


Languages
Pages
Legal


Euroclear plcAnnual Report 2016
Euroclear history
Euroclear is the financial industry’s trusted provider of post-trade services. We provide settlement, safekeeping and servicing of domestic and cross-border securities transactions from bonds, equities and derivatives, to investment funds. We connect over 2,000 financial market participants across the globe and ensure that all securities transactions are processed safely and efficiently. As an open and resilient infrastructure, we help clients reduce complexity and costs, and mitigate risk.
About Euroclear
1968Morgan Guaranty launches the Euroclear System
2000Euroclear Bank is created, taking responsibility for all Euroclear-related operating and banking responsibilities
2002CRESTCo, the CSD for Irish equities and all UK securities, becomes part of the Euroclear group. It is later renamed Euroclear UK & Ireland
2005Euroclear SA/NV created as a new parent company, owning Euroclear Bank and the CSDs and the group’s shared securities-processing platforms
2016Euroclear’s ESES CSDs (Euroclear Belgium, Euroclear France and Euroclear Nederland) connect to the ECB’s TARGET2-Securities platform
Euroclear's Collateral Highway is launched as the first fully open global market infrastructure to source and mobilise collateral across borders
2012
Euroclear System sold to the Euroclear Clearance System Public Limited Company which is owned by over 120 major financial institutions
1972Euroclear Bank merges with Sicovam, the CSD of France, which is renamed Euroclear France. CSDs of the Netherlands and Belgium sign agreements to join the Euroclear group
2001
Euroclear and the Depository Trust & Clearing Corporation (DTCC) establish joint venture to deliver a pan-Atlantic collateral processing infrastructure – DTCC-Euroclear GlobalCollateral Ltd
2014
Euroclear Settlement of Euronext-zone Securities (ESES) is launched
2009
Euroclear plcAnnual Report 2016
euroclear.com
© 2017 Euroclear SA / NV, 1 Boulevard du Roi Albert II,1210 Brussels, Belgium, Tel: +32 (0)2 326 1211 – RPM Brussels number 0423 747 369.Euroclear is the marketing name for the Euroclear System, Euroclear plc, Euroclear SA / NV and their affiliates. All rights reserved. The information and materials contained in this document are protected by intellectual property or other proprietary rights. All information contained herein is provided for information purposes only and does not constitute any recommendation, offer or invitation to engage in any investment, financial or other activity. We exclude to the fullest extent permitted by law all conditions, guarantees, warranties and / or representations of any kind with regard to your use of any information contained in this document. You may not use, publish, transmit, or otherwise reproduce this document or any information contained herein in whole or in part unless we have given our prior written consent. Your use of any products or services described herein shall be subject to our acceptance in accordance with the eligibility criteria determined by us.
Euroclear is a carbon neutral company – PAS2060 certified • MA3968 – 2017
Euroclear plcAnnual Report 2016

Euroclear is the financial industry’s trusted provider of post-trade services. We provide settlement, safekeeping and servicing of domestic and cross-border securities transactions from bonds, equities and derivatives, to investment funds. We connect over 2,000 financial market participants across the globe and ensure that all securities transactions are processed safely and efficiently. As an open and resilient infrastructure, we help clients reduce complexity and costs, and mitigate risk.
CRESTCo, the CSD for Irish equities and all UK securities, becomes part of the Euroclear group. It is later renamed Euroclear UK & Ireland
Euroclear’s ESES CSDs (Euroclear Belgium, Euroclear France and Euroclear Nederland) connect to the ECB’s TARGET2-Securities platform
Euroclear Bank merges with Sicovam, the CSD of France, which is renamed Euroclear France. CSDs of the Netherlands and Belgium sign agreements to join the Euroclear group
Euroclear history
Euroclear is the financial industry’s trusted provider of post-trade services. We provide settlement, safekeeping and servicing of domestic and cross-border securities transactions from bonds, equities and derivatives, to investment funds. We connect over 2,000 financial market participants across the globe and ensure that all securities transactions are processed safely and efficiently. As an open and resilient infrastructure, we help clients reduce complexity and costs, and mitigate risk.
About Euroclear
1968Morgan Guaranty launches the Euroclear System
2000Euroclear Bank is created, taking responsibility for all Euroclear-related operating and banking responsibilities
2002CRESTCo, the CSD for Irish equities and all UK securities, becomes part of the Euroclear group. It is later renamed Euroclear UK & Ireland
2005Euroclear SA/NV created as a new parent company, owning Euroclear Bank and the CSDs and the group’s shared securities-processing platforms
2016Euroclear’s ESES CSDs (Euroclear Belgium, Euroclear France and Euroclear Nederland) connect to the ECB’s TARGET2-Securities platform
Euroclear's Collateral Highway is launched as the first fully open global market infrastructure to source and mobilise collateral across borders
2012
Euroclear System sold to the Euroclear Clearance System Public Limited Company which is owned by over 120 major financial institutions
1972Euroclear Bank merges with Sicovam, the CSD of France, which is renamed Euroclear France. CSDs of the Netherlands and Belgium sign agreements to join the Euroclear group
2001
Euroclear and the Depository Trust & Clearing Corporation (DTCC) establish joint venture to deliver a pan-Atlantic collateral processing infrastructure – DTCC-Euroclear GlobalCollateral Ltd
2014
Euroclear Settlement of Euronext-zone Securities (ESES) is launched
2009

£€
Euroclear in 6 steps
Support an open marketplace where scale and connectivity across the spectrum of market participants are strengths.
To be profit moderated with the financial discipline of a ‘for-profit’ entity and the commitment to support market stability, deliver shared economies of scale, and develop markets locally and globally.
Serve the public good by ensuring the efficiency and safety of markets and actively enabling risk-reduction.
Foster a high performing culture in respect of our corporate values, delivered worldwide thanks to our diverse and dedicated teams.
2
6
Standard & Poor’s
AAFitch
AA+
3 Euroclear’s DNA
Breadth of participation
Asset safety & resilience
1 Scale provider of post-trade services
Offshore Renminbi holdings
40%40%
60%Eurobond holdings
50%50%European capitalmarket securities
>assets held in custodyfor our clients
€27.7 trillion
4 Collateral Highway
of the world’s50 largest banks
2 000>including:
90%
Global client franchise
5 The place for funds
clients
>100central banks
$
> €1 trillioncollateral mobilised daily
3%year-on-year growth
>1.7 millionsecurities worldwide
in turnover
transactions processed
196 million
€655 trillion
€
We offer personalised client support in 16 languages
16 languages
We have links to 49 major markets
49 major markets
We deal in 50settlement currencies
50 currencies£
€
Our clients are located in over 90 countries
>90 countries
€
$
£
>11.1 millionfund orders routed annually
145,000investment fundsprocessed by Euroclear
1200fund administrators
>
€1.8 trillionfunds under custody

Strategic report 2016
Consolidated financial statements 2016
Chairman’s messageInterview with Lieve Mostrey, Euroclear group CEOEuroclear’s Management CommitteeOperating HighlightsFinancial ReviewOur strategy for evolving capital marketsPerforming strongly across the groupOur responsibilityCorporate responsibility
040609101214202428
Directors’ reportStatement of Directors' responsibilitiesEuroclear plc Board and Committees – compositionConsolidated income statementConsolidated statement of comprehensive incomeConsolidated statement of changes in equityConsolidated statement of financial positionConsolidated statement of cash flowsNotes to the consolidated financial statementsIndependent auditor's reportParent company statement of financial positionStatement of changes in equityStatement of cash flowsNotes to the parent company financial statementsIndependent auditor's report
364142434445464748
108110111112113121

Euroclear plcStrategic report2016

| Strategic report
Dear shareholders,
I am pleased to report that your company performed well in 2016 and maintained its profitability through a challenging year. The Board recommends a dividend of €37 per share for 2016, with a stable 40% pay-out ratio.
In addition, the Board has launched a fourth share buy-back programme, subject to shareholder approval, providing liquidity to those who wish to sell, while enhancing value for our engaged and committed shareholder base.
The Board has decided that now is an appropriate time to moderate the buy-back programme, and grow its capital base further, with the value of this year’s planned buy-back reduced to €58 million.
The Board has therefore added €121 million to reserves in order to further strengthen Euroclear’s financial robustness in a more volatile environment.
In September 2016, the group migrated successfully settlement activity for Euroclear’s ESES CSDs (Euroclear Belgium, Euroclear France
and Euroclear Nederland) – Europe’s largest multi-country CSD – to the European Central Bank’s TARGET2-Securities (T2S) platform. The orderly connection to T2S was a complex and challenging undertaking for which the Board congratulates both management and staff.
We are committed to contributing to the harmonisation of Europe’s capital markets. In 2017, a key priority for the group will be the implementation of the CSD Regulation (CSDR), which provides a single, pan-European rulebook for our sector. We are actively engaged with clients, regulators and other stakeholders to ensure the smooth transition to CSDR implementation.
While recent market and political developments have created new uncertainty, Euroclear remains confident in its ability to deliver stable
and efficient services to its large client base, as the leading European marketplace for securities.
That Euroclear is well positioned at this point is testament to Tim Howell’s tenure as Chief Executive Officer (CEO) of Euroclear over the past six years, which has been transformative for your company. In deciding to move on at the end of 2016, Tim leaves an organisation that is stronger across all of its financial metrics, closer to its clients and engaged in collaborative, innovative initiatives that add value to the markets we serve.
The Board trusts that this progress will be built upon by Tim’s successor, Lieve Mostrey, who was appointed as CEO, in line with the Board’s succession planning. Lieve is a highly skilled, experienced banker who has led Euroclear’s technology and operations for the past six years, as well as having
Chairman’s message
04
Euroclear plc Annual Report 2016

vast experience from earlier roles in financial services and non-executive directorships. We have great trust in her ability to meet the evolving needs of a systemically important financial market infrastructure for Euroclear’s clients, shareholders and employees, in line with our regulators’ expectations.
During 2016, the Board welcomed Anthony Carey, Xiaomei Fan and Tsutomu Suzuki as directors nominated by shareholders, while Stephen Davies, Toru Horie, Xiaochi Liu and Neil Martin retired from the Board. On behalf of the Board, I would like to extend our gratitude to each of our retiring directors for the contribution made to Euroclear during their service.
The Board looks forward to working with our new CEO through constructive dialogue aimed at
assuring the safety and security of the financial markets, and at fostering Euroclear’s business responsiveness to the evolving needs of our clients.
Marc Antoine AuthemanChairman of the Board
The orderly connection to T2S was a complex and challenging undertaking for which the Board congratulates both management and staff.
Marc Antoine AuthemanChairman of the Board
05

| Strategic report
Q. Congratulations on your appointment as CEO. How would you describe the company’s performance in 2016?
LM: Thank you. Let me begin by recognising the contribution that Tim Howell, my predecessor, made to the group through his leadership and direction during his time at Euroclear.
For the past six years, our company has undergone a significant transformation, becoming more agile to operate in our fast-changing environment and to meet our clients’ evolving needs.
Looking back at 2016, we performed robustly, building on our record 2015 results to deliver modest increases in revenues, operating profit, and net profit. Revenues were up 2.8% to €1,162 million in 2016. This was due to stable net fee income that was supplemented by growing net interest income. This resulted in an operating profit of €411 million, a 3% increase compared to the prior year.
We continue to look at controlling costs effectively and decided to make a one-off investment in restructuring costs to secure future operating efficiencies. This investment was largely offset by a one-off taxation benefit, meaning that the group’s net profit for 2016 still increased 2% to €298 million.
At the same time, we reached an historic milestone by successfully connecting the group’s ESES CSDs to T2S, while also continuing to progress our other strategic initiatives.
Q. Uncertainty around geopolitical events has been a major factor in financial markets’ performance throughout 2016. How has Euroclear weathered this environment?
LM: 2016 started slowly for us, with weaker business drivers during the first half of the year compared to 2015. As geopolitical events, such as Brexit and the US presidential elections unfolded, we saw increased volumes.
Despite market volatility, our business drivers trended positively, even above our expectations, throughout the second half of the year.
Q. Turning to strategy, how would you describe Euroclear’s priorities for the next three years?
LM: For the past six years, the management team has been fully engaged in implementing our strategy, focused on delivering value for all our stakeholders. We believe that this path is fundamentally sound, and we will remain consistent in our approach going forward. Concretely, we will focus our efforts on three mutually-beneficial strategic priorities.
First, we will strengthen our core business, particularly in Europe, as we contribute to making the harmonisation of European capital markets a success for issuers and investors alike, underpinned by our compliance with an even more robust regulatory framework. Plus, we will continue to invest in our systems
In this short interview, Lieve Mostrey discusses her appointment as group Chief Executive Officer, Euroclear’s performance in 2016, and her vision for achieving future success for the company.
Interview with Lieve Mostrey, Euroclear group CEO
06
Euroclear plc Annual Report 2016

across our domestic CSDs in support of our long-term commitment to these markets.
Moreover, we are considering how innovations, such as robotics and distributed ledger technology, may bring leading-edge, efficient and stable solutions throughout our existing business in the coming years.
Secondly, we are becoming increasingly relevant to our clients around the world by continuing to grow our initiatives in collateral management, funds and by connecting the global financial markets.
We have taken great strides in these areas, with over €1 trillion of collateral outstanding on the Collateral Highway; successfully supporting clients through the first
wave of new over-the-counter (OTC) collateralisation regulations for derivatives; our joint venture with the DTCC going live; further adoption of the international ETF structure; and by connecting Euroclear Bank to new markets like China and Chile.
Lastly, we will explore new areas where we can innovate and collaborate to bring new products and services to clients by finding value-add applications for new technologies. For example, our collaboration with Taskize and our initiatives involving distributed ledger technology. By working in partnership on a broad range of greenfield opportunities, we can make sensible levels of investment to discover tomorrow’s hidden jewels.
We are making good progress in realising our strategic vision. You
can read more on how we are implementing these priorities in the ‘Strategy’ section later in this report.
Q. Looking forward, do you expect Brexit and industry consolidation in financial market infrastructures to impact Euroclear?
LM: As a multi-country organisation, and the trusted post-trade destination for clients in Europe, we are well placed to adapt to Brexit’s consequences and support our clients through the uncertainty ahead. To this end, it’s too early to be certain how the wider European landscape will change, apart from the fact that it will. We are keeping a close eye on developments and analysing the possible implications for us and the financial markets we serve.
Despite market volatility, our business drivers trended positively, even above our expectations, throughout the second half of the year.
Lieve MostreyChief Executive Officer;Executive Director – Euroclear SA/NV
07

| Strategic report
Most of our UK business is domestic, however the country’s departure from the EU creates uncertainty for the Irish marketplace, which we service through Euroclear UK & Ireland. The Irish marketplace is important to us, and one that we’ve serviced for a very long time and want to continue to serve. We are working closely with the relevant authorities and our clients, and are very confident that we will deliver a sustainable, long-term solution to this situation.
Q. There’s lots of talk about blockchain. What opportunities do you see from the rise of this distributed ledger technology (DLT)?
LM: Although there’s still a lot of hype around the subject, we consider this technology to be very promising. We have, over the past years, completed some interesting research in DLT, and have several operational pilots underway. These pilot projects are being developed both in-house, and together with leading FinTech partners.
Our experience has shown that DLT has real potential in many areas, including the post-trade sector. There are a number of encouraging post-trade arenas that could act as a testing
ground for the technology, especially less mature markets. Take, for instance, London’s gold bullion market. It is not automated today and could really benefit from DLT acting as a central point of reference.
The areas of opportunity for DLT – or indeed any new innovation – are found at an intersection where technology opportunities meet the rethinking of business models, within the boundaries of regulatory constraints. This is the sweet spot where the solutions of tomorrow will be found. These are the kinds of exciting opportunities we want to explore with our partners.
Q. Finally, how well do you feel that Euroclear is equipped for the journey ahead?
LM: I am truly happy to say that we are very well positioned for the future. We are already trusted as a provider of post-trade services by a global client franchise that connects 2,000 participants in more than 90 countries.
Our people are our most valuable resource. Their skills and expertise, combined with our organisational agility and client-focused culture,
underpin Euroclear’s capacity to continue delivering sustainable high performance – and to be a great place to work.
We operate under a robust regulatory framework, which is further strengthened through the incoming CSD Regulation (CSDR), and have a sound, client-led governance structure.
Underpinning our role as a safe and stable financial market infrastructure is our strong financial position. Euroclear Investments’ successful issuance of €600 million senior debt in 2016 provides the group with even greater financial resilience and additional flexibility going forward.
All this brings me to confirm that we are in a good place, and I am excited for the future of the group. I would like to take this opportunity to thank every employee in the group for their efforts this year, our clients for entrusting us with their business and our shareholders for their ongoing support.
08
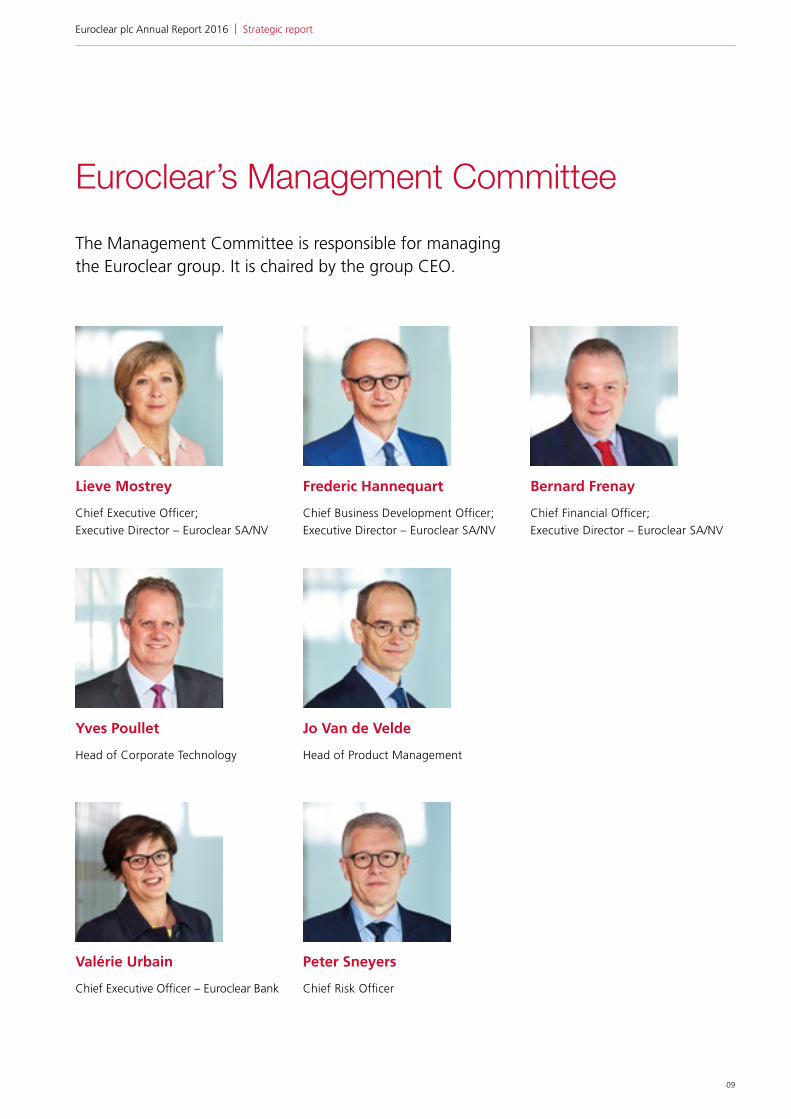
Lieve Mostrey
Chief Executive Officer; Executive Director – Euroclear SA/NV
Valérie Urbain
Chief Executive Officer – Euroclear Bank
Frederic Hannequart
Chief Business Development Officer; Executive Director – Euroclear SA/NV
Bernard Frenay
Chief Financial Officer; Executive Director – Euroclear SA/NV
Yves Poullet
Head of Corporate Technology
Euroclear’s Management CommitteeThe Management Committee is responsible for managing the Euroclear group. It is chaired by the group CEO.
Jo Van de Velde
Head of Product Management
Peter Sneyers
Chief Risk Officer
09
| Strategic reportEuroclear plc Annual Report 2016

| Strategic report
1 The data includes intra-group holdings/transactions, as relevant.2 The Collateral Highway launched in July 2012, mobilises
collateral from sources within and external to the Euroclear group.
Key drivers
The value of securities held1 for our clients at the end of 2016 reached €27.7 trillion, an increase of 0.8% compared to €27.5 trillion in 2015.
Turnover1, or the value of securities transactions settled, declined by 2.1% to €655.4 trillion in 2016 compared to €669.5 trillion in 2015.
The number of netted transactions settled in the group reached 195.9 million in 2016, a 2.7% increase compared to 190.7 million in 2015.
On our global Collateral Highway, the daily outstandings for the end of 2016 averaged €1072.5 billion, an increase of 0.4% compared to €1067.7 billion in 2015.
Our group-wide fund orders routed declined by 13.3% to 11.1 million.
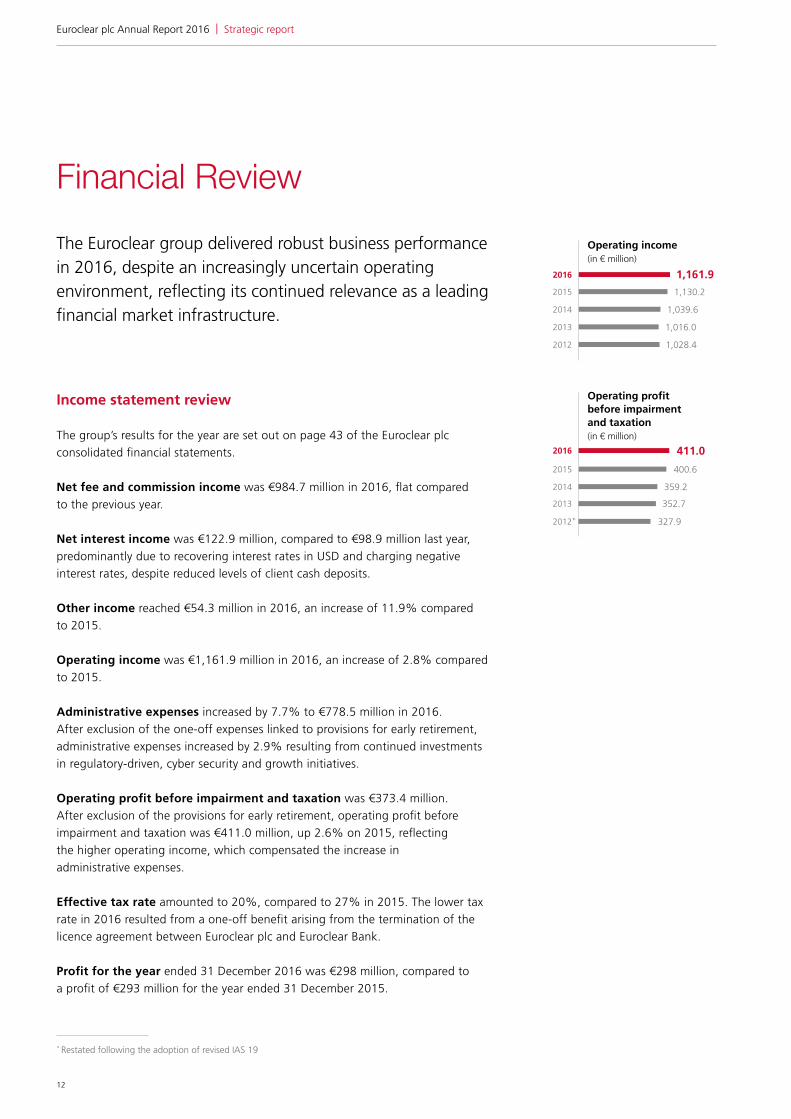
The Euroclear group delivered robust business performance in 2016, despite an increasingly uncertain operating environment, reflecting its continued relevance as a leading financial market infrastructure.
Operating HighlightsValue of securities held(in € trillion)1
23.02012
24.22013
26.02014
27.52015
27.72016
Turnover(in € trillion)1
541.62012
572.82013
623.32014
669.52015
655.42016
Number of netted transactions (in millions)
158.92012
170.42013
181.62014
190.72015
195.92016
Average daily collateral provision oustanding (in € billion)2
700.62012
787.32013
886.92014
1067.72015
1072.52016
10
Euroclear plc Annual Report 2016

Key performance indicators
Our key performance indicators reflect our stability and discipline as a company.
Net fee income margin (net fee income excluding administrative expenses compared to administrative expenses) reduced from 35.9% to 26.5% in 2016. After exclusion of the one-off expenses linked to provisions for early retirement, net fee income margin was 32.4% in 2016, reflecting flat net fee income and an increase in administrative expenses of 2.9% resulting from continued investments in regulatory-driven, cyber security and growth initiatives.
Operating margin (operating profit before impairment and taxation compared to operating income) was flat at 35.4% in 2016, excluding the one-off expenses linked to provisions for early retirement.
Unit cost ratio (administrative expenses compared to the average value of securities held) increased from 0.26 basis point (bps) in 2015 to 0.29 bps in 2016.
Return on equity (profit for the year compared to average shareholders’ equity) reduced from 8.7% to 8.5% in 2016.
Net earnings per share (profit for the year divided by the weighted average number of shares) increased to €92.4 in 2016 compared to €87.0 in 2015, due to the slightly higher earnings combined with the impact of the share buy-back.
Net fee income margin(in %)
27.62012
32.72013
35.72014
35.92015
26.52016
Adjusted return on equity(in %)
7.82012
8.32013
8.72014
8.72015
8.52016
Adjusted net earnings per share (in €)
63.02012
69.32013
78.62014
87.02015
92.42016
11
| Strategic report
* Restated following the adoption of revised IAS 19
Income statement review
The group’s results for the year are set out on page 43 of the Euroclear plc consolidated financial statements.
Net fee and commission income was €984.7 million in 2016, flat compared to the previous year.
Net interest income was €122.9 million, compared to €98.9 million last year, predominantly due to recovering interest rates in USD and charging negative interest rates, despite reduced levels of client cash deposits.
Other income reached €54.3 million in 2016, an increase of 11.9% compared to 2015.
Operating income was €1,161.9 million in 2016, an increase of 2.8% compared to 2015.
Administrative expenses increased by 7.7% to €778.5 million in 2016. After exclusion of the one-off expenses linked to provisions for early retirement, administrative expenses increased by 2.9% resulting from continued investments in regulatory-driven, cyber security and growth initiatives.
Operating profit before impairment and taxation was €373.4 million. After exclusion of the provisions for early retirement, operating profit before impairment and taxation was €411.0 million, up 2.6% on 2015, reflecting the higher operating income, which compensated the increase in administrative expenses.
Effective tax rate amounted to 20%, compared to 27% in 2015. The lower tax rate in 2016 resulted from a one-off benefit arising from the termination of the licence agreement between Euroclear plc and Euroclear Bank.
Profit for the year ended 31 December 2016 was €298 million, compared to a profit of €293 million for the year ended 31 December 2015.
The Euroclear group delivered robust business performance in 2016, despite an increasingly uncertain operating environment, reflecting its continued relevance as a leading financial market infrastructure.
Financial ReviewOperating income(in € million)
1,161.9
1,028.42012
1,016.02013
1,039.62014
1,130.22015
2016
Operating profit before impairment and taxation (in € million)
411.0
327.92012
352.72013
359.22014
400.62015
2016
*
12
Euroclear plc Annual Report 2016

Balance sheet review
The group’s financial position as of 31 December 2016 is set out on page 46 of the Euroclear plc consolidated financial statements.
Total assets were €22,876 million on 31 December 2016, up €891 million from the previous year.
Loans and deposits totalled €18,398 million and €17,886 million, respectively, on 31 December 2016.
Total shareholders’ equity totalled €3,560 million in 2016, up €85 million from the prior year.
Net asset value per share (total shareholder’s equity divided by the year-end number of shares) totalled €1,103 as of 31 December 2016, compared to €1,077 in 2015.
Capital management
In 2016, the group’s dividend pay-out ratio of 40% remained unchanged. The Board has recommended a dividend of €119 million, or €37 per share (2015: €36.3). The Board has recommended to return in 2017 20% of 2015 profit to shareholders via a share buyback, representing €58 million.
Euroclear Bank is rated AA+ by Fitch Ratings and AA by Standard & Poor’s.
Employee evolution
The average number of people employed by the group during the year was 3,944 compared to 3,863 in 2015.
3,560
Shareholders’ equity(in € million)
3,184.52012
3,212.52013
3,244.52014
3,4762015
2016
Dividend per share(in €)
25.42012
29.62013
31.52014
36.32015
37.02016
13

| Strategic report
We offer our clients greater collateral mobility and access to liquidity, operating stability and resilience, and higher levels of process automation.
14
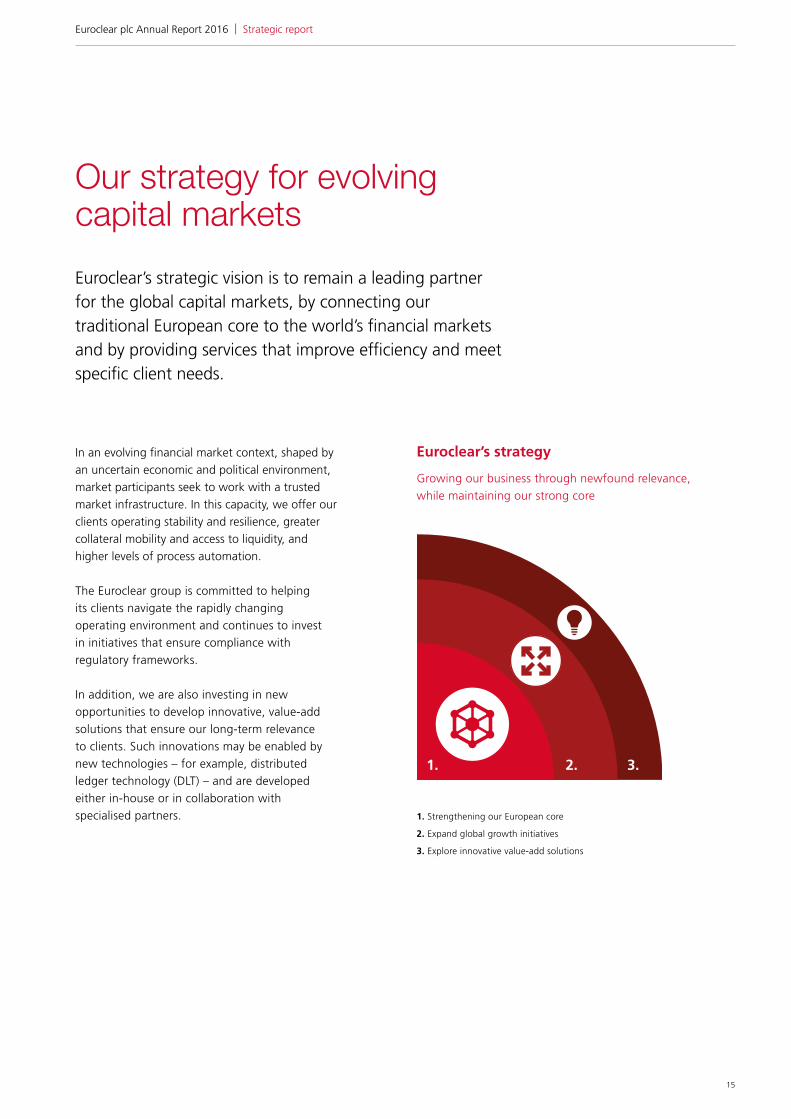
Euroclear’s strategic vision is to remain a leading partner for the global capital markets, by connecting our traditional European core to the world’s financial markets and by providing services that improve efficiency and meet specific client needs.
Euroclear’s strategy
Our strategy for evolving capital markets
In an evolving financial market context, shaped by an uncertain economic and political environment, market participants seek to work with a trusted market infrastructure. In this capacity, we offer our clients operating stability and resilience, greater collateral mobility and access to liquidity, and higher levels of process automation.
The Euroclear group is committed to helping its clients navigate the rapidly changing operating environment and continues to invest in initiatives that ensure compliance with regulatory frameworks.
In addition, we are also investing in new opportunities to develop innovative, value-add solutions that ensure our long-term relevance to clients. Such innovations may be enabled by new technologies – for example, distributed ledger technology (DLT) – and are developed either in-house or in collaboration with specialised partners.
Growing our business through newfound relevance, while maintaining our strong core
1. 2. 3.
1. Strengthening our European core
2. Expand global growth initiatives
3. Explore innovative value-add solutions
15
| Strategic reportEuroclear plc Annual Report 2016
| Strategic report
Investing to strengthen our European core
Europe has been moving towards a single regulated marketplace covering every facet of its financial markets. In line with the European Commission’s plans for a Capital Markets Union (CMU), the new CSD Regulation (CSDR) brings a single, pan-European rulebook to the post-trade sector, while the European Central Bank’s TARGET2-Securities (T2S) platform is gearing up to provide a single settlement environment for the Eurozone.
Meanwhile, the outlook for Europe is clouded by political uncertainty,
combined with the potential ramifications of ongoing corporate initiatives by some of the region’s financial market infrastructures.Euroclear has a long-standing commitment to Europe, holding 60% of Eurobonds (principally through Euroclear Bank, the group’s ICSD) and over 50% of European capital market securities across the group’s seven (I)CSDs across the region.
As the operating environment continues to evolve, we continue to intensify investment that supports clients in navigating these changes, while enhancing the safety and efficiency of Europe’s capital markets.
Target2-SecuritiesIn September 2016, Euroclear’s ESES CSDs (Euroclear Belgium, Euroclear France and Euroclear Nederland) reached a significant milestone by successfully connecting to the T2S platform.
T2S is designed to increase cross-border settlement efficiency in Europe and presents new opportunities for firms to access liquidity and finance their activity more effectively.
The group has completed a number of investments to increase interoperability between Euroclear Bank and the ESES CSDs. For our clients, this means
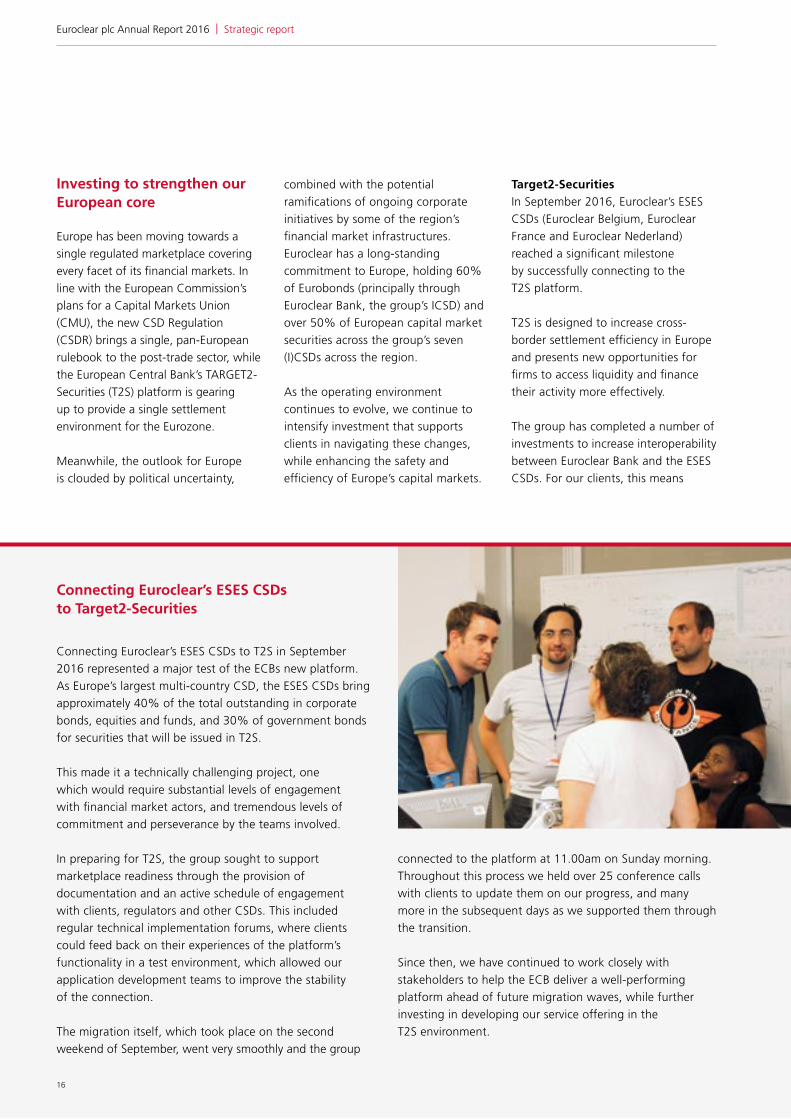
Connecting Euroclear’s ESES CSDs to Target2-Securities
Connecting Euroclear’s ESES CSDs to T2S in September 2016 represented a major test of the ECBs new platform. As Europe’s largest multi-country CSD, the ESES CSDs bring approximately 40% of the total outstanding in corporate bonds, equities and funds, and 30% of government bonds for securities that will be issued in T2S.
This made it a technically challenging project, one which would require substantial levels of engagement with financial market actors, and tremendous levels of commitment and perseverance by the teams involved.
In preparing for T2S, the group sought to support marketplace readiness through the provision of documentation and an active schedule of engagement with clients, regulators and other CSDs. This included regular technical implementation forums, where clients could feed back on their experiences of the platform’s functionality in a test environment, which allowed our application development teams to improve the stability of the connection.
The migration itself, which took place on the second weekend of September, went very smoothly and the group
connected to the platform at 11.00am on Sunday morning. Throughout this process we held over 25 conference calls with clients to update them on our progress, and many more in the subsequent days as we supported them through the transition.
Since then, we have continued to work closely with stakeholders to help the ECB deliver a well-performing platform ahead of future migration waves, while further investing in developing our service offering in the T2S environment.
16
Euroclear plc Annual Report 2016

access to global commercial and European central bank liquidity to meet short-term liquidity needs. We continue our efforts to support our clients as we strengthen our range of harmonised services for both issuers and investors across all T2S markets.
CSD regulation (CSDR)CSDR is another important step in harmonising European financial
markets, by providing a single, pan-European rulebook for CSDs. It involves a complete review and standardisation of rules applicable to (I)CSDs in the European Union, and also standardises settlement cycles and settlement discipline procedures across Europe.
CSDR will also require changes by our clients to comply with record keeping requirements, in particular. The introduction of standardised settlement discipline and buy-in regimes across Europe is scheduled for 2019.
Getting ready for the provisions of CSDR has been a major focus for the group throughout 2016. The Euroclear (I)CSDs are preparing their applications for authorisation under the new regulation and expect to submit our filings to obtain their licenses in accordance with the official timelines, currently anticipated for the end of September 2017.
Safe and stable domestic CSDsWe continue to invest in our domestic
CSDs to provide robust market infrastructures for the markets we service.
In Finland, the group has been working to replace Euroclear Finland’s entire securities processing infrastructure with a new settlement system, known as Infinity, with phase one implemented in 2015. The group is working with clients on
the implementation schedules of its remaining releases in order to ensure the delivery of a safe and stable platform, as well as connection to T2S.
We are also committed to upgrading Sweden’s financial market infra-structure, while meeting its regulatory imperatives. In 2017, Euroclear Sweden will extend the functionality of its existing IT platform to meet the demands of CSDR, before completing development work on its new IT platform, known as EuroclearSafe.
The benefits of having robust market infrastructures was demonstrated by the performance of Euroclear UK and Ireland’s CREST settlement system throughout the post-Brexit market volatility, a system that celebrated its 20th anniversary in 2016.
While there are no immediate operational impacts resulting from Brexit, we are working closely with Irish market participants to minimise the impact of any potential changes that may be required in the way the
group settles Irish securities markets via TARGET2.
Enhanced cyber resilienceSecurity, including effective controls to counter cyber-crime, is an area that Euroclear has always taken very seriously, and the group has continuously invested in controls that maintain the resilience of our systems.
The financial industry has awakened to the evolving risks posed by cyber threats, which have demonstrated increased levels of complexity, sophistication and propensity to target the sector over recent times.
Given our role as financial market infrastructure, we have been at the forefront of collaborative efforts to increase cyber resilience in the industry. In addition, we have taken steps to strengthen our own cyber security capability, through the roll-out of a new multi-year programme that started in 2016.
We have already made progress in further interlinking our cyber security defences with business systems, with plans in place to develop our cyber intelligence, analytics and reporting, and to embed further our security-conscious culture throughout Euroclear.
Growing relevance in global initiatives
As an open financial market infra-structure, we support the evolving requirements of our clients as they look to benefit from the opportunities created by an increasingly interconnected global economy.
Global collateral managementFinancial market participants are increasingly demanding collateral that can be mobilised across borders and time zones. With new global
In Europe, we are now one of the largest providers of fund processing services with over 11.1 million orders routed through our platforms in 2016.
17

| Strategic report
regulations in the un-cleared, over-the-counter (OTC) derivatives market taking effect in 2016, the demand for collateral is poised to accelerate in the years ahead. A key tenet of our strategy has been to support the financial market’s requirement for a neutral, interoperable utility to source, mobilise and segregate such collateral. This led us to launch the Euroclear Collateral Highway in 2012, the world’s first open architecture global infrastructure for collateral management.
The Collateral Highway provides a comprehensive solution for managing collateral, offering clients a complete view of exposures across the full spectrum of their asset classes. In addition to more traditional collateral management functions (typically repos, securities lending, derivatives and access to central bank liquidity), our range of collateral management solutions includes dedicated services for corporate treasurers, and a specialised equity financing service. By the end of 2016, the average daily collateralised outstanding on the Collateral Highway reached €1,072 billion.
Our joint venture with the Depository Trust & Clearing Corporation (DTCC), DTCC-Euroclear GlobalCollateral Ltd (DEGCL), is connecting two of the most important pools of collateral to provide a truly global, end-to-end collateral management solution.
In 2016, we began to rollout DEGCL’s Collateral Management Utility (CMU) as a step to support clients in complying with new OTC derivatives regulations, enabling unprecedented operating efficiencies to market participants and improving the stability and soundness of financial markets.
Servicing fundsFunds are increasingly the means by which investors are choosing to participate in international markets, and a way for issuers to efficiently access a global investor base. Through its expanding funds network, Euroclear is establishing itself as the place for funds, providing a single entry point for the effective distribution of cross-border, offshore and domestic funds.
In early 2016, we launched Euroclear FundsPlace, a new umbrella brand for the group’s fund solutions. Our range of trade and post-trade services for funds is fully automated, to drive out the cost, risks and complexity associated with the manual processing of fund trades. These services include account opening, order routing,
settlement and asset servicing, providing access to a network of over 900 fund administrators. As an important provider of fund processing services across Europe, we routed over 11 million orders through our FundsPlace platforms in 2016.
Meanwhile, the international Exchange-Traded Fund (ETF) structure continues to gain popularity amongst issuers and investors alike, bringing with it a simplified issuance structure and access to a global investor base. BlackRock, the world’s largest provider of ETFs, was the inaugural issuer of international ETFs in 2013.
Early in 2016, BlackRock completed the migration of its entire suite of domestic ETFs to the international issuance structure, the largest ever corporate action in the ETF industry that transferred assets valued at over $200bn. Meanwhile, State Street moved 29 ETFs to the international structure, as part of its decision to transfer settlement for 40 of its SPDR ETFs to Euroclear’s FundSettle platform.
We also collaborated with a number of issuers who sought to use the international ETF structure to provide a global investor base with access to Asian markets.
Hong Kong based fund manager, Fullgoal Asset Management issued an RMB-denominated ETF in the international structure, while ICBC
Credit Suisse Asset Management International chose Euroclear Bank for clearing and settlement of its first internationally-listed China equity ETF. In early 2017, GF International Asset Management announced the launch of an international ETF, which would be the first fund product launched by a Europe-based Chinese asset manager that gives investors access to large and mid-cap equities on the Shanghai and Shenzhen stock exchanges in China via the Renminbi Qualified Foreign Institutional Investor (RQFII) scheme.
Our strategy extends beyond our strong core and growth initiatives to explore new opportunities to support our clients’ evolving needs.
18
Euroclear plc Annual Report 2016

International marketsAcross the globe, growth economies are seeking to attract foreign investors to help fund long-term development needs. At the same time, international investors are seeking opportunities to diversify and increase the profitability of their investments around the world, particularly during a period of historically low yields in Europe and North America. To this end, we made further progress in bringing benefits to domestic capital markets that might otherwise have more limited access to global participants, with the aim of bringing more efficient capital flows and providing stability to these financial markets.
Following the inclusion of the Chinese Renminbi in the International Monetary Fund’s SDR currency basket, Euroclear has sought to meet the needs of its central bank and supranational clients by facilitating access to Chinese government bonds. Euroclear continues to work closely with the Chinese authorities to support their ambition of increasing international investment into China’s onshore fixed income market.
In January 2017, the Chilean government announced a series
of reforms to open access to the country’s domestic financial markets to international investors. This was a result of close cooperation between the Chilean Ministry of Finance and Euroclear to align post-trade processes with international standards and to set up a link with Euroclear Bank to make Chile ‘Euroclearable’.
We remain in close dialogue with financial markets elsewhere in Latin America as well as other growth economies in the Middle East and Asia as we seek to support their ambitions.
This has led us to support two notable sovereign debt issuances in the course of 2016. Firstly as Argentina returned to the global debt markets with the successful launch of a $16.5 billion bond, and then as the Kingdom of Saudi Arabia launched its first ever issuance totalling $17.5 billion.
Exploring innovative value-add solutions
Our strategy extends beyond our strong core and growth initiatives to explore new opportunities to support our clients’ evolving needs.
Frequently, we are using a collaborative approach by partnering with specialised providers, particularly in financial technology, to develop solutions efficiently. For example, we have participated in working groups to explore how distributed ledger technology (DLT) might bring post-trade efficiencies to sub-optimised areas, such as London’s gold bullion market.
As one of the leading providers of post-trade services, we bring a different perspective to the application of DLT. In the course of 2016, we published two studies on DLT, the first looking ‘beyond the hype’, while the second, which was published jointly with Slaughter and May, examines the regulatory frameworks that might be needed for broader adoption in the post-trade space.
We have also explored ways to make the post-trade sector work more smoothly. Launched during 2016, the group’s partnership with Taskize, an innovative solution that helps people across financial operations to work together, has already attracted strong levels of customer interest.
19

| Strategic report
TurnoverValue of
securities heldNumber of
netted transactions
Euroclear Bank2016 € 451.7 trillion € 12.7 trillion 84.1 million
Change from 2015 +2.1% +2.5% +1.0%
Performing strongly across the groupEuroclear Bank
Euroclear Bank continued to perform resiliently in 2016, while fulfilling its role as an international financial market infrastructure that connects investors and issuers around the world.
Euroclear Bank’s resilient 2016 performance was despite an uncertain and evolving environment, driven by new regulations and the harmonisation of European financial markets, as well as a changing geopolitical landscape.
A primary focus in 2016 was our work to comply with provisions of CSDR. We have been working closely with clients and regulatory authorities to implement the necessary changes in order to meet the requirements of CSDR and to obtain our licenses.
With the T2S platform now a reality in Europe, we have worked closely alongside clients and migrating CSDs
to ensure a safe and stable transition to the platform. We continue to engage closely with our stakeholders on future T2S waves.
New global regulations for un-cleared, over-the-counter (OTC) derivatives began to come into force in 2016 with further steps expected in 2017. In September 2016, new derivatives collateral margin requirements were introduced. In addition to working closely with financial market participants to help them comply with the new rules, DTCC-Euroclear GlobalCollateral Ltd, our joint venture with the DTCC, provides an open industry infrastructure solution for clients as they manage their collateral
margin needs. This supplements the existing collateral management solutions that clients can access through the Collateral Highway.
Our international ETF structure gained further momentum, and by mid-2016, BlackRock had the largest ever corporate action in the ETF industry, finalising the transfer of its $200 billion domestic ETF programme to the international structure.
We are continuously improving Euroclear Bank’s service offering with innovative solutions. In December 2016, we began offering our clients use of Taskize as a new channel to connect with us for query resolution.
20
Euroclear plc Annual Report 2016

TurnoverValue of
securities heldNumber of
netted transactions
Euroclear UK & Ireland
2016 € 122.8 trillion € 5.8 trillion 59.8 million
Change from 2015 –13.8% –5.2% +8.3%
The data for Euroclear UK & Ireland excludes self-collateralised repos.
Euroclear UK & Ireland
Euroclear UK & Ireland celebrated a milestone in 2016, as the CREST system marked its twentieth anniversary of providing a strong, stable and efficient settlement service.
The CREST system once again demonstrated these qualities when, on 23 June 2016, the people of the United Kingdom voted to leave the European Union (commonly known as ‘Brexit’). While the news resulted in significant volatility and further uncertainty in the financial markets, our settlement systems remained stable and reliable, as expected.
While the full implications of Brexit are not fully known, we are already working closely with the Irish financial market to deliver solutions that ensure continued support to that market’s needs. We continue to monitor the evolving situation and will support Euroclear UK & Ireland clients throughout this period of uncertainty.
Although Brexit creates many uncertainties, UK authorities have confirmed that the incoming pan-European CSDR will still come into force. We are getting ready for implementation of the new regulation in the UK and Ireland, preparing for our filing and building market awareness of the new requirements where they affect clients.
We have also progressed a number of the group’s strategic growth initiatives in 2016. In funds, we have established a new connection from our EMX system into FundsPlace to offer valuation and orders. Further development of this portal will, over time, provide a single, efficient access point for investors into fund assets.
In addition, as a number of ETF issuers have moved domestic ETFs towards the international issuance structure in Euroclear Bank, Euroclear UK & Ireland has worked to ensure a smooth transition.
During the course of 2016, the Governors of the US Federal Reserve confirmed that Euroclear UK & Ireland will be the first non-US entity to have direct access to the Federal Reserve Bank of New York’s Net Settlement Service. This will enable us to provide clients with delivery-versus-payment settlement in three currencies.
21

| Strategic report
The ESES CSDs’ primary focus in 2016 was delivering a safe and stable migration to T2S. Wave 3 of the T2S platform for euro-denominated CSDs was successfully launched on 12 September, as our ESES CSDs successfully connected to the platform, alongside VP Lux and VP Securities.
T2S increases cross-border settlement efficiency in Europe and presents new opportunities for firms to access liquidity and finance their activity more effectively. Through their migration to the T2S platform, our ESES CSDs connected approximately 40% of the total outstanding in corporate bonds, equities and funds, and 30% of government bonds for securities that will be issued in T2S.
In the T2S environment, we will provide the same high level of asset servicing across asset classes, regardless of the service access option and the asset location. We will offer a range of harmonised services across all T2S securities, despite the continuing co-existence of varying market practices. Following completion of the migration, our ESES CSDs have outsourced matching and settlement services to T2S, but continue to directly offer all custody and other services to clients.
We have also been preparing the ESES CSDs for the evolving regulatory landscape by working to ensure compliance with the provisions of CSDR and preparing the filings to obtain their licenses.
At the same time, Euroclear France continued to develop its relationship with its local financial marketplace, in support of the Paris2020 initiative. Most notably, we made systems changes to support reforms in the negotiable debt securities market, the Eurozone’s largest commercial paper market, now known as NeuCP.
Across ESES, we also continued to partner with Euronext, and have reinforced this through a series of initiatives that connect issuers and investors throughout the Euronext countries.
TurnoverValue of
securities heldNumber of
netted transactions
Euroclear Belgium2016 € 1.0 trillion € 0.2 trillion 2.4 million
Change from 2015 +2.0% –12.8% –3.6%
Euroclear France2016 € 62.9 trillion € 6.3 trillion 23.2 million
Change from 2015 –6.7% +3.4% –3.3%
Euroclear Nederland2016 € 4.7 trillion € 1.0 trillion 5.9 million
Change from 2015 –3.8% +1.3% –4.7%
The data for Euroclear France excludes ‘pensions livrées’ with Banque de France.
ESES CSDs – Euroclear Belgium, Euroclear France and Euroclear Nederland
Euroclear Settlement of Euronext-zone Securities (ESES) comprises Euroclear France, Euroclear Belgium and Euroclear Nederland.
22
Euroclear plc Annual Report 2016

Euroclear Finland has been migrating its entire securities processing infrastructure to a new IT system, known as Infinity, which is being deployed progressively.
Having launched phase 1 of the Infinity platform in 2015, we have been working with clients on the implementation schedules of its remaining releases and connection to T2S. We have collaborated with market participants on every stage of the delivery roadmap of this substantial project, including rigorous testing, in order to ensure the delivery of a safe and stable platform.
Concurrently, Euroclear Finland has been getting ready for the requirements of CSDR, further supporting European market harmonisation.
The group is also committed to upgrading Sweden’s financial market infrastructure, while meeting its regulatory imperatives. In 2017, Euroclear Sweden will extend the functionality of its existing IT platform to meet the demands of CSDR, before continuing work on a new IT platform, known as EuroclearSafe.
Meanwhile, we continued to explore innovative solutions that support market needs across Finland and Sweden, such as the potential use for DLT as a registry for Housing Company Certificates in Finland.
TurnoverValue of
securities heldNumber of
netted transactions
Euroclear Finland2016 € 0.6 trillion € 0.3 trillion 7.1 million
Change from 2015 –1.8% +9.9% +4.1%
Euroclear Sweden2016 € 11.8 trillion € 1.4 trillion 13.3 million
Change from 2015 +9.5% +0.9% +4.9%
Euroclear Finland and Euroclear Sweden
Euroclear Finland and Euroclear Sweden continued to implement the group’s strategy in the Nordic region.
23

| Strategic report
Through reliability, innovation and leadership, we strive at all times to live up to our reputation as one of the world’s preeminent providers of post-trade services.
24

Our responsibilityProfessional competence, resilient platforms, a strong risk culture and the integrity of the company’s corporate governance framework are the foundations upon which Euroclear has established its reputation as a trusted market infrastructure. Equally important is our commitment to our people and our wider corporate responsibility.
Risk and governance
We have built a strong risk culture and an embedded risk management framework underpinned by considerable expertise with a stable and experienced team. We strive to minimise the risks involved in the operation of both domestic and international settlement, custody and collateral services, and other settlement-related activities.
Our enterprise risk management framework is benchmarked against relevant market and regulatory standards, including those covering market infrastructures. A clear governance structure is in place to ensure accountability for identifying, monitoring and controlling the risks related to the business. This includes comprehensive and regularly tested processes in all entities, to ensure continuous availability of business critical services, including effective management response to crises.
Further information on our risks and uncertainties, risk management strategies, policies and processes can be found in the notes accompanying the Consolidated Financial Statements and in our annual Pillar 3 report on www.euroclear.com.
Corporate governance
The individual entities within the Euroclear group operate in line with local law and regulation on corporate governance matters. In addition, as a group, there is an overarching governance framework and philosophy that reinforces our position as a safe and efficient venue for post-trade activities. We are committed to, and guided by, best practice recommendations and the principles outlined in the UK Corporate Governance Code.
The Board of Euroclear plc, as the ultimate parent company of the group, is responsible for:
• ensuring that the necessary financial resources are in place to meet strategic goals;
• all shareholder matters, including agreeing dividend policies and payments;
• setting values and standards in governance matters.
The Board of Euroclear SA/NV plays a key role in setting the direction of the group. All directors on the Euroclear plc Board are also Euroclear SA/NV Board members in addition to three members of the Euroclear SA/NV’s senior management.
The Euroclear SA/NV Board is responsible for:
• setting group strategy and overseeing its implementation;
• setting the risk appetite for the group and ensuring an effective framework is in place to enable risks to be properly managed.
A Management Committee is in place in Euroclear SA/NV, composed of seven senior management team members. It is chaired by the group CEO and has been delegated wide management powers by the Euroclear SA/NV Board. Details of the composition of the Management Committee is shown on page 42.
For further information on corporate governance, including our governance focus in 2016, please see page 38 of the Directors’ report.
Our mission and values
Our company mission and values serve as a compass as we navigate through market challenges to achieve our common goal of ‘post-trade made easy’.
| Strategic reportEuroclear plc Annual Report 2016
25

| Strategic report
Through reliability, innovation and leadership, we strive at all times to live up to our reputation as one of the world’s preeminent providers of post-trade services:
• by listening closely to what our clients need and adapting quickly;
• by delivering on our commitments;
• by supporting the stability and development of the markets, locally and globally;
• by building effective partnerships with our clients and others in the industry.
Our corporate values are encapsulated in the word REACH, which stands for:
REACH embodies our aim to exceed expectations, to take advantage of new opportunities and to reach out to help our clients achieve success.
Our people
Our people are critical to our success. Developing the right mix of people and skills, engaging employees with our corporate values and mission, and providing a positive working environment as well as leadership support are priorities in every location of the group.
Over the course of 2016, 317 new colleagues joined Euroclear in locations around the world, reaching a workforce equivalent to 3,817 full-time employees at year-end.
Our ability as a company to face our future challenges depends largely on our employees’ capacity and willingness to learn and grow. This year we have put a strong focus on those aspects, providing employees with a clearer view on the development options and career orientations available to them, and encouraging them to actively seek professional development opportunities.
We promote internal mobility within the group; over 400 colleagues changed functions this year through our internal mobility opportunities.
In total, staff attended more than 9,500 days of training over the year. We have continued to build on the success of our Leadership Development Programme that focuses on leading for innovation and growth in a complex and uncertain world. In 2016 we have extended the concepts in this programme to people managers at all levels, with the objective to equip them with new ways of leading whatever their experience and level. Recognising the importance of personalised coaching as an engagement factor, we also offer a variety of coaching services, the objectives of which are to support employees and teams to reach their best potential. Several employees are now certified coaches. During the past year, 374 members of staff have participated in numerous programmes with high satisfaction scores.
In our annual staff engagement survey, 85% of staff participated in 2016, giving a highly representative picture of the organisation. The overall staff satisfaction score of 70% is the second highest ever recorded. We continue to take action as a result of the survey: in 2016 we have embedded stress management in our leadership training programme. We have also consolidated and followed up on well-
R
E
A
C
H
Respect
Effective
Accountable
Client first
Helpful
26
Euroclear plc Annual Report 2016

being plans – for instance, we have rolled out our Mindfulness programme in the UK, after successful deployment in France and Belgium.
We seek to ensure business continuity by taking an active role in succession planning. We are ramping up continuous efforts to make our organisational design more effective and agile, and providing ongoing support to employees through their careers.
The group’s diversity and inclusion action plan seeks to enrich the quality of what we do:
• by promoting equality of opportunity for all our people regardless of gender, ethnicity, sexual orientation, religion or disability;
• by showing each other respect;
• by removing any direct or indirect forms of discrimination that may limit the achievement of this goal.
After three years of action to promote better gender balance at all levels in the group, our actions start to bear fruit. We continue to see a positive trend in 2016 towards a better female
representation at senior levels (32% of women, a 2% increase), and at the level of first line management and senior operational experts (52% of women, a 4% increase). The perception of gender balance by employees has also improved, as measured in a positive result in the climate survey.
Our Diversity and Well-being initiatives also form an integral part of the workplace segment of Euroclear’s Corporate Responsibility framework. In 2016 Euroclear coaches have worked with the non-governmental organisation Greenlight for Girls, to encourage young women to take up Science, Technology, Engineering and Mathematics (STEM) subjects.
In our approach to employee relations, we ensure that all mandatory Social Relations bodies and committees – and related negotiations – are organised and conducted in a timely manner, and take place in each of our group entities as well as on a pan-European level, thereby complying with the Information and Consultation processes on recurrent topics and special projects.
27

| Strategic report
As a financial market infrastructure, our DNA is made up of openness and serving the public good by ensuring the efficiency of the capital markets.
28
Corporate responsibilityCorporate Responsibility (CR) is part of our DNA. Our CR mission is to conduct business in an ethical, responsible and sustainable way, while giving back to the wider community.
Our CR programme consists of four streams:
• Community;
• Environment;
• Marketplace;
• Workplace.
Community
The group’s community partnerships, which include supporting young entrepreneurs in Europe and schools and communities in rural Uganda, have made a positive contribution to local communities, as well as employee engagement.
In 2016, we reached the end of our first three year partnership with Build Africa and have agreed to extend the partnership for another three years. Our work with the school and community in Kalengo has exceeded expectations. 2016 saw the completion of all building works and the introduction of solar panels and technology.
Two field trips, consisting of staff from across the group, went out to Kalengo in 2016, taking part in a series of activities, including working with local savings and loans schemes.
In 2017, we will be focusing on neighbouring schools and communities, enabling thousands of families to rise above the poverty line. Staff raised €20,000 for Build Africa in 2016, which is matched by Euroclear.
In line with our focus on education as a means to creating economic equality, we also partner with Junior Achievement Europe to roll out programmes across eight of our locations.
Through this programme, staff can volunteer in local schools to help young people gain the skills they need to thrive in the modern business environment. In 2016, over 160 employees participated in one of the Junior Achievement programmes.
For more information on Junior Achievement Europe and Build Africa, please visit jaeurope.org and build-africa.org.
We continue to support many local initiatives through our local office charity committees, putting special emphasis on projects proposed by staff members. In 2016, Euroclear supported over 60 local charities across our locations. Some of our locations also run a matching gift scheme, whereby we match staff donations to registered charities.
| Strategic reportEuroclear plc Annual Report 2016
29

| Strategic report
Environment
As a responsible corporate citizen, we aim to reduce our impact on the environment as much as possible.
We focus on three main environmental pillars: compliance, emissions, and resource use. As a company, we have been third party certified to the BS PAS 2060 standard for Carbon Neutrality since 2012.
Since this date, we have invested over €0.6 million primarily in gold standard carbon credits, which include additional social or health benefits for the local communities.
Euroclear’s environmental initiatives have achieved a 29.0% reduction in the group’s carbon footprint since 2010. A large part of these savings have been linked to our reductions in energy consumption. We are an endorser of the EU Datacentre Code of Conduct and have reduced the energy related emissions from our offices and datacentres by a substantial 58.7%.
In 2017, we will be announcing new long-term emissions reduction targets based on Scientific Based Targeting. Our focus is to set ambitious targets to ensure that our operations and influence contribute actively to achieving the long-term goals from COP21.
Marketplace
Long-term sustainability and professional competence are the foundations upon which we have built our company’s position over the past decades. Our corporate reputation, brand, client trust and public confidence in our business activities depend upon the behaviour and safeguards put in place to anticipate and correct any potential problems,
internally and externally. This includes responsible procurement and adhering to strong business ethics. We commit to protect ourselves from possible unethical practices on the part of our suppliers, thereby implicating Euroclear as part of the supply chain. We strongly encourage all providers to, where possible, improve the footprint of goods and services. Increasingly, our clients rightly demand that we provide documented proof according to industry-wide accepted standards.
We are committed to ensuring that our staff can raise concerns without fear of consequence. To this end, in 2016 we took steps to put in place a revised ‘Speak Up’ framework. The framework sets out what can be reported, the process, as well as how a potential report is handled.
As part of extending our ‘Speak Up’ capabilities, we have contracted Safecall Ltd, an independent global specialist in the mitigation of fraud, theft and misconduct, to implement an external whistleblowing hotline. This hotline was implemented in early 2017, and is available to all staff to complement existing internal reporting channels.
Workplace
The workplace segment of our CR framework is comprised of its Diversity & Inclusion programme discussed above in ‘Our People’, and employee well-being and safety initiatives, such as promoting optimal work-life balance.
Through these programmes, we aim to create a working environment where all employees feel valued, respected, supported and fully engaged to contribute to our future success.
We are a diverse group with different working cultures, different clients,
and different ways of doing business. This diversity, whether it is gender diversity, racial diversity, or just a diversity of opinions, combined with an inclusive culture where people can be themselves, helps deliver value for our clients and our business, by:
• contributing to our attractiveness as an employer and to retain talented people;
• supporting our ability to forge strong and trusted relationships with a wide variety of existing and prospective clients around the world;
• fostering innovation and creativity to strengthen our competitive advantage and business performance;
• approaching challenges from a variety of perspectives to support problem solving and risk mitigation.
Our approach to work-life balance has seen the introduction of flexible working and teleworking, providing the technology and infrastructure to support a more agile work culture. Similarly, it has supported cultural and recreational activities for the benefit of staff and their families around the world.
We value our employees highly and are committed to protecting them, through the provision of a safe, secure and healthy workplace. We seek to ensure this through:
• Risk management of Euroclear’s activities and the implementation of appropriate emergency procedures or additional controls, to aid in the prevention of loss to people, property, equipment and the environment;
• Assessment of employee tasks to drive reduction in injuries and improve comfort, with focus on work related ill-health, particularly musculoskeletal and stress related conditions.
30
Euroclear plc Annual Report 2016

| Strategic reportEuroclear plc Annual Report 2016
Building a successful partnership with Build Africa
2016 brings us to the end of our initial three year partnership with Build Africa through which we supported a school and its local community in the village of Kalengo, in rural Uganda. Through this partnership, we have seen the school and community blossom in a way that was unimaginable back in 2013, when 700 children were having classes in the dust under a mango tree. There were over 160 children to a class, with no tables or chairs. There was one broken latrine block for all the children with no facilities for girls.
The original plans to provide infrastructure for the school and to set up ten savings and loans schemes in the community developed into a wide-reaching programme that has touched the lives of hundreds of families and engaged our staff on many levels. Over the last three years, five teams of colleagues from across the group travelled to Kalengo, making a significant difference to the local community and bringing back rewarding experiences for the volunteers.
We leave Kalengo with a robust fit for purpose infrastructure, sports facilities which have enabled children to compete at national level, thriving savings and loans schemes and a community committed to the education of its young people. Having not previously featured on its district league table, the school was ranked 3rd in 2016, out of 95 schools. Now, together with Build Africa, we will be extending our support further afield, working with schools and communities across the surrounding district, thereby multiplying our impact.
“The savings and loans schemes have helped the members learn how to make savings and improve their lives…I own a fish selling business […] Through this I am able to support my five children’s education…..”
Robert, a member of a Kalengo Savings & Loans group
What difference have we made?
• 12 classroom blocks
• Supply of desks and other furniture
• Library with over 1,000 books
• 2 new latrine blocks
• Borehole to pump clean water for school and local community
• Teacher accommodation block, kitchen and latrine
• Teacher training
• Health training
• 10 savings and loans schemes established to set up small businesses
31
32
Euroclear plcConsolidated financialstatements
Registered number: 01060802
and parent company financialstatements at 31 December 2016
Directors’ report
Statement of directors' responsibilities
Euroclear plc Board and Committees - composition
Consolidated income statement
Consolidated statement of comprehensive income
Consolidated statement of changes in equity
Consolidated statement of financial position
Consolidated statement of cash flows
Notes to the consolidated financial statements
I. Interests in other entities
II. Accounting policies
III. Critical accouting estimates and judgements
IV. Risk management and the financial risk management environment
V. Segment analysis
VI. Net interest income
VII. Net fee and commission income
VIII. Realised gains/(losses) on investment securities
IX. Net gains/(losses) on financial assets and liabilities held for trading
X. Administrative expenses
XI. Impairment
XII. Taxation
XIII. Deferred taxation
XIV. Available-for-sale financial assets
XV. Financial instruments held for trading
XVI. Derivatives used for hedging
XVII. Property, plant and equipment
XVIII. Goodwill and intangible assets
XIX. Provisions for liabilities and charges
XX. Defined benefit plans
XXI. Share capital
XXII. Other reserves
XXIII. Dividends paid
XXIV. Contingent liabilities and commitments
XXV. Operating lease commitments
XXVI. Related-party disclosures
XXVII. Events after the balance sheet date
Independent auditor's report
Parent company statement of financial position
Statement of changes in equity
Statement of cash flows
Notes to the parent company financial statements
Independent auditor's report
34
39
40
41
42
43
44
45
46
46
48
56
58
76
79
79
80
80
81
82
82
84
87
88
89
91
92
95
95
100
101
102
102
103
103
105
106
108
109
110
111
119

33
Euroclear plcConsolidated financialstatements
Registered number: 01060802
and parent company financialstatements at 31 December 2016
Directors’ report
Statement of directors' responsibilities
Euroclear plc Board and Committees - composition
Consolidated income statement
Consolidated statement of comprehensive income
Consolidated statement of changes in equity
Consolidated statement of financial position
Consolidated statement of cash flows
Notes to the consolidated financial statements
I. Interests in other entities
II. Accounting policies
III. Critical accouting estimates and judgements
IV. Risk management and the financial risk management environment
V. Segment analysis
VI. Net interest income
VII. Net fee and commission income
VIII. Realised gains/(losses) on investment securities
IX. Net gains/(losses) on financial assets and liabilities held for trading
X. Administrative expenses
XI. Impairment
XII. Taxation
XIII. Deferred taxation
XIV. Available-for-sale financial assets
XV. Financial instruments held for trading
XVI. Derivatives used for hedging
XVII. Property, plant and equipment
XVIII. Goodwill and intangible assets
XIX. Provisions for liabilities and charges
XX. Defined benefit plans
XXI. Share capital
XXII. Other reserves
XXIII. Dividends paid
XXIV. Contingent liabilities and commitments
XXV. Operating lease commitments
XXVI. Related-party disclosures
XXVII. Events after the balance sheet date
Independent auditor's report
Parent company statement of financial position
Statement of changes in equity
Statement of cash flows
Notes to the parent company financial statements
Independent auditor's report
34
39
40
41
42
43
44
45
46
46
48
56
58
76
79
79
80
80
81
82
82
84
87
88
89
91
92
95
95
100
101
102
102
103
103
105
106
108
109
110
111
119

34
Directors’ report
The directors of Euroclear plc (the 'Company') present their report, together with the audited consolidated financial statements of the company and its subsidiaries (the ‘group’), for the year ended 31 December 2016. A review of the group’s business, its development, and performance during and at the end of the financial year is set out in the Strategic Report which forms an integral part of this document.
Group overview and principal activities
The Euroclear group is the world's leading provider of post-trade services. The group provides settlement, safekeeping and servicing of domestic and cross-border securities, with asset classes covered including bonds, equities and investment funds. The Euroclear group includes the International Central Securities Depository ( ICSD ), Euroclear Bank, based in Brussels, as well as the domestic Central Securities Depositories ( CSDs ) Euroclear Belgium, Euroclear Finland, Euroclear France, Euroclear Nederland, Euroclear Sweden and Euroclear UK & Ireland. Euroclear Bank is the only credit institution in the Euroclear group. Euroclear SA / NV provides system development and support services to the other companies of the group. Euroclear plc is the holding company which owns, directly or indirectly, the entire issued share capital of these companies.
Euroclear SA / NV is headquartered in Brussels and operates three branches in Amsterdam, London and Paris. Euroclear Bank is headquartered in Brussels and operates two branches in Hong Kong and Krakow. The group’s domestic CSDs are headquartered in their local markets.
Euroclear Bank’s branch in Krakow, Euroclear Bank SA / NV (Spółka Akcyjna) – Oddział w Polsce, officially opened
in January 2013. By the end of 2016, it had grown to over 500 employees who serve our global client base. The Krakow branch provides a dual-office arrangement with Euroclear Bank’s existing operations in Belgium.
With more than 100 employees, Euroclear Bank SA / NV (Hong Kong Branch) is an important contributor to client servicing in Asia. Through the Hong Kong office, we are able to provide clients with a global service offering, despite the time zone difference with our headquarters in Europe.
Dividends
The Board proposes a final dividend of €37 (2015: €36.3) per Ordinary and ‘S’ share, to be approved by shareholders at the Annual General Meeting. This dividend evidences that the group stays committed to delivering long-term value to shareholders whilst leaving sufficient means for the group to fund its activity going forward.
Acquisition of own shares
In 2016, the PLC Board agreed to postpone to 2017 the decision to launch a share buy-back transaction and align its execution with the year-end capital planning and ordinary dividend distribution processes.
Information on likely future developments in the business of the company or its subsidiaries Likely future developments in the business of the company and its subsidiaries are included in the Strategic Report.
Post balance sheet events
There are no important post-balance events to report for the company and its subsidiaries except for the proposed dividend and share buy-back.
Risk management in Euroclear
Enterprise Risk management framework and governance Euroclear operates under a strong market infrastructure regulatory framework, and is a user owned organisation with strong client participation at Boardlevel. Euroclear intends to maintain its strong reputation in the financial industry for its safety and resilience and for the quality of its products and post-trade services.
In this context, the Board considers that a strong and effective risk governance framework, underpinned by a sound risk culture, is critical to the
| Directors' reportEuroclear plc Annual Report 2016

35
overall effectiveness of Euroclear’s risk management arrangements. To ensure the organisation’s risk arrangements continue to meet Board, market and regulatory expectations, the Euroclear group has initiated a group-wide risk transformation programme across the three lines of defence. The programme aims to reinforce Euroclear’s risk management framework in line with the increasing regulatory requirement including further clarification of the roles and responsibilities of the Board and its Committees, Senior Management, Line Management, and the Control Functions. Focus has been put also on the continuous integration of the regulatory evolution in the overall risk framework.
The Board oversees that effectiveness and independence of the control functions are in place. In particular, it ensures that the Risk Management function provides robust, independent oversight of risk-taking activities to help Euroclear achieve its goals and deliver its strategy within the Board’s risk appetite. The Risk Management function does this by: aiming to deliver and maintain an appropriate Enterprise Risk Management (ERM) framework; providing the Board and Senior Management with high quality, independent risk advice and guidance; and helping foster a healthy risk culture throughout the organisation. As part of the risk transformation programme, the Risk Management function is reinforcing its regulatory monitoring capability and risk management capabilities.
The ERM framework structures the way Euroclear manages its risks, within the Board’s risk appetite, whilst pursuing its strategy and corporate objectives. It also details the roles and responsibilities
of the three lines of defence, in line with the Board’s expectations and the governance arrangements.
The first line of defence is the primary source of (non-independent) assurance on the adequacy and effectiveness of the control environment to Senior Management and the Board. The first line of defence provides this assurance through amongst others regular risk and control self-assessments, ‘positive assurance reports’, ‘assurance maps’ and an annual internal control system report. The assurance maps are complemented by independent Risk Management (second line of defence) and Internal Audit (third line of defence) opinions. This regular reporting by the three lines of defence allows a frequent, effective and comprehensive monitoring of the control environment. Moreover, it
contributes to the effective operation of Euroclear’s three lines of defence model whereby the Risk Management function plays its role as an independent challenger to the first line of defence and where Internal Audit provides comprehensive assurance based on the highest level of independence and objectivity.
Risks affecting the groupAll of our entities face operational risk (the risk of loss resulting from inadequate or failed internal processes, people and systems, or from external events). Effective identification, monitoring, management and appropriate reporting are at the
centre of our approach. Being a market infrastructure, the integrity, confidentiality and availability of our and our clients’ data, and the continuous availability of our services, is very important.
Members of the Euroclear group are designated as critical national infrastructure in seven countries. Therefore as security and resilience is a key aspect of our approach to operational risk we have developed and tested comprehensive processes in all entities to ensure the security and continuous availability of business-critical services, including effective management response to incidents and crises. Therefore security remains high on our agenda. All locations have appropriate security and contingency arrangements for recovery from
workplace disruptions; supplemented by three geographically separate data centres to sustain operations in the event of a local and regional scale disaster. Disaster recovery response capability is proven through regular switches of activity between the primary data centres. We also regularly exercise and test our operational and management response and provide adequate training at all levels of the organisation.
Financial risks are borne mainly by the ICSD, Euroclear Bank, in its role as single-purpose settlement bank. The CSDs of the group have a very low risk appetite. They offer only securities
The Euroclear group has initiated a group-wide risk transformation programme across the three lines of defence.
| Directors' report ( continued )Euroclear plc Annual Report 2016

36
settlement services in central bank money and do not provide credit to clients. They do not engage in operations with counterparties, except for the investment of their own funds.
As a settlement bank, Euroclear Bank mainly faces collateralised intra-day credit exposures on its clients. In addition, it runs credit risk resulting from the intra-day use of a high-quality correspondent network and from short-term placements, mainly by using reverse repos, of clients’ end-of-day cash positions in the market with high-quality counterparties.
Because liquidity is key for the efficient functioning of Euroclear Bank, it has built a sound framework to ensure smooth day-to-day operations and have a high level preparedness to cope with unexpected and important liquidity shocks.
A very low level of market risk (interest rate and foreign exchange rate risks only) arises as a by-product of the investment of Euroclear Bank’s capital and proceeds of the debt issue (interest rate risk) and future earnings (interest rate and foreign exchange rate risks). There is no trading activity. A hedging strategy was put in place to mitigate the Euroclear Bank interest rate risk and foreign exchange risk.
ComplianceThe group-wide ethical and compliance
risk management framework allows Euroclear to adequately identify, monitor and manage the full spectrum of legal and compliance risks (including conduct risk). These include, amongst others, fraud, market abuse and money laundering. In addition, a specific focus is devoted to controls linked to economic sanctions taken by authorities. This framework is supported by a major communication effort (e-learning, case-based compliance tests, etc.) that helps maintain the staff’s high levels of awareness.
Supervision and regulationThe National Bank of Belgium and the Financial Services and Markets Authority are the supervisors of Euroclear Bank. The National Bank of Belgium is the lead regulator of Euroclear SA / NV. In addition, individual CSDs are supervised by their respective local regulator and
central bank, which set and monitor, among others, their capital adequacy, liquidity requirements, governance and internal control systems.
Recovery planIn line with regulatory rules and guidelines, we prepared recovery plans for each of the group entities as well as a plan for the group. These plans are approved by the Board of Directors, upon recommendation of the Risk and Audit Committees on a yearly basis. These recovery plans are designed to
allow Euroclear entities to recover their financial health in the face of extreme stress scenarios and thereby avoid going into resolution. To that aim, they identify and analyse a number of recovery options that the entity could take in order to restore its capital base, liquidity position or profitability, over a short to medium timeframe.
Detailed information on the risks faced by Euroclear, as well as its risk management strategies, policies and processes can be found in Euroclear’s yearly Pillar 3 report on www.euroclear.com as well as in Note IV to the Consolidated financial statements.
Corporate governance
IntroductionWe know that sound corporate governance is key for us to remain a trusted partner to our clients and safeguard the interests of our shareholders. We have put in place governance procedures and practices which promote accountability and transparency of decision-making throughout our group and which seek to ensure that all stakeholder’s interests are duly considered and that the Board sets the right tone at the top. These procedures are reinforced by our strong focus on ethical behaviour and positive working culture. We believe that these elements together enable us to make better business decisions that will secure our success.
The role of the Board and CommitteesGovernance of the Euroclear group is divided between the Boards of Euroclear plc and Euroclear SA / NV (ESA). Euroclear plc is a financial holding company and the ultimate parent company of the Euroclear group.
Euroclear has built a sound framework to ensure smooth day-to-day operations and have a high level preparedness to cope with unexpected and important liquidity shocks.
| Directors' report ( continued )Euroclear plc Annual Report 2016
37
ESA is the Belgian parent company of the international and national central securities depositories of the Euroclear group. It is a wholly owned subsidiary of Euroclear Investments SA, which itself is owned by Euroclear plc. Regulated by the National Bank of Belgium, ESA owns the group’s shared securities processing platforms and delivers support services to the other companies in the group.
The Board provides leadership for the group and is responsible for its long-term success. Our Board fulfils this leadership role by setting the tone at the top and ensuring it maintains a strong focus on strategic matters within the boundaries of our risk appetite. The Board achieves this balance by working towards a rolling agenda of periodic reports (for example a broad CEO report, financial updates, risk updates etc.) while ensuring adequate meeting time is made for business, risk and strategic reviews.
During 2016 the Board of Euroclear plc decided to align the timing of distributions to shareholders, in the form of dividends or share buy-backs, with the capital planning exercise at the first board meeting of each year. It also agreed to launch a debt issue of €600 million, to underpin the financial robustness of the group.
The Board of ESA, as operational parent of the group entities, balanced its time between dealing with regulatory matters and discussing business and strategy issues.
During the year, the Board dedicated time to performing a step back review of the strategic landscape with management. The aim of the review was to ensure that the group’s strategic priorities and ambitions remain relevant
and adapted to the changing regulatory and business environment and included a view of the current and emerging risks. These themes were also relevant in the Board’s ICAAP review and approval of the recovery plan during the year. The Board also intensified its oversight of the ESES T2S programme delivery following its delay and until it successful completion. Supported by the work of the Risk Committee and the Board of the ESES CSDs, it worked closely with management to ensure that the Company and its clients were ready for a safe transition to T2S in September.
The Board relies on the work and advice of its Committees to prepare its discussion and decisions on several key topics. This structure allows detailed or complex matters to be afforded the
adequate time and expert input.Each Committee operates within clearly defined terms of reference, which are regularly reviewed by the respective Committees and the full Board.
The ESA Risk Committee undertook a deep review this year of the Board’s approach to overseeing risk matters and setting and monitoring the risk appetite of the group. This was in parallel with overseeing a transformation of the group’s Risk Management division including recommending a new board corporate risk policy. At the same time, the Committee oversaw management’s revised strategy on cyber security, with the input of a dedicated adviser on cyber who was appointed
by the Risk Committee and made a recommendation to the Board on a renewed cyber security strategy at the end of 2016. The Committee also started its review of management’s readiness for the implementation of CSDR across the group. This was in addition to the more cyclical work of the Committee in monitoring, the risk assessments, the risk dashboards, the group’s risk appetite and risk framework throughout the course of the year.
The Audit Committee and Risk Committee worked jointly on the review of the group’s internal control framework and on capital planning, making their recommendation to the Board for the purposes of its ICAAP approval.
The Audit Committee continued to monitor our governance, risk and compliance framework as well as the Internal Control System for the group. It led and concluded a thorough RFP for the group audit services by recommending to the Board to propose to the shareholders to appoint Deloitte to take over from PwC as group auditors as of 1 January 2018.
The Remuneration Committee revisited the principles underpinning the Board approved Compensation Policy to ensure it remained relevant and in line with the current strategic, legal, regulatory and business context of the group. It also reviewed and
The Board also intensified its oversight of the ESES T2S programme delivery following its delay and until it successful completion.
| Directors' report ( continued )Euroclear plc Annual Report 2016

38
recommended to the Board the annual executive compensation approvals having taken advice from the Risk Committee to ensure that its approach and recommendations were in line with the group risk appetite.
During 2016, the Nominations and Governance Committee dedicated time to preparing and advising the Board on the transition to a new group CEO, in line with the preparatory succession planning it had carried out. It also led the Board’s work with regard to revising and further reinforcing the policy and procedure at Board level on identifying and managing conflicts of interest.
Details of the Board, its Committees and attendance at meetings throughout the year are set out on page 40 and further information and terms of reference can be found on www.euroclear.com.
Our Boards and ManagementAt the end of 2016, the Euroclear plc Board was composed of 21 non-executive directors, 16 of whom were senior executives from firms which are customers and shareholders. The other five directors, including our chairman (Mr. Marc Antoine Autheman) and the deputy chairman (Mr. Eddy Wymeersch), are independent non-executive directors.
All of the directors on the Euroclear plc Board are also Euroclear SA / NV Board members in addition to three members of the Euroclear group Senior Management. The directors of Euroclear plc who have held office during 2016 to the date of this report are listed on page 40. The directors of Euroclear plc have no interest in the shares or in the options on shares of any group company. Directors of Euroclear plc do not participate in a stock option scheme.
There are seven members of the Management Committee in Euroclear SA / NV and it is chaired by the group CEO. The Board has delegated to the Management Committee the responsibility for the management of the Company within the strategic framework defined by the Board.
Political donations
No political donations were made during the year.
Research and development
The Euroclear group has continued investing in research and development. These investments are linked to the performance and resilience of our systems as well as business developments, which are described in more detail in the Strategic Report. The group also continued investing in market research in line with its mission to provide increasingly commoditised market infrastructure services.
Our responsibility
Please refer to the strategic report for an overview of our mission and values, our commitment to our people and our corporate responsibility.
Non-statutory audit services
The amount of fees charged to Euroclear plc and its subsidiaries for non-statutory audit services amounted to €1,095,000, the largest part of it relating to the ISAE 3402 report. Further details of fees for audit and non-audit services are provided in Note X of the financial statements.
Disclosure of information to the auditors
Each of the persons who is a director at the date of approval of this report confirms that:
• so far as each director is aware, there is no relevant audit information of which the group’s auditors are unaware; and
• the director has taken all steps that he/she ought to have taken as a director in order to make himself/herself aware of any relevant audit information and to establish that the group’s auditors are aware of that information.
By order of the Board
| Directors' report ( continued )Euroclear plc Annual Report 2016
Marc Antoine AuthemanChairman of the Board23 February 2017

39
Statement of directors’ responsibilities
The following statement, which should be read in conjunction with the independent auditor’s report, is made with the purpose of distinguishing for shareholders the responsibilities of the directors from those of the auditors in relation to the financial statements.
The directors are required by the Companies Act 2006 to prepare financial statements for each financial year. Under that law, the directors have prepared the group and parent company financial statements in accordance with International Financial Reporting Standards (IFRS) as adopted by the European Union. In preparing the group financial statements, the directors have also elected to comply with IFRS issued by the International Accounting Standards Board (IASB). The financial statements are required by law to give a true and fair view of the state of affairs of the group and the parent company at the end of the financial period and of the profit or loss of the group for that period. In preparing those financial statements, the directors are required to:
• select suitable accounting policies and then apply them consistently;
• make judgements and estimates that are reasonable and prudent;
• state that the financial statements comply with IFRS as adopted by the European Union and IFRS issued by IASB; and
• prepare the financial statements on the going concern basis, unless it is inappropriate to presume that the group will continue in business.
The directors confirm that they have complied with the above requirements in preparing the financial statements.
The directors are responsible for keeping adequate accounting records that are sufficient to show and explain the company’s transactions and disclose with reasonable accuracy and at any time the financial position of the group and the parent company and enable them to ensure that the financial statements comply with the Companies Act 2006. They are also responsible for safeguarding the assets of the parent company and the group and hence for taking reasonable steps for the prevention and detection of fraud and other irregularities.
The directors are responsible for the maintenance and integrity of the company’s website. Legislation in the United Kingdom governing the preparation and dissemination of financial statements may differ from legislation in other jurisdictions.
Each person who is a director at the date of approval of this report confirms that:
• so far as each director is aware, there is no relevant audit information of which the company’s auditors are unaware; and
• each director has taken all steps that he / she ought to have taken as a director to make himself /herself aware of any relevant audit information and to establish that the company’s auditors are aware of that information.
This confirmation is given and should be interpreted in accordance with the provisions of Section 418(2) of the Companies Act 2006.
By order of the Board
In relation to the financial statements
Marc Antoine AuthemanChairman of the Board23 February 2017
| Statement of directors’ responsibilitesEuroclear plc Annual Report 2016

40
Euroclear plc Board and Committees – compositionAs at 31 December 2016
MembersEuroclear plc
BoardAudit
Committee
Nominations &Governance Committee
RemunerationCommittee
Operations Committee
Marc Antoine Autheman ( Chairman ) 3( 3 ) 3( 3 ) 3( 3 ) ( chair ) 2( 2 ) ( chair )
Eddy Wymeersch ( Deputy Chairman )
3( 3 ) 3( 3 ) 3( 3 ) 2( 2 )
Michel Berthezène 3( 3 ) 3( 3 ) 3( 3 )
Ingeborg Boets 3( 3 ) 5( 5 ) ( chair ) 2( 2 )
Cian Burke 3( 3 ) 4( 5 )
Anthony Carey ( appointed 12 July 2016 )
2( 2 )
Patrick Colle 3( 3 ) 4( 5 )
Stephen Davies ( resigned 19 October 2016 )
2( 2 ) 4( 4 )
John Devine 3( 3 ) 5( 5 )
Xiaomei Fan ( appointed 8 December 2016 )
0( 1 ) 0( 0 )
Mark S. Garvin 2( 3 ) 2( 3 ) ( chair ) 2( 3 ) 0( 2 )
Isabelle Hennebelle 2( 3 )
Toru Horie ( resigned 10 May 2016 )
1( 1 ) 2( 2 )
Thomas Isaac 3( 3 )
Masashi Kurabe 3( 3 ) 3( 3 ) 3( 3 )
Francis La Salla 3( 3 ) 3( 3 ) 3( 3 )
Xiaochi Liu ( resigned 8 December 2016 )
3( 3 ) 3( 3 ) 3( 3 )
Francois Marion 2( 3 ) 4( 5 ) 1( 2 )
Neil Martin ( resigned 23 February 2016 )
1( 1 )
Nils-Fredrik Nyblaeus 3( 3 ) 1( 2 )
Franco Passacantando 3( 3 )
Bruno Prigent 3( 3 )
Satvinder Singh 1( 3 )
Tsutomu Suzuki (appointed 22 November 2016)
0( 1 ) 0( 0 )
Clare Woodman 2( 3 ) 1( 3 ) 2( 3 )
( ) the figure in brackets indicates the maximum number of meetings the director could have attended
* attended as invitee.
| Euroclear plc Board and Committees – compositionEuroclear plc Annual Report 2016

41
( €’000 ) Notes 2015 2016
Interest income VI 128,909 164,169
Interest expense VI ( 30,023 ) ( 41,229 )
Net interest income 98,886 122,940
Fee and commission income VII 1,367,816 1,393,148
Fee and commission expense VII ( 385,044 ) ( 408,473 )
Net fee and commission income 982,772 984,675
Net interest and fee income 1,081,658 1,107,615
Dividend income 4,743 6,944
Realised gains / ( losses ) on investment securities VIII 20 2,516
Net gains / ( losses ) on financial assets and liabilities held for trading IX 25,871 27,947
Net gains / ( losses ) on foreign exchange 5,949 5,253
Other operating income 11,980 11,673
Operating income 1,130,221 1,161,948
Administrative expenses X ( 723,068 ) ( 778,465 )
Share of the profit / ( loss ) of investments accounted for using equity method I ( 6,520 ) ( 7,069 )
Operating profit / ( loss ) before impairment and taxation 400,633 376,414
Impairment XI ( 757 ) ( 2,997 )
Operating profit / ( loss ) before taxation 399,876 373,417
Taxation XII, XIII ( 106,950 ) ( 75,225 )
Profit / ( loss ) for the year 292,926 298,192
Consolidated income statementFor the year ended 31 December 2016
For the list of companies in the group, see Note I. The accompanying Notes form an integral part of these financial statements.
| Consolidated income statementEuroclear plc Annual Report 2016

42
2015 2016
( €’000 ) Notes Gross Tax Net Gross Tax Net
Changes in other comprehensive income
– Available-for-sale financial assets XIV, XXII 115,199 ( 560 ) 114,639 ( 45,642 ) ( 65 ) ( 45,707 )
– Cash flow hedges XVI, XXII 1,963 ( 667 ) 1,296 ( 1,997 ) 679 ( 1,318 )
– Foreign currency translation reserve XXII 11,024 – 11,024 ( 28,792 ) – ( 28,792 )
Recyclable subsequently to profit / ( loss ) 128,186 ( 1,227 ) 126,959 ( 76,431 ) 614 ( 75,817 )
– Defined benefit plans XX 34,229 ( 10,617 ) 23,612 ( 29,907 ) 9,573 ( 20,334 )
Not recyclable to profit / ( loss ) 34,229 ( 10,617 ) 23,612 ( 29,907 ) 9,573 ( 20,334 )
Other comprehensive income for the year
162,415 ( 11,844 ) 150,571 ( 106,338 ) 10,187 ( 96,151 )
Profits / ( loss ) for the year 399,876 ( 106,950 ) 292,926 373,417 ( 75,225 ) 298,192
Total comprehensive income for the year
562,291 ( 118,794 ) 443,497 267,079 ( 65,038) 202,041
Consolidated statement of comprehensive incomeFor the year ended 31 December 2016
The accompanying Notes form an integral part of these financial statements.
| Consolidated statement of comprehensive incomeEuroclear plc Annual Report 2016

43
( €’000 ) Notes
Called up share
capital
Share premium account
Capital redemption
reserveOther
reservesRetained earnings
Total equity
At 1 January 2016 3,228 143,223 603 1,088,525 2,239,952 3,475,531
Changes in other comprehensive income
– Available-for-sale financial assets XXII – – – ( 45,707 ) – ( 45,707 )
– Cash flow hedges XXII – – – ( 1,318 ) – ( 1,318 )
– Foreign currency translation reserve XXII – – – ( 28,792 ) – ( 28,792 )
– Defined benefit plans – – – – ( 20,334 ) ( 20,334 )
Transfer to legal reserve XXII – – – 9,905 ( 9,905 ) –
Profit / ( loss ) for the year – – – – 298,192 298,192
Dividends paid XXIII – – – – ( 117,186 ) ( 117,186 )
At 31 December 2016 3,228 143,223 603 1,022,613 2,390,719 3,560,386
At 1 January 2015 3,369 143,223 462 949,693 2,147,736 3,244,483
Changes in other comprehensive income
– Available-for-sale financial assets XXII – – – 114,639 – 114,639
– Cash flow hedges XXII – – – 1,296 – 1,296
– Foreign currency translation reserve XXII – – – 11,024 – 11,024
– Defined benefit plans – – – – 23,612 23,612
Transfer to legal reserve XXII – – – 11,873 ( 11,873 ) –
Profit / ( loss ) for the year – – – – 292,926 292,926
Share buy-back XXI ( 141 ) – 141 – ( 106,224 ) ( 106,224 )
Dividends paid XXIII – – – – ( 106,225 ) ( 106,225 )
At 31 December 2015 3,228 143,223 603 1,088,525 2,239,952 3,475,531
Consolidated statement of changes in equityFor the year ended 31 December 2016
The accompanying Notes form an integral part of these financial statements.
| Consolidated statement of changes in equityEuroclear plc Annual Report 2016
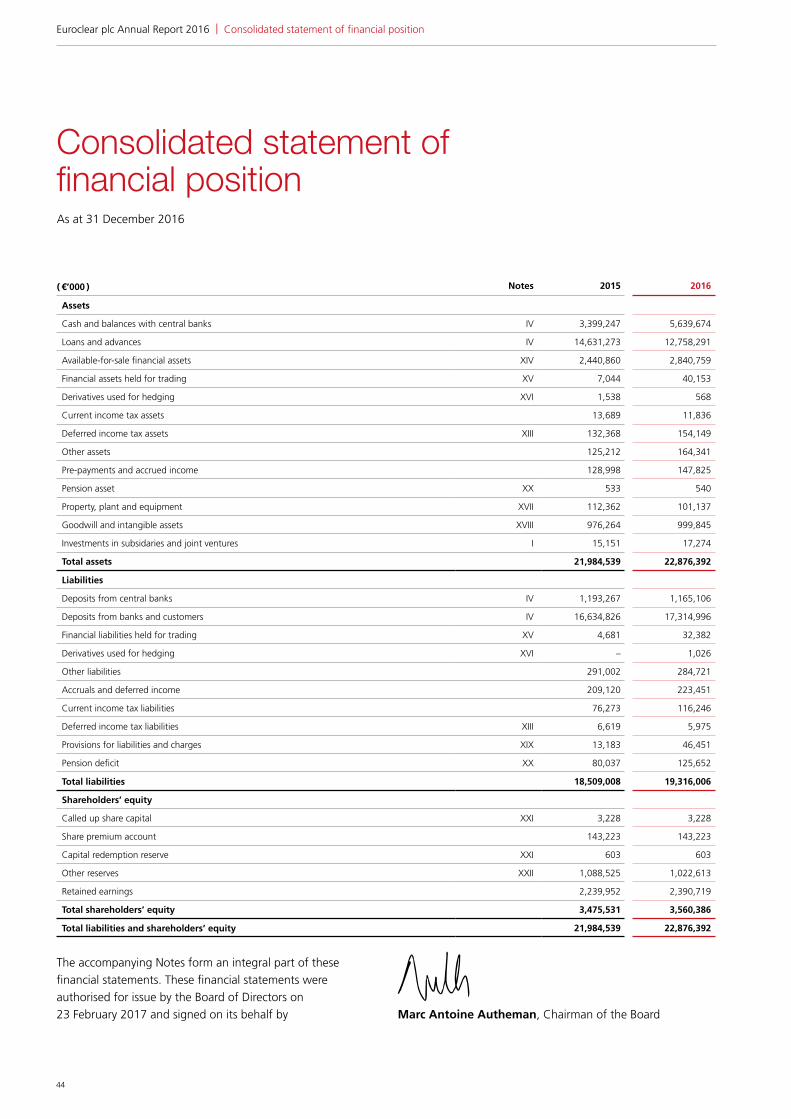
44
Consolidated statement of financial positionAs at 31 December 2016
( €’000 ) Notes 2015 2016
Assets
Cash and balances with central banks IV 3,399,247 5,639,674
Loans and advances IV 14,631,273 12,758,291
Available-for-sale financial assets XIV 2,440,860 2,840,759
Financial assets held for trading XV 7,044 40,153
Derivatives used for hedging XVI 1,538 568
Current income tax assets 13,689 11,836
Deferred income tax assets XIII 132,368 154,149
Other assets 125,212 164,341
Pre-payments and accrued income 128,998 147,825
Pension asset XX 533 540
Property, plant and equipment XVII 112,362 101,137
Goodwill and intangible assets XVIII 976,264 999,845
Investments in subsidaries and joint ventures I 15,151 17,274
Total assets 21,984,539 22,876,392
Liabilities
Deposits from central banks IV 1,193,267 1,165,106
Deposits from banks and customers IV 16,634,826 17,314,996
Financial liabilities held for trading XV 4,681 32,382
Derivatives used for hedging XVI – 1,026
Other liabilities 291,002 284,721
Accruals and deferred income 209,120 223,451
Current income tax liabilities 76,273 116,246
Deferred income tax liabilities XIII 6,619 5,975
Provisions for liabilities and charges XIX 13,183 46,451
Pension deficit XX 80,037 125,652
Total liabilities 18,509,008 19,316,006
Shareholders’ equity
Called up share capital XXI 3,228 3,228
Share premium account 143,223 143,223
Capital redemption reserve XXI 603 603
Other reserves XXII 1,088,525 1,022,613
Retained earnings 2,239,952 2,390,719
Total shareholders’ equity 3,475,531 3,560,386
Total liabilities and shareholders’ equity 21,984,539 22,876,392
The accompanying Notes form an integral part of these financial statements. These financial statements were authorised for issue by the Board of Directors on 23 February 2017 and signed on its behalf by Marc Antoine Autheman, Chairman of the Board
| Consolidated statement of financial positionEuroclear plc Annual Report 2016
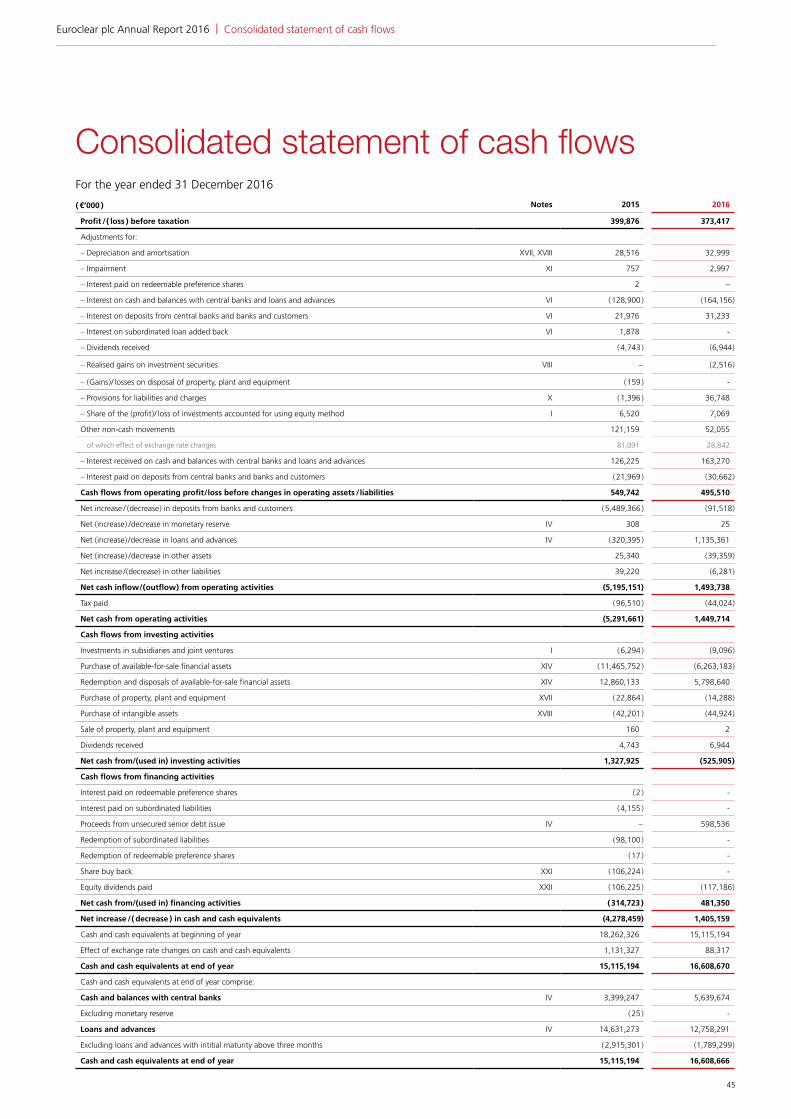
45
Consolidated statement of cash flowsFor the year ended 31 December 2016
( €’000 ) Notes 2015 2016
Profit / ( loss ) before taxation 399,876 373,417
Adjustments for:
– Depreciation and amortisation XVII, XVIII 28,516 32,999
– Impairment XI 757 2,997
– Interest paid on redeemable preference shares 2 –
– Interest on cash and balances with central banks and loans and advances VI ( 128,900 ) ( 164,156 )
– Interest on deposits from central banks and banks and customers VI 21,976 31,233
– Interest on subordinated loan added back VI 1,878 -
– Dividends received ( 4,743 ) ( 6,944 )
– Realised gains on investment securities VIII – ( 2,516 )
– ( Gains ) / losses on disposal of property, plant and equipment ( 159 ) -
– Provisions for liabilities and charges X ( 1,396 ) 36,748
– Share of the ( profit ) / loss of investments accounted for using equity method I 6,520 7,069
Other non-cash movements 121,159 52,055
of which effect of exchange rate changes 81,091 28,842
– Interest received on cash and balances with central banks and loans and advances 126,225 163,270
– Interest paid on deposits from central banks and banks and customers ( 21,969 ) ( 30,662 )
Cash flows from operating profit / loss before changes in operating assets / liabilities 549,742 495,510
Net increase / ( decrease ) in deposits from banks and customers ( 5,489,366 ) ( 91,518 )
Net ( increase ) / decrease in monetary reserve IV 308 25
Net ( increase ) / decrease in loans and advances IV ( 320,395 ) 1,135,361
Net ( increase ) / decrease in other assets 25,340 ( 39,359 )
Net increase / ( decrease ) in other liabilities 39,220 ( 6,281 )
Net cash inflow / ( outflow ) from operating activities (5,195,151) 1,493,738
Tax paid ( 96,510 ) ( 44,024 )
Net cash from operating activities (5,291,661) 1,449,714
Cash flows from investing activities
Investments in subsidiaries and joint ventures I ( 6,294 ) ( 9,096 )
Purchase of available-for-sale financial assets XIV ( 11,465,752 ) ( 6,263,183 )
Redemption and disposals of available-for-sale financial assets XIV 12,860,133 5,798,640
Purchase of property, plant and equipment XVII ( 22,864 ) ( 14,288 )
Purchase of intangible assets XVIII ( 42,201 ) ( 44,924 )
Sale of property, plant and equipment 160 2
Dividends received 4,743 6,944
Net cash from/(used in) investing activities 1,327,925 ( 525,905 )
Cash flows from financing activities
Interest paid on redeemable preference shares ( 2 ) -
Interest paid on subordinated liabilities ( 4,155 ) -
Proceeds from unsecured senior debt issue IV – 598,536
Redemption of subordinated liabilities ( 98,100 ) -
Redemption of redeemable preference shares ( 17 ) -
Share buy back XXI ( 106,224 ) -
Equity dividends paid XXII ( 106,225 ) ( 117,186 )
Net cash from/(used in) financing activities ( 314,723 ) 481,350
Net increase / ( decrease ) in cash and cash equivalents (4,278,459) 1,405,159
Cash and cash equivalents at beginning of year 18,262,326 15,115,194
Effect of exchange rate changes on cash and cash equivalents 1,131,327 88,317
Cash and cash equivalents at end of year 15,115,194 16,608,670
Cash and cash equivalents at end of year comprise:
Cash and balances with central banks IV 3,399,247 5,639,674
Excluding monetary reserve ( 25 ) -
Loans and advances IV 14,631,273 12,758,291
Excluding loans and advances with intitial maturity above three months ( 2,915,301 ) ( 1,789,299 )
Cash and cash equivalents at end of year 15,115,194 16,608,666
| Consolidated statement of cash flowsEuroclear plc Annual Report 2016

46
Notes to the consolidated financial statementsI. Interests in other entities
I.1. General informationEuroclear plc (the Company) and its subsidiaries (together, the group) arrange for the provision of settlement and related services, including banking services in the case of Euroclear Bank, for domestic and international securi¬ties transactions, covering bonds, equities, investment funds and derivatives.
Euroclear plc is a limited liability company and is incorporated in the United Kingdom. The address of its registered office is:Euroclear plc33 Cannon StreetLondon EC4M 5SB United Kingdom
Copies of the Euroclear Plc and Euroclear SA / NV consolidated financial statements can be obtained at the same address or checked on www.euroclear.com.
The company is domiciled in Switzerland, with its executive office located at:Baarermatte6340 BaarSwitzerland
I.2. SubsidiariesThe full list of subsidiaries of the group can be found in Note II to the parent company financial statements.
In April 2015, Euroclear Investments took over a 70% stake in Taskize Limited. Taskize Limted is a start-up company founded to develop and bring to market Taskize Connect, a collaboration software designed to resolve issues in global banking operations within and between firms.
In November 2016, Euroclear Investments’ participations in Taskize and Euroclear Market Solutions Limited were dropped down to Euroclear SA / NV at their acquisition value.
Euroclear Plc does not have any non-controlling interests in its subsidiaries other than in Taskize. Judgements and estimates are thus not taken in assessing the subsidiaries’ ownership
interest. The company does not face any significant restriction on its ability to access or use assets, and settle liabilities, of the group.
I.3. Joint ventureThe Depository Trust & Clearing Corporation (DTCC) and Euroclear created a joint venture in September 2014 focusing on collateral processing. The company, DTCC-Euroclear Global Collateral Ltd, is domiciled in the United Kingdom.
The joint venture provides an open industry infrastructure solution for clients as they manage their collateral margin needs, including a Margin Transit Utility (MTU) providing straight-through processing to the settlement of margin obligations, and a Collateral Management Utility (CMU) offering optimised collateral mobility and allocation at a global level.
The joint arrangement between DTCC and Euroclear SA / NV qualifies as a joint venture. Ownership and governance of the company is shared equally between DTCC and Euroclear with its Board and senior executives drawn from the two firms’ management. Under the contractual agreements, unanimous consent is required from the two parties for all relevant activities. The shareholders are jointly responsible for the new company. The joint arrangement is conducted through a separate legal entity, which has been equally funded by the two shareholders. Each party has a 50% interest in the company (covering both MTU and CMU services all together) with equal rights attached to shares, dividends and net assets.
The company financial statements are prepared in accordance with International Financial Reporting Standards.
There are neither commitments nor contingent liabilities relating to the group’s interest in the joint venture.
DTCC-Euroclear Global Collateral Ltd is not a listed company and there is no quoted market price available for its shares.
| Notes to the consolidated financial statementsEuroclear plc Annual Report 2016

47
Country of incorporationProportions of voting rights and
ordinary shares held Dividends received
DTCC-Euroclear Global Collateral Ltd United Kingdom 50% –
Summarised statement of financial position ( €’000 ) 2015 2016
Assets
Cash and cash equivalents 31,136 29,082
Other current assets ( excluding cash ) 22 46
Non-current assets 3,609 13,004
Total assets 34,767 42,132
Liabilities
Other current liabilities ( including trade payables ) 17,053 20,172
Total liabilities 17,053 20,172
Summarised statement of comprehensive income ( €’000 ) 2015 2016
Operating profit / ( loss ) before taxation ( 17,690 ) ( 23,714 )
Taxation 3,609 9,576
Profit / ( loss ) for the year ( 14,081 ) ( 14,138 )
Total comprehensive income ( 14,081 ) ( 14,138 )
Reconciliation of summarised financial information ( €’000 ) 2015 2016
Opening net assets 1 January 27,784 17,714
Capital injection – 18,192
Profit / ( loss ) for the year ( 14,081 ) ( 14,138 )
Loss attributable to 2014 1,042 –
Effect of exchange rate changes 2,969 192
Closing net assets at 31 December 17,714 21,960
Interest in joint venture at 50%
Carrying value 8,857 10,980
50% of the total comprehensive income are recognised in the group’s consolidated comprehensive income.
| Notes to the consolidated financial statements ( continued )Euroclear plc Annual Report 2016

48
II. Accounting policies
II.1. Basis of preparationThe consolidated and parent company financial statements have been prepared in accordance with International Financial Reporting Standards as adopted by the European Union (IFRSs as adopted by the EU), IFRIC Interpretations and the Companies Act 2006 applicable to companies reporting under IFRS.
These financial statements have been prepared under the historical cost convention, as modified by the revaluation of certain financial instruments and are prepared on a going concern basis.
The EU has not endorsed IAS 39 Financial Instruments: Recognition and Measurement as issued by the IASB, deciding instead to amend some of the hedge accounting requirements. The group has not applied these hedge accounting requirements and has therefore effectively also complied with IAS 39 in full as issued by the IASB.
The preparation of financial statements in conformity with IFRSs requires the use of certain critical accounting estimates. It also requires management to exercise its judgement in the process of applying the company's accounting policies. The areas involving a higher degree of judgement or complexity, or areas where assumptions and estimates are significant to the financial statements, are disclosed in Note III.
II.1.a. Adoption of interpretation and amendments to standards The following amendments to standards became effective on 1 January 2016:
• Annual improvements to IFRS 2010-2012 cycle
• Amendments to IAS 19 Defined Benefit Plans: Employee contributions
• Annual improvements to IFRS 2012-2014 cycle
• Amendments to IAS 1 Disclosure Initiative
• Amendments to IAS 27 Equity Method in Separate Financial Statements
• Amendments to IAS 16 and IAS 41 Bearer Plants
• Amendments to IAS 16 and IAS 38 Classification of Acceptable Methods of Depreciation and Amortisation
• Amendments to IFRS 11 Accounting of Acquisitions of Interests in Joint Operations
• Amendments to IFRS 10, IFRS 12 and IAS 28 Investment entities – Applying the consolidation exemption
II.1.b. Standards, amended standards and interpretations endorsed by the EU, but not yet effective in 2017No new standards, interpretations, or amendments to standards became effective on 1 January 2017.
The following new standards will be applied for financial years commencing on 1 January 2018.
• IFRS 9 on Financial Instruments. The group has started its assessment of the classification and measurement of financial assets. Debt and equity instruments are currently classified as available-for-sale financial assets. These assets will satisfy the conditions for classification as at fair value through other comprehensive income (FVOCI) and hence there will be no change to the accounting for these assets. Accordingly, the group does not expect the new guidance to have a significant impact on the classification and measurement of its financial assets.
There will be no impact on the group’s accounting for financial liabilities, as the new requirements only affect the accounting for financial liabilities that are designated at fair value through profit or loss and the group does not have any such liabilities.
The new hedge accounting rules will align the accounting for hedging instruments more closely with the group’s risk management practices. The group’s current hedge relationships will still qualify as continuing hedges upon the adoption of IFRS 9. Accordingly, the group does not expect a significant impact on the accounting for its hedging relationships.
The new impairment model requires the recognition of impairment provisions based on expected credit losses (ECL) rather than only incurred credit losses as is the case under IAS 39. The new model will result in an earlier recognition of credit losses. The group has undertaken a detailed assessment of how its impairment provisions will be affected by the new model. The group does not expect a significant impact on the accounting from the adoption of the ECL, due to the
| Notes to the consolidated financial statements ( continued )Euroclear plc Annual Report 2016

49
short term nature of the group’s financial assets and high level of collateralisation.
The new standard also introduces expanded disclosure requirements and changes in presentation. These are expected to change the nature and extent of the group’s disclosures about its financial instruments particularly in the year of the adoption of the new standard.
• IFRS 15 Revenue from Contracts with Customers: the application of this new standard will have no significant impact on the group’s financial statements.
II.2. Summary of significant accounting policiesThe principal accounting policies applied in the preparation of these consolidated financial statements are set out below. Unless otherwise stated, these policies have been consistently applied to all the years presented.
II.3. ConsolidationSubsidiaries are all entities over which the group has control. The group controls an entity when the group is exposed to, or has rights to, variable returns from its involvement with the entity and has the ability to affect those returns through its power to direct the activities of the entity. Subsidiaries are fully consolidated from the date on which control is transferred to the group. They are deconsolidated from the date that control ceases.
A group entity controls an investee if and only if the investor has all the following:
• power over the investee;
• exposure, or rights, to variable returns from its involvement with the investee; and
• the ability to use its power over the investee to affect the amount of the investor’s returns.
In accordance with IFRS 3, the cost of an acquisition is measured as the fair value of the assets given, equity instruments issued and liabilities incurred or assumed at the date of exchange. Costs directly attributable to the acquisition are expensed. Identifiable assets acquired and liabilities and contingent liabilities assumed in a business combination are measured initially at their fair values at the acquisition date, irrespective of the extent of any minority interest.
The excess of the cost of acquisition over the fair value of the group's share of the identifiable net assets is recognised as goodwill. If the cost of acquisition is less than the fair value of the group's share of the net assets of the subsidiary acquired, the difference is recognised directly in the income statement.
Inter-company transactions, balances and unrealised gains on transactions between group companies are eliminated. Unrealised losses are also eliminated unless the transaction provides evidence of impairment of the asset transferred. Where permitted under local legislation, the accounting policies of subsidiaries have been changed to ensure consistency with the policies of the group.
Business combinations involving entities under common control were specifically excluded from the scope of IFRS 3 Business combinations. The group has therefore applied the guidance provided by IAS 8 Accounting policies, changes in accounting estimates and errors, which requires man-agement to consider the requirements and guidance in other international standards and interpretations dealing with similar issues. Management have therefore applied the UK GAAP requirements of Financial Reporting Standard (FRS) 6 Mergers and acquisitions for such business combinations involving entities under common control. This standard allows the assets and liabilities of the parties to the combination to be retained at their book value.
A joint arrangement is an arrangement of which two or more parties have joint control. A joint arrangement has the following characteristics:
• the parties are bound by a contractual arrangement;
• the contractual arrangement gives two or more of those parties joint control of the arrangement.
A joint arrangement is either a joint operation or a joint venture.
A joint venture is a joint arrangement whereby the parties that have joint control of the arrangement have rights to the net assets of the arrangement. Joint ventures are accounted for using the equity method of accounting. Under the equity method, the investment is initially recognised at cost and the carrying amount is subsequently increased or decreased to recognise the group’s share of the net result of the joint venture after the acquisition. The group’s share of the joint venture’s profit or loss is recognised in its income statement.
| Notes to the consolidated financial statements ( continued )Euroclear plc Annual Report 2016

50
The group’s interest in a joint venture or associate is carried in the statement of financial position at its share in the net assets of the joint venture, less any impairment loss. The accounting policies of the joint venture are changed where necessary to ensure consistency with the policies adopted by the group.
II.4. Segment reportingAn operating segment is a component of an entity that engages in business activities from which it may earn revenues and incur expenses.
Operating segments are reported in a manner consistent with the internal reporting provided to the chief operating decision-maker. The chief operating decision maker, who is responsible for allocating resources and assessing performance of the operating segments, has been identified as the Euroclear SA / NV Management Committee.
II.5. Foreign currency translationII.5.a. Functional and presentation currencyItems included in the financial statements of each of the group's entities are measured using the currency of the primary economic environment in which the entity operates (the functional currency). The consolidated financial statements are presented in euro, which is the company's functional and pre-sentation currency.
II.5.b. Transactions and balancesForeign currency transactions are translated into the functional currency using the exchange rates prevailing at the dates of the transactions. Foreign exchange gains and losses resulting from the settlement of such transactions and from the translation at year-end exchange rates of monetary assets and liabilities denominated in foreign currencies are recognised in the income statement, except when deferred in equity as qualifying cash flow hedges and qualifying net investment hedges. Translation differences on non-monetary items measured at fair value through profit or loss are reported as part of the fair value gain or loss. Translation differences on other non-monetary items are included in the foreign currency translation reserve.
II.5.c. Group companiesThe results and financial position of all the group's entities that have a functional currency different from the presentation currency are translated into the presentation currency as follows:
• assets and liabilities for each balance sheet presented are translated at the closing exchange rate at the balance sheet date;
• income and expenses for each income statement are translated at average exchange rates for the year; and
• the resulting exchange differences are recognised in the foreign currency translation reserve.
On consolidation, exchange differences arising from the translation of the net investment in foreign entities, and of borrowings and other currency instruments designated as hedges of such investments, are taken to other comprehensive income, in the foreign currency translation reserve and the hedge of net investments in foreign operations reserve. When a foreign operation is sold, such exchange differences are recognised in the income statement as part of the gain or loss on the sale.
None of the group companies have used the currency of a hyperinflationary economy as its functional currency.
Goodwill and fair value adjustments arising on the acquisition of a foreign entity are treated as assets and liabilities of the foreign entity and translated at the closing exchange rate.
II.6. Revenue recognitionII.6.a. Interest income and expenseInterest income and expense are recognised in the income statement for all instruments measured at amortised cost using the effective interest rate method. This is a method of calculating the amortised cost of a financial asset or liability and of allocating the interest income or interest expense over the relevant accounting years.
The effective interest rate is the rate that exactly discounts the estimated cash payments or receipts over the expected life of the instrument to the net carrying amount of the financial asset or financial liability. When calculating the effective interest rate, the future expected cash flows are estimated after considering all the contractual terms of the instrument, but not future credit losses.
Group loans to, and deposits from, banks and customers are principally related to Euroclear Bank clients' cash accounts operated in connection with their securities settlement activity, with balances generally changing on a daily basis.
| Notes to the consolidated financial statements ( continued )Euroclear plc Annual Report 2016

51
Time deposits and the re-deposits of surplus funds rarely have maturities of more than three months. Interest income and expense on derivative instruments are recorded in profit and loss on an accrual basis.
II.6.b. Fee and commission income and expenseFee and commission income and expense which respectively represent a return and cost for services rendered (such as safekeeping, settlement and custody) are recognised in the income statement when the related service is performed. Safekeeping fees are based on the monthly average depot value of securities held in custody, while settlement fees are based on the number of settled transactions. Rebates granted are deducted from fee and commission income when declared.
Fee and commission income and expense, which represent a return for credit risk borne or which are in the nature of interest (securities borrowing), are recognised in the income statement over the period of the loan, or on a systematic basis over the expected life of the transaction to which they relate, net of rebates granted.
II.6.c. DividendsDividends on available-for-sale equity instruments are recognised in the income statement when the group's right to receive payment is established.
II.6.d. Gains and losses on disposalsGains and losses on disposals of property, plant and equipment, determined by comparing proceeds with the carrying amount, are included in the income statement in other operating income and administrative expenses respectively.
II.7. Financial instrumentsFinancial assets are classified into held-to-maturity investments, available-for-sale financial assets, held for trading, or loans and receivables. The group has not designated any financial instrument as at fair value through profit or loss.
II.7.a. Held-to-maturity investmentsHeld-to-maturity investments are non-derivative financial assets with fixed or determinable payments and fixed maturities that the group's management has the positive intention and ability to hold to maturity. In accordance with IAS 39, the disposal of any more than an insignificant amount of held-to-maturity assets will result in the entire category being tainted and reclassified as available-for-sale for a
period of two years (provided no further tainting occurs). Held-to-maturity assets are recognised in the balance sheet on settlement date at fair value plus any directly related transaction costs. They are subsequently measured at amortised cost using the effective interest method less any impairment losses.
II.7.b. Available-for-sale investmentsAvailable-for-sale investments are those financial assets including debt securities and equity shares which are intended to be held for an indefinite period of time, but which may be sold in response to changes in the group's financial environment.
Available-for-sale investments are recognised in the balance sheet on settlement date at fair value. Gains or losses arising from changes in the fair value of such assets are recognised directly in equity, until the asset is either sold, matures or becomes impaired, at which time the cumulative gain or loss previously recognised in equity is released to the income statement. Interest revenues are recognised using the effective yield method.
The fair value of listed debt securities and equity shares reflects the published price at the balance sheet date. In the case of investments with no listed market price, a valuation technique (e.g. recent transactions between willing and knowledgeable parties, discounted cash flows and market multiples) is applied. Where the fair value of unlisted equity investments cannot be reliably measured, they continue to be valued at cost.
II.7.c. Held for tradingA financial asset is classified as held for trading if it is either:
• acquired for the purpose of selling or repurchasing in the near term;
• part of a portfolio of identified financial instruments that are managed together and for which there is evidence of a recent actual pattern of short-term profit taking;
• a derivative that is not a designated and effective hedging instrument.
Assets held for trading are initially recognised and subsequently measured at fair value. The movements in fair value are recognised in the income statement.
| Notes to the consolidated financial statements ( continued )Euroclear plc Annual Report 2016
52
II.7.d. Loans and receivablesLoans and receivables are non-derivative financial assets with fixed or determinable payments that are not quoted in an active market. They are initially recognised in the balance sheet on settlement date at fair value plus directly related transaction costs, if any, when cash is advanced to the borrowers. They are subsequently measured at amortised cost using the effective interest method.
Long-term loans or receivables that carry no interest are initially recognised at the net present value of all future cash receipts discounted using applicable market interest rates at origination, with the difference between nominal value and net present value recorded in the income statement. The difference between nominal value and net present value is subsequently recognised in the income statement over the life of the investment using the effective interest rate.
II.8. BorrowingsBorrowings are recognised initially at fair value, being the issue proceeds (fair value of consideration received) net of transaction costs incurred. Borrowings are subsequently stated at amortised cost; any difference between proceeds net of transaction costs and the redemption value is recognised in the income statement over the period of the borrowings using the effective interest rate method.
Preference shares, which carry a mandatory coupon, or which are redeemable on a fixed or determinable future date, are classified as financial liabilities and are presented in other borrowed funds. The coupon on these preference shares is recognised in the income statement as interest expense.
II.9. Derivative financial instruments and hedge accountingAll derivative financial instruments are recognised, and subsequently re-measured, at fair value. Derivative fair values are determined from quoted prices in active markets where available. Where there is no active market for an instrument, fair value is derived from prices for the derivative's components using appropriate pricing or valuation models.
Gains and losses arising from changes in fair value of a derivative are recognised as they arise in profit and loss, unless the derivative is part of a qualifying hedge.
Hedge relationships are formally documented at inception. The documentation includes identification of the hedged item and the hedging instrument, and explains the risk that
is being hedged and the way in which effectiveness of the hedge relationship will be assessed at inception and during the period of the hedge. If the hedge is not highly effective in offsetting changes in fair values or cash flows attributable to the hedged risk, consistent with the documented risk management strategy, hedge accounting is discontinued.
The group may enter into three types of hedges: hedges of changes in the fair value of a recognised asset or liability or firm commitment (fair value hedges), hedges of the variability in cash flows from a recognised asset or liability or a forecast transaction (cash flow hedges), and hedges of the net investment in a foreign entity (net investment hedges).
II.9.a. Fair value hedgesChanges in the fair value of derivatives that are designated and which qualify as fair value hedges are recorded in the profit and loss account, together with any changes in the fair value of the hedged asset or liability attributable to the hedged risk. Hedge accounting is discontinued when the hedging instrument does no longer qualify for hedge accounting.
II.9.b. Cash flow hedgesIn the case of a cash flow hedge, the portion of the gain or loss on the hedging instrument that is determined to be an effective hedge should be recognised directly in other comprehensive income and released to profit and loss when the hedged item (for instance the forecasted transaction) affects profit and loss. The ineffective portion of the gain or loss on the hedging instrument is recognised immediately in the profit and loss account.
II.9.c Net investment hedgesA hedge of a net investment in a foreign operation is accounted for similarly to cash flow hedges. The portion of the gain or loss on the hedging instrument that is determined to be an effective hedge is recognised directly in other comprehensive income and released to profit and loss when the foreign operation is partially disposed or sold. The ineffective portion of the gain or loss on the hedging instrument is recognised immediately in the profit and loss account.
II.10. Impairment of financial assetsThe group assesses at each balance sheet date whether there is objective evidence that a financial asset or group of financial assets classified as held-to-maturity, available-for-sale or loans and receivables is impaired. A financial asset or portfolio of
| Notes to the consolidated financial statements ( continued )Euroclear plc Annual Report 2016

53
financial assets is impaired and an impairment loss recognised where there is objective evidence that an event occurring after initial recognition of the asset has adversely affected the amount or timing of future cash flows and this effect can be reliably estimated.
For financial assets carried at amortised cost, the amount of the impairment loss is measured as the difference between the carrying amount of the financial asset and the present value of estimated future cash flows discounted at the financial asset’s original effective interest rate. The carrying amount of the asset is reduced and the amount of the loss is recognised in profit or loss.
Cash flows relating to short-term receivables (less than three months) generally are not discounted. The impairment loss is measured as the difference between the carrying amount of the financial asset and the estimated future cash flows, and is recognised immediately in profit and loss. If, in a subsequent year, the amount of the impairment or bad debt loss decreases and the decrease can be related objectively to an event occurring after the recognition of the original loss, this loss is reversed. The reversal shall not result in a carrying amount of the financial asset that exceeds what the amortised cost would have been had the impairment not been recognised at the date the impairment is reversed.
For financial assets carried at fair value, if there is objective evidence of impairment of an available-for-sale financial asset, the cumulative net loss (difference between amortised acquisition cost and current fair value less any impairment loss previously recognised in profit or loss) that has previously been recognised in equity is removed and recognised in the income statement. If, in a subsequent year, the fair value of an available-for-sale debt instrument increases and the increase can be objectively related to an event occurring after the loss was recognised, the loss may be reversed through profit and loss. Impairments on investments in equity securities cannot be reversed.
II.11. Purchase and resale agreementsSecurities purchased under agreements to resell ('reverse repos') are recorded as loans and advances to other banks or customers, as appropriate. The difference between the sale and repurchase price is treated as interest and accrued over the life of the agreements using the effective interest method.
II.12. Goodwill and intangible assetsII.12.a. GoodwillGoodwill represents the excess of the cost of an acquisition over the fair value of the group's share of the identifiable net tangible and intangible assets of an acquired entity at the date of acquisition. Goodwill is carried at cost less accumulated impairment losses and tested for impairment annually or more frequently where events or changes in circumstances indicate that it might be impaired. For the purpose of impairment testing, goodwill is allocated to cash-generating units, the smallest identifiable group of assets that generates cash inflows that are largely independent of the cash inflows from other assets or groups of assets. If impairment is identified, the carrying value of goodwill is written down to its net recoverable amount. Impairment losses are immediately recognised in profit and loss and are not subsequently reversed.
II.12.b. Computer softwareComputer software licences are capitalised on the basis of the costs incurred to acquire and bring to use the specific software.
Costs associated with the development phase of computer software being developed by, and for use of, the group are capitalised only when the following can be demonstrated:
• technical feasibility;
• intention to complete;
• ability to use or sell the asset;
• generation of probable future economic benefits;
• availability of technical, financial and other resources; and
• reliable measurement of attributable expenditure.
Borrowing costs that are directly attributable to the acquisition or development of software are considered as part of the cost of the software.
The cost of computer software is amortised using the straight-line method over its estimated useful life, normally estimated to be between three and five years.
Impairment tests are performed annually or more frequently if events or circumstances indicate that the asset might be impaired.
| Notes to the consolidated financial statements ( continued )Euroclear plc Annual Report 2016

54
Costs associated with maintaining or upgrading computer software programmes are recognised as an expense as incurred.
II.12.c. Other intangible assetsAt the time of a business combination, part of the cost might be attributed to one or more intangible assets when these are separable or arise from contractual or other legal rights (such as contractual customer relationships), provided a fair value can be measured reliably.
For each asset, the expected useful life is also assessed. Where this is a finite period, the cost of the asset will be amortised using the straight-line method over that period. The estimated useful life is assessed to be indefinite when, following an analysis of all the relevant factors, there is no foreseeable limit to the period over which the asset is expected to generate net cash inflows. In such circumstances, the cost will not be amortised.
The amortisation period and amortisation method for assets with a finite life are reviewed at least at each financial year-end, and changed when necessary.
For assets with an indefinite life, impairment tests are performed annually or more frequently if events or circumstances indicate that the asset might be impaired.
II.13. Property, plant and equipmentProperty, plant and equipment are stated at cost less accumulated depreciation. Where an item of property, plant and equipment comprises major components having different useful lives, these components are accounted for separately.
Borrowing costs that are directly attributable to the acquisition of an asset are considered as part of the cost of the asset.
Subsequent costs are included in the asset's carrying amount or are recognised as a separate asset, as appropriate, only when it is probable that future economic benefits associated with the item will flow to the group and the cost can be measured reliably. All other costs are charged to the income statement during the financial year in which they are incurred.
Depreciation on property, plant and equipment is determined using the straight-line method to allocate the depreciable amount (difference between the cost and the residual value) over its estimated useful life.
The estimated useful life of property, plant and equipment is as follows:
• buildings (including enhancements): 20 to 40 years;
• leasehold improvements: shorter of economic life and period of lease;
• furniture and fixtures: seven years; and
• IT equipment (data processing and communications): between two and five years.
Land is not depreciated.
II.14. LeasesContracts to lease assets are classified as finance leases where they transfer substantially all the risks and rewards of ownership of the asset to the customer. Contracts not deemed to be finance leases are treated as operating leases.
Assets acquired under finance leases are included within fixed assets at the fair value of the leased asset or, if lower, the present value of the minimum lease payments, and depreciated over their economic useful lives taking into account anticipated residual values.
Operating lease income and charges are adjusted where relevant by lease incentives and are recognised on a straight-line basis over the life of the lease.
When an operating lease is terminated before the lease period has expired, any payment required to be made to the lessor, or received from the lessee by way of penalty, is recognised as an expense or income in the period in which termination takes place.
II.15. Cash and cash equivalentsFor the purposes of the statement of cash flows, cash and cash equivalents comprise balances with an original maturity of not more than three months, including cash and non-restricted balances with central banks, and loans and advances to banks and other customers.
II.16. ProvisionsProvisions are recognised where:
• there is a present obligation arising from a past event;
| Notes to the consolidated financial statements ( continued )Euroclear plc Annual Report 2016

55
• there is a probable outflow of resources; and
• the outflow can be estimated reliably.
Provisions are recognised in respect of onerous contracts where the unavoidable costs of the future obligations under the contract exceed the economic benefits expected to be received.
Contingent liabilities are possible obligations whose existence depends on the outcome of one or more uncertain future events not wholly under the control of the group. For those present obligations where the outflows of resources are uncertain, or in the rare cases where these outflows cannot be measured reliably, this will give rise to a contingent liability. Contingent liabilities are not recognised in the financial statements but are disclosed, unless they are remote.
II.17. Employee benefitsII.17.a. Pension obligationsThe group operates a number of post-retirement benefit schemes for its employees, including both defined contribution and defined benefit pension plans.
A defined contribution plan is a pension plan under which the group pays fixed contributions into a separate entity and has no legal or constructive obligation to pay further contributions.
A defined benefit plan is a post-employment benefit plan other than a defined contribution plan.
The liability recognised in the balance sheet in respect of defined benefit plans is the present value of the defined benefit obligation at the balance sheet date less the fair value of plan assets. The defined benefit obligation is calculated annually by independent actuaries using the projected unit credit method. The present value of the defined benefit obligation is determined by discounting the estimated future cash outflows using interest rates of high-quality corporate bonds that are denominated in the currency in which the benefits will be paid, and that have terms to maturity approximating to the terms of the related pension liability.
Actuarial gains and losses arising from experience adjustments and changes in actuarial assumptions are recognised in equity in the period in which they occur.
Past service costs are recognised immediately in the profit and loss account.
The costs of defined contribution plans are charged to the income statement in the year in which they fall due.
II.17.b. Other post-retirement benefitsSome group companies provide post-retirement healthcare benefits to their retirees. The expected costs of these benefits are accrued over the period of employment using an accounting methodology similar to that for defined benefit pension plans. Actuarial gains and losses arising from experience adjustments and changes in actuarial assumptions are charged or credited to equity. These obligations are valued annually by independent qualified actuaries.
II.18. Current and deferred income taxesCurrent tax payable on profits, based on the applicable tax law in each jurisdiction, is recognised as an expense in the year in which profits arise.
Deferred income tax is provided in full, using the liability method, on temporary differences arising between the tax bases of assets and liabilities and their carrying amounts in the consolidated financial statements. Deferred income tax is determined using tax rates (and laws) that have been enacted or substantially enacted in each relevant country by the balance sheet date and are expected to apply when the related deferred income tax asset is realised or the deferred income tax liability is settled.
The principal temporary differences arise from:
• depreciation of tangible fixed assets and the amortisation of intangible assets;
• revaluation of certain financial assets and liabilities, including derivative contracts;
• provisions for pensions and other post-retirement benefits;
• tax losses carried forward; and
• in relation to acquisitions, the difference between the fair values of the net assets acquired and their tax base.
Temporary differences on the initial recognition of assets and liabilities other than those acquired in a business combination
| Notes to the consolidated financial statements ( continued )Euroclear plc Annual Report 2016

are not recognised unless the transaction affects accounting or taxable profit.
Deferred tax assets, including those related to income tax losses available for carry forward, are recognised when it is probable that future taxable profit will be available against which the temporary differences can be used.
Deferred income tax is provided on temporary differences arising from investments in subsidiaries and associates, except where:
• the timing of the reversal of the temporary difference is controlled by the group; and
• it is probable that the difference will not reverse in the foreseeable future.
Current tax assets and liabilities are offset when they arise in the same entity and where there is both a legal right of offset and the intention to settle on a net basis or to realise the asset and settle the liability simultaneously.
Deferred tax related to a transaction or event which is charged or credited directly to equity (e.g. fair value re-measurement of available-for-sale investments and cash flow hedges) is also credited or charged directly to equity and is subsequently recognised in the income statement together with the deferred gain or loss.
Deferred tax assets and liabilities are not discounted.
II.19. DividendsDividends on ordinary shares are recognised in equity and as a liability in the year in which they are approved by the Company's shareholders.
Dividends for the year that are declared after the balance sheet date are not recognised as a liability and are instead disclosed as subsequent events.
III. Critical accouting estimates and judgements
The Euroclear group makes estimates and assumptions that affect the reported amounts of assets and liabilities. These estimates are considered to be important to understand the group’s financial condition, since they require management to make complex and subjective judgements, some of which
may relate to matters that are inherently uncertain. Estimates and judgements are continually evaluated and based on historical experience and other factors, including expectations of future events that are believed to be reasonable under the circumstances.
III.1. Impairment of goodwill and contractual customers’ relationships with an indefinite useful life
The group tests goodwill and contractual customers’ relationships for impairment annually (during the fourth quarter), irrespective of whether there is an indication of impairment. Furthermore, the group remains alert for indicators of impairment throughout the year and conducts a high-level impairment review at each quarter end.
Such impairment reviews are deemed to detect:
• overpayment;
• under-performance compared with expectations; and
• significant changes with an adverse effect on the acquired business. Such changes can stem from, for example, new business parameters (e.g. volatility of stock markets, changes in the volume of securities safekept on behalf of customers, ...) or from changes in market data used to determine the cost of capital of the acquired businesses.
An impairment loss is recognised whenever the recoverable amount of the goodwill is less than its carrying amount (book value). The recoverable amount of an asset is the higher of its net selling price and its value in use, both based on present value calculations.
• Net selling price is the amount obtainable from the sale of an asset in an arm's length transaction between knowledgeable willing parties, less the cost of disposal.
• Value in use is the amount obtainable from the use of an asset until the end of its useful life and from its subsequent disposal. Value in use is calculated as the present value of estimated future cash flows. The value in use calculation may take into account not only the post-acquisition performance of the acquired entity itself, but also the changes in cash flows in other entities in the group that are positively or negatively affected by the acquisition.
56
| Notes to the consolidated financial statements ( continued )Euroclear plc Annual Report 2016

No impairment charge was deemed necessary at the end of 2015 and 2016. See Note XVIII.
Contractual customers' relationships with an indefinite useful life relate to the acquisition of Euroclear Belgium.
III.2. ProvisionsA provision is a liability of uncertain timing or amount. At each reporting year, the necessity to record or adjust provisions is considered based on the latest information available.
Onerous lease provisions are recognised when a decision has been taken to vacate premises leased by the Company and when the space is expected to remain empty or to be sub-let at terms and conditions below those in the Euroclear lease. The provision represents the lower of the cost to breach the contract and the cost of fulfilling it, taking into account the expected benefits that might be received under a sub-lease, providing the entity is actively seeking to sub-let the property.
Provisions for onerous contracts are recognised when the Company has a contract that is onerous. The provision represents the best estimate of the unavoidable costs of the obligations under the contract over the economic benefits expected to be received under it.
Human resources-related provisions are recognised when a decision has been made, a formal plan exists and the main features are known by those affected. The provision represents the best estimate of the full cost to be incurred to implement the plan.
Provisions for dilapidation, or end-of-lease obligations, are recorded when Euroclear is contractually bound to incur such costs and a reliable estimate can be made.
Provisions for litigation are recorded when there are strong indications that costs will be incurred to settle the legal cases concerned and a reliable estimate can be made.
III.3. Defined benefit plansThe present value of the defined benefit plan obligations depends on a number of factors that are determined on an actuarial basis using a number of assumptions. Any changes in these assumptions will impact the carrying amount of the obligations.
The assumptions used in determining the net cost/(income) for the plans include the discount rate at the end of each year. This is the interest rate that should be used to determine the present value of estimated future cash outflows expected to be required to settle the plan obligations. In determining the appropriate discount rate, the group considers the interest rates of high-quality corporate bonds (or mortgage backed bonds in Sweden) that are denominated in the currency in which the benefits will be paid and that have terms to maturity approximating the terms of the related plan liability.
Other key assumptions for plan obligations are based in part on current market conditions.
The major assumptions used are shown in Note XXI.
III.4. Deferred tax assetsDeferred tax assets are recognised to reflect the future tax benefit from unused tax losses or tax credits and other temporary differences. If there is a concern about the relevant entities’ capacity to utilise the tax assets within a reasonable (10-year) period, the assets are impaired, even when there remains a possibility to benefit longer term if sufficient taxable profits arise. The 10-year period is considered reasonable in view of the activities of the Euroclear group entities and the sector in which they operate.
III.5.Impairment of available-for-sale equity investmentsThe group determines that available-for-sale equity investments are impaired when there has been a significant or prolonged decline in the fair value below its cost. This determination of what is significant or prolonged requires judgement. In making this judgement, the group evaluates among other factors, the normal volatility in share price. In addition, impairment may be appropriate when there is evidence of a deterioration in the financial health of the investee, industry and sector performance, changes in technology, and operational and financing cash flows. The group determines that available-for-sale equity investments are impaired when there is a constant decrease of fair value of more than 50% compared with the fair value at inception for a period greater than one year.
Where appropriate, the group has recourse to adequate valuation techniques (e.g. discounted cash flows, market multiples) to estimate the value of non-quoted available-for-sale equity investments, as explained in section IV.
57
| Notes to the consolidated financial statements ( continued )Euroclear plc Annual Report 2016

58
As far as such investments are concerned, no indicator of impairment has been detected. The group, therefore, estimates that their respective values in the accounts of the relevant acquiring company are still justified.
IV. Risk management and the financial risk management environment
This section is unaudited unless specifically stated as audited.
IV.1. Managing business in a risk-controlled environmentIV.1.a. The Enterprise Risk Management frameworkThe Risk Management function has developed a comprehensive Enterprise Risk Management (ERM) framework, taking into account relevant market and regulatory standards, to help Euroclear achieve its strategic objectives. Euroclear’s ERM framework sets the way Euroclear manages its risks:
• effective risk governance is critical to the overall effectiveness of Euroclear’s risk management;
• underpinning the effectiveness of our risk governance framework is the need for open and transparent identification, analysis, sharing of risk information and management of those risks – including root causes, potential impacts and incidents – from across the organisation;
• In achieving our strategic objectives, the risk vs reward balance is crucial. Risk appetite is used as a guide to help Senior Management teams understand how much risk the Board of Euroclear are willing to accept in the pursuit of Euroclear’s objectives. In contrast, risk capacity is the total risk burden each Euroclear company can bear without entering in recovery or resolution. Euroclear’s risk appetite framework facilitates these decisions;
• Euroclear’s risk culture refers to, amongst other things, our attitude towards risk and opportunity, our level of risk awareness, how we take decisions and how responsibility and accountability are defined. Risk culture is thus the embedding of risk management in our day-to-day activities;
• Euroclear’s ERM framework is the methodology designed by the Risk Management function, approved by the Boards of Euroclear and implemented and operated by Senior Management, that helps the company manage risks in a structured way;
• the three lines of defence model we operate within Euroclear facilitates the effective operation of our ERM framework. Each line plays a distinct role providing Senior Management and the Boards with confidence about Euroclear’s likelihood to achieve its key goals through the effective management of risks.
IV.1.b. The three lines of defence• First line of defence
Management is responsible for taking acceptable risks, within the Board’s risk appetite, to meet Euroclear’s strategic objectives. Management uses the ERM framework as support to identify, assess, control and mitigate the risks that it takes and that might impact the achievement of these objectives. Management provides the Boards with:
– information on Euroclear’s risk profile and key developing risks;
– assurance and evidence that risk controls are both adequate and effective; and
– opinion on the likelihood that strategic objectives will be achieved.
• Second line of defence The Risk Management function and the Compliance & Ethics division provide robust independent oversight of management’s risk taking activities. To achieve this mission, the Risk Management function:
– delivers and maintains a leading ERM framework;
– helps foster a healthy risk culture throughout the organisation; and
– provides the Boards and Senior Management with high quality, independent risk advice and guidance.
More specifically, the Risk Management function provides robust, independent oversight of management’s risk-taking activities through:
– establishing, maintaining, facilitating and assessing the effective operation of Euroclear’s ERM framework;
– providing risk and compliance education and training (at all levels) where helpful or necessary;
| Notes to the consolidated financial statements ( continued )Euroclear plc Annual Report 2016

59
– constructively challenging management and advising the Boards on the identification, assessment, mitigation and reporting of risks, including compliance risks;
– independently assessing the adequacy and operating effectiveness of key compliance controls;
– providing the Boards with an independent view of Euroclear’s> risk capacity, appetite (including risk appetite
framework) and risk profile;> key individuals, aggregate and emerging risks, both
at the Group and entity level; and> likely achievement of key goals.
– acting as an independent risk and compliance ‘sounding Board’ (providing advice) for Senior Management and the Boards; and
– leading and sharing risk thinking within the organisation and wider financial market infrastructure sector.
Compliance defines the framework, monitors, tests, reports and escalates to management on controls relating to laws and regulations and advice on remedial actions. Compliance also provides regular trainings across the organisation to increase awareness of compliance risks and ethical issues.
Other support functions like Finance or HR monitor specific controls and escalate to management in case of control defects.
• Third line of defence Internal Audit provides comprehensive assurance based on the highest level of independence and objectivity within the organisation, in order to support the Boards and Senior Management in reaching their objectives. Internal Audit’s scope is unrestricted, and provides assurance on the adequacy and effectiveness of Euroclear’s governance, risk management and internal controls.
Management establishes High Level Control Objectives (HLCOs) to mitigate the risks. These HLCOs set the expectation of the level of internal control in each entity and division of the group. Each of the HLCOs has a senior business management owner who is accountable for ensuring that risks are appropriately mitigated.
IV.1.c. Risk appetite framework & control environmentThe risks that Euroclear faces in the pursuit of its strategic objectives are reflected in the Risk Universe in line with the risk register (which categorises the principal areas of risk Euroclear faces). Euroclear faces six key risk types: operational risk, credit risk, liquidity risk, market risk, business risk, and strategic risk.
For the management of these risks, the Boards and Senior Management have set limits to the amount of risk they are prepared to accept (risk appetite) to achieve Euroclear’s strategic objectives.
Based on the business strategy and the defined Risk Appetite, management defines key business objectives. The key risks relating to these business objectives are assessed regularly, hand-in-hand with the related HLCOs and key control objectives – underpinned by control activities and their evidences.
Risk and control monitoringManagement provides its regular self-assessment regarding the likely achievement of their business objectives and the relating risk and control environment via the Positive Assurance Report (PAR). The PAR is a management tool providing view on the likely achievement of the business objectives, and demonstrates the robustness of the risk and control environment of the area. As such, the PAR monitors the risk and control environment and is at the center of the Internal Control Systems (ICS) monitoring.
The first line of defence performs an annual Risk & Control Self-Assessments (RCSAs) facilitated by the Risk Management function. The RCSA is not a stand-alone exercise; it does build on the PAR assessments and feeds into that. These self-assessments and the complementary Horizontal Self-Assessments (HSAs) are key components of the ERM framework. The RCSAs and HSAs aim to achieve the following objectives:
• build an accurate and consistent assessment of ICS, i.e. to have an appropriate understanding of the risk profile of the business comparative to our risk appetite;
• increase risk awareness and promote an ongoing assessment of risks and controls by business managers;
• identify evolving and new risks by bringing together experts and less experienced people;
| Notes to the consolidated financial statements ( continued )Euroclear plc Annual Report 2016
60
• obtain quantification of the risks faced by Euroclear at ‘risk event level’, service level and entity level;
• ensure that individual risks in the ICS are identified proactively and that they are addressed adequately; and
• are a key input in assessing the ICS overall adequacy and effectiveness.
Risk Management is reviewing and challenging where needed and gives its independent view on the effectiveness of the controls to manage current and emerging risks.
The third line (Internal Audit) provides the highest level of independent assurance to Senior Management and Euroclear entity boards on the adequacy and effectiveness of governance, risk management and internal controls.
All (I)CSDs of the Euroclear group have annual ISAE 3402 report audited by external audit firm which provides assurance on the controls in place in the Euroclear entities. In addition, our (I)CSDs update annually the Disclosure Framework for Securities Settlement Systems, which is one of the requirements for compliance with CPMI-IOSCO’s Principles for Financial Market Infrastructures.
Risk reportingRisk Management in its independent risk oversight role of management’s risk taking activity:
• Risk Management regularly consults several tools, such as the Risk Universe, the Risk Tracking Database and the outcome of risk assessments to form its independent opinion on the risk profile of the company. Outcome of the risk assessments are reported as relevant to the appropriate governance body of Euroclear (Group Risk Committee, Management Committee, Credit and Assets and Liabilities Committee or Board Risk Committee).
• Risk Management regularly (at least quarterly) reports formally to Senior Management and the Board Risk Committees on the risk profile of the entity in relation to the risk appetite. In addition, the Chief Risk Officer (CRO) reports his view on the group risk profile, summarising the key risks at Group level, to the Euroclear SA / NV Management Committee and the Euroclear SA / NV Board Risk Committee.
• Risk Management escalates to the appropriate level material risk issues when, in its opinion, either a new risk emerges or mitigating actions for an existing risk have been insufficient in scope and / or time.
IV.2. Operational risk management
All Euroclear entities face operational risks in their daily activities, caused by either inadequate or failed internal processes, human errors, system failures or external events. In line with Basel recommendations, Euroclear categorises its operational risks and loss events in seven risk event types:
• employment practices and workplace safety;
• clients, products & business practices;
• execution, delivery & process management;
• internal fraud;
• external fraud and cyber;
• business disruption & systems failure;
• damage to or loss of physical (or other) assets.
Euroclear uses Key Risk Indicators (KRIs), Key Performance Indicators (KPIs) and regular self-assessment to effectively monitor operational risk. Risk Management also ensures that the first line consistently logs and reports all incidents, with or without financial impact, and escalates them at the appropriate management level as necessary.
Euroclear (anonymously) shares its internal loss data with the Operational Riskdata Exchange Association (ORX) to access their database of high quality operational risk loss data. Euroclear uses this data for its capital modelling and to understand and manage operational risk adequately.
Information Security & Business ContinuityA major component of our operational risk management is Information Security (IS) and Business Continuity Management, which are fully integrated in our ERM framework and aligned with recognised international standards.
| Notes to the consolidated financial statements ( continued )Euroclear plc Annual Report 2016
61
Euroclear’s business continuity arrangements include identification of all critical functions to ensure continuity of required services. To this end, appropriate business continuity plans are prepared. In addition, Euroclear’s business continuity programme includes a testing strategy to enable each entity to respond to unforeseen events. Euroclear performs departmental / divisional as well as entity and group wide business continuity plan tests to ensure continued readiness to respond to crisis situation. Euroclear also participates in market wide business continuity tests. For example:
• IT disaster recovery testing: switch between data centres;
• crisis management exercises;
• office recovery testing: switch to a recovery office and dual sites testing;
• testing of agreed arrangements with critical suppliers and external parties covering for example:
• crisis communication
• reciprocal plans with other Financial Market Infrastructures (e.g. National Central Banks, other (I)CSDs, Central Counterparts)
• participation to market wide exercises where and when they are organised;
• evacuation exercises of the buildings.
In addition, each division/department is responsible for producing, maintaining and implemented its 'site-switch' procedure to ensure the continuity of Euroclear Bank’s critical functions.
IV.3. Euroclear group financial risk management
The framework put in place at Euroclear ensures that financial risks (i.e. credit, liquidity and market risks) are tightly controlled. The core of this framework is formed by the Corporate Risk Management Board Policy and underlying policy handbooks.
IV.3.1. Credit riskCredit risk is defined as the risk of loss arising from the default or failure of a participant or counterparty to meet its financial obligations to Euroclear.
Euroclear Bank Euroclear Bank has not experienced any credit losses in its history, not even during periods of market turmoil. This is largely due to the very short duration of credit exposures. In addition, Euroclear Bank applies very strict collateralisation rules. More than 99% of its credit exposures are collateralised, mostly with very high-quality collateral.
In addition, Euroclear Bank also has treasury exposures resulting from clients’ end-of-day cash positions. These balances are usually placed in the market with high-quality counterparties, preferably by using reverse repurchase agreements (reverse repos) or in very high quality securities with short-term maturities. The risks are limited by their short duration, as well as policy limits.
Euroclear CSDsAs their transactions settle in central bank money, the Euroclear CSDs have no direct cash relationship with their clients. Consequently, they cannot extend loans or credit facilities to their clients. The Euroclear CSDs can potentially face a certain level of credit risk arising from the non-payment of fees by their clients, albeit for limited amounts considering both the frequency of the billing and their relatively broad customer base. Therefore, each CSD of the group is required by its home regulator to hold enough liquidity to cover such risks.
Finally, the Euroclear CSDs are also exposed to the credit risk related to the reinvestment of their cash surplus with their bank counterparties. The credit risk is mitigated through a strict investment policy limiting the allowed counterparties and type of instruments.
IV.3.1.a. Maximum credit exposureThe table overleaf (audited) summarises the maximum exposure to credit risk (net of any impairment losses recognised in accordance with IAS 39), which for the purpose of this annex is defined as the net carrying amount as reported in the financial statements (therefore measured on an end-of-day basis), without taking into account any collateral held or other credit enhancement attached.
| Notes to the consolidated financial statements ( continued )Euroclear plc Annual Report 2016

62
Financial assets ( €’000 ) Notes 2015 2016
At 31 December
– Cash and balances with central banks 3,399,247 5,639,674
– Loans and advances 14,631,273 12,758,291
– Available-for-sale financial assets XIV 2,440,860 2,840,759
– Financial assets held for trading XV 7,044 40,153
– Derivatives used for hedging XVI 1,538 568
Total financial assets 20,479,962 21,279,445
Securities lending indemnifications XXIV 18,576,063 28,298,635
Total 39,056,025 49,578,080
At 31 December 2016, the secured exposure amounted to €39,288,690,000 (2015:€33,451,118,000), while the unsecured exposure amounted to €10,289,390,000 (2015: €5,588,892,000). Secured exposure includes €10,179,992,000 of reverse repo transactions (2015: €13,913,443,000).
The credit quality of balances with central banks and the portfolio of loans and advances can be assessed by reference to the internal rating system adopted by the group (audited table).
Rating ( in % ) 2015 2016
At 31 December
– Eaaa 19% 31%
– Eaa 25% 28%
– Ea 45% 33%
– Ebbb+ and Ebbb 10% 7%
– Ebbb– and below 1% 1%
Total 100% 100%
The internal rating 'Eaa' shown above sums up the ratings 'Eaa-', 'Eaa' and 'Eaa+' of Euroclear Bank’s internal ratings scale. Accordingly, the internal rating 'Ea' sums up the ratings 'Ea-', 'Ea' and 'Ea+' of the internal ratings scale.
The table overleaf (audited) presents an analysis of the available-for-sale financial assets (excluding equity shares) by rating agency designation based on Standard & Poor's ratings or their equivalent (Moody’s P1 includes Standard & Poor’s A1+ and A1 for short term investments):
| Notes to the consolidated financial statements ( continued )Euroclear plc Annual Report 2016
Rating ( in % ) 2015 2016
At 31 December
– AAA 7% 8%
– P1 62% 57%
– AA+ 10% 4%
– AA 21% 19%
– AA- – 12%
Total 100% 100%

IV.3.2. Liquidity risk Liquidity risk is the risk of loss arising from Euroclear being unable to settle a cash or securities obligation when due. Liquidity risks does not imply that Euroclear is insolvent since it may be able to settle the required debit obligations at some unspecified time thereafter.
IV.3.2.a. Liquidity risk at Euroclear BankEuroclear Bank provides liquidity to offer efficient settlement and custody services. It ensures timely cross-border settlement with domestic markets, supports new issues and custody activities, and enables clients to transfer sales and income proceeds in a timely manner. Euroclear Bank's liquidity risk is largely intra-day and transactional.
Euroclear Bank's overnight settlement process, enabling clients to settle transactions in a wide range of currencies
within a single timeframe, efficiently recycles and minimises liquidity needs, as clients only have to fund the resulting net debit position.
Euroclear Bank may end up with residual cash positions at the end of the day. On a daily basis, Euroclear Bank is typically long cash, which it invests mostly on a very short term basis to match the volatility of clients' settlement and money transfer activities.
IV.3.2.b. Liquidity risk appetite Euroclear Bank's liquidity risk appetite is very low, given the criticality of intra-day liquidity for the efficient delivery of its settlement and custody services. Euroclear Bank has, therefore, adopted a strong risk management framework to anticipate, monitor and manage the intra-day liquidity flows to ensure the quality of its services. Liquidity risk is further
63
IV.3.1.b. Credit risk mitigationEuroclear Bank aims at mitigating most of the short-term credit exposure on its clients, preferably by relying on securities or cash collateral held and pledged within the clients’ accounts in Euroclear Bank. Frequent monitoring shows that more than 99% of the collateral pledged in the Euroclear System has investment grade quality. As clients’ credit facilities are multi-purpose and multi-currency, clients can use the collateral pledged to Euroclear Bank to guarantee all the obligations they have with Euroclear Bank, irrespective of the nature of the exposure and the original currency.
In order to accurately determine the value of the collateral it takes, Euroclear Bank has developed a dynamic internal collateral valuation model taking into account market, credit, country and liquidity risks. Haircuts are computed at least once a day for each security, reflecting the latest market
risk factors and conditions. The collateral valuation model is back-tested and stress tested regularly. The results show that the collateral valuation model has provided continually adequate valuations, even during periods of high volatility for the markets.
Euroclear Bank’s secured exposure relates to overdrafts or fixed-term advances granted to clients, guarantees issued to securities lenders in the context of the securities lending and borrowing and GC Access programmes, and reverse repos.
IV.3.1.c. Concentration riskConcentration limits are set to ensure that the group does not take too large an exposure on too few clients or counterparties. Under EU and Belgian banking regulations, large individual exposures have to remain below 25% of their own funds (Tier 1 + Tier 2 less deductions).
Geographical concentration of financial assets and liabilities ( €’000 ) Europe Americas Rest of the world Total
At 31 December 2016
Total financial assets 19,105,817 939,385 1,234,243 21,279,445
Total financial liabilites 8,531,175 3,409,518 6,572,817 18,513,510
At 31 December 2015
Total financial assets 18,864,630 246,541 1,368,791 20,479,962
Total financial liabilites 7,103,359 3,642,205 7,087,210 17,832,774
| Notes to the consolidated financial statements ( continued )Euroclear plc Annual Report 2016
64
mitigated by Euroclear Bank's strict client admission policy and the continuous monitoring of its clients, and by the fact that credit is secured and short-term.
IV.3.2.c. Funding Euroclear Bank’s settlement system allows for an efficient recycling of liquidity. Although Euroclear Bank settles transactions amounting to over €1,700 billion each day (2016 average), it only extends less than 5% of the settled transactions in secured intra-day credit to its clients (thanks to netted back-to-back transactions and to an efficient securities lending and borrowing programme). Since Euroclear Bank’s daily payment receipts typically match its payment obligations, additional liquidity is only needed to smoothen or accelerate the payment process and to ensure the timely execution of time critical payments throughout the day.
To support its daily payment activity, Euroclear Bank relies on a large network of highly rated cash correspondents and has a direct access to TARGET2 system for euro payments. To raise liquidity, Euroclear Bank can also use its investment book, funded by equity and retained earnings. The investment book must be invested with the objective of capital and liquidity preservation, meaning in euro-denominated sovereign, supranational or agency debt instruments rated AA- or above and ESCB-eligible. Furthermore, Euroclear Bank has a broad access to the inter-bank market and has contingency liquidity sources in place for the major currencies.
The adequacy of Euroclear Bank’s liquidity capacity is assessed and approved quarterly by the Credit and Assets and Liabilities Committee (CALCO). It also monitors, on a monthly basis, the trend of liquidity risks that Euroclear Bank faces through liquidity key risk indicators, allowing for instance to identify changes in clients’ cash management behaviour that may affect Euroclear Bank’s liquidity.
IV.3.2.d. Liquidity stress testing Euroclear Bank regularly performs idiosyncratic and market-wide liquidity stress tests to assess potential liquidity strains and to ensure adequate access to enough liquidity sources to fund any shortfalls. For the group CSDs and Euroclear SA / NV, liquidity stress testing is also performed to ensure, where applicable, compliance with local regulatory liquidity obligations as well as adequate funding.
Example of liquidity stress tests are:
• default of the top two clients (at family level);
• operational failure of a key cash correspondent;
• a sudden drop of participant balances.
• cut of cash correspondent lines;
• default of participants and knock on effects.
In addition, Euroclear Bank has to comply with regulatory liquidity stress tests such as the Liquidity Coverage Ratio (LCR). The aim of the LCR is that credit institutions hold sufficient liquid assets to withstand the excess of liquidity outflows over inflows that are expected to accumulate over a 30-day stressed period. The National Bank of Belgium (NBB) is requiring full LCR compliance (100%) as from 1 October 2015. Euroclear complies with this requirement.
IV.3.2.e. Liquidity contingency plan Euroclear Bank maintains an appropriate liquidity contingency plan to ensure the business continuity of its core settlement and custody services. The plan documents the relevant operational procedures and ensures access to (contingency) liquidity in the event of an operational or financial crisis. On top of its own capital and access to regular market funding, Euroclear Bank has negotiated committed liquidity lines and can call upon a €1,150 million syndicated back-stop facility and a €180 million bilateral standby facility. The contingency plan and the availability of contingency liquidity are regularly tested and subject to stress testing. Finally, to cover its short-term liquidity needs resulting from the default of a client, Euroclear Bank has agreements in place allowing Euroclear Bank to appropriate the client pledged collateral (immediate transfer of ownership). To generate liquidity, this appropriated collateral is then re-used with liquidity providers or pledged with the NBB, pending full liquidation.
IV.3.2.f. Liquidity risks in Euroclear SA / NV and the CSDs Investments of cash belonging to Euroclear SA / NV and the CSDs aim at minimising liquidity risk for these entities:
• stable cash positions linked to regulatory liquidity requirements, for entities where such requirements apply, should be invested on a rollover basis; and
• surplus cash investments, which includes the working cash needs of these entities, should always be cash flow driven, which means that the amount and period of the
| Notes to the consolidated financial statements ( continued )Euroclear plc Annual Report 2016
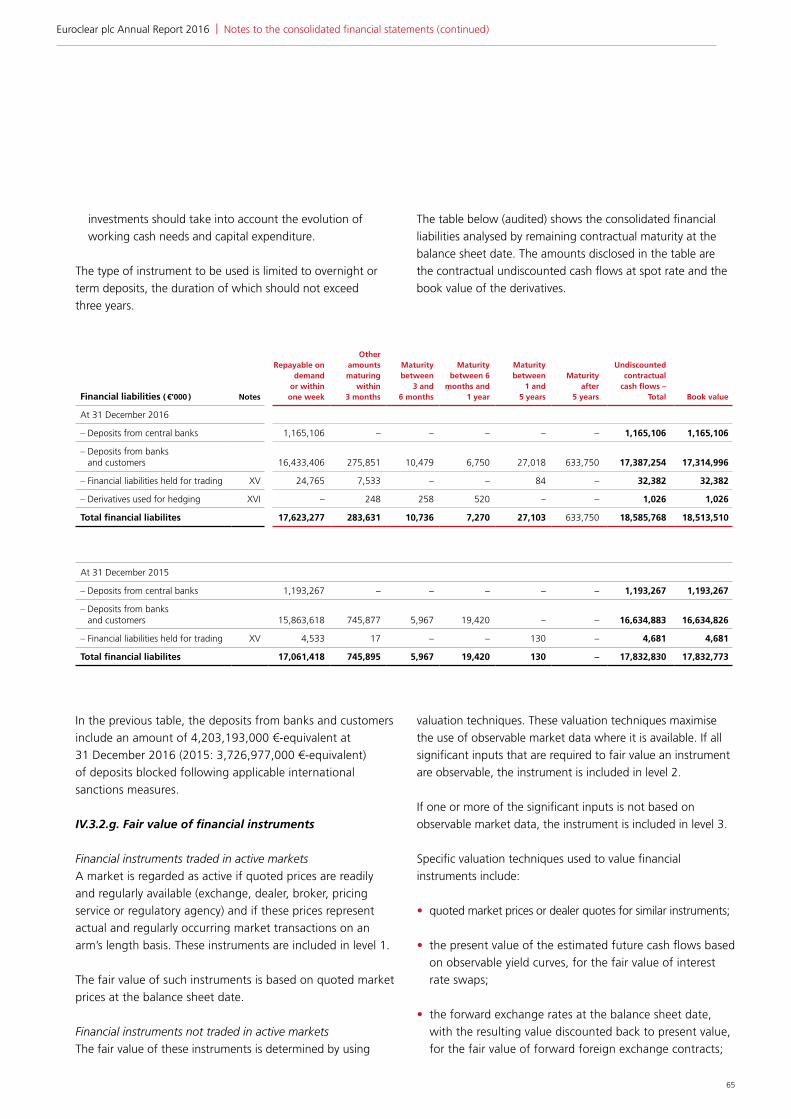
65
investments should take into account the evolution of working cash needs and capital expenditure.
The type of instrument to be used is limited to overnight or term deposits, the duration of which should not exceed three years.
The table below (audited) shows the consolidated financial liabilities analysed by remaining contractual maturity at the balance sheet date. The amounts disclosed in the table are the contractual undiscounted cash flows at spot rate and the book value of the derivatives.
Financial liabilities ( €’000 ) Notes
Repayable ondemand
or within one week
Other amountsmaturing
within3 months
Maturitybetween
3 and 6 months
Maturitybetween 6
months and 1 year
Maturitybetween
1 and 5 years
Maturityafter
5 years
Undiscountedcontractual
cash flows – Total Book value
At 31 December 2016
– Deposits from central banks 1,165,106 – – – – – 1,165,106 1,165,106
– Deposits from banks and customers 16,433,406 275,851 10,479 6,750 27,018 633,750 17,387,254 17,314,996
– Financial liabilities held for trading XV 24,765 7,533 – – 84 – 32,382 32,382
– Derivatives used for hedging XVI – 248 258 520 – – 1,026 1,026
Total financial liabilites 17,623,277 283,631 10,736 7,270 27,103 633,750 18,585,768 18,513,510
At 31 December 2015
– Deposits from central banks 1,193,267 – – – – – 1,193,267 1,193,267
– Deposits from banks and customers 15,863,618 745,877 5,967 19,420 – – 16,634,883 16,634,826
– Financial liabilities held for trading XV 4,533 17 – – 130 – 4,681 4,681
Total financial liabilites 17,061,418 745,895 5,967 19,420 130 – 17,832,830 17,832,773
| Notes to the consolidated financial statements ( continued )Euroclear plc Annual Report 2016
In the previous table, the deposits from banks and customers include an amount of 4,203,193,000 €-equivalent at 31 December 2016 (2015: 3,726,977,000 €-equivalent) of deposits blocked following applicable international sanctions measures.
IV.3.2.g. Fair value of financial instruments
Financial instruments traded in active marketsA market is regarded as active if quoted prices are readily and regularly available (exchange, dealer, broker, pricing service or regulatory agency) and if these prices represent actual and regularly occurring market transactions on an arm’s length basis. These instruments are included in level 1.
The fair value of such instruments is based on quoted market prices at the balance sheet date.
Financial instruments not traded in active marketsThe fair value of these instruments is determined by using
valuation techniques. These valuation techniques maximise the use of observable market data where it is available. If all significant inputs that are required to fair value an instrument are observable, the instrument is included in level 2.
If one or more of the significant inputs is not based on observable market data, the instrument is included in level 3.
Specific valuation techniques used to value financial instruments include:
• quoted market prices or dealer quotes for similar instruments;
• the present value of the estimated future cash flows based on observable yield curves, for the fair value of interest rate swaps;
• the forward exchange rates at the balance sheet date, with the resulting value discounted back to present value, for the fair value of forward foreign exchange contracts;
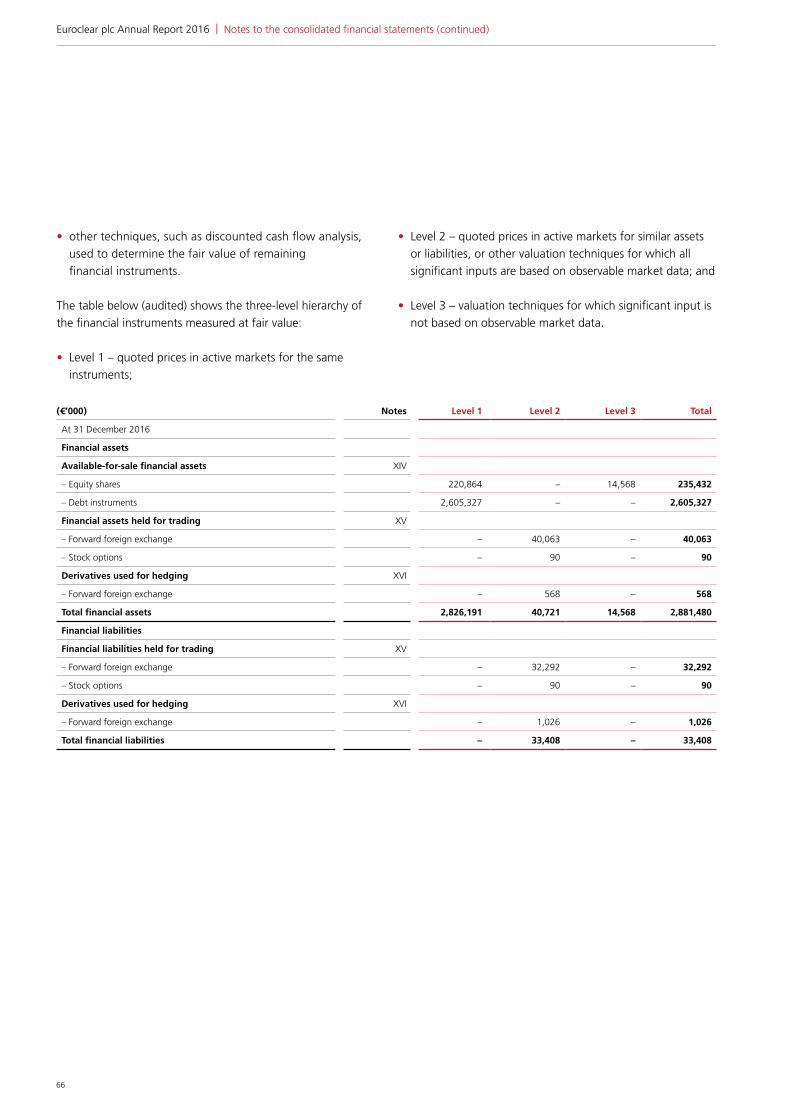
66
• other techniques, such as discounted cash flow analysis, used to determine the fair value of remaining financial instruments.
The table below (audited) shows the three-level hierarchy of the financial instruments measured at fair value:
• Level 1 – quoted prices in active markets for the same instruments;
• Level 2 – quoted prices in active markets for similar assets or liabilities, or other valuation techniques for which all significant inputs are based on observable market data; and
• Level 3 – valuation techniques for which significant input is not based on observable market data.
( €’000 ) Notes Level 1 Level 2 Level 3 Total
At 31 December 2016
Financial assets
Available-for-sale financial assets XIV
– Equity shares 220,864 – 14,568 235,432
– Debt instruments 2,605,327 – – 2,605,327
Financial assets held for trading XV
– Forward foreign exchange – 40,063 – 40,063
– Stock options – 90 – 90
Derivatives used for hedging XVI
– Forward foreign exchange – 568 – 568
Total financial assets 2,826,191 40,721 14,568 2,881,480
Financial liabilities
Financial liabilities held for trading XV
– Forward foreign exchange – 32,292 – 32,292
– Stock options – 90 – 90
Derivatives used for hedging XVI
– Forward foreign exchange – 1,026 – 1,026
Total financial liabilities – 33,408 – 33,408
| Notes to the consolidated financial statements ( continued )Euroclear plc Annual Report 2016

( €’000 ) Notes Level 1 Level 2 Level 3 Total
At 31 December 2015
Financial assets
Available–for–sale financial assets XIV
– Equity shares 267,487 – 14,435 281,922
– Debt instruments 2,158,938 – – 2,158,938
Financial assets held for trading XV
– Forward foreign exchange – 6,897 – 6,897
– Stock options 147 – – 147
Derivatives used for hedging XVI
– Forward foreign exchange – 1,538 – 1,538
Total financial assets 2,426,572 8,435 14,435 2,449,442
Financial liabilities
Financial liabilities held for trading XV
– Forward foreign exchange – 4,533 – 4,533
– Stock options 147 – – 147
Total financial liabilities 147 4,533 – 4,680
67
Financial instruments classified in level 3 relate solely to minority long-term participating interests of Euroclear Bank:
• SWIFT equity shares are re-measured each time there is a re-balancing exercise according to SWIFT’s Articles of Association (i.e. every three years), at that time an indication about equity share value is provided.
• Monte Titoli equity shares have no quotation nor price indication. The valuation is based on market multiples. More specifically, the multiple used is the median P/E of
a peer group (companies in the same industry enjoying strong ratings) for a three-year period, to smoothen somewhat market volatility in our assessment.
• Acadiasoft equity shares bought in 2015 have no quotation nor price indication. The actual valuation is the acquisition cost.
The table below shows the reconciliation of the level 3 fair value measurements:
| Notes to the consolidated financial statements ( continued )Euroclear plc Annual Report 2016
Financial assets ( €’000 ) Notes
At 31 December
2015
Transfer in / ( out ) of level 3
Fair value adjustment released in
profit or loss
Fair value adjustment recognised
in equity( Disposals ) / acquisitions
At 31 December
2016
Available-for-sale financial assets
XIV
– Equity shares 14,435 – – 133 – 14,568
Total financial assets 14,435 – – 133 – 14,568
Financial assets ( €’000 ) Notes
At 31 December
2014
Transfer in / ( out ) of level 3
Fair value adjustment released in
profit or loss
Fair value adjustment recognised
in equity( Disposals ) / acquisitions
At 31 December
2015
Available-for-sale financial assets
XIV
– Equity shares 9,782 – (21) 110 4,564 14,435
Total financial assets 9,782 – (21) 110 4,564 14,435
68
IV.3.3. Market riskMarket risk is the risk of losses in (on or off balance-sheet) positions arising from adverse movements in market prices. Market risk arises from possible changes in foreign exchange rates, interest rates, equity or commodity prices.
IV.3.3.a. Market risk in Euroclear
Euroclear BankThe majority of market risk in the group is concentrated at Euroclear Bank. As part of the Market Risk Policy Handbook, an adequate risk framework has been put in place to measure, monitor and control the interest rate and foreign exchange risk supported by Euroclear Bank. Value-at-Risk (VaR) methodologies are used to measure interest rate and currency risk. The Management Committee of Euroclear Bank sets VaR limits for all currencies combined, which are monitored daily.
By policy, Euroclear Bank's core equity (shareholders’ equity plus retained earnings) is invested in debt instruments rated AA- or higher. The duration of these assets is limited to five years and is currently around one year.
Euroclear SA / NV and the Euroclear CSDsInterest rate risk exists only to a limited extent in the CSDs and in Euroclear SA / NV. Indeed, the CSDs do not operate commercial cash accounts but invest their cash positions in accordance with regulatory liquidity requirements. The duration of the investments cannot exceed three years, and the types of instruments to be used are limited to straight overnight or term deposits.
Foreign exchange risk is also very limited in the CSDs and in Euroclear SA / NV. To avoid the potential foreign exchange risk that could arise from the investment of their surplus cash, these investments can only be made in their local currency, meaning in EUR for entities whose functional currency is EUR, in GBP for the entities located in the United Kingdom, and in SEK for the Swedish entities. The most significant source of foreign exchange risk stems from the potential change in net asset values of Euroclear SA / NV’s non-euro shareholdings (for example Euroclear UK & Ireland and Euroclear Sweden).
IV.3.3.a.1. Interest rate riskEuroclear typically has net long cash positions and its earnings therefore are sensitive to future changes in interest rates.
The table below shows the interest rate sensitivity of Euroclear’s Banking Book positions. The figures relate to Euroclear SA / NV consolidated, as communicated to the National Bank of Belgium in the framework of standardised reporting under Pillar 2 of Basel. The figures for Euroclear plc are not expected to diverge materially from the content of this table. Assets and liabilities held in the Banking Book are predominantly denominated in euro, and they are expressed at market value for the purpose of this disclosure. The economic value of the Banking Book is computed by discounting the future cash flows for assets and liabilities present in this book.
The sensitivity of the economic value of the Banking Book to interest rate shocks is presented in the first column of the table below. The 10-year contingent convertible loan amounting to €200,000,000 granted by Euroclear Investments SA to Euroclear Bank to reinforce its capital base in a recoverable situation, in the context of the Recovery and Resolution plan, is included in the interest rate risk of the Banking Book 2016 economic value calculation. There is currently a maturity mismatch between the 10-year loan and the cash investment.
The remainder of the table illustrates to which extent the net interest income of Euroclear Bank is sensitive to interest rate movements, compared to the amount earned in 2016. For the purpose of this disclosure, we aggregate the future earnings in euro, however, for the interest rate sensitivity we distinguish between sterling, US dollars and euros (all other currencies are converted and included in euros). The 2015 table is however limited to Euroclear material currencies (sterling, US dollars, euros, Australian dollars and Russian rubles), this difference results from a change in methodology requirement from the NBB applicable as from 2016.
| Notes to the consolidated financial statements ( continued )Euroclear plc Annual Report 2016

Interest rate increase / ( decrease ), in basis points ( €’000 )Economic value
of banking bookInterest result Effective 2016
Income sensitivity interest result Expected 2017
300 1,775,220 451,605
200 1,772,062 337,037
100 1,767,231 221,061
– 1,760,522 123,059 103,638
( 100 ) 1,751,705 50,571
( 200 ) 1,740,523 12,979
( 300 ) 1,726,686 3,860
Interest rate increase / ( decrease ), in basis points ( €’000 )Economic value
of banking bookInterest result Effective 2015
Income sensitivity interest result Expected 2016
300 1,718,238 379,653
200 1,735,908 282,707
100 1,753,823 184,554
– 1,771,990 71,023 98,866
( 100 ) 1,790,416 49,577
( 200 ) 1,809,108 34,346
( 300 ) 1,828,075 32,165
The table overleaf (audited) reflects the interest rate risk profile of assets and liabilities at 31 December, based on the earlier of maturity date and interest rate resetting date.
69
| Notes to the consolidated financial statements ( continued )Euroclear plc Annual Report 2016

( €’000 )
Repayable on demand
or within one week
Other amounts maturing
within 3 months
Maturity between
3 and 6 months
Maturity between
6 months and 1 year
Maturity between
1 and 5 years
Maturity after
5 yearsNon–interest
bearing Total
At 31 December 2016
Assets
– Cash and balances with central banks
5,639,464 – – – – – 210 5,639,674
– Loans and advances 9,852,589 1,166,066 1,684,441 8,446 35,988 – 10,761 12,758,291
– Available–for–sale financial assets – 1,429,197 453,444 267,291 449,664 – 241,163 2,840,759
– Financial assets held for trading 1,931 37,376 762 – 84 – – 40,153
– Derivatives used for hedging – 136 141 290 – – – 568
– Other assets – – – – – – 1,596,947 1,596,947
Total assets 15,493,984 2,632,775 2,138,788 276,027 485,736 – 1,849,082 22,876,392
Liabilities
– Deposits from central banks 1,165,106 – – – – – – 1,165,106
– Deposits from banks and customers 16,432,814 276,466 10,500 – – 594,113 1,103 17,314,996
– Financial liabilities held for trading 24,765 7,533 – – 84 – – 32,382
– Derivatives used for hedging – 248 258 521 – – – 1,026
– Other liabilities – – – – – – 802,496 802,496
Shareholders’ equity – – – – – – 3,560,386 3,560,386
Total liabilities and shareholders’ equity
17,622,685 284,246 10,758 521 84 594,113 4,363,984 22,876,392
Total interest sensitivity gap ( 2,128,701 ) 2,348,529 2,128,031 275,506 485,652 ( 594,113 ) ( 2,514,902 ) –
Cumulative gap ( 2,128,701 ) 219,827 2,347,858 2,623,364 3,109,016 2,514,903 – –
70
| Notes to the consolidated financial statements ( continued )Euroclear plc Annual Report 2016

71
( €’000 )
Repayable on demand
or within one week
Other amounts maturing
within 3 months
Maturity between
3 and 6 months
Maturity between
6 months and 1 year
Maturity between
1 and 5 years
Maturity after
5 yearsNon–interest
bearing Total
At 31 December 2015
Assets
– Cash and balances with central banks
3,398,944 – – – – – 303 3,399,247
– Loans and advances 10,355,767 1,561,115 2,519,521 98,807 85,271 – 10,792 14,631,273
– Available–for–sale financial assets 395,017 625,147 414,174 212,991 505,009 – 288,522 2,440,860
– Financial assets held for trading 6,864 50 – – 130 – – 7,044
– Derivatives used for hedging – 399 389 750 – – – 1,538
– Other assets – – – – – – 1,504,577 1,504,577
Total assets 14,156,592 2,186,711 2,934,084 312,548 590,410 – 1,804,194 21,984,539
Liabilities
– Deposits from central banks 1,193,265 – – – – – 2 1,193,267
– Deposits from banks and customers 16,404,502 214,294 15,500 – – – 530 16,634,826
– Financial liabilities held for trading 4,534 17 – – 130 – – 4,681
– Derivatives used for hedging – – – – – – – –
– Other liabilities – – – – – – 676,234 676,234
Shareholders’ equity – – – – – – 3,475,531 3,475,531
Total liabilities and shareholders’ equity
17,602,301 214,311 15,500 – 130 – 4,152,297 21,984,539
Total interest sensitivity gap ( 3,445,709 ) 1,972,400 2,918,584 312,548 590,280 – ( 2,348,103 ) –
Cumulative gap ( 3,445,709 ) ( 1,473,309 ) 1,445,275 1,757,823 2,348,103 2,348,103 – –
| Notes to the consolidated financial statements ( continued )Euroclear plc Annual Report 2016

72
Interest sensitivity gapA negative interest rate sensitivity gap exists when more liabilities than assets re-price or mature during a given period. A negative gap position tends to benefit net interest income in a declining interest rate environment and vice versa.
Key componentsThe following table (audited) analyses the nature of cash and balances with central banks:
( €’000 ) 2015 2016
At 31 December
Cas h in hand 34 27
Loans and advances 3,399,188 5,639,647
Monetary reserve 25 –
Total cash and balances with central banks 3,399,247 5,639,674
Euroclear Bank and other group entities had deposited €5,639,278,000 (2015: €3,398,842,000) of surplus funds with central banks. Amongst other reasons Euroclear Bank, like other banks, is required to comply with average monetary reserve requirements determined by the European Central Bank (ECB). Throughout each period set by the ECB,
Euroclear Bank deposits varying amounts in its monetary reserve account at the NBB in order to meet the average requirement for that period.
The following table (audited) analyses the nature of loans and advances:
The fair value of the loans and advances with an initial maturity greater than one year at 31 December 2016 was €74,571,000 (2015: €257,739,000)
The following table (audited) analyses the nature of deposits from banks and clients:
On 7 December 2016, Euroclear Investments SA issued a senior, unsecured and unsubordinated Eurobond on the Euronext Amsterdam stock exchange for an amount up to €600,000,000 (10 year maturity - fixed coupon). The issue is deemed to enhance the group funding flexibility over the next 10-year period, maintain a suitable level of investment capacity in the group and strengthen the recovery capacity
of operating entities. The issue was realised at a re-offer price slightly below par (€598,536,000), leading to a re-offer yield of 1.151% or 2.6 bps above the annual interest rate. A combined management and underwriting commission of 0.55% was levied on the nominal amount of the securities. The fees (€3,300,000), together with other transactions costs (€1,219,000), are amortised on an actuarial basis.
( €’000 ) 2015 2016
Surplus funds 13,658,837 11,940,667
Loans and advances 972,436 817,624
Total 14,631,273 12,758,291
( €’000 ) 2015 2016
Deposits 15,775,739 15,861,808
Other borrowings 859,087 1,453,188
– of which long term funding – 594,313
Total 16,634,826 17,314,996
| Notes to the consolidated financial statements ( continued )Euroclear plc Annual Report 2016
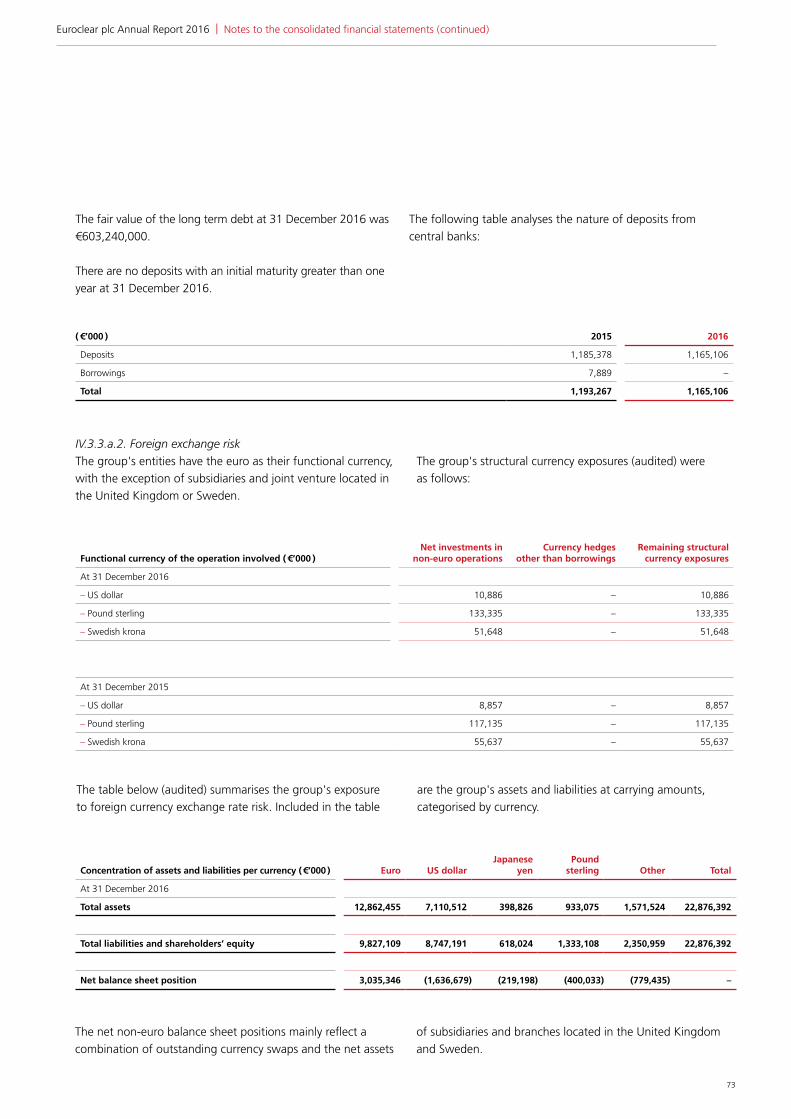
73
( €’000 ) 2015 2016
Deposits 1,185,378 1,165,106
Borrowings 7,889 –
Total 1,193,267 1,165,106
The fair value of the long term debt at 31 December 2016 was €603,240,000.
There are no deposits with an initial maturity greater than one year at 31 December 2016.
The following table analyses the nature of deposits from central banks:
IV.3.3.a.2. Foreign exchange riskThe group's entities have the euro as their functional currency, with the exception of subsidiaries and joint venture located in the United Kingdom or Sweden.
The group's structural currency exposures (audited) were as follows:
Functional currency of the operation involved ( €’000 )Net investments in
non-euro operationsCurrency hedges
other than borrowingsRemaining structural
currency exposures
At 31 December 2016
– US dollar 10,886 – 10,886
– Pound sterling 133,335 – 133,335
– Swedish krona 51,648 – 51,648
At 31 December 2015
– US dollar 8,857 – 8,857
– Pound sterling 117,135 – 117,135
– Swedish krona 55,637 – 55,637
Concentration of assets and liabilities per currency ( €’000 ) Euro US dollarJapanese
yenPound
sterling Other Total
At 31 December 2016
Total assets 12,862,455 7,110,512 398,826 933,075 1,571,524 22,876,392
Total liabilities and shareholders’ equity 9,827,109 8,747,191 618,024 1,333,108 2,350,959 22,876,392
Net balance sheet position 3,035,346 (1,636,679) (219,198) (400,033) (779,435) –
The table below (audited) summarises the group's exposure to foreign currency exchange rate risk. Included in the table
are the group's assets and liabilities at carrying amounts, categorised by currency.
The net non-euro balance sheet positions mainly reflect a combination of outstanding currency swaps and the net assets
of subsidiaries and branches located in the United Kingdom and Sweden.
| Notes to the consolidated financial statements ( continued )Euroclear plc Annual Report 2016

74
Concentration of assets and liabilities per currency ( €’000 ) Euro US dollarJapanese
yenPound
sterling Other Total
At 31 December 2015
Total assets 9,853,333 8,326,547 437,433 1,536,125 1,831,101 21,984,539
Total liabilities and shareholders’ equity 9,367,335 8,458,501 830,802 1,563,883 1,764,018 21,984,539
Net balance sheet position 485,998 (131,954) (393,369) (27,758) 67,083 –
IV.3.3.b. Market risk appetite for Euroclear Bank Market transactions are carried out at the discretion of Euroclear Bank, which accepts market risk only within its low risk appetite. Euroclear Bank complies with internal market limits, such as Value-at-Risk (VaR).
Euroclear Bank adheres to the following principles relating to the management of market risk. Euroclear Bank does not engage in any activity that is not considered as part of its normal business or a consequence of its clients’ activity, and as such will not engage in trading (even if, under IFRS, certain transactions in derivatives do not qualify as hedges and are therefore recognised under trading activities). The activities and instruments in which Euroclear Bank can engage must be in line with its low-risk profile. Euroclear Bank is not significantly exposed to equity risk or commodity risk. A prudent investment strategy is applied in order to preserve the core equity of Euroclear Bank. In particular, the assets of the investment book can only be invested in highly rated and liquid debt instruments (with the exception of intra-company loans) and an appropriate hedging strategy may be applied so as to protect future earnings against adverse market conditions.
IV.3.3.c. Market risk mitigation (hedging)Euroclear Bank has engaged in a series of market derivatives to hedge the forex risk exposure resulting from future income streams, with the aim of ensuring that the financial results are not adversely affected by market evolutions (‘predictability of
future revenues’). Such transactions are classified as cash flow hedges.
It is compliant with market expectations that Euroclear Bank conducts its business prudently, as a single purpose bank.
IV.3.3.d. Market risk measurement The market risk relative to the management of the available for sale portfolio is measured using a VaR methodology. The VaR for a portfolio is the maximum loss over a determined time horizon at a given confidence level (99%). The VaR model assumes a holding period, until positions can be closed, of one day. The market parameters are derived from the volatility and correlation observed from historical daily changes. Euroclear Bank has to comply with a global VaR limit, as well as VaR limits by book. The market risk exposure that Euroclear Bank takes is segregated in the following books: Investment Book (all securities purchased by Euroclear Bank with the proceeds of its own equity); Treasury Book (assets, liabilities and commitments resulting from the activity of Euroclear Bank Clients); and Hedging Book (market transactions that are conducted to manage the risk exposure resulting from future income streams). The VaR model is back tested on a regular basis. Given its low market risk appetite and the fact that Euroclear Bank does not engage in trading activities, the VaR figures are low.
( €’000 ) 2015 average 2015 min 2015 max 2016 average 2016 min 2016 max
Investment book IR risk 372 105 1,183 476 203 2,529
Treasury book IR risk 26 5 125 26 5 118
Hedging book 678 117 1,588 445 48 1,786
Aggregate VaR ( Hedging & Investment book )
796 181 1,575 662 225 2,537
| Notes to the consolidated financial statements ( continued )Euroclear plc Annual Report 2016

75
IV.4. Capital managementIV.4.a. Capital measurement and allocationThe internal view on Euroclear Bank’s capital needs is based on economic capital models, which estimate the amount of capital that Euroclear needs to have to protect itself from unexpected losses resulting from the risks it faces in its various activities. This view is complemented by what-if loss scenarios. These models and stress scenarios are continuously kept up-to-date and regularly validated by an independent party. Euroclear Bank is therefore confident that the resulting capital requirements are adequate to support the risks that it faces. The capital requirement model covers operational and credit risks. In addition, Euroclear Bank maintains models that estimate the uncertainty on the profit and loss over a one year horizon due to movements in market risk and business risk factors. This conservative approach to capital, combined with Euroclear's strong risk management and effective controls, has helped Euroclear Bank retain high credit ratings in times of market stress. Euroclear Bank is assigned a AA+ credit rating by Fitch Ratings and a AA credit rating by Standard & Poor’s (S&P).
The NBB is the main supervisor of Euroclear Bank, the lead regulator for Euroclear SA / NV and, for consolidated capital adequacy purposes only, Euroclear Plc. In addition, individual Euroclear CSDs are regulated by their own local supervisors, which set and monitor compliance with their capital adequacy and liquidity requirements. All Euroclear CSDs and Euroclear Bank will be subject as of 2017 to the capital requirements stipulated under CSDR.
The Capital Requirement Regulation (CRR) requires Euroclear Bank, Euroclear Bank consolidated, Euroclear SA consolidated and Euroclear plc consolidated, to maintain at all times:
• a ratio of total capital to risk-weighted assets that cannot fall under a threshold of 8%;
• a ratio of Tier 1 capital to risk-weighted assets that must exceed a threshold of 6%;
• a ratio of common equity Tier1 capital exceeding 4.5%; and
• a capital conservation buffer of 2.5% in common equity (not applicable to Euroclear plc consolidated).
Euroclear Bank and Euroclear SA / NV have, together with seven other banks or banking groups in Belgium, been identified in 2015 by the NBB as domestically systemically important institutions (D-SII) under Belgian banking law and CRD IV. The NBB applies therefore as of 2016, a common equity Tier 1 capital ratio surcharge of 0.75% to Euroclear Bank standalone, Euroclear Bank and Euroclear SA consolidated, in three tranches of 0.25%.
Euroclear determines risk-weighted assets for credit, operational risk and market risk.
For credit risk, Euroclear uses the Foundation Internal Ratings Based Approach (FIRBA). Risk-weighted assets take into consideration balance sheet assets and off-balance-sheet exposures that may give rise to credit risk, as calculated for both Euroclear Bank and the group on a consolidated basis. Collateral and other eligible guarantees are taken into account appropriately.
With respect to operational risk, Euroclear has received approval to use the Advanced Measurement Approach (AMA) for the calculation of Pillar 1 capital requirements since Q1 2008. Euroclear uses a hybrid approach at all consolidated levels above Euroclear Bank, by combining the AMA for Euroclear Bank with a Standardised or Basic Indicator Approach for the other group’s entities.
As Euroclear Bank is a limited purpose bank and does not have a trading book, the market risk that Euroclear Bank incurs is very limited. For market risk, Euroclear uses the Standardised Approach to cover the Foreign Exchange risk.
In addition to the capital ratios, Euroclear Bank will have to comply with the leverage ratio as of 2018. Current requirement is 3%. Euroclear’s current levels of the leverage ratio are already well above this regulatory requirement and are disclosed in the Pillar3 publication.
The table below (audited) sets out the group’s Tier 1 and total capital, which both comfortably exceed the regulatory requirements.
| Notes to the consolidated financial statements ( continued )Euroclear plc Annual Report 2016

76
( €’000 ) 2015 2016
Risk-weighted assets( 1 ) 5,824,449 6,658,788
Capital requirement 465,956 532,703
– Credit risk 145,565 172,113
– Market risk 26,314 28,027
– Operational risk 294,077 332,563
Capital base( 2 ) 2,329,993 2,438,220
– Tier 1 2,329,993 2,438,220
– Tier 2 – –
Solvency ratio
– Tier 1 40.0% 36.6%
– Total 40.0% 36.6%
( 1 ) Risk-weighted assets (unaudited) represent the total capital requirement multiplied by a factor of 12.5. This means that the risk-weighted
assets do not only relate to credit and market risk, but also comprise the gross-up of the capital requirements related to operational risks. For
Euroclear, the latter are the main source of capital consumption.( 2 ) Capital base is highly comparable to the shareholders’ equity presented in the Statement of financial positions. Differences are due to
deductions required by CRD IV regulation, mainly goodwill and intangible assets, current year proposed dividend, limits on investments in
financial sector entities, cash-flow hedging reserve and provision shortfall for expected losses.
IV.4.b. Regulatory capital position
V. Segment analysis
The Euroclear SA / NV Management Committee receives internal reports for Euroclear Bank, Euroclear SA / NV, Euroclear UK & Ireland, the ESES CSDs and Nordics.
The reportable business segments are as follows:
• Euroclear Bank (including its Hong Kong branch and its Polish branch) is an International Central Securities Depository (ICSD);
• Euroclear SA / NV (including its branches in Amsterdam, London and Paris) is the provider of software development and non-operational support services to the (l)CSDs;
• Euroclear UK & Ireland is the Central Securities Depository (CSD) subsidiary located in the United Kingdom. This entity also runs an investment fund order routing business;
• the ESES segment includes the group’s CSD subsidiaries located in Belgium, France and the Netherlands; and
• the Nordics segment includes two companies: Euroclear Sweden (CSD in Sweden) and Euroclear Finland (CSD in Finland).
Information reported within ‘Other’ relates to the parent companies, a reinsurance company, a Special Purpose Vehicle (SPV) established in connection with the issuance of subordinated debt qualifying as capital for Euroclear Bank (liquidated in December 2015), Euroclear Market Solutions Limited and two property development companies whose properties are leased almost entirely to Euroclear SA / NV. None of these qualified as a reportable segment in 2016 or 2015.
The risks and returns associated with Euroclear Bank’s ICSD services do not vary geographically and, accordingly, is considered as one geographical segment. The activities of all other segments are within Europe.
No single customer generated 10% or more of the group’s revenues.
| Notes to the consolidated financial statements ( continued )Euroclear plc Annual Report 2016

77
Transactions between the companies are on normal commercial terms and conditions. Recharges of software development costs and support services are based on formal agreements between the entities concerned.
Segment assets and liabilities comprise all third-party assets and liabilities.
2016
( €’000 ) NotesEuroclear
BankEuroclear
SA / NV
Euroclear UK &
IrelandESES CSDs Nordics Other Eliminations Group
Net interest income VI 122,614 341 431 411 ( 459 ) ( 398 ) – 122,940
Net fee and commission income VII 590,599 ( 10 ) 129,208 170,618 94,284 5 ( 29 ) 984,675
Intra-group recharges 1,010 505,856 15 391 475 1,113 ( 508,860 ) –
Other income 42,400 87,351 134 3,607 235 260,843 (340,237) 54,333
Operating income 756,623 593,538 129,788 175,027 94,535 261,563 (849,126) 1,161,948
Staff costs X ( 124,312 ) ( 254,894 ) ( 9,007 ) ( 19,139 ) ( 18,208 ) ( 963 ) – ( 426,523 )
Other direct costs X ( 159,970 ) (261,152) ( 5,575 ) (10,054 ) ( 20,717 ) ( 6,954 ) 145,479 ( 318,943 )
Depreciation and amortisation
XVII, XVIII
( 1,730 ) ( 25,335 ) ( 48 ) ( 803 ) ( 2,809 ) ( 2,274 ) – ( 32,999 )
Royalty fees ( 27,275 ) – ( 492 ) ( 621 ) ( 333 ) – 28,721 –
Group non-operational and Administrative support services
( 307,674 ) ( 1,447 ) ( 54,601 ) ( 124,169 ) ( 17,642 ) ( 3,328 ) 508,861 –
Share of result in joint venture – ( 7,069 ) – – – – – ( 7,069 )
Operating profit / ( loss ) before impairment and taxation
135,662 43,641 60,065 20,241 34,826 248,044 ( 166,065 ) 376,414
Impairment XI 322 ( 2,572 ) ( 198 ) (209 ) ( 340 ) – – ( 2,997 )
Operating profit / ( loss ) before taxation
135,984 41,069 59,867 20,032 34,486 248,044 ( 166,065 ) 373,417
Taxation XII ( 39,902 ) 6,144 ( 11,883 ) ( 5,936 ) ( 7,345 ) ( 16,303 ) – ( 75,225 )
Profit / ( loss ) for the year 96,082 47,213 47,984 14,096 27,141 231,741 ( 166,065 ) 298,192
External revenues 1,203,639 12,995 137,695 163,619 91,884 1,818 – 1,611,650
Revenues from other segments 17,661 581,583 963 27,242 4,654 129,599 ( 761,702 ) –
Total revenues 1,221,300 594,578 138,658 190,861 96,538 131,417 ( 761,702 ) 1,611,650
Segment assets 20,118,552 1,363,106 146,150 207,909 374,270 666,405 – 22,876,392
Segment liabilities 18,360,468 221,731 12,159 45,452 58,412 617,784 – 19,316,006
| Notes to the consolidated financial statements ( continued )Euroclear plc Annual Report 2016

78
2015
( €’000 ) NotesEuroclear
BankEuroclear
SA / NV
Euroclear UK &
IrelandESES CSDs Nordics Other Eliminations Group
Net interest income VI 96,936 680 984 796 ( 195 ) ( 315 ) – 98,886
Net fee and commission income VII 569,125 ( 8 ) 136,419 187,650 89,613 5 ( 32 ) 982,772
Intra-group recharges 512 488,264 122 437 745 1,154 ( 491,234 ) –
Other income 33,852 260,933 ( 7 ) 3,504 9 249,445 ( 499,173 ) 48,563
Operating income 700,425 749,869 137,518 192,387 90,172 250,289 ( 990,439 ) 1,130,221
Staff costs X ( 124,965 ) ( 258,044 ) ( 8,537 ) ( 19,125 ) ( 17,179 ) ( 991 ) – ( 428,841 )
Other direct costs X ( 28,653 ) ( 209,529 ) ( 4,839 ) ( 7,193 ) ( 22,107 ) ( 7,962 ) 14,572 ( 265,711 )
Depreciation and amortisation
XVII, XVIII
( 1,409 ) ( 21,057 ) ( 45 ) ( 872 ) ( 2,856 ) ( 2,277 ) – ( 28,516 )
Royalty fees ( 25,678 ) – ( 510 ) ( 575 ) ( 294 ) – 27,057 –
Group non-operational and Administrative support services
( 290,940 ) ( 1,774 ) ( 68,575 ) ( 110,855 ) ( 14,509 ) ( 4,581 ) 491,234 –
Share of result in joint venture – ( 6,520 ) – – – – – ( 6,520 )
Operating profit / ( loss ) before impairment and taxation
228,780 252,945 55,012 53,767 33,227 234,478 ( 457,576 ) 400,633
Impairment XI ( 288 ) ( 162 ) ( 18 ) ( 103 ) ( 186 ) – – ( 757 )
Operating profit / ( loss ) before taxation
228,492 252,783 54,994 53,664 33,041 234,478 ( 457,576 ) 399,876
Taxation XII ( 68,796 ) 2,360 ( 11,268 ) ( 17,849 ) ( 7,072 ) ( 4,325 ) – ( 106,950 )
Profit / ( loss ) for the year 159,696 255,143 43,726 35,815 25,969 230,153 ( 457,576 ) 292,926
External revenues 1,125,595 16,426 143,134 171,198 87,952 983 – 1,545,288
Revenues from other segments 11,153 734,532 1,133 26,116 4,039 252,075 ( 1,029,048 ) –
Total revenues 1,136,748 750,958 144,267 197,314 91,991 253,058 ( 1,029,048 ) 1,545,288
Segment assets 19,743,344 1,412,663 133,048 199,408 349,869 146,207 – 21,984,539
Segment liabilities 18,231,087 177,237 9,829 44,930 36,640 9,285 – 18,509,008
The €166,065,000 remaining in the Eliminations column relates to dividends received from companies within the group (2015: €457,576,000).
| Notes to the consolidated financial statements ( continued )Euroclear plc Annual Report 2016

79
Euroclear Bank has exercised in June 2015 its optional redemption rights on all of its Upper Tier 2 note with Euroclear Finance 2.
( €’000 ) Notes 2015 2016
Interest income on financial instruments
– Cash and balances with central banks 1,792 4,065
– Loans and advances 127,108 160,091
Interest income on defined benefit plans XX 9 13
Total interest income 128,909 164,169
Interest expense on financial instruments
– Deposits from central banks ( 4,081 ) ( 10,161 )
– Deposits from banks and customers ( 17,895 ) ( 21,072 )
– Available-for-sale financial assets ( 4,203 ) ( 8,234 )
– Subordinated liabilities ( 1,878 ) –
Interest expense on defined benefit plans XX ( 1,966 ) ( 1,762 )
Total interest expense ( 30,023 ) ( 41,229 )
Net interest income 98,886 122,940
VI. Net interest income
| Notes to the consolidated financial statements ( continued )Euroclear plc Annual Report 2016
( €’000 ) 2015 2016
Fee and commission income
Clearing and settlement 396,320 405,714
Safekeeping 624,275 643,551
Other 347,221 343,883
Total fee and commission income 1,367,816 1,393,148
Fee and commission expense
Clearing and settlement ( 72,906 ) ( 80,444 )
Safekeeping ( 178,365 ) ( 184,352 )
Other ( 133,773 ) ( 143,677 )
Total fee and commission expense ( 385,044 ) ( 408,473 )
Net fee and commission income 982,772 984,675
VII. Net fee and commission income

80
VIII. Realised gains / ( losses ) on investment securities
( €’000 ) 2015 2016
Available-for-sale financial assets – fair value adjustment recognised in equity and released in profit or loss during
the period – equity shares20 2,516
Total 20 2,516
IX. Net gains / ( losses ) on financial assets and liabilities held for trading
The net gains on foreign exchange trading relate to treasury swaps initiated by Euroclear Bank in order to convert balances in non-core currencies into euro or US dollars for
re-investment purposes. Under IFRS, these results may not be included within net interest income.
Realised gains relate to the sale of the ICE equity shares during the year.
( €’000 ) 2015 2016
Foreign exchange trading 25,871 27,947
Total 25,871 27,947
Other fee and commission income mainly relates to communication fees and the recovery of out-of-pocket expenses incurred on behalf of clients, issuer services fees earned by Euroclear Finland and Euroclear Sweden, and revenue earned by Euroclear UK & Ireland for collecting Stamp Duty Reserve Tax on behalf of HM Revenue & Customs in
the United Kingdom and Stamp Duty on behalf of the Irish Revenue Commissioners.
Other fee and commission expense mainly relates to fees incurred on behalf of clients as well as other fees for collateral leasing and back-stop facilities.
| Notes to the consolidated financial statements ( continued )Euroclear plc Annual Report 2016

81
( €’000 ) Notes 2015 2016
Staff costs
– Wages and salaries 306,821 309,427
– Social security costs 74,076 70,739
– Defined benefit plans XX 19,537 18,536
– Defined contribution plans 6,670 6,122
– Other staff costs 22,225 21,699
Auditor’s remuneration 2,305 2,569
Consultants’ fees 150,943 168,501
Occupancy 39,721 38,344
Maintenance and repairs 37,070 40,346
Travel and training 21,756 17,530
Communications 6,931 8,024
Rent and non capitalised purchases 13,572 13,255
Other taxes 5,630 6,260
Depreciation and amortisation XVII, XVIII 28,516 32,999
Other administrative expenses 26,408 27,602
Provisions for liabilities and charges XIX (1,396) 36,748
Capitalised expenses (37,717) (40,236)
Total 723,068 778,465
The average number of persons employed by the group during the year was 3,944 (2015: 3,863).
X. Administrative expenses
| Notes to the consolidated financial statements ( continued )Euroclear plc Annual Report 2016
( €’000 ) 2015 2016
Fees payable to the Company’s auditor and its associates for the audit of the parent companyand consolidated financial statements
151 118
Fees payable to the Company’s auditor and its associates for other services:
– The audit of the Company’s subsidiaries 1,295 1,292
– Audit related assurance services 135 64
– Taxation advisory services 9 5
– Other assurance services ( including ISAE 3402 ) 697 962
– Other non-audit services 18 128
Fees included in the consolidated financial statements 2,305 2,569
Fees in respect of investments accounted for using the equity method 56 47
Fees in respect of audit of pension plan 6 6
Total 2,367 2,622
Euroclear ensures that the independence of the external auditor is preserved through a specific policy adopted by the Board and agreed by PwC. This policy adheres to the highest
standards of independence. The engagement of the external auditor for non-core services is subject to specific controls, monitored by the Board’s Audit Committee.
The auditors’ remuneration for Euroclear plc and its subsidiary undertakings was as follows:
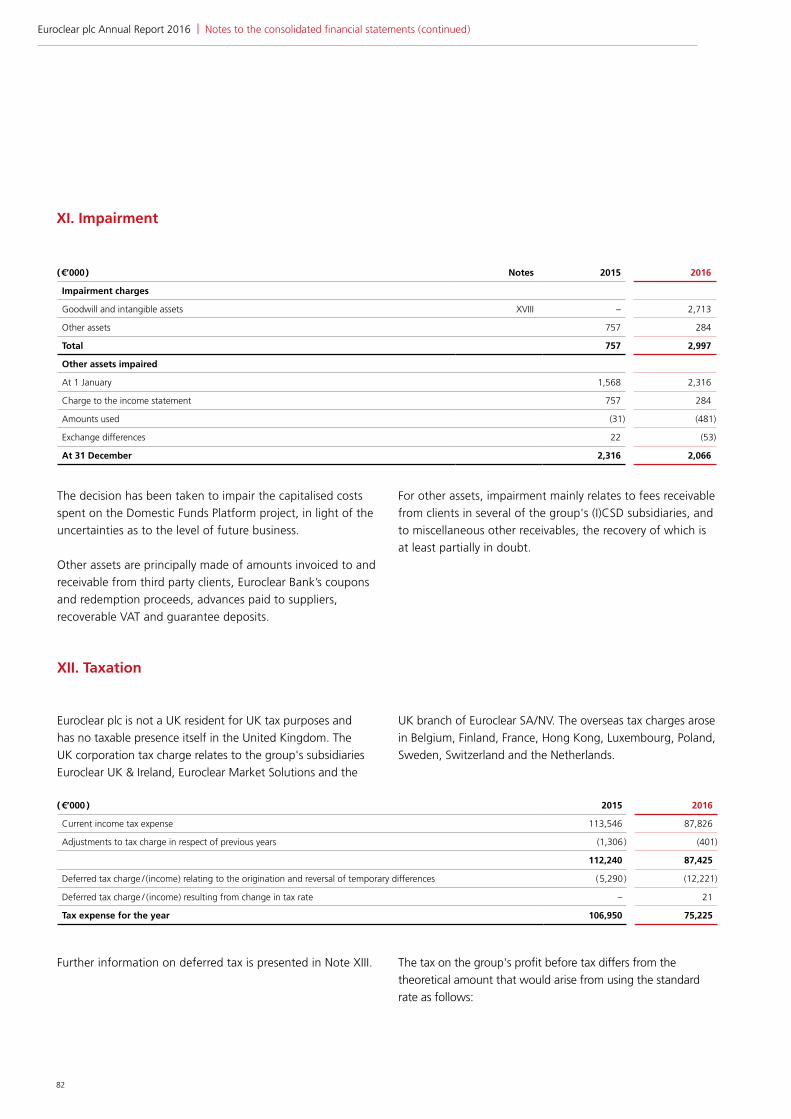
82
( €’000 ) Notes 2015 2016
Impairment charges
Goodwill and intangible assets XVIII – 2,713
Other assets 757 284
Total 757 2,997
Other assets impaired
At 1 January 1,568 2,316
Charge to the income statement 757 284
Amounts used (31) (481)
Exchange differences 22 (53)
At 31 December 2,316 2,066
XI. Impairment
The decision has been taken to impair the capitalised costs spent on the Domestic Funds Platform project, in light of the uncertainties as to the level of future business.
Other assets are principally made of amounts invoiced to and receivable from third party clients, Euroclear Bank’s coupons and redemption proceeds, advances paid to suppliers, recoverable VAT and guarantee deposits.
For other assets, impairment mainly relates to fees receivable from clients in several of the group's (I)CSD subsidiaries, and to miscellaneous other receivables, the recovery of which is at least partially in doubt.
| Notes to the consolidated financial statements ( continued )Euroclear plc Annual Report 2016
( €’000 ) 2015 2016
Current income tax expense 113,546 87,826
Adjustments to tax charge in respect of previous years (1,306 ) (401)
112,240 87,425
Deferred tax charge / ( income ) relating to the origination and reversal of temporary differences ( 5,290 ) (12,221)
Deferred tax charge / ( income ) resulting from change in tax rate – 21
Tax expense for the year 106,950 75,225
Further information on deferred tax is presented in Note XIII. The tax on the group's profit before tax differs from the theoretical amount that would arise from using the standard rate as follows:
Euroclear plc is not a UK resident for UK tax purposes and has no taxable presence itself in the United Kingdom. The UK corporation tax charge relates to the group's subsidiaries Euroclear UK & Ireland, Euroclear Market Solutions and the
UK branch of Euroclear SA / NV. The overseas tax charges arose in Belgium, Finland, France, Hong Kong, Luxembourg, Poland, Sweden, Switzerland and the Netherlands.
XII. Taxation

83
( €’000 ) 2015 2016
Operating profit / ( loss ) before tax 399,876 373,417
At standard rate of tax ( 1 ) 106,967 75,244
Effects of:
– Notional interest on capital ( 8,029 ) (5,821)
– Expenses not deductible for tax purposes 8,711 5,598
– Elimination of intercompany dividends 324 (2,129)
– Income not subject to tax ( 481 ) (6,570)
– Disposal of subsidiaries 174 –
– Share of net tax ( profit ) / loss of investments accounted for using equity method 2,216 2,403
– Different rates in the companies in the group 9,256 6,880
– Change of tax rate on deferred taxation – 21
– Utilisation / reversals of past derecognised deferred tax assets ( 10,882 ) –
– Adjustments to tax charge in respect of previous years ( 1,306 ) (401)
Tax expense for the year 106,950 75,225
( 1 ) A rate of 20.15% (2015: 26.75% before reversal of impairment) representing the effective tax rate for the group, has been used as the
standard rate.
Since 1 January 2006, the group entities in Belgium benefit from a tax reduction linked to a notional interest on capital.
The current income tax asset of €11,836,000 at 31 December 2016 (2015: €13,689,000) represents the total of amounts recoverable from the tax authorities relating to over-payments of income tax pre-payments, prior year adjustments and R&D tax credit.
The net tax effect linked to the intercompany dividends eliminated for consolidation purposes have been considered
separately in order to adequately reflect the impact of this item of reconciliation on the tax expense. The expenses not deductible for tax purposes include the other tax effects of consolidation adjustments not subject to deferred tax.
The year-to-year variation of the effect of the different rates applicable to the companies within the group is explained by a combination of factors: increase of the above group’s effective tax rate, higher income not subject to tax and changes in the taxable basis of certain sizeable entities.
| Notes to the consolidated financial statements ( continued )Euroclear plc Annual Report 2016

84
( €’000 ) TotalMaturity on or before
31 December 2017Maturity after
31 December 2017
At 31 December 2016
Assets
Defined benefit plans 39,294 – 39,294
Available-for-sale securities ( 417 ) 50 ( 467 )
Cash flow hedging reserve 156 156 –
Financial assets / ( liabilities ) held for trading 196 – 196
Software development 96 17 79
Property, plant and equipment 666 21 645
Tax loss carried forward 96,430 3,843 92,587
Other temporary differences 17,728 16,806 922
Total 154,149 20,893 133,256
Liabilities
Defined benefit plans (2,682) – ( 2,682)
Other temporary differences 5,620 1,082 4,538
Insurance reserve of Euroclear Re SA 3,037 – 3,037
Total 5,975 1,082 4,893
XIII. Deferred taxation
The details of deferred taxation are as follows:
| Notes to the consolidated financial statements ( continued )Euroclear plc Annual Report 2016
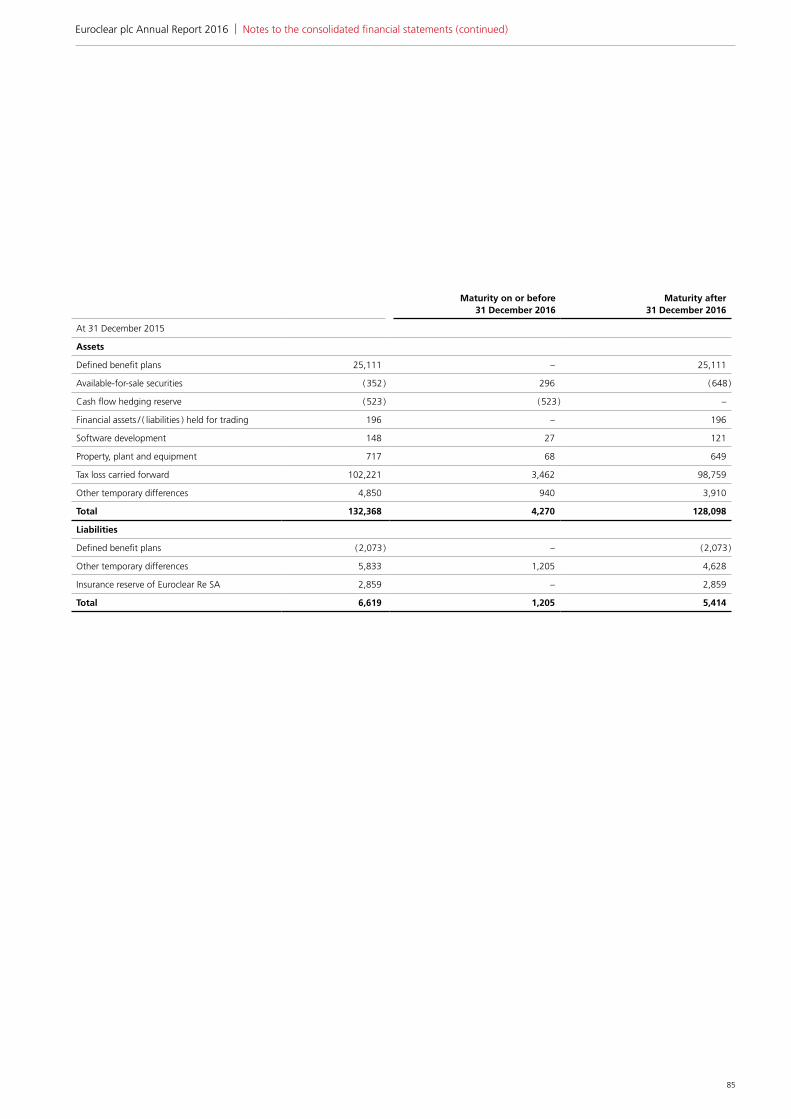
85
Maturity on or before 31 December 2016
Maturity after 31 December 2016
At 31 December 2015
Assets
Defined benefit plans 25,111 – 25,111
Available-for-sale securities ( 352 ) 296 ( 648 )
Cash flow hedging reserve ( 523 ) ( 523 ) –
Financial assets / ( liabilities ) held for trading 196 – 196
Software development 148 27 121
Property, plant and equipment 717 68 649
Tax loss carried forward 102,221 3,462 98,759
Other temporary differences 4,850 940 3,910
Total 132,368 4,270 128,098
Liabilities
Defined benefit plans ( 2,073 ) – ( 2,073 )
Other temporary differences 5,833 1,205 4,628
Insurance reserve of Euroclear Re SA 2,859 – 2,859
Total 6,619 1,205 5,414
| Notes to the consolidated financial statements ( continued )Euroclear plc Annual Report 2016
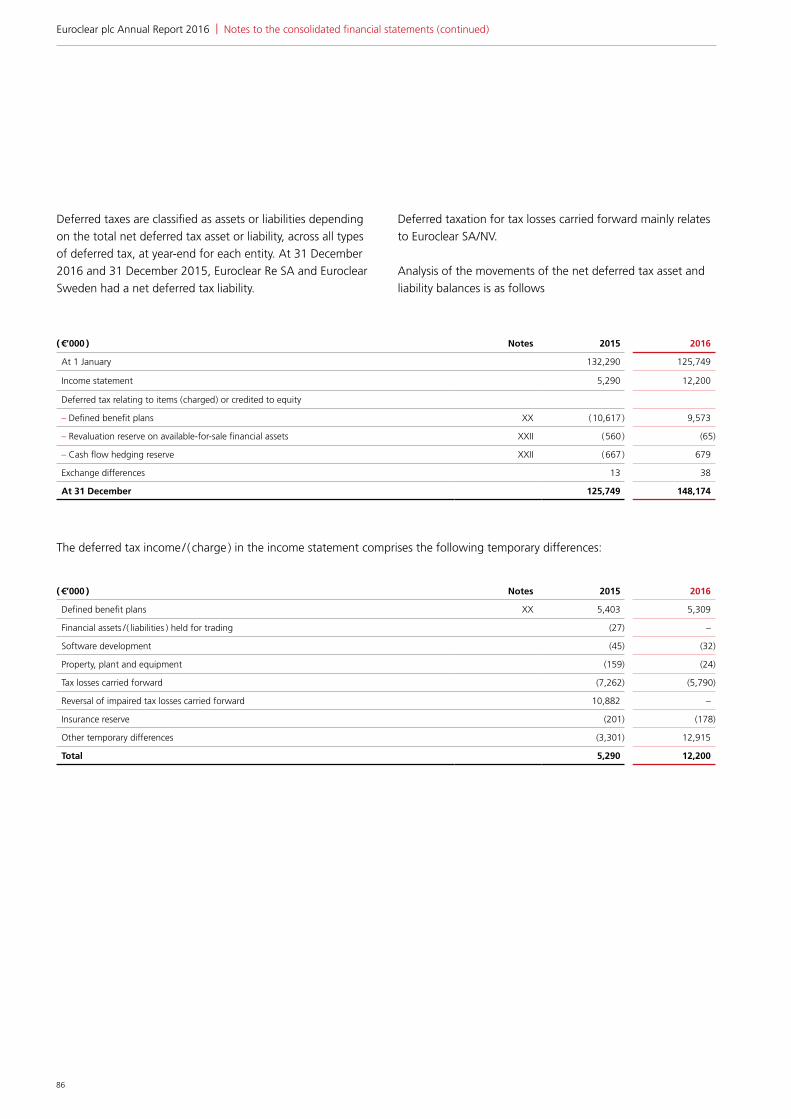
86
( €’000 ) Notes 2015 2016
At 1 January 132,290 125,749
Income statement 5,290 12,200
Deferred tax relating to items ( charged ) or credited to equity
– Defined benefit plans XX ( 10,617 ) 9,573
– Revaluation reserve on available-for-sale financial assets XXII ( 560 ) (65)
– Cash flow hedging reserve XXII ( 667 ) 679
Exchange differences 13 38
At 31 December 125,749 148,174
Deferred taxes are classified as assets or liabilities depending on the total net deferred tax asset or liability, across all types of deferred tax, at year-end for each entity. At 31 December 2016 and 31 December 2015, Euroclear Re SA and Euroclear Sweden had a net deferred tax liability.
Deferred taxation for tax losses carried forward mainly relates to Euroclear SA / NV.
Analysis of the movements of the net deferred tax asset and liability balances is as follows
The deferred tax income / ( charge ) in the income statement comprises the following temporary differences:
( €’000 ) Notes 2015 2016
Defined benefit plans XX 5,403 5,309
Financial assets / ( liabilities ) held for trading (27) –
Software development (45) (32)
Property, plant and equipment (159) (24)
Tax losses carried forward (7,262) (5,790)
Reversal of impaired tax losses carried forward 10,882 –
Insurance reserve (201) (178)
Other temporary differences (3,301) 12,915
Total 5,290 12,200
| Notes to the consolidated financial statements ( continued )Euroclear plc Annual Report 2016

87
( €’000 ) 2015 2016
At 31 December
Equity shares
– Listed 267,487 220,864
– Unlisted but fair value determinable 14,435 14,568
Listed debt instruments 2,158,938 2,605,327
2,440,860 2,840,759
( €’000 ) Equity shares Debt securities Total
At 1 January 2016 281,922 2,158,938 2,440,860
Additions – 6,263,183 6,263,183
Redemptions and disposals (123 ) ( 5,796,001) ( 5,796,124 )
Gains / losses from changes in fair value
– ( Gains ) / losses on redeemed or sold securities ( 2,516 ) 205 ( 2,311 )
– Gains / ( losses ) on held securities ( 43,851 ) 520 ( 43,331 )
Amortisation of discounts and ( premiums ) – ( 20,650 ) ( 20,650 )
Net change in accrued interest – ( 868 ) ( 868 )
At 31 December 2016 235,432 2,605,327 2,840,759
At 1 January 2015 161,923 3,589,003 3,750,926
Additions 4,552 11,461,200 11,465,752
Redemptions and disposals ( 9 ) ( 12,860,124 ) ( 12,860,133 )
Gains / losses from changes in fair value
– ( Gains ) / losses on redeemed or sold securities ( 21 ) 606 585
– Gains / ( losses ) on held securities 115,478 ( 864 ) 114,614
Amortisation of discounts and ( premiums ) – ( 18,283 ) ( 18,283 )
Net change in accrued interest – ( 12,601 ) ( 12,601 )
At 31 December 2015 281,923 2,158,937 2,440,860
XIV. Available-for-sale financial assets
All debt securities have fixed coupons.
For unlisted securities, the valuation is based on the prices at which the securities could probably be sold to willing and knowledgeable parties. These prices are determined using generally accepted valuation techniques, including discounted cash flow models and relevant market multiples.
The realised results on the available-for-sale financial assets can be found in Note VIII.
The maturity profile of the available-for-sale financial assets can be found in Note IV.
The movement in available-for-sale financial assets can be summarised as follows:
| Notes to the consolidated financial statements ( continued )Euroclear plc Annual Report 2016

88
Fair value Notional amount
( €’000 ) Assets Liabilities Assets Liabilities
At 31 December 2016 Foreign exchange derivatives
– Forward foreign exchange 40,063 32,292 3,949,805 1,647,929
Stock options ( Note V to Parent company financial statements ) 90 90 246 246
Total 40,153 32,382 3,950,051 1,648,175
At 31 December 2015 Foreign exchange derivatives
– Forward foreign exchange 6,897 4,534 1,079,786 1,361,603
Stock options ( Note V to Parent company financial statements ) 147 147 497 497
Total 7,044 4,681 1,080,283 1,362,100
The notional amount related to forward foreign exchange contracts at 31 December 2016 and 31 December 2015 principally reflect to outstanding currency swaps.
In certain circumstances, currency forward exchange contracts are used by certain companies of the Euroclear group to hedge the fair value of some specific liabilities expressed in foreign currencies. These transactions do, however, not qualify for hedge accounting.
XV. Financial instruments held for trading
XV.1. Fair value and notional amountsThe fair value and notional amounts of the group's trading derivatives were as follows:
| Notes to the consolidated financial statements ( continued )Euroclear plc Annual Report 2016
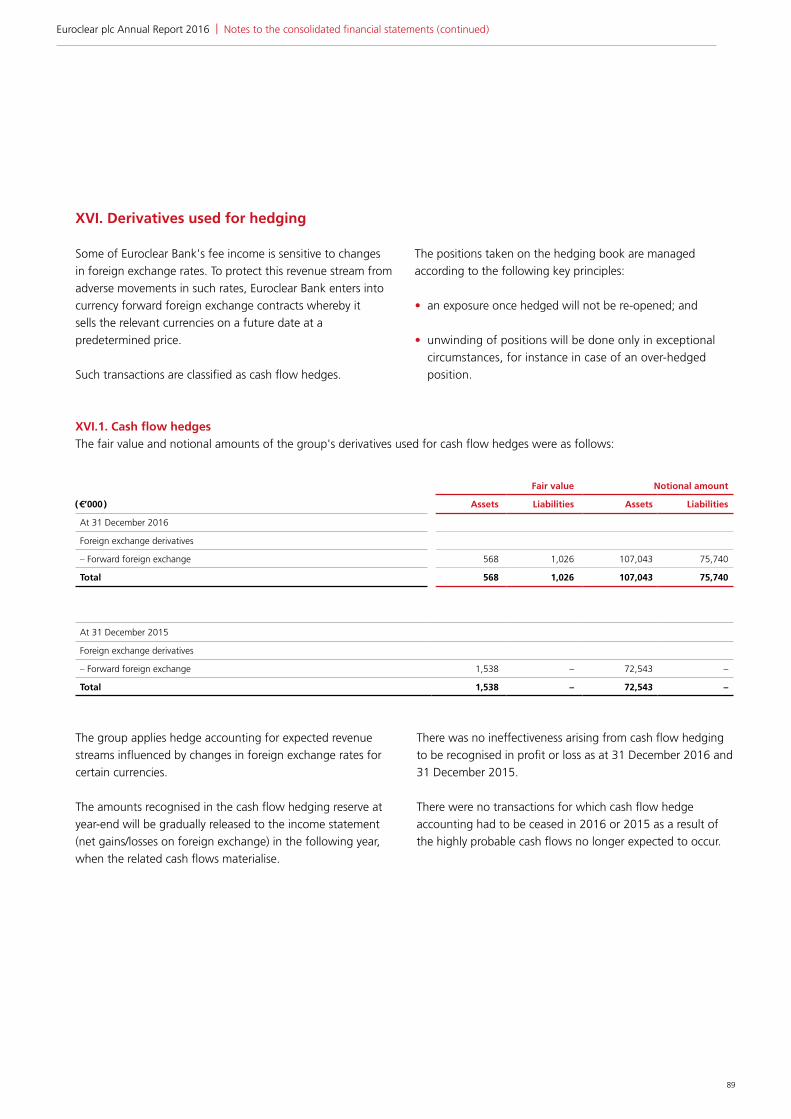
89
Fair value Notional amount
( €’000 ) Assets Liabilities Assets Liabilities
At 31 December 2016
Foreign exchange derivatives
– Forward foreign exchange 568 1,026 107,043 75,740
Total 568 1,026 107,043 75,740
At 31 December 2015
Foreign exchange derivatives
– Forward foreign exchange 1,538 – 72,543 –
Total 1,538 – 72,543 –
XVI. Derivatives used for hedging
Some of Euroclear Bank's fee income is sensitive to changes in foreign exchange rates. To protect this revenue stream from adverse movements in such rates, Euroclear Bank enters into currency forward foreign exchange contracts whereby it sells the relevant currencies on a future date at a predetermined price.
Such transactions are classified as cash flow hedges.
The positions taken on the hedging book are managed according to the following key principles:
• an exposure once hedged will not be re-opened; and
• unwinding of positions will be done only in exceptional circumstances, for instance in case of an over-hedged position.
The group applies hedge accounting for expected revenue streams influenced by changes in foreign exchange rates for certain currencies.
The amounts recognised in the cash flow hedging reserve at year-end will be gradually released to the income statement (net gains/losses on foreign exchange) in the following year, when the related cash flows materialise.
There was no ineffectiveness arising from cash flow hedging to be recognised in profit or loss as at 31 December 2016 and 31 December 2015.
There were no transactions for which cash flow hedge accounting had to be ceased in 2016 or 2015 as a result of the highly probable cash flows no longer expected to occur.
| Notes to the consolidated financial statements ( continued )Euroclear plc Annual Report 2016
XVI.1. Cash flow hedgesThe fair value and notional amounts of the group's derivatives used for cash flow hedges were as follows:
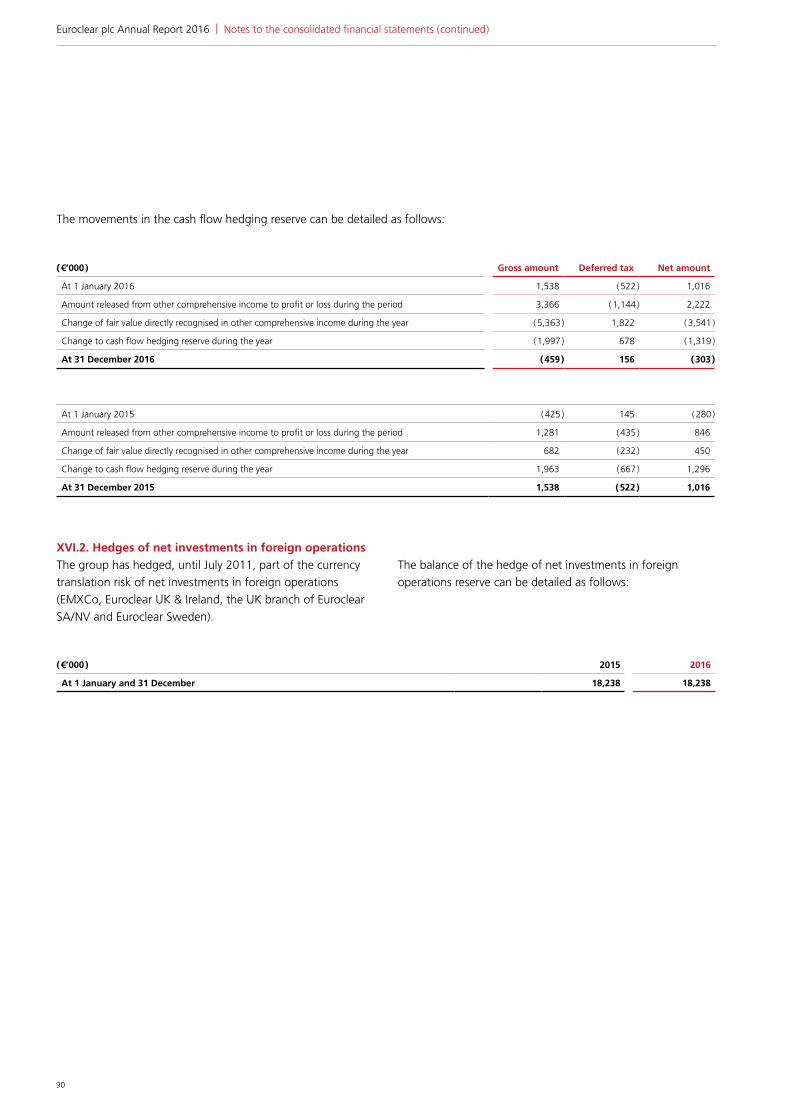
90
( €’000 ) Gross amount Deferred tax Net amount
At 1 January 2016 1,538 ( 522 ) 1,016
Amount released from other comprehensive income to profit or loss during the period 3,366 ( 1,144 ) 2,222
Change of fair value directly recognised in other comprehensive income during the year ( 5,363 ) 1,822 ( 3,541 )
Change to cash flow hedging reserve during the year ( 1,997 ) 678 ( 1,319 )
At 31 December 2016 ( 459 ) 156 ( 303 )
At 1 January 2015 ( 425 ) 145 ( 280 )
Amount released from other comprehensive income to profit or loss during the period 1,281 ( 435 ) 846
Change of fair value directly recognised in other comprehensive income during the year 682 ( 232 ) 450
Change to cash flow hedging reserve during the year 1,963 ( 667 ) 1,296
At 31 December 2015 1,538 ( 522 ) 1,016
The movements in the cash flow hedging reserve can be detailed as follows:
XVI.2. Hedges of net investments in foreign operationsThe group has hedged, until July 2011, part of the currency translation risk of net investments in foreign operations (EMXCo, Euroclear UK & Ireland, the UK branch of Euroclear SA / NV and Euroclear Sweden).
The balance of the hedge of net investments in foreign operations reserve can be detailed as follows:
( €’000 ) 2015 2016
At 1 January and 31 December 18,238 18,238
| Notes to the consolidated financial statements ( continued )Euroclear plc Annual Report 2016

91
( €’000 ) NotesLand and buildings
Leasehold improvements
Furniture and fixtures
IT equipment
Other equipment Total
Cost
At 1 January 2016 106,645 56,463 13,922 139,039 576 316,645
Additions 963 1,082 519 11,640 31 14,235
Capitalisation of dilapidation provision XIX – 53 – – – 53
Transfer and disposals – ( 444 ) 453 ( 29,729 ) – ( 29,720 )
Exchange differences – ( 988 ) ( 240 ) ( 501 ) ( 2 ) ( 1,731 )
At 31 December 2016 107,608 56,166 14,654 120,449 605 299,482
Accumulated depreciation
At 1 January 2016 ( 62,845 ) ( 34,905 ) ( 8,241 ) ( 98,207 ) ( 85 ) ( 204,283 )
Depreciation charge ( 3,059 ) ( 4,404 ) ( 1,334 ) ( 15,845 ) ( 29 ) ( 24,671 )
Transfer and disposals ( 2 ) 6 – 29,692 – 29,696
Exchange differences – 306 157 451 ( 1 ) 913
At 31 December 2016 ( 65,906 ) ( 38,997 ) ( 9,418 ) ( 83,909 ) ( 115 ) ( 198,345 )
Net book value at 31 December 2016 41,702 17,169 5,236 36,540 490 101,137
Cost
At 1 January 2015 102,084 53,883 13,176 129,180 730 299,053
Additions 1,555 5,737 587 14,979 6 22,864
Capitalisation of dilapidation provision XIX – 470 – – – 470
Transfer and disposals 3,006 ( 4,107 ) 43 ( 5,402 ) ( 163 ) ( 6,623 )
Exchange differences – 480 116 282 3 881
At 31 December 2015 106,645 56,463 13,922 139,039 576 316,645
Accumulated depreciation
At 1 January 2015 ( 58,821 ) ( 31,702 ) ( 7,587 ) ( 88,569 ) ( 216 ) ( 186,895 )
Depreciation charge ( 2,870 ) ( 4,417 ) ( 1,256 ) ( 14,595 ) ( 30 ) ( 23,168 )
Transfer and disposals ( 1,154 ) 1,445 687 5,209 163 6,350
Exchange differences – ( 231 ) ( 85 ) ( 252 ) ( 2 ) ( 570 )
At 31 December 2015 ( 62,845 ) ( 34,905 ) ( 8,241 ) ( 98,207 ) ( 85 ) ( 204,283 )
Net book value at 31 December 2015 43,800 21,558 5,681 40,832 491 112,362
XVII. Property, plant and equipment
The figures above include cost of property, plant and equipment under construction for an amount of €1,489,000 (2015: €2,449,000).
| Notes to the consolidated financial statements ( continued )Euroclear plc Annual Report 2016

92
XVIII. Goodwill and intangible assets
( €’000 )
Internally developed
softwarePurchased software Know-how Goodwill
Contractual customer
relationshipUnpatented technology Total
Cost
At 1 January 2016 51,840 69,001 46,001 1,425,318 21,965 59,725 1,673,850
Additions 33,452 11,472 – – – – 44,924
Transfer and disposals ( 149 ) ( 649 ) – – – – ( 798 )
Exchange differences ( 30 ) ( 823 ) ( 49 ) ( 10,090 ) – – ( 10,992 )
At 31 December 2016 85,113 79,001 45,952 1,415,228 21,965 59,725 1,706,984
Accumulated amortisation and impairment
At 1 January 2016 ( 3,075 ) ( 48,447 ) ( 46,001 ) ( 540,338 ) – ( 59,725 ) ( 697,586 )
Amortisation charges ( 4,426 ) ( 3,902 ) – – – – ( 8,328 )
Impairment charge ( 2,713 ) – – – – – ( 2,713 )
Transfer and disposals ( 1 ) ( 2 ) – – – – ( 3 )
Exchange differences – 827 49 615 – – 1,491
At 31 December 2016 ( 10,215 ) ( 51,524 ) ( 45,952 ) ( 539,723 ) – ( 59,725 ) ( 707,139 )
Net book value at 31 December 2016 74,898 27,477 – 875,505 21,965 – 999,845
Cost
At 1 January 2015 34,778 72,848 45,974 1,420,017 21,965 59,725 1,655,307
Additions 27,159 15,042 – – – – 42,201
Transfer and disposals ( 10,097 ) ( 19,275 ) – – – – ( 29,372 )
Exchange differences – 386 27 5,301 – – 5,714
At 31 December 2015 51,840 69,001 46,001 1,425,318 21,965 59,725 1,673,850
Accumulated amortisation and impairment
At 1 January 2015 ( 28,543 ) ( 46,645 ) ( 45,974 ) ( 539,987 ) – ( 59,725 ) ( 720,874 )
Amortisation charges ( 2,630 ) ( 2,718 ) – – – – ( 5,348 )
Transfer and disposals 28,098 1,274 – – – – 29,372
Exchange differences – ( 358 ) ( 27 ) ( 351 ) – – ( 736 )
At 31 December 2015 ( 3,075 ) ( 48,447 ) ( 46,001 ) ( 540,338 ) – ( 59,725 ) ( 697,586 )
Net book value at 31 December 2015 48,765 20,554 – 884,980 21,965 – 976,264
Goodwill and the contractual customer relationship relate to the acquisition of EMXCo, Euroclear Belgium, Euroclear Finland, Euroclear France, Euroclear Nederland, Euroclear Sweden and Euroclear UK & Ireland.
The unpatented technology related to the infrastructure of Euroclear Finland and Euroclear Sweden, which was fully amortised by mid-2012.
| Notes to the consolidated financial statements ( continued )Euroclear plc Annual Report 2016

93
XVIII.1 Determination of the cash-generating unitsGoodwill impairment reviews are based on the cash-generating units (CGUs) for the group’s three relevant operating segments: the ESES CSDs (Euroclear Belgium, Euroclear France, Euroclear Nederland), Euroclear UK & Ireland (Euroclear UK & Ireland and EMX Company Ltd, which was integrated into Euroclear UK & Ireland in 2010) and the Nordics (Euroclear Finland and Euroclear Sweden).
Except for Euroclear Sweden, goodwill and contractual customer relationship are expressed and tested for impairment purposes in euro. At the time of the acquisition of Euroclear UK & Ireland, the related goodwill was considered as a non-monetary asset of the acquirer and therefore expressed in euro. At the time of migration to IFRS, which considers goodwill to be a monetary asset of the acquired entity, Euroclear decided not to restate prior years’ business
combinations. The goodwill relating to EMX Company Ltd, now appraised together with that of Euroclear UK & Ireland, is expressed in sterling but is translated into euro at the spot rate on closing date for the purpose of impairment testing.
XVIII.2. Basis on which recoverable amounts have been determinedThe recoverable amounts is based on the ‘value in use’ using the discounted cash flow methodology for each segment. The 2016 valuation of all the entities concerned is based on a five-year free cash flow forecast with projections for periods beyond this assuming a perpetual annuity ranging between 1.7% and 2% depending on the concerned entity.
The net book values of the goodwill, and Euroclear Belgium’s contractual customer relationships, are set out in the table below.
These are the only intangible assets considered to have indefinite useful lives.
( €’000 ) 2015 2016
Euroclear UK & Ireland 206,762 204,045
ESES 484,626 484,626
Nordics 215,557 208,799
906,945 897,470
| Notes to the consolidated financial statements ( continued )Euroclear plc Annual Report 2016

94
XVIII.3 Key assumptions related to discount factorsThe appropriate discount rates are determined by applying the Capital Asset Pricing Model (CAPM). The discount rates and
perpetual growth rates used for each CGU in the 2016 and 2015 impairment reviews were as follows:
XVIII.4. The 2016 impairment reviewThe key assumptions for the valuation exercise are based on both external sources of information and on internal expectations (assets held in custody, transaction volumes, interest rates, etc.). Forecasts are taken from Board approved plans which translate into resilient profitability trends throughout 2017 and the years beyond. For all operating segments, their valuation indicated that the current values of goodwill and related intangibles are fair and justified.
The Board concluded that in 2016, there is no goodwill impairment risk arising from the review.
As far as sensitivity analysis is concerned, neither an increase of the discount rate by 1% nor a decrease of the business drivers by 5% would have resulted in an impairment in one of the CGUs (all other factors being equal).
The changes in the parameters used for the sensitivity analysis set out above are based on management’s estimates of what level of change is reasonably possible. For example, the choice of a 5% decrease for business volumes is justified by the volatility observed between forecasts and actuals over the past four years while the increase of the discount rate is justified by the highest yearly variance over the past four years.
2015 2016
Discount rate Perpetual growth rate Discount rate Perpetual growth rate
Euroclear UK & Ireland 7.50 % 1.70 % 6.70 % 1.70 %
ESES 6.10 % 1.70 % 6.50 % 1.70 %
Nordics 7.90 % 1.70% – 2.00 % 8.30 % 1.70 % – 2.00 %
| Notes to the consolidated financial statements ( continued )Euroclear plc Annual Report 2016
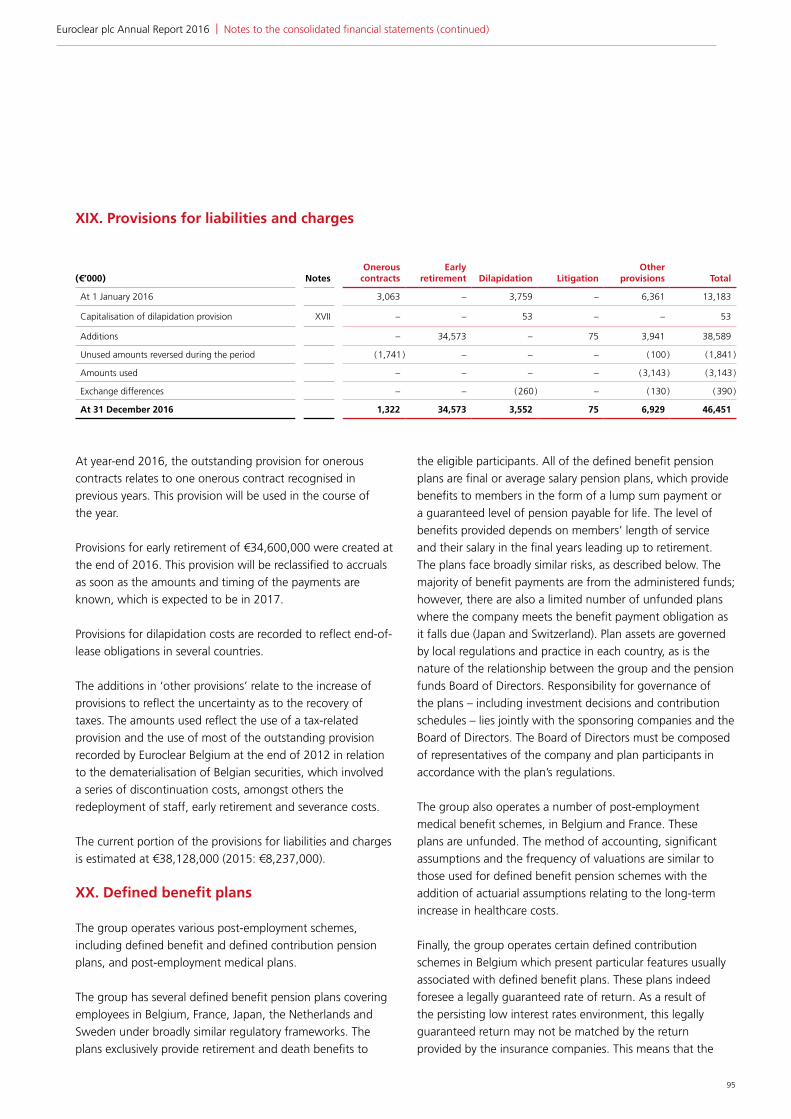
95
XIX. Provisions for liabilities and charges
At year-end 2016, the outstanding provision for onerous contracts relates to one onerous contract recognised in previous years. This provision will be used in the course of the year.
Provisions for early retirement of €34,600,000 were created at the end of 2016. This provision will be reclassified to accruals as soon as the amounts and timing of the payments are known, which is expected to be in 2017.
Provisions for dilapidation costs are recorded to reflect end-of-lease obligations in several countries.
The additions in ‘other provisions’ relate to the increase of provisions to reflect the uncertainty as to the recovery of taxes. The amounts used reflect the use of a tax-related provision and the use of most of the outstanding provision recorded by Euroclear Belgium at the end of 2012 in relation to the dematerialisation of Belgian securities, which involved a series of discontinuation costs, amongst others the redeployment of staff, early retirement and severance costs.
The current portion of the provisions for liabilities and charges is estimated at €38,128,000 (2015: €8,237,000).
XX. Defined benefit plans
The group operates various post-employment schemes, including defined benefit and defined contribution pension plans, and post-employment medical plans.
The group has several defined benefit pension plans covering employees in Belgium, France, Japan, the Netherlands and Sweden under broadly similar regulatory frameworks. The plans exclusively provide retirement and death benefits to
the eligible participants. All of the defined benefit pension plans are final or average salary pension plans, which provide benefits to members in the form of a lump sum payment or a guaranteed level of pension payable for life. The level of benefits provided depends on members’ length of service and their salary in the final years leading up to retirement. The plans face broadly similar risks, as described below. The majority of benefit payments are from the administered funds; however, there are also a limited number of unfunded plans where the company meets the benefit payment obligation as it falls due (Japan and Switzerland). Plan assets are governed by local regulations and practice in each country, as is the nature of the relationship between the group and the pension funds Board of Directors. Responsibility for governance of the plans – including investment decisions and contribution schedules – lies jointly with the sponsoring companies and the Board of Directors. The Board of Directors must be composed of representatives of the company and plan participants in accordance with the plan’s regulations.
The group also operates a number of post-employment medical benefit schemes, in Belgium and France. These plans are unfunded. The method of accounting, significant assumptions and the frequency of valuations are similar to those used for defined benefit pension schemes with the addition of actuarial assumptions relating to the long-term increase in healthcare costs.
Finally, the group operates certain defined contribution schemes in Belgium which present particular features usually associated with defined benefit plans. These plans indeed foresee a legally guaranteed rate of return. As a result of the persisting low interest rates environment, this legally guaranteed return may not be matched by the return provided by the insurance companies. This means that the
( €’000 ) NotesOnerous
contractsEarly
retirement Dilapidation LitigationOther
provisions Total
At 1 January 2016 3,063 – 3,759 – 6,361 13,183
Capitalisation of dilapidation provision XVII – – 53 – – 53
Additions – 34,573 – 75 3,941 38,589
Unused amounts reversed during the period ( 1,741 ) – – – ( 100 ) ( 1,841 )
Amounts used – – – – ( 3,143 ) ( 3,143 )
Exchange differences – – ( 260 ) – ( 130 ) ( 390 )
At 31 December 2016 1,322 34,573 3,552 75 6,929 46,451
| Notes to the consolidated financial statements ( continued )Euroclear plc Annual Report 2016
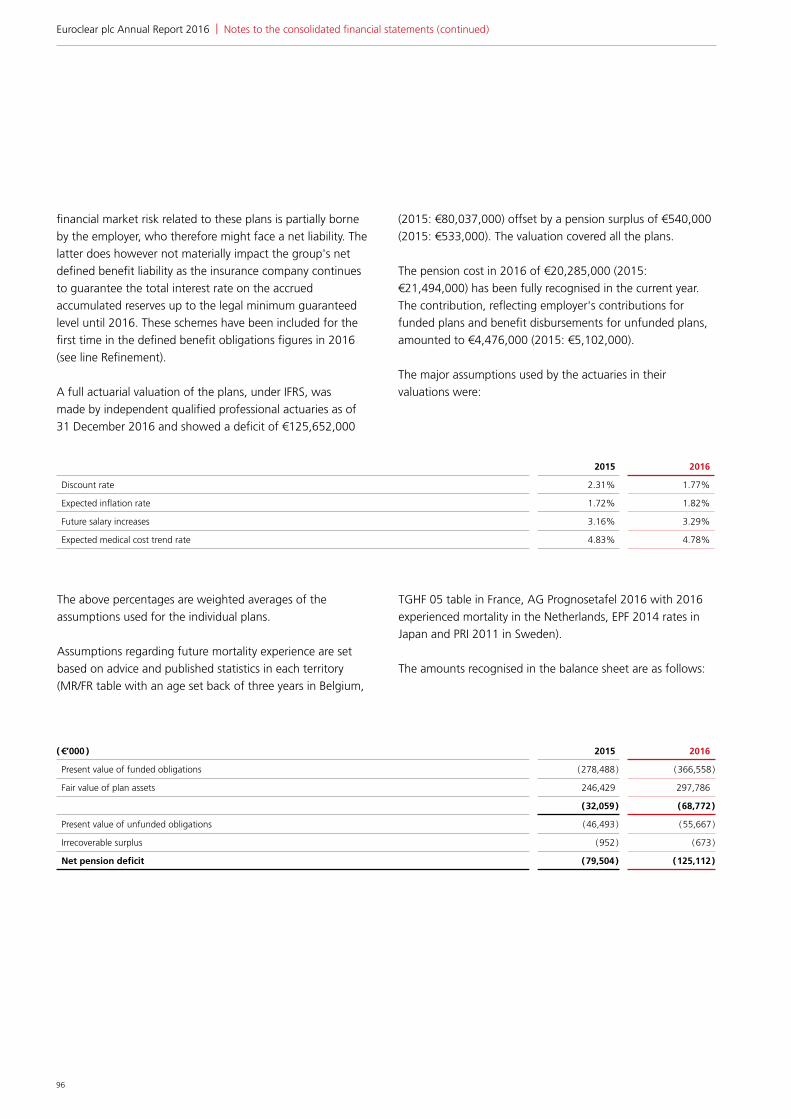
96
financial market risk related to these plans is partially borne by the employer, who therefore might face a net liability. The latter does however not materially impact the group's net defined benefit liability as the insurance company continues to guarantee the total interest rate on the accrued accumulated reserves up to the legal minimum guaranteed level until 2016. These schemes have been included for the first time in the defined benefit obligations figures in 2016 (see line Refinement).
A full actuarial valuation of the plans, under IFRS, was made by independent qualified professional actuaries as of 31 December 2016 and showed a deficit of €125,652,000
(2015: €80,037,000) offset by a pension surplus of €540,000 (2015: €533,000). The valuation covered all the plans.
The pension cost in 2016 of €20,285,000 (2015: €21,494,000) has been fully recognised in the current year. The contribution, reflecting employer's contributions for funded plans and benefit disbursements for unfunded plans, amounted to €4,476,000 (2015: €5,102,000).
The major assumptions used by the actuaries in their valuations were:
( €’000 ) 2015 2016
Present value of funded obligations ( 278,488 ) ( 366,558 )
Fair value of plan assets 246,429 297,786
( 32,059 ) ( 68,7 72 )
Present value of unfunded obligations ( 46,493 ) ( 55,667 )
Irrecoverable surplus ( 952 ) ( 673 )
Net pension deficit ( 79,504 ) ( 125,112 )
The above percentages are weighted averages of the assumptions used for the individual plans.
Assumptions regarding future mortality experience are set based on advice and published statistics in each territory (MR/FR table with an age set back of three years in Belgium,
TGHF 05 table in France, AG Prognosetafel 2016 with 2016 experienced mortality in the Netherlands, EPF 2014 rates in Japan and PRI 2011 in Sweden).
The amounts recognised in the balance sheet are as follows:
2015 2016
Discount rate 2.31% 1.77%
Expected inflation rate 1.72% 1.82%
Future salary increases 3.16% 3.29%
Expected medical cost trend rate 4.83% 4.78%
| Notes to the consolidated financial statements ( continued )Euroclear plc Annual Report 2016

97
2015 2016
( €’000 ) Quoted Unquoted Total Quoted Unquoted Total
Equity instruments
– European equities 38,539 – 38,539 39,645 – 39,645
– Global equities 77,388 – 77,388 78,355 – 78,355
– Emerging markets equities 2,353 – 2,353 3,202 – 3,202
– European real estate equities 9,413 – 9,413 9,644 – 9,644
– US equities 100 – 100 – – –
– Japan equities 34 – 34 – – –
Debt instruments
– EMU government bonds 54,925 – 54,925 49,875 – 49,875
– EMU corporate bonds 42,047 – 42,047 48,799 – 48,799
– Euro inflation–linked bonds 18,878 – 18,878 19,289 – 19,289
Property 1,500 – 1,500 1,933 – 1,933
Cash and cash equivalents 174 – 174 103 – 103
Qualifying insurance policies – 994 994 – 947 947
Investment funds 25 – 25 – – –
Other 59 – 59 45,994 – 45,994
Total market value of assets 245,435 994 246,429 296,839 997 297,786
The value of assets in all plans was:
The assets of the funded plans are held separately from those of the group. The group ensures that the investment positions are managed within an asset-liability matching (ALM) framework that has been developed to achieve long-term investments that are in line with the obligations under the pension schemes. Within this framework, the group’s ALM objective is to match assets to the pension obligations by investing in long-term fixed interest securities with maturities that match the benefit payments as they fall due and in the
appropriate currency. The company actively monitors how the duration and the expected yield of the investments are matching the expected cash outflows arising from the pension obligations. A large proportion of assets consists of equities and bonds, although the group also invests in property, cash and holds some insurance assets. The group believes that equities offer the best returns over the long term with an acceptable level of risk.
| Notes to the consolidated financial statements ( continued )Euroclear plc Annual Report 2016

98
Medical plans Pension plans
( €’000 ) NotesPresent value of obligations
Present value of obligations
Fair value of plan assets Total
Asset ceiling Total
At 1 January 2016 44,895 280,086 ( 246,429 ) 33,657 952 79,504
Current service cost X 1,885 17,914 – 17,914 – 19,799
Past service cost X – ( 1,263 ) – ( 1,263 ) – ( 1,263 )
Net Interest expense / ( income ) VI 982 6,437 ( 5,670 ) 767 – 1,749
Income statement 2,867 23,088 ( 5,670 ) 17,418 – 20,285
Remeasurements
Experience ( gains ) / losses ( 2,039 ) 1,284 ( 4,389 ) ( 3,105 ) – ( 5,144 )
( Gains ) / losses due to change in demographic assumptions
– ( 611 ) – ( 611 ) – ( 611 )
( Gains ) / losses due to change in financial assumptions
8,269 26,924 – 26,924 – 35,193
Refinement – 46,684 ( 45,936 ) 748 – 748
Settlements – ( 1,291 ) 1,291 – – –
Changes in asset ceiling – – – – ( 279 ) ( 279 )
Statement of other comprehensive income 6,230 72,990 ( 49,034 ) 23,956 ( 279 ) 29,907
Employer’s contributions ( 355 ) ( 37 ) ( 4,084 ) ( 4,121 ) – ( 4,476 )
Exchange differences – ( 1,049 ) 941 ( 108 ) – ( 108 )
Benefit payments – ( 6,490 ) 6,490 – – –
At 31 December 2016 53,637 368,588 ( 297,786 ) 70,802 673 125,112
At 1 January 2015 45,534 280,085 ( 228,656 ) 51,429 – 96,963
Current service cost X 1,962 17,575 – 17,575 – 19,537
Interest expense / ( income ) VI 951 5,993 ( 4,987 ) 1,006 – 1,957
Income statement 2,913 23,568 ( 4,987 ) 18,581 – 21,494
Remeasurements
Experience ( gains ) / losses ( 1,459 ) ( 979 ) ( 15,644 ) ( 16,623 ) – ( 18,082 )
( Gains ) / losses due to change in demographic assumptions
3,216 ( 5,670 ) – ( 5,670 ) – ( 2,454 )
( Gains ) / losses due to change in financial assumptions
( 4,949 ) ( 9,696 ) – ( 9,696 ) – ( 14,645 )
Changes in asset ceiling – – – – 952 952
Statement of other comprehensive income ( 3,192 ) ( 16,345 ) ( 15,644 ) ( 31,989 ) 952 ( 34,229 )
Employer’s contributions ( 360 ) – ( 4,742 ) ( 4,742 ) – ( 5,102 )
Exchange differences – 925 ( 547 ) 378 – 378
Benefit payments – ( 8,308 ) 8,308 – – –
At 31 December 2015 44,895 280,086 ( 246,429 ) 33,657 952 79,504
The changes in the net deficit are as follows:
The weighted average duration of the defined benefit obligations is 16.8 years (2015: 17.4 years).
| Notes to the consolidated financial statements ( continued )Euroclear plc Annual Report 2016

99
Funding levels are monitored on an annual basis and contributions are made to comply with minimum requirements as determined by local regulations and, if applicable, internal funding policy. The group considers that the contribution rates set at the last valuation date are sufficient to eliminate the deficit over the agreed period.
Expected contributions to post-employment benefit plans for the year ending 31 December 2017 are €4,900,000.
The cumulative actuarial loss recognised in other comprehensive income as at 31 December 2016 was €81,359,000 (2015: €51,452,000).
The sensitivity of the defined benefit obligations to a 1% movement in the weighted principal assumptions is:
The above sensitivity analysis is based on a change in an assumption while holding all other assumptions constant. In practice, this is unlikely to occur, and changes in some of the assumptions may be correlated. When calculating the sensitivity of the defined benefit obligations to significant actuarial assumptions, the same method (present value of the defined benefit obligation calculated with the projected unit credit method at the end of the reporting period) has been applied as when calculating the pension liability recognised within the statement of financial position. As the majority of the liabilities are not affected by the life expectancy risk (because of lump sum payments), no life expectancy sensitivity is considered.
Through its defined benefit pension plans and post employment medical plans, the group is exposed to a number of risks, the most significant of which are detailed below:
• asset volatility: the risk is kept under control thanks to proper risk management procedures and strategic asset allocation driven by the financial characteristics of the plans, in particular the plans liabilities and the risk tolerance of the Board and the group. The plan liabilities are calculated using a discount rate set with reference to corporate bond yields; if plan assets underperform this yield, this will create a deficit. Belgian plans hold 60% of equities, which are expected to outperform corporate bonds in the long-term while providing volatility and risk in the short-term. The group believes that due to the long-term nature of the plan liabilities and the strength of the supporting group, a level of continuing equity investment is
an appropriate element of the group’s long term strategy to manage the plans efficiently. See above for more details on the group’s asset-liability matching strategy.
• changes in bond yields: a decrease in corporate bond yields will increase plan liabilities, although this will be partially offset by an increase in the value of the plans’ bond holdings.
• inflation risk: the plans’ benefit obligations are linked to inflation (see sensitivity impact), and higher inflation will lead to higher liabilities. The impact is however limited and the assumptions are cautiously monitored annually.
• life expectancy: as mentioned, longevity risk is limited as the majority of the benefit payments are lump sums.
• medical trend rate risk: as the liabilities of the Belgian and French medical plans are very sensitive to the used medical trend rate, the evolution of this trend rate is monitored regularly to make sure that this trend rate properly reflects the long term expected evolution of the medical cost.
• salary increase: as the pension liabilities are quite sensitive to salary increase, the used assumptions are monitored closely and historic salary evolution is compared against the used assumptions.
The group has not changed the processes used to manage its risks from previous periods.
( €’000 ) Increase in assumption Decrease in assumption
Discount rate –15.6% 16.8%
Salary increase rate 14.6% –14.6%
Inflation rate 11.5% –11.5%
Medical trend rate 28.0% –20.0%
| Notes to the consolidated financial statements ( continued )Euroclear plc Annual Report 2016

100
The movement in the deferred tax asset relating to the pension deficit is as follows:
( €’000 ) Notes 2015 2016
Amount credited / ( charged ) through equity XIII ( 10,617 ) 9,573
Amount credited / ( charged ) through the income statement XIII 5,403 5,309
Exchange differences 81 ( 91 )
Increase / ( decrease ) in deferred tax asset ( 5,133 ) 14,791
XXI. Share capital
Authorised share capital 4,000,000 shares of 1 euro each
Equity shares Number of shares
Issued, allotted and fully paid share capital Ordinary Class ‘S’ Total ( €’000 )
At 1 January 2016 2,728,149 500,120 3,228,269 3,228
At 31 December 2016 2,728,149 500,120 3,228,269 3,228
At 1 January 2015 2,868,890 500,120 3,369,010 3,369
Share buy back ( 140,741 ) – ( 140,741 ) ( 141 )
At 31 December 2015 2,728,149 500,120 3,228,269 3,228
At 31 December 2016 and 31 December 2015, there was no stock option plan on the shares of Euroclear plc or any subsidiary.
The ordinary shares have attached to them full voting, dividend and capital distribution rights, including on a winding up. They do not confer any rights of redemption.
The class S shares have attached to them voting and capital distribution rights, including on a winding up. They also entitle a simple majority of the holders to appoint and remove a number of ‘S’ Directors. The holders of the shares are disenfranchised from voting on the appointment of any director of the company other than an ‘S’ Director. New S shares must be offered to holders of S shares in proportion to their existing holdings. They do not confer any rights of redemption.
140,741 €-denominated ordinary shares with an aggregate nominal value of €140,741 were purchased in 2015. Distributable reserves have been reduced by €106,224,000, being the consideration paid for these shares. The shares have subsequently been cancelled and share capital has been reduced by the aggregate nominal value of the cancelled shares €140,741. The nominal value of the shares cancelled has been transferred to a share capital redemption reserve. No share buy-back took place in 2016.
| Notes to the consolidated financial statements ( continued )Euroclear plc Annual Report 2016
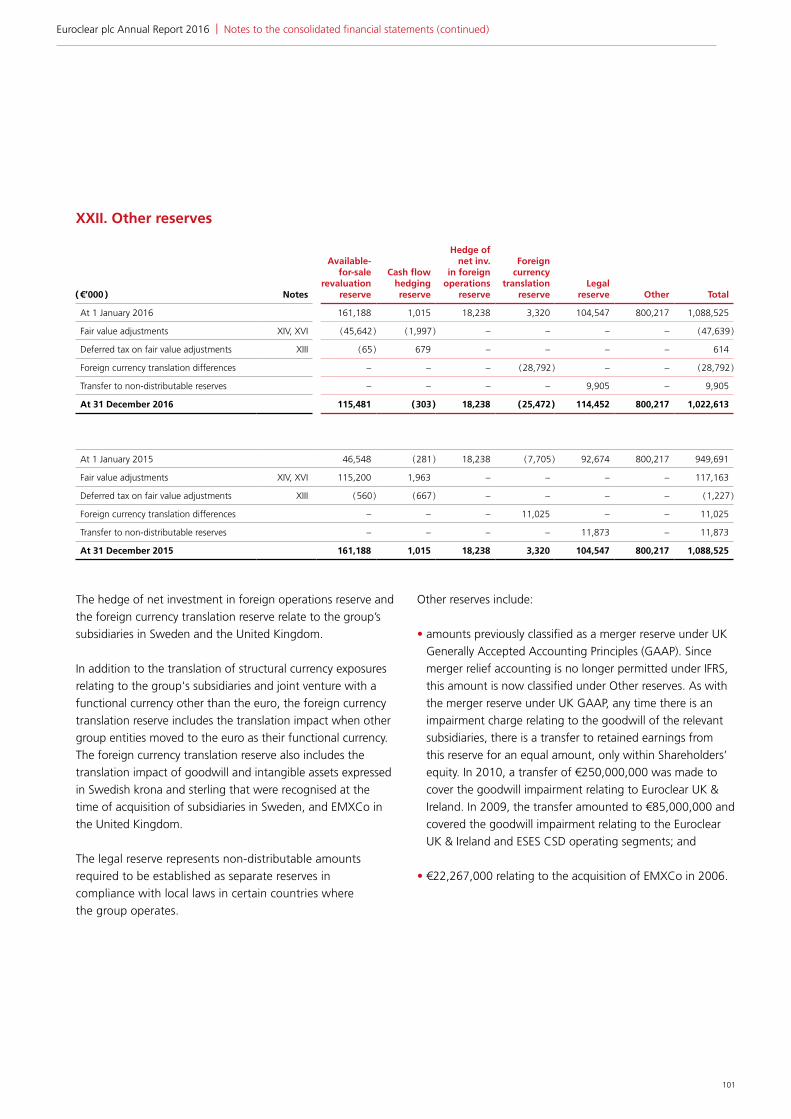
101
( €’000 ) Notes
Available- for-sale
revaluation reserve
Cash flow hedging reserve
Hedge of net inv.
in foreign operations
reserve
Foreign currency
translation reserve
Legal reserve Other Total
At 1 January 2016 161,188 1,015 18,238 3,320 104,547 800,217 1,088,525
Fair value adjustments XIV, XVI ( 45,642 ) ( 1,997 ) – – – – ( 47,639 )
Deferred tax on fair value adjustments XIII ( 65 ) 679 – – – – 614
Foreign currency translation differences – – – ( 28,792 ) – – ( 28,792 )
Transfer to non-distributable reserves – – – – 9,905 – 9,905
At 31 December 2016 115,481 ( 303 ) 18,238 ( 25,472 ) 114,452 800,217 1,022,613
At 1 January 2015 46,548 ( 281 ) 18,238 ( 7,705 ) 92,674 800,217 949,691
Fair value adjustments XIV, XVI 115,200 1,963 – – – – 117,163
Deferred tax on fair value adjustments XIII ( 560 ) ( 667 ) – – – – ( 1,227 )
Foreign currency translation differences – – – 11,025 – – 11,025
Transfer to non-distributable reserves – – – – 11,873 – 11,873
At 31 December 2015 161,188 1,015 18,238 3,320 104,547 800,217 1,088,525
XXII. Other reserves
The hedge of net investment in foreign operations reserve and the foreign currency translation reserve relate to the group’s subsidiaries in Sweden and the United Kingdom.
In addition to the translation of structural currency exposures relating to the group's subsidiaries and joint venture with a functional currency other than the euro, the foreign currency translation reserve includes the translation impact when other group entities moved to the euro as their functional currency. The foreign currency translation reserve also includes the translation impact of goodwill and intangible assets expressed in Swedish krona and sterling that were recognised at the time of acquisition of subsidiaries in Sweden, and EMXCo in the United Kingdom.
The legal reserve represents non-distributable amounts required to be established as separate reserves in compliance with local laws in certain countries where the group operates.
Other reserves include:
• amounts previously classified as a merger reserve under UK Generally Accepted Accounting Principles (GAAP). Since merger relief accounting is no longer permitted under IFRS, this amount is now classified under Other reserves. As with the merger reserve under UK GAAP, any time there is an impairment charge relating to the goodwill of the relevant subsidiaries, there is a transfer to retained earnings from this reserve for an equal amount, only within Shareholders’ equity. In 2010, a transfer of €250,000,000 was made to cover the goodwill impairment relating to Euroclear UK & Ireland. In 2009, the transfer amounted to €85,000,000 and covered the goodwill impairment relating to the Euroclear UK & Ireland and ESES CSD operating segments; and
• €22,267,000 relating to the acquisition of EMXCo in 2006.
| Notes to the consolidated financial statements ( continued )Euroclear plc Annual Report 2016

102
XXIV. Contingent liabilities and commitments
The collateral pledged mainly relates to
• securities deposited with the National Bank of Belgium as potential collateral, principally for Target2-related exposures. It includes investment securities with a market value of €1,569,282,000 (2015: €2,111,395,000) and the reuse of securities received as collateral for reverse repurchase agreements from participants with a market value of €2,195,141,000 (2015:€0). There was no exposure at 31 December 2016 (2015: €7,889,000); and
• a bank deposit of €500,000 (2015: €500,000) pledged by Euroclear Finland to a third-party registration fund in order to fulfil its obligations as account operator.
Under the terms of the Euroclear Securities Lending and Borrowing Programme, Euroclear Bank provides a guarantee to securities lenders whereby if a securities borrower is unable to return the securities, Euroclear Bank guarantees the lender to receive replacement securities or their cash equivalent. A similar guarantee applies to Euroclear Bank's GC Access Programme. The guarantee is valued at market value of the loan securities plus accrued interest. Euroclear Bank’s policy is that all securities borrowings are covered by collateral pledged by the borrowing banks and clients.
( €’000 ) 2015 2016
At 31 December
Collateral pledged, of which: 2,147,826 3,800,462
– Own assets 2,147,826 1,605,321
– Re-use of collateral received – 2,195,141
Securities lending indemnifications 18,576,062 28,298,635
Litigations – –
€ per share 2015 2016
Equity paid 31.53 36.30
( €’000 )
Equity paid 106,225 117,186
XXIII. Dividends paid
See Note XXVII for details of the proposed 2016 equity dividend.
| Notes to the consolidated financial statements ( continued )Euroclear plc Annual Report 2016

103
XXV. Operating lease commitments
2015 2016
Group company as lessee ( €’000 )
PropertyVehicles, plant
and equipment
PropertyVehicles, plant
and equipment
Future aggregate minimum lease payments under non-cancellable operating leases: 99,778 53,407 117,148 38,244
– up to one year 17,548 18,972 18,972 16,555
– later than one year and not later than five years 56,225 33,984 53,272 21,689
– over five years 26,005 451 44,904 –
The total total sublease payments receivables relating to the above operating leases amounted to €210,619 (2015:€0).
Minimum lease payments recognised as an expense 17,546 17,847 17,739 18,443
XXVI. Related party disclosures
Euroclear plc, incorporated in the United Kingdom, is the ultimate parent and controlling party of the Euroclear group. Euroclear plc's investments in its subsidiaries are set out in Note II to the parent company financial statements.
Transactions with related parties, other than those between companies of the group eliminated on consolidation, principally relate to investments in subsidiaries and
joint ventures and to key management compensation. Transactions between Euroclear plc, as parent company, and its subsidiaries are described in Note XI to the parent company financial statements.
Besides this, the group considers its Belgian pension fund as a related party as it has the ability to exercise significant influence over it in taking financial or operational decisions. Disclosures related to the pension funds are presented in Note XX.
| Notes to the consolidated financial statements ( continued )Euroclear plc Annual Report 2016

104
XXVI.1.a. Administrative supportCertain administrative support costs are periodically recharged to and by other companies within the Euroclear group.
XXVI.1.b. Liquidity facilityIn April 2015, Euroclear SA provided a two-year liquidity facility to Taskize Limited for an amount up to GBP 300,000 (€409,000).
Taskize Limited must use the funds drawn under this agreement for the purpose of financing its operational and business setup costs and its initial application development costs. An annual fee of 0.55% is computed on the undrawn amount of the facility. Any utilisation of the facility (none to date) is remunerated at annual rate of 3.9%.
2015 2016
( €’000 )
Other group
companies
Joint
ventures Total
Other group
companies
Joint
ventures Total
Assets
Other assets – 4,352 4,352 – 1,584 1,584
Investments in subsidaries and joint ventures 6,294 8,857 15,151 6,294 10,980 17,274
Total assets 6,294 13,209 19,503 6,294 12,564 18,858
Liabilities
Income statement
Interest income – – – 2 – 2
Other operating income – 4,336 4,336 – 4,890 4,890
Total income statement – 4,336 4,336 2 4,890 4,892
Off-balance sheet
Liquidity facility given ( 409 ) – ( 409 ) ( 409 ) – ( 409 )
Total off-balance sheet ( 409 ) – ( 409 ) ( 409 ) – ( 409 )
XXVI.1. Transactions with non-consolidated subsidiaries and joint venture
| Notes to the consolidated financial statements ( continued )Euroclear plc Annual Report 2016

105
The NBB has been informed of the compensation principles for the members of the Management Committees of Euroclear SA / NV and Euroclear Bank and of certain other Senior Management, taking into account the applicable regulations. The amounts - as approved by the respective Remuneration Committees/Boards - reflect these principles and more specifically the allocation between short-term and long-term benefits.
No loans or similar transactions occurred with directors, key management or their close family members.
The companies employing the Euroclear SA / NV non-executive directors are subject to the same terms, conditions and tariffs as other companies.
Included in the fees of non-executive directors are fees paid directly to the respective employers of the Euroclear directors, amounting to €139,000 (2015: €195,000).
Nine directors waived the right to receive emoluments totalling €248,000 (2015: seven directors; €224,000).
Directors' emoluments are in the form of fees with the exception of life insurance benefits for one director amounting to €11,000 (2015: €11,000).
XXVII. Events after the balance sheet date
Proposed dividendOn 23 February 2017, the directors resolved to propose a dividend in respect of the financial year ending 31 December 2016 of €37.00 (2015: €36.30) per equity share, which will distribute €119,446,000 (2015: €117,186,000) of shareholders' equity. The dividend will be paid on 20 May 2016 to shareholders on the register on 23 March 2017.
On 23 February 2017, the directors resolved to propose to return €58,000,000 profit to shareholders via a share buy-back.
( €’000 ) 2015 2016
Short-term employee benefits 17,995 17,717
Post-employment benefits 1,784 1,732
Other long-term benefits 2,416 2,562
Termination benefits 2,863 3,102
Total compensation of key management 25,058 25,113
Emoluments of non-executive directors 1,282 1,329
Total compensation of key management and directors 26,340 26,442
Emoluments of highest paid director 581 575
| Notes to the consolidated financial statements ( continued )Euroclear plc Annual Report 2016
XXVI.2. Key management compensationThe compensation of key management (members of the Management Committees of Euroclear SA / NV and its (l)
CSD subsidiaries, group division heads and the Euroclear plc Executive Secretary) and non-executive directors was as follows:

106
Independent auditor’s report
Report on the group financial statements
Our opinion In our opinion, Euroclear plc’s group financial statements (the “financial statements”):
• give a true and fair view of the state of the group’s affairs as at 31 December 2016 and of its profit and cash flows for the year then ended;
• have been properly prepared in accordance with International Financial Reporting Standards (“IFRSs”) as adopted by the European Union; and
• have been prepared in accordance with the requirements of the Companies Act 2006.
What we have audited The financial statements, included within the Annual Report, comprise:
• the Consolidated statement of financial position as at 31 December 2016;
• the Consolidated income statement and Consolidated statement of comprehensive income for the year then ended;
• the Consolidated statement of cash flows for the year then ended;
• the Consolidated statement of changes in equity for the year then ended; and
• the notes to the financial statements which include a summary of
significant accounting policies and other explanatory information.
The financial reporting framework that has been applied in the preparation of the financial statements is IFRSs as adopted by the European Union, and applicable law.
In applying the financial reporting framework, the directors have made a number of subjective judgements, for example in respect of significant accounting estimates. In making such estimates, they have made assumptions and considered future events.
Opinion on other matter prescribed by the Companies Act 2006
In our opinion, based on the work undertaken in the course of the audit:
• the information given in the Strategic Report and the Directors’ Report for the financial year for which the financial statements are prepared is consistent with the financial statements; and
• the Strategic Report and the Directors’ Report have been prepared in accordance with applicable legal requirements.
In addition, in light of the knowledge and understanding of the group and its environment obtained in the course of the audit, we are required to report if we have identified any material misstatements in the Strategic Report and the Directors’ Report. We have nothing to report in this respect.
Other matters on which we are required to report by exception
Adequacy of information and explanations receivedUnder the Companies Act 2006 we are required to report to you if, in our opinion, we have not received all the information and explanations we require for our audit. We have no exceptions to report arising from this responsibility.
Directors’ remuneration Under the Companies Act 2006 we are required to report to you if, in our opinion, certain disclosures of directors’ remuneration specified by law are not made. We have no exceptions to report arising from this responsibility.
Responsibilities for the financial statements and the audit
Our responsibilities and those of the directors As explained more fully in the Statement of directors' responsibility set out on page 39, the directors are responsible for the preparation of the financial statements and for being satisfied that they give a true and fair view.
Our responsibility is to audit and express an opinion on the financial statements in accordance with applicable law and International Standards on Auditing (UK and Ireland) (“ISAs (UK & Ireland)”). Those standards require us to comply with the Auditing Practices Board’s Ethical Standards for Auditors.
to the members of Euroclear plc
| Independent auditor’s reportEuroclear plc Annual Report 2016

107
This report, including the opinions, has been prepared for and only for the parent company’s members as a body in accordance with Chapter 3 of Part 16 of the Companies Act 2006 and for no other purpose. We do not, in giving these opinions, accept or assume responsibility for any other purpose or to any other person to whom this report is shown or into whose hands it may come save where expressly agreed by our prior consent in writing.
What an audit of financial statements involves We conducted our audit in accordance with ISAs (UK & Ireland). An audit involves obtaining evidence about the amounts and disclosures in the financial statements sufficient to give reasonable assurance that the financial statements are free from material misstatement, whether caused by fraud or error. This includes an assessment of:
• whether the accounting policies are appropriate to the group’s circumstances and have been consistently applied and adequately disclosed;
• the reasonableness of significant accounting estimates made by the directors; and
• the overall presentation of the financial statements.
We primarily focus our work in these areas by assessing the directors’ judgements against available evidence, forming our own judgements, and evaluating the disclosures in the financial statements.
We test and examine information, using sampling and other auditing techniques, to the extent we consider necessary to provide a reasonable basis for us to draw conclusions. We obtain audit evidence through testing the effectiveness of controls, substantive procedures or a combination of both.
In addition, we read all the financial and non-financial information in the Annual Report to identify material inconsistencies with the audited financial statements and to identify any information that is apparently materially incorrect based on, or materially inconsistent
with, the knowledge acquired by us in the course of performing the audit. If we become aware of any apparent material misstatements or inconsistencies we consider the implications for our report. With respect to the Strategic Report and Directors’ Report, we consider whether those reports include the disclosures required by applicable legal requirements.
Henry Daubeney (Senior Statutory Auditor) for and on behalf of PricewaterhouseCoopers LLPChartered Accountants and Statutory AuditorsLondon27 February 2017
| Independent auditor’s report ( continued )Euroclear plc Annual Report 2016

108
Parent company statement of financial position
( €’000 ) Notes 2015 2016
Assets
Non-current assets
Loans and receivables 33,000 –
Investment in subsidiary undertakings II 1,562,921 1,562,921
Deferred income tax assets III 65 67
Total non-current assets 1,595,986 1,562,988
Current assets
Trade and other receivables IV 6,429 7,369
Derivative financial instruments V 147 90
Loans and advances 16,255 269,041
Current income tax assets – 26
Total current assets 22,831 276,526
Total assets 1,618,817 1,839,514
Equity
Capital and reserves attributable to equity holders of the parent
Ordinary shares VI 3,228 3,228
Share premium 143,223 143,223
Capital redemption reserve 603 603
Other reserves VII 1,207,848 1,207,848
Retained earnings 258,487 368,462
Total equity 1,613,389 1,723,364
Liabilities
Non-current liabilities
Pension deficit VIII 448 461
Total non-current liabilities 448 461
Current liabilities
Trade and other payables IX 1,225 373
Borrowings XI – 100,000
Current income tax liabilities 3,608 15,226
Derivative financial instruments V 147 90
Total current liabilities 4,980 115,689
Total liabilities 5,428 116,150
Total equity and liabilities 1,618,817 1,839,514
The accompanying Notes form an integral part of these financial statements.
These financial statements were authorised for issue by the Board of Directors on 23 February 2017 and signed on its behalf by
Marc Antoine Autheman Chairman of the Board
| Parent company statement of financial positionEuroclear plc Annual Report 2016
As at 31 December 2016

109
Statement of changes in equity
( €’000 )Called up
share capital
Share premium account
Capital redemption
reserveOther
reservesRetained earnings
Total equity
At 1 January 2016 3,228 143,223 603 1,207,848 258,487 1,613,389
Profit for the year ( Note I ) – – – – 227,172 227,172
Dividends paid ( Note XXIII to Euroclear plc consolidated financial statements )
– – – – ( 117,186 ) ( 117,186 )
Pension reserve – – – – ( 11 ) ( 11 )
At 31 December 2016 3,228 143,223 603 1,207,848 368,462 1,723,364
At 1 January 2015 3,369 143,223 462 1,207,848 242,548 1,597,450
Profit for the year ( Note I ) – – – – 228,388 228,388
Share buy-back ( 141 ) – 141 – ( 106,224 ) ( 106,224 )
Dividends paid ( Note XXIII to Euroclear plc consolidated financial statements )
– – – – ( 106,225 ) ( 106,225 )
At 31 December 2015 3,228 143,223 603 1,207,848 258,487 1,613,389
| Parent company statement of financial position ( continued ) Euroclear plc Annual Report 2016

110
( €’000 ) Notes 2015 2016
Profit before income tax 232,000 242,329
Adjustments for:
– Interest on redeemable preference shares 2 –
– Interest income ( 86 ) ( 48 )
Other non-cash movements ( 2 ) ( 4 )
– Interest received 113 51
Changes in working capital:
– Trade and other receivables IV ( 295 ) ( 940 )
– Trade and other payables IX 878 ( 852 )
Cash generated from operations 232,610 240,536
Income tax paid ( 3,077 ) ( 3,564 )
Net cash generated from operating activities 229,533 236,972
Cash flows from financing activities
Net ( increase ) / decrease in loans and advances ( 18,000 ) 18,000
Share buy-back ( Note XXII of Euroclear plc consolidated financial statements )
( 106,224 ) –
Redemption of redeemable preference shares ( 17 ) –
Dividends paid to the Company’s shareholders ( Note XXIII of Euroclear plc consolidated financial statements )
( 106,225 ) ( 117,186 )
Interest paid to holders of redeemable preference shares ( 2 ) –
Net cash used in financing activities ( 230,468 ) ( 99,186 )
Net ( decrease ) / increase in cash and cash equivalents ( 935 ) 137,786
Cash and cash equivalents at beginning of the year 17,190 16,255
Cash and cash equivalents at end of the year 16,255 154,041
of which cash at bank and on hand 11,249 144,039
of which short-term bank deposits 5,006 10,002
Statement of cash flows
The amount placed with related parties at 31 December 2016 was €9,000 (2015: €8,000) (Note XI).
The accompanying Notes form an integral part of these financial statements.
| Parent company statement of financial position ( continued )Euroclear plc Annual Report 2016
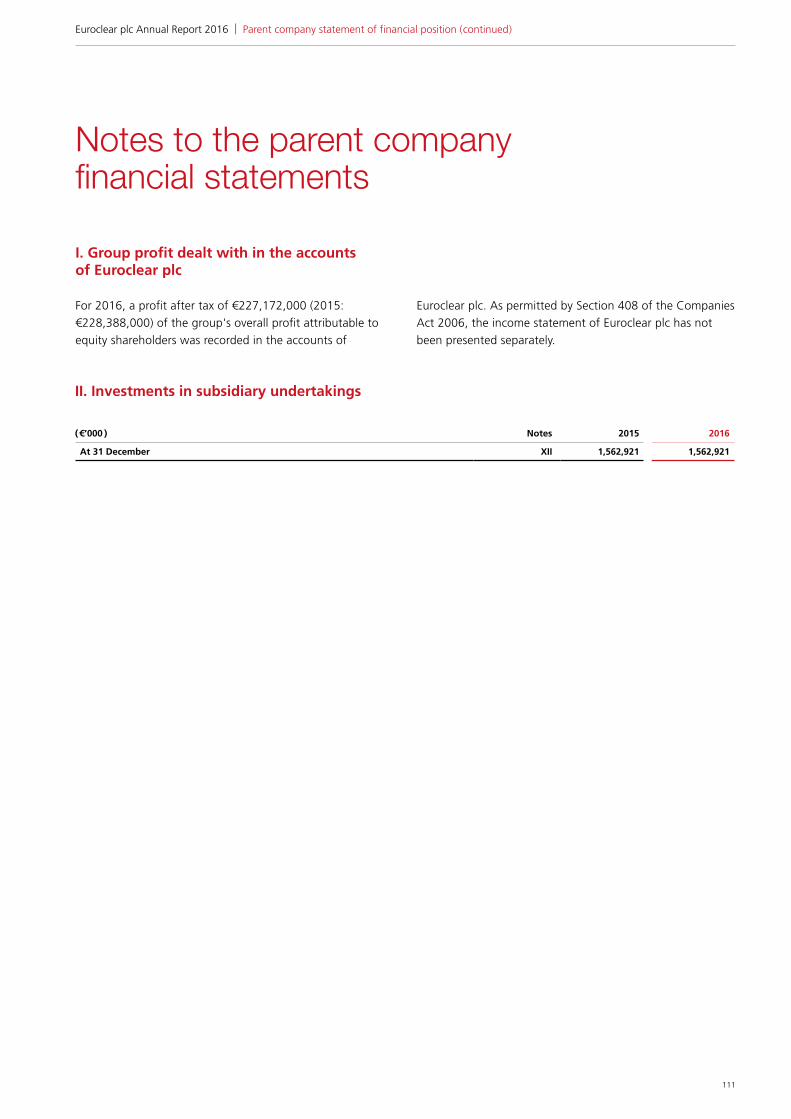
111
I. Group profit dealt with in the accounts of Euroclear plc
For 2016, a profit after tax of €227,172,000 (2015: €228,388,000) of the group's overall profit attributable to equity shareholders was recorded in the accounts of
Euroclear plc. As permitted by Section 408 of the Companies Act 2006, the income statement of Euroclear plc has not been presented separately.
( €’000 ) Notes 2015 2016
At 31 December XII 1,562,921 1,562,921
Notes to the parent company financial statements
II. Investments in subsidiary undertakings
| Parent company statement of financial position ( continued ) Euroclear plc Annual Report 2016

112
(1) Held through Euroclear SA / NV (2) Held through Euroclear Bank SA / NV (3) Held through Euroclear Investments
Address of registered office Nature of business
Proportions of voting rights and ordinary
shares held
Consolidated subsidiaries
Caisse interprofessionelle de dépôts et de virements de titres SA ( 1 )
1 Boulevard du Roi Albert II, 1210 Brussels, Belgium
Central Securities Depository for Belgium 100%
Calar Belgium SA / NV ( 2 ) 1 Boulevard du Roi Albert II, 1210 Brussels, Belgium
Property Investment 100%
EMX Company Limited ( 1 ) Watling House, 33 Cannon Street, EC4M5SB London, United Kingdom
Dormant 100%
Euroclear Bank SA / NV ( 1 ) 1 Boulevard du Roi Albert II, 1210 Brussels, Belgium
Banking, securities settlement and custody services
100%
Euroclear Finland Oy ( 1 ) Urho Kekkosen katu 5 C, 00100 Helsinki, Finland
Central Securities Depository for Finland 100%
Euroclear France SA ( 1 ) 66 rue de la Victoire 75009 Paris, France Central Securities Depository for France 100%
Euroclear International Services Limited ( 1 )
Watling House, 33 Cannon Street, London EC4M 5SB, United Kingdom
Dormant 100%
Euroclear Investments 12 Rue Eugène Ruppert, 2453 Luxembourg, Investment holding 100%
Euroclear Market Solution Limited ( 1 ) Watling House, 33 Cannon Street, London EC4M 5SB, United Kingdom
Proprietary services 100%
Euroclear Properties France SAS ( 3 ) 66 rue de la Victoire 75009 Paris, France Property Investment 100%
Euroclear Re SA ( 3 ) 12 rue Eugène Ruppert,, 2453 Luxembourg Reinsurance 100%
Euroclear SA / NV ( 3 ) 1 Boulevard du Roi Albert II, 1210 Brussels, Belgium
(I)CSD holding company, ownership of share processing platforms and delivery of shared
non-operational services 100%
Euroclear Sweden AB ( 1 ) PO Box 7822, Regeringsgatan 65, 103 97 Stockholm, Sweden
Central Securities Depository for Sweden 100%
Euroclear UK & Ireland Limited ( 1 ) Watling House, 33 Cannon Street, London EC4M 5SB, United Kingdom
Central Securities Depository for the United Kingdom and Ireland, and Investment-fund
order routing100%
Nederlands Centraal Instituut voor Giraal Effectenverkeer BV (Necigef) ( 1 )
Herengracht 459-469, 1017 BS Amsterdam, The Netherlands
Central Securities Depository for the Netherlands
100%
Number of wholly owned subsidiaries 15
Number of non-wholly owned subsidiary
0
Total subsidiaries 15
In November 2016, Euroclear Investments’ participation in Euroclear Market Solutions Limited was dropped down to Euroclear SA / NV at its acquisition value.
Euroclear Finance 2 was liquidated in December 2015 following the redemption in June 2015 of the fixed/floating rate guaranteed non-cumulative perpetual securities.
| Parent company statement of financial position ( continued )Euroclear plc Annual Report 2016
At 31 December 2016, Euroclear plc had the following interests in the issued ordinary share capital of subsidiary undertakings.

113
Address of registered office Nature of business
Proportions of voting rights and ordinary
shares held
Non-consolidated subsidiaries
CIN(Belgium) Limited ( 1 ) Watling House, 33 Cannon Street, London EC4M 5SB, United Kingdom
Nominee company 100%
CREST Client Tax Nominee(No.1) Limited ( 1 )
Watling House, 33 Cannon Street, London EC4M 5SB, United Kingdom
Nominee company 100%
CREST USD Nominee Limited ( 1 ) Watling House, 33 Cannon Street, London EC4M 5SB, United Kingdom
Nominee company 100%
CREST Depository Limited ( 2 ) Watling House, 33 Cannon Street, London EC4M 5SB, United Kingdom
Nominee company 100%
CREST International Nominees Limited ( 1 )
Watling House, 33 Cannon Street, London EC4M 5SB, United Kingdom
Nominee company 100%
CREST Stamp Nominee(No.1) Lim-ited ( 2 )
Watling House, 33 Cannon Street, London EC4M 5SB, United Kingdom
Nominee company 100%
CREST Stamp Nominee(No.2) Lim-ited ( 2 )
Watling House, 33 Cannon Street, London EC4M 5SB, United Kingdom
Nominee company 100%
CRESTCo Limited ( 2 ) Watling House, 33 Cannon Street, London EC4M 5SB, United Kingdom
Nominee company 100%
EC Nominees Limited ( 3 ) Watling House, 33 Cannon Street, London EC4M 5SB, United Kingdom
Nominee company 100%
ENL Nominee Limited ( 5 ) Watling House, 33 Cannon Street, London EC4M 5SB, United Kingdom
Nominee company 100%
EOC Equity Limited ( 3 ) Watling House, 33 Cannon Street, London EC4M 5SB, United Kingdom
Nominee company 100%
Euroclear Nominees Limited ( 3 ) Watling House, 33 Cannon Street, London EC4M 5SB, United Kingdom
Nominee company 100%
Euroclear Treasury Nominee Limited ( 3 ) Watling House, 33 Cannon Street, London EC4M 5SB, United Kingdom
Nominee company 100%
Fundsettle EOC Nominees Limited ( 3 ) Watling House, 33 Cannon Street, London EC4M 5SB, United Kingdom
Nominee company 100%
Taskize Limited ( 4 ) Watling House, 33 Cannon Street, London EC4M 5SB, United Kingdom
Proprietary services 70%
Trinity Nominees Limited ( 2 ) Watling House, 33 Cannon Street, London EC4M 5SB, United Kingdom
Nominee company 100%
( 1 ) Held through CREST Depository Limited ( 2 ) Held through Euroclear UK & Ireland ( 3 ) Held through Euroclear Bank SA / NV ( 4 ) Held through Euroclear SA / NV( 5 ) Held through Nederlands Centraal Instituut voor Giraal Effectenverkeer BV (Necigef)
In April 2015, Euroclear Investments took over a 70% stake in Taskize Limited. Taskize Limted is a start-up company founded to develop and bring to market Taskize Connect, a collaboration software designed to resolve issues in global banking operations within and between firms. In November 2016, the participation was dropped down to Euroclear SA / NV at its acquisition value. The aggregate amount of Taskize’s ‘capital and reserves’ and ‘net loss’ were respectively €3,941,000 and €1,006,000 as at the end of 2016. The
participation is recognised at a net book value of €6,294,000 in the consolidated statement of financial position.
These companies have not been consolidated since they collectively represent less than 1% of the group consolidated equity, and are therefore not considered as being material.
No transactions have occurred during the year between the nominee companies and the other companies in the group.
| Parent company statement of financial position ( continued ) Euroclear plc Annual Report 2016
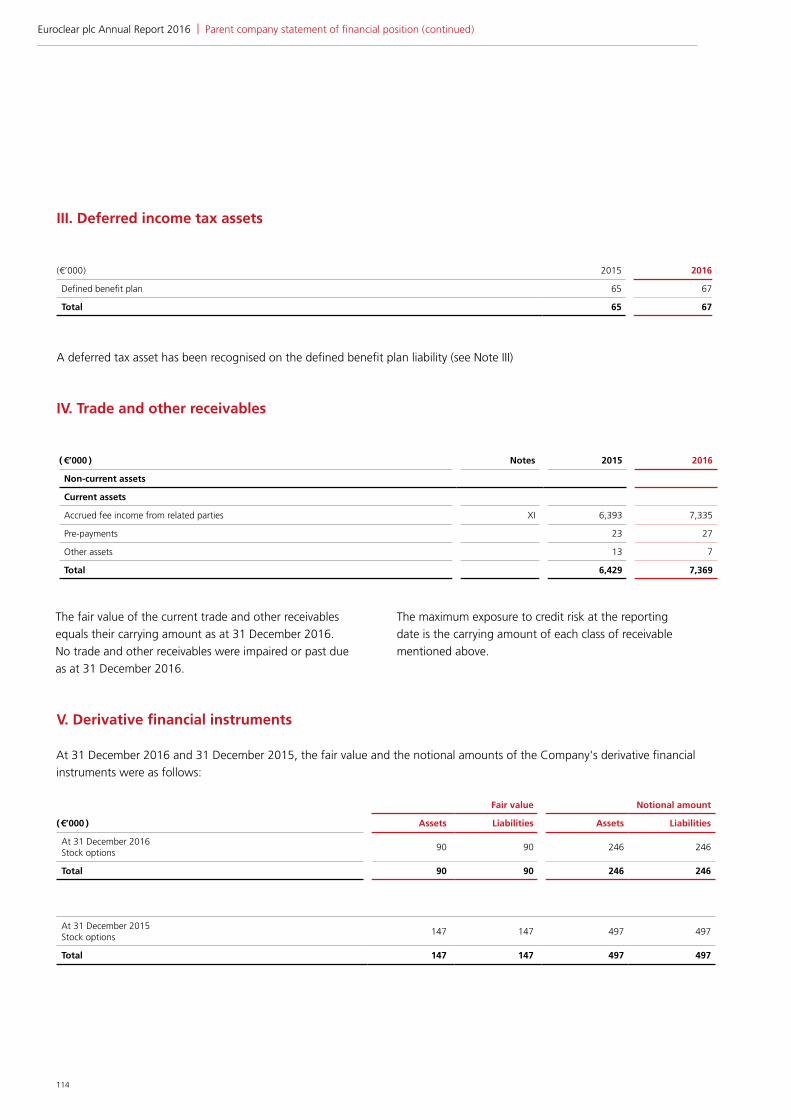
114
The fair value of the current trade and other receivables equals their carrying amount as at 31 December 2016.No trade and other receivables were impaired or past due as at 31 December 2016.
The maximum exposure to credit risk at the reporting date is the carrying amount of each class of receivable mentioned above.
IV. Trade and other receivables
( €’000 ) Notes 2015 2016
Non-current assets
Current assets
Accrued fee income from related parties XI 6,393 7,335
Pre-payments 23 27
Other assets 13 7
Total 6,429 7,369
V. Derivative financial instruments
At 31 December 2016 and 31 December 2015, the fair value and the notional amounts of the Company's derivative financial instruments were as follows:
Fair value Notional amount
( €’000 ) Assets Liabilities Assets Liabilities
At 31 December 2016 Stock options
90 90 246 246
Total 90 90 246 246
At 31 December 2015 Stock options
147 147 497 497
Total 147 147 497 497
| Parent company statement of financial position ( continued )Euroclear plc Annual Report 2016
A deferred tax asset has been recognised on the defined benefit plan liability (see Note III)
( €’000 ) 2015 2016
Defined benefit plan 65 67
Total 65 67
III. Deferred income tax assets

115
All derivatives are classified as a current asset or liability held for trading as at 31 December 2016 and 31 December 2015.
The maximum exposure to credit risk at the reporting date is the fair value of the derivative assets on the balance sheet.
The Belgian-based members of the Euroclear SA / NV and Euroclear Bank Management Committees and certain members of Senior Management participate in a stock option scheme (not involving shares of any Euroclear group company) managed by the Board of Directors of Euroclear plc.
VI. Share capital
VII. Other reserves
For details, see Note XXI to the Euroclear plc consolidated financial statements.
Other reserves include €1,176,940,000 previously classified as a merger reserve under UK Generally Accepted Accounting Principles (GAAP). Since merger relief accounting is no longer
permitted under IFRS, this amount is now classified under Other reserves. The remaining €22,267,000 relates to the acquisition of Euroclear Belgium in 2006.
( €’000 )Non- distributable
capital reserveForeign currency
translation reserveOther
reserves Total
At 1 January 2016 10,752 ( 2,111 ) 1,199,207 1,207,848
At 31 December 2016 10,752 ( 2,111 ) 1,199,207 1,207,848
At 1 January 2015 10,752 ( 2,111 ) 1,199,207 1,207,848
At 31 December 2015 10,752 ( 2,111 ) 1,199,207 1,207,848
VIII. Pension deficit
The plan relates to annuity pensions payable to the spouse of a former Executive Secretary.
( €’000 ) 2015 2016
Defined benefit plan 448 461
Total 448 461
IX. Trade and other payables
( €’000 ) Notes 2015 2016
Amounts due to related parties XI 920 4
Social security and other taxes 84 92
Accruals and deferred income 153 75
Other liabilities 68 202
Total 1,225 373
| Parent company statement of financial position ( continued ) Euroclear plc Annual Report 2016

116
X. Contingent liabilities and commitments
The Company has contractually committed to make a liquidity facility of up to €20,000,000 available to Euroclear SA / NV.
No amount has been drawn on this facility.
Commitments ( contract amount ) ( €’000 ) Notes 2015 2016
Liquidity facility provided to subsidiary – one year or less XII 20,000 20,000
XI. Related-party transactions
Euroclear plc is the ultimate parent and the controlling party of the Euroclear group. Investments in its subsidiaries are set out in Note II.
The following is a summary of the balances relating to transactions with Euroclear plc's subsidiaries included in its financial statements:
( €’000 ) Notes 2015 2016
Assets
Non-current assets 1,562,921 1,562,921
Investment in subsidiaries II 1,562,921 1,562,921
Current assets 6,401 7,344
Trade and other receivables IV 6,393 7,335
Loans and deposits 8 9
Total assets 1,569,322 1,570,265
Liabilities
Current liabilities
Trade and other payables IX 920 192
Borrowings – 100,000
Total liabilities 920 100,192
Income statement
Revenues 25,688 27,285
Administrative expenses ( 2,777 ) ( 2,039 )
Other income – 131,400
Finance income 211,699 87,459
Total income statement 234,610 244,105
Off-balance sheet
Liquidity facility provided X 20,000 20,000
Total off-balance sheet 20,000 20,000
Further details of the transactions with related parties and of key management compensation are provided overleaf.
| Parent company statement of financial position ( continued )Euroclear plc Annual Report 2016
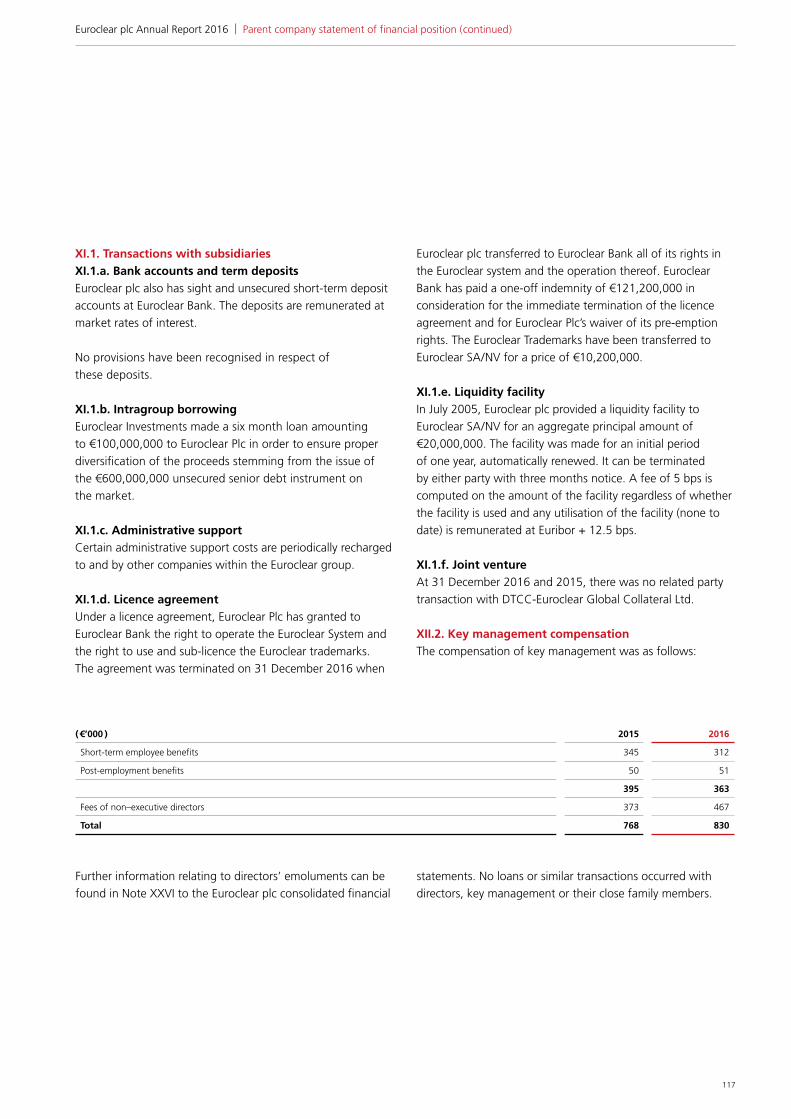
117
XI.1. Transactions with subsidiariesXI.1.a. Bank accounts and term depositsEuroclear plc also has sight and unsecured short-term deposit accounts at Euroclear Bank. The deposits are remunerated at market rates of interest.
No provisions have been recognised in respect of these deposits.
XI.1.b. Intragroup borrowingEuroclear Investments made a six month loan amounting to €100,000,000 to Euroclear Plc in order to ensure proper diversification of the proceeds stemming from the issue of the €600,000,000 unsecured senior debt instrument on the market.
XI.1.c. Administrative supportCertain administrative support costs are periodically recharged to and by other companies within the Euroclear group.
XI.1.d. Licence agreementUnder a licence agreement, Euroclear Plc has granted to Euroclear Bank the right to operate the Euroclear System and the right to use and sub-licence the Euroclear trademarks. The agreement was terminated on 31 December 2016 when
Euroclear plc transferred to Euroclear Bank all of its rights in the Euroclear system and the operation thereof. Euroclear Bank has paid a one-off indemnity of €121,200,000 in consideration for the immediate termination of the licence agreement and for Euroclear Plc’s waiver of its pre-emption rights. The Euroclear Trademarks have been transferred to Euroclear SA / NV for a price of €10,200,000.
XI.1.e. Liquidity facilityIn July 2005, Euroclear plc provided a liquidity facility to Euroclear SA / NV for an aggregate principal amount of €20,000,000. The facility was made for an initial period of one year, automatically renewed. It can be terminated by either party with three months notice. A fee of 5 bps is computed on the amount of the facility regardless of whether the facility is used and any utilisation of the facility (none to date) is remunerated at Euribor + 12.5 bps.
XI.1.f. Joint ventureAt 31 December 2016 and 2015, there was no related party transaction with DTCC-Euroclear Global Collateral Ltd.
XII.2. Key management compensationThe compensation of key management was as follows:
( €’000 ) 2015 2016
Short-term employee benefits 345 312
Post-employment benefits 50 51
395 363
Fees of non–executive directors 373 467
Total 768 830
Further information relating to directors’ emoluments can be found in Note XXVI to the Euroclear plc consolidated financial
statements. No loans or similar transactions occurred with directors, key management or their close family members.
| Parent company statement of financial position ( continued ) Euroclear plc Annual Report 2016

118
XII. Events after the balance sheet date
XII.1. Proposed dividendOn 23 February 2017, the directors resolved to propose a dividend in respect of the financial year ending 31 December 2016 of €37.00 (2015: €36.30) per equity share, which will distribute €119,446,000 (2015: €117,186,000) of
shareholders' equity. The dividend will be paid on 22 May 2017 to shareholders on the register on 23 March 2017.On 23 February 2017, the directors resolved to propose to return €58,000,000 profit to shareholders via a share buy-back.
| Parent company statement of financial position ( continued )Euroclear plc Annual Report 2016

119
Independent auditor’s report
Report on the financial statements
Our opinion In our opinion, Euroclear plc’s financial statements ( the “financial statements” ):
• give a true and fair view of the state of the company’s affairs as at 31 December 2016 and of its profit and cash flows for the year then ended;
• have been properly prepared in accordance with International Financial Reporting Standards ( “IFRSs” ) as adopted by the European Union; and
• have been prepared in accordance with the requirements of the Companies Act 2006.
What we have audited The financial statements, included within the Annual report, comprise:
• the parent company statement of financial position as at 31 December 2016;
• the Statement of cash flows for the year then ended;
• the Statement of changes in equity for the year then ended; and
• the notes to the financial statements, which include a summary of significant accounting policies and other explanatory information.
The financial reporting framework that has been applied in the preparation of the financial statements is IFRSs as adopted by the European Union, and applicable law.
In applying the financial reporting framework, the directors have made a number of subjective judgements, for example in respect of significant accounting estimates. In making such estimates, they have made assumptions and considered future events.
Opinion on other matter prescribed by the Companies Act 2006
In our opinion, based on the work undertaken in the course of the audit:
• the information given in the Strategic Report and the Directors’ Report for the financial year for which the financial statements are prepared is consistent with the financial statements; and
• the Strategic Report and the Directors’ Report have been prepared in accordance with applicable legal requirements.
In addition, in light of the knowledge and understanding of the company and its environment obtained in the course of the audit, we are required to report if we have identified any material misstatements in the Strategic Report and the Directors’ Report. We have nothing to report in this respect.
Other matters on which we are required to report by exception
Adequacy of accounting records and information and explanations receivedUnder the Companies Act 2006 we are required to report to you if, in our opinion:
• we have not received all the information and explanations we require for our audit; or
• adequate accounting records have not been kept by the parent company, or returns adequate for our audit have not been received from branches not visited by us; or
• the financial statements are not in agreement with the accounting records and returns.
We have no exceptions to report arising from this responsibility.
Directors’ remuneration Under the Companies Act 2006 we are required to report to you if, in our opinion, certain disclosures of directors’ remuneration specified by law are not made. We have no exceptions to report arising from this responsibility.
Responsibilities for the financial statements and the audit
Our responsibilities and those of the directors As explained more fully in the Statement of directors’ responsibilities set out on page 39, the directors are responsible for the preparation of the financial statements and for being satisfied that they give a true and fair view.
Our responsibility is to audit and express an opinion on the financial statements in accordance with applicable law and International Standards on Auditing (UK and Ireland) (“ISAs (UK & Ireland)”). Those standards require us to comply with the Auditing Practices Board’s Ethical Standards for Auditors.This report, including the opinions,
to the members of Euroclear plc
| Independent auditor’s reportEuroclear plc Annual Report 2016

120
has been prepared for and only for the company’s members as a body in accordance with Chapter 3 of Part 16 of the Companies Act 2006 and for no other purpose. We do not, in giving these opinions, accept or assume responsibility for any other purpose or to any other person to whom this report is shown or into whose hands it may come save where expressly agreed by our prior consent in writing.
What an audit of financial statements involves We conducted our audit in accordance with ISAs (UK & Ireland). An audit involves obtaining evidence about the amounts and disclosures in the financial statements sufficient to give reasonable assurance that the financial statements are free from material misstatement, whether caused by fraud or error. This includes an assessment of:
• whether the accounting policies are appropriate to the company’s circumstances and have been
consistently applied and adequately disclosed;
• the reasonableness of significant accounting estimates made by the directors; and
• the overall presentation of the financial statements.
We primarily focus our work in these areas by assessing the directors’ judgements against available evidence, forming our own judgements, and evaluating the disclosures in the financial statements.
We test and examine information, using sampling and other auditing techniques, to the extent we consider necessary to provide a reasonable basis for us to draw conclusions. We obtain audit evidence through testing the effectiveness of controls, substantive procedures or a combination of both.
In addition, we read all the financial and non-financial information in the Annual Report to identify material inconsistencies with the audited financial statements and to identify any information that is apparently materially incorrect based on, or materially inconsistent with, the knowledge acquired by us in the course of performing the audit. If we become aware of any apparent material misstatements or inconsistencies we consider the implications for our report.
Henry Daubeney ( Senior Statutory Auditor ) for and on behalf of PricewaterhouseCoopers LLP Chartered Accountants and Statutory Auditors London 27 February 2017
| Independent auditor’s report ( continued )Euroclear plc Annual Report 2016

121

euroclear.com
© 2017 Euroclear SA / NV, 1 Boulevard du Roi Albert II,1210 Brussels, Belgium, Tel: +32 (0)2 326 1211 – RPM Brussels number 0423 747 369.Euroclear is the marketing name for the Euroclear System, Euroclear plc, Euroclear SA / NV and their affiliates. All rights reserved. The information and materials contained in this document are protected by intellectual property or other proprietary rights. All information contained herein is provided for information purposes only and does not constitute any recommendation, offer or invitation to engage in any investment, financial or other activity. We exclude to the fullest extent permitted by law all conditions, guarantees, warranties and / or representations of any kind with regard to your use of any information contained in this document. You may not use, publish, transmit, or otherwise reproduce this document or any information contained herein in whole or in part unless we have given our prior written consent. Your use of any products or services described herein shall be subject to our acceptance in accordance with the eligibility criteria determined by us.
Euroclear is a carbon neutral company – PAS2060 certified • MA3968 – 2017
Top Related