


![Acid Promoted Radical-Chain Difunctionalization of …4 Optimization of reaction conditions[a] Entry Oxidant Equiv. Acid Equiv. Additive T/ C Yield (%)[b] 1 BPO (1.5 equiv.) HCl (aq.,](https://static.fdocuments.us/doc/165x107/5f1cbe1099fd92028a750a29/acid-promoted-radical-chain-difunctionalization-of-4-optimization-of-reaction-conditionsa.jpg)
![Reductive Amination SI[11] · An oven-dried 4 mL reaction vessel was charged with 2-naphthaldehyde 1a (1.0 mmol, 1.0 equiv), acid catalyst (0.1 equiv), H 2O (5.0 equiv) and DMF 2a](https://static.fdocuments.us/doc/165x107/605e1d4729d0ca7a6c1c7100/reductive-amination-si11-an-oven-dried-4-ml-reaction-vessel-was-charged-with-2-naphthaldehyde.jpg)

Languages
Pages
Legal


EU Market Situation for
Eggs
Committee for the Common Organisation
of the Agricultural Markets
23 October 2014
DG AGRI C3 23 October 2014
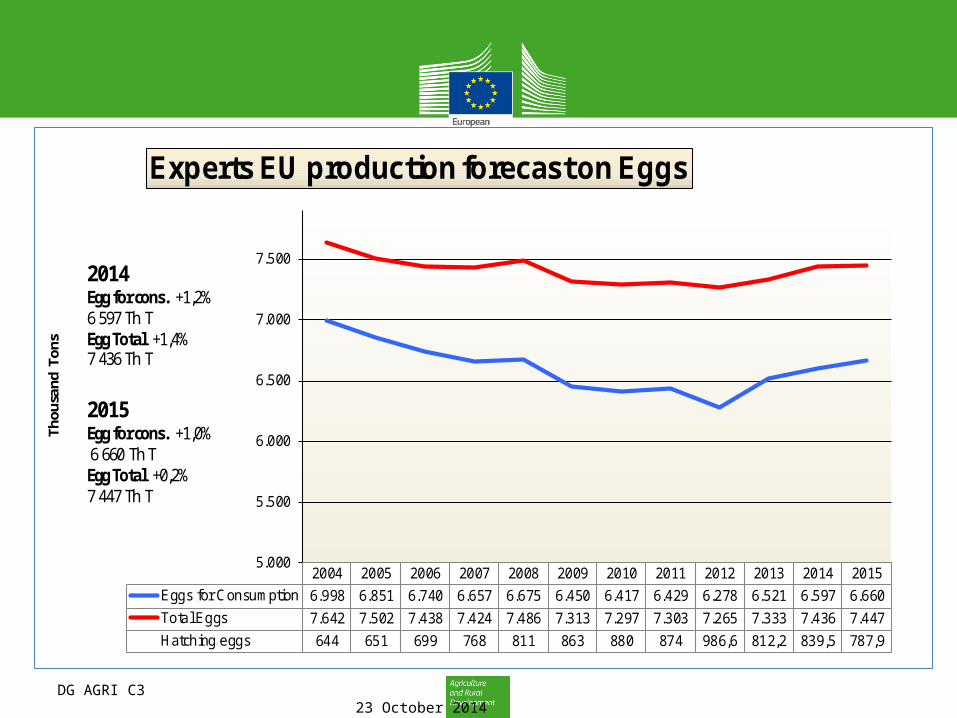
2004 2005 2006 2007 2008 2009 2010 2011 2012 2013 2014 2015
Eggs for Consumption 6.998 6.851 6.740 6.657 6.675 6.450 6.417 6.429 6.278 6.521 6.597 6.660
Total Eggs 7.642 7.502 7.438 7.424 7.486 7.313 7.297 7.303 7.265 7.333 7.436 7.447
Hatching eggs 644 651 699 768 811 863 880 874 986,6 812,2 839,5 787,9
5.000
5.500
6.000
6.500
7.000
7.500
Thou
sand
Ton
s
Experts EU production forecast on Eggs
2014Egg for cons. +1,2%6 597 Th TEgg Total +1,4%7 436 Th T
2015Egg for cons. +1,0% 6 660 Th TEgg Total +0,2% 7 447 Th T

DG AGRI C3 23 October 2014
0
200
400
600
800
1 000
BE BG CZ DK DE EE EL ES FR IE IT CY LV LT HU MT NL AT PL PT RO SI SK FI SE UK
Qty
in 1
000 t
on
nes
Experts EU production forecast of Eggs for consumption2014: 6 596.7 Th T ( + 1.2 %) & 2015: 6 659.5 Th T ( + 0.5 %)
2012 2013 2014 2015
DE : 0.6%
NL : 0.6% UK :
2.8%
HU : -3.7%
FI : 1.5%
IT : 1.3%
FR : -2.9%
SK : 0.3%
RO : 0.0%
PT : 0.0%
IE : 0.0%
DK : 0.0%
BG : 2.4%
ES : 8.5%

DG AGRI C3 23 October 2014
0
200
400
600
800
1 000
BE BG CZ DK DE EE EL ES FR IE IT CY LV LT HU MT NL AT PL PT RO SI SK FI SE UK
Qty
in 1
000 t
on
nes
Experts EU production forecast of Total Eggs(Eggs in shell + Hatching Eggs)
2014: 7 436.2 Th T ( + 1.4%) & 2015: 7 447.4 ThT ( + 0.2%)
2013 2014 2015 2015
DE : 0.6%
HU : -2.9%
NL : 0.5%
FI : 1.5%
UK : 2.8%
IT : 1.2%
SK : 0.4%
RO : 0.0%
PT : 0.0%
IE : 0.0%
FR : -2.7%
DK : 0.0%
BG : 2.2%
ES : 0.0%

DG AGRI C3 23 October 2014
0
100
200
300
BE BG CZ DK DE EE EL ES FR IE IT CY LV LT HU MT NL AT PL PT RO SI SK FI SE UK
Qty
in 1
000 t
on
nes
Experts EU production forecast of Hatching Eggs2014: 839.5 Th T ( +3.4 %) & 2015: 842.9 Th T ( + 0.4 %)
2012 2013 2014 2015
HU : 2.4%
UK : 2.9%
SK : 1.4%
RO : 0.0%
FI : 0.0%
PT : 0.0%
NL : 0.0%
IT : 0.0%
IE : 0.0%
FR : 0.0%
DE : 0.0%
DK : 0.0%
BG : 0.0%

85
105
125
145
165
185
1 4 7 10 13 16 19 22 25 28 31 34 37 40 43 46 49 52
€u
ro/
10
0k
g
Evolution of the weekly EU average price for Class A eggs in packing stations
Moy.09-13 2011 2012 2013 2014
DG AGRI C3 23 October 2014
DG AGRI C3 23 October 2014
0
7.500
15.000
22.500
30.000
37.500
| 2010 | 2011 | 2012 | 2013 | 2014 |
1.0
00 p
.
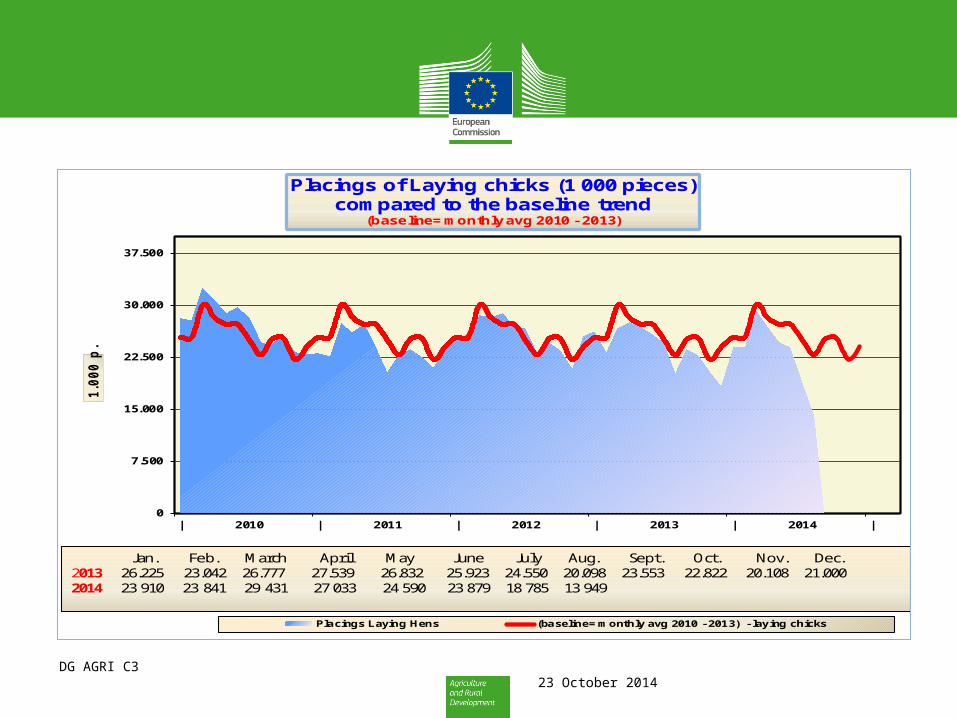
Placings of Laying chicks (1 000 pieces)compared to the baseline trend
(baseline= monthly avg 2010 - 2013)
Placings Laying Hens (baseline= monthly avg 2010 - 2013) - laying chicks
Jan. Feb. March April May June July Aug. Sept. Oct. Nov. Dec.2013 26.225 23.042 26.777 27.539 26.832 25.923 24.550 20.098 23.553 22.822 20.108 21.000 2014 23 910 23 841 29 431 27 033 24 590 23 879 18 785 13 949
DG AGRI C3 23 October 2014
0
40
80
120
160
0
1.500
3.000
4.500
6.000
7.500
9.000
| 2010 | 2011 | 2012 | 2013 | 2014 |
Pric
e €u
ro/1
00kg
Mio
p.
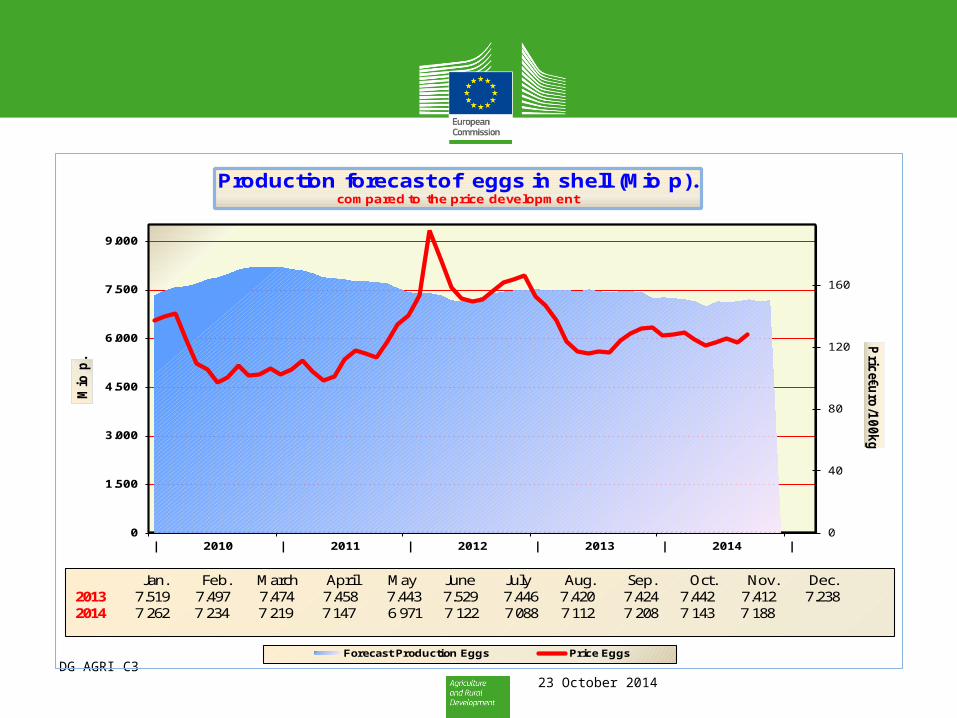
Production forecast of eggs in shell (Mio p).compared to the price development
Forecast Production Eggs Price Eggs
Jan. Feb. March April May June July Aug. Sep. Oct. Nov. Dec.2013 7.519 7.497 7.474 7.458 7.443 7.529 7.446 7.420 7.424 7.442 7.412 7.238 2014 7 262 7 234 7 219 7 147 6 971 7 122 7 088 7 112 7 208 7 143 7 188
DG AGRI C3 23 October 2014
40,00
65,00
90,00
115,00
140,00
165,00
190,00
| 10 | 11 | 12 | 13 | 14 |
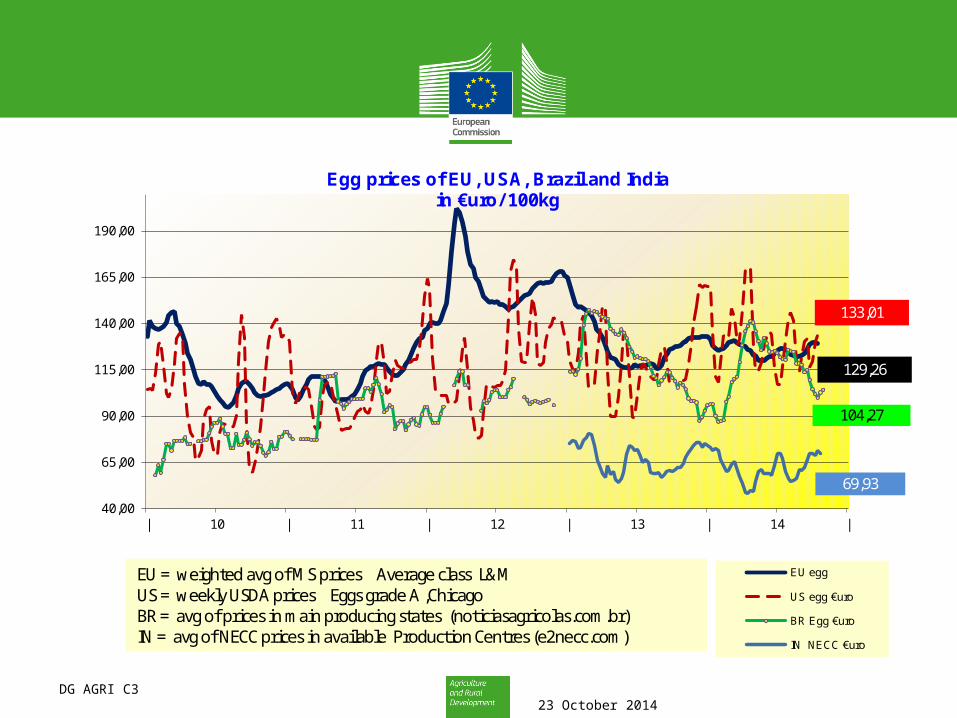
Egg prices of EU, USA, Brazil and Indiain €uro/ 100kg
EU egg
US egg €uro
BR Egg €uro
IN NECC €uro
69,93
129,26
104,27
133,01
EU = weighted avg of MS prices Average class L&MUS = weekly USDA prices Eggs grade A ,ChicagoBR = avg of prices in main producing states (noticiasagricolas.com.br)IN = avg of NECC prices in available Production Centres (e2necc.com)
DG AGRI C3 23 October 2014
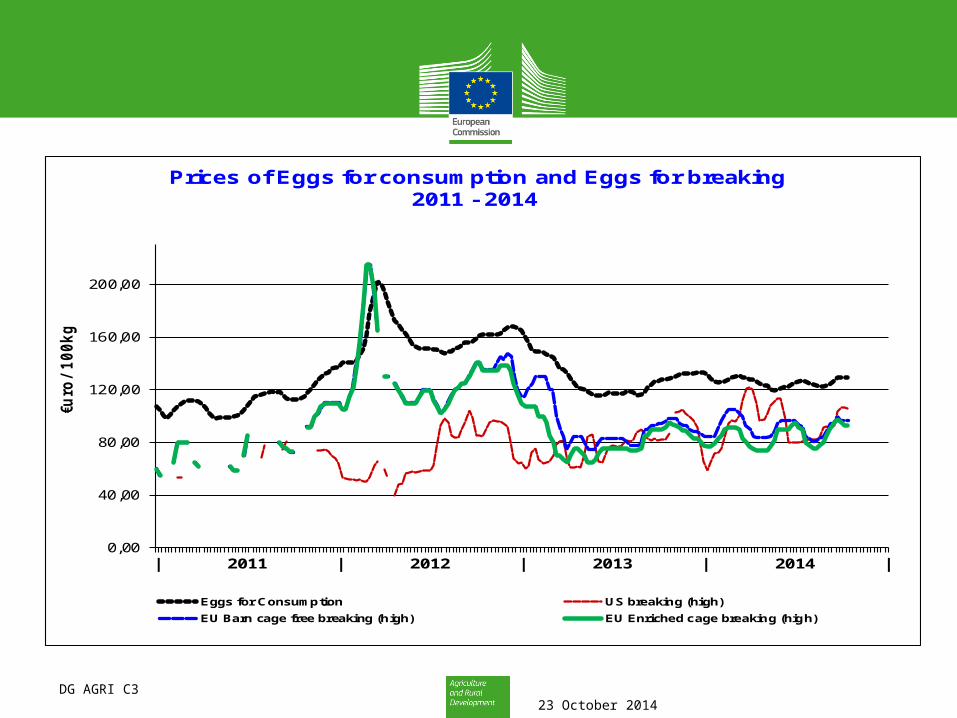
0,00
40,00
80,00
120,00
160,00
200,00
| 2011 | 2012 | 2013 | 2014 |
€uro
/ 100kg
Prices of Eggs for consumption and Eggs for breaking 2011 - 2014
Eggs for Consumption US breaking (high)
EU Barn cage free breaking (high) EU Enriched cage breaking (high)

DG AGRI C3 23 October 2014
0,0
40,0
80,0
120,0
160,0
200,0
240,0
1|
5 9 13 17 21 252012
29 33 37 41 45 49 1|
5 9 13 17 21 252013
29 33 37 41 45 49 1|
5 9 13 17 21 252014
29 33 37 41 45 49 1|
€/10
kg
Maximum weekly prices for individual egg products in the EU and the USA in €/10kg
whole plain EU Yolk EU Albumen Spray EU
whole plain US Yolk US Albumen Spray US
DG AGRI C3 23 October 2014
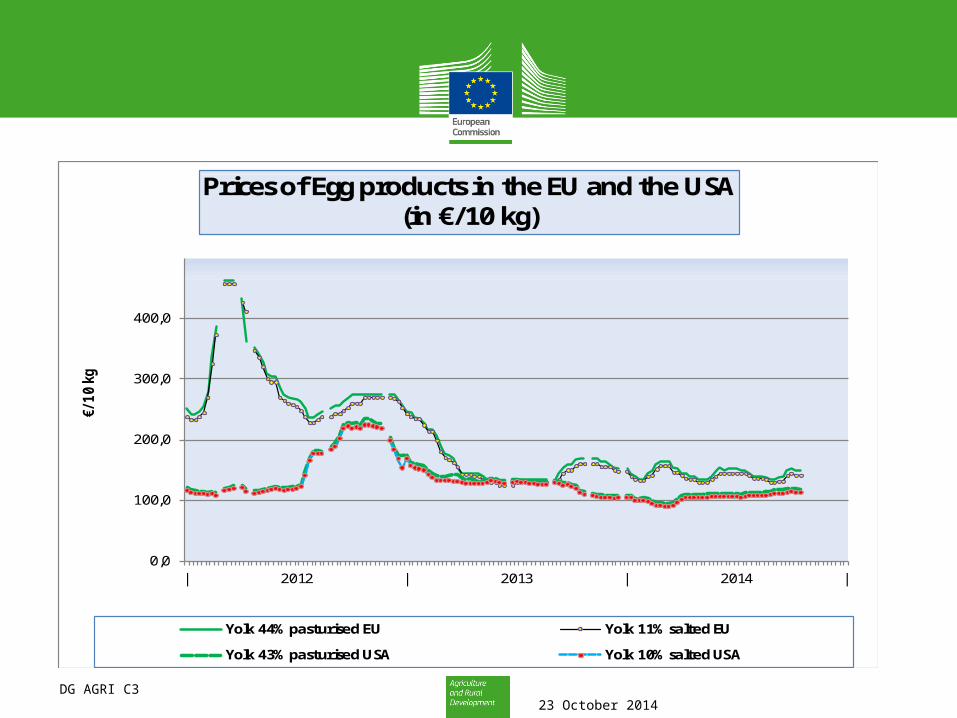
0,0
100,0
200,0
300,0
400,0
| 2012 | 2013 | 2014 |
€/1
0 k
g
Prices of Egg products in the EU and the USA(in €/10 kg)
Yolk 44% pasturised EU Yolk 11% salted EU
Yolk 43% pasturised USA Yolk 10% salted USA

DG AGRI C3 23 October 2014
0
30
60
90
120
150
180
04 05 06 07 08 09 10 11 12 13 ja fe mr ap ma jn jl au se oc no de
Euro
/ 10
0kg
Margin between Feed cost and Egg price in Egg production
marge
Marge 2009 - 2013
feed
egg
DG AGRI C3 23 October 2014
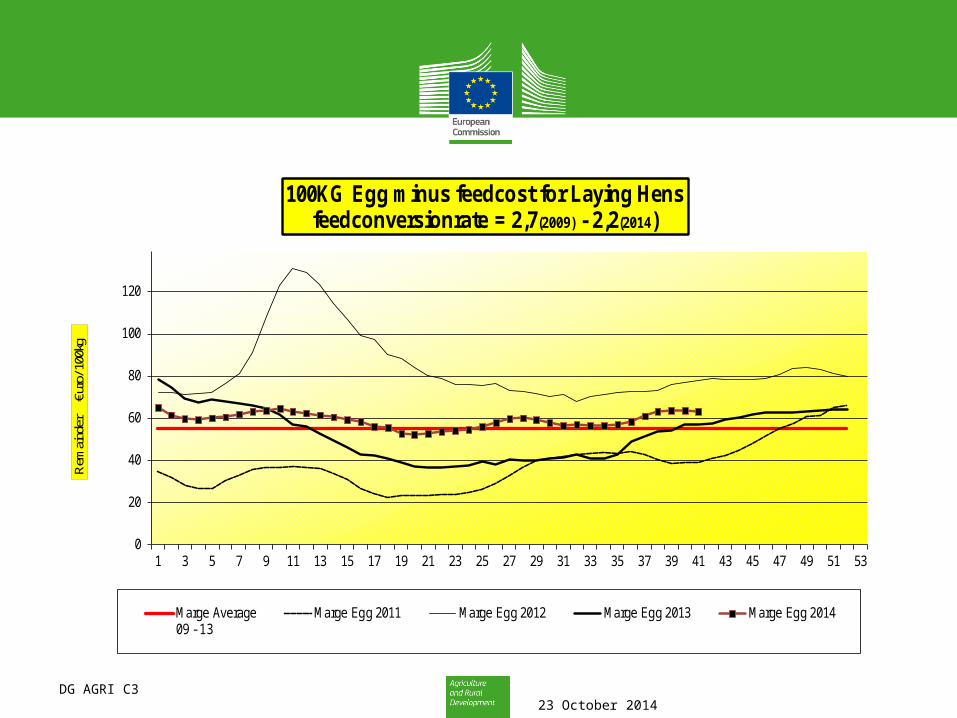
0
20
40
60
80
100
120
1 3 5 7 9 11 13 15 17 19 21 23 25 27 29 31 33 35 37 39 41 43 45 47 49 51 53
Rem
aind
er
€uro
/ 100
kg
100KG Egg minus feedcost for Laying Hensfeedconversionrate = 2,7(2009) - 2,2(2014)
Marge Average09 - 13
Marge Egg 2011 Marge Egg 2012 Marge Egg 2013 Marge Egg 2014

DG AGRI C3 23 October 2014
EU Imports of Eggs:Trade Figures (Comext – tonnes egg equiv.) not incl. Hatching eggs
Compared
tonnes % tonnes % tonnes % tonnes % tonnes % to Jan-Aug 13
India 3.211 9,4% 1.554 7,5% 3.657 9,7% 3.856 18,9% 3.566 44,4% + 60,8%
USA 14.009 40,9% 5.960 28,6% 15.183 40,2% 6.853 33,5% 2.376 29,6% - 56%
Argentina 7.937 23,2% 8.115 39,0% 10.162 26,9% 5.734 28,0% 835 10,4% - 81%
Norw ay 1.722 5,0% 1.502 7,2% 1.474 3,9% 1.969 9,6% 798 9,9% - 46%
Sw itzerland 337 1,0% 342 1,6% 332 0,9% 355 1,7% 329 4,1% + 56%
Israel 941 2,7% 547 2,6% 1.393 3,7% 349 1,7% 100 1,2% - 55%
Others 6.087 0,2% 2.787 0,0% 5.528 0,0% 1.338 0,0% 32 0,4%
EXTRA EU 28 34.244 20.806 37.729 20.454 8.037
% change - 39% + 81% - 46% - 47,1%
2010 2011 2012 Jan-Aug 142013

DG AGRI C3 23 October 2014
EU Egg Imports
1.603 2.218 3.566
11.846
5.370 2.376
4.662
1.467
132
27.848
15.204
8.037
0
5.000
10.000
15.000
20.000
25.000
30.000
Jan-Aug 12 Jan-Aug 13 Jan-Aug 14
Total EU Import of Eggs - not incl. Hatching eggs
(Tonnes eggs equiv)
India USA Argentina Norway Switzerland Other destinations
2.157 2.594 3.316
18.603
12.1028.123
4.196
181
32.655
22.208
13.375
0
5.000
10.000
15.000
20.000
25.000
30.000
35.000
Jan-Aug 12 Jan-Aug 13 Jan-Aug 14
Total EU Import of Eggs - not incl. Hatching eggs
(1000 EUR)
India USA Argentina Norway Switzerland Other destinations
DG AGRI C3 23 October 2014
Ch
ina
+ H
. K
on
g
Ch
ina
+ H
. K
on
g
Sin
gap
ore
(u
p t
o J
ul)
Sin
gap
ore
(u
p t
o J
ul)
Me
xico
(u
p t
o J
ul)
Me
xico
(u
p t
o J
ul)
Swit
zerl
and
Swit
zerl
and
Jap
an Jap
an
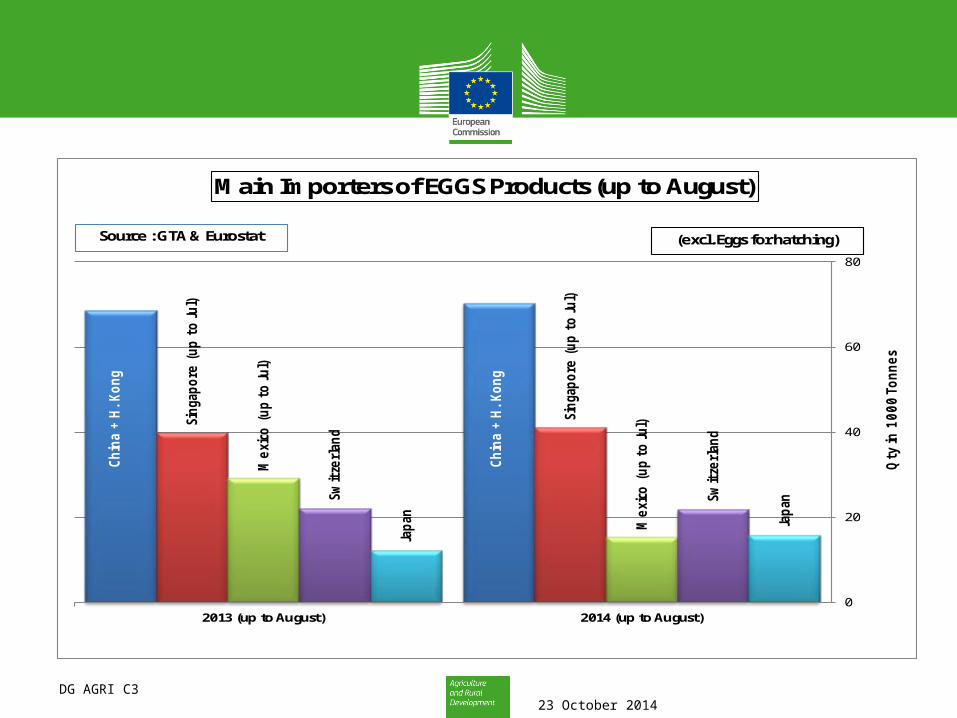
0
20
40
60
80
2013 (up to August) 2014 (up to August)
Qty
in 1
00
0 T
on
ne
s
Main Importers of EGGS Products (up to August)
Source : GTA & Eurostat (excl. Eggs for hatching)

DG AGRI C3 23 October 2014
EU Exports of Eggs:Trade Figures (Comext – tonnes egg equiv.) not incl. Hatching eggs
Compared
tonnes % tonnes % tonnes % tonnes % tonnes % to Jan-Aug 13
Japan 52.923 29% 66.357 31% 66.938 36% 64.527 30% 51.763 36% + 30,5%
Sw itzerland 45.072 25% 42.168 19% 41.893 23% 42.086 20% 25.467 17% - 8%
U.A.Emirates 5.888 3% 8.262 4% 1.674 1% 10.450 5% 4.487 3% - 20%
Iraq 20 0% 1.552 1% 1.139 1% 7.741 4% 5.531 4% +++
Russia 5.293 3% 4.947 2% 5.982 3% 10.539 5% 4.773 3% - 33%
Angola 10.414 6% 17.524 8% 17.109 9% 12.906 6% 8.074 6% - 17%
Equat.Guinea 1.487 1% 1.945 1% 1.632 1% 2.215 1% 1.736 1% + 3%
Secr.Extra 2.164 1% 1.148 1% 2.638 1% 8.262 4% 2.267 2% - 52%
Israel 1.308 1% 2.654 1% 1.060 1% 936 0% 2.197 2% +++
Thailand 6.180 3% 7.254 3% 6.409 3% 5.919 3% 3.392 2% - 18%
Taiw an 7.145 4% 7.941 4% 4.626 2% 3.412 2% 1.823 1% - 31%
Others 43.825 24% 55.353 25% 34.694 19% 45.623 21% 34.229 23%
EXTRA EU 28 181.719 217.105 185.793 214.617 145.738
% change + 19% - 14% + 16% + 8,4%
2010 2011 2012 Jan-Aug 142013

DG AGRI C3 23 October 2014
EU Egg Exports
44.845 39.66151.763
27.68627.622
25.467
35.351 48.87750.130
124.502134.400
145.738
0
20.000
40.000
60.000
80.000
100.000
120.000
140.000
160.000
Jan-Aug 12 Jan-Aug 13 Jan-Aug 14
Total EU Export of Eggs not incl. hatching eggs (T. eggs equiv.)
Japan Switzerland Angola Iraq Russia Other origins
37.549 40.97256.363
41.05946.387
36.267
8.601
43.973
59.46463.635
142.974
166.949176.715
0
20.000
40.000
60.000
80.000
100.000
120.000
140.000
160.000
180.000
200.000
Jan-Aug 12 Jan-Aug 13 Jan-Aug 14
Total EU Export of Eggs not incl. hatching eggs (1000 EUR)
Japan Switzerland Angola Iraq Russia Other origins
DG AGRI C3 23 October 2014
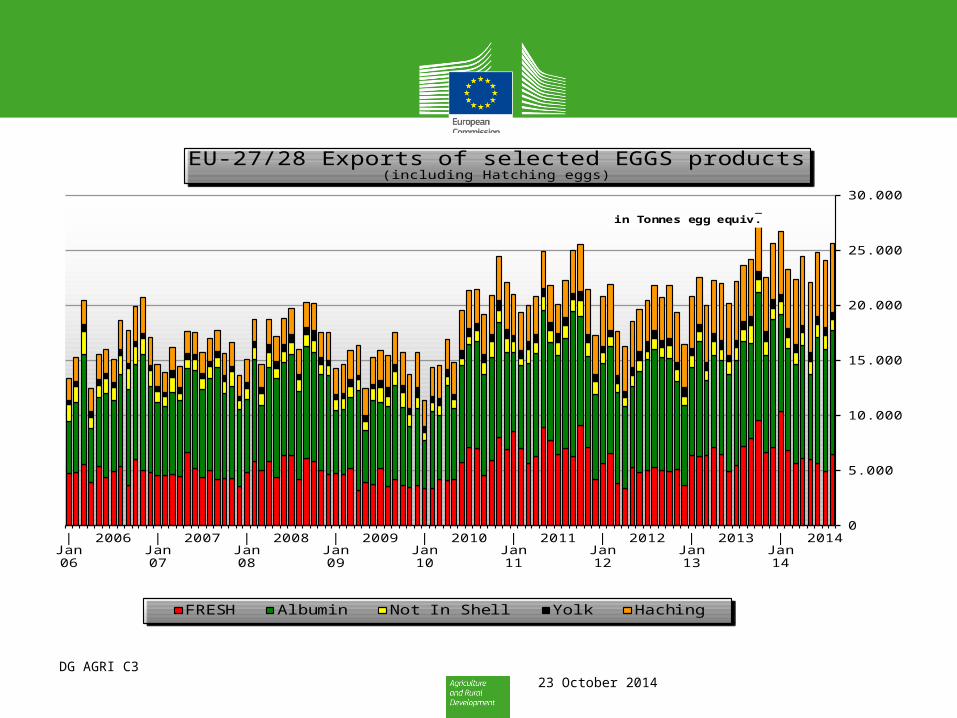
0
5.000
10.000
15.000
20.000
25.000
30.000
|Jan06
2006 |Jan07
2007 |Jan08
2008 |Jan09
2009 |Jan10
2010 |Jan11
2011 |Jan12
2012 |Jan13
2013 |Jan14
2014
in Tonnes egg equiv.
EU-27/28 Exports of selected EGGS products (including Hatching eggs)
FRESH Albumin Not In Shell Yolk Haching
DG AGRI C3 23 October 2014
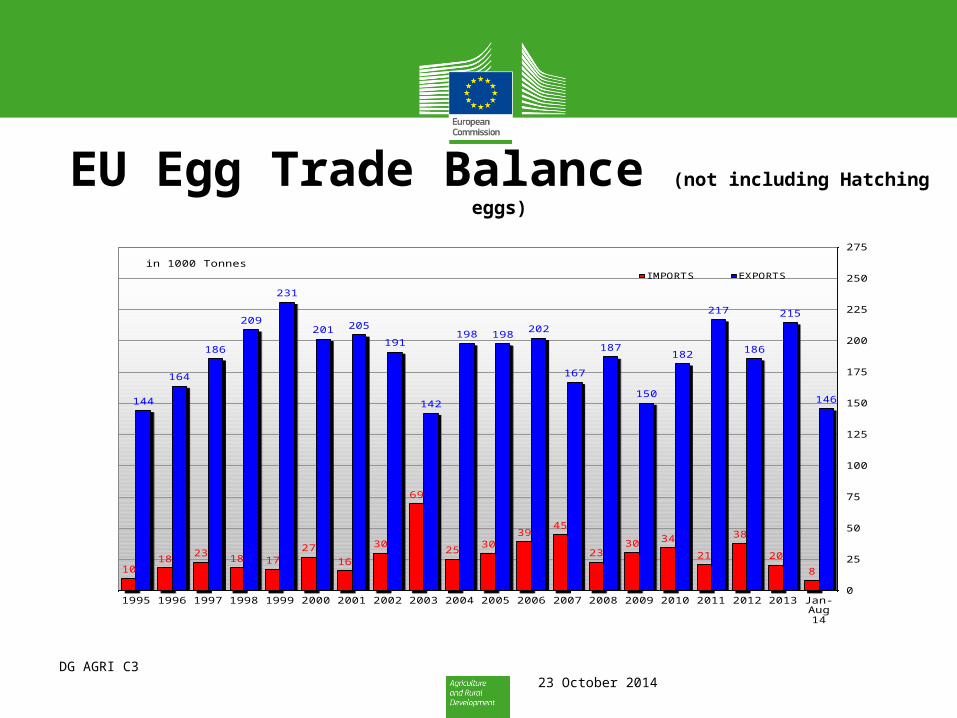
EU Egg Trade Balance (not including Hatching eggs)
1018
2318 17
27
16
30
69
2530
3945
2330 34
21
38
20
8
144
164
186
209
231
201 205
191
142
198 198202
167
187
150
182
217
186
215
146
0
25
50
75
100
125
150
175
200
225
250
275
1995 1996 1997 1998 1999 2000 2001 2002 2003 2004 2005 2006 2007 2008 2009 2010 2011 2012 2013 Jan-Aug14
in 1000 TonnesIMPORTS EXPORTS
DG AGRI C3 23 October 2014
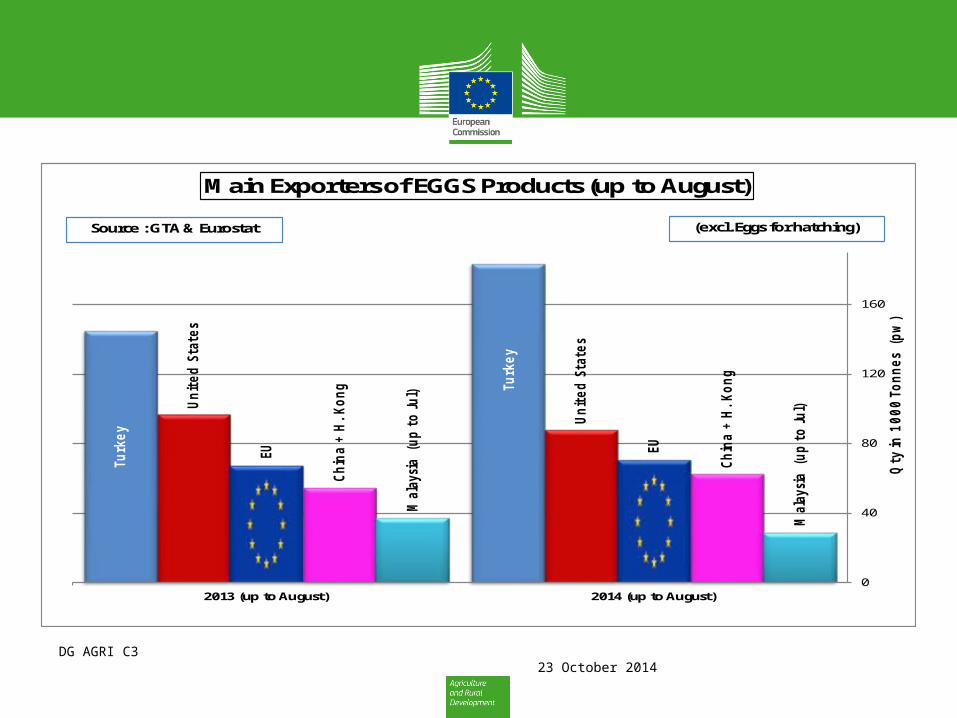
Tu
rke
y
Tu
rke
y
Un
ite
d S
tate
s
Un
ite
d S
tate
s
EU EU
Ch
ina
+ H
. K
on
g
Ch
ina
+ H
. K
on
g
Ma
lay
sia
(u
p t
o J
ul)
Ma
lay
sia
(u
p t
o J
ul)
0
40
80
120
160
2013 (up to August) 2014 (up to August)
Qty
in
10
00
To
nn
es
(p
w)
Main Exporters of EGGS Products (up to August)
(excl. Eggs for hatching)Source : GTA & Eurostat
Top Related