


Languages
Pages
Legal

ETFS IN EUROPE - RECENT TRENDS AND THE CHALLENGES AHEAD
Detlef Glow
Head of Lipper EMEA Research
(ALL DATA AS OF MARCH, 31 2013)

ASSETS UNDER MANAGEMENT

ETFs - Assets Under Management (10/2005 – 03/2013)
180
200
220
240
260
280
300
320
ETFs in Europe - Assets under Management (in Billion Euro)
Equity Bond Real Estate Other Commodities Money Market
Source: Lipper
0
20
40
60
80
100
120
140
160
180

ETFs - Assets Under Management (03/2012 – 03/2013)
200
250
300
350Equity Bond Real Estate Other Commodities Money Market
Source: Lipper
0
50
100
150

Assets Under Management
�Assets under management grew by 38.89 billion euro
or 14.37% over the last twelve month (31.03.2012 –
31.03.2013) up to 309.48 billion euro.
Source: Lipper
�In Q1-2013 the assets under management grew by
4.36% or 12.92 billion euro.

Largest ETFs by Assets Under Management (31/03/13)
Name ISIN Code Lipper Global AuM in Million EUR
iShares DAX® (DE) DE0005933931 Equity Germany 13,767.62
iShares S&P 500 USD IE0031442068 Equity US 9,174.31
SPDR Dow Jones Industrial Average ETF Trust US78467X1090 Equity US 8,754.92
db x-trackers DAX UCITS ETF LU0274211480 Equity Germany 6,979.02
iShares Barclays 1-3 Year Treasury Bond Fund US4642874576 Bond USD Short Term 5,825.86
Market Vectors Gold Miners ETF US57060U1007 Equity Sector Gold&Prec Metals 5,790.90
Source: Lipper
Market Vectors Gold Miners ETF US57060U1007 Equity Sector Gold&Prec Metals 5,790.90
iShares MSCI Japan Index Fund US4642868487 Equity Japan 5,578.69
iShares MSCI Emerging Markets USD IE00B0M63177 Equity Emerging Mkts Global 5,540.33
iShares FTSE China 25 Index Fund US4642871846 Equity Greater China 5,262.20
iShares FTSE 100 GBP IE0005042456 Equity UK 4,603.65

Summary Assets Under Management
� The European ETF market is highly concentrated
� Only 54 of the 1782 ETFs hold assets above 1 billion EUR
� 32 equity funds
Source: Lipper
� 32 equity funds
� 11 bond funds
� 9 commodity funds (8 gold, 1 silver)
� 1 money market funds
� 1 real estate linked equity fund

Summary Assets Under Management
�The largest ETF (iShares DAX) holds 4.45% of overall AuM
�Top 10 ETFs account for 24.47% of overall AuM
Source: Lipper
�Top 54 ETFs account for 51.70% of overall AuM

MARKET STRUCTURE

ETFs in Europe by Fund Domiciles (31.03.2013)
Total Bond Equity Commodities Real Estate Money Market Other
Germany 115 30 78 1 3 2 1
France 372 48 260 8 8 3 45
Ire land 552 120 368 26 10 5 23
Luxembourg 579 77 341 29 10 17 105
Other 164 18 55 73 5 - 13
# 1782 293 1102 137 36 27 187
Germany6%
Other9%
Source: Lipper
France21%
Ireland31%
Luxembourg33%

ETFs in Europe – by Fund Type (31.03.2013)
800
1000
1200
14001330
Source: Lipper
0
200
400
600
Primaries
Non-Primaries
452

Market Share per Asset Type 31.03.2013
by Assets under Managementby Number of Funds
Equity62%
Other10%
Money Market2%
Commodities8%
Real Estate2%
Bond19%
Real Estate1% Other
3%
Money Market2%
Commodities9%
Source: Lipper
Bond16%
2%
Equity66%
9%
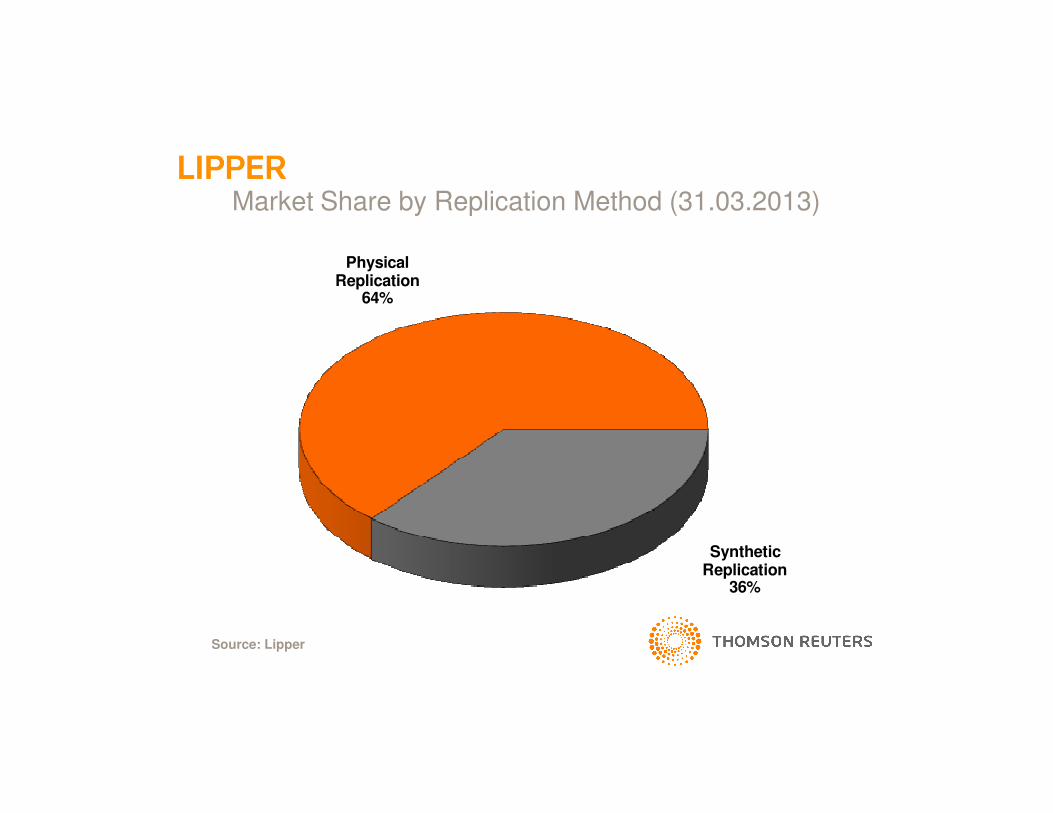
Market Share by Replication Method (31.03.2013)
Physical Replication
64%
Source: Lipper
Synthetic Replication
36%

Summary Market Structure
�Luxembourg and Ireland are the dominat domiciles for
ETFs followed by France.
�Opposite to other UCITS products, the number of
convenience share classes is low in the ETF segment.
Source: Lipper
convenience share classes is low in the ETF segment.
�Physical replication is the preferred replication method.
�The product mix by AuM follows the number of funds
(exception „other“ funds).

NEW FUND LAUNCHES Q1/2013

Monthly ETF Launches (01.01.2007 - 31.03.2013)
800
1000
1200
1400
1600
40
50
60
70
80
Su
m o
f N
ew
Fu
nd
s
New
Fu
nd
s p
er
Mo
nth
New Funds per Month Sum of New Funds
Source: Lipper
0
200
400
600
0
10
20
30 Su
m o
f N
ew
Fu
nd
s
New
Fu
nd
s p
er
Mo
nth

ETFs în Europe – New Launches per Quarter
60
80
100
120
Source: Lipper
0
20
40

New ETF Launches Q1 - 2013
Bond9%
Equity86%
Real Estate
Source: Lipper
Real Estate5%
n = 23

New ETFs – Assets under Management (in Million Euro)
200
250
300
350
400
450Equity Bond Real Estate Other Commodities Money Market
Source: Lipper
0
50
100
150
200

Summary Fund Launches
� The number of new launched ETFs in Q1 - 2013 is rather
small compared with the launching activity of fund
promoters over the last five years …
� … but as the number of fund launches has come down
Source: Lipper
� … but as the number of fund launches has come down
since Q3 – 2012 the launch pattern might have changed in
general.
� A reason for this can be seen in the low number of asset
classes which are not already covered by ETFs.

FOCUS Q1-2013: STRATEGY ETFS

ETFS WITH RISK CONTROLLED STRATEGIES

Risk Controlled Strategies
� Risk controlled strategies try to minimize the overall risk
(volatility) of an index (benchmark/portfolio) by using an
alternative approach for the weighting of the constituents
within the index.
Source: Lipper
� Minimum variance: Reduction of the overall risk of an
index, by excluding constituents with high volatility.
� Equal risk weighting: All constituents of the basis index are
weighted by their risk (volatility) contribution.

Timeline of Fund Launches
27
15
20
25
30
Number of New Products Sum
Source: Lipper
0
5
10
15

Assets Under Management (in Billion Euro)
0.4
0.5
0.6
0.7
0.8
Source: Lipper
0
0.1
0.2
0.3
0.4

Summary Risk Controlled Strategies
�Relatively new segment within the European ETF market.
�There are 27 products available – covering developed and
emerging markets with different strategies, e.g. minimum
Source: Lipper
emerging markets with different strategies, e.g. minimum
variance/volatility and equal risk contribution.
� 774 million Euros assets under management (Average
TNA 28.66 million euro).

Summary Risk Controlled Strategies
�The largest ETF (OSSIAM ETF US Minimum Variance
EUR) holds 143.20 million euro (18.51% of overall AuM)
�Funds need to increase assets under management and
Source: Lipper
�Funds need to increase assets under management and
market liquidity to become even more attractive for all kind
of investors.
� Transparency on strategies and holdings, as well as
superior returns will be key for the future success.

LONG – SHORT ETFS

Long/Short ETFs – Assets Under Management (Billion EUR)
2.5
3
3.5
4
4.5
5
5.5
6Short/Leveraged Short Leveraged Long
Source: Lipper
0
0.5
1
1.5
2
2.5
FOCUS: LONG – SHORT EQUITY ETFS

L/S Equity ETFs – Assets Under Management (Billion EUR)
2.5
3
3.5
4
4.5
5Short/Leveraged Short Leveraged Long
Source: Lipper
0
0.5
1
1.5
2

Long/Short Equity ETFs – Potential Market Impact
66.10%
56.22%
60%
70%
80%
90%
100%Short/Leveraged Short Leveraged Long
Source: Lipper
33.90%
43.78%
0%
10%
20%
30%
40%
50%
by Assets under Management by Exposure

Summary Long/Short Equity ETFs
� 35 leveraged long funds available
� Average AuM 40.07 million euro.
� Largest fund Lyxor ETF Leverage CAC 40 (TNA 287.85
Source: Lipper
� Largest fund Lyxor ETF Leverage CAC 40 (TNA 287.85
million euro).

Summary Long/Short Equity ETFs
� 42 short funds available
� Average AuM 44.51 million euro
� Largest fund db x-trackers Short DAX Daily UCITS ETF 1C
Source: Lipper
� Largest fund db x-trackers Short DAX Daily UCITS ETF 1C
(TNA 496.51 million euro)
Summary Long/Short Equity ETFs
� 17 leveraged short/double short funds available
� Average AuM 50.94 million euro
� Largest fund Lyxor ETF CAC 40 Daily Double Short (TNA
Source: Lipper
� Largest fund Lyxor ETF CAC 40 Daily Double Short (TNA
264.38 million euro)

Summary Long/Short Equity ETFs
� In terms of assets under management the segment is still
to small to make predictions on investors sentiment …
� … but there are some funds within the different segments
that have already a reasonable size and therefore might be
Source: Lipper
that have already a reasonable size and therefore might be
used by professional investors to gain directional market
exposure.
� A wider usage of these products may lead to a new
indicator for investor sentiment in the future.

SUMMARY

Summary�The European ETF market is highly concentrated and
will not change this pattern in the foreseeable future.
�AuM in the European ETF sector will continue to grow � growth rate will be lower than in the past
� impact from market movements will increase
Source: Lipper
�Number of funds will also grow further
� not all markets have already covered by ETFs
� strategy ETFs may become more important
�ETFs on bond markets and investment strategies might
become the key driver for future growth

Summary�The overall ETF landscape in Europe might change:
� new/different ETF promoter will enter the market
� established promoter will leave the market
� fund launches, as well as closures and mergers will
Source: Lipper
� fund launches, as well as closures and mergers will
change the product ranges with a trend to more
granularity.
� new distribution models might be introduced

DISCLAIMER
© Thomson Reuters 2012 All Rights Reserved.
This presentation is for informational purposes only, and do not constitute investment advice or an offer to sell or the solicitation of an offer to buy any security of any entity in any jurisdiction.
No guarantee is made that the information in this presentation is accurate or complete and no warranties are made with regard to the results to
40
warranties are made with regard to the results to be obtained from its use.
In addition, Lipper will not be liable for any loss or damage resulting from information obtained from Lipper or any of its affiliates.
Top Related