


Languages
Pages
Legal


ESG issues in the palm oil investments An event study on the listed palm oil companies in Singapore, Indonesia, and Malaysia
Master Thesis January 26, 2016
Author: Nanda Erian
Student number: s1482289
Programme: Financial Engineering and Management MSc
Supervisory committee:
Internal supervisors: Ir. drs. A.C.M. de Bakker
Dr. B. Roorda

ESG issues in the palm oil investments - 1
Preface This Master Thesis is written during my internship in Profundo, an economic and financial research
consultancy analyzing commodity chains, financial institutions, and CSR issues. One of the main focuses
of Profundo is analyzing how financial institutions can effectively disguise investments that are harmful
for the humans and environment, and also what financial institutions currently do to create sustainable
economic development. During the internship, I was involved in the financial research on the
sustainability of the palm oil industry, which mainly focused in Singapore, Indonesia, and Malaysia. As
an Indonesian, I was lucky enough to find a project in the Netherlands analyzing my own home country,
which aims for the environmental sustainability, social justice, and better governance in the palm oil
activities, including in Indonesia. It has been an inspiring work experience, knowing that the financial
knowledge I obtained during my Master Degree can be contribute to a more sustainable world.
I would like to thank Profundo team, especially Jan Willem van Gelder and Retno Kusumaningtyas, for
the internship experiences, and surely for the support to this Master Thesis. I gained a lot of useful
inputs for this Master Thesis, either data or advices. I hope that this Master Thesis could give additional
insights for the analysis regarding investments in the palm oil industry.
Furthermore, I would like to thank Mr. de Bakker as my first supervisor, whom have guided me
throughout this Master Thesis development. I am especially grateful to Mr. de Bakker for advising me
to use event study framework and giving guidance so that I can achieve my target for the completion
of this Master Thesis. I also would like to thank Mr. Roorda as my second supervisor, for the advices
during my search for the thesis topic and for the inputs to this Master Thesis.
In this opportunity, I also would like to thank the Indonesia Endowment Fund for Education (LPDP) for
giving me the scholarship to pursue this Master degree. Lastly, I would like to thank my friends and
families for the supports during my study in Universiteit Twente.
Amsterdam, 26th January 2016.
ESG issues in the palm oil investments - 2
Abstract We present the analysis of the impact of the Environmental, Social, and Governance (ESG) issues on
the stock return of the listed palm oil companies in Singapore, Indonesia, and Malaysia using the event
study framework. The center of an event study is the measurement of an abnormal stock return, which
is the actual ex-post return of the security over the event window minus the normal return of the firm
over the event window (MacKinlay, 1997). In this research, the chosen model to calculate the normal
return on the initial assessment is the market model, while the constant mean return model is used as
the reliability test. The main events analyzed in this research are divided into three main groups, which
are the haze crisis in 2015, the ESG issues reports, and the ESG commitment reports. Eventually, the
statistical conclusion of our assessment on the haze crisis in 2015 shows a significant negative impact
to the stock return, which is also in line with the reported news regarding the events. For the ESG issues
reports, we also have the evidence of the negative impact, but it is relatively low and on the significance
level of 10%. Then, we do not have evidence to show the impact of the ESG commitment reports. The
lack of samples is proven to result problems in the validity of the model as for the groups that have
relatively low number of samples, the normality assumption is violated. In terms of reliability, our initial
assessment model is proven to be robust as it leads to the same statistical conclusion in the sensitivity
analysis on the changes of event window and estimation window length. Also, the market model and
the constant mean return model result consistent inferences in this research, though with significant
difference of cumulative average abnormal returns (CAAR) in some of the results.
Keywords: ESG, palm oil, event study, market model, abnormal return, stock return.

ESG issues in the palm oil investments - 3
Table of contents
Preface .................................................................................................................................................... 1
Abstract ................................................................................................................................................... 2
Table of contents ..................................................................................................................................... 3
List of figures ........................................................................................................................................... 5
List of tables ............................................................................................................................................ 5
1 Introduction.......................................................................................................................................... 7
1.1 Core problem and its background ................................................................................................. 7
1.2 Objective ....................................................................................................................................... 8
1.3 Scope ............................................................................................................................................. 8
1.4 Research questions ....................................................................................................................... 8
1.5 Methodology ................................................................................................................................. 9
1.6 Outline ........................................................................................................................................... 9
2 Literature review ................................................................................................................................ 10
2.1 The palm oil industry ................................................................................................................... 10
2.2 Environmental, Social, and Governance (ESG) issues in the palm oil industry ............................ 11
2.2.1 ESG definition ....................................................................................................................... 11
2.2.2 ESG risk analysis for the palm oil companies ........................................................................ 12
2.2.3 ESG integration in risk management .................................................................................... 14
2.3 Event study framework ............................................................................................................... 16
3 Event definition and hypotheses development .................................................................................. 18
3.1 The haze crisis in 2015................................................................................................................. 18
3.2 The ESG issue reports .................................................................................................................. 19
3.3 The ESG commitment reports ..................................................................................................... 20
4 Event study model development ........................................................................................................ 21
4.1 Assessment methodology ........................................................................................................... 21
4.2 Validity test methods................................................................................................................... 24
4.3 Reliability test methods ............................................................................................................... 25
5 Data collection .................................................................................................................................... 26
5.1 List of listed palm oil companies in Singapore, Indonesia, and Malaysia..................................... 26
5.2 List of events ............................................................................................................................... 26
5.2.1 The haze crisis in 2015 .......................................................................................................... 26
5.2.2 The ESG issue reports ........................................................................................................... 27
ESG issues in the palm oil investments - 4
5.2.3 The ESG commitment reports .............................................................................................. 29
5.3 Stock prices of the assessed companies ...................................................................................... 29
6 Results and analysis ............................................................................................................................ 30
6.1 Market portfolio .......................................................................................................................... 30
6.2 The haze crisis in 2015................................................................................................................. 31
6.3 The ESG issue reports .................................................................................................................. 34
6.4 The ESG commitment reports ..................................................................................................... 37
6.5 Validation analysis ....................................................................................................................... 37
6.5.1 R2 analysis ............................................................................................................................. 37
6.5.2 Normality tests ..................................................................................................................... 38
6.6 Sensitivity analysis ....................................................................................................................... 41
6.6.1 Sensitivity analysis on event window ................................................................................... 41
6.6.2 Sensitivity analysis on estimation window ........................................................................... 43
6.7 Constant mean return model ...................................................................................................... 46
7 Conclusion and recommendations ..................................................................................................... 48
7.1 Conclusion ................................................................................................................................... 48
7.2 Discussion and recommendations ............................................................................................... 49
References ............................................................................................................................................. 51
Appendix A – The listed palm oil companies in Singapore, Indonesia, and Malaysia ............................ 56
Appendix B – The collection of ESG issues ............................................................................................ 58
Appendix C – The collection of ESG commitments ................................................................................ 60
Appendix D – Top Fund Holdings in Market Indices .............................................................................. 61
Appendix E – The collection of ESG Issues ranked by the CAR (top 10) ................................................ 62

ESG issues in the palm oil investments - 5
List of figures Figure 1 - Palm oil production chain (based on WWF, 2008) ................................................................ 10
Figure 2 - Timeline for an event study (MacKinlay, 1997) ..................................................................... 17
Figure 3 - Assessment methodology ..................................................................................................... 21
Figure 4 - Haze crisis 2015 timeline ....................................................................................................... 27
Figure 5 - MXSG Index trend ................................................................................................................. 32
Figure 6 - MXID Index trend .................................................................................................................. 32
Figure 7 - MXMY Index trend................................................................................................................. 32
Figure 8 - q-q plot: the haze crisis event samples ................................................................................. 39
Figure 9 - q-q plot: the ESG reports samples ......................................................................................... 39
Figure 10 - q-q plot: the ESG commitments samples ............................................................................ 40
Figure 11 - q-q plot: the listed companies in Singapore in the haze crisis event ................................... 40
List of tables Table 1 - The list of ESG issues associated with palm oil operations ..................................................... 12
Table 2 - How ESG risks can erode shareholder value (based on WWF & EnviroMarket, 2012) ........... 14
Table 3 - Criteria of the company screening in Bloomberg database .................................................... 26
Table 4 - Number of samples in the haze crisis event assessment ........................................................ 27
Table 5 - Number of samples of ESG issue reports ................................................................................ 28
Table 6 - Market portfolio assessment .................................................................................................. 30
Table 7 - H1 assessment result .............................................................................................................. 31
Table 8 - H1a assessment result ............................................................................................................ 33
Table 9 - H1a significance of the CAAR .................................................................................................. 33
Table 10 - H1b assessment result .......................................................................................................... 33
Table 11 - H1b significance of the CAAR ................................................................................................ 33
Table 12 - H1c assessment result .......................................................................................................... 34
Table 13 - H1c significance of the CAAR ................................................................................................ 34
Table 14 - Adjusted event date ............................................................................................................. 34
Table 15 - H2 assessment result ............................................................................................................ 35
Table 16 - H2a assessment result part 1 ............................................................................................... 35
Table 17 - H2a significance of the CAAR ................................................................................................ 35
Table 18 - H2b assessment result of two clusters of the years ............................................................. 36
Table 19 - H2b significance of the CAAR ................................................................................................ 36
Table 20 - The CAAR of each years ........................................................................................................ 36
Table 21 - H2c assessment result .......................................................................................................... 37
Table 22 - H2c significance of the CAAR ................................................................................................ 37
Table 23 - H3 assessment result ............................................................................................................ 37
Table 24 - R2 results ............................................................................................................................... 38
Table 25 - the chi-square test results .................................................................................................... 40
Table 26 - Sensitivity analysis on event window of the haze crisis in 2015 group ................................. 42
Table 27 - Sensitivity analysis on event window of the ESG issue reports group .................................. 43
Table 28 - Sensitivity analysis on event window of the ESG commitment reports group ..................... 43
Table 29 - Sensitivity analysis on the estimation window of the haze crisis in 2015 group ................... 44
Table 30 - Sensitivity analysis on the estimation window of the ESG issue reports group .................... 45
ESG issues in the palm oil investments - 6
Table 31 - Sensitivity analysis on the estimation window of the ESG commitment reports group ....... 45
Table 32 - Constant mean return model comparison in the haze crisis in 2015 group ......................... 46
Table 33 - Constant mean return model comparison in the ESG issue reports group .......................... 47
Table 34 - Constant mean return model comparison in the ESG commitment reports ........................ 47
Table 35 - The overview of H1 results ................................................................................................... 48
ESG issues in the palm oil investments - 7
1 Introduction In the first chapter of this thesis, we present the background and approach to achieve the objective of
the research. We start with the introduction to the problem and how the current situation leads us to
raise the research questions. Then we continue with the description of the scope, questions, and
methodology of the research. We end this chapter by giving the outline of this thesis.
1.1 Core problem and its background
Mielke (as cited in WWF, FMO, & CDC, 2012) presented that the Palm oil demand has been predicted
to accelerate more than 65% growth by 2020 over 2010 baselines, due to the rapidly expanding
populations, changing consumption patterns, and increasing demand from the Bioenergy and
Oleochemicals industries. Palm oil production has important economic impacts for Malaysia and
Indonesia, where it contributed 3.2% of the Malaysian GDP and 6% to 7% of the Indonesian GDP,
presented in RSPO report in 2011 (as cited in WWF et al., 2012). Investing in the palm oil industry,
however, is not guaranteed to be a success. There is set of challenges faced by the industry, including
land and labor shortages, environmental destruction, social conflicts, irregular weather patterns, rising
costs for fuel and fertilizer, litigation risk in producer and consumer markets, and pressure for
transparency and sustainability for consumer and corporate buyer (WWF et al., 2012).
The haze crisis that affected Indonesia from approximately June 2015 has been an example of how an
environmental issue creates a risk to the economic growth in the palm oil industry. As has been widely
reported, the industry operation is one of the roots of the forest and peatland fires which causing health
problems and deaths, threatening endangered wildlife, and producing huge carbon pollution. The
Indonesian government has estimated that the fires costs over $30 billion, then responding by taken
public accountability measures by investigating firms and arresting executives in connection with fires.
It poses serious reputational risks for the firms involved and found to be violating sustainability policies.
In October 2015, the fires have already impacted the Agriculture stocks in the Jakarta Composite Index
which fell 29%, ranking among the three worst performing sectoral indices in 2015 (Cushing, 2015).
As a respond to the haze crisis, The Association of Banks in Singapore (ABS) launched a new industry
guideline, which aims to integrate Environmental, Social, and Governance (ESG) criteria into the risk
assessment and lending decision-making process, and to improve transparency and accountability on
ESG issues (Cushing, 2015). The guideline is an improvement on the sustainable finance in Singapore,
Indonesia, and Malaysia, which is highlighted in a report by World Wildlife Fund (WWF) as the domestic
banks and investors in the region are lagging far behind in incorporating ESG issues compared to the
international financial institutions (Cushing, 2015). The report found that the leading palm oil
companies listed in the region provide insufficient relevant disclosure for investors to assess the ESG
issues. However, there is no evidence that domestic investors address the disclosure gaps through
engagement and collaborative initiatives. Moreover, among the assessed domestic banks, only one
bank appears to have the policies on financing forest-related commodity companies (WWF, 2015).
The lack of attention on ESG integration by investors and banks provokes an interest to investigate how
actually the ESG issues affect the performance of the investment on the palm oil activities. We are
interested to examine whether ESG issues of the palm oil companies expose a risk of loss to the

Introduction
ESG issues in the palm oil investments - 8
investor’s investment. The research would thus give idea of the importance to incorporate the ESG
issues into the decision-making process to invest on the palm oil activities.
1.2 Objective
The investment performance investigated in this research is the stock return. The objective is to provide
an assessment how the ESG issues affect the stock return of the investment in the listed palm oil
companies in Singapore, Indonesia, and Malaysia.
1.3 Scope As stated in 1.1 and 1.2, this research is done in a scope of listed palm oil companies in Singapore,
Indonesia, and Malaysia. Palm oil is one of the commodity sectors that exposes sustainability issues for
investors, thus lessons learned about sustainability in this sector might be applicable to food, fiber, and
biofuel commodities more broadly (WWF & EnviroMarket, 2012). Indonesia and Malaysia produce 87%
and consume 22% of global palm oil, presented in WWF report in 2011 (WWF et al., 2012). The big
palm oil companies operating in these regions are mostly listed in Singapore, Indonesia, and Malaysia,
so that these countries become our scope in this research.
An event study framework is chosen as the method to investigate how the ESG issues affect the
performance of the investment on the palm oil activities, where the assessed variable is the stock
return. Therefore, the scope of this research is focused on the stock return to represent the financial
performance.
1.4 Research questions
The expected outcome of the research is to show the impact of the ESG issues of the palm oil activities
on the stock return of the companies. The intention is to give idea of the exposed risk of loss to the
investor’s investment due to the ESG issues. Thus the main research question is as shown below:
Is the stock return of the listed palm oil companies in Singapore, Indonesia, and Malaysia negatively
affected by the ESG issues in their activities?
To answer the main research question, the following sub research questions are defined:
1. What are the ESG issues?
2. How can we determine if the activities of the palm oil companies creating an ESG issue?
The first and second sub research questions are meant to give clear definition of the ESG issues in the
palm oil activities, thus the collection of the cases to be assessed can be done properly. The next sub
research questions aim to give insights how the assessment to answer the main research question
should be done:
3. How can we define the period and time length of the events of the ESG issues?
4. How can we measure the difference between the stock returns in the time of the events and outside
the events?
5. How can we test the significance of the difference?

Introduction
ESG issues in the palm oil investments - 9
1.5 Methodology
The methodology of the research has been developed sequentially as shown below:
1. Literature review
The literature review in this research consists of two parts. The first part is conducted to answer the
first and second sub research questions. This part aims to give clear understanding of the ESG issues
definition in the palm oil activities, to become a guideline in collecting the cases that will be observed.
The second part of the literature review is about the insights to build a proper method for the
assessment. The insights from the literature review are also used to develop the hypotheses in this
research.
2. Assessment Model development
We conducted the assessment to answer the main research question using an event study framework.
An event study is a statistical method to measure the impact of a specific event on the value of a firm,
thus it is a suitable framework for this research (MacKinlay, 1997). In the second step of this research,
a proper event study model to conduct the assessment is developed.
3. Data collection
We collected cases of the ESG issues of the listed palm oil companies in Singapore, Indonesia, and
Malaysia as the observed events. After collecting the set of cases, we gathered the corresponding
financial market data that are needed in the assessment model.
4. Data assessment
After the data collection, we conducted the data assessment using the developed model. In general,
the event study consists of defining and identifying the period of the events, determining the sample
characteristics, and conducting statistic calculations to measure the difference of the returns impacted
by the events (MacKinlay, 1997). The data assessment in this research is conducted using Microsoft
Excel.
5. Result analysis
The last step of the research is to analyze the result of the assessment. The conclusion of this research
is formulated to answer the main research question based on the analysis.
1.6 Outline
The outline of this thesis will be in line with the sequence of the developed methodology. The next
chapter is the literature review where we explain all theories used in this thesis. In chapter 2, most of
the sub research questions are answered. Then we define the event and develop the hypotheses in
chapter 3, based on the insights from the literature review. The assessment model development is
explained in Chapter 4, where the detailed steps to assess the impact of the ESG issues on the stock
return in the observed samples will be explained thoroughly. Then in chapter 5, we explain the data
collection process, including the sources of the data. We present the assessment results and analysis in
chapter 6. Lastly, we provide the conclusion of the research and the recommendation for further
improvement in chapter 7.
ESG issues in the palm oil investments - 10
2 Literature review We present the literature review in this chapter to answer the sub-research questions, which aim to
gain background knowledge of the ESG issues in the palm oil activities and insights for the assessment
model development.
2.1 The palm oil industry
Palm oil is the most common edible oil and is used in everyday foods, cosmetics, and personal hygiene
products (WWF & EnviroMarket, 2012). The palm oil is the most profitable of any edible oil since it
offers the highest yield. It is also important as an economic driver for some developing nations, such as
Indonesia and Malaysia (WWF & EnviroMarket, 2012).
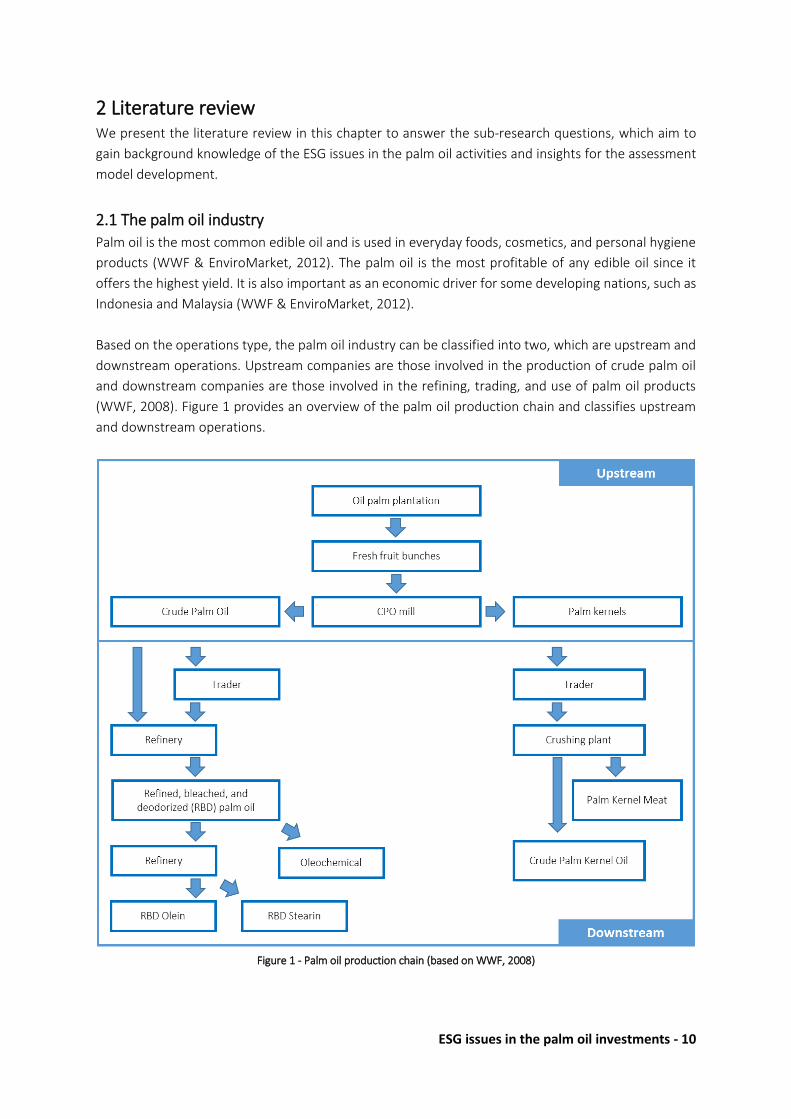
Based on the operations type, the palm oil industry can be classified into two, which are upstream and
downstream operations. Upstream companies are those involved in the production of crude palm oil
and downstream companies are those involved in the refining, trading, and use of palm oil products
(WWF, 2008). Figure 1 provides an overview of the palm oil production chain and classifies upstream
and downstream operations.
Figure 1 - Palm oil production chain (based on WWF, 2008)

Literature review
ESG issues in the palm oil investments - 11
During the expansion of the palm oil industry, it has been the subject of consumer, activist, and media
campaigns in buyer markets, as well as frequent demonstrations and campaigns from local
communities, due to its unsustainable operations. The impact on biodiversity and climate change due
to deforestation, burning, and the draining of peatlands have been highlighted by the
environmentalists. The industry’s impacts on indigenous people, land rights, labor rights, and local
communities have been focused by the social NGOs (WWF et al., 2012).
The Roundtable on Sustainable Palm Oil (RSPO) was founded in 2004 as a response to these pressures.
RSPO consists of palm oil producers, civil society, governments, and buyers. It is a certification to the
palm oil companies which involves undertaking a review of existing production operations, identifying
areas of non-compliance with the standards, implementing an action plan to address those areas, and
finally undergoing audits by an approved certification body (WWF et al., 2012). One of the applications
of the RSPO certification is for financial institutions to assess a palm oil company’s performance on
sustainability issues, as a consideration to become the financier of the company (WWF, 2008).
2.2 Environmental, Social, and Governance (ESG) issues in the palm oil industry
In this section, we review the ESG definition, including the list of palm oil operations that can be
categorized as the ESG issues. Then we take up some examples of the ESG risk analysis for the palm oil
companies. We examine some studies that present the integration of the ESG criteria into financial risk
management at the end of this section.
2.2.1 ESG definition
In June 2004, UN Global Compact’s “Who Cares Wins” initiative proposed for the first time the concept
and term of ESG to drive the attention of the mainstream investors and analysts into the criteria and
influence of the environmental, social, and governance issues (WWF, 2014). In a report published on
2014 about ESG integration for banks, WWF defined the ESG by listing the issues that can be covered
by the term, which are (WWF, 2014):
Environmental: Greenhouse gas emissions, biodiversity loss, pollution and contamination,
carbon regulation exposure, renewable energy;
Social: Labor practices, community displacement, human rights, health and safety, financial
inclusion;
Governance: Corruption and bribery, reputation, management effectiveness.
In another report published in 2012, WWF listed issues that can be covered by the ESG term, but more
specifically associated with the palm oil operations (WWF & EnviroMarket, 2012). The list is presented
in the Table 1.
In general, we also found that the term ESG is interchangeably with the term of sustainability, for
example, in a report by WWF discussed the sustainability finance in Singapore, Indonesia, and Malaysia
(WWF, 2015). It is necessary to note that the list above does not limit the issues that can be covered
under the ESG term. The United Nations-supported Principles for Responsible Investment (PRI)
association, a partner of UN Global Impact, argued that a definitive list of ESG issues does not exist,
since any list that claims to be exhaustive or definitive would inevitably be incomplete and would soon

Literature review
ESG issues in the palm oil investments - 12
be out of date (PRI Association, 2013). Nonetheless, for guidance purposes, PRI association also
provides an explanation for ESG term, which is also relevant with the list of issues in Table 1, as shown
below (PRI Association, 2013):
Environmental: Issues relating to the quality and functioning of the natural environment and
natural systems;
Social: Issues relating to the rights, well-being, and interests of people and communities;
Governance: Issues relating to the governance of companies and other investee entities.
This research uses the list in Table 1 as a guidance to collect the ESG issues to be assessed. The ESG
issues in Singapore, Indonesia, and Malaysia are mostly reported in NGO’s research, thus it is relevant
to take the ESG definition from one of the leading NGO’s perspective.
Environmental Social Governance
Deforestation and use of fire
for clearing
Displacement of indigenous
people
Lack of disclosure on ESG
matters
Drainage of peat lands Human/labor rights abuses Ownership disputes
Methane emissions associated
with mill effluent treatment
Poor and unsafe labor
conditions for workers
Illegal operations
Biodiversity impact and
species loss due to forest
degradation
Public backlash due to lack of
disclosure of impact on
communities
Destruction of natural capital
base on which company
depends
Soil degradation related to
intensive production
Unfair treatment and price
setting
Planting on unsuitable slopes
causing soil erosion
Negative feedback or protests
from NGOs
Excessive water use
Lack of riparian buffers
resulting in contamination of
rivers and soil erosion
Pollution and waste toxicity
Excessive use of pesticides and
fertilizers
Table 1 - The list of ESG issues associated with palm oil operations (based on WWF & EnviroMarket, 2012)
2.2.2 ESG risk analysis for the palm oil companies
Chain Reaction Research published a report in June 2015 analyzing the risk that exposes Indonesian
palm oil growers due to the non-compliance to the sustainability purchasing policies (Chain Reaction
Research, 2015b). The research analyzes ten largest palm oil growers listed in Indonesian stock
exchange (IDX) and concludes that six out of ten palm oil companies have high-risk exposure to the No
Deforestation, No Peat, No Exploitation (NDPE) purchasing policies. The high-risk is due to the growing
evidence that major palm oil buyers are prepared to diminish, suspend, or cancel a trade with the palm
oil growers that are suspected or proven to be non-compliance to the policies, thus these six palm oil
companies have high possibility to lose buyers. The research assessed the companies by looking at their
Literature review
ESG issues in the palm oil investments - 13
commitment regarding to NDPE policies, which include climate change, biodiversity, and social issues
(Chain Reaction Research, 2015b).
Another report published by Chain Reaction Research presents a full risk analysis, specifically on one of
the palm oil companies in Indonesia, Sawit Sumbermas Sarana (SSMS) (Chain Reaction Research,
2015a). The research conducts an assessment with regard to SSMS’s sustainability policy and its
practices on the ground, with focus on deforestation, peatlands, biodiversity, and Free, Prior and
Informed Consent (FPIC). The assessment concludes that SSMS was exposed to the risk of a potential
loss of their main customers and a compensation cost due to acquiring and reforesting land. The loss
of the main customers could result in more than double digit declines in Asset Turnover, ROA, and ROE
for SSMS. The compensation costs could result in a decrease of the profitability due to the increased
expenses. In addition, another significant risk that could expose the company is the damage of SSMS
reputation among customers, investors, and public. The reputation damage could trigger further
consequences of financial health of the company, such as loss for other major customers, or rejection
on financing and investments from the banks and investors (Chain Reaction Research, 2015a). The
reports published by Chain Reaction Research are the examples of how the ESG issues could expose a
financial risk to the palm oil companies.
The case of Greenpeace’s campaign against Sinar Mas in 2010 is an example of how a palm oil company
lost their major customer due to reputation damage. In March 2010, Greenpeace published a report
exposing how Nestle is sourcing palm oil from Sinar Mas who continues to expand into the rainforest
and carbon-rich peatlands, as well as into critical orang-utans habitat (Greenpeace, 2010a). The report
exposes the evidence of how Sinar Mas driving orang-utans to extinction, threatening livelihoods,
destroying peatland forests, burning rainforests, and breaking the law. At the end of the report,
Greenpeace demands that Nestle must immediately stop the trade with the Sinar Mas group
(Greenpeace, 2010a). The campaign was launched with a viral ad campaign, social media campaign,
and traditional on-the-ground activism. The campaign triggered a large amount of commentaries on
blogs, which accounted for 70% of the conversations about palm oil on the web during the six-month
period to September 27. Eventually, Nestle responded by changing policy and severing contracts with
Sinar Mas (Harrild, 2010).
A different approach was taken in a report by WWF that not only analyze the risks of ESG issues, but
also focus on the benefits of adapting an ESG policy into the palm oil operations, in this case the
principles and criteria of the RSPO (WWF et al., 2012). The report presents benefits of implementing
RSPO principles and criteria in the areas of operations, community relations, staff and labor, revenues
and market access, and access to capital (WWF et al., 2012). These benefits then also can be the
guidance to analyze the ESG risks in a palm oil company as the opportunities that can be lost if the
company does not adopt the RSPO principles and criteria.
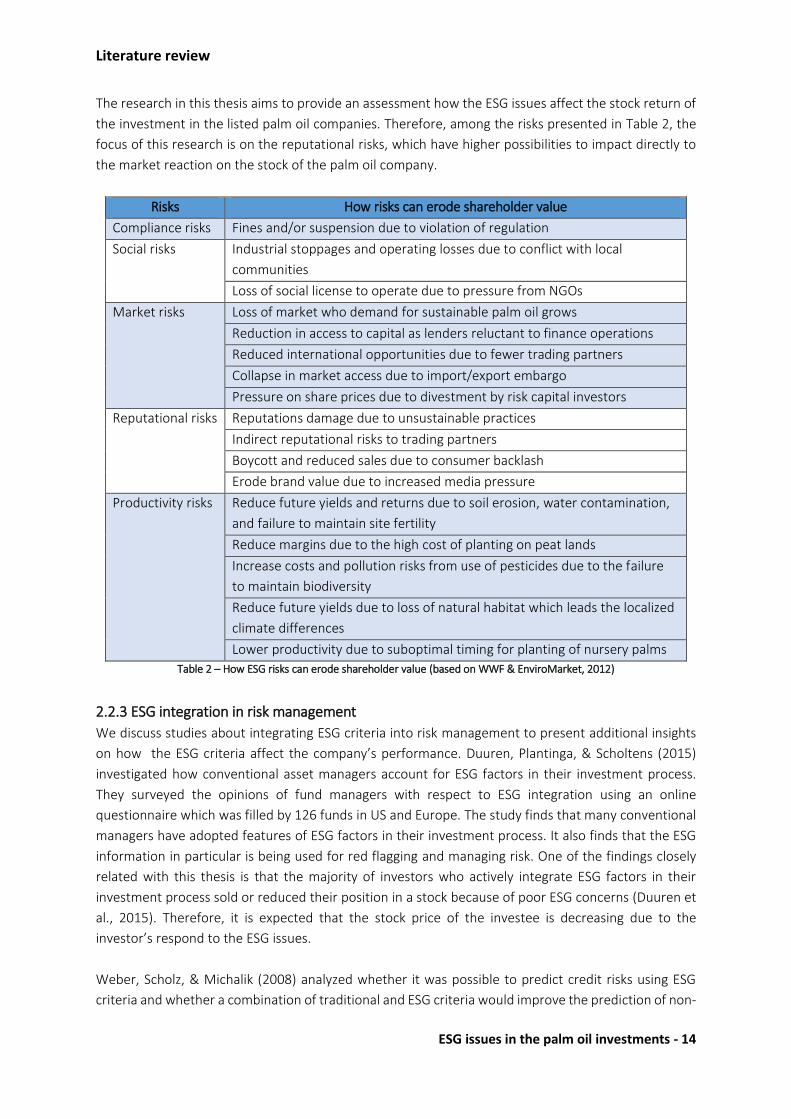
The ESG risks are defined into different categories in another report by WWF, which aims as a guidance
for the investors in the palm oil industry. Table 2 presents list of risks caused by ESG issues that can
disrupt the growth of the commercial value of the palm oil business and result in negative impact upon
the shareholder value and investment returns (WWF & EnviroMarket, 2012).
Literature review
ESG issues in the palm oil investments - 14
The research in this thesis aims to provide an assessment how the ESG issues affect the stock return of
the investment in the listed palm oil companies. Therefore, among the risks presented in Table 2, the
focus of this research is on the reputational risks, which have higher possibilities to impact directly to
the market reaction on the stock of the palm oil company.
Risks How risks can erode shareholder value
Compliance risks Fines and/or suspension due to violation of regulation
Social risks Industrial stoppages and operating losses due to conflict with local
communities
Loss of social license to operate due to pressure from NGOs
Market risks Loss of market who demand for sustainable palm oil grows
Reduction in access to capital as lenders reluctant to finance operations
Reduced international opportunities due to fewer trading partners
Collapse in market access due to import/export embargo
Pressure on share prices due to divestment by risk capital investors
Reputational risks Reputations damage due to unsustainable practices
Indirect reputational risks to trading partners
Boycott and reduced sales due to consumer backlash
Erode brand value due to increased media pressure
Productivity risks Reduce future yields and returns due to soil erosion, water contamination,
and failure to maintain site fertility
Reduce margins due to the high cost of planting on peat lands
Increase costs and pollution risks from use of pesticides due to the failure
to maintain biodiversity
Reduce future yields due to loss of natural habitat which leads the localized
climate differences
Lower productivity due to suboptimal timing for planting of nursery palms
Table 2 – How ESG risks can erode shareholder value (based on WWF & EnviroMarket, 2012)
2.2.3 ESG integration in risk management
We discuss studies about integrating ESG criteria into risk management to present additional insights
on how the ESG criteria affect the company’s performance. Duuren, Plantinga, & Scholtens (2015)
investigated how conventional asset managers account for ESG factors in their investment process.
They surveyed the opinions of fund managers with respect to ESG integration using an online
questionnaire which was filled by 126 funds in US and Europe. The study finds that many conventional
managers have adopted features of ESG factors in their investment process. It also finds that the ESG
information in particular is being used for red flagging and managing risk. One of the findings closely
related with this thesis is that the majority of investors who actively integrate ESG factors in their
investment process sold or reduced their position in a stock because of poor ESG concerns (Duuren et
al., 2015). Therefore, it is expected that the stock price of the investee is decreasing due to the
investor’s respond to the ESG issues.
Weber, Scholz, & Michalik (2008) analyzed whether it was possible to predict credit risks using ESG
criteria and whether a combination of traditional and ESG criteria would improve the prediction of non-
Literature review
ESG issues in the palm oil investments - 15
default and default loans. In their study, they concentrated on the counterparty credit risks, which are
mainly influenced by the reputation of the debtor, the ability to repay, the future earnings, the debtor’s
capital and its ratio to debt, and the value of the collateral. Thompson (1998) and Coulson and Dixon
(1995) (as cited in Weber et al., 2008) stated that ESG risks could significantly influence these factors
of the counterparty credit risks. The result of the analysis is that ESG criteria can be used to predict the
financial performance of a debtor and improve the predictive validity of the credit rating process, which
shows correlations between a firm’s financial performance and its ESG performance.
Coulson (2007), Thompson (1998), and Wagner (2007) (as cited in Weber et al., 2008) support the
finding by presenting that the integration of ESG risks into the rating process resulted in improved risk
prediction and risk management for lenders, because ESG risks influence the risk of the loans. Scholz et
al. (as cited in Weber et al., 2008) have also reported that some of the environmentally caused credit
defaults could have been prevented if the lenders had used a rating system that consisted not only of
economic and financial indicators, but also of ESG indicators.
WWF (2008) published a guideline to help financial institutions to reduce the environmental and social
risks associated with transactions in the palm oil industry. The guideline has received advantages from
the input of representatives of several financial institutions including ABN AMRO Bank, Fortis, HSBC,
the International Finance Corporation, ING Bank, Rabobank, and Standard Chartered, and from CIS
Cooperative Insurance as an institutional investor. One of the guidelines presented in the report is the
model screening process describing a process for screening clients seeking credit, for compliance with
the model palm oil policy. The model screening process consists of several steps as shown below (WWF,
2008):
Step 1
Bank informs the company about the bank’s palm oil policy, decides whether to invoke the
screening process, and requests the company to start the process by completing a
questionnaire.
Step 2
For established upstream operations, Bank reviews all production units and classifies each unit
as:
a) RSPO-certified;
b) In-progress to compliance with RSPO criteria;
c) Not RSPO-certified and not progressing; or
d) Not yet assessed for compliance with RSPO criteria
For new or expanded upstream operations:
Bank reviews the plans for these mills or plantations
For downstream operations:
Bank reviews the palm oil procurement policies and practices of these operations
Step 3
Bank sets conditions of engagement with the company, as appropriate, to ensure:
Literature review
ESG issues in the palm oil investments - 16
a) Compliance with RSPO criteria across all upstream production units;
b) Compliance with RSPO criteria is built into the planning processes for new production units,
and/or
c) The company progressively increases the proportion of RSPO-certified palm oil entering its
supply chains
Step 4
Bank and company schedule the steps to be taken to satisfy the preconditions and complete
the screening process. If the company accepts conditions and timetable, then the process can
continue.
Step 5
Pre-financing actions implemented. If the company satisfies pre-finance conditions, then the
process can continue.
Step 6
Bank approves financing, finalizes sustainability covenants and works with company to
schedule company actions to meet the covenants and bank actions to monitor compliance.
Step 7
Bank monitors the company’s compliance with sustainability covenants.
This guideline could give insights of the current practice of integrating ESG criteria into risk assessment
policies, specifically in the palm oil industry. Moreover, this guideline also shows how each classification
of the palm oil companies based on their operations and their commitment level to ESG has a different
approach of assessment.
2.3 Event study framework
The assessment to answer the main research question in this research is done by using an event study
framework. An event study is a statistical method to measure the impact of a specific event on the
value of a firm, thus it is a suitable framework for this research (MacKinlay, 1997). In general, the event
study consists of defining and identifying the period of the events, determining the sample
characteristics, and conducting statistic calculations to measure the difference of the returns impacted
by the events (MacKinlay, 1997). The usefulness of the event study is based on the fact that, given
rationality in the marketplace, the effects of an event will be reflected without delay in security prices.
Most of the application of the event study is the effect of an event on the price of a particular class of
securities of the firm, most often common equity (MacKinlay, 1997).
The timeline in an event study consists of estimation window, event window, and post-event window.
The event window is the period over which the security prices of the firms involved in the event will be
examined. The center of an event study is the measurement of an abnormal stock return, which is the
actual ex-post return of the security over the event window minus the normal return of the firm over
the event window (MacKinlay, 1997). The normal return itself defined as the expected return without
conditioning on the event taking place. The normal return is calculated based on the return in the

Literature review
ESG issues in the palm oil investments - 17
estimation window, the period prior to the event (MacKinlay, 1997). Figure 2 shows the timeline for an
event study, with each T represents the time, and t is the event date.
Figure 2 - Timeline for an event study (MacKinlay, 1997)
The normal return can be calculated using several approaches, which can be grouped into statistical
and economic approaches. Models in the statistical approach are solely based on statistical
assumptions concerning the behavior of stock returns and do not depend on any economic arguments.
The most common models for statistical approaches are constant mean return model and market
model. On the other hand, models in the economic approach rely on both statistical assumptions and
economic arguments concerning investors’ behaviors, such as the risk free rate, market risk premium,
and estimated beta. For economic approaches, two common models are the Capital Asset Pricing
Model (CAPM) and the Arbitrage Pricing Theory (APT) (MacKinlay, 1997).
The market model is the chosen approach in this research. To calculate the normal return, the market
model relates the return of any given security to the return of the market portfolio using regression
analysis. Compared to CAPM and APT, the normal return in market model is calculated solely based on
the regression analysis, while CAPM and APT also rely on economic restrictions. In CAPM, the normal
return relies on the risk free rate, market risk premium, and estimated beta. Then in APT, the normal
return relies on the macroeconomic factors, risk free rate, and estimated beta. It is discovered that the
market model can avoid the potential for sensitivity to the economic restrictions in CAPM, thus the use
of the CAPM has almost ceased. APT might add explanatory power compared to CAPM, but the gains
from using it versus the market model are small. Therefore, the market model is more often to use
compared to these two economic models (MacKinlay, 1997).
The normal return calculated in the constant mean return model is simply the mean of the return in
the estimation window. The market model can improve the constant mean return model by removing
the portion of the return that is related to variation in the market’s return, thus the variance of the
abnormal return is reduced (MacKinlay, 1997). This can increase the ability to detect event effects. The
benefit from using the market model depends on the R2 of the regression, where the higher R2 the
greater is the variance reduction of the abnormal return (MacKinlay, 1997). Nonetheless, the constant
mean return model is also used in this research as a reliability test to the result of the assessment using
the market model. Though the constant mean return model is considered as the simplest model, Brown
and Warner (as cited in MacKinlay, 1997) find it often yields results similar to those of more
sophisticated models.
ESG issues in the palm oil investments - 18
3 Event definition and hypotheses development The event in this assessment model refers to the ESG issues incident in the palm oil company’s activities,
and the event date is defined based upon the period of the news publication where the incident is
reported. We created three groups of event in this research, which are the haze crisis event in 2015,
the ESG issue reports in 2009 – June 2015 (bad news), and an additional research on the event when
the palm oil companies published a commitment to improve their ESG performance in 2009 – June
2015 (good news). For each group of event, we further analyzed factors that could influence a different
effect magnitude of the event on the stock return of the companies.
3.1 The haze crisis in 2015
One of the backgrounds of this research is the haze crisis that affected Singapore, Indonesia, and
Malaysia in June 2015 until approximately the end of October 2015, and have already impacted the
Agriculture stocks in the Jakarta Composite Index which fell 29% in this period, ranking among the three
worst performing sectoral indices in 2015 (Cushing, 2015). Surely it is expected that if we assess the
event of the haze crisis using the model we developed in this research, the result will show that the
haze crisis affects the stock return of the palm oil companies negatively. Therefore, we developed our
first hypothesis as shown below:
H1: The stock return of the listed palm oil companies in Singapore, Indonesia, and Malaysia are
negatively affected by the haze crisis in 2015
Among of the benefits of implementing RSPO principles and criteria presented by WWF et al. (2012)
are the market and capital access to the buyers and investors who are committed only to buy certified
sustainable palm oil (CSPO). Therefore, we consider that the buyers and investors of the RSPO members
mostly have a high concern about sustainability. Thus, it is expected that the RSPO members have a
higher negative impact (lower abnormal return) in the time of the haze crisis. This is due to the buyers
and investors who are more reactive to the ESG issues in the RSPO members. We analyzed the influence
of RSPO status on the effect of the haze crisis, using the hypothesis H1a below:
H1a: The Palm oil companies that are RSPO members show lower abnormal return (more negative)
compared to non-RSPO members in the haze crisis 2015
The highlight of the bad news exposed to the palm oil companies during the haze crisis is the forest
burning activities that allegedly done by the palm oil plantation companies. It is then plausible that this
bad news affect more negatively to the companies involved in the upstream activities. The hypothesis
H1b is meant to analyze this estimation.
H1b: The Palm oil companies involved in upstream activities show lower abnormal return (more
negative) compared to the companies that only involved in downstream activities in the haze crisis
2015
WWF (2015) measures the extent to which the banks in Singapore, Indonesia, and Malaysia are
considering sustainability in their financing and investment activities. The variation among countries
that the research found is that Indonesian banks are typically further ahead in terms of sustainability

Event definition and hypotheses development
ESG issues in the palm oil investments - 19
consideration, while Singaporean banks provided the least relevant disclosure on it. It is then also
interesting to see the national variation in this research by using the finding by WWF as the base for
the hypothesis. The more a country is considering sustainability, the worse the abnormal return in the
palm oil companies in the haze crisis event. The hypothesis is shown below:
H1c: The palm oil companies listed in Indonesia show the worst abnormal return, while the palm oil
companies listed in Singapore show the best abnormal return among the three countries in the
haze crisis 2015
3.2 The ESG issue reports
As discussed in the literature review, this research uses the list in Table 1 as a guidance to collect the
ESG issues to be assessed. Looking at the explanation in section 2.2.2, we expect that the result of the
assessment will show that the stock return is negatively affected by the ESG issues, thus the hypothesis
for this analysis is shown below:
H2: The stock return of the listed palm oil companies in Singapore, Indonesia, and Malaysia are
negatively affected by the ESG issue reports in 2009 – June 2015
It is interesting to analyze which issue that included in ESG definition has the most influence on the
stock return of the palm oil companies. From section 2.2.2, we have the insights about how the ESG
issues could expose a financial risk to the palm oil companies, where most of the issues discussed has
a direct impact on sales of the companies, such as the loss of the main customer. Therefore, we
predicted the most negative impact (lowest abnormal return) will be resulted from the ESG issues that
have a direct impact on the sales, as shown in the hypothesis below:
H2a: The ESG issue reports in 2009 - June 2015 that have a direct impact on the sales of the palm oil
companies in Singapore, Indonesia, and Malaysia result the lowest abnormal return among other
ESG issues
The initiatives to improve the ESG performance of the palm oil companies keep progressing in each
year, either it is from the NGOs campaign, the financial institution policies, or the palm oil companies
commitment. Thus, it is expected that the awareness of the ESG compliance is increasing in each year,
which result in higher negative impact for companies that creating an ESG issue. We then developed a
hypothesis for this concern, as shown below:
H2b: The ESG issue reports published in more recent years result in more negative impact on the stock
return of the palm oil companies in Singapore, Indonesia, and Malaysia
Moreover, we also analyzed the national variation for the impact of the ESG issue reports in 2009 –
June 2015, as stated in the hypothesis H2c:
H2c: The palm oil companies listed in Indonesia show the worst abnormal return, while the palm oil
companies listed in Singapore show the best abnormal return among the three countries in the
impact of the ESG issue reports in 2009 – June 2015

Event definition and hypotheses development
ESG issues in the palm oil investments - 20
3.3 The ESG commitment reports
We developed an additional research on the event when the palm oil companies published a
commitment to improve their ESG performance in 2009 – June 2015. Since we have created a
hypothesis that the stock return is negatively affected by the ESG issue reports, it is interesting to
strengthen this hypothesis by also analyzing how the stock return is affected by the ESG commitment
reports. Surely, we expect that the stock return is positively affected by these ESG commitments. The
hypothesis for this analysis is shown below:
H3: The stock return of the listed palm oil companies in Singapore, Indonesia, and Malaysia are
positively affected by the ESG commitment reports in 2009 – June 2015
ESG issues in the palm oil investments - 21
4 Event study model development In this chapter, we present the development of the event study model which is suitable to do the
assessment to answer our main research question. The event study model developed in this research
is mainly based on MacKinlay (1997).
4.1 Assessment methodology
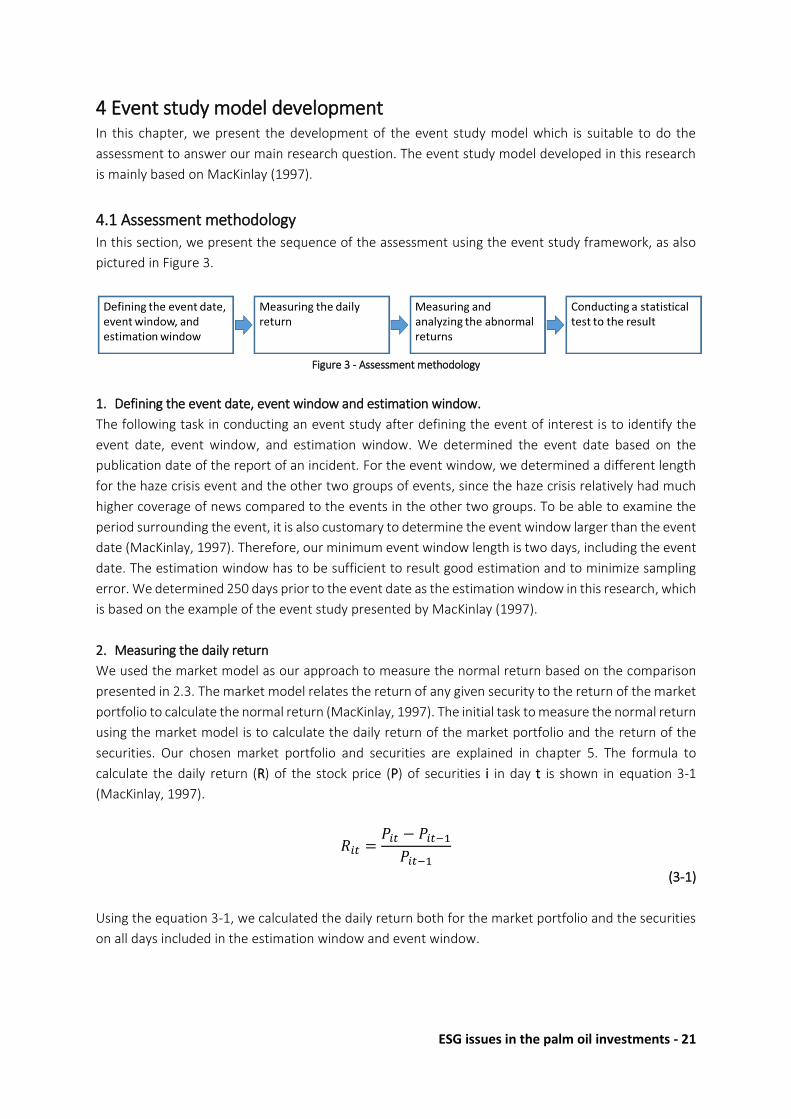
In this section, we present the sequence of the assessment using the event study framework, as also
pictured in Figure 3.
Figure 3 - Assessment methodology
1. Defining the event date, event window and estimation window.
The following task in conducting an event study after defining the event of interest is to identify the
event date, event window, and estimation window. We determined the event date based on the
publication date of the report of an incident. For the event window, we determined a different length
for the haze crisis event and the other two groups of events, since the haze crisis relatively had much
higher coverage of news compared to the events in the other two groups. To be able to examine the
period surrounding the event, it is also customary to determine the event window larger than the event
date (MacKinlay, 1997). Therefore, our minimum event window length is two days, including the event
date. The estimation window has to be sufficient to result good estimation and to minimize sampling
error. We determined 250 days prior to the event date as the estimation window in this research, which
is based on the example of the event study presented by MacKinlay (1997).
2. Measuring the daily return
We used the market model as our approach to measure the normal return based on the comparison
presented in 2.3. The market model relates the return of any given security to the return of the market
portfolio to calculate the normal return (MacKinlay, 1997). The initial task to measure the normal return
using the market model is to calculate the daily return of the market portfolio and the return of the
securities. Our chosen market portfolio and securities are explained in chapter 5. The formula to
calculate the daily return (R) of the stock price (P) of securities i in day t is shown in equation 3-1
(MacKinlay, 1997).
𝑅𝑖𝑡 =𝑃𝑖𝑡 − 𝑃𝑖𝑡−1
𝑃𝑖𝑡−1
(3-1)
Using the equation 3-1, we calculated the daily return both for the market portfolio and the securities
on all days included in the estimation window and event window.
Event study model development
ESG issues in the palm oil investments - 22
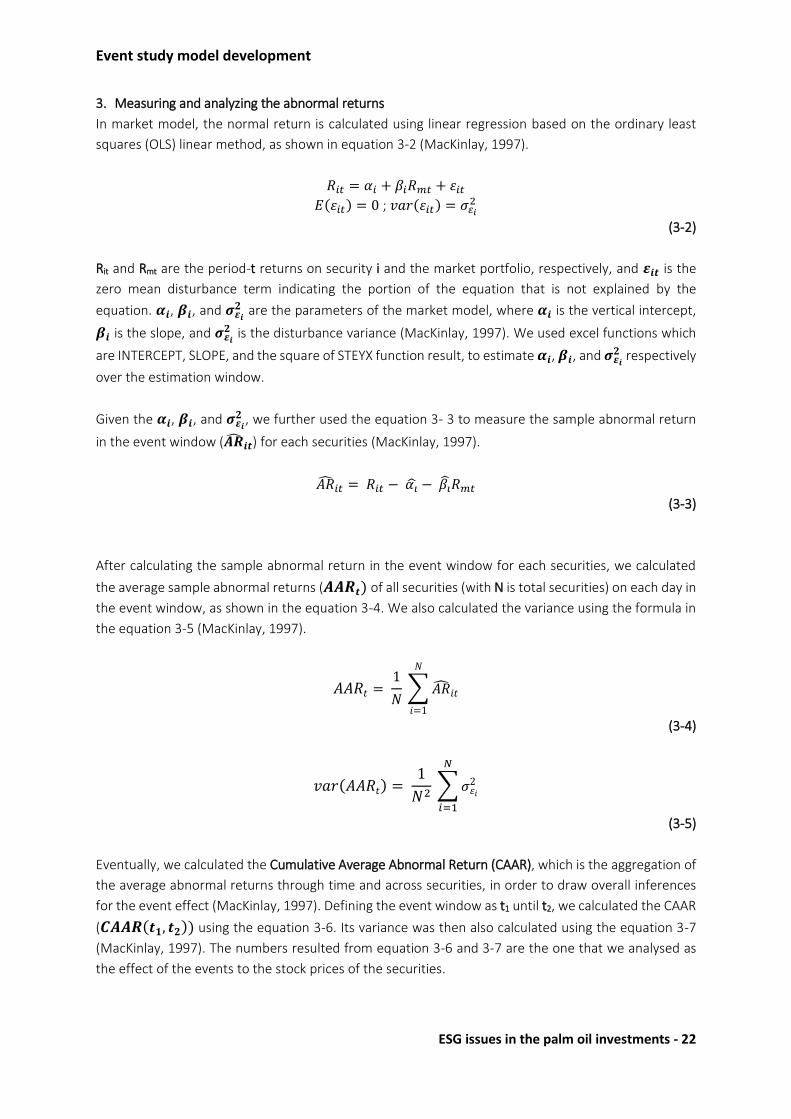
3. Measuring and analyzing the abnormal returns
In market model, the normal return is calculated using linear regression based on the ordinary least
squares (OLS) linear method, as shown in equation 3-2 (MacKinlay, 1997).
𝑅𝑖𝑡 = 𝛼𝑖 + 𝛽𝑖𝑅𝑚𝑡 + 𝜀𝑖𝑡
𝐸(𝜀𝑖𝑡) = 0 ; 𝑣𝑎𝑟(𝜀𝑖𝑡) = 𝜎𝜀𝑖2
(3-2)
Rit and Rmt are the period-t returns on security i and the market portfolio, respectively, and 𝜺𝒊𝒕 is the
zero mean disturbance term indicating the portion of the equation that is not explained by the
equation. 𝜶𝒊, 𝜷𝒊, and 𝝈𝜺𝒊𝟐 are the parameters of the market model, where 𝜶𝒊 is the vertical intercept,
𝜷𝒊 is the slope, and 𝝈𝜺𝒊𝟐 is the disturbance variance (MacKinlay, 1997). We used excel functions which
are INTERCEPT, SLOPE, and the square of STEYX function result, to estimate 𝜶𝒊, 𝜷𝒊, and 𝝈𝜺𝒊𝟐 respectively
over the estimation window.
Given the 𝜶𝒊, 𝜷𝒊, and 𝝈𝜺𝒊𝟐 , we further used the equation 3- 3 to measure the sample abnormal return
in the event window (𝑨�̂�𝒊𝒕) for each securities (MacKinlay, 1997).
𝐴�̂�𝑖𝑡 = 𝑅𝑖𝑡 − 𝛼�̂� − 𝛽�̂�𝑅𝑚𝑡
(3-3)
After calculating the sample abnormal return in the event window for each securities, we calculated
the average sample abnormal returns (𝑨𝑨𝑹𝒕) of all securities (with N is total securities) on each day in
the event window, as shown in the equation 3-4. We also calculated the variance using the formula in
the equation 3-5 (MacKinlay, 1997).
𝐴𝐴𝑅𝑡 = 1
𝑁 ∑ 𝐴�̂�𝑖𝑡
𝑁
𝑖=1
(3-4)
𝑣𝑎𝑟(𝐴𝐴𝑅𝑡) = 1
𝑁2 ∑ 𝜎𝜀𝑖
2
𝑁
𝑖=1
(3-5)
Eventually, we calculated the Cumulative Average Abnormal Return (CAAR), which is the aggregation of
the average abnormal returns through time and across securities, in order to draw overall inferences
for the event effect (MacKinlay, 1997). Defining the event window as t1 until t2, we calculated the CAAR
(𝑪𝑨𝑨𝑹(𝒕𝟏, 𝒕𝟐)) using the equation 3-6. Its variance was then also calculated using the equation 3-7
(MacKinlay, 1997). The numbers resulted from equation 3-6 and 3-7 are the one that we analysed as
the effect of the events to the stock prices of the securities.
Event study model development
ESG issues in the palm oil investments - 23
𝐶𝐴𝐴𝑅(𝑡1, 𝑡2) = ∑ 𝐴𝐴𝑅𝑡
𝑡2
𝑡=𝑡1
(3-6)
𝑣𝑎𝑟(𝐶𝐴𝐴𝑅(𝑡1, 𝑡2)) = ∑ 𝑣𝑎𝑟(𝐴𝐴𝑅𝑡)
𝑡2
𝑡=𝑡1
(3-7)
4. Conducting a statistical test to the result
The null hypothesis in conducting event study framework (H0a) is that the event has no impact on the
behavior of returns (mean or variance) (MacKinlay, 1997). Therefore, looking at the hypotheses
developed in this research, we expect to reject this H0a. Under the H0a, the distribution of
𝐶𝐴𝐴𝑅(𝒕𝟏, 𝒕𝟐) is asymptotically normal with zero mean and unit variance as shown in equation 3-8.
𝐶𝐴𝐴𝑅(𝑡1, 𝑡2)~ 𝑁[0, 𝑣𝑎𝑟(𝐶𝐴𝐴𝑅(𝑡1, 𝑡2))]
(3-8)
The assumptions of the 𝐶𝐴𝐴𝑅(𝒕𝟏, 𝒕𝟐) distribution are multivariate normal, independent, and
identically distributed. The central limit theorem guarantees that if the abnormal returns in the
securities are independent and identically distributed, the distribution of 𝑨𝑨𝑹𝒕 converges to normality
as the number of samples of securities increases (Brown & Warner, 1985). Therefore, 𝐶𝐴𝐴𝑅(𝒕𝟏, 𝒕𝟐),
as the cumulative of 𝑨𝑨𝑹𝒕, also has asymptotically normal distribution. Nevertheless, the
normality of 𝑨𝑨𝑹𝒕 will still be tested to validate the model.
Next, we tested the H0a using the distributional properties of 𝐶𝐴𝐴𝑅(𝒕𝟏, 𝒕𝟐) which is shown in the
equation 3-9.
𝜃1 = 𝐶𝐴𝐴𝑅(𝑡1, 𝑡2)
𝑣𝑎𝑟(𝐶𝐴𝐴𝑅(𝑡1, 𝑡2))12
~ 𝑁(0,1)
(3-9)
The last step of the statistical test is calculating the significance level of 𝜽𝟏, which is expressed as the
P-value. The P-value is the probability of getting a value as extreme as or more extreme than what was
actually observed, given that H0a is true (Larsen & Marx, 2012). We applied a one tailed t-test to the
𝜽𝟏, with degree of freedom as N – 1, using an Excel TDIST function. If the P-value calculated is less than
or equal to 𝜶, the H0a can be rejected at the 𝜶 level of significance (Larsen & Marx, 2012). We compared
the result of the test using significance level of 𝜶 = 10%, 𝜶 = 5% and 𝜶 = 1%.
5. Comparing the CAAR between two clusters
An additional statistical test was done after we conducted the assessment to find the CAAR for each
clusters defined in the hypotheses. We compared the CAAR between two clusters to measure whether
the CAAR difference between two clusters is really significance. We used Welch’s approximation (also
known as the unequal variance t-test) to do the comparison. The null hypothesis for this statistical test

Event study model development
ESG issues in the palm oil investments - 24
(H0b) is the CAAR between two clusters are equal, thus we expected to reject the H0b to support our
hypotheses (Larsen & Marx, 2012).
Defining CAARX and CAARY as the CAAR of two clusters that were tested, we calculated the random
variable W of the difference of the two clusters using equation 3-10 (Larsen & Marx, 2012).
𝑊 = 𝐶𝐴𝐴𝑅𝑋 − 𝐶𝐴𝐴𝑅𝑌
√𝑣𝑎𝑟(𝐶𝐴𝐴𝑅𝑋)
𝑛+
𝑣𝑎𝑟(𝐶𝐴𝐴𝑅𝑌)𝑚
(3-10)
We defined n and m as the sample size, then var(CAARX) and var(CAARY) as the variances of CAARX and
CAARY respectively. In Welch’s approximation, W is approximately distributed as a Student t random
variable (Larsen & Marx, 2012). The degrees of freedom of the student t distribution (v) is calculated
using the equation 3-11 (Larsen & Marx, 2012).
𝑣 = (𝑣𝑎𝑟(𝐶𝐴𝐴𝑅𝑋)𝑣𝑎𝑟(𝐶𝐴𝐴𝑅𝑌)
+𝑛𝑚)2
1(𝑛 − 1)
(𝑣𝑎𝑟(𝐶𝐴𝐴𝑅𝑋)𝑣𝑎𝑟(𝐶𝐴𝐴𝑅𝑌)
)2 +1
(𝑚 − 1)(
𝑛𝑚)2
(3-11)
Similar with our previous statistical test, the significance level is expressed as the P-value. We applied
a one tailed t-test to the W, with degree of freedom of v (rounded down to the nearest integer), using
an Excel function of TDIST. If the P-value calculated is less than or equal to 𝜶, the H0b can be rejected
at the 𝜶 level of significance (Larsen & Marx, 2012). We also compared the result of the test using
significance level of 𝜶 = 10%, 𝜶 = 5% and 𝜶 = 1%.
4.2 Validity test methods
The validity test was conducted on the regression in market model and the normality assumption of
the 𝑨𝑨𝑹𝒕. The regression validation is done by analyzing the R2 of the regression. The R2 is the
proportion of the total variation in the stock returns of the company that can be attributed to the linear
relationship with the stock returns of the market (Larsen & Marx, 2012). In general, the higher the R2,
the better the model fits the data. The R2 is calculated using the Excel RSQ function over the market
returns and the company returns.
The second validation test was conducted on the normality assumption of the 𝑨𝑨𝑹𝒕. We took the
𝑨𝑨𝑹𝒕 over the estimation window and test for its normality using the q-q plot and chi-square test. The
steps to conduct the q-q plot are shown below (Law, 2014):
1. Sorting the 𝑨𝑨𝑹𝒕 of the estimation window from the lowest to the highest (so called the actual
data).
2. Calculating the Cumulative Distribution Function (CDF) consecutively with the sorted actual data.
3. Calculating the expected value in normal distribution for each CDF using the Excel NORM.INV
function.
Event study model development
ESG issues in the palm oil investments - 25
4. Calculating the z-value for each CDF using the Excel NORM.S.INV function.
5. Plotting the actual data to the z-value to create the q-q- plot, then plotting the expected value to
the z-value as a reference line.
To better have perspective at which extent we can sure that the probability of the 𝑨𝑨𝑹𝒕 is indeed
normal, we also conducted the chi-square test. The steps to conduct the chi-square test are shown
below (Law, 2014):
1. Creating the bins which containing borders resulted from the expected value range.
2. Calculating the frequencies of both the expected data and the actual data in each bins.
3. Determining the chi-square test result using the Excel CHISQ.TEST function which is expressed in P-
value.
4. If the P-value calculated is less than or equal to 𝜶, the hypothesis that the 𝑨𝑨𝑹𝒕 is independent ,
identically, and normally distributed can be rejected at the 𝜶 level of significance (Law, 2014).
4.3 Reliability test methods
We conducted reliability tests by performing sensitivity analysis and reassessment using the constant
mean return model. The independent variables that are used in the sensitivity analysis are the
estimation window length and the event window length. We intend to see how the result of the
assessment affected by the changes of these variables. The sensitivity analysis was done by creating
different combinations of estimation window and event window then performing the assessment for
each of the combinations.
The second reliability test is the reassessment using constant mean return model. In constant mean
return model, the abnormal return (𝑨�̂�𝒊𝒕) of security i in period t is calculated using the formula in
equation 3-12.
𝑨�̂�𝒊𝒕 = 𝑅𝑖𝑡 − 𝜇𝑖
(3-12)
Rit is the period-t returns on security i in the event window and 𝝁𝒊 is the mean return of the security in
the estimation window. The standard deviation of the abnormal return is calculated simply using the
Excel STDEV function over the estimation window and then the variance of the abnormal return is the
square of the standard deviation. Except for the calculation of the abnormal return and its variance, the
sequence of the assessment using the constant mean return model is the same as previously explained.
The intention to do the reassessment using the constant mean return model is to see if our data show
significantly different results compared to the assessment using the market model, which explains its
reliability.
ESG issues in the palm oil investments - 26
5 Data collection The fifth chapter of this thesis contains the explanation of the data collection, including the sources and
the criteria of selection of each data used in the research.
5.1 List of listed palm oil companies in Singapore, Indonesia, and Malaysia
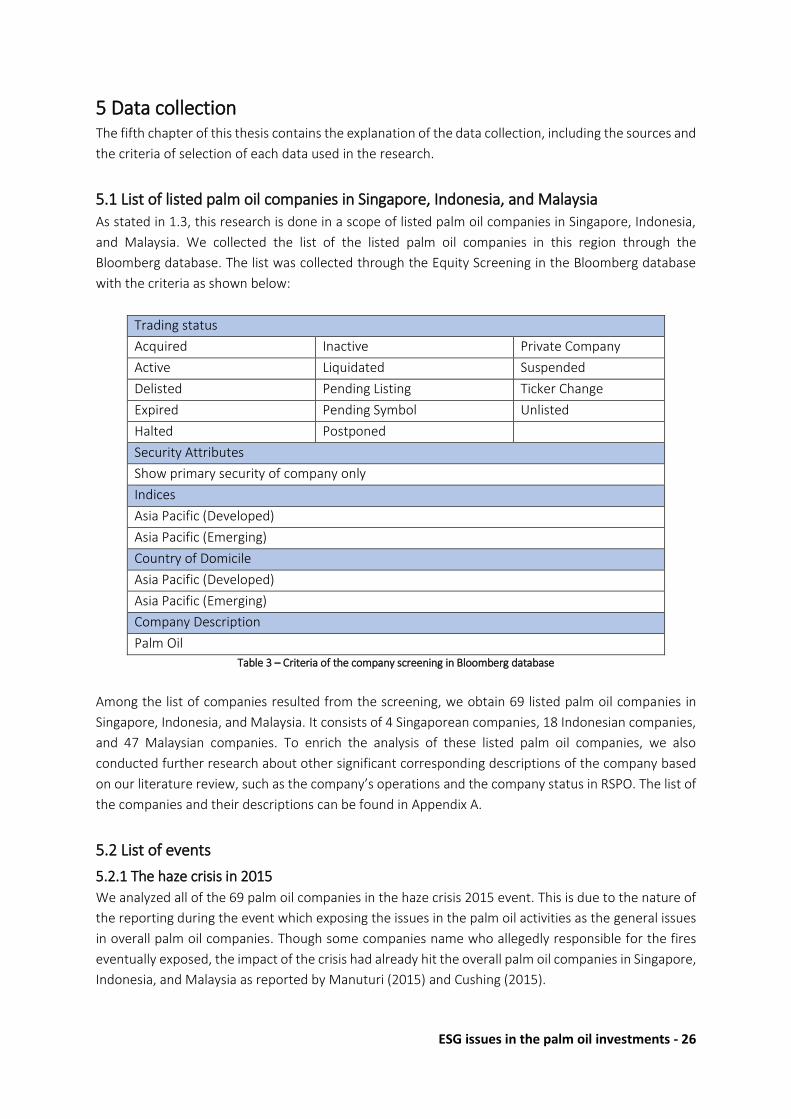
As stated in 1.3, this research is done in a scope of listed palm oil companies in Singapore, Indonesia,
and Malaysia. We collected the list of the listed palm oil companies in this region through the
Bloomberg database. The list was collected through the Equity Screening in the Bloomberg database
with the criteria as shown below:
Trading status
Acquired Inactive Private Company
Active Liquidated Suspended
Delisted Pending Listing Ticker Change
Expired Pending Symbol Unlisted
Halted Postponed
Security Attributes
Show primary security of company only
Indices
Asia Pacific (Developed)
Asia Pacific (Emerging)
Country of Domicile
Asia Pacific (Developed)
Asia Pacific (Emerging)
Company Description
Palm Oil
Table 3 – Criteria of the company screening in Bloomberg database
Among the list of companies resulted from the screening, we obtain 69 listed palm oil companies in
Singapore, Indonesia, and Malaysia. It consists of 4 Singaporean companies, 18 Indonesian companies,
and 47 Malaysian companies. To enrich the analysis of these listed palm oil companies, we also
conducted further research about other significant corresponding descriptions of the company based
on our literature review, such as the company’s operations and the company status in RSPO. The list of
the companies and their descriptions can be found in Appendix A.
5.2 List of events
5.2.1 The haze crisis in 2015
We analyzed all of the 69 palm oil companies in the haze crisis 2015 event. This is due to the nature of
the reporting during the event which exposing the issues in the palm oil activities as the general issues
in overall palm oil companies. Though some companies name who allegedly responsible for the fires
eventually exposed, the impact of the crisis had already hit the overall palm oil companies in Singapore,
Indonesia, and Malaysia as reported by Manuturi (2015) and Cushing (2015).

Data collection
ESG issues in the palm oil investments - 27
To determine the event date as the input in our assessment, we created a timeline based on the news
of the haze crisis as shown in Figure 4. The date on the timeline is the publication date of the news. This
timeline is built based on the online articles written by Gunawan (2015), Samadhi (2015), Afrizal &
Harahap (2015), Jacobson & Sirait (2015), and Manuturi (2015), respectively from the oldest to the
newest date. Based on the timeline of the haze crisis, we determined the event date on the July 31,
2015, the day after the first news mentioning palm oil companies’ role in the haze crisis published.
Figure 4 - Haze crisis 2015 timeline
To test the developed hypotheses in the haze crisis event, we divided the 69 palm oil companies based
on the criteria in the hypotheses, which are their RSPO status, activities, and listing country. Table 4
shows number of samples for each determined criteria. The RSPO status and the activities data were
gathered by checking the RSPO website and each of the palm oil company’s website.
Criteria No. of samples
Total samples 69
RSPO members 25
Upstream activities 59
Listed in Singapore 4
Listed in Indonesia 18
Listed in Malaysia 47
Table 4 - Number of samples in the haze crisis event assessment
5.2.2 The ESG issue reports
We focused on the cases that are reported in NGO publications for collecting ESG issues to be assessed
in this research. To confirm the significance of the issues, we also set other criteria for the NGO reports
that are collected, which are the name of the palm oil companies has to be mentioned on the title or
the summary of the report, and it has been responded from the mentioned company. The cases that
are collected are bounded in the period of 1st January 2009 until 1st July 2015. For the events exposing
companies that have subsidiaries also listed either in Singapore, Indonesia, or Malaysia, we also put
their subsidiaries in the list of samples to be assessed. This is the case for the ESG reports exposing
Golden Agri Resources and Wilmar International, where we also put their subsidiaries, which are SMART
and Wilmar Cahaya Indonesia respectively in the list of samples. Eventually, there are 36 samples of
Data collection
ESG issues in the palm oil investments - 28
ESG issue reports that we assessed in this research to test hypothesis H2. The collected ESG issues can
be found in Appendix B.
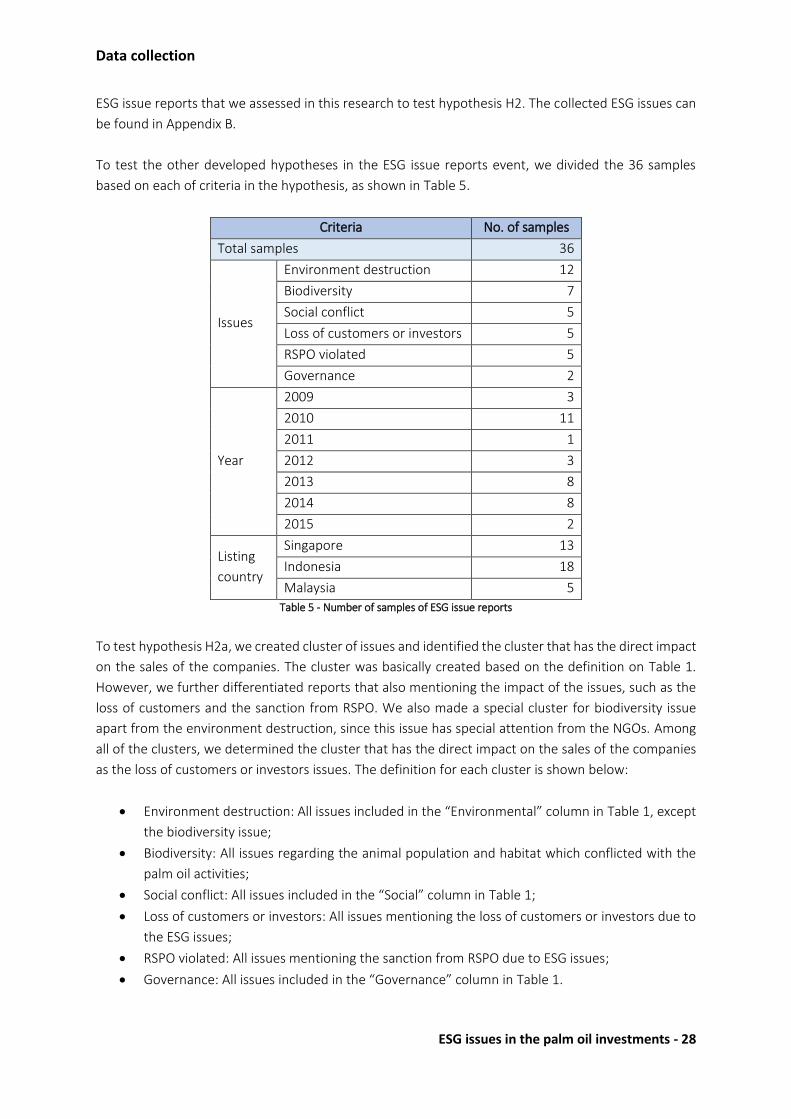
To test the other developed hypotheses in the ESG issue reports event, we divided the 36 samples
based on each of criteria in the hypothesis, as shown in Table 5.
Criteria No. of samples
Total samples 36
Issues
Environment destruction 12
Biodiversity 7
Social conflict 5
Loss of customers or investors 5
RSPO violated 5
Governance 2
Year
2009 3
2010 11
2011 1
2012 3
2013 8
2014 8
2015 2
Listing
country
Singapore 13
Indonesia 18
Malaysia 5
Table 5 - Number of samples of ESG issue reports
To test hypothesis H2a, we created cluster of issues and identified the cluster that has the direct impact
on the sales of the companies. The cluster was basically created based on the definition on Table 1.
However, we further differentiated reports that also mentioning the impact of the issues, such as the
loss of customers and the sanction from RSPO. We also made a special cluster for biodiversity issue
apart from the environment destruction, since this issue has special attention from the NGOs. Among
all of the clusters, we determined the cluster that has the direct impact on the sales of the companies
as the loss of customers or investors issues. The definition for each cluster is shown below:
Environment destruction: All issues included in the “Environmental” column in Table 1, except
the biodiversity issue;
Biodiversity: All issues regarding the animal population and habitat which conflicted with the
palm oil activities;
Social conflict: All issues included in the “Social” column in Table 1;
Loss of customers or investors: All issues mentioning the loss of customers or investors due to
the ESG issues;
RSPO violated: All issues mentioning the sanction from RSPO due to ESG issues;
Governance: All issues included in the “Governance” column in Table 1.

Data collection
ESG issues in the palm oil investments - 29
To avoid correlation between clusters, if a report contains more than one issue, we only put it in one
cluster where the issue is the most highlighted in the report. We noticed that in some groups, the
number of samples are relatively low. This could result in insignificance result of the test. As the
consequences, not all the assessment results can be extracted into an inference.
5.2.3 The ESG commitment reports
The collected ESG commitments consist of the reports mentioning the palm oil companies pledge to
improve their performance on ESG criteria and also the events when the palm oil companies joining
RSPO. The reports that are collected are bounded in the same period as the ESG issue events which is
1st January 2009 until 1st July 2015. To test hypothesis H3, we eventually gathered 13 samples to be
assessed. The collection of the ESG commitment can be found in Appendix C.
5.3 Stock prices of the assessed companies
We defined the securities in our event study model as the stock price of the palm oil companies that
are exposed by the reports of the incident. The stock prices historical data of the listed palm oil
companies in Singapore, Indonesia, and Malaysia that included in the assessment are extracted from
the Bloomberg database. These data were extracted over a period of 1st January 2008 up to 30th
November 2015, thus the requirement of the data period to do the event study can be covered.
To conduct the assessment based on the market model of the event study, we first need to define the
market portfolio. We have two alternatives of market portfolio to be used in the assessment, which are
the country indices and the crude palm oil (CPO) prices. We extracted the suitable indices’ prices,
including MXSG Index, MXID Index, and MXMY Index1 as the first alternative of market portfolio for the
palm oil companies in Singapore, Indonesia, and Malaysia respectively. The second alternative is the
Malaysian Palm Oil Board Crude Palm Oil FOB Spot Prices (PAL2MALY Index), which also extracted from
the Bloomberg database. PAL2MALY Index was chosen since it is also used as one of the crude palm oil
price references both in Malaysia and Indonesia. The benefit from using the market model depends on
the R2 of the regression, where the higher R2 the greater is the variance reduction of the abnormal
return (MacKinlay, 1997). Therefore, we eventually will choose the market portfolio from the two
alternatives based on the better R2 in the first assessment to test H1.
The trading days that become our reference is the trading days of the biggest market cap securities
among all of the companies, which is Wilmar International. From the extraction of the stock prices, we
found some missing daily data in each of securities in the Bloomberg database. The missing daily data
are the non-trading days and non-transactions days for the corresponding companies. We handled this
missing data by inserting the stock price of the day before the missing data.
1 The name of the index is as shown as the ticker in the Bloomberg database.
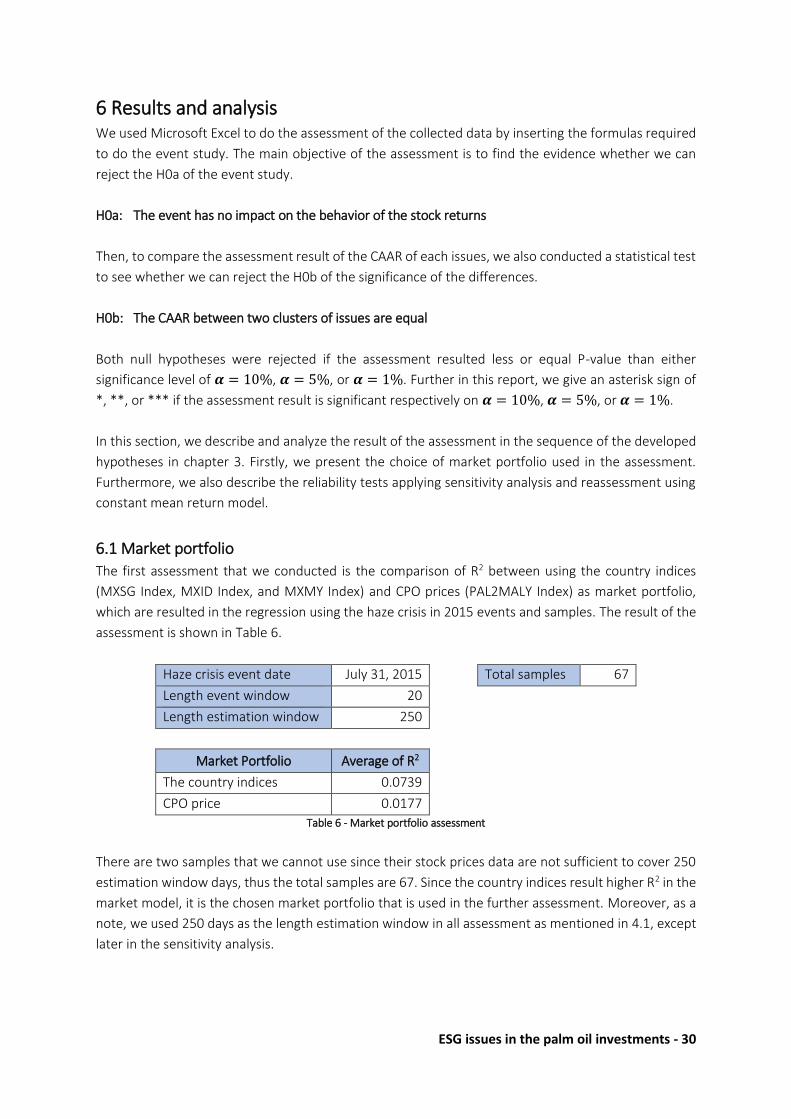
ESG issues in the palm oil investments - 30
6 Results and analysis We used Microsoft Excel to do the assessment of the collected data by inserting the formulas required
to do the event study. The main objective of the assessment is to find the evidence whether we can
reject the H0a of the event study.
H0a: The event has no impact on the behavior of the stock returns
Then, to compare the assessment result of the CAAR of each issues, we also conducted a statistical test
to see whether we can reject the H0b of the significance of the differences.
H0b: The CAAR between two clusters of issues are equal
Both null hypotheses were rejected if the assessment resulted less or equal P-value than either
significance level of 𝜶 = 10%, 𝜶 = 5%, or 𝜶 = 1%. Further in this report, we give an asterisk sign of
*, **, or *** if the assessment result is significant respectively on 𝜶 = 10%, 𝜶 = 5%, or 𝜶 = 1%.
In this section, we describe and analyze the result of the assessment in the sequence of the developed
hypotheses in chapter 3. Firstly, we present the choice of market portfolio used in the assessment.
Furthermore, we also describe the reliability tests applying sensitivity analysis and reassessment using
constant mean return model.
6.1 Market portfolio
The first assessment that we conducted is the comparison of R2 between using the country indices
(MXSG Index, MXID Index, and MXMY Index) and CPO prices (PAL2MALY Index) as market portfolio,
which are resulted in the regression using the haze crisis in 2015 events and samples. The result of the
assessment is shown in Table 6.
Haze crisis event date July 31, 2015 Total samples 67
Length event window 20
Length estimation window 250
Market Portfolio Average of R2
The country indices 0.0739
CPO price 0.0177
Table 6 - Market portfolio assessment
There are two samples that we cannot use since their stock prices data are not sufficient to cover 250
estimation window days, thus the total samples are 67. Since the country indices result higher R2 in the
market model, it is the chosen market portfolio that is used in the further assessment. Moreover, as a
note, we used 250 days as the length estimation window in all assessment as mentioned in 4.1, except
later in the sensitivity analysis.
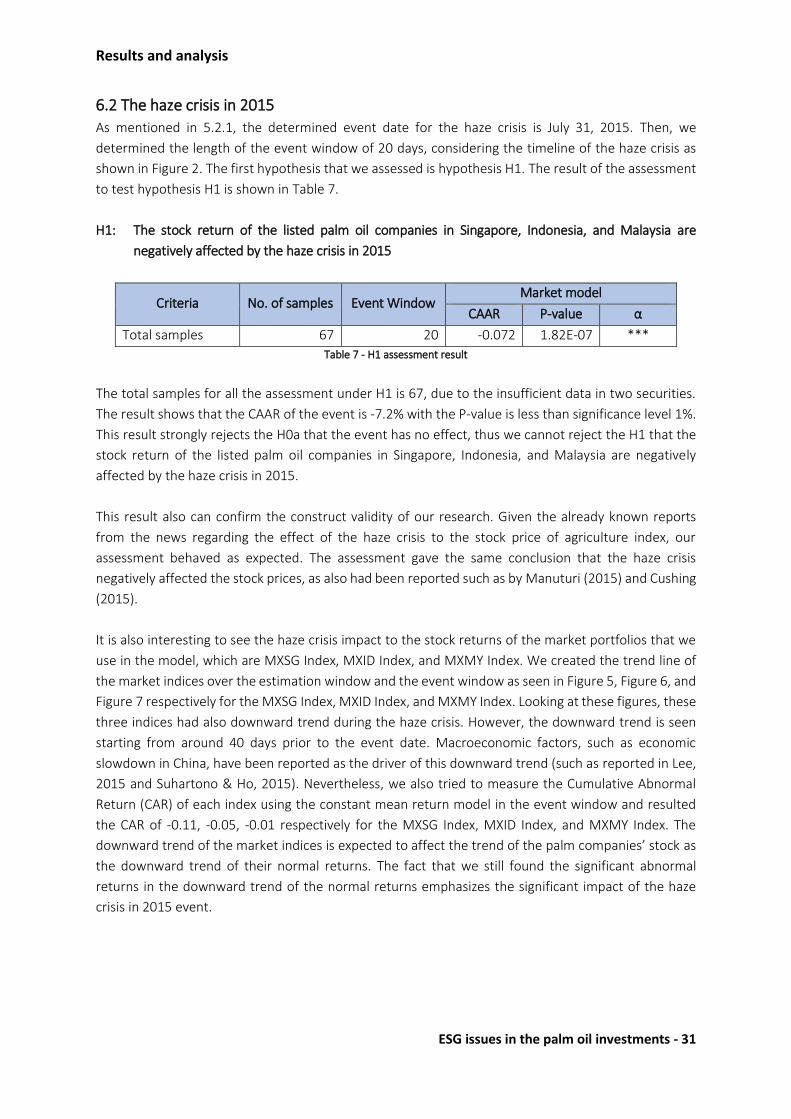
Results and analysis
ESG issues in the palm oil investments - 31
6.2 The haze crisis in 2015
As mentioned in 5.2.1, the determined event date for the haze crisis is July 31, 2015. Then, we
determined the length of the event window of 20 days, considering the timeline of the haze crisis as
shown in Figure 2. The first hypothesis that we assessed is hypothesis H1. The result of the assessment
to test hypothesis H1 is shown in Table 7.
H1: The stock return of the listed palm oil companies in Singapore, Indonesia, and Malaysia are
negatively affected by the haze crisis in 2015
Criteria No. of samples Event Window Market model
CAAR P-value α
Total samples 67 20 -0.072 1.82E-07 ***
Table 7 - H1 assessment result
The total samples for all the assessment under H1 is 67, due to the insufficient data in two securities.
The result shows that the CAAR of the event is -7.2% with the P-value is less than significance level 1%.
This result strongly rejects the H0a that the event has no effect, thus we cannot reject the H1 that the
stock return of the listed palm oil companies in Singapore, Indonesia, and Malaysia are negatively
affected by the haze crisis in 2015.
This result also can confirm the construct validity of our research. Given the already known reports
from the news regarding the effect of the haze crisis to the stock price of agriculture index, our
assessment behaved as expected. The assessment gave the same conclusion that the haze crisis
negatively affected the stock prices, as also had been reported such as by Manuturi (2015) and Cushing
(2015).
It is also interesting to see the haze crisis impact to the stock returns of the market portfolios that we
use in the model, which are MXSG Index, MXID Index, and MXMY Index. We created the trend line of
the market indices over the estimation window and the event window as seen in Figure 5, Figure 6, and
Figure 7 respectively for the MXSG Index, MXID Index, and MXMY Index. Looking at these figures, these
three indices had also downward trend during the haze crisis. However, the downward trend is seen
starting from around 40 days prior to the event date. Macroeconomic factors, such as economic
slowdown in China, have been reported as the driver of this downward trend (such as reported in Lee,
2015 and Suhartono & Ho, 2015). Nevertheless, we also tried to measure the Cumulative Abnormal
Return (CAR) of each index using the constant mean return model in the event window and resulted
the CAR of -0.11, -0.05, -0.01 respectively for the MXSG Index, MXID Index, and MXMY Index. The
downward trend of the market indices is expected to affect the trend of the palm companies’ stock as
the downward trend of their normal returns. The fact that we still found the significant abnormal
returns in the downward trend of the normal returns emphasizes the significant impact of the haze
crisis in 2015 event.
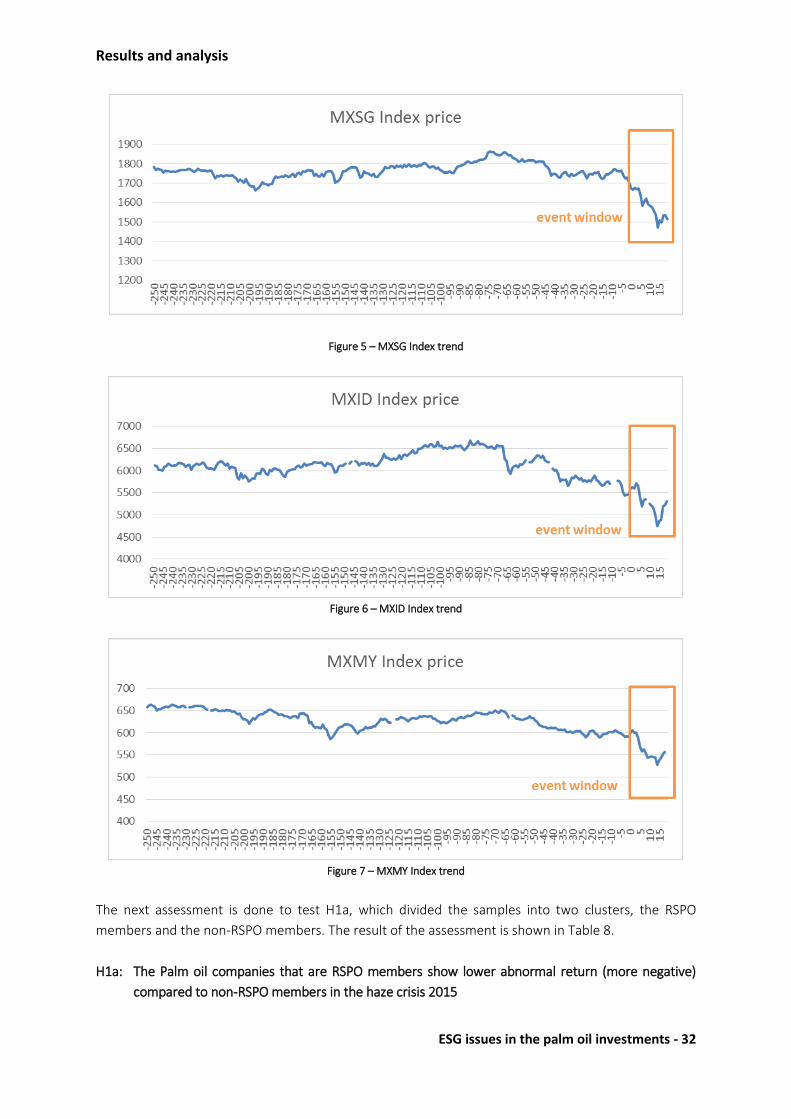
Results and analysis
ESG issues in the palm oil investments - 32
Figure 5 – MXSG Index trend
Figure 6 – MXID Index trend
Figure 7 – MXMY Index trend
The next assessment is done to test H1a, which divided the samples into two clusters, the RSPO
members and the non-RSPO members. The result of the assessment is shown in Table 8.
H1a: The Palm oil companies that are RSPO members show lower abnormal return (more negative)
compared to non-RSPO members in the haze crisis 2015
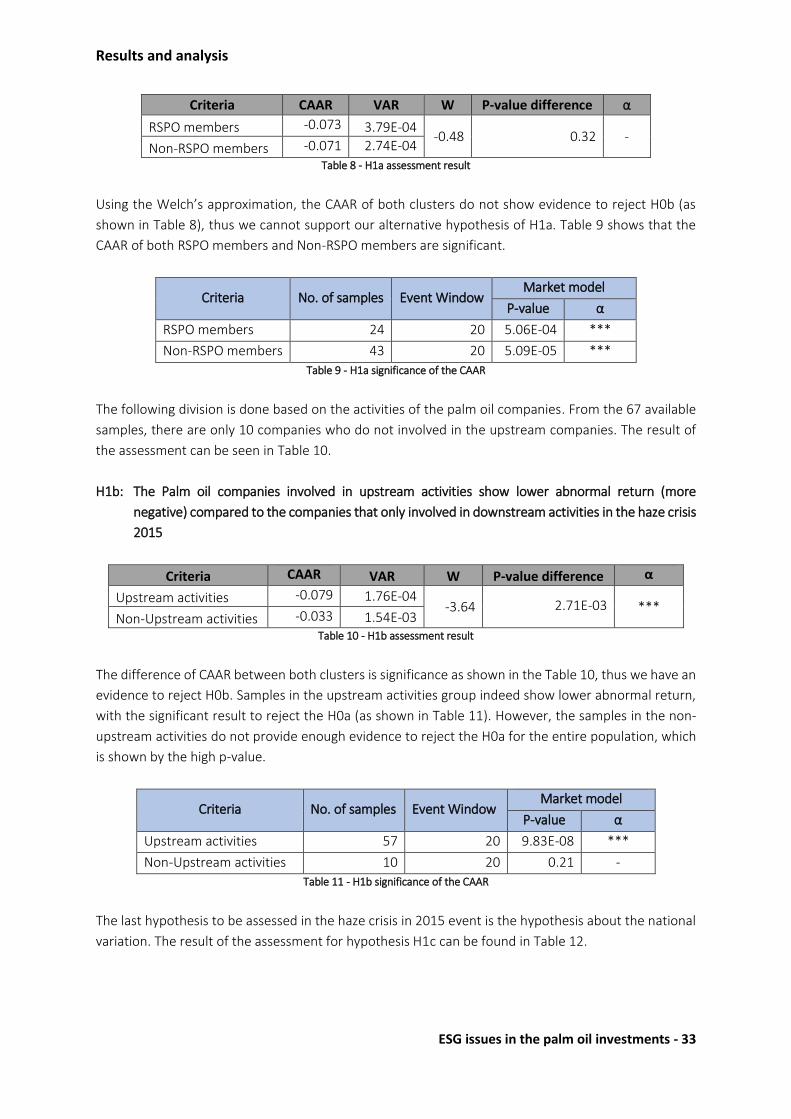
Results and analysis
ESG issues in the palm oil investments - 33
Criteria CAAR VAR W P-value difference α
RSPO members -0.073 3.79E-04 -0.48 0.32 -
Non-RSPO members -0.071 2.74E-04
Table 8 - H1a assessment result
Using the Welch’s approximation, the CAAR of both clusters do not show evidence to reject H0b (as
shown in Table 8), thus we cannot support our alternative hypothesis of H1a. Table 9 shows that the
CAAR of both RSPO members and Non-RSPO members are significant.
Criteria No. of samples Event Window Market model
P-value α
RSPO members 24 20 5.06E-04 ***
Non-RSPO members 43 20 5.09E-05 ***
Table 9 - H1a significance of the CAAR
The following division is done based on the activities of the palm oil companies. From the 67 available
samples, there are only 10 companies who do not involved in the upstream companies. The result of
the assessment can be seen in Table 10.
H1b: The Palm oil companies involved in upstream activities show lower abnormal return (more
negative) compared to the companies that only involved in downstream activities in the haze crisis
2015
Criteria CAAR VAR W P-value difference α
Upstream activities -0.079 1.76E-04 -3.64 2.71E-03 ***
Non-Upstream activities -0.033 1.54E-03 Table 10 - H1b assessment result
The difference of CAAR between both clusters is significance as shown in the Table 10, thus we have an
evidence to reject H0b. Samples in the upstream activities group indeed show lower abnormal return,
with the significant result to reject the H0a (as shown in Table 11). However, the samples in the non-
upstream activities do not provide enough evidence to reject the H0a for the entire population, which
is shown by the high p-value.
Criteria No. of samples Event Window Market model
P-value α
Upstream activities 57 20 9.83E-08 ***
Non-Upstream activities 10 20 0.21 -
Table 11 - H1b significance of the CAAR
The last hypothesis to be assessed in the haze crisis in 2015 event is the hypothesis about the national
variation. The result of the assessment for hypothesis H1c can be found in Table 12.

Results and analysis
ESG issues in the palm oil investments - 34
H1c: The palm oil companies listed in Indonesia show the worst abnormal return, while the palm oil
companies listed in Singapore show the best abnormal return among the three countries in the
haze crisis 2015
Criteria CAAR VAR W P-value difference α
Listed in Singapore -0.035 1.07E-03 5.12 3.45E-03 ***
Listed in Indonesia -0.126 7.63E-04
Listed in Singapore -0.035 1.07E-03 1.28 1.45E-01 -
Listed in Malaysia -0.056 2.32E-04
Listed in Indonesia -0.126 7.63E-04 -9.59 8.43E-09 ***
Listed in Malaysia -0.056 2.32E-04 Table 12 - H1c assessment result
The difference between the CAAR of the listed companies in Singapore and Indonesia is significant, and
so does the difference between the CAAR of the listed companies in Indonesia and Malaysia. Therefore
the H0b for each of these two comparisons can be rejected. However, we do not have enough evidence
to reject the H0b for the comparison of the CAAR of the listed companies in Singapore and Malaysia.
Based on the assessment result, the CAAR in Indonesia indeed drives the CAAR of the total samples. It
shows the worst abnormal return compared to the other two countries, with significant low p-value,
thus the H0a is strongly rejected (as shown in Table 13). However, there are only 4 samples representing
companies listed in Singapore which produce insignificant result.
Criteria No. of samples Event Window Market model
P-value α
Listed in Singapore 4 20 0.18 -
Listed in Indonesia 16 20 1.86E-04 ***
Listed in Malaysia 47 20 2.80E-04 ***
Table 13 - H1c significance of the CAAR
6.3 The ESG issue reports
In this section, we describe and analyze the result of the assessment of the ESG issue reports. The
samples used in this assessment can be found in Appendix B. Since some of the event date (publication
date of the reports) fell on the non-trading days, we had to adjust some of the event date to the nearest
trading days after the firstly defined event date. The adjusted event date is shown in Table 14.
No Company Issue Adjusted event date Citation
1 Kuala Lumpur Kepong RSPO violated November 17, 2014 (Saturi, 2014)
2 Wilmar Biodiversity October 21, 2013 (Greenpeace, 2013)
3 Wilmar Cahaya Indonesia Biodiversity October 21, 2013 (Greenpeace, 2013)
Table 14 – Adjusted event date
The first hypothesis that we assessed for the ESG issue reports events is hypothesis H2. The result of
the assessment to test hypothesis H2 is shown in Table 15.

Results and analysis
ESG issues in the palm oil investments - 35
H2: The stock return of the listed palm oil companies in Singapore, Indonesia, and Malaysia are
negatively affected by the ESG issue reports in 2009 – June 2015
Criteria No. of samples Event Window Market model
CAAR P-value α
Total samples 36 2 -0.008 0.088 *
Table 15 - H2 assessment result
The assessment results p-value of 0.088, thus we have an evidence to reject H0a significantly at the
level 𝜶 = 10%. Looking at the CAAR resulted from the assessment, we have a figure showing that the
event negatively affected the stock return, although the effect is relatively low.
The next assessment is done to each of the issues. To test the hypothesis H2a, we first divided the
cluster into two groups, which are the issues that have direct impact to sales and not. The issue that
have direct impact to sales is the loss of customers or investors issue, while the others are categorized
as issues that have no direct impact to sales. After that, we also will see the assessment result for each
of the issues.
H2a: The ESG issue reports in 2009 - June 2015 that have a direct impact on the sales of the palm oil
companies in Singapore, Indonesia, and Malaysia result the lowest abnormal return among other
ESG issues
Criteria CAAR VAR W P-value difference α
Direct impact to sales -0.0182 3.76E-04 -1.30 0.13 -
Non - Direct impact to sales -0.0068 4.01E-05 Table 16 - H2a assessment result part 1
From the assessment result shown in Table 16, the CAAR of the group that has direct impact to sales is
higher than the group that does not have direct impact to sales. However, the difference of the two
clusters is not significance, thus we cannot reject H0b. These two clusters also result p-value higher
than significance level of 10% from the assessment, thus there is not enough evidence to reject the H0a
on each cluster (as shown in Table 17).
Criteria No. of samples Event Window Market model
P-value α
Direct impact to sales 5 2 0.20 -
Non - Direct impact to sales 31 2 0.15 -
Table 17 - H2a significance of the CAAR
H2b: The ESG issue reports published in more recent years result in more negative impact on the stock
return of the palm oil companies in Singapore, Indonesia, and Malaysia

Results and analysis
ESG issues in the palm oil investments - 36
Criteria CAAR VAR W P-value difference α
2009 - 2012 -0.015 9.53E-05 -4.68 2.65E-05 ***
2013 - 2015 -0.002 5.25E-05 Table 18 - H2b assessment result of two clusters of the years
We tried to make two clusters of the years, the cluster containing issues in 2009 – 2012 and the cluster
containing issues in 2013 – 2015, which gave us equal sample size for each cluster. As seen in Table 18,
the difference of the two clusters is significant, but the CAAR in 2009-2012 group is more negative
instead, thus it does not support the H2b. Looking solely at the CAAR in Table 20, we do not found an
obvious trend whether the CAAR is becoming more negative in each increasing years. Therefore, it is
unlikely that the driver of the significant result of two clusters in Table 18 is the difference of the years.
Criteria No. of samples Event Window Market model
P-value α
2009 - 2012 18 2 0.070 *
2013 - 2015 18 2 0.410 - Table 19 - H2b significance of the CAAR
Criteria No. of samples Event Window Market model
CAAR P-value α
2009 3 2 -0.0182 0.33 -
2010 11 2 -0.0170 0.10 *
2011 1 2 - - -
2012 3 2 -0.0084 0.31 -
2013 8 2 0.0019 0.44 -
2014 8 2 -0.0029 0.38 -
2015 2 2 -0.0110 0.34 -
Table 20 - The CAAR of each years
The last hypothesis to be assessed in the ESG issue reports event is the national variation. The result of
the assessment can be seen in Table 21.
H2c: The palm oil companies listed in Indonesia show the worst abnormal return, while the palm oil
companies listed in Singapore show the best abnormal return among the three countries in the
impact of the ESG issue reports in 2009 – June 2015
The differences of the CAAR of the three countries are significance, thus we have evidence to reject
H0b for all of the comparisons as shown in Table 21. However, The CAAR of all of the countries show
insignificant results, since the p-value in all groups are higher than the significance level of 10%, as
shown in Table 22. Looking at the CAAR, Indonesia indeed shows the worst abnormal return, but it is
Malaysia that has the best abnormal return.

Results and analysis
ESG issues in the palm oil investments - 37
Criteria CAAR VAR W P-value difference α
Singapore -0.0063 6.10E-05 2.03 2.59E-02 **
Indonesia -0.0130 1.12E-04
Singapore -0.0063 6.10E-05 -2.34 2.58E-02 **
Malaysia 0.0028 5.24E-05
Indonesia -0.0130 1.12E-04 -3.88 1.88E-03 ***
Malaysia 0.0028 5.24E-05 Table 21 - H2c assessment result
Criteria No. of samples Event Window Market model
P-value α
Singapore 13 2 0.22 -
Indonesia 18 2 0.12 -
Malaysia 5 2 0.36 -
Table 22 - H2c significance of the CAAR
6.4 The ESG commitment reports
Appendix C shows the collected samples that we assessed to test the hypothesis H3. The result of the
assessment is shown in Table 23.
H3: The stock return of the listed palm oil companies in Singapore, Indonesia, and Malaysia are
positively affected by the ESG commitment reports in 2009 – June 2015
Criteria No. of samples Event Window Market model
CAAR P-value α
Total samples 12 2 0.001 0.480 -
Table 23 - H3 assessment result
There is one sample that do not provide sufficient data to cover 250 estimation days, thus our number
of samples become 12. Looking at the p-value, we again do not have enough evidence to reject the H0a
for this set of samples.
6.5 Validation analysis
6.5.1 R2 analysis
We extracted the suitable indices’ prices, including MXSG Index, MXID Index, and MXMY Index as the
market portfolio for the palm oil companies in Singapore, Indonesia, and Malaysia respectively. The R2
is the proportion of the total variation in the stock returns of each of the companies that can be
attributed to the linear relationship with the stock returns of their corresponding market indices (Larsen
& Marx, 2012). In general, the higher the R2, the better the model fits the data. Table 24 shows the
resulted R2 in the market model regression.

Results and analysis
ESG issues in the palm oil investments - 38
R2
Total Samples Singapore Indonesia Malaysia
Average 0.07 0.13 0.05 0.08
Highest 0.27 0.24 0.16 0.27
Lowest 4.28E-05 0.06 4.28E-05 3.97E-04 Table 24 – R2 results
Looking at our R2 results, it can be inferred that the proportion of the total variation in the stock returns
that can be explained by the variation of the market indices is very low. The plausible reasons for the
low R2 are the different characteristic between the industries driving the market indices and the palm
oil industry, the effect of using closed prices rather than adjusted close, and the non-synchronous
trading. We provide the top fund holdings in each market indices in Appendix D. It shows that except
Malaysia, none of the top fund holdings in other two country indices are the agriculture industries.
The effect of using closed prices and the non-synchronous trading can result in biased and inconsistent
β in the regression estimates. However, the assessed variable in the event study is the abnormal return,
and not the result of the regression itself, which is the normal return. Hence, the possible failures
resulted from using closed prices and the non-synchronous trading do not result in misspecification of
the event study model. By construction, the cumulative abnormal returns of all companies in the
estimation window sum to zero, so that a bias in the estimate of β is compensated for a bias in α (Brown
& Warner, 1985). Therefore, regardless of the quality of the regression, if the event window shows
stationarity compared to the estimation window, the cumulative abnormal returns can be shown to
also have a mean equal to zero (Brown & Warner, 1985)..
Nevertheless, the market model can improve the constant mean return model by removing the portion
of the return that is related to variation in the market’s return, thus the variance of the abnormal return
is reduced (MacKinlay, 1997). This benefit can be achieved if we have sufficiently high R2 for the variance
reduction of the abnormal return (MacKinlay, 1997). Therefore, the low R2 may not show the
misspecification of the event study using market model, but it shows that the model is not optimal to
reduce the variance of the abnormal returns.
6.5.2 Normality tests
The second validation test was conducted on the normality assumption of the AARt. We took the AARt
over the estimation window and test for its normality using the q-q plot and chi-square test. The chi-
square test is expressed in P-value. If the P-value calculated is less than or equal to 𝜶, the hypothesis
that the 𝑨𝑨𝑹𝒕 is independent, identically, and normally distributed (H0c) can be rejected at the 𝜶 level
of significance (Law, 2014). For this normality test, we took 𝜶 = 5%.
H0c: The 𝑨𝑨𝑹𝒕 samples are independent, identically distributed, and normally distributed
The central limit theorem guarantees that if the abnormal returns in the securities are independent
and identically distributed, the distribution of 𝑨𝑨𝑹𝒕 converges to normality as the number of samples
of securities increases (Brown & Warner, 1985). Therefore, we also compared the result of the
normality test with the sample size of each groups.

Results and analysis
ESG issues in the palm oil investments - 39
The tested groups are the overall samples in the haze crisis event (67 samples), the ESG issues reports
(36 samples), the ESG commitment reports (12 samples), and the group that has the least number of
samples which is the listed companies in Singapore in the haze crisis event analysis (4 samples). Figure
8, Figure 9 Figure 10, and Figure 11 show the q-q plots respectively for each group. The blue dots are
the plotted actual data, and the orange line is the reference line showing expected normally distributed
data. The first two figures indicating that the actual data of 𝑨𝑨𝑹𝒕 mostly fit to the expected normally
distributed data, though some deviations are clearly seen in the tail of the distributions. On the other
hand, the last two figures show a lot of deviations from the reference line, indicating that they are not
fit into the normal distribution.
Figure 8 - q-q plot: the haze crisis event samples
Figure 9 - q-q plot: the ESG reports samples
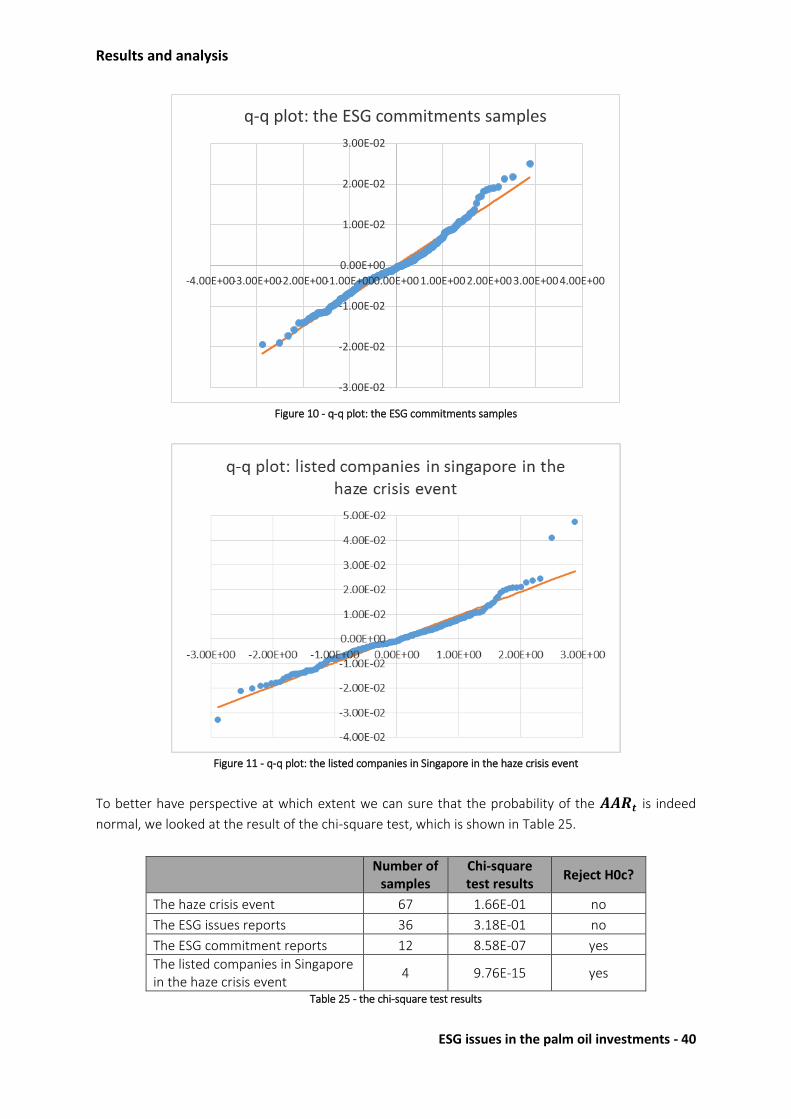
Results and analysis
ESG issues in the palm oil investments - 40
Figure 10 - q-q plot: the ESG commitments samples
Figure 11 - q-q plot: the listed companies in Singapore in the haze crisis event
To better have perspective at which extent we can sure that the probability of the 𝑨𝑨𝑹𝒕 is indeed
normal, we looked at the result of the chi-square test, which is shown in Table 25.
Number of
samples Chi-square test results
Reject H0c?
The haze crisis event 67 1.66E-01 no
The ESG issues reports 36 3.18E-01 no
The ESG commitment reports 12 8.58E-07 yes
The listed companies in Singapore in the haze crisis event
4 9.76E-15 yes
Table 25 - the chi-square test results
-3.00E-02
-2.00E-02
-1.00E-02
0.00E+00
1.00E-02
2.00E-02
3.00E-02
-4.00E+00-3.00E+00-2.00E+00-1.00E+000.00E+001.00E+002.00E+003.00E+004.00E+00
q-q plot: the ESG commitments samples
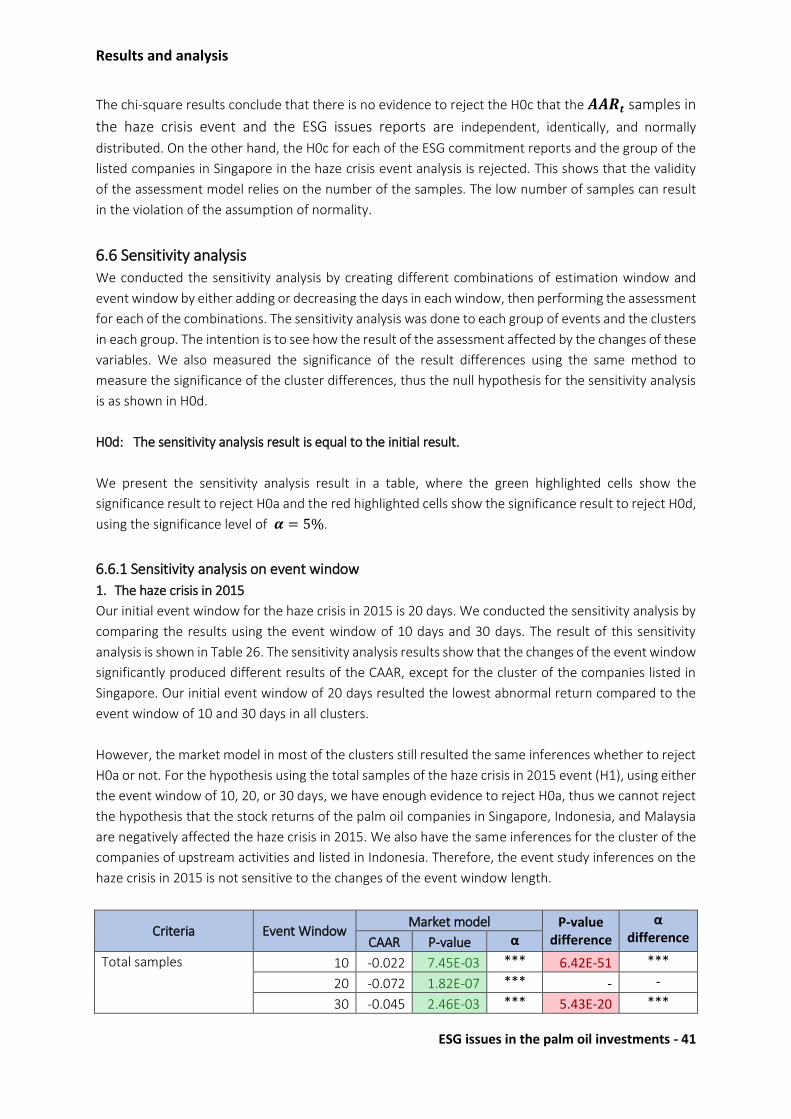
Results and analysis
ESG issues in the palm oil investments - 41
The chi-square results conclude that there is no evidence to reject the H0c that the 𝑨𝑨𝑹𝒕 samples in
the haze crisis event and the ESG issues reports are independent, identically, and normally
distributed. On the other hand, the H0c for each of the ESG commitment reports and the group of the
listed companies in Singapore in the haze crisis event analysis is rejected. This shows that the validity
of the assessment model relies on the number of the samples. The low number of samples can result
in the violation of the assumption of normality.
6.6 Sensitivity analysis
We conducted the sensitivity analysis by creating different combinations of estimation window and
event window by either adding or decreasing the days in each window, then performing the assessment
for each of the combinations. The sensitivity analysis was done to each group of events and the clusters
in each group. The intention is to see how the result of the assessment affected by the changes of these
variables. We also measured the significance of the result differences using the same method to
measure the significance of the cluster differences, thus the null hypothesis for the sensitivity analysis
is as shown in H0d.
H0d: The sensitivity analysis result is equal to the initial result.
We present the sensitivity analysis result in a table, where the green highlighted cells show the
significance result to reject H0a and the red highlighted cells show the significance result to reject H0d,
using the significance level of 𝜶 = 5%.
6.6.1 Sensitivity analysis on event window
1. The haze crisis in 2015
Our initial event window for the haze crisis in 2015 is 20 days. We conducted the sensitivity analysis by
comparing the results using the event window of 10 days and 30 days. The result of this sensitivity
analysis is shown in Table 26. The sensitivity analysis results show that the changes of the event window
significantly produced different results of the CAAR, except for the cluster of the companies listed in
Singapore. Our initial event window of 20 days resulted the lowest abnormal return compared to the
event window of 10 and 30 days in all clusters.
However, the market model in most of the clusters still resulted the same inferences whether to reject
H0a or not. For the hypothesis using the total samples of the haze crisis in 2015 event (H1), using either
the event window of 10, 20, or 30 days, we have enough evidence to reject H0a, thus we cannot reject
the hypothesis that the stock returns of the palm oil companies in Singapore, Indonesia, and Malaysia
are negatively affected the haze crisis in 2015. We also have the same inferences for the cluster of the
companies of upstream activities and listed in Indonesia. Therefore, the event study inferences on the
haze crisis in 2015 is not sensitive to the changes of the event window length.
Criteria Event Window Market model P-value
difference
α difference CAAR P-value α
Total samples 10 -0.022 7.45E-03 *** 6.42E-51 ***
20 -0.072 1.82E-07 *** - -
30 -0.045 2.46E-03 *** 5.43E-20 ***
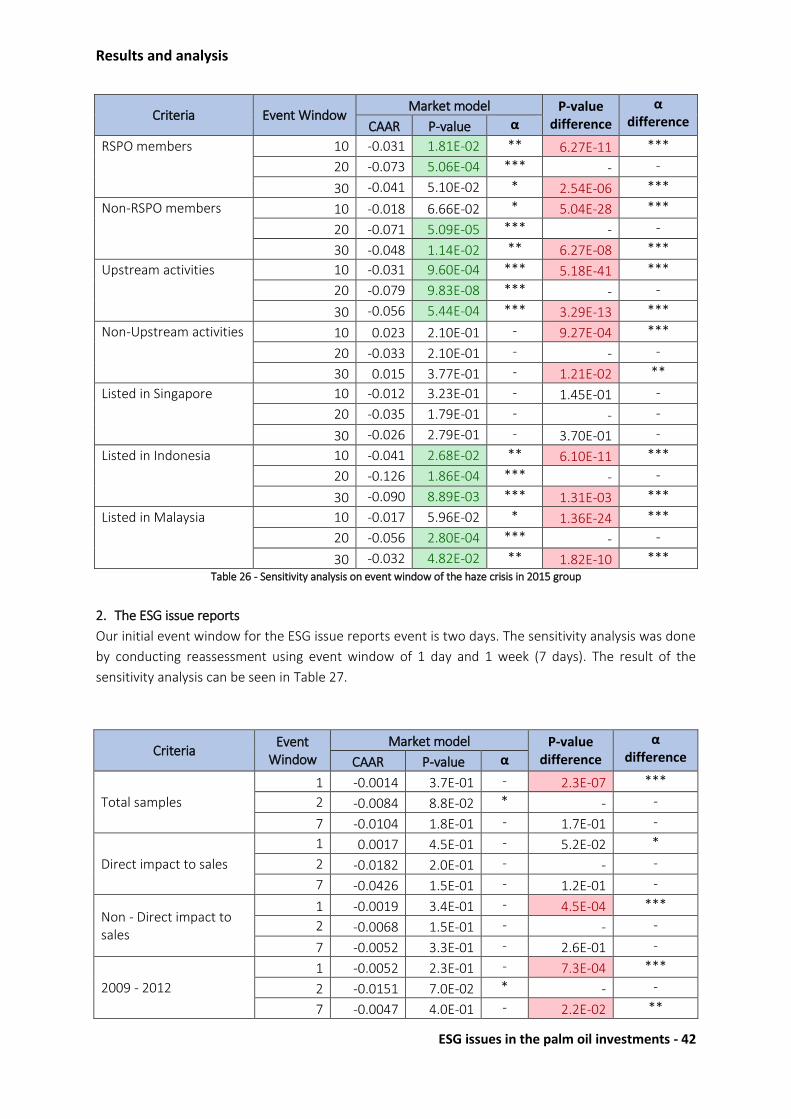
Results and analysis
ESG issues in the palm oil investments - 42
Criteria Event Window Market model P-value
difference
α difference CAAR P-value α
RSPO members 10 -0.031 1.81E-02 ** 6.27E-11 ***
20 -0.073 5.06E-04 *** - -
30 -0.041 5.10E-02 * 2.54E-06 ***
Non-RSPO members 10 -0.018 6.66E-02 * 5.04E-28 ***
20 -0.071 5.09E-05 *** - -
30 -0.048 1.14E-02 ** 6.27E-08 ***
Upstream activities 10 -0.031 9.60E-04 *** 5.18E-41 ***
20 -0.079 9.83E-08 *** - -
30 -0.056 5.44E-04 *** 3.29E-13 ***
Non-Upstream activities 10 0.023 2.10E-01 - 9.27E-04 ***
20 -0.033 2.10E-01 - - -
30 0.015 3.77E-01 - 1.21E-02 **
Listed in Singapore 10 -0.012 3.23E-01 - 1.45E-01 -
20 -0.035 1.79E-01 - - -
30 -0.026 2.79E-01 - 3.70E-01 -
Listed in Indonesia 10 -0.041 2.68E-02 ** 6.10E-11 ***
20 -0.126 1.86E-04 *** - -
30 -0.090 8.89E-03 *** 1.31E-03 ***
Listed in Malaysia 10 -0.017 5.96E-02 * 1.36E-24 ***
20 -0.056 2.80E-04 *** - -
30 -0.032 4.82E-02 ** 1.82E-10 *** Table 26 - Sensitivity analysis on event window of the haze crisis in 2015 group
2. The ESG issue reports
Our initial event window for the ESG issue reports event is two days. The sensitivity analysis was done
by conducting reassessment using event window of 1 day and 1 week (7 days). The result of the
sensitivity analysis can be seen in Table 27.
Criteria Event
Window Market model P-value
difference
α difference CAAR P-value α
Total samples
1 -0.0014 3.7E-01 - 2.3E-07 ***
2 -0.0084 8.8E-02 * - -
7 -0.0104 1.8E-01 - 1.7E-01 -
Direct impact to sales
1 0.0017 4.5E-01 - 5.2E-02 *
2 -0.0182 2.0E-01 - - -
7 -0.0426 1.5E-01 - 1.2E-01 -
Non - Direct impact to sales
1 -0.0019 3.4E-01 - 4.5E-04 ***
2 -0.0068 1.5E-01 - - -
7 -0.0052 3.3E-01 - 2.6E-01 -
2009 - 2012
1 -0.0052 2.3E-01 - 7.3E-04 ***
2 -0.0151 7.0E-02 * - -
7 -0.0047 4.0E-01 - 2.2E-02 **
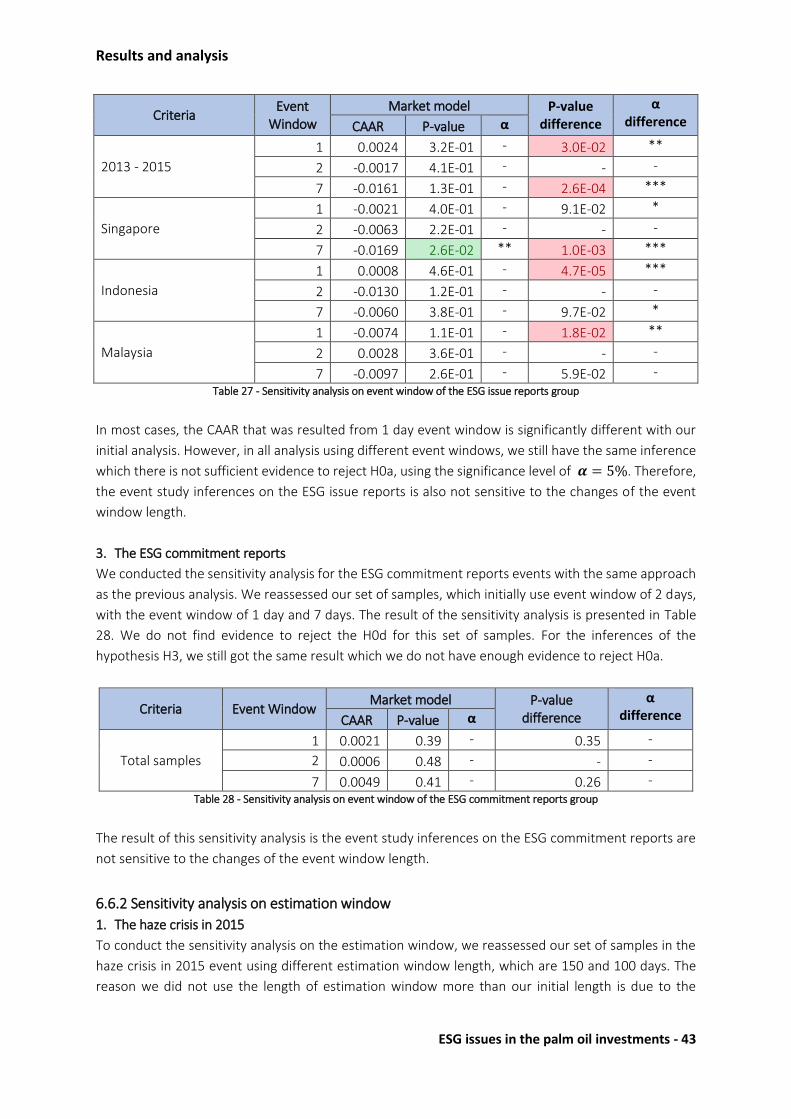
Results and analysis
ESG issues in the palm oil investments - 43
Criteria Event
Window Market model P-value
difference
α difference CAAR P-value α
2013 - 2015
1 0.0024 3.2E-01 - 3.0E-02 **
2 -0.0017 4.1E-01 - - -
7 -0.0161 1.3E-01 - 2.6E-04 ***
Singapore
1 -0.0021 4.0E-01 - 9.1E-02 *
2 -0.0063 2.2E-01 - - -
7 -0.0169 2.6E-02 ** 1.0E-03 ***
Indonesia
1 0.0008 4.6E-01 - 4.7E-05 ***
2 -0.0130 1.2E-01 - - -
7 -0.0060 3.8E-01 - 9.7E-02 *
Malaysia
1 -0.0074 1.1E-01 - 1.8E-02 **
2 0.0028 3.6E-01 - - -
7 -0.0097 2.6E-01 - 5.9E-02 -
Table 27 - Sensitivity analysis on event window of the ESG issue reports group
In most cases, the CAAR that was resulted from 1 day event window is significantly different with our
initial analysis. However, in all analysis using different event windows, we still have the same inference
which there is not sufficient evidence to reject H0a, using the significance level of 𝜶 = 5%. Therefore,
the event study inferences on the ESG issue reports is also not sensitive to the changes of the event
window length.
3. The ESG commitment reports
We conducted the sensitivity analysis for the ESG commitment reports events with the same approach
as the previous analysis. We reassessed our set of samples, which initially use event window of 2 days,
with the event window of 1 day and 7 days. The result of the sensitivity analysis is presented in Table
28. We do not find evidence to reject the H0d for this set of samples. For the inferences of the
hypothesis H3, we still got the same result which we do not have enough evidence to reject H0a.
Criteria Event Window Market model P-value
difference
α difference CAAR P-value α
Total samples
1 0.0021 0.39 - 0.35 -
2 0.0006 0.48 - - -
7 0.0049 0.41 - 0.26 - Table 28 - Sensitivity analysis on event window of the ESG commitment reports group
The result of this sensitivity analysis is the event study inferences on the ESG commitment reports are
not sensitive to the changes of the event window length.
6.6.2 Sensitivity analysis on estimation window
1. The haze crisis in 2015
To conduct the sensitivity analysis on the estimation window, we reassessed our set of samples in the
haze crisis in 2015 event using different estimation window length, which are 150 and 100 days. The
reason we did not use the length of estimation window more than our initial length is due to the

Results and analysis
ESG issues in the palm oil investments - 44
insufficient data in some samples to cover more than 250 days for the estimation day length. The result
of the first sensitivity analysis on estimation window length is shown in Table 29.
Criteria Estimation
Window Market model P-value
difference
α difference CAAR P-value α
Total samples 250 -0.072 1.82E-07 *** - -
150 -0.093 1.77E-10 *** 5.17E-17 ***
100 -0.089 1.14E-09 *** 1.79E-12 ***
RSPO members 250 -0.073 5.06E-04 *** - -
150 -0.078 3.53E-04 *** 2.03E-01 -
100 -0.079 4.96E-04 *** 1.53E-01 -
Non-RSPO members 250 -0.071 5.09E-05 *** - -
150 -0.101 8.45E-08 *** 3.89E-13 ***
100 -0.094 3.73E-07 *** 2.77E-09 ***
Upstream activities 250 -0.079 9.83E-08 *** - -
150 -0.098 3.28E-10 *** 2.84E-12 ***
100 -0.095 1.40E-09 *** 1.50E-09 ***
Non-Upstream activities
250 -0.033 2.10E-01 - - -
150 -0.064 6.58E-02 - 4.65E-02 **
100 -0.054 9.86E-02 - 1.20E-01 -
Listed in Singapore 250 -0.035 1.79E-01 - - -
150 -0.041 1.64E-01 - 4.18E-01 -
100 -0.057 1.02E-01 - 2.08E-01 -
Listed in Indonesia 250 -0.126 1.86E-04 *** - -
150 -0.125 2.25E-04 *** 4.52E-01 -
100 -0.127 4.04E-04 *** 4.67E-01 -
Listed in Malaysia 250 -0.056 2.80E-04 *** - -
150 -0.086 3.08E-07 *** 1.12E-15 ***
100 -0.079 1.56E-06 *** 1.30E-10 *** Table 29 - Sensitivity analysis on the estimation window of the haze crisis in 2015 group
Though there are some significant differences CAAR in some clusters, the inferences in each cluster
whether to reject H0a or not are still the same. Looking at the total samples, we can still strongly reject
H0a, thus we cannot reject our H1. This sensitivity analysis indicates that the event study inferences on
the haze crisis in 2015 are not sensitive to the changes on the estimation window length.
2. The ESG issue reports
We used the same combination of the estimation window length to do the sensitivity analysis of the
ESG issue reports event. We found that the results are not sensitive to the changes of the estimation
window length, since there are no significant difference between the results. Looking at the total
samples, we got stronger evidence to reject H0a using estimation window length of 100 days, though
the CAAR is not significantly different with the one resulted in our initial assessment. The result of the
sensitivity analysis can be seen in Table 30.

Results and analysis
ESG issues in the palm oil investments - 45
Criteria Estimation
Window Market model P-value
difference
α difference CAAR P-value α
Total samples
250 -0.0084 8.8E-02 * - -
150 -0.0094 6.0E-02 * 2.4E-01 -
100 -0.0097 4.9E-02 ** 1.7E-01 -
Direct impact to sales
250 -0.0182 2.0E-01 - - -
150 -0.0160 2.1E-01 - 4.3E-01 -
100 -0.0171 1.8E-01 - 4.6E-01 -
Non - Direct impact to sales
250 -0.0068 1.5E-01 - - -
150 -0.0083 9.4E-02 * 1.7E-01 -
100 -0.0085 8.6E-02 * 1.4E-01 -
2009 - 2012
250 -0.0151 7.0E-02 * - -
150 -0.0154 5.1E-02 * 4.6E-01 -
100 -0.0161 4.3E-02 ** 3.7E-01 -
2013 - 2015
250 -0.0017 4.1E-01 - - -
150 -0.0034 3.3E-01 - 2.5E-01 -
100 -0.0033 3.3E-01 - 2.5E-01 -
Singapore
250 -0.0063 2.2E-01 - - -
150 -0.0065 2.1E-01 - 4.7E-01 -
100 -0.0063 2.2E-01 - 4.9E-01 -
Indonesia
250 -0.0130 1.2E-01 - - -
150 -0.0146 8.9E-02 * 3.2E-01 -
100 -0.0155 7.5E-02 * 2.4E-01 -
Malaysia
250 0.0028 3.6E-01 - - -
150 0.0021 3.9E-01 - 4.3E-01 -
100 0.0025 3.7E-01 - 4.7E-01 -
Table 30 - Sensitivity analysis on the estimation window of the ESG issue reports group
We also can conclude that the event study results on the ESG issue reports group are not sensitive to
the changes on the estimation window length.
3. The ESG commitment reports
Using the same combination of estimation window length as the previous analysis, we also did not find
significant difference on the CAAR results of the assessment in the ESG commitment reports event.
Therefore, the inferences in each different estimation window length is still the same, which we do not
have enough evidence to reject H0a. Therefore, the event study results on the ESG commitment reports
are also not sensitive to the changes of the estimation window length. The result of the sensitivity
analysis can be found in Table 31.
Criteria Estimation
Window Market model P-value
difference
α difference CAAR P-value α
Total samples
250 0.0006 0.48 - - -
150 0.0022 0.42 - 0.35 -
100 0.0050 0.31 - 0.15 - Table 31 - Sensitivity analysis on the estimation window of the ESG commitment reports group

Results and analysis
ESG issues in the palm oil investments - 46
6.7 Constant mean return model
The second reliability test is the reassessment using constant mean return model. We did the
reassessment using constant mean return model to each group of events and the clusters in each
group. The reassessment used the same event window and estimation window length as our initial
assessment. The significance of the result differences is then measured using the same method as the
previous analysis, thus the null hypothesis for this reassessment is as shown in H0e.
H0e: The assessment results using constant mean return model is equal with the assessment results
using market model.
We present the sensitivity analysis result in a table, where the green highlighted cells show the
significance result to reject H0a and the red highlighted cells show the significance result to reject H0e,
using the significance level of 𝜶 = 5%.
1. The haze crisis in 2015
Comparing the results between the assessment using market model and constant mean return model
in the haze crisis in 2015 group, we found that the CAAR results of the two models are significantly
different. However, the inferences that we got from the statistical test are still consistent in both
models. Both using market model and constant mean return model, we cannot reject the hypothesis
that the stock returns of the palm oil companies in Singapore, Indonesia, and Malaysia are negatively
affected the haze crisis in 2015. The result of the comparison using constant mean return model for the
haze crisis in 2015 group can be seen in Table 32.
Criteria No. of
samples Model CAAR P-value α
P-value difference
α difference
Total samples 67 MM -0.072 1.82E-07 ***
3.53E-36 *** 67 CMRM -0.111 2.11E-12 ***
RSPO members 24 MM -0.073 5.06E-04 ***
2.33E-06 *** 24 CMRM -0.103 1.62E-05 ***
Non-RSPO members
43 MM -0.071 5.09E-05 *** 2.51E-20 ***
43 CMRM -0.115 1.79E-08 ***
Upstream activities
57 MM -0.079 9.83E-08 *** 3.54E-26 ***
57 CMRM -0.113 1.14E-11 ***
Non-Upstream activities
10 MM -0.033 2.10E-01 - 1.56E-03 ***
10 CMRM -0.095 2.28E-02 **
Listed in Singapore
4 MM -0.035 1.79E-01 - 6.64E-03 ***
4 CMRM -0.124 1.82E-02 **
Listed in Indonesia
16 MM -0.126 1.86E-04 *** 3.35E-01 -
16 CMRM -0.130 1.63E-04 ***
Listed in Malaysia
47 MM -0.056 2.80E-04 *** 1.19E-25 ***
47 CMRM -0.103 2.39E-08 *** Table 32 - Constant mean return model comparison in the haze crisis in 2015 group
Since we have the same inferences in most of cases using both models, it can be concluded that our
initial assessment model is reliable.
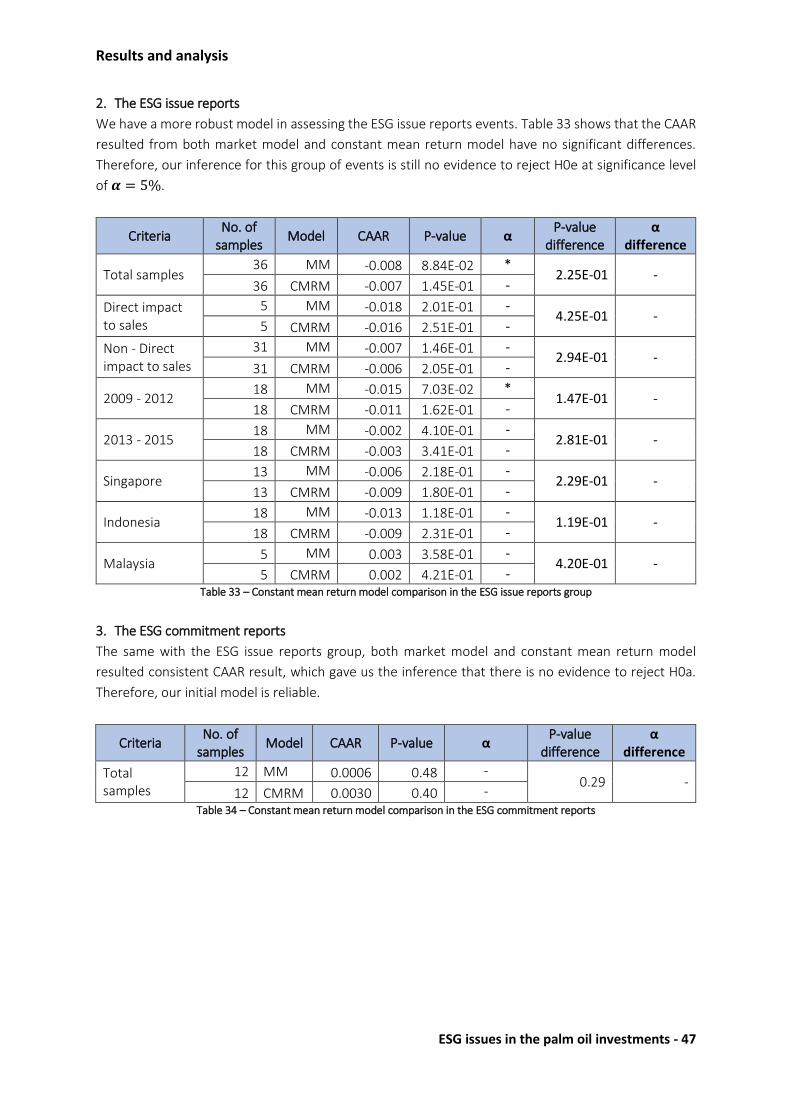
Results and analysis
ESG issues in the palm oil investments - 47
2. The ESG issue reports
We have a more robust model in assessing the ESG issue reports events. Table 33 shows that the CAAR
resulted from both market model and constant mean return model have no significant differences.
Therefore, our inference for this group of events is still no evidence to reject H0e at significance level
of 𝜶 = 5%.
Criteria No. of
samples Model CAAR P-value α
P-value difference
α difference
Total samples 36 MM -0.008 8.84E-02 *
2.25E-01 - 36 CMRM -0.007 1.45E-01 -
Direct impact to sales
5 MM -0.018 2.01E-01 - 4.25E-01 -
5 CMRM -0.016 2.51E-01 -
Non - Direct impact to sales
31 MM -0.007 1.46E-01 - 2.94E-01 -
31 CMRM -0.006 2.05E-01 -
2009 - 2012 18 MM -0.015 7.03E-02 *
1.47E-01 - 18 CMRM -0.011 1.62E-01 -
2013 - 2015 18 MM -0.002 4.10E-01 -
2.81E-01 - 18 CMRM -0.003 3.41E-01 -
Singapore 13 MM -0.006 2.18E-01 -
2.29E-01 - 13 CMRM -0.009 1.80E-01 -
Indonesia 18 MM -0.013 1.18E-01 -
1.19E-01 - 18 CMRM -0.009 2.31E-01 -
Malaysia 5 MM 0.003 3.58E-01 -
4.20E-01 - 5 CMRM 0.002 4.21E-01 -
Table 33 – Constant mean return model comparison in the ESG issue reports group
3. The ESG commitment reports
The same with the ESG issue reports group, both market model and constant mean return model
resulted consistent CAAR result, which gave us the inference that there is no evidence to reject H0a.
Therefore, our initial model is reliable.
Criteria No. of
samples Model CAAR P-value α
P-value difference
α difference
Total samples
12 MM 0.0006 0.48 - 0.29 -
12 CMRM 0.0030 0.40 - Table 34 – Constant mean return model comparison in the ESG commitment reports
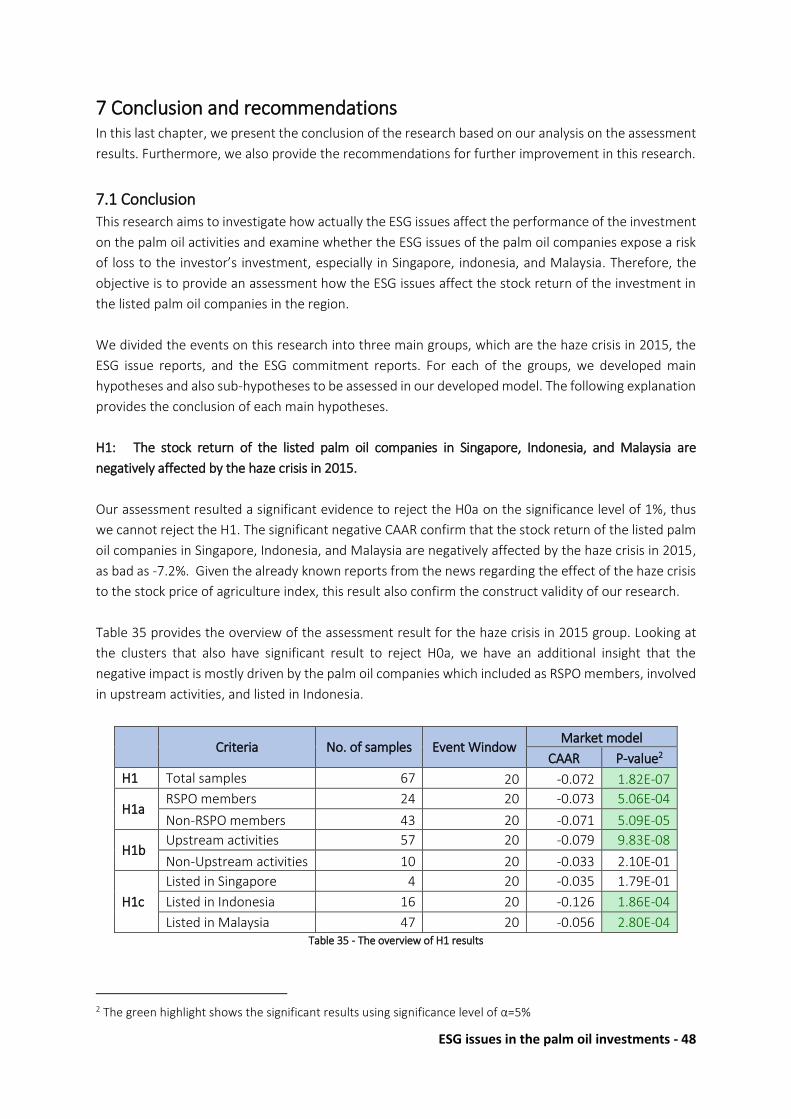
ESG issues in the palm oil investments - 48
7 Conclusion and recommendations In this last chapter, we present the conclusion of the research based on our analysis on the assessment
results. Furthermore, we also provide the recommendations for further improvement in this research.
7.1 Conclusion
This research aims to investigate how actually the ESG issues affect the performance of the investment
on the palm oil activities and examine whether the ESG issues of the palm oil companies expose a risk
of loss to the investor’s investment, especially in Singapore, indonesia, and Malaysia. Therefore, the
objective is to provide an assessment how the ESG issues affect the stock return of the investment in
the listed palm oil companies in the region.
We divided the events on this research into three main groups, which are the haze crisis in 2015, the
ESG issue reports, and the ESG commitment reports. For each of the groups, we developed main
hypotheses and also sub-hypotheses to be assessed in our developed model. The following explanation
provides the conclusion of each main hypotheses.
H1: The stock return of the listed palm oil companies in Singapore, Indonesia, and Malaysia are
negatively affected by the haze crisis in 2015.
Our assessment resulted a significant evidence to reject the H0a on the significance level of 1%, thus
we cannot reject the H1. The significant negative CAAR confirm that the stock return of the listed palm
oil companies in Singapore, Indonesia, and Malaysia are negatively affected by the haze crisis in 2015,
as bad as -7.2%. Given the already known reports from the news regarding the effect of the haze crisis
to the stock price of agriculture index, this result also confirm the construct validity of our research.
Table 35 provides the overview of the assessment result for the haze crisis in 2015 group. Looking at
the clusters that also have significant result to reject H0a, we have an additional insight that the
negative impact is mostly driven by the palm oil companies which included as RSPO members, involved
in upstream activities, and listed in Indonesia.
Criteria No. of samples Event Window
Market model
CAAR P-value2
H1 Total samples 67 20 -0.072 1.82E-07
H1a RSPO members 24 20 -0.073 5.06E-04
Non-RSPO members 43 20 -0.071 5.09E-05
H1b Upstream activities 57 20 -0.079 9.83E-08
Non-Upstream activities 10 20 -0.033 2.10E-01
H1c
Listed in Singapore 4 20 -0.035 1.79E-01
Listed in Indonesia 16 20 -0.126 1.86E-04
Listed in Malaysia 47 20 -0.056 2.80E-04 Table 35 - The overview of H1 results
2 The green highlight shows the significant results using significance level of α=5%
Conclusion and recommendations
ESG issues in the palm oil investments - 49
Hypothesis H1a and H1c were developed with the assumption that the more the investors in a cluster
consider sustainability, the worse the abnormal return in that cluster in the haze crisis event. The result
of our assessment is in line with this assumption, thus it can give an insight that the impact of the ESG
issues can be influenced by the investors awareness to the ESG issues.
H2: The stock return of the listed palm oil companies in Singapore, Indonesia, and Malaysia are
negatively affected by the ESG issue reports in 2009 – June 2015.
Our assessment resulted CAAR of -0.8% and we have the evidence to reject H0a with the significance
level of 10%, thus the evidence to reject H0a in H2 is not as strong as H1. The problem in dividing the
samples into clusters is the insufficient sample size, so that we do not have enough evidences to proof
that the ESG issue reports have an effect to the stock return of the listed pal oil companies in Singapore,
Indonesia, and Malaysia.
H3: The stock return of the listed palm oil companies in Singapore, Indonesia, and Malaysia are
positively affected by the ESG commitment reports in 2009 – June 2015.
The same case applied when we assessed the ESG commitment reports. The lack of samples resulted
in the lack of evidence to reject the H0a. Therefore, we do not have enough evidence to show the effect
of the ESG commitment reports to the stock return of the listed palm oil companies in Singapore,
Indonesia, and Malaysia.
The lack of samples is also proven to result problems in the validity of the model. The H0c for the ESG
commitment reports group, which only has 12 samples, is rejected. This shows that the validity of the
assessment model relies on the number of the samples. The low number of samples can result in the
violation of the assumption of normality. Another analyzed problem is the low R2 in the market model.
The low R2 may not show the misspecification of the event study using market model, but it shows that
the model is not optimal to reduce the variance of the abnormal returns.
From the sensitivity analysis, we found that our initial model is robust as it is not sensitive to the changes
of both event window and estimation window. Also, both using market model and constant mean
return model, we get consistent inferences whether to reject H0a or not, although some clusters have
significantly different CAAR.
7.2 Discussion and recommendations
The expected outcome of the research is to show the impact of the ESG issues on the stock return of
the palm oil companies. The intention is to give the idea of the exposed risk of loss to the investor’s
investment due to the ESG issues. Eventually, we have one evidence of the negative impact of an ESG
issue, which is shown in the haze crisis in 2015. However, this haze crisis can be considered as a special
event, since it also involved a natural disaster and it had a direct impact to the decreasing of production
of the palm oil, thus it affected the overall palm oil industry. While for the impact of the ESG issues in a
specific company, the evidence is not as strong as the haze crisis in 2015 (significant at the level of
α=10%).

Conclusion and recommendations
ESG issues in the palm oil investments - 50
In the recent years, the impact of integrating ESG criteria into the palm oil activities has been
approached by considering the reaction of the buyers and investors who are concern about these
criteria, e.g. the study published by (WWF et al., 2012). Our analysis also resulted an indication that the
impact of the ESG issues on the stock return is influenced by the investors’ awareness to the ESG
criteria. WWF (2015) highlighted the lack of sustainable finance in Singapore, Indonesia, and Malaysia
as the domestic banks and investors in the region are lagging far behind in incorporating ESG issues
compared to the international financial institutions. Therefore, our result which shows relatively low
evidence (significant CAAR of -0.8% at the level of α=10%) of the ESG issues impact to the palm oil
investment is in line with the fact of the lack of attention in ESG issues from the investors in the
Singapore, Indonesia, and Malaysia.
The insufficient samples of issues become one of the drawback of this research, especially to normality
assumption violation. We could not find additional samples by expanding our search up to 2005, thus
we limit our samples on 2009. One of the improvement that can be done in this research in the future
is by expanding the scope to other similar industries or other regions. There is a possibility to get more
samples by expanding our scope into similar plantation industries in food, fiber, and biofuel. We may
also get more samples by expanding the scope into other regions outside Singapore, Indonesia, and
Malaysia. Surely, the expansion of the scope must consider the variation of the result by the additional
diversities that will be included in the samples.
The low R2 also indicates that our choice to use market model do not result in the optimization of its
benefit. The market model should reduce the variance of the abnormal returns if the market portfolio
returns can explain a high proportion of variance in the company stock returns. Therefore, in the future
study, the choice of the market portfolio as the reference in the market model should really consider
the high number of R2 so that we can optimize the benefit of using market model compared to other
models.
To show the exposed financial risk of the ESG issues, firstly we have to translate the ESG criteria into
financial indicators, which currently still become a challenge both for the palm oil companies and their
investors. Rather than looking into historical events, another approach was done by Chain Reaction
Research to present a full risk analysis of a palm oil company (Chain Reaction Research, 2015a). They
created a scenario if the investors and buyers become more aware to the ESG issues and if the
government become stricter to regulation regarding the ESG issues, then forecasting the impact of the
scenario in the future (Chain Reaction Research, 2015a). Looking at the current trend, where more
companies and financial institutions pledging to become more sustainable, this approach actually one
of the better ways to give a picture of exposed risk to the palm oil investments.
Lastly, a deeper case study in each of the issues we found in this research also can help to translate the
ESG issues into financial indicators. It is interesting to see how these issues affecting the financial
performance by looking in detail of their financial statement, and not only into their stock return.
Appendix E presents the collection of the ESG issues ranked by the worst abnormal returns, as a
guidance to start analyzing deeper into each issues impact to the overall financial performance.
ESG issues in the palm oil investments - 51
References Afrizal, J., & Harahap, R. (2015). Companies blamed for hectares of peatland fires in Jambi. Retrieved
from http://www.thejakartapost.com/news/2015/08/21/companies-blamed-hectares-peatland-fires-jambi.html
Bell, L. (2014). Palm oil company continues to operate illegal plantation despite court ruling. Retrieved
from http://news.mongabay.com/2014/09/palm-oil-company-continues-to-operate-illegal-plantation-despite-court-ruling/
Brown, S. J., & Warner, J. B. (1985). Using daily stock returns. Journal of Financial Economics, 14(1), 3–
31. http://doi.org/10.1016/0304-405X(85)90042-X Butler, R. A. (2011). Breakthrough ? Controversial palm oil company signs rainforest pact. Retrieved
from http://news.mongabay.com/2011/02/breakthrough-controversial-palm-oil-company-signs-rainforest-pact/
Butler, R. A. (2012). Palm oil case against “ Green Governor ” in Indonesia heats up. Retrieved from
http://news.mongabay.com/2012/03/palm-oil-case-against-green-governor-in-indonesia-heats-up/
Butler, R. A. (2014). In precedent-setting case , palm oil company fined $ 30M for destroying
orangutan forest. Retrieved from http://news.mongabay.com/2014/01/in-precedent-setting-case-palm-oil-company-fined-30m-for-destroying-orangutan-forest/
Chain Reaction Research. (2015a). Full Risk AnalysisSawit Sumbermas Sarana. Retrieved from
https://chainreactionresearch.files.wordpress.com/2015/09/sawit-sumber-mas-sarana-150907-crr-report.pdf
Chain Reaction Research. (2015b). Indonesian palm oil growers ’ exposure to sustainability purchasing
policies. Retrieved from http://chainreactionresearch.com/reports/idx-listed-palm-oil-growers/ Cheam, J. (2013). Name and shame companies behind haze: Singapore. Retrieved from
http://www.eco-business.com/news/name-and-shame-companies-behind-haze-singapore/ Cushing, B. (2015). The Chain: Indonesia’s Haze Crisis, Astra's New Policy, Lumber Liquidators' Plea
Deal, And More. Retrieved October 29, 2015, from http://chainreactionresearch.com/2015/10/28/the-chain-indonesia-haze-crisis/
Duuren, E. Van, Plantinga, A., & Scholtens, B. (2015). ESG Integration and the Investment
Management Process: Fundamental Investing Reinvented, 3795, 0–13. http://doi.org/10.1007/s10551-015-2610-8
Forest Peoples Programme. (2015). Golden Agri-Resources still in violation of RSPO standards.
Retrieved from http://www.forestpeoples.org/topics/responsible-finance/news/2015/04/golden-agri-resources-still-violation-rspo-standards
Friends of the Eart Europe. (2014). Deutsche Bank divests from Bumitama. Retrieved from
https://www.foeeurope.org/deutsche-bank-divests-bumitama-260514
References
ESG issues in the palm oil investments - 52
Friends of the Earth US, Walhi - Friends of the Earth Indonesia, Forest Heroes, & SumOfUs. (2013). Commodity Crimes. Illicit land grabs, illegal palm oil, and endangered orangutans. Retrieved from http://libcloud.s3.amazonaws.com/93/0a/2/3326/FOE_CommodityCrimes_LowRes.pdf
Greenomics Indonesia. (2014). As a Strategic Shareholder, Is This In Line With Wilmar’s No
Deforestation Policy? Retrieved from http://www.greenomics.org/docs/Findings_Wilmar’s-No-Deforestation-Policy_(LowRes).pdf
Greenomics Indonesia. (2015). IPOP signatories are the biggest buyers of palm oil. Retrieved from
http://www.greenomics.org/docs/IPOP_Implementation_Report-03_Greenomics.pdf Greenpeace. (2009). A defining moment for the palm oil industry as Unilever breaks link with forest
destruction? Retrieved from http://www.greenpeace.org.uk/blog/forests/defining-moment-palm-oil-industry-unilever-breaks-link-forest-destruction-20091209
Greenpeace. (2010a). Caught Red Handed: How Nestle’s Use of Palm Oil is Having a castrating Impact
on Rainforest, The Clumate and Orang-utans. Retrieved from http://www.greenpeace.org/international/en/publications/reports/caught-red-handed-how-nestle/
Greenpeace. (2010b). Exposed : Notorious rainforest destroyer Sinar Mas misled stock exchange and
customers Palm oil audit proves group breached Indonesian law. Retrieved from http://www.greenpeace.org/international/en/press/releases/Exposed-Notorious-rainforest-destroyer-Sinar-Mas-misled-stock-exchange-and-customers/
Greenpeace. (2010c). How Sinar Mas is pulping the planet. Retrieved from
http://www.greenpeace.org/international/en/publications/reports/SinarMas-APP/ Greenpeace. (2010d). RSPO letters to Sinar Mas. Retrieved from
http://www.greenpeace.org/international/en/publications/reports/RSPO-letters/ Greenpeace. (2010e). We got it our way! Burger King ditches Sinar Mas palm oil. Retrieved from
http://www.greenpeace.org.uk/blog/forests/we-got-it-our-way-burger-king-ditches-sinar-mas-palm-oil-20100902
Greenpeace. (2013). Licence to kill: How deforestation for palm oil is driving Sumatran tigers toward
extinction. http://doi.org/10.1038/35052008 Greenpeace. (2014). GAR’s No Deforestation Policy to Now Apply to All Palm Oil Suppliers. Retrieved
from http://www.greenpeace.org/usa/news/gars-no-deforestation-policy-to-now-apply-to-all-palm-oil-suppliers/
Gunawan, A. (2015). 207 fire spots detected in Sumatra on Sunday. Retrieved from
http://www.thejakartapost.com/news/2015/06/28/207-fire-spots-detected-sumatra-sunday.html
Harrild, L. (2010). Lessons from the palm oil showdown. Retrieved from
http://www.theguardian.com/sustainable-business/palm-oil-greenpeace-social-media Jacobson, P., & Sirait, J. (2015). Who ’ s responsible for Indonesia ’ s fires ? Retrieved from
http://news.mongabay.com/2015/09/whos-responsible-for-indonesias-fires/

References
ESG issues in the palm oil investments - 53
Klute, M. (2009). Touching the Sky : Human Rights Violations and Land Right Conflicts around Bakrie Sumatera ’ s Plantations. Retrieved from http://www.biofuelwatch.org.uk/docs/BakrieStudy.pdf
Larsen, R. J., & Marx, M. L. (2012). An Introduction to Mathematical Statistics and Its Application (5th
Editio). Pearson Education, Inc. Law, A. (2014). Simulation Modeling and Analysis (5th Editio). WCB/McGraw-Hill. Lee, M. (2015). Bears continue to rule S’pore market in June. Retrieved from
http://www.straitstimes.com/business/companies-markets/bears-continue-to-rule-spore-market-in-june
MacKinlay, A. C. (1997). Event Studies in Economics and Finance. Journal of Economic Literature,
XXXV(March), 13–39. Manuturi, V. (2015). Agriculture Shares Feel the Heat From Forest Fires. Retrieved from
http://jakartaglobe.beritasatu.com/business/agriculture-shares-feel-heat-forest-fires/ Milieudefensie, & Friends of the Earth Europe. (2010). Too Green to be True. Friends of the Earth
Europe. Retrieved from https://www.foeeurope.org/sites/default/files/publications/FoEE_Too_Green_to_be_True_0310.pdf
Mongabay. (2011). Malaysian palm oil giant in fight with forest people gets rebuke from RSPO Holland
America. Retrieved from http://news.mongabay.com/2011/04/malaysian-palm-oil-giant-in-fight-with-forest-people-gets-rebuke-from-rspo/
Mongabay. (2012a). Controversial palm oil license issued in Indonesian orangutan forest revoked
Related articles. Retrieved from http://news.mongabay.com/2012/09/controversial-palm-oil-license-issued-in-indonesian-orangutan-forest-revoked/
Mongabay. (2012b). RSPO rules against palm oil company in controversial deforestation case.
Retrieved from http://news.mongabay.com/2012/12/rspo-rules-against-palm-oil-company-in-controversial-deforestation-case/
Mongabay. (2013). 5 RSPO companies linked to haze. Retrieved from
http://news.mongabay.com/2013/06/5-rspo-companies-linked-to-haze/ Mongabay. (2014). Malaysian palm oil giant tied to social conflict , deforestation , says report.
Retrieved from http://news.mongabay.com/2014/04/malaysian-palm-oil-giant-tied-to-social-conflict-deforestation-says-report/
Mongabay. (2015). Palm oil major makes deforestation-free commitment. Retrieved from
http://news.mongabay.com/2015/02/palm-oil-major-makes-deforestation-free-commitment/ Parker, D. (2013). Indonesian palm oil giant launches conservation pilot project. Retrieved from
http://news.mongabay.com/2013/03/indonesian-palm-oil-giant-launches-conservation-pilot-project/
PRI Association. (2013). PRI Reporting Framework 2013 Main definitions (Vol. 44). Retrieved from
http://www.unpri.org/wp-content/uploads/2013-14_PRI_RF_maindefinitions.pdf

References
ESG issues in the palm oil investments - 54
RSPO. (n.d.-a). Golden Agri-Resources Ltd. Retrieved from http://www.rspo.org/members/719/Golden-Agri-Resources-Ltd
RSPO. (n.d.-b). Innoprise Plantations Berhad. Retrieved from
http://www.rspo.org/members/2261/Innoprise-Plantations-Berhad RSPO. (n.d.-c). PT Dharma Satya Nusantara. Retrieved from http://www.rspo.org/members/1891/PT-
DHARMA-SATYA-NUSANTARA RSPO. (n.d.-d). PT Eterindo Wahanatama Tbk. Retrieved from http://www.rspo.org/members/285/PT-
Eterindo-Wahanatama-Tbk RSPO. (n.d.-e). TDM Plantation Sdn Bhd. Retrieved from http://www.rspo.org/members/765/TDM-
Plantation-Sdn-Bhd Samadhi, T. N. (2015). New forest fires threaten Indonesia ’ s protected areas. Retrieved from
http://www.thejakartapost.com/news/2015/07/30/new-forest-fires-threaten-indonesia-s-protected-areas.html
Saturi, S. (2014). Langgar Aturan, RSPO Didesak Tindak KLK Grup. Retrieved from
http://www.mongabay.co.id/2014/11/16/langgar-aturan-rspo-didesak-tindak-klk-grup/ Sime Darby. (2014). Major Growers Commit to No HCS Development as HCS Study Starts in Earnest.
Retrieved from http://www.simedarby.com/Major_Growers_Commit_to_No_HCS_Development_as_HCS_Study_Starts_in_Earnest.aspx
Suhartono, H., & Ho, Y. (2015). Indonesian Stocks Slide Into Bear Market as Economy Stumbles.
Retrieved from http://www.bloomberg.com/news/articles/2015-08-21/indonesia-stocks-poised-to-enter-bear-market-as-economy-stumbles
The Edge. (2014). Genting Plantations’ RSPO membership suspended. Retrieved from
http://www.theedgemarkets.com/my/article/genting-plantations’-rspo-membership-suspended Weber, O., Scholz, R. W., & Michalik, G. (2008). Incorporating Sustainability Criteria into Credit Risk
Management. Business Strategy and the Environment, 19, 39–50. Wilmar. (2013). No Deforestation, No Peat, No Exploitation Policy. Retrieved from
http://www.wilmar-international.com/wp-content/uploads/2012/11/No-Deforestation-No-Peat-No-Exploitation-Policy.pdf
WWF. (2008). The Palm Oil Financing Handbook. Retrieved from
http://wwf.panda.org/what_we_do/footprint/agriculture/palm_oil/publications/?153401/New-guide-for-financial-institutions-The-Palm-Oil-Financing-Handbook
WWF. (2010). WWF Reactive Statement on PT SMART’s Announcement of Environmental
Commitments for its Palm Oil Production. Retrieved from https://www.worldwildlife.org/stories/wwf-reactive-statement-on-pt-smart-s-announcement-of-environmental-commitments-for-its-palm-oil-production
References
ESG issues in the palm oil investments - 55
WWF. (2013). Mengurai Permasalahan Sawit di Taman Nasional Tesso Nilo. Retrieved from http://www.wwf.or.id/?28680/Addressing-the-encroachment-problem--in-Tesso-Nilo-National-Park
WWF. (2014). Environmental, Social, and Governance Integration for Banks: A Guide to Starting
Implementation. Retrieved from http://wwf.panda.org/?226990 WWF. (2015). Sustainable Finance in Singapore, Indonesia, and Malaysia: A Review of Financiers’ ESG
Practices Disclosure Standards and Regulations. Retrieved from http://wwf.panda.org/?246811/Sustainable-finance-in-Singapore-Malaysia-and-Indonesia-A-review-of-financiersESG-practice
WWF, & EnviroMarket. (2012). Palm Oil Investor Review : Investor Guidance on Palm Oil. Retrieved
from http://wwf.panda.org/what_we_do/footprint/agriculture/palm_oil/solutions/responsible_financing/investor_review/
WWF, FMO, & CDC. (2012). Profitability and Sustainability in Palm Oil Production. Retrieved from
http://wwf.panda.org/?204548/Profitability-and-Sustainability-in-Palm-Oil-Production

ESG issues in the palm oil investments - 56
Appendix A – The listed palm oil companies in Singapore, Indonesia, and
Malaysia
The list is sorted based on the highest to the lowest market cap at the end of 2014.
No Ticker Short Name
Country
where it
listed3
Date of
joining
RSPO4
Involved in
upstream?
Exposed in
media
during haze
crisis?
1 WIL SP Equity WILMAR INTERNATI SG 8/15/2005 yes yes
2 IOI MK Equity IOI CORP BHD MY 5/17/2004 yes yes
3 KLK MK Equity KUALA LUMPUR KEP MY 10/18/2004 yes no
4 GGR SP Equity GOLDEN AGRI-RESO SG 3/31/2011 yes yes
5 AALI IJ Equity ASTRA AGRO LEST IND - yes no
6 IJM MK Equity IJM CORP BHD MY 9/8/2004 yes yes
7 HAP MK Equity HAP SENG CONS MY 9/1/2005 yes no
8 FGV MK Equity FELDA GLOBAL VEN MY 10/17/2004 yes no
9 FR SP Equity FIRST RESOURCES SG 3/10/2008 yes yes
10 GENP MK Equity GENTING PLANTATI MY 11/14/2006 yes yes
11 SMAR IJ Equity SMART TBK IND 1/30/2005 yes yes
12 BAL SP Equity BUMITAMA AGRI LT IND 10/7/2007 yes no
13 QLG MK Equity QL RESOURCES BHD MY 4/19/2007 yes no
14 SSMS IJ Equity SAWIT SUMBERMAS IND 4/18/2007 yes no
15 KUL MK Equity KULIM MALAYSIA MY 8/8/2004 yes no
16 LSIP IJ Equity PP LONDON SUMATR IND 11/5/2004 yes no
17 BWPT IJ Equity EAGLE HIGH PLANT IND 3/21/2008 yes yes
18 SIMP IJ Equity SALIM IVOMAS PRA IND 9/24/2007 yes no
19 IFAR SP Equity INDOFOOD AGRI RE SG - yes no
20 DSNG IJ Equity DHARMA SATYA NUS IND 12/4/2012 yes no
21 MKH MK Equity MKH BHD MY - yes no
22 VSI MK Equity VS INDUSTRY BHD MY - yes no
23 ANJT IJ Equity AUSTINDO NUSANTA IND 2/26/2007 yes yes
24 TDM MK Equity TDM BHD MY 2/28/2011 yes no
25 TBLA IJ Equity TUNAS BARU LAMP IND 7/24/2006 yes no
26 SGRO IJ Equity SAMPOERNA AGRO IND 1/10/2007 yes no
27 CBP MK Equity CB INDUSTRIAL MY - yes no
28 YNHB MK Equity YNH PROPERTY BHD MY - yes no
29 RSAW MK Equity RIMBUNAN SAWIT MY - yes no
30 BMHB MK Equity BOILERMECH MY - no no
31 SALC MK Equity SALCON BHD MY - no no
32 JAWA IJ Equity J.A. WATTIE TBK IND - yes no
33 DTL MK Equity DUTALAND BHD MY - yes no
3 SG = SINGAPORE; MY = MALAYSIA; IND = INDONESIA. 4 Blank fill indicates that the company is not an RSPO member in the haze crisis 2015.
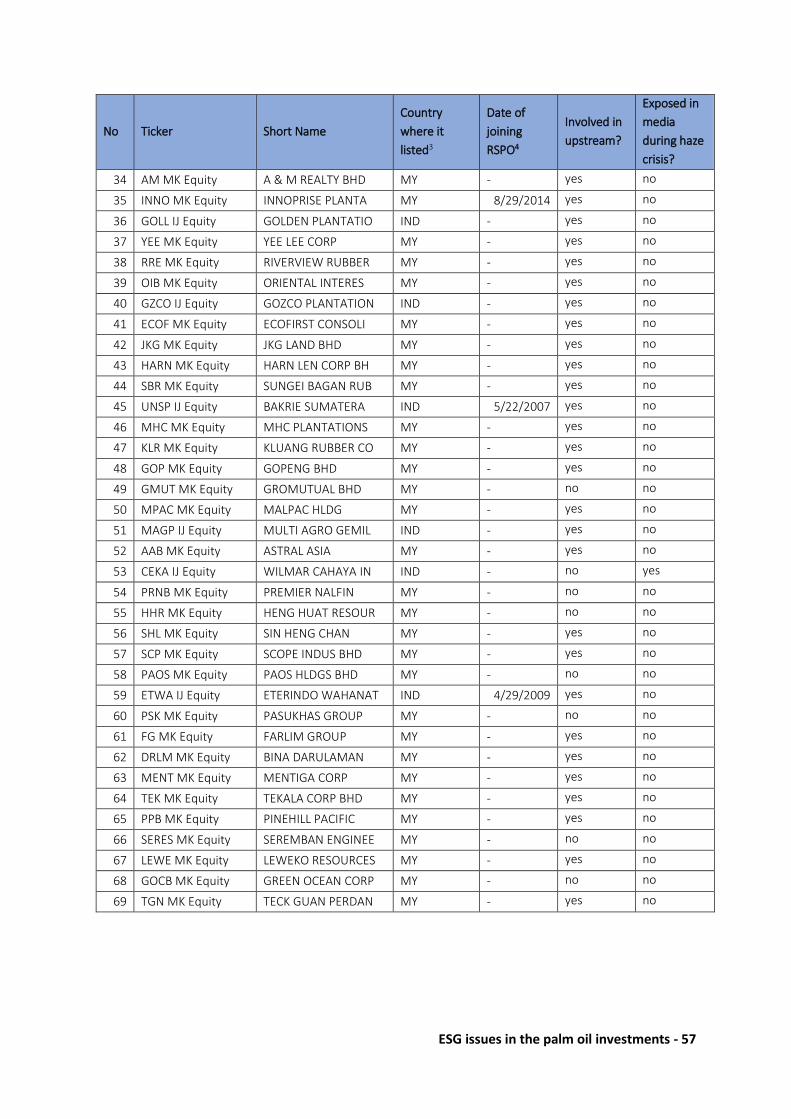
ESG issues in the palm oil investments - 57
No Ticker Short Name
Country
where it
listed3
Date of
joining
RSPO4
Involved in
upstream?
Exposed in
media
during haze
crisis?
34 AM MK Equity A & M REALTY BHD MY - yes no
35 INNO MK Equity INNOPRISE PLANTA MY 8/29/2014 yes no
36 GOLL IJ Equity GOLDEN PLANTATIO IND - yes no
37 YEE MK Equity YEE LEE CORP MY - yes no
38 RRE MK Equity RIVERVIEW RUBBER MY - yes no
39 OIB MK Equity ORIENTAL INTERES MY - yes no
40 GZCO IJ Equity GOZCO PLANTATION IND - yes no
41 ECOF MK Equity ECOFIRST CONSOLI MY - yes no
42 JKG MK Equity JKG LAND BHD MY - yes no
43 HARN MK Equity HARN LEN CORP BH MY - yes no
44 SBR MK Equity SUNGEI BAGAN RUB MY - yes no
45 UNSP IJ Equity BAKRIE SUMATERA IND 5/22/2007 yes no
46 MHC MK Equity MHC PLANTATIONS MY - yes no
47 KLR MK Equity KLUANG RUBBER CO MY - yes no
48 GOP MK Equity GOPENG BHD MY - yes no
49 GMUT MK Equity GROMUTUAL BHD MY - no no
50 MPAC MK Equity MALPAC HLDG MY - yes no
51 MAGP IJ Equity MULTI AGRO GEMIL IND - yes no
52 AAB MK Equity ASTRAL ASIA MY - yes no
53 CEKA IJ Equity WILMAR CAHAYA IN IND - no yes
54 PRNB MK Equity PREMIER NALFIN MY - no no
55 HHR MK Equity HENG HUAT RESOUR MY - no no
56 SHL MK Equity SIN HENG CHAN MY - yes no
57 SCP MK Equity SCOPE INDUS BHD MY - yes no
58 PAOS MK Equity PAOS HLDGS BHD MY - no no
59 ETWA IJ Equity ETERINDO WAHANAT IND 4/29/2009 yes no
60 PSK MK Equity PASUKHAS GROUP MY - no no
61 FG MK Equity FARLIM GROUP MY - yes no
62 DRLM MK Equity BINA DARULAMAN MY - yes no
63 MENT MK Equity MENTIGA CORP MY - yes no
64 TEK MK Equity TEKALA CORP BHD MY - yes no
65 PPB MK Equity PINEHILL PACIFIC MY - yes no
66 SERES MK Equity SEREMBAN ENGINEE MY - no no
67 LEWE MK Equity LEWEKO RESOURCES MY - yes no
68 GOCB MK Equity GREEN OCEAN CORP MY - no no
69 TGN MK Equity TECK GUAN PERDAN MY - yes no

ESG issues in the palm oil investments - 58
Appendix B – The collection of ESG issues
List of issues:
E = Environment destruction;
B = Biodiversity;
S = Social conflict;
L = Loss of customers or investors;
R = RSPO violated;
G = Governance.
No Company Country Issue Event Date Citation
1 Astra Agro Lestari IND B March 22, 2012 (Butler, 2012)
2 Astra Agro Lestari IND B September 6, 2012 (Mongabay, 2012a)
3 Astra Agro Lestari IND B January 9, 2014 (Butler, 2014)
4 Bumitama Agri IND S November 21, 2013 (Friends of the Earth US,
Walhi - Friends of the Earth
Indonesia, Forest Heroes, &
SumOfUs, 2013)
5 Bumitama Agri IND L May 26, 2014 (Friends of the Eart Europe,
2014)
6 Bumitama Agri IND E September 12, 2014 (Bell, 2014)
7 First Resources SG E December 20, 2012 (Mongabay, 2012b)
8 Genting Plantation MY R April 30, 2014 (The Edge, 2014)
9 Sinar Mas (GAR) SG L December 11, 2009 (Greenpeace, 2009)
10 Sinar Mas (GAR) SG B March 15, 2010 (Greenpeace, 2010a)
11 Sinar Mas (GAR) SG E July 6, 2010 (Greenpeace, 2010b)
12 Sinar Mas (GAR) SG G August 19, 2010 (Greenpeace, 2010c)
13 Sinar Mas (GAR) SG L September 2, 2010 (Greenpeace, 2010e)
14 Sinar Mas (GAR) SG R September 23, 2010 (Greenpeace, 2010d)
15 Golden Agri Resources SG E June 19, 2013 (Cheam, 2013)
16 Golden Agri Resources SG R April 8, 2015 (Forest Peoples
Programme, 2015)
17 IOI Corporation MY S March 15, 2010 (Milieudefensie & Friends
of the Earth Europe, 2010)
18 IOI Corporation MY S April 6, 2011 (Mongabay, 2011)
19 Kuala Lumpur Kepong MY S April 3, 2014 (Mongabay, 2014)
20 Kuala Lumpur Kepong MY R November 16, 2014 (Saturi, 2014)
21 Sinar Mas (SMART) IND L December 11, 2009 (Greenpeace, 2009)
22 Sinar Mas (SMART) IND B March 15, 2010 (Greenpeace, 2010a)
23 Sinar Mas (SMART) IND E July 6, 2010 (Greenpeace, 2010b)
24 Sinar Mas (SMART) IND G August 19, 2010 (Greenpeace, 2010c)
25 Sinar Mas (SMART) IND L September 2, 2010 (Greenpeace, 2010e)
26 Sinar Mas (SMART) IND R September 23, 2010 (Greenpeace, 2010d)
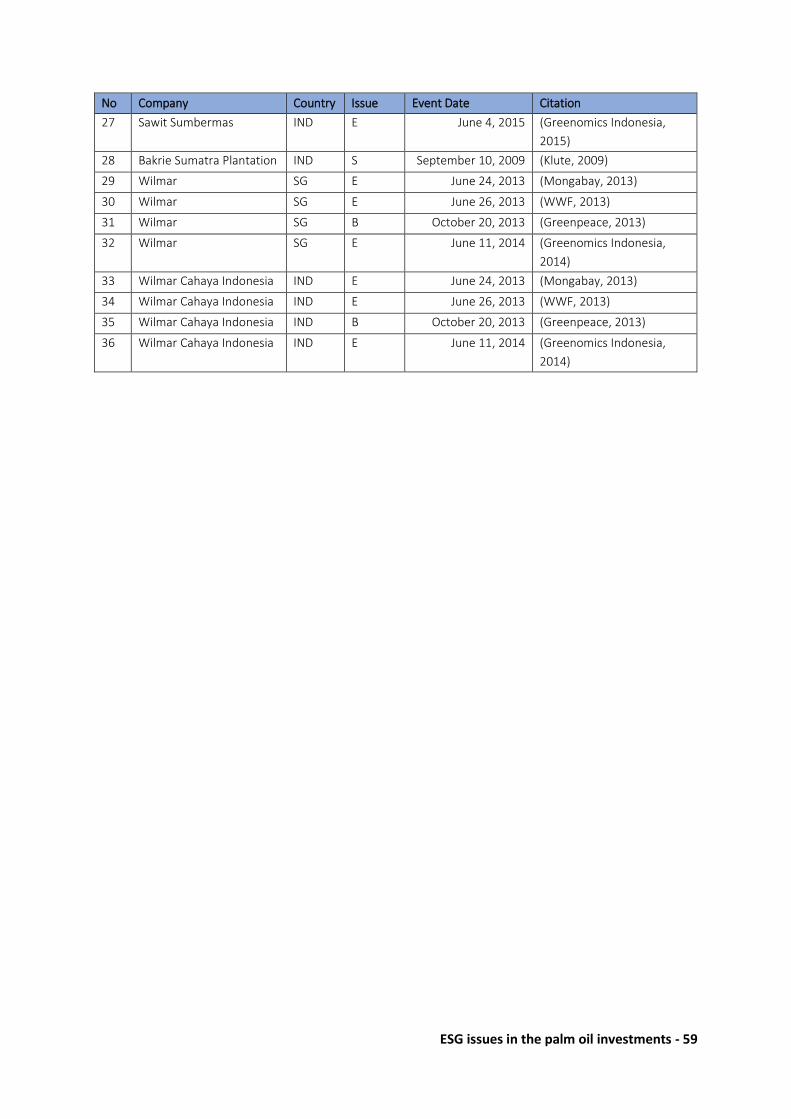
ESG issues in the palm oil investments - 59
No Company Country Issue Event Date Citation
27 Sawit Sumbermas IND E June 4, 2015 (Greenomics Indonesia,
2015)
28 Bakrie Sumatra Plantation IND S September 10, 2009 (Klute, 2009)
29 Wilmar SG E June 24, 2013 (Mongabay, 2013)
30 Wilmar SG E June 26, 2013 (WWF, 2013)
31 Wilmar SG B October 20, 2013 (Greenpeace, 2013)
32 Wilmar SG E June 11, 2014 (Greenomics Indonesia,
2014)
33 Wilmar Cahaya Indonesia IND E June 24, 2013 (Mongabay, 2013)
34 Wilmar Cahaya Indonesia IND E June 26, 2013 (WWF, 2013)
35 Wilmar Cahaya Indonesia IND B October 20, 2013 (Greenpeace, 2013)
36 Wilmar Cahaya Indonesia IND E June 11, 2014 (Greenomics Indonesia,
2014)
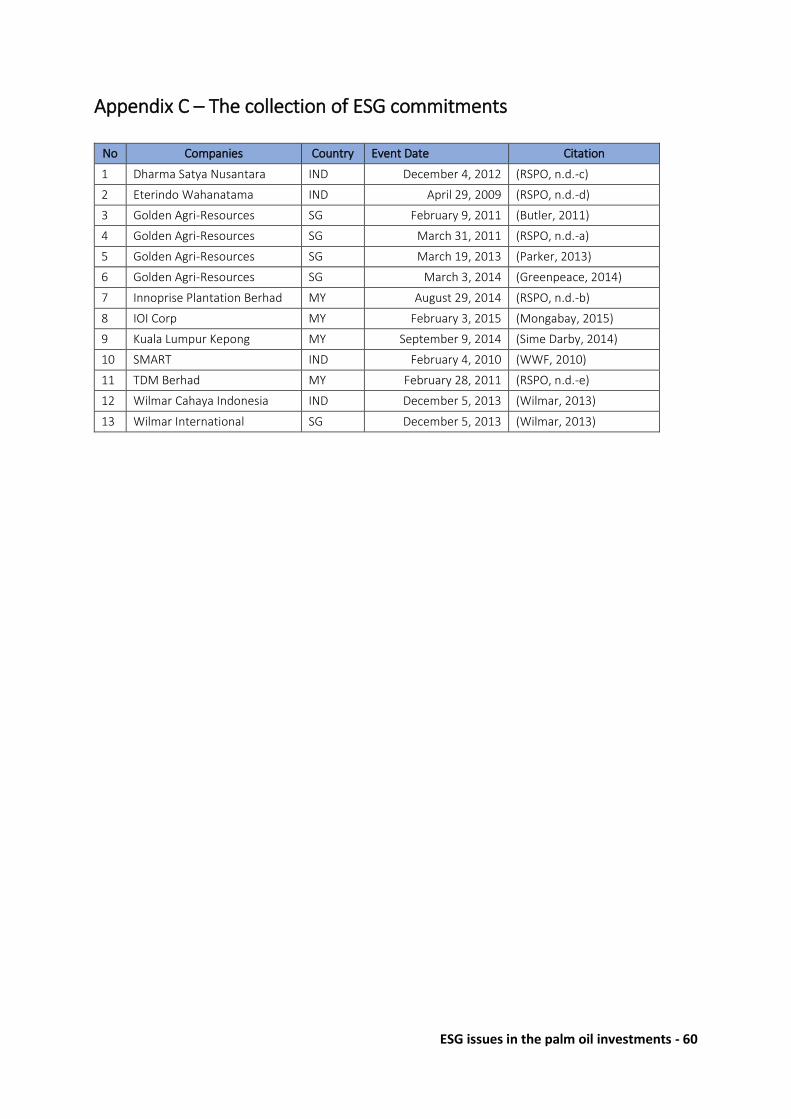
ESG issues in the palm oil investments - 60
Appendix C – The collection of ESG commitments
No Companies Country Event Date Citation
1 Dharma Satya Nusantara IND December 4, 2012 (RSPO, n.d.-c)
2 Eterindo Wahanatama IND April 29, 2009 (RSPO, n.d.-d)
3 Golden Agri-Resources SG February 9, 2011 (Butler, 2011)
4 Golden Agri-Resources SG March 31, 2011 (RSPO, n.d.-a)
5 Golden Agri-Resources SG March 19, 2013 (Parker, 2013)
6 Golden Agri-Resources SG March 3, 2014 (Greenpeace, 2014)
7 Innoprise Plantation Berhad MY August 29, 2014 (RSPO, n.d.-b)
8 IOI Corp MY February 3, 2015 (Mongabay, 2015)
9 Kuala Lumpur Kepong MY September 9, 2014 (Sime Darby, 2014)
10 SMART IND February 4, 2010 (WWF, 2010)
11 TDM Berhad MY February 28, 2011 (RSPO, n.d.-e)
12 Wilmar Cahaya Indonesia IND December 5, 2013 (Wilmar, 2013)
13 Wilmar International SG December 5, 2013 (Wilmar, 2013)

ESG issues in the palm oil investments - 61
Appendix D – Top Fund Holdings in Market Indices
Top fund holdings in MXSG Index
Reference: http://www.bloomberg.com/quote/EWS:US. Accessed on 1/19/2016.
Top fund holdings in MXID Index
Reference: http://www.bloomberg.com/quote/EIDO:US. Accessed on 1/19/2016.
Top fund holdings in MXMY Index
Reference: http://www.bloomberg.com/quote/EWM:US. Accessed on 1/19/2016.
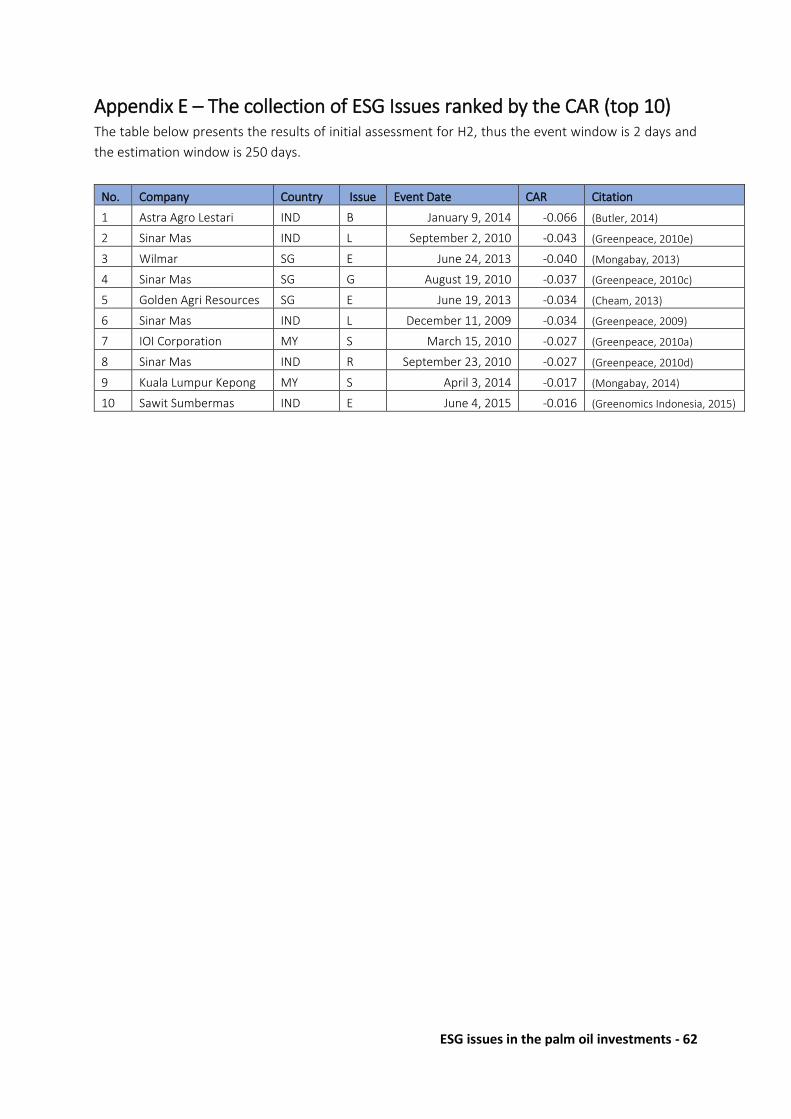
ESG issues in the palm oil investments - 62
Appendix E – The collection of ESG Issues ranked by the CAR (top 10) The table below presents the results of initial assessment for H2, thus the event window is 2 days and
the estimation window is 250 days.
No. Company Country Issue Event Date CAR Citation
1 Astra Agro Lestari IND B January 9, 2014 -0.066 (Butler, 2014)
2 Sinar Mas IND L September 2, 2010 -0.043 (Greenpeace, 2010e)
3 Wilmar SG E June 24, 2013 -0.040 (Mongabay, 2013)
4 Sinar Mas SG G August 19, 2010 -0.037 (Greenpeace, 2010c)
5 Golden Agri Resources SG E June 19, 2013 -0.034 (Cheam, 2013)
6 Sinar Mas IND L December 11, 2009 -0.034 (Greenpeace, 2009)
7 IOI Corporation MY S March 15, 2010 -0.027 (Greenpeace, 2010a)
8 Sinar Mas IND R September 23, 2010 -0.027 (Greenpeace, 2010d)
9 Kuala Lumpur Kepong MY S April 3, 2014 -0.017 (Mongabay, 2014)
10 Sawit Sumbermas IND E June 4, 2015 -0.016 (Greenomics Indonesia, 2015)
Top Related