
![Untitled-1 [] · Cyient Limited, formerly Infotech Enterprises Limited, ... 12 Top Picks for 2018 26-Dec-17 Gati Limited 99.80 137.65 158 15% Open Call -27](https://static.fdocuments.us/doc/165x107/5b14a88a7f8b9a347c8e492c/untitled-1-cyient-limited-formerly-infotech-enterprises-limited-12.jpg)


Languages
Pages
Legal

Equity | India | IT Services
Cyient Ltd.
Growing with technology…… March 31, 2015
BUY
Analyst
Omkar Tanksale
+91-22- 6614 2692 [email protected] Institutional Research 1
Initiating Coverage
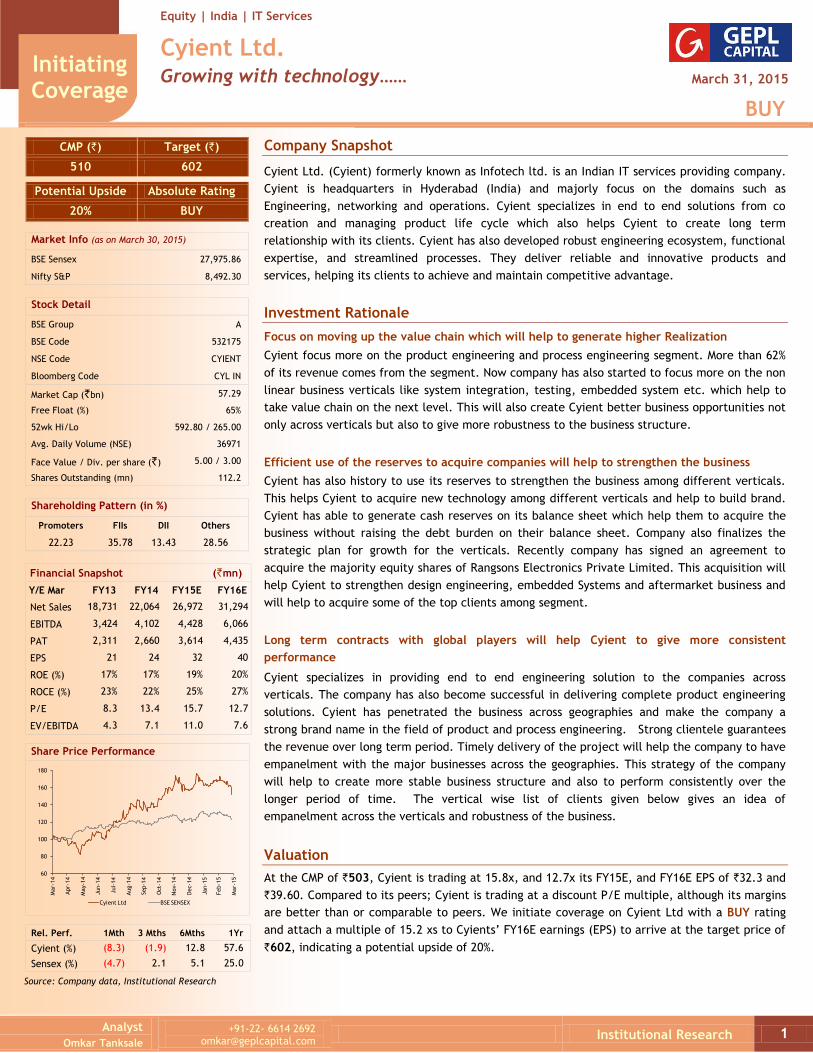
CMP (`) Target (`)
510 602
Potential Upside Absolute Rating
20% BUY
Market Info (as on March 30, 2015)
BSE Sensex 27,975.86
Nifty S&P 8,492.30
Stock Detail
BSE Group A
BSE Code 532175
NSE Code CYIENT
Bloomberg Code CYL IN
Market Cap (`bn) 57.29
Free Float (%) 65%
52wk Hi/Lo 592.80 / 265.00
Avg. Daily Volume (NSE) 36971
Face Value / Div. per share (`) 5.00 / 3.00
Shares Outstanding (mn) 112.2
Shareholding Pattern (in %)
Promoters FIIs DII Others
22.23 35.78 13.43 28.56
Financial Snapshot (`mn)
Y/E Mar FY13 FY14 FY15E FY16E
Net Sales 18,731 22,064 26,972 31,294
EBITDA 3,424 4,102 4,428 6,066
PAT 2,311 2,660 3,614 4,435
EPS 21 24 32 40
ROE (%) 17% 17% 19% 20%
ROCE (%) 23% 22% 25% 27%
P/E 8.3 13.4 15.7 12.7
EV/EBITDA 4.3 7.1 11.0 7.6
Share Price Performance
60
80
100
120
140
160
180
Mar-
14
Apr-
14
May-
14
Jun-1
4
Jul-
14
Aug-1
4
Sep-1
4
Oct
-14
Nov-
14
Dec-
14
Jan-1
5
Feb-1
5
Mar-
15
Cyient Ltd BSE SENSEX
Rel. Perf. 1Mth 3 Mths 6Mths 1Yr
Cyient (%) (8.3) (1.9) 12.8 57.6
Sensex (%) (4.7) 2.1 5.1 25.0
Source: Company data, Institutional Research
Company Snapshot
Cyient Ltd. (Cyient) formerly known as Infotech ltd. is an Indian IT services providing company.
Cyient is headquarters in Hyderabad (India) and majorly focus on the domains such as
Engineering, networking and operations. Cyient specializes in end to end solutions from co
creation and managing product life cycle which also helps Cyient to create long term
relationship with its clients. Cyient has also developed robust engineering ecosystem, functional
expertise, and streamlined processes. They deliver reliable and innovative products and
services, helping its clients to achieve and maintain competitive advantage.
Investment Rationale
Focus on moving up the value chain which will help to generate higher Realization
Cyient focus more on the product engineering and process engineering segment. More than 62%
of its revenue comes from the segment. Now company has also started to focus more on the non
linear business verticals like system integration, testing, embedded system etc. which help to
take value chain on the next level. This will also create Cyient better business opportunities not
only across verticals but also to give more robustness to the business structure.
Efficient use of the reserves to acquire companies will help to strengthen the business
Cyient has also history to use its reserves to strengthen the business among different verticals.
This helps Cyient to acquire new technology among different verticals and help to build brand.
Cyient has able to generate cash reserves on its balance sheet which help them to acquire the
business without raising the debt burden on their balance sheet. Company also finalizes the
strategic plan for growth for the verticals. Recently company has signed an agreement to
acquire the majority equity shares of Rangsons Electronics Private Limited. This acquisition will
help Cyient to strengthen design engineering, embedded Systems and aftermarket business and
will help to acquire some of the top clients among segment.
Long term contracts with global players will help Cyient to give more consistent
performance
Cyient specializes in providing end to end engineering solution to the companies across
verticals. The company has also become successful in delivering complete product engineering
solutions. Cyient has penetrated the business across geographies and make the company a
strong brand name in the field of product and process engineering. Strong clientele guarantees
the revenue over long term period. Timely delivery of the project will help the company to have
empanelment with the major businesses across the geographies. This strategy of the company
will help to create more stable business structure and also to perform consistently over the
longer period of time. The vertical wise list of clients given below gives an idea of
empanelment across the verticals and robustness of the business.
Valuation
At the CMP of `503, Cyient is trading at 15.8x, and 12.7x its FY15E, and FY16E EPS of `32.3 and
`39.60. Compared to its peers; Cyient is trading at a discount P/E multiple, although its margins
are better than or comparable to peers. We initiate coverage on Cyient Ltd with a BUY rating
and attach a multiple of 15.2 xs to Cyients’ FY16E earnings (EPS) to arrive at the target price of
`602, indicating a potential upside of 20%.

Equity | India | IT Services
Cyient Ltd. March 31, 2015
BUY
Institutional Research | Initiating Coverage 2
Index & Content
Sr. No. Topic Page No.
1 Company Background......................................... 3
2 Business Model................................................. 4
3 Key Management Personnel.................................. 5
4 Investment Rationale......................................... 6
5 Financial Overview........................................... 10
6 Key Risks........................................................ 14
7 SWOT Analysis.................................................. 15
8 Michael Porter’s Five Force Analysis........................ 16
9 Valuation & Outlook........................................... 17
10 Financials........................................................ 18
11 Disclaimer....................................................... 19
Equity | India | IT Services
Cyient Ltd. March 31, 2015
BUY
Institutional Research | Initiating Coverage 3
Company Background
Cyient Ltd. (Cyient) formerly known as Infotech Enterprises Ltd. is the Hyderabad based
midsized IT services company. The company is majorly involved in providing solutions and
engineering services to companies across verticals. Majority of verticals include Aerospace,
Transportation, Semiconductor, Medical and electronics etc. The company has developed the
expertise in the field of design engineering. Cyient also has strong presence in the field of data
transformation, network & operations and Utilities. They help their clients in communication
service providers (CSPs) plan, design and manage their next-generation networks.
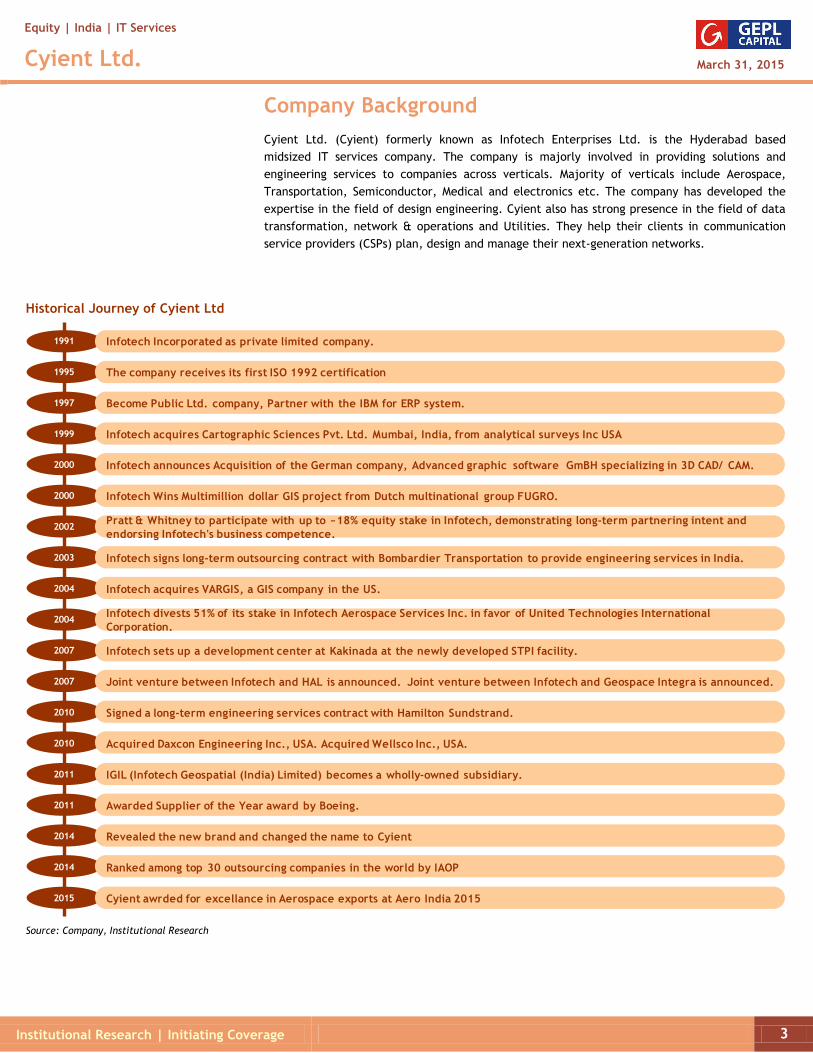
Historical Journey of Cyient Ltd
1991 Infotech Incorporated as private limited company.
1995 The company receives its first ISO 1992 certification
1997 Become Public Ltd. company, Partner with the IBM for ERP system.
1999 Infotech acquires Cartographic Sciences Pvt. Ltd. Mumbai, India, from analytical surveys Inc USA
2000 Infotech announces Acquisition of the German company, Advanced graphic software GmBH specializing in 3D CAD/ CAM.
2000 Infotech Wins Multimillion dollar GIS project from Dutch multinational group FUGRO.
2002Pratt & Whitney to participate with up to ~18% equity stake in Infotech, demonstrating long-term partnering intent and
endorsing Infotech's business competence.
2003 Infotech signs long-term outsourcing contract with Bombardier Transportation to provide engineering services in India.
2004 Infotech acquires VARGIS, a GIS company in the US.
2004Infotech divests 51% of its stake in Infotech Aerospace Services Inc. in favor of United Technologies International
Corporation.
2007 Infotech sets up a development center at Kakinada at the newly developed STPI facility.
2007 Joint venture between Infotech and HAL is announced. Joint venture between Infotech and Geospace Integra is announced.
2010 Signed a long-term engineering services contract with Hamilton Sundstrand.
2010 Acquired Daxcon Engineering Inc., USA. Acquired Wellsco Inc., USA.
2011 IGIL (Infotech Geospatial (India) Limited) becomes a wholly-owned subsidiary.
2011 Awarded Supplier of the Year award by Boeing.
2014 Revealed the new brand and changed the name to Cyient
2014 Ranked among top 30 outsourcing companies in the world by IAOP
2015 Cyient awrded for excellance in Aerospace exports at Aero India 2015
Source: Company, Institutional Research
Equity | India | IT Services
Cyient Ltd. March 31, 2015
BUY
Institutional Research | Initiating Coverage 4
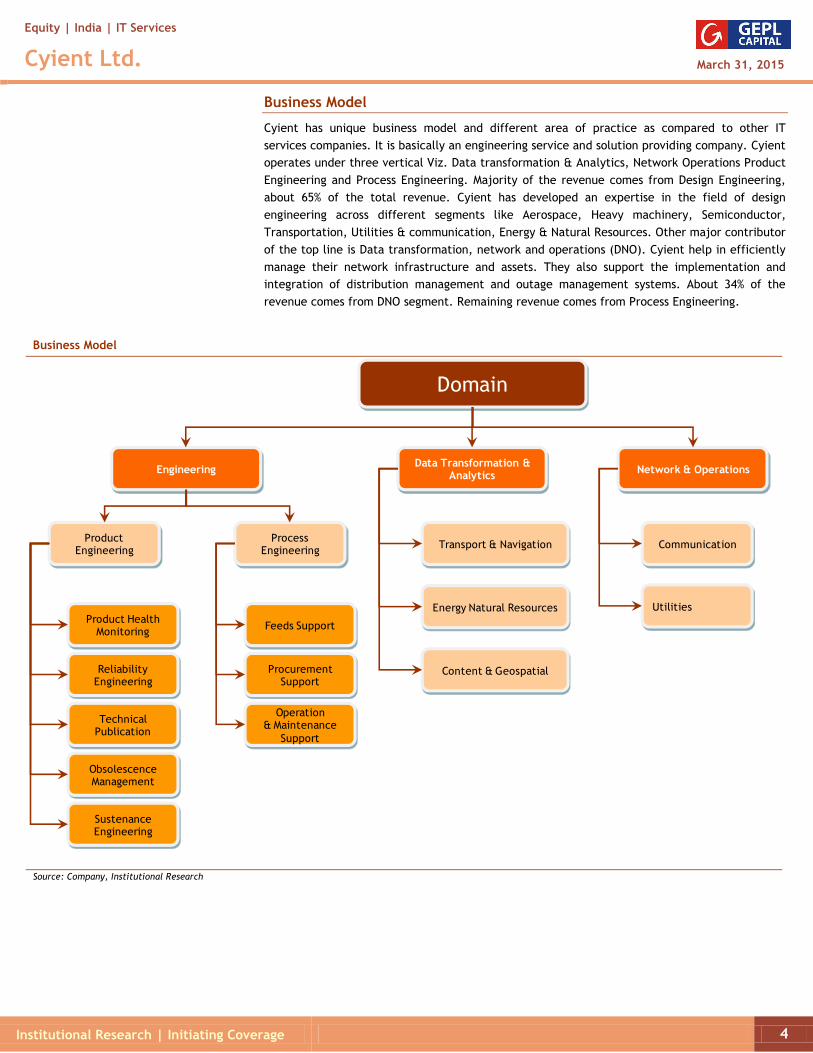
Business Model
Cyient has unique business model and different area of practice as compared to other IT
services companies. It is basically an engineering service and solution providing company. Cyient
operates under three vertical Viz. Data transformation & Analytics, Network Operations Product
Engineering and Process Engineering. Majority of the revenue comes from Design Engineering,
about 65% of the total revenue. Cyient has developed an expertise in the field of design
engineering across different segments like Aerospace, Heavy machinery, Semiconductor,
Transportation, Utilities & communication, Energy & Natural Resources. Other major contributor
of the top line is Data transformation, network and operations (DNO). Cyient help in efficiently
manage their network infrastructure and assets. They also support the implementation and
integration of distribution management and outage management systems. About 34% of the
revenue comes from DNO segment. Remaining revenue comes from Process Engineering.
Business Model
Domain
Transport & NavigationProduct
Engineering
Product Health Monitoring
Engineering Data Transformation &
AnalyticsNetwork & Operations
Process Engineering
Reliability Engineering
Technical Publication
Obsolescence Management
Sustenance Engineering
Feeds Support
Procurement Support
Operation & Maintenance
Support
Energy Natural Resources
Content & Geospatial
Communication
Utilities
Source: Company, Institutional Research
Equity | India | IT Services
Cyient Ltd. March 31, 2015
BUY
Institutional Research | Initiating Coverage 5
Key Management Personnel
Cyient Ltd. is blessed with credible management that takes Cyient on the path of the growth.
B.V.R Mohan Reddy (Executive Chairman):
Mohan focuses on the medium- to long-term future of the company. He is also involved in
leadership development, innovation, information systems and corporate social responsibility.
Krishna Bodanapu (Managing Director and CEO):
Krishna Bodanapu joined Cyient in 2001. In his current role, he provides the strategic direction
for growth and is responsible for all operations.
B. ASHOK REDDY (President, Corporate Affairs & Infrastructure):
Ashok has fiduciary responsibility for all of Cyient’s subsidiaries. As the chairman of the
subsidiaries, he maintains all government and industry body relationships
AJAY AGGARWAL (Sr. VP & CFO):
Ajay has extensive international experience spanning 27 years in financial management and
commercial management at large multi location, multiproduct organizations. He is skilled in
setting up startups with expertise in funding, banking and strategic planning, business modeling,
MIS, ERP implementations, capital budgeting, corporate finance, M&A and restructuring.
DR. DEVENDRA RAO GUNTUPALLI (Sr. VP & CIO)
Dr. Rao is currently responsible for information technology and systems to generate business
value to the organization.
Equity | India | IT Services
Cyient Ltd. March 31, 2015
BUY
Institutional Research | Initiating Coverage 6
Investment Rationale
Strategic vertical split to drive the desire growth
Cyient is operating under different verticals to provide design and engineering services to its
clients. The company has managed successfully its product mix across different verticals to
attain desire growth momentum. Engineering Services Outsourcing (ESO) is one of the most
highly growing sectors in IT service industry. India will be leading offshore destination which
provide high end ESO.
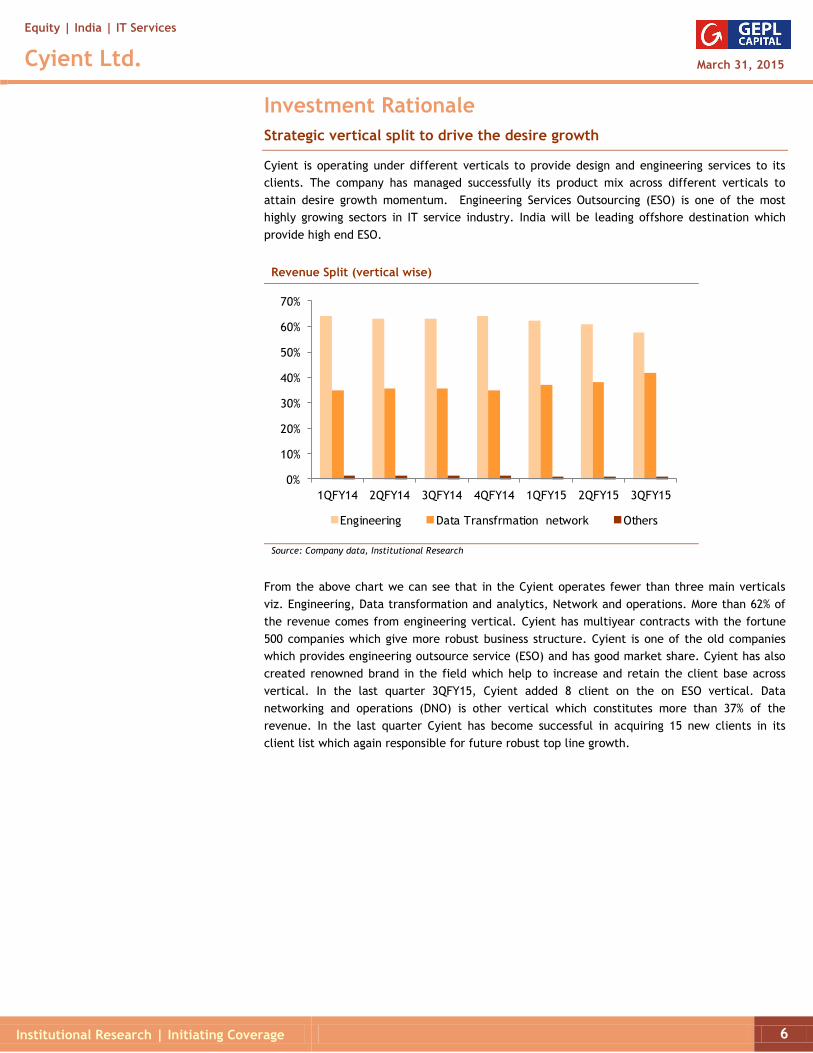
Revenue Split (vertical wise)
0%
10%
20%
30%
40%
50%
60%
70%
1QFY14 2QFY14 3QFY14 4QFY14 1QFY15 2QFY15 3QFY15
Engineering Data Transfrmation network Others
Source: Company data, Institutional Research
From the above chart we can see that in the Cyient operates fewer than three main verticals
viz. Engineering, Data transformation and analytics, Network and operations. More than 62% of
the revenue comes from engineering vertical. Cyient has multiyear contracts with the fortune
500 companies which give more robust business structure. Cyient is one of the old companies
which provides engineering outsource service (ESO) and has good market share. Cyient has also
created renowned brand in the field which help to increase and retain the client base across
vertical. In the last quarter 3QFY15, Cyient added 8 client on the on ESO vertical. Data
networking and operations (DNO) is other vertical which constitutes more than 37% of the
revenue. In the last quarter Cyient has become successful in acquiring 15 new clients in its
client list which again responsible for future robust top line growth.

Equity | India | IT Services
Cyient Ltd. March 31, 2015
BUY
Institutional Research | Initiating Coverage 7
Robust top line growth is expected in the upcoming period with high
growth in the segment revenue.
Cyient is the market leader in the field of Product engineering and Design Engineering. More
than 65% of the top line contribution comes from this segment. The Engineering services
outsourcing (ESO) is outpaced the IT service industry over the last five years. The engineering
services outsourcing has been growing across the geographies and among different sub segments
like new product development, Engineering consulting, value Engineering etc.
India's Product Engineering Growth Rate ($ bn)
1314.7
42
0
5
10
15
20
25
30
35
40
45
FY11 FY12 FY2020E
13% YoY Growth
Source: Zinnov, Institutional Research
From the above diagram we can say that, ESO has shown strong growth momentum in the past
few quarters and also have higher growth prospects. Cyient has larger client distribution from
the same industry.
India is one of the largest contributors to the industry with more than 20% market share. India is
considered to be better option for ESO as easy availability of the highly skilled labor,
infrastructure and technology. The total product engineering outsourcing sector is likely to grow
with 13-15% in the upcoming years. By the year 2020 the sector has the outlook of growing with
14% CAGR. The total market size of the Indian Engineering outsourcing will be $42 bn , this
potential of the market will definitely give Cyient an edge to grow with higher momentum. We
believe that as a market leader in India Cyient will outperform the market growth rate.
Specialize technology in the field will help the company to grow in the upcoming future.
Equity | India | IT Services
Cyient Ltd. March 31, 2015
BUY
Institutional Research | Initiating Coverage 8
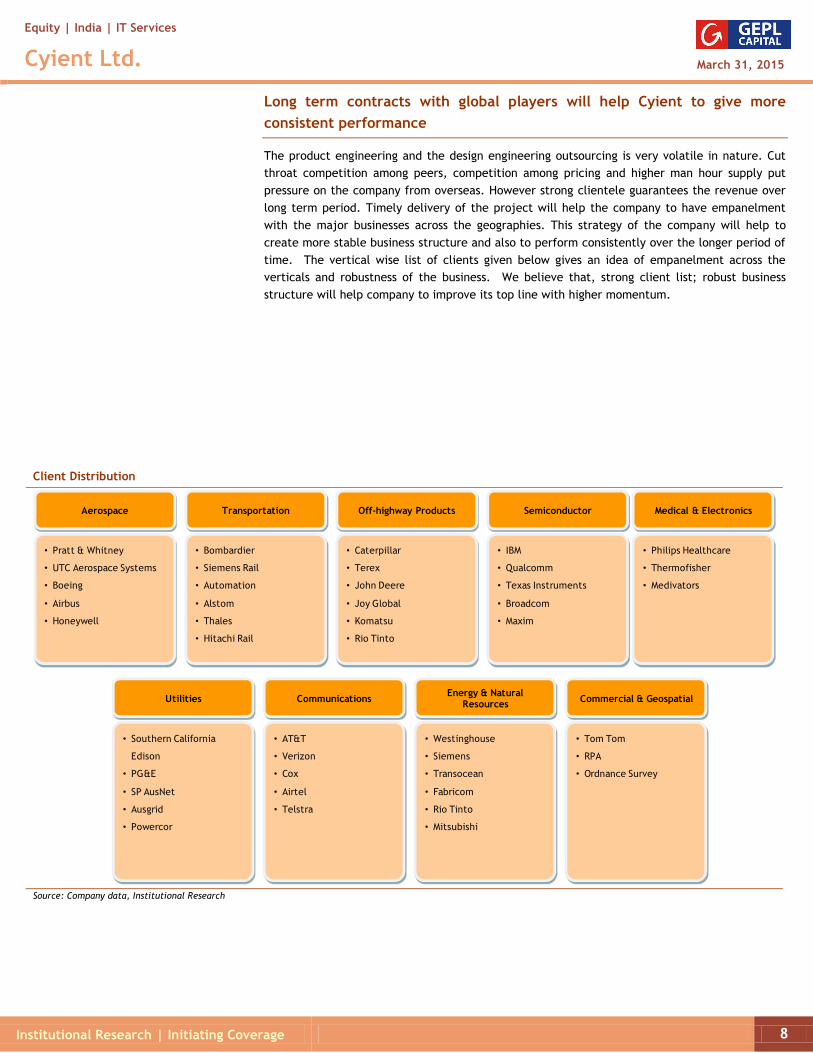
Long term contracts with global players will help Cyient to give more
consistent performance
The product engineering and the design engineering outsourcing is very volatile in nature. Cut
throat competition among peers, competition among pricing and higher man hour supply put
pressure on the company from overseas. However strong clientele guarantees the revenue over
long term period. Timely delivery of the project will help the company to have empanelment
with the major businesses across the geographies. This strategy of the company will help to
create more stable business structure and also to perform consistently over the longer period of
time. The vertical wise list of clients given below gives an idea of empanelment across the
verticals and robustness of the business. We believe that, strong client list; robust business
structure will help company to improve its top line with higher momentum.
Client Distribution
Aerospace
• Pratt & Whitney
• UTC Aerospace Systems
• Boeing
• Airbus
• Honeywell
Transportation
• Bombardier
• Siemens Rail
• Automation
• Alstom
• Thales
• Hitachi Rail
Off-highway Products
• Caterpillar
• Terex
• John Deere
• Joy Global
• Komatsu
• Rio Tinto
Semiconductor
• IBM
• Qualcomm
• Texas Instruments
• Broadcom
• Maxim
Utilities
• Southern California
Edison
• PG&E
• SP AusNet
• Ausgrid
• Powercor
Communications
• AT&T
• Verizon
• Cox
• Airtel
• Telstra
Energy & Natural Resources
• Westinghouse
• Siemens
• Transocean
• Fabricom
• Rio Tinto
• Mitsubishi
Commercial & Geospatial
• Tom Tom
• RPA
• Ordnance Survey
Medical & Electronics
• Philips Healthcare
• Thermofisher
• Medivators
Source: Company data, Institutional Research

Equity | India | IT Services
Cyient Ltd. March 31, 2015
BUY
Institutional Research | Initiating Coverage 9
Efficient use of the reserves to acquire companies will help to strengthen
the business
Cyient has also history to use its reserves to strengthen the business among different verticals.
This helps Cyient to acquire new technology among different verticals and help to build brand.
Cyient also able to generate cash reserves on its balance sheet which help them to acquire the
business without raising the debt burden on their balance sheet. Company also finalizes the
strategic plan for growth for the verticals. Recently company has signed an agreement to
acquire the majority equity shares of Rangsons Electronics Private Limited. This acquisition will
help Cyient to strengthen design engineering, embedded Systems and aftermarket business and
will help to acquire some of the top clients among segment.
Consistent employee addition help company to maintain higher efficiency
Strong employee support makes IT service company stronger. Higher the employees higher the
projects can IT company can take. Employee addition increases the efficiency of the company.
This will ultimately help to attain higher top line growth and also help company to grow.
Employee distribution
0%
10%
20%
30%
40%
50%
60%
70%
80%
90%
100%
0
1,000
2,000
3,000
4,000
5,000
6,000
7,000
1Q
FY11
2Q
FY11
3Q
FY11
4Q
FY11
1Q
FY12
2Q
FY12
3Q
FY12
4Q
FY12
1Q
FY13
2Q
FY13
3Q
FY13
4Q
FY13
1Q
FY14
2Q
FY14
3Q
FY14
4Q
FY14
1Q
FY15
2Q
FY15
3Q
FY15
Engineering DNO IT Services Support Functions Utilization
Source: Company data, Institutional Research
As shown in the above chart, Cyient has consistent employee addition which ensures timely
completion of the project. Higher efficiency ensures lower operating cost which will help Cyient
to produce better operating margins. Moderate addition in the employees also helps to add
active clients. This will also help to attain desire top line growth. From the above chart we can
see that, Cyient has maximum dedicated employees to engineering and DNO services. Stable
utilization levels also show the efficient use of its manpower to generate revenue. This enables
company to acquire new projects easily as compared to its peers, and also ensures the timeline
based delivery of the project.

Equity | India | IT Services
Cyient Ltd. March 31, 2015
BUY
Institutional Research | Initiating Coverage 10
Financial Overview
Pretax Margin
EBITDA Margins
As shown in the graph below, Cyient has shown consistent EBITDA growth over the past few
quarters. This shows that Cyient has been successful in managing the operating expenses
efficiently with the rise in the top line. After the slight decline in the EBITDA margins in 1QFY15
company has started regaining the desire operating efficiency over last two quarters and will
also likely to continue in the upcoming period.
EBITDA Margins
0%
5%
10%
15%
20%
25%
0
200
400
600
800
1000
1200
1400
1Q
FY11
2Q
FY11
3Q
FY11
4Q
FY11
1Q
FY12
2Q
FY12
3Q
FY12
4Q
FY12
1Q
FY13
2Q
FY13
3Q
FY13
4Q
FY13
1Q
FY14
2Q
FY14
3Q
FY14
4Q
FY14
1Q
FY15
2Q
FY15
3Q
FY15
EBITDA Margin
Source: Company data, Institutional Research
Operating Margins
As shown in the graph below, Cyient has become successful in increasing the operating margins
over past few years. Consistent rise in the operating profit indicates that, Cyient has become
successful in transferring the operating cost to its customers. This also indicates rising efficiency
in the business. We believe that Cyient will deliver better operating margins as they focus more
on the segments where they have higher realizations.
Operating Margins
0%
5%
10%
15%
20%
25%
30%
0
200
400
600
800
1000
1200
1400
1600
1Q
FY11
2Q
FY11
3Q
FY11
4Q
FY11
1Q
FY12
2Q
FY12
3Q
FY12
4Q
FY12
1Q
FY13
2Q
FY13
3Q
FY13
4Q
FY13
1Q
FY14
2Q
FY14
3Q
FY14
4Q
FY14
1Q
FY15
2Q
FY15
3Q
FY15
EBIT after other Income Margin
Source: Company data, Institutional Research
Equity | India | IT Services
Cyient Ltd. March 31, 2015
BUY
Institutional Research | Initiating Coverage 11
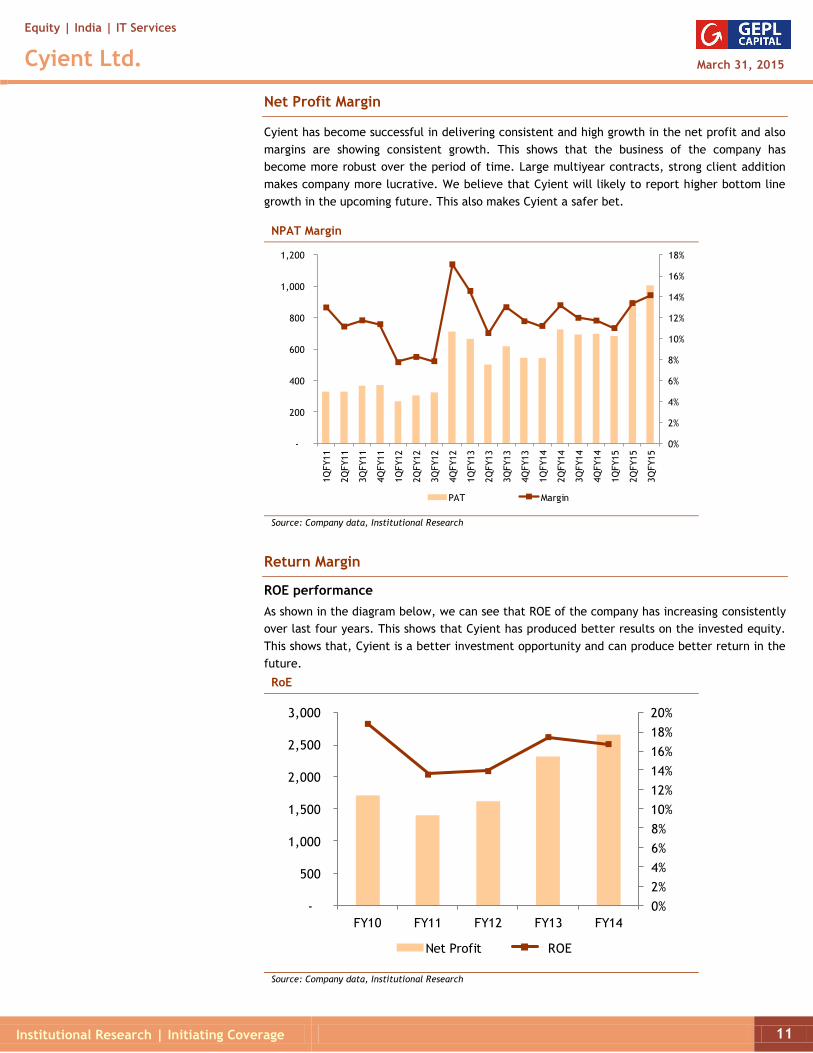
Net Profit Margin
Cyient has become successful in delivering consistent and high growth in the net profit and also
margins are showing consistent growth. This shows that the business of the company has
become more robust over the period of time. Large multiyear contracts, strong client addition
makes company more lucrative. We believe that Cyient will likely to report higher bottom line
growth in the upcoming future. This also makes Cyient a safer bet.
NPAT Margin
0%
2%
4%
6%
8%
10%
12%
14%
16%
18%
-
200
400
600
800
1,000
1,200
1Q
FY11
2Q
FY11
3Q
FY11
4Q
FY11
1Q
FY12
2Q
FY12
3Q
FY12
4Q
FY12
1Q
FY13
2Q
FY13
3Q
FY13
4Q
FY13
1Q
FY14
2Q
FY14
3Q
FY14
4Q
FY14
1Q
FY15
2Q
FY15
3Q
FY15
PAT Margin
Source: Company data, Institutional Research
Return Margin
ROE performance
As shown in the diagram below, we can see that ROE of the company has increasing consistently
over last four years. This shows that Cyient has produced better results on the invested equity.
This shows that, Cyient is a better investment opportunity and can produce better return in the
future.
RoE
0%
2%
4%
6%
8%
10%
12%
14%
16%
18%
20%
-
500
1,000
1,500
2,000
2,500
3,000
FY10 FY11 FY12 FY13 FY14
Net Profit ROE
Source: Company data, Institutional Research

Equity | India | IT Services
Cyient Ltd. March 31, 2015
BUY
Institutional Research | Initiating Coverage 12
Return on the capital Employed (ROCE)
Return on the capital employed (ROCE) is also one of the major important aspect while
investing. Cyient has zero or marginal debt on their balances sheet. So that the company has
produce the strong growth in terms of ROCE as net profit is growing. We believe that Cyient will
show a strong growth for the upcoming period.
RoCE
0%
5%
10%
15%
20%
25%
-
500
1,000
1,500
2,000
2,500
3,000
FY10 FY11 FY12 FY13 FY14
Net Profit RoCE
Source: Company data, Institutional Research
Payout Ratio
Dividend Payout Ratio
Cyient is one of the highly dividend paying company. As shown in the graph below Cyient has
strong payout ratio. This also makes stock very lucrative. We believe that in the upcoming
period Cyient will likely to maintain the payout ratio of 20% in the upcoming period.
Dividend Payout Ratio
0%
5%
10%
15%
20%
25%
-
100
200
300
400
500
600
700
800
FY10 FY11 FY12 FY13 FY14
Dividend Paid Dividend payout ratio
Source: Company data, Institutional Research

Equity | India | IT Services
Cyient Ltd. March 31, 2015
BUY
Institutional Research | Initiating Coverage 13
Net Profit to Payout Ratio
Cyient has history of paying dividend to its share holder. As shown in the diagram below we can
see that company had given dividends as proportion to the net profit. We believe that payout
ratio to net profit ratio will likely to remain same. This also makes stock more lucrative.
Investor can also take privilege of higher payout ratio.
Net Profit to Payout Ratio
0%
5%
10%
15%
20%
25%
-
500
1,000
1,500
2,000
2,500
3,000
FY10 FY11 FY12 FY13 FY14
Net Profit Dividend payout ratio
Source: Company data, Institutional Research
Equity | India | IT Services
Cyient Ltd. March 31, 2015
BUY
Institutional Research | Initiating Coverage 14
Key Risks
Investment Risk :
Fluctuations in the US$-INR and GBP-INR and GBP-US$. As majority of the revenue
comes from international territories. Fluctuation in the currencies will impact the
revenue of the company
Change in the economic climate / legislation against Indian offshore development in
the countries where the company provides its services. Fluctuation in world’s largest
economy will affect the IT services business on substantial front.
Increase in Visa fees will increase the cost. Rise in the visa fees will lead to rise in the
operating cost (Employee expenses) to IT industry. So it plays a major role in the IT
industry.
Salary hikes i.e. wage inflation may cause a spoil sport. Rising economic growth will
create more jobs in the country. This will ultimately give rise to wages hikes. Wage
hikes will affect the operating margins of the company. So fluctuation in the wages is
considered to be significant risk in IT service Industry.
Equity | India | IT Services
Cyient Ltd. March 31, 2015
BUY
Institutional Research | Initiating Coverage 15
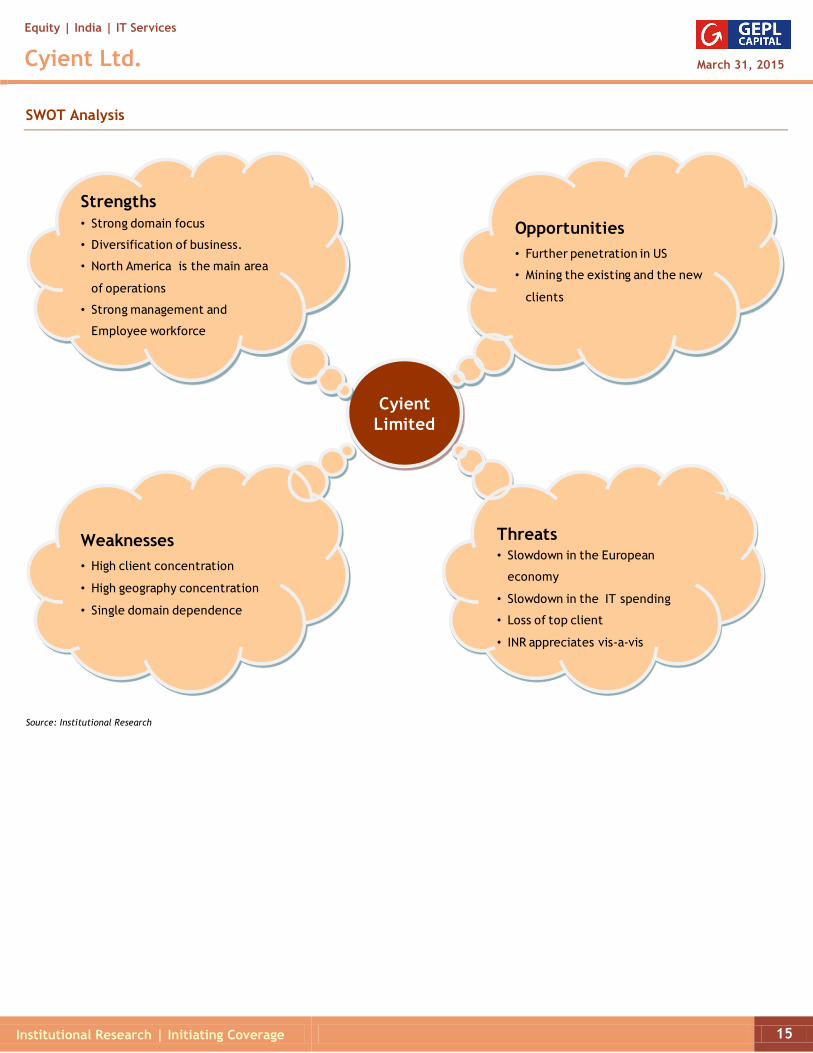
SWOT Analysis
Cyient
Limited
Strengths
• Strong domain focus
• Diversification of business.
• North America is the main area
of operations
• Strong management and
Employee workforce
Opportunities
• Further penetration in US
• Mining the existing and the new
clients
Weaknesses
• High client concentration
• High geography concentration
• Single domain dependence
Threats• Slowdown in the European
economy
• Slowdown in the IT spending
• Loss of top client
• INR appreciates vis-a-vis
Source: Institutional Research

Equity | India | IT Services
Cyient Ltd. March 31, 2015
BUY
Institutional Research | Initiating Coverage 16
Michael Porter’s Five Force Analysis
Inter-firm Rivalry–High
Lower Entry barriers in
the industry have led to
high concentration in
the industry.
Threat of new entrants –
Increasing
• MNCs are entering the ‘offshore’
business heavily.
Bargaining Power of
Suppliers – High
• Intense competition in the
recruitment market puts higher
wage pressure and increasing
trend of attrition is witnessed.
Bargaining Power of Buyers –
Increasing
• With availability of multiple
vendors, Buyers have a lot of
choice and this has led to
pressures on the billing rates.
Threat from Substitutes -
Increasing
• Emerging economies like China,
Brazil and Russia can be the
substitute places for ‘offshoring’
taking away the India advantage
to certain extent.
Source: Institutional Research

Equity | India | IT Services
Cyient Ltd. March 31, 2015
BUY
Institutional Research | Initiating Coverage 17
Valuation & Outlook
At the CMP of `503, Cyient is trading at 15.8x, and 12.7x its FY15E, and FY16E EPS of `32.3 and
`39.60. Compared to its peers; Cyient is trading at a discount P/E multiple, although its margins
are better than or comparable to peers. We initiate coverage on Cyient Ltd with a BUY rating
and attach a multiple of 15.2 xs to Cyients’ FY16E earnings (EPS) to arrive at the target price of
`602, indicating a potential upside of 20%.
1 year forward P/E Chart
0
100
200
300
400
500
600
Ap
r-04
Aug
-04
Dec-0
4
Ap
r-05
Aug
-05
Dec-0
5
Ap
r-06
Aug
-06
Dec-0
6
Ap
r-07
Aug
-07
Dec-0
7
Ap
r-08
Aug
-08
Dec-0
8
Ap
r-09
Aug
-09
Dec-0
9
Ap
r-10
Aug
-10
Dec-1
0
Ap
r-11
Aug
-11
Dec-1
1
Ap
r-12
Aug
-12
Dec-1
2
Ap
r-13
Aug
-13
Dec-1
3
Ap
r-14
Close -Unit Curr 10.0 X 12.0 X 15.0 X 18.0 X 20.0 X
Source: Capitaline, Institutional Research
1 year forward P/ BV Chart
0
100
200
300
400
500
600
Apr-
04
Sep-0
4
Feb-0
5
Jul-
05
Dec-
05
May-
06
Oct
-06
Mar-
07
Aug-0
7
Jan-0
8
Jun-0
8
Nov-
08
Apr-
09
Sep-0
9
Feb-1
0
Jul-
10
Dec-
10
May-
11
Oct
-11
Mar-
12
Aug-1
2
Jan-1
3
Jun-1
3
Nov-
13
Apr-
14
Close -Unit Curr 1.5 X 2.0 X 2.5 X 3.0 X 3.5 X
Source: Capitaline, Institutional Research

Equity | India | IT Services
Cyient Ltd. March 31, 2015
BUY
Institutional Research | Initiating Coverage 18
Income Statement
Y/E Mar (`mn) FY12 FY13 FY14 FY15E FY16E
Net revenues 15,531 18,731 22,064 26,972 31,294
Employee Cost 9,526 11,406 13,678 16,108 18,343
EBITDA 2,691 3,424 4,102 4,428 6,066
EBITDA Margin (%) 17% 18% 19% 16% 19%
Depreciation 494 635 720 805 983
Other Income 175 381 169 1,187 1,000
Interest (Net) 7 3 14 49 48
Exceptional Items 16 18 - - -
PBT 2,349 3,148 3,538 4,762 6,036
PBT Margin (%) 15% 17% 16% 18% 19%
Tax 835 967 1,030 1,308 1,720
Adjusted PAT 1,514 2,182 2,508 3,453 4,315
Extraordinary Items 100 129 152 152 120
Reported PAT 1,614 2,311 2,660 3,614 4,435
Balance Sheet
Y/E Mar (`mn) FY12 FY13 FY14 FY15E FY16E
Equity capital 557 558 560 560 560
Reserves & Surplus 11017 12664 15323 17983 21323
Net worth 11574 13222 15883 18543 21883
Total debt 493 381 382 350 350
Deferred Tax Liability 33 45 52 20 25
Total Liabilities & Equity 14,036 16,100 19,466 22,403 26,130
Net block 2796 2965 2867 3211 3597
Capital WIP 198 228 71 250 250
Total fixed assets 3465 3582 3437 3486 3872
Investments 244 373 525 450 450
Goodwill 472 389 499 25 25
Other Fixed Assets 0 0.192 2.082 0 0
Total Non-Current Assets 4,507 4,906 5,018 4,671 5,167
Debtors 3675 3944 4800 5863 6803
Cash & bank 4560 4983 6913 8668 10960
Loans & advances 353 590 786 700 700
Other Current Assets 942 1067 1548 2000 2000
Total Current Assets 9,529 11,194 14,447 17,732 20,963
Creditors 881 1,215 1,802 2,140 2,472
Provisions 1,054 1,234 1,346 1,350 1,400
Current Liab. & Prov. 1,935 2,449 3,147 3,490 3,872
Total Assets 14,036 16,100 19,465 22,403 26,130
Key Ratio
Y/E Mar (`mn) FY12 FY13 FY14 FY15E FY16E
Per Share Ratios
Fully diluted E P S 14.49 20.68 23.80 32.26 39.60
Book Value 104 118 142 166 195
Dividend per share 2.51 4.49 5.01 6.44 7.92
Valuation Ratio
P/E 10.35 8.32 13.43 15.70 15.20
P/BV 1.44 1.45 2.25 3.26 2.76
EV/EBITDA 4.71 4.28 7.13 11.00 7.60
EV/Sales 0.82 0.78 1.33 1.94 1.59
Growth Ratios
Sales Growth 31% 21% 18% 22% 16%
EBITDA Growth 50% 27% 20% 8% 37%
Net Profit Growth 15% 43% 15% 36% 23%
EPS Growth 16% 43% 15% 36% 23%
Common size Ratios
EBITDA Margin 17% 18% 19% 16% 19%
EBIT margin 14% 15% 15% 13% 16%
PAT margin 10% 12% 12% 13% 14%
Employee cost 21% 21% 19% 24% 22%
Return ratios
RoNW 14% 17% 17% 19% 20%
RoCE 20% 23% 22% 25% 27%
Turnover ratios (days)
Debtors ( Days) 86 77 79 79 79
Creditors ( Days) 20 24 29 28 28
Inventory (Days) - - - - -
Solvency Ratios
Total Debt/Equity 4% 3% 3% 2% 2%
Source: Company data, Institutional Research
Cash Flow
Y/E Mar (`mn) FY12 FY13 FY14 FY15E FY16E
PBT 2,349 3,148 7,118 4,762 6,036
Add: Depreciation 494 635 720 805 983
Other Adjustments 9,183 (936) (1,342) (1,300) (1,200)
Chg. in working capital 73 2,257 3,297 2,169 4,553
Taxes paid (688) 955 (1,024) (1,308) (1,720)
Extra Ordinary Items 0 0 0 0 0
CF from operations 1,239 1,402 2,272 3,478 6,274
Capex (804) (722) (766) (883) (1,016)
Purchase of investment 889 2,096 2,181 2,100 2,100
Proceeds from Invest. Sale (1,400) 347 354 200 200
Other Adjustments 20,854 (254) (2,944) (3,000) (3,000)
CF from Investing acti. (2,287) 2,278 (176) (1,083) (1,216)
Share application money received
500 3,291 1,428 (997) (2,942)
Finance Cost 2,092 2,874 (137) (49) (48)
Dividend & dividend tax (502) (422) (521) (793) (976)
CF from Financing acti. 223 1,294 (427) (639) (2,766)
Chg. in cash (3,046) 4,527 1,930 1,755 2,292
Opening cash 3,502 456 4,983 6,913 8,668
Closing cash 4,560 4,983 6,913 8,668 10,960
Du-Pont Analysis
(%) FY12 FY13 FY14 FY15E FY16E
PAT/ PBT 69% 73% 75% 76% 73%
PBT/ PBIT 99% 99% 100% 99% 99%
PBIT / Sales 15% 17% 16% 18% 19%
Sales / Assets 1.28 1.37 1.35 1.43 1.41
Assets/ Equity 1.05 1.03 1.03 1.02 1.02
ROE 14% 17% 17% 19% 20%
Equity | India | IT Services
Cyient Ltd. March 31, 2015
BUY
Institutional Research | Initiating Coverage 19
NOTES
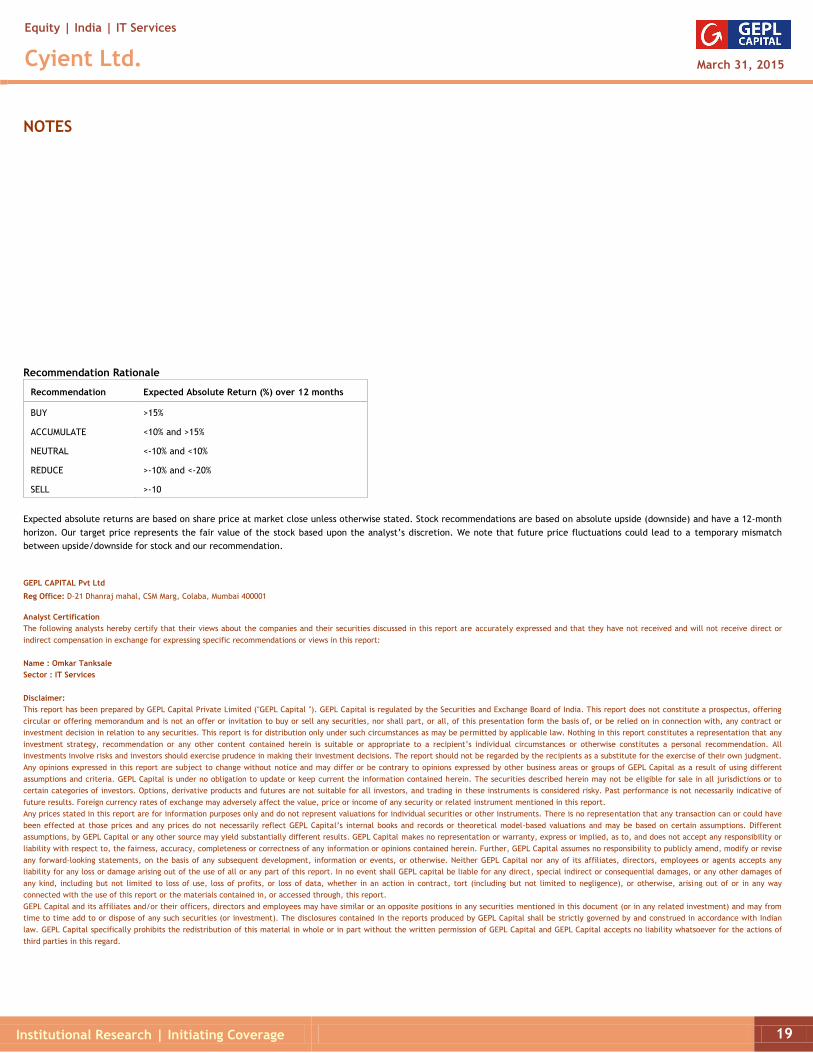
Recommendation Rationale
Recommendation Expected Absolute Return (%) over 12 months
BUY >15%
ACCUMULATE <10% and >15%
NEUTRAL <-10% and <10%
REDUCE >-10% and <-20%
SELL >-10
Expected absolute returns are based on share price at market close unless otherwise stated. Stock recommendations are based on absolute upside (downside) and have a 12-month
horizon. Our target price represents the fair value of the stock based upon the analyst’s discretion. We note that future price fluctuations could lead to a temporary mismatch
between upside/downside for stock and our recommendation.
GEPL CAPITAL Pvt Ltd
Reg Office: D-21 Dhanraj mahal, CSM Marg, Colaba, Mumbai 400001
Analyst Certification
The following analysts hereby certify that their views about the companies and their securities discussed in this report are accurately expressed and that they have not received and will not receive direct or
indirect compensation in exchange for expressing specific recommendations or views in this report:
Name : Omkar Tanksale
Sector : IT Services
Disclaimer:
This report has been prepared by GEPL Capital Private Limited ("GEPL Capital "). GEPL Capital is regulated by the Securities and Exchange Board of India. This report does not constitute a prospectus, offering
circular or offering memorandum and is not an offer or invitation to buy or sell any securities, nor shall part, or all, of this presentation form the basis of, or be relied on in connection with, any contract or
investment decision in relation to any securities. This report is for distribution only under such circumstances as may be permitted by applicable law. Nothing in this report constitutes a representation that any
investment strategy, recommendation or any other content contained herein is suitable or appropriate to a recipient’s individual circumstances or otherwise constitutes a personal recommendation. All
investments involve risks and investors should exercise prudence in making their investment decisions. The report should not be regarded by the recipients as a substitute for the exercise of their own judgment.
Any opinions expressed in this report are subject to change without notice and may differ or be contrary to opinions expressed by other business areas or groups of GEPL Capital as a result of using different
assumptions and criteria. GEPL Capital is under no obligation to update or keep current the information contained herein. The securities described herein may not be eligible for sale in all jurisdictions or to
certain categories of investors. Options, derivative products and futures are not suitable for all investors, and trading in these instruments is considered risky. Past performance is not necessarily indicative of
future results. Foreign currency rates of exchange may adversely affect the value, price or income of any security or related instrument mentioned in this report.
Any prices stated in this report are for information purposes only and do not represent valuations for individual securities or other instruments. There is no representation that any transaction can or could have
been effected at those prices and any prices do not necessarily reflect GEPL Capital’s internal books and records or theoretical model-based valuations and may be based on certain assumptions. Different
assumptions, by GEPL Capital or any other source may yield substantially different results. GEPL Capital makes no representation or warranty, express or implied, as to, and does not accept any responsibility or
liability with respect to, the fairness, accuracy, completeness or correctness of any information or opinions contained herein. Further, GEPL Capital assumes no responsibility to publicly amend, modify or revise
any forward-looking statements, on the basis of any subsequent development, information or events, or otherwise. Neither GEPL Capital nor any of its affiliates, directors, employees or agents accepts any
liability for any loss or damage arising out of the use of all or any part of this report. In no event shall GEPL capital be liable for any direct, special indirect or consequential damages, or any other damages of
any kind, including but not limited to loss of use, loss of profits, or loss of data, whether in an action in contract, tort (including but not limited to negligence), or otherwise, arising out of or in any way
connected with the use of this report or the materials contained in, or accessed through, this report.
GEPL Capital and its affiliates and/or their officers, directors and employees may have similar or an opposite positions in any securities mentioned in this document (or in any related investment) and may from
time to time add to or dispose of any such securities (or investment). The disclosures contained in the reports produced by GEPL Capital shall be strictly governed by and construed in accordance with Indian
law. GEPL Capital specifically prohibits the redistribution of this material in whole or in part without the written permission of GEPL Capital and GEPL Capital accepts no liability whatsoever for the actions of
third parties in this regard.
Top Related