


Languages
Pages
Legal


Epidemiology and Management of Stemphylium Leaf Blight on Onion
(Allium Cepa L.) in The Holland Marsh, Ontario.
By
Cyril Selasi Tayviah
A thesis
presented to
The University of Guelph
In partial fulfilment of requirements
For the degree of
Masters of Science
In
Plant Agriculture
Guelph, Ontario, Canada
©Cyril Selasi Tayviah, April, 2017

ABSTRACT
Epidemiology and management of stemphylium leaf blight on onion (Allium cepa L.)
in the Holland Marsh, Ontario.
Cyril Selasi Tayviah
University of Guelph
Advisors:
Dr. Mary Ruth McDonald
Dr. Bruce D. Gossen
Stemphylium leaf blight (SLB), caused by Stemphylium vesicarium Wallr (Simmons)
(teleomorph: Pleospora allii. (Rabenh.) Ces. & De Not), is a destructive disease of onion.
The objective of this study was to assess the epidemiology of SLB in Ontario and
evaluate management strategies. Stemphylium leaf blight first appeared at the end of June
to mid-July in 2015 and 2016, coinciding with air-borne conidia of S. vesicarium (based
on spore trapping), frequent rainfall, and air temperatures ≥ 15 °C. Onion cultivars
Pontiac, Milestone and Hendrix were slightly less susceptible to SLB compared to the
other commercial cultivars in the study. A protective application of fluopyram plus
pyrimethanil at the 3 - 4 leaf stage reduced SLB incidence, but later applications had little
impact. Aerial infrared photography demonstrated the potential to identify differences in
onion plots, but these differences were not related to SLB. Additional research is needed
to evaluate more fungicides and spray-timings for SLB management.

iii
ACKNOWLEDGEMENT
I would wish to thank God Almighty for giving me life and strength to go through
this process. I would like to thank my academic advisors Dr. McDonald, Dr. Gossen, and
Dr. Martin for guiding me throughout graduate school. All the support, patience, insight
and opportunities you provided me with has helped me strengthen my scientific research
and communication skills. Also, I would like to thank Dr. Ralph Martin, for his
encouragement and contributions as a member of advisory committee.
I appreciate the financial support provided by the Ontario Ministry of Agriculture,
Food and Rural Affairs/Univ. of Guelph Partnership, the Bradford Cooperative Storage
and the Fresh Vegetable Growers of Ontario through Growing Forward 2.
I need to thank all my lab mates who create such a good atmosphere in the lab
especially the contributions of Dr. Ahmed Abdelmagid, Dr. Fadi Al-Daoud, Jen Foster
and Amy Fang Shi. I am very grateful to Kevin Vander Kooi, Laura Riches, Shawn
Janse, Misko Mitrovic, Dennis Van Dyk and all the summer staff at the Muck Crops
Research Station for all of your help with the 2015 and 2016 field trials.
I am very grateful to my family for their continuous push in my quest to pursue
further studies. I would like to say a special thank you to my aunty Corliss Hewlett for
her belief in me and teaching me to work independently. I appreciate the tremendous
support from all the friends and people I met at here in Guelph especially the staff in the
department. A special thank you to Blake Adair for all the opportunities you gave me to
better myself. Finally, I want to say a very big thank you to my best friend and wife Nana
Adjoa for the unswaying support through all these years. God bless you.

iv
TABLE OF CONTENT
Abstract ............................................................................................................................... ii
Acknowledgement ............................................................................................................. iii
Table of content ................................................................................................................. iv
List of Tables ................................................................................................................... viii
List of Figures ..................................................................................................................... x
LITERATURE REVIEW ................................................................................................... 1
1.1 Onion......................................................................................................................... 1
1.1.1 Taxonomy and description ..................................................................................... 1
1.1.2 Origin, distribution and types ............................................................................ 2
1.1.3 Onion production ............................................................................................... 4
1.1.4 Onion cultivation ............................................................................................... 5
1.2 Foliar diseases of onion ............................................................................................ 7
1.3 Stemphylium leaf blight ............................................................................................ 8
1.3.1 Causal agent and symptoms ............................................................................... 8
1.3.2 Pathogenicity and host ....................................................................................... 9
1.3.3 Losses and distribution .................................................................................... 10
1.4 Disease cycle ........................................................................................................... 10
1.4.1 Sexual and asexual spores ................................................................................ 10
1.4.2 Inoculum dispersal and distribution ................................................................. 13
1.4.3 Sporulation and infection ................................................................................. 13
1.5 Factors influencing infection and development ...................................................... 14
1.5.1 Temperature ..................................................................................................... 14
1.5.2 Moisture ........................................................................................................... 15
1.5.3 Solar radiation and vapour pressure deficit ..................................................... 15
1.6 Management of SLB ............................................................................................... 16
1.6.1 Host resistance, biological and cultural ........................................................... 16
1.6.2 Fungicides ........................................................................................................ 17
1.6.3 Forecasting models .......................................................................................... 17
1.7 Disease detection .................................................................................................... 21
1.7.1 Visual detection ............................................................................................... 21
1.7.2 Molecular methods for detection ..................................................................... 21
1.8 Remote sensing ....................................................................................................... 22

v
1.8.1 Overview .......................................................................................................... 22
1.8.2 Disease detection with remote sensing ............................................................ 24
1.8.3 Image analysis and vegetative indices ............................................................. 25
1.8.4 Airborne platforms and unmanned aerial vehicles .......................................... 27
1.9 Summary and objective ........................................................................................... 27
CHAPTER TW0 ............................................................................................................... 31
RELATIONSHIP AMONG WEATHER VARIABLES, CONCENTRATION OF
AIRBORNE SPORES AND DEVELOPMENT OF STEMPHYLIUM LEAF BLIGHT 31
2.1 Introduction ............................................................................................................. 31
2.2 Materials and Methods ............................................................................................ 33
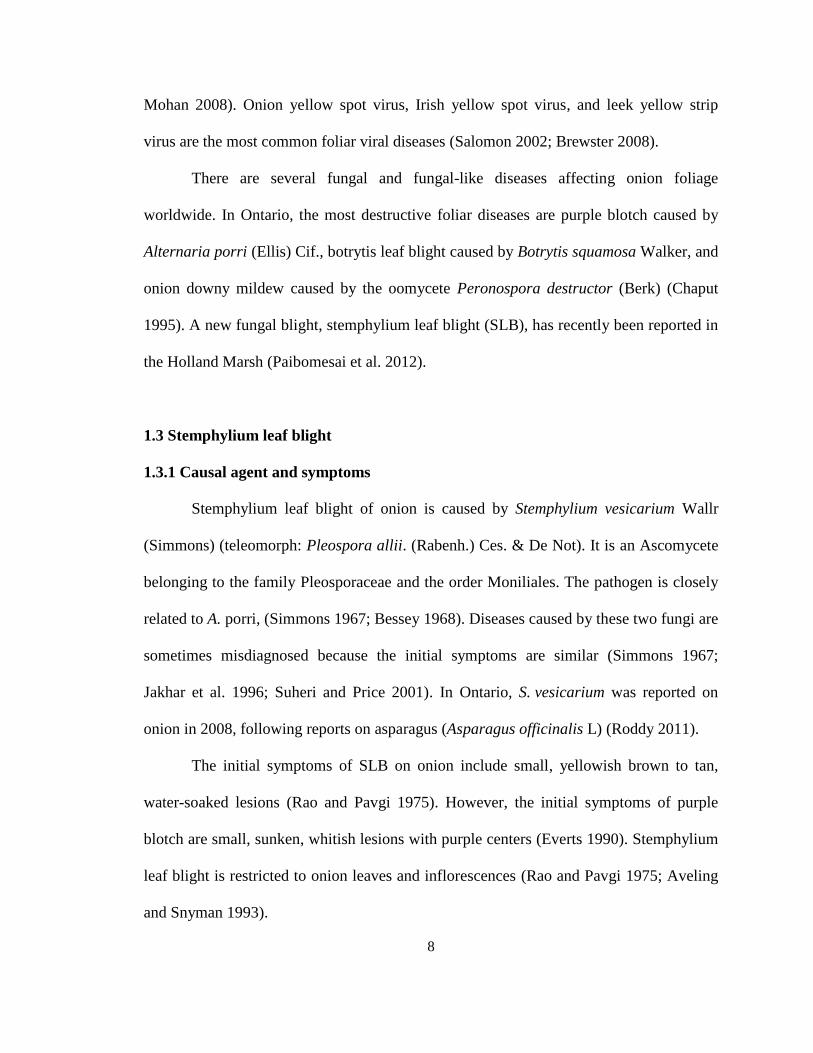
2.2.1 Trapping field................................................................................................... 33
2.2.2 Spore trapping .................................................................................................. 35
2.2.3 Weather data .................................................................................................... 37
2.2.4 Disease assessment .......................................................................................... 38
2.2.5 Overwintering .................................................................................................. 39
2.2.6 Data analysis .................................................................................................... 40
2.3 Results ..................................................................................................................... 41
2.3.1 Daily airborne spore concentration .................................................................. 41
2.3.2 Seasonal pattern of airborne spores ................................................................. 42
2.3.3 Weather variables and airborne spore concentration ....................................... 46
2.3.4 Disease assessment .......................................................................................... 59
2.3.4 Overwintering .................................................................................................. 62
2.4 Discussion ............................................................................................................... 62
CHAPTER THREE .......................................................................................................... 69
SUSCEPTIBILTY OF ONION CULTIVARS TO ISOLATES OF STEMPHYLIUM
VESICARIUM .................................................................................................................. 69
3.1 Introduction ............................................................................................................. 69
3.2 Materials and Methods ............................................................................................ 71
3.2.1 Plant material and experimental design ........................................................... 71
3.2.2 Molecular confirmation ................................................................................... 75
3.2.3 Pathogenicity test and inoculation ................................................................... 76
3.2.4 SLB assessment and yield ................................................................................ 77
3.2.5 Data analysis .................................................................................................... 79

vi
3.3 Results ..................................................................................................................... 80
3.3.1 Identification, sporulation and pathogenicity .................................................. 80
3.3.2 SLB assessment ............................................................................................... 82
3.3.3 Yield ................................................................................................................. 88
4.4 Discussion ............................................................................................................... 91
CHAPTER Four ................................................................................................................ 96
COMPARISON OF SPRAY TIMING PROGRAMS FOR MANAGEMENT OF
STEMPHYLIUM LEAF BLIGHT OF ONION ............................................................... 96
4.1 Introduction ............................................................................................................. 96
4.2 Materials and Methods ............................................................................................ 99
4.2.1 Plant material and plot layout .......................................................................... 99
4.2.2 Experimental design and treatments .............................................................. 100
4.2.3 Weather data .................................................................................................. 102
4.2.4 SLB assessment ............................................................................................. 102
4.2.5 Yield assessment ............................................................................................ 103
4.2.6 Data analysis .................................................................................................. 104
4.3 Results ................................................................................................................... 104
4.3.1 Weather assessment ....................................................................................... 104
4.3.2 SLB assessment ............................................................................................. 105
4.3.3 Fungicide Applications .................................................................................. 107
4.3.4 Yield ............................................................................................................... 108
4.4 Discussion ............................................................................................................. 109
CHAPTER FIVE ............................................................................................................ 114
DETECTION OF STEMPHYLIUM LEAF BLIGHT ON ONION USING AERIAL
PHOTOGRAPHY ........................................................................................................... 114
5.1 Introduction ........................................................................................................... 114
5.2 Materials and Method ........................................................................................... 117
5.2.1 Aerial imaging ............................................................................................... 117
5.2.2 Regions of interest ......................................................................................... 118
5.2.3 Data collection ............................................................................................... 121
5.2.4 Image analysis and vegetative indices ........................................................... 122
5.2.5 Statistical analysis .......................................................................................... 123
5.3 Results ................................................................................................................... 124

vii
5.3.1 Image analysis ................................................................................................ 124
5.3.2 Disease and vegetative indices ........................................................................... 125
5.4 Discussion ............................................................................................................. 132
CHAPTER SIX ............................................................................................................... 136
GENERAL DISCUSSION ............................................................................................. 136
Literature Cited ............................................................................................................... 143
Appendix 1: Supplementary Tables for Chapter Two .................................................... 164
Appendix 2: Supplementary Tables for Chapter THREE............................................... 193
Appendix 3: Supplementary Tables for Chapter Four .................................................... 225
Appendix 4: Supplementary Tables for Chapter Five .................................................... 237

viii
LIST OF TABLES
Table 1.1 Acreage of onion production in Canada, by province, in 2012 (Statistics
Canada, 2013) ............................................................................................................. 5 Table 1.2 Relationship between temperature and leaf wetness used in calculating DSV in
TOMCAST (from Madden, 1978) ............................................................................ 19 Table 1.3 The regions of the reflectance spectrum used in calculating vegetative indices
(Hatfield and Prueger 2010) ...................................................................................... 26
Table 2.1 Weather variables assessed and tested for correlation with conidia and
ascospores of Stemphylium vesicarium recorded in onion at the Holland Marsh, ON.
................................................................................................................................... 41
Table 2.2 Percentage of airborne ascospores and conidia captured at 2-hr intervals each
day during the growing season in onion plots at the Holland Marsh, ON in 2015 and
2016. .......................................................................................................................... 43 Table 2.3 Weather conditions recorded during the period when airborne spores were
trapped, cumulative number of days with favourable weather conditions for
stemphylium leaf blight on onion in the Holland Marsh, ON in 2015 and 2016...... 48 Table 2.4 Spearman's correlation coefficients between weather variables and daily
airborne spore captured from onion plots in the Holland Marsh, ON. ..................... 49 Table 2.5 Stepwise regressions of the daily concentration of conidia versus weather
parameters at the Holland Marsh, ON in 2015 and 2016.......................................... 55 Table 2.6 Stepwise regression of the daily concentration of ascospores versus weather
parameters at the Holland Marsh, ON in 2015 and 2016.......................................... 57
Table 2.7 Influence of weather variables on accumulated numbers of airborne spores and
stemphylium leaf blight levels on onion at the Holland Marsh, Ontario in 2015 and
2016. .......................................................................................................................... 61
Table 3.1 Onion cultivars screened for disease reaction to Stemphylium vesicarium in
growth room studies and field trials at the Holland Marsh, ON. .............................. 71 Table 3.2 Source of the isolates of Stemphylium vesicarium screened for pathogenicity
and aggressiveness on onion under controlled conditions. ....................................... 72 Table 3.3 Lesions per leaf and leaf dieback (%) assessed on onion inoculated with five
isolates of Stemphylium vesicarium under controlled conditions. ........................... 82
Table 3.4 Lesions per leaf and leaf dieback (%) assessed on onion cultivars inoculated
with Stemphylium vesicarium under controlled conditions. ..................................... 84
Table 3.5 Marketable yield and bulb size distribution of onion cultivars evaluated for
stemphylium leaf blight at the MCRS, Holland Marsh, ON, 2015 ........................... 90
Table 4. 1 Fungicide spray-timing programs tested for management of stemphylium leaf
blight on onion cv. La Salle grown at MCRS, Holland Marsh, ON in 2015 and 2016.
................................................................................................................................. 101 Table 4.2 Monthly weather variables recorded during the onion production season at the
Holland Marsh, ON in 2015 and 2016. ................................................................... 105

ix
Table 4.3 Lesion counts, overall incidence and overall severity of SLB on onion sprayed
following selected spray-timing programs at the Holland Marsh, ON in 2015 and
2016. ........................................................................................................................ 106 Table 4.4 Application dates, number of applications and cost of fungicide based on spray
timing treatments to manage SLB on onion in the Holland Marsh, ON in 2015 and
2016 ......................................................................................................................... 108 Table 4.5 Marketable yield and bulb size distribution of onion cv. La Salle following
selected spray-timing programs at the Holland Marsh, ON in 2015 and 2016. ...... 109
Table 5. 1 Fungicide spray-timing programs evaluated on onion cv. La Salle in the spray
timing trials at Holland Marsh, ON in 2015 and 2016............................................ 121 Table 5. 2 Vegetative indices calculated from aerial images of onion trials at the Holland
Marsh, ON in 2015 and 2016. ................................................................................. 123 Table 5.3 Stemphylium leaf blight incidence, severity and vegetative indices calculated
for onion cultivars screened for the susceptibility to SLB at the MCRS, Holland
Marsh, ON, 2015. .................................................................................................... 127
Table 5.4 Stemphylium leaf blight incidence, leaf dieback, and vegetative indices
measured on onions in a trial sprayed following selected fungicide application
programs at the MCRS, Holland Marsh, 2015. ...................................................... 130
Table 5.5 Stemphylium leaf blight incidence, leaf dieback, and vegetative indices
measured on onions in a trial sprayed following selected fungicide application
programs at the MCRS, Holland Marsh, 2015. ...................................................... 131

x
LIST OF FIGURES
Figure 1.1 Onion development cycle (from Lee et al. 2013). ............................................. 2 Figure 1.2 Stages of vegetative growth of Allium crops (Rey et al. 1974) ........................ 6 Figure 1.3 Stemphylium vesicarium (teleomorph: Pleospora allii): (A) Conidiophores and
natural conidia; (B) Conidia from culture; (C) Ascus and ascospore from culture
(Simmons 1969) ........................................................................................................ 12 Figure 1.4 Chart for determining daily infection values (DINFV) based on duration and
mean hourly temperature of the leaf wetness period in BOTCAST (Sutton et al.
1986) ......................................................................................................................... 20
Figure 1.5 Field spectral reflectance. Curve H: the average spectra of healthy tomato
plants. Curve 1: the average spectra of infected plants at stage 1 and curves 2, 3 and
4: at stages 2, 3 and 4, respectively. Curve S: the average spectra of the soil. ( Zhang
et al. 2003) ................................................................................................................ 23
Figure 2.1 Aerial view of the spore trap plot planted at the MCRS in 2016, and (B)
Burkard 7-day volumetric sampler used to sample air-borne spores at the site. ...... 35 Figure 2.2 Burkard 7-day volumetric spore sampler clock head mounted with prepared
drum for monitoring of airborne spore in the Holland Marsh, 2016. ....................... 37
Figure 2.3 Seasonal patterns of conidial capture and first observation of stemphylium leaf
blight symptoms (incidence) on onion at the Holland Marsh, ON in 2015 and 2016.
................................................................................................................................... 44 Figure 2.4 Seasonal pattern of ascospore capture and the first observation of stemphylium
leaf blight symptoms (incidence) on onion at the Holland Marsh, ON in 2015 and
2016. .......................................................................................................................... 45
Figure 2.5 Seasonal distribution of airborne ascospores and conidia in relation to daily
rainfall recorded in an onion plot at the Holland Marsh, ON, 2015. ........................ 50 Figure 2.6 Seasonal distribution of airborne ascospores and conidia of S. vesicarium in
relation to total daily rainfall recorded in onion plots grown in the Holland Marsh,
ON, 2016. .................................................................................................................. 51
Figure 2.7 Seasonal distribution of airborne ascospores and conidia of S. vesicarium in
relation to average daily temperature recorded in onion plots grown in the Holland
Marsh, ON, 2015. ...................................................................................................... 52 Figure 2.8 Seasonal distribution of airborne ascospores and conidia of S. vesicarium in
relation to average daily temperature recorded in onion plots grown in the Holland
Marsh, Ontario, 2016. ............................................................................................... 53
Figure 2.9 Regression (± 95% confidence interval) for daily conidia concentration versus
number of days with (A) average temperature exceeding 15 °C in an onion plot in
2015 (R2
= 0.22, P < 0.0001) and (B) number of days with leaf wetness duration
exceeding 6 h (R2
= 0.26, P < 0.0001) in onion plots at the Holland Marsh, ON in
2016. .......................................................................................................................... 56 Figure 2.10 Regression (+ 95% confidence interval) of daily ascospore concentration
versus (A) rainfall in the 10 days prior to capture in 2015 (R2
= 0.11, P = 0.02) and
xi
(B) daily leaf wetness duration in 2016 (R2 = 0.11, P = 0.02) in the Holland Marsh,
ON. ............................................................................................................................ 58 Figure 2.11 Onion cv. La Salle showing (A) a young lesion, and (B) leaf dieback and
sporulation after infection with stemphylium leaf blight at the Holland Marsh, 2015
................................................................................................................................... 60
Figure 3.1 Cultures of the five isolates of Stemphylium vesicarium screened for
pathogenicity and aggressiveness on onion in a growth room study. ....................... 73 Figure 3.2 Conidia of the five Stemphylium vesicarium isolates assessed in a growth room
study of pathogenicity and aggressiveness on onion. ............................................... 81
Figure 3.3 Image of gel of the reaction of PCR products with a DNA probe from different
isolates of Stemphylium vesicarium (OO55, OO54, OO27, OO31, NO35 and OA45).
................................................................................................................................... 81 Figure 3.4 Mean incidence (final assessment) of stemphylium leaf blight on onion
cultivars at the Holland Marsh, ON in 2015 and 2016. ............................................ 85 Figure 3.5 Lesions per leaf on onion cultivars screened for susceptibility to stemphylium
leaf blight at the MCRS, Holland Marsh, ON in 2015 and 2016. ............................. 86 Figure 3.6 Leaf dieback on onion cultivars caused by stemphylium leaf blight at the
MCRS, Holland Marsh, ON in 2015 and 2016. ........................................................ 87
Figure 3.7 (A) Herbicide caused by spray-drift of flumioxazin herbicide and (B) the
initial infection and sporulation of Stemphylium vesicarium on herbicide injured
onion leaves in the Holland Marsh, ON, 2015. ......................................................... 88
Figure 5. 1 A modified Cine Star – 8 MK Heavy Lift RTF octocopter mounted with a
camera for aerial image collection at the Holland Marsh, ON. 2015 ..................... 118
Figure 5. 2 Study area for (A) the onion cultivar trial and (B) fungicide spray-timing trial
in the Holland Marsh, ON in 2015 .......................................................................... 120 Figure 5. 3 Aerial near-infrared image of onion plots taken on 13 July at (A) 15 20 m and
(B) 25 30 m above ground at the MCRS, Holland Marsh, ON, 2015. ................... 124 Figure 5. 4 Aerial infrared image of onion trials taken on 4 August with a Xnite-Canon
SX230NDVI camera with the red-filter replaced (A) and blue-filter with a near-
infrared filter at the MCRS, Holland Marsh, 2016. ................................................ 132

1
CHAPTER ONE
LITERATURE REVIEW
1.1 Onion
1.1.1 Taxonomy and description
Onions (Allium cepa L.) are monocots in the sub-family Alliodaea (Alliceae) and
family Amarallidaceae (Angiosperm Phenology Group III. 2003; Chase et al. 2009).
Onions are biennials but are often cultivated as annuals grown for bulbs. The Alliodaea
sub-family contains about 780 cultivated species (Fritsch and Friesen 2002). Other
commonly cultivated crops in this sub-family are garlic (A. sativum), Welsh onion
(A. fistulosum), leeks (A. ampeloprasum), chives (A. schoenoprasum), and Chinese chives
(A. tuberosum) (Brewster 2008).
The shoot portion of the onion consists of photosynthetic leaf blades with non-
photosynthetic leaf bases (scales). The leaf blades grow alternately in a flattened, fan-
shaped band. They are fleshy, hollow, cylindrical and flat on one side (Fritsch and
Friesen 2002). The crop accumulates and stores food as it approaches maturity by
forming several bladeless scales at the base of the plant (Heath and Hollies 1965; Fritsch
and Friesen 2002). These scales swell up to form the bulb. At maturity the bulb size can
range from 5–100 mm in size (Lancaster et al. 1996).
Onion bulbs overwinter if not harvested at the end of the first season. The crop
develops a new shoot system consisting of a scape and inflorescence in the spring after a
cold winter through vernalisation (Fig. 1.1) (Brewster 2008; Lee et al. 2013). The
inflorescence is a round umbel with many white flowers. These flowers are insect

2
pollinated and each flower develops a single black seed (Pathak et al. 2001; Brewster
2008).
Figure 1.1 Onion development cycle (from Lee et al. 2013).
1.1.2 Origin, distribution and types
The origin of onions remains an enigma, but they are believed to have originated
from Central Asia (Vavilov 1951). However, the highest onion diversity is observed in
the eastern Mediterranean region and through Afghanistan, Tajikstan, Pakistan and India
(Brewster 2008; Kik 2008). The crop is cultivated worldwide on a range of soils and
climatic conditions. There are several groupings of onion based on variation in bulb

3
characteristics, response to photoperiod length, and storage qualities (Lancaster et al.
1996; Rabinowitch and Currah 2002).
Horticulturally, onions are grouped into two categories: the bulb group (A. cepa
var cepa) and the aggregate group (A. cepa var aggregatum). The bulb group, also
referred to as the common onion, produces one bulb per plant, whereas the plants in the
aggregate group produce a bunch or cluster of small bulbs. The bulb group is usually
commercially propagated from seed and the aggregate group is propagated vegetatively
(Hanelt 1990; Rabinowitch and Currah 2002). Shallots (A. cepa var aggregatum) are the
most common of the aggregate group (Brewster 2008).
Cultivation and distribution of onion is influenced by photoperiod length, light
quality and light interception (Garner and Allard 1920; Bertaud 1986; Brewster 2008).
Long-day (LD) cultivars require ≥ 16 h photoperiod to form bulbs, whereas intermediate-
day (ID) cultivars bulb at photoperiods between 14–16 h and short day (SD) cultivars
require a maximum of a 12 h photoperiod to form bulbs (Rabinowitch and Currah 2002;
Brewster 2008).
Onion bulb formation at a particular photoperiod is influenced by temperature
(Fritsch and Friesen 2002). Long-day and ID cultivars are suitable for cultivation in the
temperate and semi-arid regions of the world, and SD cultivars are most suitable for
warm tropical and sub-tropical climates (Uzo and Currah 1990; Brewster 2008). Long-
day cultivars grown under SD conditions will not bulb and SD cultivars grown under LD
conditions start to bulb upon emergence.

4
1.1.3 Onion production
Onions are the second most cultivated vegetable crop worldwide after tomatoes
(FAOSTATS 2015). In 2012, the area of onion cultivated worldwide was approximately
4.3 million hectares in over 170 countries, generating $4.0 billion in revenue. China,
India, and the USA are the three highest onion producers. These countries produce more
than 50% of the world’s onions (FAOSTATS 2015). The average yield is 17 tonnes per
hectare. However, Canada, South Korea, Japan and USA have the highest yield per
hectare at 40 - 60 t/ha (YARA 2015; Mailvaganam 2016).
Onions are produced and supplied all year round worldwide due to diverse
growing conditions and improved long-term storage options. The Netherlands generates
approximately $504 million from onion exports, making it the largest onion exporter
worldwide. Canada is the eleventh highest exporter of onion globally, exporting $4.2
million, and is the fastest growing exporter (FAOSTATS 2015; Workman 2016).
Onion is a major vegetable consumed in multi-cultural Canada with a
consumption of 8.5 kg per person per year. Annually, onion is cultivated on 4740 ha in
Canada. This production yields approximately 200,000 mt per year with a farm gate
value of $74 million (Agriculture and Agri-food Canada 2014). Ontario is the highest
onion producing province (Table 1.1). In Ontario, 2460 ha of onion is cultivated with an
annual farm gate value of $34 million (Agriculture and Agri-food Canada 2014;
Mailvaganam 2016). The majority of this production is on muck soil at the Holland
Marsh (44o5’N and 79
o35’W) in the York Region of the province.

5
Table 1.1 Acreage of onion production in Canada, by province, in 2012 (Statistics
Canada, 2013)
Province Area cultivated (ha)
Ontario 2460
Quebec 1938
Nova Scotia 253
Manitoba 209
British Columbia 101
Total 5436
1.1.4 Onion cultivation
In Canada, the main types of onion produced are white, red and yellow globe
onions. In Ontario, the majority of onions cultivated are the yellow globe cultivars (Valk
1988). The common commercial hybrids mature 85–115 days after seeding (McDonald et
al. 2015). Onion plants progress through 10 vegetative development stages, similar to
other Allium crops, from seeding to harvest (Fig 1.2) (Rey et al. 1974).

6
Figure 1.2 Stages of vegetative growth of Allium crops (Rey et al. 1974)
7
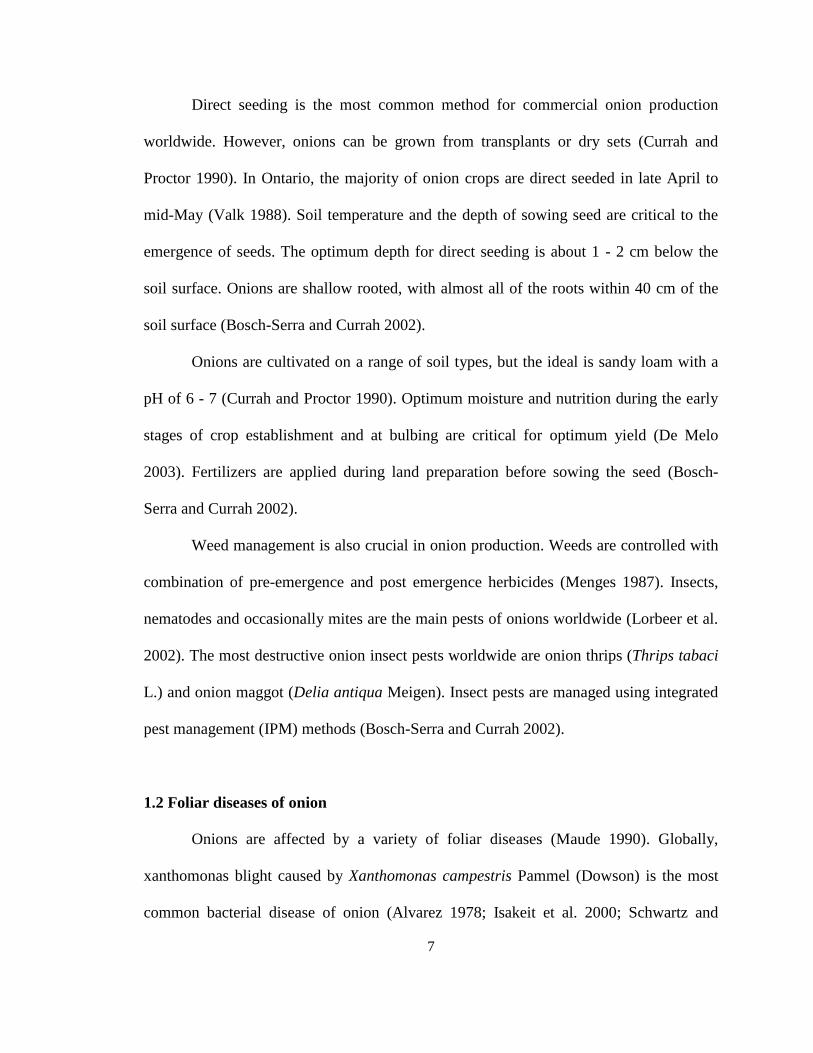
Direct seeding is the most common method for commercial onion production
worldwide. However, onions can be grown from transplants or dry sets (Currah and
Proctor 1990). In Ontario, the majority of onion crops are direct seeded in late April to
mid-May (Valk 1988). Soil temperature and the depth of sowing seed are critical to the
emergence of seeds. The optimum depth for direct seeding is about 1 - 2 cm below the
soil surface. Onions are shallow rooted, with almost all of the roots within 40 cm of the
soil surface (Bosch-Serra and Currah 2002).
Onions are cultivated on a range of soil types, but the ideal is sandy loam with a
pH of 6 - 7 (Currah and Proctor 1990). Optimum moisture and nutrition during the early
stages of crop establishment and at bulbing are critical for optimum yield (De Melo
2003). Fertilizers are applied during land preparation before sowing the seed (Bosch-
Serra and Currah 2002).
Weed management is also crucial in onion production. Weeds are controlled with
combination of pre-emergence and post emergence herbicides (Menges 1987). Insects,
nematodes and occasionally mites are the main pests of onions worldwide (Lorbeer et al.
2002). The most destructive onion insect pests worldwide are onion thrips (Thrips tabaci
L.) and onion maggot (Delia antiqua Meigen). Insect pests are managed using integrated
pest management (IPM) methods (Bosch-Serra and Currah 2002).
1.2 Foliar diseases of onion
Onions are affected by a variety of foliar diseases (Maude 1990). Globally,
xanthomonas blight caused by Xanthomonas campestris Pammel (Dowson) is the most
common bacterial disease of onion (Alvarez 1978; Isakeit et al. 2000; Schwartz and
8
Mohan 2008). Onion yellow spot virus, Irish yellow spot virus, and leek yellow strip
virus are the most common foliar viral diseases (Salomon 2002; Brewster 2008).
There are several fungal and fungal-like diseases affecting onion foliage
worldwide. In Ontario, the most destructive foliar diseases are purple blotch caused by
Alternaria porri (Ellis) Cif., botrytis leaf blight caused by Botrytis squamosa Walker, and
onion downy mildew caused by the oomycete Peronospora destructor (Berk) (Chaput
1995). A new fungal blight, stemphylium leaf blight (SLB), has recently been reported in
the Holland Marsh (Paibomesai et al. 2012).
1.3 Stemphylium leaf blight
1.3.1 Causal agent and symptoms
Stemphylium leaf blight of onion is caused by Stemphylium vesicarium Wallr
(Simmons) (teleomorph: Pleospora allii. (Rabenh.) Ces. & De Not). It is an Ascomycete
belonging to the family Pleosporaceae and the order Moniliales. The pathogen is closely
related to A. porri, (Simmons 1967; Bessey 1968). Diseases caused by these two fungi are
sometimes misdiagnosed because the initial symptoms are similar (Simmons 1967;
Jakhar et al. 1996; Suheri and Price 2001). In Ontario, S. vesicarium was reported on
onion in 2008, following reports on asparagus (Asparagus officinalis L) (Roddy 2011).
The initial symptoms of SLB on onion include small, yellowish brown to tan,
water-soaked lesions (Rao and Pavgi 1975). However, the initial symptoms of purple
blotch are small, sunken, whitish lesions with purple centers (Everts 1990). Stemphylium
leaf blight is restricted to onion leaves and inflorescences (Rao and Pavgi 1975; Aveling
and Snyman 1993).

9
In the Holland Marsh, SLB is first observed when the onion crop is at the 3- to 4-
leaf stage, reaching maximum severity when leaves begin to senescence. As SLB
progresses, extensive necrosis of infected leaves develop back from the tip. This necrosis
is associated with host-specific toxins produced by S. vesicarium after infection (Singh et
al. 2000; Wolpert et al. 2002). The disease results in desiccation and premature lodging
of onion, which can lead to a severe reduction in bulb size. Severely infected plants
produce small bulbs that are unmarketable or sold at a discount (Rao and Pavgi 1975;
Miller et al. 1978; Lorbeer 1993).
1.3.2 Pathogenicity and host
Stemphylium vesicarium has been detected on a wide range of crops as both a
pathogen and saprophyte. In addition to onion, S. vesicarium is pathogenic on garlic
(Basallote 1993), leek (Suheri and Price 2001), Welsh onion (Misawa and Yasuoka
2012), asparagus (Falloon 1987), and European pear (Pyrus communis L.) (Llorente and
Montesinos 2006). Also, in addition to known hosts, the pathogen can cause
asymptomatic infections and develop as endophytes in the living tissues of various plants
(Köhl et al. 2009b; Misawa and Yasuoka 2012).
Host-specific toxins are involved in the pathogenicity and aggressiveness of
isolates (Singh et al. 1999; Wolpert et al. 2002). Isolates that are pathogenic on European
pear cultivars produce two toxins, SV-toxin I and SV-toxin II (Singh et al. 1999) that are
not pathogenic to asparagus or onion (Pattori et al. 2006; Köhl et al. 2009a). The toxicity
and concentration of the toxins is correlated with SLB severity (Singh et al. 1999, 2000).
Isolates of S. vesicarium from asparagus, onion, and garlic were reported to be

10
pathogenic to all three crops (Basallote-Ureba et al. 1999). Isolates from parsley were
pathogenic to members of the Apiaceae family but not to Allium crops (Koike et al.
2013).
1.3.3 Losses and distribution
Stemphylium leaf blight is an important disease of onion in both tropical and
temperate countries (FAO/IPGRI 1997). The disease caused 90% yield losses on onion in
Texas and New York State in 1978 (Miller et al. 1978; Lorbeer 1993), 80 85% yield loss
in Portugal (Tomaz and Lima 1988), and large losses in Egypt (Hassan et al. 2007), India
(Rao and Pavgi 1975), Japan (Misawa and Yasuoka 2012), New Zealand (Suheri and
Price 2001), South Africa (Aveling 1992) and Spain (Basallote 1993). On asparagus, it
can result in 100% loss of spears (Falloon 1987; Hausbeck 2009). Brown spot disease on
pear, caused by S. vesicarium, resulted in 60 - 90% loss of yield (Montesinos and
Vilardell 1992; Montesinos et al. 1995b; Llorente and Montesinos 2002).
1.4 Disease cycle
1.4.1 Sexual and asexual spores
The disease cycle of SLB is characterised by sexual and asexual phases (Prados-
Ligero et al. 1998; Basallote-Ureba et al. 1999). In the sexual phase, pseudothecia
develop on both diseased and symptomless tissues of host and non-host plants (Rossi et
al. 2008; Misawa and Yasuoka 2012). On onion, however, pseudothecia development is
restricted to the inflorescence (Rao and Pavgi 1975). The development of pseudothecia in
temperate regions occurs in the winter at temperatures between 5 - 15 °C and high

11
relative humidity (Prados-Ligero et al. 2003; Llorente and Montesinos 2004). At these
low temperatures, ascospores maturation takes 1 - 6 months (Simmons 1969; Prados-
Ligero et al. 1998). The pseudothecia are black and bear several cylindrical asci (Fig 1.3)
(Simmons 1969). Pseudothecia release ascospores in the spring, coinciding with rainfall
events.
Ascospores are yellowish brown and ellipsoidal, with the upper half narrowly
tapered (Fig 1.3). Matured ascospores have 5 - 7 complete transverse septa and zero to
several incomplete longitudinal septa. The average size of a mature ascospore is about 18
× 38 µm. Ascospores of P. allii are indistinguishable from ascospores of P. herbarum
(Fries) Rabenhorst (anamorph: S. botryosum Wallroth), but the asci of P. herbanum are
smaller (Simmons 1969, 1985). Ascospores can infect onion plants under laboratory
conditions (Prados-Ligero et al. 1998), but their role in the epidemiology of SLB is
unclear.
In Allium crops, primary infection in the field is associated with asexual conidia
(Prados-Ligero et al. 2003; Misawa and Yasuoka 2012). Conidia are olive-brown, oval to
ovoid, and are borne on conidiophores that are pale to brown with dark edges and bands.
The conidia have 1 - 5 transverse septa and are constricted at 1 - 3 transverse septa. The
conidia also have 1 - 2 complete longitudinal septa (Fig. 1.3) (Simmons 1969; Ellis
1971). Conidia of S. vesicarium are twice as long as wide (mean 18 × 34 µm), whereas
those of S. botryosum have roughly equal length and width (25 × 28 µm, (Simmons
1969).
Molecular procedures can be used to accurately identify Stemphylium species,
based on specific primers in polymerase chain reaction (PCR) of the internal transcribe

12
spacer (ITS) region or DNA sequencing of the glyceraldehyde-3-phosphate
dehydrogenase (gpd)gene sequence (Câmara et al. 2002; Köhl et al. 2009b).
Figure 1.3 Stemphylium vesicarium (teleomorph: Pleospora allii): (A) Conidiophores
and natural conidia; (B) Conidia from culture; (C) Ascus and ascospore from culture
(Simmons 1969)

13
1.4.2 Inoculum dispersal and distribution
Information on inoculum availability and distribution for SLB on onion is not
available. In pear and garlic crops in Spain (Prados-Ligero et al. 2003; Rossi et al. 2008),
Welsh onion in Japan (Misawa and Yasuoka 2012) and asparagus in Michigan, USA
(Granke and Hausbeck 2010), both ascospores and conidia are present during the
cropping season. Ascospores are captured in the early part of the cropping season and
conidia are captured later, during disease development.
In Allium crops, there was a time lag between when ascospores are first detected
and first incidence of SLB (Prados-Ligero et al. 2003; Misawa and Yasuoka 2012). In
pear orchards, it is postulated that ascospores colonise plant debris on the orchard floor
and produce abundant conidia, which then infection pear (Llorente and Montesinos,
2006; Rossi et al. 2008; Rossi et al. 2005). In asparagus, both ascospores and conidia
infect spears in the field (Granke and Hausbeck 2010).
Both ascospores and conidia are air-borne. The daily release and volume of
ascospores and conidia are influenced by precipitation, temperature, relative humidity,
vapour pressure deficit, wind speed, and solar radiation (Granke and Hausbeck 2010;
Misawa and Yasuoka 2012; Prados-Ligero et al. 2003; Rossi et al. 2005). Daily release of
airborne ascospores and conidia show a diurnal pattern, as with many other Ascomycetes
(Meredith 1966; Prados-Ligero et al. 2003).
1.4.3 Sporulation and infection
Stemphylium vesicarium sporulates on onion, garlic and asparagus, producing
abundant conidia (Falloon 1987; Basallote-Ureba et al. 1999; Suheri and Price 2000,

14
2001). Sporulation usually occurs at the site of initial lesions. On onion and garlic leaves,
sporulation is observed 6 days after the development of initial lesions (Basallote-Ureba et
al. 1999).
Stemphylium species infect their host mainly through stomata openings and
wounds (Bradley et al. 2003). Older onion leaves are more susceptible to infection than
young leaves. Germination of conidia on onion leaves occurs at 4–35 °C (Srivastava et al.
1996; Suheri and Price 2000). The optimal conditions for conidial infection are
temperatures > 18 °C, leaf wetness duration > 6 h, and high relative humidity (Shishkoff
and Lorbeer 1989; Suheri and Price 2000; Prados-Ligero et al. 2003).
The pathogen starts producing host-specific toxins immediately after infection.
These toxins increase the severity of infection by inducing electrolyte losses from host
tissues, causing ultra-structural changes in cells that lead to extensive veinal necrosis
(Singh et al. 1999, 2000). Typical symptoms of leaf spot and apical necrosis on onion and
garlic occur 6–14 days after inoculation (Shishkoff and Lorbeer 1989; Basallote-Ureba et
al. 1999; Suheri and Price 2000; Misawa and Yasuoka 2012).
1.5 Factors influencing infection and development
1.5.1 Temperature
Temperature is a critical factor in overwintering of S. vesicarium, release of air-
borne spores, and infection of Allium crops (Shishkoff and Lorbeer 1989; Basallote-
Ureba et al. 1999). The optimum temperature for development and maturation of
pseudothecia on garlic and pear debris in Spain in winter is 5–15 °C (Prados-Ligero et al.
1998; Llorente and Montesinos 2006). Ascospore release in garlic crops is highest at

15
cooler temperatures (10–21 °C) compared to conidia (15 - 32 °C) (Prados-Ligero et al.
2003). The optimum temperature for the development of infection on onion under
controlled conditions is 10–25 °C (Suheri and Price 2000). In Ontario, the average winter
temperatures are below 0 °C and it often snows, whereas daily mean summer
temperatures range from 10 - 27 °C (Environment Canada 2016). Information is lacking
on the temperature requirements for formation and maturation of pseudothecia on onion
residue in Ontario.
1.5.2 Moisture
Stemphylium vesicarium requires the presence of free water for infection
(Llorente and Montesinos 2002; Prados-Ligero et al. 2003). A minimum leaf wetness
period of 6 h is sufficient for infection at favourable temperatures on pear (Montesinos et
al. 1995b). Conidial germination and infection on onion occurs at favourable
temperatures with a leaf wetness period exceeding 8 h (Shishkoff and Lorbeer 1989;
Suheri and Price 2000).
1.5.3 Solar radiation and vapour pressure deficit
Solar radiation has an indirect effect on infection via the effect on available
moisture and air temperature. Vapour pressure deficit (VPD) is a measure of the
difference between the amount of moisture the air can hold at a particular temperature
and the actual amount of moisture it holds (Abtew and Melesse 2013) and is the true
measure of dryness (Anderson 1936). Conidial availability increases with solar radiation,
and the number of infections increase with VPD between 0.1 - 1.5 kPa (Prados-Ligero et

16
al. 2003; Granke and Hausbeck 2010). The highest ascospore concentrations in garlic are
captured at low VPD, between 0.1 - 0.5 kPa (Prados-Ligero et al. 2003).
1.6 Management of SLB
1.6.1 Host resistance, biological and cultural
Use of host resistance would be the most efficient way to manage SLB on Allium
crops (Pathak et al. 2001; Mishra et al. 2009). However, no strong source of resistance
has been identified in common onion. Lines of onion screened in Taiwan were all
susceptible to infection by S. vesicarium, but the degree of susceptibility differed among
cultivars (Pathak et al. 2001). Five lines of Welsh onion and seven lines of garlic
exhibited complete resistance to S. vesicarium, but transfer of that resistance into
common onion using conventional plant breeding is not possible (Pathak et al. 2001;
Mishra et al. 2009).
Biological control agents such as Bacillus subtilis, Saccharomyces cerevisiae,
Pseudomonas fluorescens and Trichoderma species reduced the severity of SLB in onion
under controlled conditions (Kamal et al. 2008). However, these products do not provide
effective management of SLB when used as the sole management strategy under field
conditions (Wright et al. 2005). In pear orchards, sanitation combined with application of
Trichoderma spp. reduced SLB incidence by 60% (Llorente et al. 2008).
Cultural methods for management of fungal diseases often aim to reduce the
primary inoculum present at the start of the growing season, and to create conditions that
are unfavourable for infection (Llorente et al. 2012). Removal of debris and general
sanitation in pear orchards reduced both initial inoculum and SLB incidence (Llorente et

17
al. 2008). Cultural strategies recommended for managing SLB on onion include
sanitation, crop rotation, reduced plant densities, and removal or burying of crop residue
(Shanmugasundaram and Kalb 2001).
1.6.2 Fungicides
Repeated calendar-based application of preventative fungicides has been
suggested as an effective way of managing SLB on onion, garlic, asparagus and pear
(Basallote et al. 1993; Meyer et al. 2000; Gupta et al. 2010; Llorente et al. 2012).
However, the pathogen has been reported to be insensitive to several fungicides
(Alberoni et al. 2010; Hoepting 2015), which indicates that this approach may not be
sustainable. In Spain, boscalid plus pyraclostrobin, iprodione (dicarboximide) and
prochloraz fungicides supressed S. vesicarium growth on garlic in vitro, but these
combinations were not assessed in the field (Gálvez et al. 2016). In Canada, fluopyram
plus pyrimethanil is registered for the suppression of SLB on onion (Bayer CropScience
Inc. Canada 2016), and ethylenebisdithiocarbamate (EBDC) fungicides are registered for
management of S. vesicarium on asparagus in the USA (Meyer et al. 2000).
1.6.3 Forecasting models
Repeated calendar-based application of fungicides can result in unnecessary
applications, e.g., when environmental factors would not support disease development or
inoculum is not present (Montesinos and Vilardell 1992; Alberoni et al. 2010; Llorente et
al. 2012). Also, unneeded applications increase the risk of development of fungicide
insensitivity within pathogen populations (Alberoni et al. 2010). It is essential, therefore,

18
to understand the dynamics of SLB development and conditions that are conducive for
disease increase. Forecasting models for S. vesicarium could reduce the number of
fungicide sprays required to keep disease levels below economic thresholds compared to
calendar-based application (Montesinos et al. 1995a; Meyer et al. 2000).
The epidemiology of brown spot disease of pear has been studied extensively, and
integrated management programs effectively reduce disease severity (Llorente et al.
2012). Disease forecasting models have been developed and tested for pear production in
Europe. The two initial models, STREP and FAST (Forecast System for Alternaria solani
on Tomato), were about 71% accurate in predicting SLB incidence (Montesinos and
Vilardell 1992). These have mostly been replaced by PAMCAST and brown spot of pear
forecast (BSPCAST) (Llorente et al. 2012). PAMCAST uses temperature and relative
humidity during the winter to estimate the amount of mature pseudothecia in pear
orchards at the start of the season (Llorente and Montesinos 2004). This estimate is used
in initiating cultural management and the application of biological control agents, which
reduce primary infection of pear leaves arising from colonized debris (Llorente and
Montesinos 2004; Llorente et al. 2012). The model has been used in pear orchards and
has been validated over several years. BSPCAST uses leaf wetness duration and
temperature during the wetness period to predict the risk of infection in pear orchards. It
is used to recommend the start of fungicide sprays (Montesinos et al. 1995b; Llorente et
al. 2011). The model has been studied and validated in pear orchards in Spain and Italy.
BSPCAST suppresses disease similar to calendar applications, while reducing fungicide
application by 60% (Montesinos et al. 1995b; Llorente et al. 2000b, 2011).

19
Purple spot on asparagus has been managed using TOMCAST and PASO
forecasting models (Meyer et al. 2000; Eichhorn et al. 2009). TOMCAST was developed
in Ontario to manage foliar diseases on tomato (Poysal et al. 1993). It uses leaf wetness
duration and the average temperature during the wet period to calculate disease severity
values (DSV) (Table 1.2) (Pitblado 1992a; Poysal et al. 1993). Use of the model can
reduce spray application by 60% without compromising the quality of the asparagus
spears (Meyer et al. 2000; Hausbeck 2005). PASO is used in forecasting infection risk in
asparagus in Germany. There is little information available on the details of this model,
except that it uses models of dew and rain to recommend initiation of fungicide sprays.
The model is reported to be less efficient than TOMCAST (Eichhorn et al. 2009).
Table 1.2 Relationship between temperature and leaf wetness used in calculating DSV in
TOMCAST (from Madden, 1978)
Mean temp. (°C)
Leaf wetness duration (h) required to produce DSV of
0 1 2 3 4
13–17 0–6 7–15 16–20 21+
18–20 0–3 4–8 9–15 16–22 23+
21–25 0–2 3–5 6–12 13–20 21+
26–29 0–3 4–8 9–15 16–22 23+
A critical consideration for fungicide application for management of SLB is to
apply fungicides before the conidia germinate. This is because the pathogen quickly
produces host-specific toxins that reduce the post-curative potential of fungicides
(Llorente et al. 2000a; Puig et al. 2014). The conditions required for release of

20
S. vesicarium conidia are similar those for B. squomosa (Lacy and Pontius 1983; Prados-
Ligero et al. 2003).
BOTCAST (Botrytis Forecaster) is a forecasting model that uses a relationship
between weather and B. squomosa infection to recommend spray thresholds for botrytis
leaf blight of onion (Fig. 1.4). The lower threshold (Threshold I) is called a warning
threshold and fungicides need not be applied unless rainfall is forecasted. At the higher
threshold (Threshold II), however, the risk of disease is high and the recommendation is
that fungicides be initiated promptly (Sutton et al. 1986).
Figure 1.4 Chart for determining daily infection values (DINFV) based on duration and
mean hourly temperature of the leaf wetness period in BOTCAST (Sutton et al. 1986)

21
1.7 Disease detection
1.7.1 Visual detection
The appearance of visual symptoms is the oldest and one of the most reliable
means of SLB detection. On pear fruit, S. vesicarium produces 1 - 2 mm circular, brown
necrotic lesions (Llorente and Montesinos 2006). On asparagus, leek, and garlic crops,
purple water-soaked lesions develop (Falloon 1987; Basallote 1993; Suheri and Price
2000). Welsh onion leaf blight and SLB on onion are characterized by yellowish brown
to tan water-soaked lesions (Basallote-Ureba et al. 1999; Misawa and Yasuoka 2012).
The disadvantage of visual detection is that it is highly subjective (Bock et al. 2010).
Also, this method is ineffective when the disease has a latent period after infection
(Martinelli et al. 2014).
1.7.2 Molecular methods for detection
Molecular methods provide greater objectivity in the detection of disease
(Martinelli et al. 2014). The presence of S. vesicarium on pear was detected using
molecular techniques such as polymerase chain reaction (PCR) and enzyme-linked
immunosorbent assay (ELISA) (Köhl et al. 2009a, 2009b). Molecular techniques are
sensitive, accurate, and effective for confirming visual assessments. However, molecular
methods can be a difficult to use in the field to detect disease before the appearance of
symptoms (Martinelli et al. 2014) because they require detailed sampling procedures,
expensive infrastructure, and can misrepresent the level of spread of infections.
Furthermore, these methods are destructive and can only be used practically on small
number of plants (Sankaran et al. 2010; Martinelli et al. 2014).

22
1.8 Remote sensing
1.8.1 Overview
Early detection of diseases caused by S. vesicarium is important to reduce disease
spread and damage to crops (Llorente et al. 2012; Yang et al. 2013). Advancements in
technology such as remote sensing to monitor crop characteristics have been used to
detect disease stress. Remote sensing is a relatively new approach to disease detection,
but it has the potential to detect diseases more quickly and with higher accuracy and
precision using spectral changes in crop canopy (West et al. 2003; Sankaran et al. 2010).
Remote sensing is being used as an indirect method of collecting data on
vegetation without physical contact, by measuring the electromagnetic energy reflected
or emitted for a particular tissue (Jensen 2000; De Jong and van der Meer 2006). Remote
sensing potentially provides a non-destructive means of plant disease detection,
identification and quantification (Mahlein et al. 2012). For example, it was used in
assessing the relationship between disease severity and the spectral reflectance of tomato
(Lycopersicon esculentum Mill.) (Fig. 1.5) (Zhang et al. 2003).

23
Figure 1.5 Field spectral reflectance. Curve H: the average spectra of healthy tomato
plants. Curve 1: the average spectra of infected plants at stage 1 and curves 2, 3 and 4: at
stages 2, 3 and 4, respectively. Curve S: the average spectra of the soil. ( Zhang et al.
2003)
Plants that are being attacked by plant pathogens activate complex molecular
defense mechanisms (Rejeb et al. 2014). This leads to changes in physiological functions
such as a reduction in photosynthesis. These changes influence the absorption and
reflectance of portions of the electromagnetic spectrum (West et al. 2003; Bravo et al.
2004). Also these changes induce changes in variables such as leaf area index,
chlorophyll content and surface temperature of the foliage (Delalieux et al. 2009).
Remote sensing with the appropriate sensors has the potential to collect data on these

24
changes, which can be used to produce spectral signatures that differentiate between
healthy and disease plants even before development of symptoms (Meroni et al. 2010).
The high cost of spectra data collection equipment (hyperspectral sensors,
cameras, etc.) is an important challenge to the use of remote sensing as a disease
detection method. Another limitation is that remote sensing requires specialized
experience with data collection and analysis. Most of the current protocols available are
not applicable to all crops, and most of them are concentrated on field crops with little
attention to horticultural crops and diseases detection (Moshou et al. 2004; Sankaran et
al. 2010; Martinelli et al. 2014).
1.8.2 Disease detection with remote sensing
Remote sensing methods for plant disease detection are grouped into imaging and
non-imaging sensor-based methods. The imaging sensor methods include the use of
visible and infrared cameras (Bock et al. 2010), multispectral (broadband) sensors,
hypersectral (narrowband) sensors (Sasaki et al. 1998; Aleixos et al. 2002; Shafri and
Hamdan 2009), thermal infrared sensors, and fluorescence imaging sensors (Delalieux et
al. 2009). The non-imaging sensor methods include the use of radiometers-
spectroradiometers and fluorescence radiometers (Wu et al. 2008; Yang et al. 2013).
These sensors are differentiated into active and passive sensors. Active sensors
emit artificial radiation and measure the energy reflected or backscattered. Radar (radio
detection and ranging) and Lidar (light detection and ranging) are the most common
active sensor remote sensing instruments (McGill 2004). Passive sensor equipment
measures the reflected solar radiation or emitted thermal radiation. Hyperspectral,

25
multispectral, and simple cameras (infrared and visible) are the most common passive
sensor equipment (Qin et al. 2009; Shafri and Hamdan 2009; Bock et al. 2010).
A measurement of the reflectance from Debney's tobacco (Nicotiana debneyi L.)
using multispectral cameras showed a reduction in reflectance after infection with tomato
mosaic tobamovirus. This reduction was attributed to an overall reduction in
photosynthesis during the early stages of infection (Polischuk et al. 1997). A similar
decrease in reflectance were observed in bailey (Acacia baileyana F. Muelle) plants
infected with powdery mildew (Lorenzen and Jensen 1991). These changes indicate a
deviation from normality such as infection and disease (Martinelli et al. 2014), but are not
explicitly indicative of disease or specific stresses (West et al. 2003; Moshou et al. 2004).
Notwithstanding,
1.8.3 Image analysis and vegetative indices
Imaging passive sensor tools measure reflected solar radiation in the visible (VIS
wavelength = 400 - 700 nm), near-infrared (NIR wavelength = 700 - 1100 nm), and
short-wave infrared (SWIR wavelength = 1100 - 2500 nm) (Sankaran et al. 2010; Garcia-
Ruiz et al. 2013) spectrum. Reflectance data needs to be processed to extract the effective
data. The biggest challenge with extracting data from images is selection of the most
appropriate processing software and techniques (Martinelli et al. 2014).
Remote sensed images for disease detection can be analysed using specific
spectral vegetative indices, which are sensitive to disease presence (Mahlein et al. 2012;
Keremane et al. 2015). Other methods of analyzing these images are i) conducting
correlation or regression analysis of the presence of disease with changes in specific band

26
wavelengths (Yang et al. 2013); ii) applying data mining algorithms to spectral data
(Zhang et al. 2003; Delalieux et al. 2009); and iii) using machine learning and
classification techniques to distinguish presence or absence of disease (Aleixos et al.
2002; Moshou et al. 2004).
Generally stressed plants show a greater increase in reflectance in the visible
region (blue, green, red) than in the rest of the spectrum, compared to healthy plants
(Carter 1993). Vegetative indices, therefore, use the reflectance figures from two or more
regions (Table 1.3) to compute values specific to plant conditions (Hatfield and Prueger
2010). Changes in the reflectance in different regions are strongly linked to chlorophyll
absorption and in the physical structure of the leaf (Kumar and Silva 1973). The portion
of the reflectance spectrum that is most sensitive to changes in a leaf is the red edge band
(Baranoski and Rokne 2005).
Table 1.3 The regions of the reflectance spectrum used in calculating vegetative indices
(Hatfield and Prueger 2010)
Region Wavelength (nm)
Blue 400–510
Green 520–590
Red 630–685
Red-edge 690–730
Near-infrared 760–850
The most common vegetative index is the normalised difference vegetative index
(NDVI) (Rouse et al. 1973). Differences in NDVI have been used to detect
Huanglongbing-infected citrus trees (Garcia-Ruiz et al. 2013), ganoderma stem base rot

27
of oil palm trees (Shafri and Hamdan 2009), and anthracnose in citrus (Aleixos et al.
2002). Disease index (Moshou et al. 2004) and green NDVI (Contreras-Medina et al.
2012) are other vegetative indices that can be used to detect changes in plant leaves
relating to disease.
The main limitation in using vegetative indices for disease detection is the
selection of disease-specific spectral bands. Also, selection of classification algorithms
for the spectral bands is a challenge. This is dependent on the imaging device and
environmental conditions under which the images are taken (Sankaran et al. 2010).
1.8.4 Airborne platforms and unmanned aerial vehicles
The increasing availability of smaller, light-weight, less expensive and high
resolution imaging sensor tools has significantly propelled the use of remote sensing for
disease management (Sankaran et al. 2010; Martinelli et al. 2014). These tools are built
so that they can be mounted on relatively small airborne devices such as unmanned aerial
vehicles (UAVs). Unmanned aerial vehicles are reported to be more efficient in
collecting real-time aerial images with better spatial resolution with easy adjustment of
flying altitudes compared to manned aircrafts (Garcia-Ruiz et al. 2013).
1.9 Summary and objective
Stemphylium leaf blight is a destructive but poorly understood disease of onion in
Ontario. Since it was first reported in 2008, the incidence and severity of SLB have
increased within the Holland Marsh. Fungicides applied in combination with IPM
strategies have not reduced SLB levels to acceptable levels. Improved understanding of

28
the biology of the pathogen (overwintering, inoculum dispersal, alternative hosts) and the
conditions that favour disease development in the Holland Marsh are needed to improve
disease management.
The original source of the pathogen on onion in the Holland Marsh is not known.
However, the pathogen was previously reported on asparagus in Ontario. Investigations
into the pathogenicity and aggressiveness of isolates of S. vesicarium from other hosts
and locations may help to identify possible sources of the pathogen. This in turn may
indicate if it is possible to transfer successful management techniques from other hosts to
onion.
At present, the options for effective management of SLB on onion are limited.
There are no cultivars with strong resistance but cultivars differ in susceptibility to SLB,
so evaluation of the reaction of locally grown cultivars could identify those with lower
susceptibility. Stemphylium vesicarium has been shown to develop insensitivity to
fungicides over very short periods of time, so application of fungicides should be
recommended only when needed, to minimize the development of insensitivity and to
minimize the cost of SLB management. Early detection may prove useful in managing
SLB, so use of aerial infrared imagery should be assessed to determine its potential to
detect early disease stress in the onion crop.
In the course of these studies, the following hypotheses were made:
1. The incidence of SLB on onion in the Holland Marsh coincides with frequent
rainfall events, temperature exceeding 18 °C, leaf wetness duration exceeding 6 h,
vapour pressure deficit less than 1.5kPa, and abundance of airborne conidia,

29
2. Ascospores and conidia are available at different times during the growing season
in the Holland Marsh,
3. Pseudothecia overwinter on infected onion residue in Ontario,
4. Commercial onion cultivars differ in susceptibility to SLB, but none are resistant,
5. Isolates of S. vesicarium from different hosts and locations in Canada are
pathogenic on onion, but differ in aggressiveness,
6. Spray timing programs can reduce the number of fungicide applications required
to keep SLB below an economic threshold on onion, and
Aerial infrared photography can be used to detect differences between healthy
onions and those infected with SLB.
The overall objective of this research was to improve the management of SLB on
onion in the Holland Marsh of Ontario. The specific objectives tested were to:
1. Investigate the availability and seasonal distribution of airborne inoculum for SLB
during the growing season,
2. Investigate the relationship between rainfall, temperature, vapour pressure deficit,
and leaf wetness duration and airborne spore concentration and SLB on onion,
3. Investigate the overwintering of S. vesicarium on onion crop residue,
4. Evaluate the susceptibility of commercially grown onion cultivars to SLB under
controlled conditions and in the field,
5. Evaluate the pathogenicity and aggressiveness on onion of selected isolates of
S. vesicarium from other hosts and locations in Canada,
6. Evaluate selected spray timing programs for management of SLB on onion, and

30
7. Investigate the use of aerial infrared photography to detect SLB on onion in the
Holland Marsh.
In the course of these studies, the following hypotheses were tested:
7. The incidence of SLB on onion in the Holland Marsh coincides with frequent
rainfall events, temperature exceeding 18 °C, leaf wetness duration exceeding 6 h,
vapour pressure deficit less than 1.5kPa, and abundance of airborne conidia,
8. Ascospores and conidia are available at different times during the growing season
in the Holland Marsh,
9. Pseudothecia overwinter on infected onion residue in Ontario,
10. Commercial onion cultivars differ in susceptibility to SLB, but none are resistant,
11. Isolates of S. vesicarium from different hosts and locations in Canada are
pathogenic on onion, but differ in aggressiveness,
12. Spray timing programs can reduce the number of fungicide applications required
to keep SLB below an economic threshold on onion, and
13. Aerial infrared photography can be used to detect differences between healthy
onions and those infected with SLB.

31
CHAPTER TW0
RELATIONSHIP AMONG WEATHER VARIABLES, CONCENTRATION OF
AIRBORNE SPORES AND DEVELOPMENT OF STEMPHYLIUM LEAF BLIGHT
2.1 Introduction
The Holland Marsh is the single largest production area for onion in Canada.
Stemphylium leaf blight (SLB) was observed in the Holland Marsh in 2008 and incidence
has since increased drastically (Paibomesai et al. 2012; McDonald et al. 2015). The
disease caused yield losses of up to 90% on onion at various locations worldwide (Rao
and Pavgi 1975; Miller et al. 1978; Lorbeer 1993; FAO/IPGRI 1997)
Initially, SLB on onion is characterized by small, yellow to tan, water-soaked
lesions that turn dark brown when the pathogen sporulates (Rao and Pavgi 1975). The
pathogen starts producing host-specific toxin immediately after conidial germination
(Singh et al. 2000; Wolpert et al. 2002). The toxins cause extensive necrosis of the
infected leaves from the tip, resulting in desiccation and premature lodging of the crop
(Rao and Pavgi 1975; Basallote-Ureba et al. 1999). Stemphylium leaf blight affects all
foliar parts of the onion crop and severely infected crops develop small to no bulbs (Rao
and Pavgi 1975).
Stemphylium vesicarium produce ascospores and conidia, which infect the various
hosts (Simmons 1969). The epidemiology of S. vesicarium has been studied extensively
on pear (Llorente et al. 2012), and garlic (Prados-Ligero et al. 2003) in Spain, and on
Welsh onion in Japan (Misawa and Yasuoka 2012). However, studies of the pathogen on
common onion are limited. On garlic tissues, pseudothecia production and ascospore

32
maturation are highly favoured by temperatures between 4.5 - 10.5 °C and relative
humidity exceeding 98%. Maturation of ascospores take 1-4 months (Prados-Ligero et al.
1998).
Ascospore release in garlic coincides with frequent precipitation, temperatures
between 10 - 21 °C and low vapour pressure deficit (VPD) of 0.1 - 0.5 kPa (Prados-
Ligero et al. 2003). In pear orchards, ascospores are postulated to first colonise debris and
dried grasses in the orchard. This initial colonisation leads to the abundant production of
conidia later in the season, which causes infections on pear fruit and young twigs (Rossi
et al. 2005, 2008).. The role of ascospores in the epidemiology of SLB on Allium crops is
not known (Prados-Ligero et al. 2003; Misawa and Yasuoka 2012).
On Allium crops, conidia are abundant during primary infection (Prados-Ligero et
al. 2003; Misawa and Yasuoka 2012). Release of conidia is favoured by frequent rainfall,
temperatures of 15 - 32 °C and VPD of 0.1 - 1.5 kPa (Prados-Ligero et al. 2003).
Maximum germination of conidia and infection on onion leaves occurs between 10 - 25
°C with leaf wetness duration exceeding 8 h (Suheri and Price 2000).
The daily concentration of airborne ascospores and conidia show a diurnal pattern
in asparagus, leek, garlic and pear (Granke and Hausbeck 2010; Prados-Ligero et al.
2003; Rossi et al. 2005; Suheri and Price 2001). In asparagus fields in Michigan, the
highest concentrations of airborne conidia were captured between 0700 - 1300 h (Granke
and Hausbeck 2010). In garlic crops in Spain, the highest concentrations of airborne
ascospores and conidia were captured between the 00 – 0600 and 1200 – 1800
respectively (Prados-Ligero et al. 2003). Weather conditions recorded in the 10 days

33
before spore capture influenced the concentration of airborne spores and subsequent
disease development (Prados-Ligero et al. 2003).
Initial symptom development on garlic and Welsh onion crops coincided with
high airborne conidia concentration, rainfall, and temperatures above 18 °C (Prados-
Ligero et al. 2003; Misawa and Yasuoka 2012). In asparagus, purple spot symptoms
coincided with both high ascospore and conidia concentrations and prolonged wetness
periods (Granke and Hausbeck 2010). There is little information on the nature and
availability of airborne inoculum of SLB on onion, or on the weather conditions that
favour SLB development.
Understanding the epidemiology of SLB on onion is essential for development of
effective management strategies. The objectives of this research, therefore, were to i)
investigate the concentration and distribution of airborne spores during the growing
season, ii) evaluate the relationship between airborne spore concentration and weather
variables, iii) evaluate the relationship between airborne spore concentration and SLB
incidence, and iv) investigate overwintering of pseudothecia in the Holland Marsh.
2.2 Materials and Methods
2.2.1 Trapping field
Onion cv. La Salle (Stokes Seeds, Thorold, ON), previously shown to be
susceptible to SLB, was assessed at two sites that has been planted to onion the previous
year and with a history of SLB. In 2015, plugs of onion (2-3 seedlings per plug) were
transplanted on 25 May using a mechanical transplanter. The trial was conducted on an
organic soil (organic matter ≈ 62%, pH ≈ 7.2) at the Jane Street research site near the

34
Muck Crop Research Station (MCRS), Holland Marsh. In 2016, the crop was direct
seeded at about 35 seeds m-1
per row on 4 May using a Stanhay Precision seeder into
organic soil (organic matter ≈ 71%, pH ≈ 5.7) at the MCRS. The seeds germinated 10-12
days after planting (DAP). In both years, the plot used for spore trapping was 15 × 24 m
in size (Fig. 2.1A).
In 2015, flumioxazin herbicide (Chateau®, Valent Corporation, Guelph, ON) was
applied following label recommendations to control weeds at 45 days after transplanting
(DAT). In 2016, bromoxynil herbicide (Pardner®, Bayer Crop Science Inc., Mississauga,
ON) was applied at 39 DAP and repeated at 56 DAP to control weeds. Weeds were
removed by hand throughout the remainder of the growing season until maturity. In 2015,
seedlings were drenched 45 days after seeding with chlorpyrifos insecticide (Pyrinex™,
Adama Agricultural Solutions Canada Ltd., Winnipeg, MB) for the management of onion
maggot. The spore trap plot did not receive applications of fungicide so as to provide a
natural representation of inoculum levels. Within the trapping plot, four beds, each
consisting of four rows, 42 cm apart and 5 m in length, were marked out for disease
assessment.
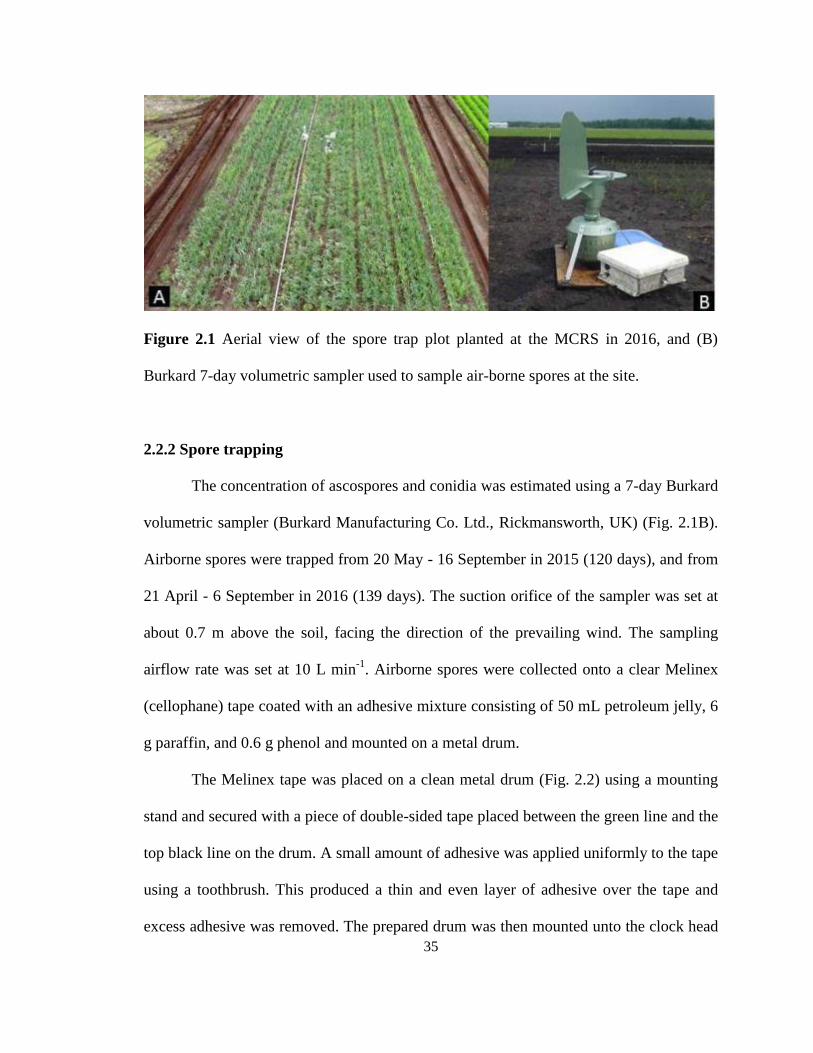
35
Figure 2.1 Aerial view of the spore trap plot planted at the MCRS in 2016, and (B)
Burkard 7-day volumetric sampler used to sample air-borne spores at the site.
2.2.2 Spore trapping
The concentration of ascospores and conidia was estimated using a 7-day Burkard
volumetric sampler (Burkard Manufacturing Co. Ltd., Rickmansworth, UK) (Fig. 2.1B).
Airborne spores were trapped from 20 May - 16 September in 2015 (120 days), and from
21 April - 6 September in 2016 (139 days). The suction orifice of the sampler was set at
about 0.7 m above the soil, facing the direction of the prevailing wind. The sampling
airflow rate was set at 10 L min-1
. Airborne spores were collected onto a clear Melinex
(cellophane) tape coated with an adhesive mixture consisting of 50 mL petroleum jelly, 6
g paraffin, and 0.6 g phenol and mounted on a metal drum.
The Melinex tape was placed on a clean metal drum (Fig. 2.2) using a mounting
stand and secured with a piece of double-sided tape placed between the green line and the
top black line on the drum. A small amount of adhesive was applied uniformly to the tape
using a toothbrush. This produced a thin and even layer of adhesive over the tape and
excess adhesive was removed. The prepared drum was then mounted unto the clock head

36
(Fig. 2.2), which was part of the lid of the trap. The clock was fully wound anti-clockwise
on the trap. The red line on the drum was lined up with the metal arrow on the clock, and
then firmly secured with a bolt. The drum was changed weekly and cut into seven 48-
mm-long pieces, with each piece carrying the spores trapped on one of the previous 7
days. The daily tape segments were fixed onto microscope slides that had been marked to
0.33 mm across to represent every 2-hr interval on the tape. The prepared slides were
scanned with a compound microscope at 400× magnification. Ascospores and conidia
were identified based on their morphological characteristics, as described by Simmons
(1969).

37
Figure 2.2 Burkard 7-day volumetric spore sampler clock head mounted with prepared
drum for monitoring of airborne spore in the Holland Marsh, 2016.
2.2.3 Weather data
Hourly meteorological data of temperature (°C), relative humidity (%), rainfall
(mm) and leaf wetness (%) were measured and recorded by an Onset® automatic weather
station (Onset Corporation, Bourne, MA) placed in the center of the trapping plot.
Rainfall was measured with a rain gauge smart sensor (Model: S-RGB-M002) installed
with a plug-in modular connector that allowed it to communicate with a data logger and
store data. Two leaf wetness smart sensors (Model: S-LWAM003) were used to measure
leaf wetness. The leaf wetness smart sensors were placed at in an upright position (almost

38
90 °) to simulate the angle of an onion leaf; the sensors did not require painting or coating
following the manufacturers’ instructions. Routine visual checks for moisture on onion
leaves were compared to the values from the two leaf wetness sensors. The data from the
sensor identified as more sensitive and accurate were used to calculate daily leaf wetness
duration (LWD). Air temperature and relative humidity were measured with a
temperature/RH sensor (Model: S-THB-M00x). The daily average temperature, average
relative humidity, total daily rainfall and daily number of hours with temperature
exceeding 15 °C were computed. Vapour pressure deficit (VPD) (kPa) was calculated
using average daily relative humidity and temperature (Abtew and Melesse 2013) as
follows:
(
)
(
)
Where es is saturation vapor pressure in kPa and T (°C) is 24 h average air temperature.
2.2.4 Disease assessment
The disease assessment plots were observed weekly for the onset of SLB lesions.
In 2015, the number of lesions was assessed on one transplant plug (consisting of 2 - 3
seedlings) at each of eight places along the middle two rows of each bed, for a total of
16 - 24 plants per plot. Plugs were selected at roughly 1-m intervals along each row,
starting 1 m from the end of the row. The first and second fully developed outer leaves on
the two largest seedlings per plug were assessed for lesions. Overall, 32 leaves were

39
assessed and the mean number of lesions per leaf was calculated. In 2016, lesions were
counted on 10 consecutive plants in each of the two middle rows as described above
(total = 40 leaves).
SLB incidence in 2015 was assessed by counting the total number of transplant
plugs per plot and the number with SLB symptoms. In 2016, 100 plants in the middle two
rows of each plot were assessed. A method similar to that for lesion assessment was used
in both years to select onion plants for assessment. However, the plants assessed for
lesions were not the same as assessed for leaf dieback. The total length and the length of
the dieback on the fifth and sixth fully developed true leaves of each plant were measured
with a 60-cm clear plastic ruler. The length of leaf dieback relative to the total leaf length
for each leaf was assessed and the average percentage leaf dieback for each bed for each
cultivar was calculated.
Onion plants in the trapping plot were pulled up on 10 September in 2015 and 6
September in 2016. Yield was not assessed in this trial.
2.2.5 Overwintering
Onion plants in the disease assessment and trapping plots in both years were
visually assessed at the end of the planting season for the formation of pseudothecia. In
2015, 64 symptomatic leaves and 32 bulbs of diseased plants were collected and placed
in light polyester mesh bags that allowed exchange of gases and moisture. An
experimental unit consisted of a bag with eight leaves or four bulbs per bag. Four bags of
leaves and four bags of bulbs were buried 10-cm deep in muck soil in separate 2 L pots,
and the remaining bags were placed on the soil surface of the same pots. Thus each pot

40
had two bags of leaves or bulbs, one buried and the other on the surface. The pots were
then placed outside on 31 October. Two bags of each tissue (one from the surface and
one from 10-cm depth) were sampled on 30 December, 30 January, 29 February and 30
March and observed visually and microscopically for formation of pseudothecia.
2.2.6 Data analysis
All statistical analyses were conducted using SAS version 9.4 (SAS Institute,
2015). Visual and statistical analyses were used to determine the relationship between the
weather data and type and number of spores trapped. First, the data were plotted to
visually compare the timing of release of ascospores and conidia with both weather data
and subsequent SLB incidence and leaf dieback. PROC GLM was used for analysis of
variance of the concentration of ascospores and conidia. Outliers were assessed using
Lund’s test and no outliers were identified. The normality of the data was tested using the
PROC UNIVARIANT function. This showed that the data were not normally distributed.
Therefore, the association between the daily concentration of airborne spores and the
weather variables listed in Table 2.1 was calculated using Spearman’s rank correlation in
PROC CORR at P < 0.05. A nonparametric test was chosen because the data were not
normally distributed and most of the weather variables were measured on an ordinal
scale. Multiple stepwise regressions of spore concentrations with weather variables were
conducted using PROG REG.

41
Table 2.1 Weather variables assessed and tested for correlation with conidia and
ascospores of Stemphylium vesicarium recorded in onion at the Holland Marsh, ON.
Temp Average daily temperature (˚C)
NTemp Number of hours daily with temperature ≥ 15 ˚C (h)
DTemp* Number of days with average temperature ≥ 15 ˚C (days)
WTemp Average temperature during leaf wetness period (˚C)
LWD Daily leaf wetness duration (h)
DLWD* Number of days with LWD ≥ 6 h (days)
VPD Vapour pressure deficit (kPa)
NVPD Number of hours daily with VPD ≤ 0.5 kPa (h)
DVPD* Number of days with VPD ≤ 0.5 kPa (days)
Rain Total daily rainfall (mm)
Train* Cumulative total rainfall (mm)
NRain* Number of days with rainfall ≥ 2mm (days)
*Calculated for cumulative periods up to 10 days prior to spore trapping
2.3 Results
2.3.1 Daily airborne spore concentration
The daily concentration of airborne conidia and ascospores were higher in 2015
compared to 2016. However, the daily pattern of spore capture was similar in the two
years. The number of airborne spores captured varied throughout the day, but the
concentration was highest in the early morning. In 2015, 49% of ascospores and 56% of
conidia were captured from 0600–1200 h, and 73% of ascospores and 60% of conidia in
2016 (Table 2.2). Few or no spores were captured during rainy periods and after dark.

42
2.3.2 Seasonal pattern of airborne spores
Conidia were captured throughout the entire season in both years, but the
concentrations differed substantially. The average daily conidia concentration was 33
conidia m-3
air in 2015 and 7 conidia m-3
air in 2016. In 2015, the highest daily conidia
concentration was 97 conidia m-3
air captured on 11 July, compared with 29 conidia m-3
air captured on 29 July and 10 August in 2016 (Fig. 2.3).
The daily concentrations of ascospores declined as the season progressed, and
ascospores became more difficult to identify as their concentration dropped and the
concentration of conidia increased. Ascospore were last captured on 6 July 2015 and 7
June 2016. The average daily ascospores concentration was 12 ascospores m-3
air in 2015
and 4 ascospores m-3
air in 2016. The highest daily concentration of ascospores in 2015
was 54 ascospores m-3
air counted on 2 June, compared with 6 ascospores m-3
air counted
on 23 and 26 April, 2016. Furthermore, ascospores were captured on only 4 days in 2016
(Fig. 2.4).

43
Table 2.2 Percentage of airborne ascospores and conidia captured at 2-hr intervals each day during the growing season in
onion plots at the Holland Marsh, ON in 2015 and 2016.
Spore
type
Hours of the day
0-2 2-4 4-6 6-8 8-10 10-12 12-14 14-16 16-18 18-20 20-22 22-24
2015
Ascospores 2 3 16 23 20 6 5 6 7 6 4 3
Conidia 1 4 14 22 22 12 7 6 5 5 2 1
2016
Ascospores 0 15 4 31 31 12 0 0 0 0 0 0
Conidia 1 3 6 20 21 18 12 7 4 4 3 1

44
Figure 2.3 Seasonal patterns of conidial capture and first observation of stemphylium leaf blight lesions on onion at the
Holland Marsh, ON in 2015 and 2016.
0
10
20
30
40
50
60
70
80
90
100
21-A
pr
28-A
pr
5-M
ay
12-M
ay
19-M
ay
26-M
ay
2-J
un
9-J
un
16-J
un
23-J
un
30-J
un
7-J
ul
14-J
ul
21-J
ul
28-J
ul
4-A
ug
11-A
ug
18-A
ug
25-A
ug
1-S
ep
8-S
ep
15-S
ep
Co
nid
ia (
sp
ore
s/m
3 a
ir)
First Lesion 2015 First Lesion 2016 2015 2016

45
Figure 2.4 Seasonal pattern of ascospore capture and the first observation of stemphylium leaf blight lesions on onion at the
Holland Marsh, ON in 2015 and 2016.
0
10
20
30
40
50
60
As
co
sp
ore
(sp
ore
/m3 a
ir)
First Lesion 2015 First Lesion 2016 2015 2016

46
2.3.3 Weather variables and airborne spore concentration
In 2015, approximately 340 mm of precipitation fell over the course of 28 days,
and 245 mm fell over 22 days in 2016 (Table 2.3). Daily conidial concentration was
correlated with the total rainfall volume (r = 0.49, P < 0.0001) and the number of rainy
days (r = 0.23, P = 0.01) in the 10 days prior to capture (Table 2.4). From observations in
2015, conidia concentration increased substantially 2–72 h after rainfall event. However,
few or no spores were trapped during a rainfall event (Figs. 2.5 and 2.6).
The mean daily temperature during the trapping period was about 19 °C and 18
°C in 2015 and 2016 respectively (Table 2.3). Average daily temperatures exceeding 15
°C were recorded on 91% of the trapping days in 2015 and 77% of the trapping days in
2016 (Table 2.3). The average temperature during LWD was 19 °C in 2015 and 18 °C in
2016 (Table 2.3). The daily conidial concentration was positively correlated with the
number of days with temperatures exceeding 15 °C in the 10 days prior to capture in both
2015 (r = 0.49, P < 0.0001) and 2016 (r = 0.68, P < 0.0001) seasons (Table 2.4). In 2016,
the daily conidia concentration was correlated with the average daily temperature (r =
0.56, P < 0.0001) and the average temperature during leaf wetness periods (r = 0.53, P <
0.0001) (Table 2.4). The daily concentration of ascospores captured decreased with daily
average temperatures exceeding 15 °C, whereas conidia concentration increased as the
season progressed and then declined towards the end of the season (Figs. 2.7 and 2.8).
In 2015, 87% of the days assessed had daily LWD exceeding 6 h, and 96% of
days in 2016 (Table 2.3). In 2016, the daily LWD correlated with daily ascospore (r =
0.31, P = 0.03) and conidial (r = 0.41, P < 0.0001) concentration. In 2015, daily
ascospore concentration was correlated with the number of day with LWD exceeding 6 h

47
in the 10 days prior to capture, but not in 2016. In 2016, daily conidial concentration was
correlated (r = 0.63, P < 0.0001) with the number of days with LWD exceeding 6 h in the
10 days prior to capture (Table 2.4).
The proportion of days in the trapping period with VPD less than 0.5 kPa was
57% in 2015 and 36% in 2016 (Table 2.3). Daily ascospore concentration was correlated
with the number of hours in a day when VPD was less than 0.5 kPa in 2016 (r = 0.31, P =
0.04). In 2016, the daily conidial concentration was also correlated with daily VPD (r =
0.20, P = 0.02) and the number of days with VPD less than 0.5 kPa in the 10 days prior to
capture (r = -0.34, P < 0.0001) (Table 2.4).

48
Table 2.3 Weather conditions recorded during the period when airborne spores were trapped, cumulative number of days with
favourable weather conditions for stemphylium leaf blight on onion in the Holland Marsh, ON in 2015 and 2016.
Year Total spore kind a Weather variables
b
Total
Rainfall
(mm)
Seasonal daily average of: Seasonal number of days with:
Ascospores
Conidia Temp.
(˚C)
Temp.
during
LWD
VPD
(kPa)
LWD
(h)
Temp. ≥
15 ˚C
Daily
VPD ≤
0.5 kPa
Rainfall
( ≥ 2 mm)
LWD
≥ 6 h
2015 470 3903 340 19 19 0.5 10 109 68 28 104
2016 22 933 245 18 18 0.6 10 107 50 22 133 a
Ascospores were captured from 20 May–6 July in 2015 and 21 April–7 June in 2016, conidia were captured 20 May–16 September
in 2015 and 21 April–6 September in 2016.
b Weather variables recorded from 20 May–16 September in 2015 and 21 April–6 September in 2016.
VPD = vapour pressure deficit. LWD = leaf wetness duration
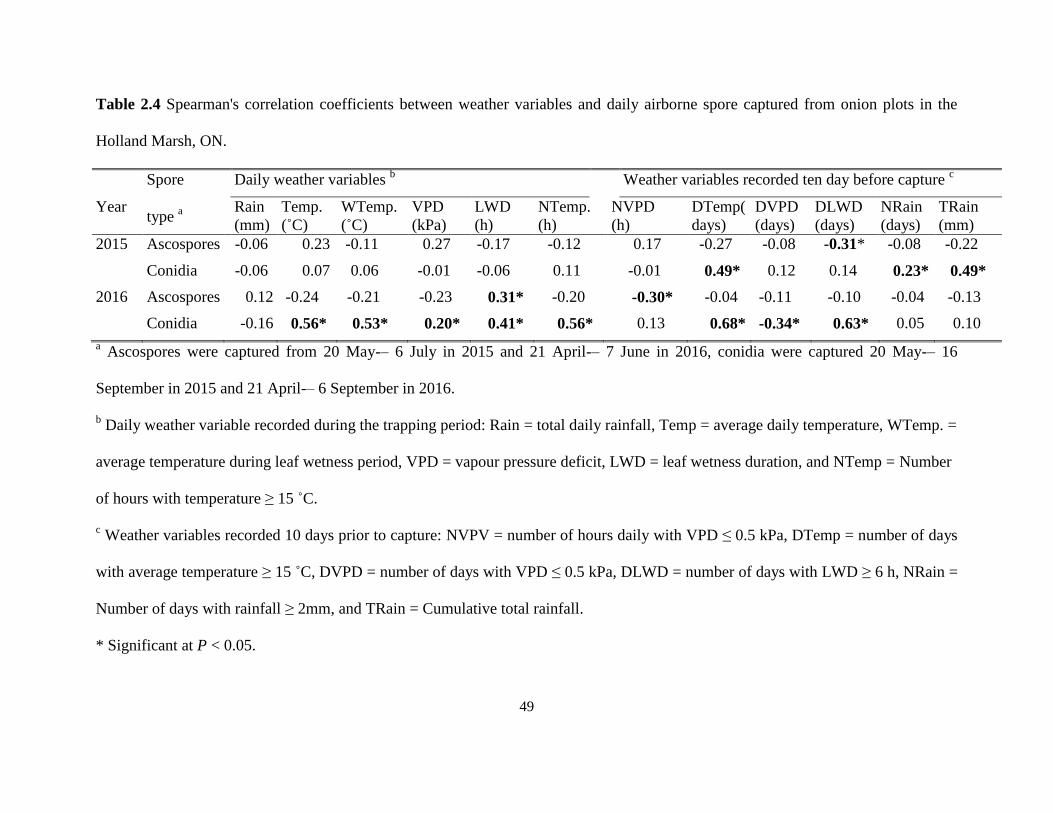
49
Table 2.4 Spearman's correlation coefficients between weather variables and daily airborne spore captured from onion plots in the
Holland Marsh, ON.
Spore
type a
Daily weather variables b
Weather variables recorded ten day before capture c
Year Rain
(mm)
Temp.
(˚C)
WTemp.
(˚C)
VPD
(kPa)
LWD
(h)
NTemp.
(h)
NVPD
(h)
DTemp(
days)
DVPD
(days)
DLWD
(days)
NRain
(days)
TRain
(mm)
2015 Ascospores
-0.06 0.23 -0.11 0.27 -0.17 -0.12 0.17 -0.27 -0.08 -0.31* -0.08 -0.22
Conidia
-0.06 0.07 0.06 -0.01 -0.06 0.11 -0.01 0.49* 0.12 0.14 0.23* 0.49*
2016 Ascospores 0.12 -0.24 -0.21 -0.23 0.31* -0.20 -0.30* -0.04 -0.11 -0.10 -0.04 -0.13
Conidia -0.16 0.56* 0.53* 0.20* 0.41* 0.56* 0.13 0.68* -0.34* 0.63* 0.05 0.10
a Ascospores were captured from 20 May-– 6 July in 2015 and 21 April-– 7 June in 2016, conidia were captured 20 May-– 16
September in 2015 and 21 April-– 6 September in 2016.
b Daily weather variable recorded during the trapping period: Rain = total daily rainfall, Temp = average daily temperature, WTemp. =
average temperature during leaf wetness period, VPD = vapour pressure deficit, LWD = leaf wetness duration, and NTemp = Number
of hours with temperature ≥ 15 ˚C.
c Weather variables recorded 10 days prior to capture: NVPV = number of hours daily with VPD ≤ 0.5 kPa, DTemp = number of days
with average temperature ≥ 15 ˚C, DVPD = number of days with VPD ≤ 0.5 kPa, DLWD = number of days with LWD ≥ 6 h, NRain =
Number of days with rainfall ≥ 2mm, and TRain = Cumulative total rainfall.
* Significant at P < 0.05.

50
Figure 2.5 Seasonal distribution of airborne ascospores and conidia in relation to daily rainfall recorded in an onion plot at the
Holland Marsh, ON, 2015.
0
5
10
15
20
25
30
0
10
20
30
40
50
60
70
80
90
100
Rain
fall
(m
m)
Air
bo
rne
sp
ore
s (
m-3
air
)
Rainfall Ascospores Conidia

51
Figure 2.6 Seasonal distribution of airborne ascospores and conidia of S. vesicarium in relation to total daily rainfall recorded
in onion plots grown in the Holland Marsh, ON, 2016.
0
5
10
15
20
25
30
35
40
0
5
10
15
20
25
30
Rain
fall
(m
m)
Air
bo
rne
sp
ore
s (
m-3
air
)
Rainfall Ascospore Conidia

52
Figure 2.7 Seasonal distribution of airborne ascospores and conidia of S. vesicarium in relation to average daily temperature recorded
in onion plots grown in the Holland Marsh, ON, 2015.
0
5
10
15
20
25
30
0
10
20
30
40
50
60
70
80
90
100
Te
mp
era
ture
(°C
)
Air
bo
rne
sp
ore
s (
m -
3 a
ir)
Ascospore Conidia Temperature

53
Figure 2.8 Seasonal distribution of airborne ascospores and conidia of S. vesicarium in relation to average daily temperature recorded
in onion plots grown in the Holland Marsh, Ontario, 2016.
0
5
10
15
20
25
30
0
5
10
15
20
25
30
Te
mp
era
ture
(°C
)
Air
bo
rne
sp
ore
s (
m -
3 a
ir)
Ascospore Conidia Temperature

54
The models derived from multiple stepwise regressions between airborne conidia
concentration and weather variables were not consistent across the two years (Table 2.5). The
daily concentration of airborne conidia in 2015 was influenced by the cumulative total rainfall
in the 10 days prior, the daily number of hours with VPD less than 0.5 kPa, the number of days
with temperature exceeding 15 °C in the 10 days prior, and the number of days with VPD less
than 0.5 kPa in the 10 days prior. The number of days with temperature exceeding 15 °C had
the greatest influence on daily conidia concentration in 2015 (Fig. 2.9A).

55
Table 2.5 Stepwise regressions of the daily concentration of conidia versus weather parameters
at the Holland Marsh, ON in 2015 and 2016.
Weather variablea
Partial R-squared Model R-squared F Value Pr > F
2015
DTemp 0.22 0.22 32.64 <0.0001
TRain 0.34 0.36 25.26 <0.0001
NVPD 0.09 0.44 18.38 <0.0001
NRain 0.03 0.47 5.72 0.02
DVPD 0.03 0.50 6.91 0.01
Rain 0.03 0.54 8.34 0.005
2016
DLWD 0.26 0.26 48.92 <0.0001
DVPD 0.14 0.40 31.49 <0.0001
LWD 0.02 0.42 4.14 0.04 a
Weather variables recorded during the trapping period: Rain=total daily rainfall, LWD = leaf
wetness duration, NVPV = number of hours daily with VPD ≤ 0.5 kPa, DTemp .= number of
days with average temperature ≥ 15 ˚C recorded 10 days prior to capture, DVPD = number of
days with VPD ≤ 0.5 kPa recorded 10 days prior to capture, DLWD = number of days with
LWD ≥ 6 h recorded 10 days prior to capture, NRain = Number of days with rainfall recorded
10 days prior to capture, and TRain = cumulative total rainfall recorded 10 days prior to
capture.
56
Figure 2.9 Regression (± 95% confidence interval) for daily conidia concentration versus number of days with (A) average
temperature exceeding 15 °C in an onion plot in 2015 (R2
= 0.22, P < 0.0001) and (B) number of days with leaf wetness duration
exceeding 6 h (R2
= 0.26, P < 0.0001) in onion plots at the Holland Marsh, ON in 2016.

57
In 2016, the concentration of conidia was correlated with the number of days with
temperature exceeding 15 °C, VPD less than 0.5 kPa, the number of days with LWD
exceeding 6 h in the 10 days prior, and daily LWD (Table 2.5). The number of days with
LWD exceeding 6 h had the greatest influence on daily conidia concentration (Fig. 2.9B).
The models derived from stepwise regression between airborne ascospore
concentration and selected weather variables were also not consistent across the two
years (Table 2.6). In 2015, total rainfall in the 10 days prior to capture had the greatest
influence on daily ascospore concentration (Fig 2.10A). In 2016, the daily LWD had the
greatest influence on daily ascospore concentration (Fig. 2.10B). The other variables had
no impact on ascospore concentration.
Table 2.6 Stepwise regression of the daily concentration of ascospores versus weather
parameters at the Holland Marsh, ON in 2015 and 2016.
Weather variable a
Partial R2 Model R
2 F Value Pr > F
2015
TRain 0.11 0.11 5.39 0.003
NRain 0.15 0.25 8.72 0.005
2016
LWD 0.11 0.11 5.59 0.02
a Weather variables recorded during the trapping period: LWD=leaf wetness duration,
NRain = Number of days with rainfall recorded 10 days prior to capture, and TRain =
cumulative total rainfall recorded 10 days prior to capture.

58
Figure 2.10 Regression (+ 95% confidence interval) of daily ascospore concentration versus (A) rainfall in the 10 days prior to
capture in 2015 (R2
= 0.11, P = 0.02) and (B) daily leaf wetness duration in 2016 (R2 = 0.11, P = 0.02) in the Holland Marsh, ON.

59
2.3.4 Disease assessment
The small, yellow to light brown lesions (Fig. 2.11A) of SLB were first observed
in the plots on 29 June 2015 and 07 July 2016. After 10–18 days, the onion leaves
showed signs of leaf dieback and the initial lesions turned dark brown, which indicated
the presence of sporulation. In both years, lesions were first observed when plants were at
the 4–6 leaf stage. Leaf dieback (Fig. 2.11B) was observed 10–14 days after initial
lesions were observed.
The mean SLB incidence scores at the final assessment date were 97% in 2015
and 25% in 2016. In both years, the first observation of SLB coincided with the
abundance of conidia and few to no ascospores in the 10 days before the observation of
the first SLB incidence (Table 2.7). In 2015, there was a minimum of 5 days with rainfall
events in the 10 days before the observation of the first SLB incidence and in 2016, there
was 3 rainy days. In both years, the average daily temperatures in the 10 days before the
observation of the first SLB incidence exceeded 15 °C. The minimum LWD in the 10
days prior to the observation of first SLB incidence was 5 h in 2015 and 9 h in 2016. The
highest VPD in the 10 days prior to the observation of first SLB incidence was 0.6 kPa in
2015 and 0.03 in 2016 (Table 2.7). There was an overall 225% and 285.7% increment in
leaf dieback in 2015 and 2016 (Table 2.7). The percentage increase of leaf dieback per
day was approximately 9% in 2015 and 12% in 2016.

60
Figure 2.11 Onion cv. La Salle showing (A) a young lesion, and (B) leaf dieback and
sporulation after infection with stemphylium leaf blight at the Holland Marsh, 2015
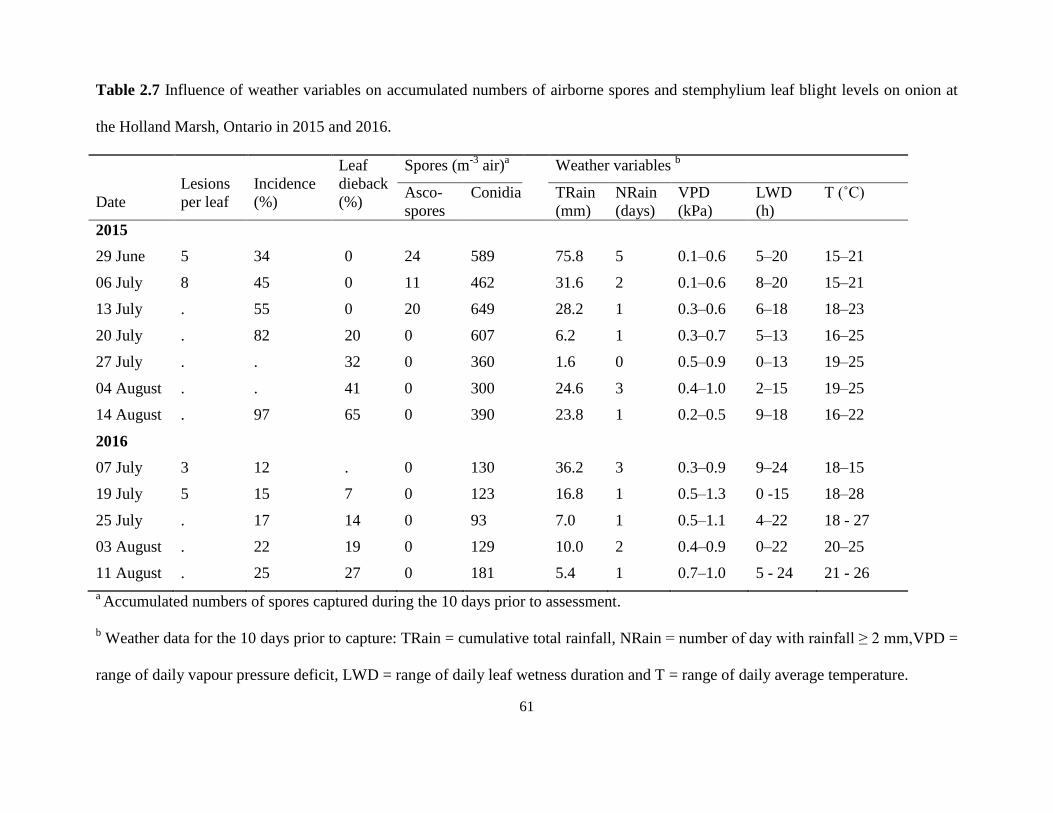
61
Table 2.7 Influence of weather variables on accumulated numbers of airborne spores and stemphylium leaf blight levels on onion at
the Holland Marsh, Ontario in 2015 and 2016.
Date
Lesions
per leaf
Incidence
(%)
Leaf
dieback
(%)
Spores (m-3
air)a
Weather variables b
Asco-
spores
Conidia TRain
(mm)
NRain
(days)
VPD
(kPa)
LWD
(h)
T (˚C)
2015
29 June 5 34 0 24 589 75.8 5 0.1–0.6 5–20 15–21
06 July 8 45 0 11 462 31.6 2 0.1–0.6 8–20 15–21
13 July . 55 0 20 649 28.2 1 0.3–0.6 6–18 18–23
20 July . 82 20 0 607 6.2 1 0.3–0.7 5–13 16–25
27 July . . 32 0 360 1.6 0 0.5–0.9 0–13 19–25
04 August . . 41 0 300 24.6 3 0.4–1.0 2–15 19–25
14 August . 97 65 0 390 23.8 1 0.2–0.5 9–18 16–22
2016
07 July 3 12 . 0 130 36.2 3 0.3–0.9 9–24 18–15
19 July 5 15 7 0 123 16.8 1 0.5–1.3 0 -15 18–28
25 July . 17 14 0 93 7.0 1 0.5–1.1 4–22 18 - 27
03 August . 22 19 0 129 10.0 2 0.4–0.9 0–22 20–25
11 August . 25 27 0 181 5.4 1 0.7–1.0 5 - 24 21 - 26
a Accumulated numbers of spores captured during the 10 days prior to assessment.
b Weather data for the 10 days prior to capture: TRain = cumulative total rainfall, NRain = number of day with rainfall ≥ 2 mm,VPD =
range of daily vapour pressure deficit, LWD = range of daily leaf wetness duration and T = range of daily average temperature.

62
2.3.4 Overwintering
All of the onion leaves that had been buried were completely degraded after 4
months of incubation outdoors overwinter (assessed on 29 February) and 81% of leaves
left on the surface were totally degraded after 5 months (30 March). Approximately 90%
of the onion bulbs buried remained intact, but the bulbs left on the surface of the soil
were partially decayed after 5 months. No pseudothecia were found on onion leaves or
bulbs after 5 months of incubation.
2.4 Discussion
The current research study represents the first assessment of the seasonal pattern
of airborne inoculum for SLB on onion and the relationships among inoculum
concentration, SLB incidence and weather. Conidia were trapped throughout the season
and conidial concentration increased as the season progressed. In contrast, ascospore
concentrations which decreased as the season progressed and temperature exceeded 15
°C. Frequent rainfalls up to 10 days before capture increased the concentration of conidia
but decreased the concentration of ascospores. Release of conidia and ascospores
exhibited a diurnal pattern with the highest concentrations captured from 0600-1200 h.
The first incidence of SLB on onion in the Holland Marsh was observed when the crop
was at the 4 - 6 leaf stage. From observation, the first SLB symptoms on onion coincided
with abundant conidia, frequent rainfall, warm temperature (≥ 15 °C), minimum LWD of
5 h, and VPD < 0.9 kPa.
The observation of initial lesions of SLB at the end of June in 2015 and early July
in 2016 was in agreement with earlier reports in the Holland Marsh (Paibomesai et al.

63
2012). Regardless of planting method, onions were at about the 4 - 6 leaf stage by the end
of June. Availability of susceptible host tissue, release of conidia, and favourable
environmental conditions explains the consistent observation of symptoms at this
particular time. Initial lesions occurred predominantly on older leaves, which supports
previous reports that older onion leaves are more susceptible to SLB than young leaves
(Shishkoff and Lorbeer 1989).
Disease incidence increased through the season, likely associated with increased
conidial concentration from sporulation on initial lesions (Basallote-Ureba et al. 1999),
aging of leaves (Shishkoff and Lorbeer 1989), and prolonged exposure of onion leaves to
inoculum and conducive environment for infection (Suheri and Price 2000). SLB
incidence was higher in 2015 than in 2016. This can be attributed to the higher conidia
concentrations in 2015 and of more days with favourable conditions for SLB infection,
such as warm temperatures (≥ 18 °C) and prolonged wet periods (LWD ≥ 8 h) (Basallote-
Ureba et al. 1999; Suheri and Price 2000).
Leaf dieback was likely associated with toxins produced by S. vesicarium (Singh
et al. 2000). The rate of increase in the percentage leaf dieback per day was similar in
both years. However, the final mean leaf dieback in 2015 was higher compared to 2016.
This may be attributed to the earlier and higher number lesions observed at the start of the
epidemic, and differences in the weather between the two seasons. In addition to the
abundance of inoculum, a minimum of 57% of the entire onion growing season had
favourable conditions (temperature ≥ 15 °C, LWD ≥ 6 h, and VPD ≤ 0.5) for SLB
development in 2015 compared to 36% in 2016 (Prados-Ligero et al. 2003).

64
The difference between spore concentrations in the two years was ascribed to
differences in weather conditions. Ascospore release from pseudothecia is triggered by
moderate rainfall and cool temperatures (10 - 21 °C) (Prados-Ligero et al. 2003), which
were common in late spring of 2015. The spring of 2016 was warmer and drier compared
to 2015. This may have resulted in the quicker degeneration of pseudothecia, and hence
reduced ascospore concentrations in 2016. Pseudothecia degenerates with temperatures
exceeding 15 °C (Prados-Ligero et al. 1998; Llorente et al. 2006). Additionally, the more
conducive infection conditions in 2015 resulted in early infection, which led to the
production of large numbers of conidia throughout the season.
In addition to the differences in the weather conditions between the two seasons,
the difference in ascospore and conidia concentration was attributed to the location of
trapping plots. In 2015, the plot was located on the Jane Street research site, bordered to
the east by a ditch with bolting onion plants from the previous season and weeds. In
2016, the trapping field was located at the MCRS and was surrounded by weed-free
onions (established at the same time) and carrots. Pseudothecia may have overwintered
on these onion inflorescence stalks (Rao and Pavgi 1975) and weeds (Misawa and
Yasuoka 2012) in 2015, resulting in higher ascospore concentration at the start of the
season. Furthermore, initial conidia may have infected the bolting onions, resulting in
increased conidial production later in the season.
In previous studies on Welsh onion in Japan, airborne ascospores were detected in
April, prior to crop establishment (Misawa and Yasuoka 2012). Also, studies on garlic in
southern Spain reported that airborne ascospore concentrations peaked in February and
March, before the first incidence of disease (Prados-Ligero et al. 2003). In 2016, when

65
spore trapping was initiated prior to planting, a few ascospores and conidia were trapped.
However, ascospore concentrations peaked before the first observation of SLB in the
Holland Marsh in both years.
On other hosts and in other locations, pseudothecia form on crop debris at the end
of the season and release ascospores in spring (Falloon 1987; Basallote-Ureba et al. 1999;
Misawa and Yasuoka 2012). The pseudothecia often take between 1–4 months to mature
(Prados-Ligero et al. 1998). In contrast, no pseudothecia were observed on diseased
onion tissues after 5 months outdoors at the Holland Marsh. Over 80% of all onion leaves
were completely or partially degraded at 5 months after harvest. These results indicated
that onion leaves may not be suitable materials for pseudothecia attachment and
development in this region. These results support a previous report that S. vesicarium
rarely overwinters on onion leaves (Rao and Pavgi 1975). In contrast. pseudothecia were
occasionally observed on the stalks of onion inflorescences in India (Rao and Pavgi
1975) and were common on dried asparagus spears (Falloon 1987).
The presence of ascospores in early spring at the Holland Marsh demonstrates that
the pathogen overwinters close to this site. In onion crops in the Holland Marsh, the
pathogen may be overwintering on alternative crops such as carrot or on weeds. Earlier
reports noted overwintering of S. vesicarium on both diseased and symptomless leaves of
Welsh onion and other crops (Misawa and Yasuoka 2012).
The infection potential of ascospores on onion was not investigated in this study.
However, the presence of few or no ascospores when SLB was first observed and the ten
day prior to this observation indicates that ascospores are likely not the primary inoculum
for SLB on onion at the Holland Marsh. This conflicts with earlier reports that suggested

66
that ascospores are the primary inoculum for SLB on Allium crops (Basallote-Ureba et al.
1999). Ascospore can infect onion and garlic tissues under controlled environmental
conditions (Prados-Ligero et al. 1998), but their role under field conditions is still not
understood.
In both years, airborne conidia were present before the first symptoms of SLB
were observed. The abundance of conidia prior to the observation of first SLB incidence
was similar to previous observations in pear (Rossi et al. 2008), garlic (Prados-Ligero et
al. 2003), leek (Suheri and Price 2001) and Welsh onion (Misawa and Yasuoka 2012).
The concentration of conidia peaked in July in both years. The high concentration of
conidia in July likely resulted from sporulation on initial lesions. The abundance of
conidia during SLB development on onion indicated that conidia were the most important
inoculum type on onion at the Holland Marsh.
Symptoms of S. vesicarium infection on Allium crops become visible 7 - 14 days
after inoculation (Shishkoff and Lorbeer 1989; Basallote-Ureba et al. 1999; Misawa and
Yasuoka 2012). However, there was a time lag (more than 30 days) between when the
first conidium was trapped and the first SLB symptom was observed on onion crops in
the Holland Marsh. These initial conidia may be causing symptomless infections on
onion or other crops and weeds growing around onion fields. A similar time lag has been
reported in Welsh onion, with latent development of S. vesicarium on several crops
(Misawa and Yasuoka 2012). Also, DNA of S. vesicarium has been reported from
symptomless pear leaves and grasses (Köhl et al. 2009). Latent development of
S. vesicarium was not investigated in the current research project.

67
Ascospore concentration declined with prolonged, heavy rainfall events. On leek
(Suheri and Price 2001) and garlic (Prados-Ligero et al. 2003), ascospore concentration
increased 24–36 h after short periods of rainfall. However, large volumes of rainfall in
the Holland Marsh earlier in 2015 may have flooded pseudothecia and inhibited the
release of ascospores. In the absence of persistent rain events in 2016, prolonged LWD
with saturated air (VPD ≤ 0.5 kPa) may have influenced airborne ascospore
concentration. These results support the importance of precipitation on daily ascospore
concentration (Prados-Ligero et al. 2003).
Rainfall in the 10 days prior to spore capture increased the daily number of
conidia captured. Also, the concentration of conidia increased substantially 2 - 72 h after
rainfall. The influence of rainfall on conidial concentration had been reported previously
(Suheri and Price 2001; Prados-Ligero et al. 2003; Granke and Hausbeck 2010). Few to
no conidia were captured during rain events. This can be attributed to rains washing
conidia from infected leaves, and also to the formation of a water layer on leaf surfaces
that prevented the dispersal of conidia (Meredith 1966; van der Werff 1967).
Daily conidia concentrations were positively correlated with the number of days
with temperatures exceeding 15 °C. A similar relationship has been reported in garlic and
leek, where the highest concentrations of conidia coincided with temperature ranging
from 15–32 °C in the days preceding capture (Suheri and Price 2001; Prados-Ligero et al.
2003). However, ascospore concentration declined as temperatures increased. These
results indicated that the increase in temperature that generally occurs from late spring
into summer influenced the type of airborne spore captured and the spore concentration
in the Holland Marsh.

68
Approximately 60% of conidia and 50–70% of ascospores were captured between
0600–1200 h at the Holland Marsh. The lowest concentrations of spores were captured
after dark. This diurnal pattern of ascospore and conidial capture was similar to that
reported on garlic in southern Spain (Prados-Ligero et al. 2003), on leek in Australia
(Suheri and Price 2001) and on asparagus in Michigan (Granke and Hausbeck 2010).
Alternaria species, which are closely related to Stemphylium species (Simmons
1967), exhibit a similar pattern of diurnal periodicity (Meredith 1966; Strandberg 1977).
Sporulation is favoured by high relative humidity and dew, conditions that are frequently
present during the night (Cohen and Rotem 1987). However, very few spores are released
at night due to the generally low wind speed and the surface-tension effect of dew
(Meredith 1966). It has been postulated that the rapid reduction in relative humidity and
evaporation of dew that generally occurs in the morning causes hygroscopic movements
that weaken the points of spore attachment. As temperature and wind speed increase,
mature spores are released (Meredith 1966). This explains the large number of airborne
spores captured in the early hours of the day within the Holland Marsh.
In conclusion, SLB developed on onion at the Holland Marsh when abundant conidia
coincided with warm temperatures (≥ 15 °C) and moderately wet conditions. The first
symptoms were observed on onion at the 4–6 leaf stage. Small tan to light brown, oval to
oblong lesions were observed first on the oldest leaves. As the disease progressed, the
older leaves senesced and served as sources of secondary inoculum for subsequent
infection.

69
CHAPTER THREE
SUSCEPTIBILTY OF ONION CULTIVARS TO ISOLATES OF STEMPHYLIUM
VESICARIUM
3.1 Introduction
Stemphylium vesicarium, cause of stemphylium leaf blight (SLB), is a widely
distributed fungal pathogen of Allium crops (Basallote-Ureba et al. 1999; Suheri and
Price 2001; Misawa and Yasuoka 2012), asparagus (Falloon 1987) and pear (Montesinos
and Vilardell 1992). SLB can cause up to 90% yield loss on onion (Tomaz and Lima
1988; Hassan et al. 2007), and is one of the most destructive diseases on onion crops in
Ontario. On Allium crops, conidia are the primary inoculum, but the role of ascospores is
unclear (Prados-Ligero et al. 2003; Misawa and Yasuoka 2012).
Infection of onion leaves by S. vesicarium occurs mainly through stomatal
openings and wounds. Infection is favoured by temperatures between 18–25 °C and leaf
wetness lasting 6 h or more (Montesinos et al. 1995a; Prados-Ligero et al. 1998). Shortly
after infection, the pathogen initiates production of toxins that cause ultra-structural
changes in the cells of susceptible hosts. These changes weaken host tissues, resulting in
extensive necrosis (Singh et al. 1999, 2000).
Latent (asymptomatic) infection by S. vesicarium can develop in susceptible host
tissues and in several alternative hosts (Köhl et al. 2009b; Misawa and Yasuoka 2012).
On Allium crops, visual symptoms of infections are usually observed 6–14 days after
inoculation (Shishkoff and Lorbeer 1989; Prados-Ligero et al. 1998; Suheri and Price
2000; Misawa and Yasuoka 2012). The initial symptoms on onion leaves consist of
small, yellow to tan, water-soaked lesions that turn dark brown as the pathogen begins to

70
sporulate (Basallote et al. 1993). As the disease progresses, infected leaves undergo rapid
necrosis from the tip down. This leads to desiccation of leaves and early dying of the crop
(Rao and Pavgi 1975).
Host resistance can provide effective management of S. vesicarium. For example,
there are resistant lines of garlic (Mishra et al. 2009) and Welsh onion (Pathak et al.
2001). All common onion lines screened in a previous study were susceptible to SLB
(Pathak et al. 2001). However, observations in onion cultivar trials at the Muck Crop
Research Station (MCRS), Holland Marsh, Ontario indicated that there may be
differences in the susceptibility of onion cultivars to SLB (McDonald and Vander Kooi
2014a). In pear, cultivars differed in susceptibility based on their reaction to toxins
produced by the pathogen (Singh et al. 2000; Wolpert et al. 2002). Identifying cultivars
with lower susceptibility to SLB would be useful for managing SLB.
In some cases, the toxins produced by S. vesicarium are highly specific. For
example, toxins from isolates collected on European pear were not pathogenic on
Japanese pear cultivars, onion or asparagus (Singh et al. 1999, 2000). In contrast, isolates
from parsley were pathogenic on carrot, celery and wounded pear fruit (Koike et al.
2013) and isolates from onion, garlic and asparagus in Spain produced disease on all
three hosts (Basallote-Ureba et al. 1999). The host specificity of S. vesicarium on onion
in Canada is not known.
The objectives of this study were to confirm the pathogenicity of isolates of
S. vesicarium from onion and asparagus on onion, and to assess the susceptibility of
commercial onion cultivars to selected isolates of S. vesicarium.
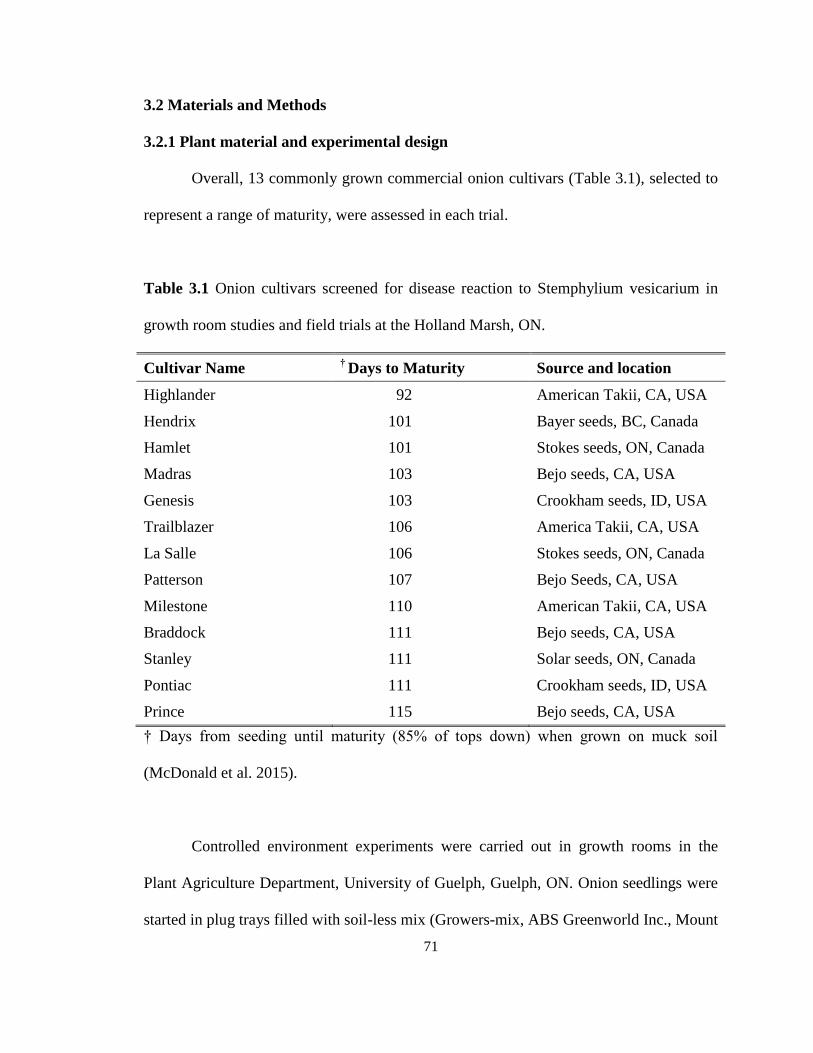
71
3.2 Materials and Methods
3.2.1 Plant material and experimental design
Overall, 13 commonly grown commercial onion cultivars (Table 3.1), selected to
represent a range of maturity, were assessed in each trial.
Table 3.1 Onion cultivars screened for disease reaction to Stemphylium vesicarium in
growth room studies and field trials at the Holland Marsh, ON.
Cultivar Name † Days to Maturity Source and location
Highlander 92 American Takii, CA, USA
Hendrix 101 Bayer seeds, BC, Canada
Hamlet 101 Stokes seeds, ON, Canada
Madras 103 Bejo seeds, CA, USA
Genesis 103 Crookham seeds, ID, USA
Trailblazer 106 America Takii, CA, USA
La Salle 106 Stokes seeds, ON, Canada
Patterson 107 Bejo Seeds, CA, USA
Milestone 110 American Takii, CA, USA
Braddock 111 Bejo seeds, CA, USA
Stanley 111 Solar seeds, ON, Canada
Pontiac 111 Crookham seeds, ID, USA
Prince 115 Bejo seeds, CA, USA
† Days from seeding until maturity (85% of tops down) when grown on muck soil
(McDonald et al. 2015).
Controlled environment experiments were carried out in growth rooms in the
Plant Agriculture Department, University of Guelph, Guelph, ON. Onion seedlings were
started in plug trays filled with soil-less mix (Growers-mix, ABS Greenworld Inc., Mount

72
Elgin, ON). Seedlings of each of the cultivars emerged 10-14 days after planting (DAP).
The leaves of the emerged onions were trimmed at 30 DAP, following commercial
practice, to stimulate development of additional roots and a firmer pseudostem for ease of
transplanting. The seedlings were transplanted (two plants per plug) at 44 DAP into 1.5-L
pots filled with soil-less mix (Sunshine ProMix BX, Sun Gro Horticulture Canada Ltd,
Agawam, MA.). Each experiment assessed the interaction of 12 onion cultivars and five
isolates of S. vesicarium (Table 3.2), plus mock-inoculated onion plants as checks. Three
isolates were from onion in Ontario, one from onion in Nova Scotia and one from
asparagus in Ontario. Each experimental unit consisted of two onion plants, arranged in a
randomized complete block factorial design with four blocks.
Table 3.2 Source of the isolates of Stemphylium vesicarium screened for pathogenicity
and aggressiveness on onion under controlled conditions.
Name Year Collection location Crop Collector
OO55 2014 MCRS, Holland Marsh, ON Onion S. Tayviah
OO54 2014 Simcoe Research Station, Simcoe, ON Onion S. Tayviah
OO27 2013 Marshland Gardens, Holland Marsh, ON Onion J.M. Foster
NO36 2013 AAFC, NS Onion P. Hildebrand
OA46 2013 Millennium Seed Field, Dundas, ON Asparagus J.M. Foster
The isolates of S. vesicarium from Ontario were collected from naturally infected
onion leaves and asparagus spears. Infected tissues were cut into small pieces and
thoroughly washed with tap water, surface sterilized with 75% ethanol for 2 min and 2%
sodium hypochlorite for 2 min, rinsed several times with sterile deionized water and dried
between layers of sterile filter paper. The samples were placed onto potato dextrose agar

73
(PDA) (Difco, Becton Dickinson, and Co., Sparks, MO) and incubated on a laboratory
bench at room temperature (20–23 °C) and ambient light intensity.
The resulting fungal colonies (Fig. 3.1) were purified using hyphal tip isolation.
Identification of isolates of S. vesicarium was based on the morphological characteristics
of conidia and conidiophores (Simmons 1969) and were confirmed by PCR and
sequencing, as described below.
Figure 3.1 Cultures of the five isolates of Stemphylium vesicarium screened for
pathogenicity and aggressiveness on onion in a growth room study.
Actively growing mycelia of the isolates were transferred onto V8-agar medium,
consisting of 200 mL of V8 juice (Campbell Soup Co., Etobicoke, ON), 3 g calcium
carbonate, 20 g agar, and 800 mL deionized water. After 4 to 6 days, when the colony
reached about 5 cm in diameter, the mycelium was matted down by placing 10 drops of
sterile water on the mycelia and flattening the aerial mycelium with a sterile glass rod.
The treated colonies were incubated under UV light (Westinghouse Lamps, McNulty,

74
PA) for 12 hr at room temperature to stimulate production of conidiophores, followed by
12 hr darkness to induce conidia production.
Field experiments were conducted in 2015 and 2016. All field experiments were
arranged as a randomized complete block design with four replicates. Each experimental
unit (plot) consisted of a 1.6 × 5.0 m bed with four rows of onion and 0.4 m between
rows.
In 2015, onion seedlings were started in plug trays with soil-less mix (Growers-
mix, ABS Greenworld Inc., Canada) on 30 March. Seedlings emerged within 10-14 days
DAP. The seedling leaves were trimmed at 25 DAP and 45 DAP. The seedlings (2-3
seedlings per transplant plug) were transplanted manually into organic soil (organic
matter ≈ 62%, pH ≈ 7.2) at the Jane Street research site of the MCRS on 25 May (57
DAP). In 2016, the onion crop was direct seeded at about 35 seeds m-1
into organic soil
(organic matter ≈ 71%, pH ≈ 5.7) on 4 May using a custom-built double-row precision
seeder. The seeds emerged 10–14 DAP. Seed of cv. Madras was not available in 2016, so
it was replaced with cv. Braddock.
In 2015, the herbicide flumioxazin (Chateau®, Valent Corporation, Guelph, ON.)
was applied, following label recommendation, to control weeds at the 4-6 leaf stage of
the onion crop, 45 days after transplanting (DAT). In 2016, bromoxynil (Pardner®, Bayer
Crop Science Inc., Mississauga, ON.) was applied at 2-3 leaf stage at 39 DAP and
repeated at the 5–6 leaf stage at 56 DAP to control weeds. Subsequent weed control was
done by hand until maturity. In 2015, chlorpyrifos insecticide (Pyrinex™, Adama
Agricultural Solutions Canada Ltd., Winnipeg, MB.) was applied at 45 days after seeding

75
to manage onion maggot as recommended by the IPM program. In 2016, there was no
need to spray again onion maggot as per the IPM recommendations.
3.2.2 Molecular confirmation
The isolates of S. vesicarium were cultured on PDA for 3 days at room
temperature and light intensity. Then a piece of the actively growing mycelium tip was
transferred into a sterile flask containing 500 mL potato dextrose broth media (Difco,
Becton Dickinson, and Co., Sparks, MO). After 24 h, the inoculated flask was transferred
unto an orbital shaker (ThermoFisher Inc., Marietta, OH) at 90 rpm. After 7 days of
continuous shaking, the mycelial mats formed were collected by filtering through sterile
cheesecloth and transferred to sterile plastic tubes. The mycelial mats were flash frozen
with liquid nitrogen and stored at -83 °C. DNA was extracted from the mycelia of each
isolate using the PowerSoil® DNA isolation kit (MO BIO Laboratories, Carlsbad, CA)
according to the manufacturer’s protocol. DNA samples were stored at -20 °C.
The specific primers f5’-ATATCAAAGCTAACCGCGTCTCAC-3' and r5’
GCAGAGATGACAACCTTCTTGG-3' were designed to amplify a region of the
glyceraldehyde-3-phosphate dehydrogenase (gpd) gene of S. vesicarium. The PCR
reaction was performed in a total volume of 15 μL containing 1x PCR buffer (50 mM
Tris-HCl, pH 8.5); 2.5 mM MgSO4; 0.2 mM dNTP; 0.5 μM of each primer separately;
0.6 U Tag DNA polymerase (Biobasic, Scarborough, ON); and 1 μL DNA template.
Amplifications were performed in a MyCycler thermal cycler (Bio-Rad Laboratories Inc.,
Mississauga, ON.). The PCR program consisted of an initial denaturation at 95 °C for 2

76
min, followed by 35 cycles of denaturation at 95 °C for 30 sec, annealing at 58 °C for 40
sec and extension at 72 °C for 40 sec. The final extension was at 72 °C for 4 min.
Amplicons were resolved by horizontal gel electrophoresis in 1.5% agarose gels
in 0.5 × Tris-borate-EDTA (TBE) buffers at 100 V cm−1
for 45 min. Gels were pre-
stained with ethidium bromide (0.5 μg mL−1
), and digitally visualized and photographed
on a Gel Doc-lt™ Imaging System (UVP-LLC, Upland, ON). DNA from a confirmed
isolate of S. vesicarium was run as the positive control and DNA-free sterile water and
DNA of Alternaria porri was used as negative controls. Pure cultures of the isolates were
also submitted to the University of Guelph Agriculture and Food laboratory for
sequencing.
3.2.3 Pathogenicity test and inoculation
The isolates were induced to sporulate on V8-agar media, as described above. The
conidia were collected by flooding the colony with 10 mL sterile water and gently
dislodging the conidia by scraping the colony surface with a sterile microscope slide. The
suspension was filtered through layers of sterile cheesecloth to remove mycelial
fragments. The concentration of conidia was determined using a hemocytometer and
adjusted to ≈ 2×10⁶ conidia mL
-1. A drop of the non-ionic surfactant Tween 20 (J.T
Baker Inc., Philipsburg, NJ) was added to every 10 ml of conidial suspension to disperse
the conidia within the suspension.
The leaves of onion plants at the 4-leaf stage (74 DAP) were rubbed gently with
sterile cheesecloth to remove wax and create tiny wounds. The onion plants were
inoculated with the conidial suspension by spraying to run-off with an Optimus® hand

77
atomizer (Home Depot, Guelph, ON.). Control plants were rubbed gently and sprayed
with sterile water plus Tween 20 solution. After inoculation, the plants were placed in
moist chambers for 72 h at high humidity (≥ 96%) to promote conidial germination and
infection. The plants were misted with water every 12 h to increase the humidity and
maintain leaf wetness. The temperature and relative humidity were recorded using an
Enviro-Meter™ (Fisher Scientific, Austin, TX). The plants were then moved to a growth
room at 60-70% RH, 18-23 °C and 16-hr photoperiod for disease development and
assessment. After inoculation, the onion plants were irrigated from the bottom to avoid
splashing of inoculum.
3.2.4 SLB assessment and yield
After inoculation, the onion plants in the growth room study were observed daily
for SLB lesions. Lesions were first observed and assessed at 11 days post-inoculation
(DPI) for the first repetition of the study and at 14 DPI for the second repetition. Lesions
were assessed on the second and third fully developed leaves on each plant, and the mean
number of lesions on the two plants of each experimental unit was calculated. Leaf
dieback on these same two leaves per plant was calculated from measurement of the total
length of the leaf and the length of the dieback. Leaf dieback was first observed and the
assessment was initiated 10 days after initial lesions were recorded, and repeated every 7
days: at 21, 28, 35 and 42 DPI for the first repetition of the study and 24, 31, 38 and 45
DPI the second repetition.
In the field trials, each plot was rated weekly for S. vesicarium lesions. In 2015,
the number of lesions was assessed on one transplant plug at each of eight sites at roughly

78
1-m intervals along the two middle rows, starting 1 m from the end of each row, as
described in Chapter 2. The number of lesions on the first and second fully developed
outer leaves of the two largest seedlings per plug was assessed. In total, 32 leaves per
replicate plot were assessed and the average number of lesions per leaf was calculated. In
2016, lesions were counted on 10 consecutive plants in each of the two middle rows (total
= 40 leaves) as described previously.
SLB incidence in 2015 was assessed by counting the total number of transplant
plugs per plot and the number with blight symptoms. In 2016, 100 plants in the middle
two rows of each plot were assessed.
Leaf dieback was assessed using a 60-cm clear plastic ruler as described
previously. A method similar to the one used for lesion counts was used to identify plants
to assess in both years. It is important to note, however, that the plants selected for leaf
dieback assessments were not the same plants used for lesion counts. Leaf dieback was
assessed on the fifth and sixth fully developed true leaves of each selected plant, and the
mean percentage leaf dieback was calculated for each plot.
In field trials, the initial SLB lesions per leaf were assessed on 29 June in 2015
and 7 July in 2016. In 2015, leaf dieback was observed 21 days after the observation of
initial symptoms. Leaf dieback for each cultivar was assessed on 20 July, 27 July, 04
August and 14 August. In 2016, leaf dieback was observed 12 days after lesions were
first observed and assessed on 19 July, 25 July, 3 August and 11 August.
The onion plants in two 2.3-m-long sections of the middle two rows of each plot
were pulled up by hand at harvest on 10 September, 2015 and 6 September 2016. They

79
were placed in windrows to cure for 2 weeks prior to yield assessment, then topped and
stored at 20–23 °C until yield assessment.
Yield was assessed on 21 October 2015 and 22 September 2016. Onion bulbs
were graded and weighed according to diameter: as jumbo (> 76 mm), medium (45–76
mm) and small (< 45 mm). Jumbo and medium onions were grouped as marketable yield.
Small, damaged or sprouting bulbs were culled. The percentage of bulb size distribution
and weight, the percentage marketable yield and the marketable yield (t ha-1
) were
calculated. In 2016, disease and yield were not assessed on Pontiac due to poor seedling
establishment.
3.2.5 Data analysis
All statistical analyses were conducted using SAS v.9.4 (SAS Institute Inc., Cary,
NC). Mixed model analysis of variance was used to assess the disease and yield data
(PROC GLM and PROC Mixed). No outliers were identified using Lund’s test. The
normality of each data set was assessed using PROC UNIVARIANT. A logarithm
transformation was applied to the growth room data to improve the fit to a normal
distribution, and back-transformed data are presented. Growth room data were pooled
across repetitions when analysis showed no repetition x treatment interaction. The
variance of the growth room data was partitioned into random effects (block and
repetition) and fixed effects (cultivar, inoculum and cultivar × inoculum). Pearson’s rank
correlation in PROC CORR at P < 0.05 was used for correlations between the mean
number of lesions per leaf and the mean percentage leaf dieback for the growth room
study. Field data were analysed separately for the individual years. Field data were not

80
pooled across years as the analysis showed a repetition (year) x treatment interaction.
Variance in the field trial data was partitioned into random effects (block) and fixed
effects (cultivar). Means were separated using Tukey’s multiple range test (α = 0.05).
Spearman’s rank correlation in PROC CORR at P < 0.05 was used for field correlations.
A nonparametric test was chosen because the field data were not normally distributed.
3.3 Results
3.3.1 Identification, sporulation and pathogenicity
All five isolates were identified as S. vesicarium, based on conidial morphology
(Fig. 3.2). The conidia were oblong in shape, and ranged from 19-23 × 22-46 µm. The
conidia of isolates OO27 and OA46 were slightly larger than the other isolates, based on
visual observation but not specific measurement. Isolates OO46 sporulated on V8 media
even without UV light stimulation. The mean number of spores collected per colony
(Petri dish) was 1 × 10⁴ conidia mL
-1 for each isolate, except NO35, where spore
recovery was only 1 × 10² conidia mL
-1. For inoculation, the spore suspension for each
isolate was concentrated to ≈ 2×10⁶ by washing off spores from more colonies.
Molecular analysis and DNA sequencing confirmed that each isolate was
S. vesicarium. Each isolate reacted with species-specific primers in PCR (Fig. 3.3), and
the similarity of each isolate was greater than 99.6% to a gene accession previously
identified as S. vesicarium (Submission number: 16-091062) based on 16s rRNA
sequences (BLAST, Genbank. National Center for Biotechnology Information
(http://blast.ncbi.nlm.nih.gov/Blast).

81
Figure 3.2 Conidia of the five Stemphylium vesicarium isolates assessed in a growth
room study of pathogenicity and aggressiveness on onion.
Figure 3.3 Image of gel of the reaction of PCR products with a DNA probe from
different isolates of Stemphylium vesicarium (OO55, OO54, OO27, OO31, NO35 and
OA45).
Each isolate produced lesions when inoculated onto onion plants and
S. vesicarium was re-isolated from lesions caused by each isolate. The lesions caused by
isolate OA46 were larger than those produced by the other isolates. No sporulation was
observed on inoculated plants and there were no lesions on mock inoculated plants.

82
3.3.2 SLB assessment
In the controlled environment studies, the first lesions of S. vesicarium were
observed on onion leaves at 9–14 DPI. There were differences among isolates in relation
to the number of lesions per leaf. The lowest number of lesions per leaf was recorded on
plants inoculated with isolates NO35 and OO54, and the highest numbers developed on
plants inoculated with isolates OO27 and OA46 (Table 3.3). The mock-inoculated plants
did not develop SLB symptoms in either repetition.
There were also differences among isolates in relation to leaf dieback. The lowest
dieback was recorded on plants inoculated with isolates NO35 and OA46, and the highest
with isolate OO27 (Table 3.3).
Table 3.3 Lesions per leaf and leaf dieback (%) assessed on onion inoculated with five
isolates of Stemphylium vesicarium under controlled conditions.
Isolate Lesion per leaf 1 Leaf dieback (%)
1
NO35 5 d 2 20 c
OA46 13 ab 21 c
OO54 7 cd 28 b
OO55 9 bc 30 b
OO27 14 a 52 a
1 Data were log transformed for analysis, and back-transformed for presentation.
2 Means in a column followed by the same letter do not differ using Tukey’s multiple
range test at P = 05, based on pooled data from two repetitions.
There were no differences in the number of lesion per leaf assessed on all the
onion cultivars assessed except of the number of lesion per leaf assessed on cv. Pontiac

83
compared to cv. Patterson (Table 3.4). Onion cv. Pontiac developed, numerically, the
lowest number of lesions per leaf. However, this was not significantly different from the
other cultivars except for Patterson, which numerically had the highest number. There
were also differences in leaf dieback on the cultivars; Pontiac had the lowest dieback and
Highlander had the highest (Table 3.4).
SLB incidence in the field trials was higher in 2015 compared to 2016 (Fig. 3.4).
In 2015, Pontiac had the numerically lowest incidence (74%), but this was only
significantly lower than Milestone (96%), La Salle (95%), and Trailblazer (93%) (Fig.
3.4). In 2016, Braddock replaced Madras because the seed of Madras was not available,
and Pontiac was not assessed due to poor germination. In 2016, Hendrix (20%), Patterson
(24%) and La Salle (25%) had the lowest incidence (numerical) but this was only
significantly lower than Milestone (39%) (Fig. 3.4).
In the field trials, the number of lesions per leaf in 2015 was slightly higher
compared to 2016 (Fig. 3.5). There were differences in the initial number of lesions per
leaf for the cultivars between the two years. In 2015, Pontiac had the lowest number of
lesions per leaf but this was only different from LaSalle and Milestone. In 2016, Hendrix,
Highlander and Prince had the lowest number of lesions per leaf, lower than Milestone
and Trailblazer (Fig. 3.5).

84
Table 3.4 Lesions per leaf and leaf dieback (%) assessed on onion cultivars inoculated
with Stemphylium vesicarium under controlled conditions.
Cultivar Lesion per leaf 1 Leaf die back (%)
1
Pontiac 7 b 2 16 e
Hendrix 9 ab 23 d
Milestone 10 ab 23 d
LaSalle 8 ab 26 cd
Madras 10 ab 29 bcd
Stanley 7 ab 29 bcd
Genesis 9 ab 31 abcd
Prince 9 ab 31 abcd
Trailblazer 9 ab 32 abcd
Patterson 11 a 33 abc
Hamlet 8 ab 37 ab
Highlander 8 ab 40 a 1
Data were log transformed for analysis and back-transformed for presentation.
2 Means in a column followed by the same letter do not differ using Tukey’s multiple
range test at P > 05, based on pooled data from two repetitions.

85
Figure 3.4 Mean incidence (final assessment) of stemphylium leaf blight on onion
cultivars at the Holland Marsh, ON in 2015 and 2016.
0
b
ab ab ab ab ab ab ab ab a a a
ab ab ab
b
ab b
ab ab ab
b
a
0
10
20
30
40
50
60
70
80
90
100
Inc
ide
nce
(%
)
Cultivars
2015 2016

86
Figure 3.5 Lesions per leaf on onion cultivars screened for susceptibility to stemphylium
leaf blight at the MCRS, Holland Marsh, ON in 2015 and 2016.
Leaf dieback was also higher in 2015 compared to 2016. In 2015, Highlander
(83%) had the highest percentage leaf dieback of all the cultivars except LaSalle (65%).
In 2015, Pontiac (54%) had the numerically lowest leaf dieback. In 2016, Highlander
(32%) again had numerically the highest leaf dieback in comparison to the all cultivars
but this was not significantly different except for Hendrix (17%), which had the
numerically lowest leaf dieback (Fig. 3.6).
c
abc bc abc abc
bc
abc
bc bc abc
ab
a
a
b b b
ab ab
ab ab
a
ab
a
0
1
2
3
4
5
6
7
8
9
10
Les
ion
s p
er
lea
f
Cultivars
2015 2016

87
Figure 3.6 Leaf dieback on onion cultivars caused by stemphylium leaf blight at the
MCRS, Holland Marsh, ON in 2015 and 2016.
In both growth room and field trials, the mean number of SLB lesions was not
correlated with the overall leaf dieback per cultivar. Also, there was no correlation
between leaf dieback and the days to maturity for each cultivar.
Similarly, there was no correlation between the mean number of lesion per leaf
assessed in the growth room studies and in the field trials. However, there was a strong
correlation between the mean percentage leaf dieback assessed in the growth room and in
the field in 2015 (r = 0.68, P = 0.02). In both the growth room and field studies,
Milestone showed high susceptibility to initial SLB lesions and Highlander showed high
susceptibility to leaf dieback.
b b
a
b b b b
b b b
ab
b
ab ab
a
b ab ab
ab ab
ab ab
ab
0
10
20
30
40
50
60
70
80
90
100
Lea
f d
ieb
ac
k (
%)
Cultivars
2015 2016

88
In 2015, there was spray-drift injury caused by flumioxazin herbicide at the 4–6
leaf stage (Fig. 3.7).
Figure 3.7 (A) Herbicide caused by spray-drift of flumioxazin herbicide and (B) the
initial infection and sporulation of Stemphylium vesicarium on herbicide injured onion
leaves in the Holland Marsh, ON, 2015.
3.3.3 Yield
There were no differences in marketable yield in either year, but yield in 2015
was higher compared to 2016. In 2015, cv. Patterson had the numerically highest
marketable yield and Genesis had the lowest yield. There were no differences in the
percentage of jumbo bulbs. Highlander had the numerically highest number of medium
bulbs but this was not significantly different from other cultivars except for Hendrix,

89
which had the numerically lowest number of medium bulbs. Hendrix had a numerically
higher percentage of culls compared to all other cultivars, but this was not different from
other cultivars except for Patterson, Prince, Highlander and Pontiac (Table 3.5).
In 2016, cv. Braddock had the numerically lowest marketable yield and Milestone
had the highest yield. Patterson, Prince, Trailblazer, Hamlet and Highlander had no
jumbo-size bulbs. Hendrix had the numerically highest percentage of jumbo bulbs in
2016 but this was not different from Milestone, Genesis, La Salle, Stanley and Braddock.
La Salle had the numerically highest percentage of medium bulbs and Braddock had the
lowest but these were not significantly different. Patterson had the numerically highest
percentage of culls but was not significantly different from the other cultivars except
Hendrix (Table 3.6). There was no correlation between leaf dieback and yield in either
year (Tables 3.5 and 3.6).
The average number of plants with 2.3 m row was about 46 plants in 2015 and 62
plants in 2016. However, the average number of bulbs harvested was about 43 bulbs per
2.3 m row in 2015 and 32 bulbs in 2016.

90
Table 3.5 Marketable yield and bulb size distribution of onion cultivars evaluated for
stemphylium leaf blight at the MCRS, Holland Marsh, ON, 2015
Cultivar Marketable
yield (t ha-1)
Bulb size distribution (%)
Jumbo
(>76 mm)
Medium
(45-76 mm)
Culls
(<45 mm)
Genesis 46 ns 7 ns 79 ab 15 ab
LaSalle 53 6 79 ab 15 ab
Trailblazer 53 5 84 ab 11 ab
Hendrix 55 5 70 b 26 a
Pontiac 55 8 85 ab 7 b
Madras 56 5 86 ab 8 ab
Milestone 57 10 86 ab 4 b
Stanley 58 11 82 ab 7 b
Hamlet 60 4 88 ab 9 ab
Highlander 63 3 91 a 6 b
Prince 63 6 88 ab 6 b
Patterson 67 9 83 ab 7 b
Numbers in a column followed by the same letter do not differ based on Tukey’s multiple
range test at P > 05, ns = not significant.

91
Table 3.6 Marketable yield and bulb size distribution of onion cultivars evaluated for
stemphylium leaf blight at the MCRS, Holland Marsh, ON, 2016
Cultivar Marketable
yield (tha-1)
Bulb size distribution (%)
Jumbo
(>76 mm)
Medium
(45-76 mm)
Culls
(<45 mm)
Braddock 27 ns 4 ab 68 ns 28 ab
Patterson 28 0 b 71 29 a
Stanley 29 2 ab 74 24 ab
Prince 30 0 b 78 22 ab
Trailblazer 32 0 b 80 20 ab
Hamlet 34 0 b 78 22 ab
LaSalle 35 4 ab 81 15 ab
Highlander 36 0 b 79 21 ab
Hendrix 38 14 a 74 12 b
Genesis 41 7 ab 75 18 ab
Milestone 46 10 ab 73 17 ab
Numbers in a column followed by the same letter do not differ based on Tukey’s multiple
range test at P > 05, ns = not significant
4.4 Discussion
Previous surveys in the Holland Marsh first identified the presence of SLB on
onion in 2008. All of the commercial onion cultivars assessed were susceptible to SLB,
but there were differences in the degree of susceptibility. Studies of five isolates of
S. vesicarium also identified variation in the aggressiveness of the isolates. Variation in
the aggressiveness of isolates has been attributed to differences in the toxins they produce
(Singh et al. 2000). Therefore, the limited variation in susceptibility of onion cultivars to
92
SLB observed in the field trials is likely related to differences in reaction to the toxins
produced by the pathogen population at the Holland Marsh.
Four isolates from SLB lesions on onion and an isolate from asparagus in Ontario
were identified as S. vesicarium based on the morphology of conidia and conidiophores
(Simmons 1969, 1985). This identification was confirmed based on molecular similarity
assessed using BLAST (Câmara et al. 2002; Wang et al. 2010).
Onion cultivars inoculated with S. vesicarium produced lesions after 9-14 days. In
previous studies, lesions developed on Allium crops at 7–14 days after inoculation
(Shishkoff and Lorbeer 1989; Basallote-Ureba et al. 1999; Suheri and Price 2000;
Misawa and Yasuoka 2012). In contrast to earlier reports (Rao and Pavgi 1975; Shishkoff
and Lorbeer 1989; Basallote-Ureba et al. 1999), the lesions in the current study rarely
coalesced. Leaf dieback was observed 10-21 days after the development of initial lesions,
which was similar to the timing of extensive necrosis on infected pear (Pattori et al.
2006).
Each of the five isolates of S. vesicarium was pathogenic on onion, but they
differed in aggressiveness, measured as percentage leaf dieback. This indicated that
S. vesicarium populations from asparagus and onion in Canada were not highly host
specific. This result was similar to a previous study of isolates from garlic, onion and
asparagus (Basallote-Ureba et al. 1999), but differed from some reports of isolates from
European pear (Köhl et al. 2009a; Singh et al. 1999; Pattori et al. 2006). Isolate OO27
from onion was the most aggressive isolate on onion. Isolate OA46 from asparagus
produced larger, more numerous lesions but less leaf dieback compared to isolates NO35,
OO54 and OO55 from onion.

93
All 13 onion cultivars assessed were susceptible to SLB, but there was variation
in the level of susceptibility. There was no correlation between the number of initial SLB
lesions and leaf dieback among the cultivars. This indicates that the reaction of onion
cultivars to infection by conidia might differ from the response to the toxins responsible
for leaf dieback. This is similar to earlier reports on the susceptibility of pear, where the
number of initial necrotic spots often differed from the subsequent rate of disease
progress, which is caused by host-specific toxins (Montesinos et al. 1995; Pattori et al.
2006; Singh et al. 1999).
In the field, SLB incidence and leaf dieback were higher in 2015 compared to
2016. These differences can be attributed to the wet and warm weather conditions and
higher density of airborne conidia in 2015 (see chapter 2). This observation supports
previous reports that the numbers of both conidia and infections on Allium crops were
higher in warm, humid seasons compared to dry seasons (Prados-Ligero et al. 2003;
Misawa and Yasuoka 2012). In 2015, spray-drift injury caused by flumioxazin herbicide
may have also increased the number of initial infections.
Marketable yields of onion in both seasons were not correlated with leaf dieback.
This was in contrast to previous reports (Miller et al. 1978; Lorbeer 1993) and a deviation
from the expectation that increasing the level of leaf dieback would reduce yield. The
differences in yield in this study were more likely associated with cultivar characteristics
(Matimati et al. 2006). Cultivars with lower leaf dieback had a higher proportion of
jumbo-sized onion bulbs. This is consistent with previous studies that increasing levels of
SLB leaf dieback reduced bulb size (Rao and Pavgi 1975). However, the extent of leaf
dieback may have a more substantial effect on yield than the number of initial lesions that

94
develop on a crop. Extensive leaf dieback can result in under-development of bulbs (Rao
and Pavgi 1975). Also, severe desiccation of the green foliage may affect the activity of
maleic hydrazide, which is applied a few weeks before lodging to prevent sprouting in
storage (Brewster 2008).
Onion yield was higher in 2015 compared to 2016. This can be attributed, in part,
to differences in planting methods. Use of a double-row precision seeding planter
maximized the number of onion plants per unit area and contributed to the development
of more uniform-sized medium bulbs (Valk 1988). The use of transplants in 2015
resulted in a lower density of plants per unit area and the development of more jumbo
bulbs in comparison to 2016 (Stoffella 1996). However, the overall harvest in 2015 had
more jumbo bulbs. Also, the average number of bulbs harvested per unit area was lower
in 2016 compared to 2015. This can be attributed to poor emergence in certain cultivars.
To further understand the variation in susceptibility of onion cultivars and
aggressiveness of onion isolates of S. vesicarium Canada, there is the need to conduct in
vitro studies on the effects of toxins of S. vesicarium isolates on onion tissue.The toxins
of S. vesicarium isolates from European pear did not cause necrosis on onion tissues or
Japanese pear cultivars. Furthermore, the toxins from the different pear isolates varied in
the extent of necrosis cause on the host tissues (Singh et al. 1999, 2000). These previous
studies indicated that toxins produced by S. vesicarium may not only be host specific but
location specific as well.
In conclusion, S. vesicarium was confirmed as the causal agent of SLB on onion
in the Holland Marsh. All of the onion cultivars assessed were susceptible to isolates
from onion, as well as an isolate from asparagus. The reaction of onion cultivars to

95
infection versus toxin production differed, as has been demonstrated in pear fruit.
Pontiac, Hendrix and Milestone were relatively less susceptible to leaf dieback compared
to Highlander, La Salle and Trailblazer.

96
CHAPTER FOUR
COMPARISON OF SPRAY TIMING PROGRAMS FOR MANAGEMENT OF
STEMPHYLIUM LEAF BLIGHT OF ONION
4.1 Introduction
The total annual onion (Allium cepa L.) production in Canada is about 200,000
metric tonnes, with a farm-gate value of $74 million (Agriculture and Agri-food Canada
2014). The majority of onions are cultivated in Ontario, Quebec, Nova Scotia, Manitoba
and British Columbia. Ontario ranks as the highest producer, producing approximately
92,000 Mt with a farm-gate value of $34 million (Mailvaganam 2015).
The main challenges with onion cultivation in Ontario are diseases, insects and
adverse weather conditions (Chaput 1995). Stemphylium leaf blight (SLB), caused by
S. vesicarium, is a relatively new disease on onion in Ontario (Paibomesai et al. 2012).
The disease has been observed in onion fields from about the end of June until harvest.
The pathogen also attacks other Allium crops (Basallote 1993; Suheri and Price 2001;
Misawa and Yasuoka 2012), asparagus (Falloon 1987) and pear (Llorente and
Montesinos 2006).
On onion, infection starts as small light yellow to tan water-soaked lesions (Rao
and Pavgi 1975; Miller et al. 1978). The lesions turn brown to dark brown to black as the
pathogen begins to sporulate. Infected leaves die back from the tip (Basallote-Ureba et al.
1999), caused by host-specific toxins produced by S. vesicarium (Singh et al. 2000). This
leads to desiccation of the leaves and early lodging, resulting in underdevelopment of
bulbs (Rao and Pavgi 1975). Infection is favoured by leaf wetness periods lasting 6 h or

97
more and warm temperatures (18–26 °C) (Montesinos et al. 1995b; Prados-Ligero et al.
1998).
The most effective way to manage SLB on onion is regular application of
preventative fungicides (Gupta et al. 2010). However, very few fungicides have been
reported to be effective in the management of SLB. High concentrations of mancozeb,
azoxystrobin, propiconazole and propineb in vitro inhibited S. vesicarium growth (Mishra
and Gupta 2012) but had little to no impact on SLB incidence in the field (Hoepting
2015). In Spain, tebuconazole or procymidone were used to reduce initial infection on
garlic (Basallote-Ureba et al. 1998). Ethylenebisdithiocarbamate (EBDC) is registered to
manage S. vesicarium on asparagus in the USA (Meyer et al. 2000). In Ontario,
fluopyram plus pyrimethanil (group 7 + 9) was recently registered to manage SLB on
onion (Bayer CropScience Inc. Canada 2016).
The detection of S. vesicarium conidia in pear orchards is used in recommending
when to initiate fungicide application (Llorente et al. 2012). Currently, onion growers in
the Holland Marsh apply fungicides when disease is reported in the local area.
Subsequent sprays are applied according to a routine 7-14 day calendar application
method. However, favourable conditions for SLB development are not always present in
the field. Therefore, calendar application of fungicides may not always be economical or
environmentally friendly (Montesinos et al. 1995b; Meyer et al. 2000). Use of spray
timing programs can reduce the number of applications required to manage SLB while
keeping disease levels below economic thresholds (Montesinos and Vilardell 1992;
Meyer et al. 2000).

98
TOMCAST (a modification of FAST – Forecasting for Alternaria solani on
tomato) is a spray timing program for management of septoria leaf spot and anthracnose
on tomato (Pitblado 1992b). TOMCAST uses daily leaf wetness duration and the average
temperature during the wet period to calculate disease severity values (DSV) (Madden
1978). At predetermined DSVs, fungicides are applied and the program is reset (see
chapter 1). The use of TOMCAST DSV 15 for management of purple spot of asparagus
reduced fungicide applications by 60% (Meyer et al. 2000).
BOTCAST (Botrytis forecaster) was developed for management of botrytis leaf
blight on onion. It uses similar weather parameters as TOMCAST but employs different
combinations of temperature and leaf wetness to estimate inoculum availability and
conditions for infection (Sutton et al. 1986). A combination of daily inoculum value and
daily infection value is used in calculating cumulative disease severity values (CDSI).
Fungicide applications are initiated at one of two thresholds; medium risk at 21–30 CDSI,
and high risk of disease at 31–40 CDSI (see chapter 1). In preliminary trials at the Muck
Crop Research Station (MCRS), BOTCAST showed potential to reduce the number of
spray applications for managing SLB (McDonald and Vander Kooi 2014b).
The objective of this research was to evaluate selected spray timing programs for
use in the integrated pest management program for SLB on onion in the Holland Marsh.
The effectiveness of the spray timing programs in reducing SLB severity and increasing
yield was assessed. Also, the costs associated with each spray timing program were
calculated and compared.

99
4.2 Materials and Methods
4.2.1 Plant material and plot layout
The trial was carried out at two sites with a history of SLB. In 2015, the trial was
conducted at the Jane Street research site of the MCRS on an organic soil (organic matter
≈ 62%, pH 7.2). In 2016, the trial was conducted at the MCRS on an organic soil (organic
matter ≈ 71%, pH 5.7). In both years, onion cv. LaSalle (Stokes Seeds, Thorold, ON) was
used because it was shown to be susceptible to SLB in preliminary trials.
In 2015, onion transplants (3 seeds per plug) were transplanted on 25 May, using
a mechanical transplanter. There were four rows per bed. The beds were 42 cm apart,
rows were 40 cm apart and the plugs were 10 cm apart within the row. In 2016, the crop
was direct seeded (≈ 35 seeds m-1
) on 4 May using a Stanhay precision seeder. There
were four double rows per bed, with 40 cm between rows, and the plants were
approximately 7.5 cm apart within the row. The seedlings emerged 10-12 days after
planting (DAP).
Flumioxazin (Chateau®, Valent Corporation, Guelph, ON.) was applied
following label recommendations to control weeds at the 4-6 onion leaf stage, 45 days
after transplanting (DAT) in 2015. Onion maggots were managed using chlorpyrifos
(Pyrinex™, Adama Agricultural Solutions Canada Ltd., Winnipeg, MB.) 45 days after
seeding following label recommendation. In 2016, bromoxynil (Pardner®, Bayer Crop
Science Inc., Mississauga, ON.) was applied at the 2-3 leaf stage at 39 DAP and repeated
at the 5–6 leaf stage at 56 DAP to control weeds. Weeds were removed by hand
throughout the rest of the growing season until maturity.

100
4.2.2 Experimental design and treatments
The experiment was designed as a randomized complete block design with four
replicates. Each experimental unit (plot) consisted of two beds of onion, each 1.6 × 5.0 m.
There were six treatments, including the non-sprayed check, which are described in Table
4.1. Two treatments were consistent in the two years, BOTCAST, and TOMCAST with a
DSV of 15. Some fungicide treatments in 2016 were modified based on the results of the
2015 trials.
In 2015, fluopyram plus pyrimethanil (Luna Tranquility®, Bayer Crop Science
Inc. Calgary, AB) was applied for each spray. This product showed the greatest SLB
reduction in preliminary studies (McDonald and Vander Kooi 2014b). In 2016, mancozeb
(Dithane™, Dow Agro Sciences, Calgary, AB) was applied as an initial protective spray
in all spray timing treatments, followed by subsequent applications of fluopyram plus
pyrimethanil. Fungicides were applied with a custom-built, tractor-mounted sprayer,
fitted with air induction, flat spray tips (model: AI9503 EVS, AI TeeJet, IL) at 275 kPa
calibrated to deliver 500 L/ha. Fluopyram plus pyrimethanil was applied at a rate of 0.15
kg fluopyram plus 0.45 kg pyrimethanil ha-1
and mancozeb at 2.44 kg ha-1
.

101
Table 4. 1 Fungicide spray-timing programs tested for management of stemphylium leaf blight on onion cv. La Salle grown at
MCRS, Holland Marsh, ON in 2015 and 2016.
Treatment Description
Both 2015 and 2016
BOTCAST The first fungicide application was made when the program accumulated 21 CDSI (lower
threshold). Subsequent applications made every 7-14 days (Sutton et al. 1986).
TOMCAST 15 The first application at 15 DSV. Subsequent applications every 15 DSV accumulations
(Pitblado 1992a).
Control (No
sprays) No fungicide application.
2015 only
STEMCAST A modification of BOTCAST with conditions favourable for the S. vesicarium infections.
The first spray applied at 21 CDSI. Subsequent sprays applied every 7–14 days.
Conidia plus
phenology (CP1)
The first spray was applied when conidia were present and onions had fully developed
enough foliage (≈3 true leaves) to receive fungicide application. Subsequent sprays applied
every 7-14 days.
Local disease
report
Routine 7–14 calendar application, with the first spray applied after the first report of SLB in the
Holland Marsh.
2016 only
TOMCAST 15/25 Initial spray was applied at 15 DSV. Subsequent sprays were applied after every 25 DSV
accumulations.
TOMCAST 15/R Initial spray was applied at 15 DSV. Subsequent sprays were applied at every 15 DSV
accumulation if there was rainfall predicted in the next 24 h.
Conidia plus
phenology (CP2)
First spray applied when conidia were detected and onions had fully developed 4–6 true leaves.
Subsequent sprays applied every 7-14 days.

102
4.2.3 Weather data
Hourly meteorological data on temperature (°C), leaf wetness duration (h) and
rainfall (mm) were collected throughout the growing season. In 2015, data were collected
from 25 May (transplanting date) to 15 August. In 2016, data were collected from 14
May (emergence) to 20 August. All weather variables were recorded using an Onset®
HOBO® automatic weather station (Onset Corporation, Bourne, MA). Hourly data on
temperature were recorded with a temperature/RH sensor (Model: S-THB-M00x). Two
leaf-wetness sensors (Model: S-LWAM003) were installed in the plot to measure leaf
wetness. These sensors did not require any painting or coating. Each sensor was placed
upright to simulate the orientation of an onion leaf. Regular visual checks for moisture on
onion leaves were compared to the values from the two sensors. The values from the
sensor identified as more sensitive and accurate were used to calculate leaf wetness
duration (LWD). A tipping gauge rain gauge smart sensor (Model: S-RGB-M002) was
used to record hourly rainfall.
4.2.4 SLB assessment
Plots were observed weekly for SLB lesions, as described previously. Initially, the
number of lesions was counted and SLB incidence was recorded. Later, percentage leaf
dieback was measured as the percentage of necrotic or chlorotic length of the leaf
compared to the total leaf length. Lesions were counted on the first and second fully
developed true leaves in both years as described previously (see chapter 3). In 2015, 32
leaves per bed (four leaves per plug) were assessed and 40 leaves per bed were assessed

103
in 2016. Lesions were first observed and assessed on 2 July in 2015 and 11 July in 2016.
In 2015, all of the plugs in each bed were assessed to determine SLB incidence. In 2016,
100 plants in the center of each bed were assessed. In 2015, SLB incidence was assessed
on 2, 9, 16 and 31 July. In 2016, incidence was assessed on 11, 19, 25 July and 9 August.
Leaf dieback was measured on the fifth and sixth fully developed true leaves on 32 leaves
in 2015 and 40 leaves in 2016, as described previously (see chapter 3). In 2015, leaf
dieback was measured on 23, 31 July, 6 August and 13 August. The area under the
disease progress curve (AUDPC) was calculated for disease incidence and leaf dieback as
follows:
∑(
)
( )
Where Yi and Yn are assessments at the first and last observations, respectively, and t1,
t2, tn-1, and tn are the times of the first, second, penultimate, and last observations, D is
the number of days of total observation and n is the number of observations. AUDPC was
standardized to sAUDPC (standard AUDPC per day) (Simko and Piepho 2012).
4.2.5 Yield assessment
The plots were harvested on 10 September, 2015 and 6 September, 2016. All of
the plants from two 2.3-m lengths of two rows from each replicate were pulled,
windrowed and cured for 1 to 2 weeks, then topped and stored at 20–23 °C until the yield
assessments were complete. Yield assessment was done on 21 October, 2015 and 20
104
September, 2016. The onion bulbs were graded according to size (diameter) as jumbo (>
76 mm), medium (45–64 mm) and small (< 45 mm). Jumbo and medium onions were
considered as marketable yield. Small onions, damaged bulbs and sprouting onions were
considered culls. The percentage of bulb size distribution and weight, the percentage
marketable yield, and the marketable yield (t/ha) were calculated.
4.2.6 Data analysis
Statistical analyses were conducted using SAS v.9.4 (SAS Institute Inc., Cary,
NC). Disease and yield assessment were analyzed using a mixed model analysis of
variance (ANOVA) in PROC MIXED. The Shapiro-Wilk test was used to test the
normality of residuals and distribution of error was assessed using residual plots. The
data were normally distributed. The data were checked for outliers using Lund’s test and
no outliers were identified. Variance was partitioned into random (block) effects and
fixed (treatment) effects and mean separation was conducted using Tukey’s multiple
range test (α = 0.05). Spearman’s correlations were conducted between leaf dieback and
yield using PROC CORR.
4.3 Results
4.3.1 Weather assessment
There were 25 days with rainfall in 120 seasonal days 2015 compared to 20 in
139 seasonal days 2016. June was the wettest month in 2015, whereas July was wettest in
2016. Overall, higher temperatures were recorded in 2016. In both years, the highest

105
temperature ranges were recorded in July. Monthly LWD ranges were similar in both
years (Table 4.2). On rainy days, LWD could last up to 24 h.
Table 4.2 Monthly weather variables recorded during the onion production season at the
Holland Marsh, ON in 2015 and 2016.
Weather variable May June July August
2015
Rainy days (days) a 4 12 2 7
Daily temp (˚C) 8–24 12–21 16–25 15–25
Daily LWD (h) 0–18 1–20 0–20 5–18
2016
Rainy days a 5 5 7 3
Daily temp. (˚C) 3–25 10–26 15–28 19–27
Daily LWD (h) 0–22 0–22 0 -24 524 a Number of days with total rainfall ≥ 2 mm
4.3.2 SLB assessment
In 2015, the numbers of lesions per leaf in the CP1 and TOMCAST 15 treatments
were slightly lower than in the other treatments. In 2016, there were no differences in the
number of lesions per leaf (Table 4.3). SLB incidence was higher in 2015 in comparison
to 2016 (Table 4.3). In 2015, the lowest AUDPC for incidence occurred in the CP1 and
TOMCAST 15 treatments. The highest overall incidence occurred in the unsprayed
control, which did not differ from the sprayed treatments. In 2016, the AUDPC for
incidence in the unsprayed control was higher than in any of the treatments that received
fungicides, except for TOMCAST 15/R, which was intermediate (Table 4.3).

106
In 2015, AUDPC for leaf dieback was higher in the unsprayed control than in any
of the treatments that receive fungicides. In 2016, there were no differences in the
AUDPC for leaf dieback. There was no correlation between the number of SLB lesions
and AUDPC for leaf dieback in 2015 (r = 0.27, P > 0.19) or 2016 (r = 0.39, P > 0.06).
Table 4.3 Lesion counts, overall incidence and overall severity of SLB on onion sprayed
following selected spray-timing programs at the Holland Marsh, ON in 2015 and 2016.
Timing program Incidence (AUDPC) Lesions per leaf Leaf dieback (AUDPC)
2015
CP1 63 c 4 a 26 b
TOMCAST 15 68 bc 4 a 25 b
BOTCAST 79 ab 7 b 26 b
STEMCAST 80 ab 7 b 31 b
Local disease report 86 a 7 b 29 b
Control 92 a 7 b 47 a
2016
CP2 10 b 3 ns 17 ns
TOMCAST 15 6 b 1 15
TOMCAST 15/25 9 b 1 14
TOMCAST 15/R 14 ab 3 16
BOTCAST 10 b 1 16
Control 22 a 4 26
1Numbers in a column followed by the same letter do not differ based on Tukey’s
multiple range test at P = 05. ns = not significant.

107
4.3.3 Fungicide Applications
Airborne conidia were trapped prior to crop establishment in both years, with the
first capture on 23 May in 2015 and 28 April in 2016. In 2015, the CP1 treatment
recommended sprays starting at 19 DAT (2-3 leaf stage). In 2016, the CP2 treatment
recommended sprays starting at 54 DAP (4-6 leaf stage). In 2015, CP1 received 10
fungicide applications, but CP2 received only four applications in 2016, (Table 4.4).
In 2015, TOMCAST 15 also recommended early fungicide application. The
model recommended six fungicide applications in 2015, starting at 19 DAT. In 2016,
TOMCAST 15, TOMCAST 15/25 and TOMCAST 15/R recommended the first
fungicide application at 56 DAP. TOMCAST 15 recommended five applications and
TOMCAST 15/25 and TOMCAST 15/R recommended three applications (Table 4.4).
1n 2015, BOTCAST recommended the first fungicide application at 40 DAT.
STEMCAST recommended the first fungicide application at 41 DAT, coinciding with
first local report of SLB in commercial fields. In 2015, BOTCAST, STEMCAST and
local disease report treatments recommended eight sprays each. In 2016, BOTCAST
recommended only three applications (Table 4.4).

108
Table 4.4 Application dates, number of applications and cost of fungicide based on spray
timing treatments to manage SLB on onion in the Holland Marsh, ON in 2015 and 2016
Timing program Spray dates No. sprays Cost($)
2015
CP1 13, 19, 28 June; 8, 15, 22, 29 July;
5, 12, 19 August 10 $1300
BOTCAST 28 June; 8, 15, 22, 29 July; 5, 12,
19 August. 8 $1064
STEMCAST 29 June, 8, 15, 22, 29 July; 5, 12,
19 August 8 $1064
Local disease
report
29 June; 8, 15, 22, 29 July; 5, 12,
19 August 8 $1064
TOMCAST 15 13, 30 June; 14, 26 July; 4, 12
August. 6 $798
Control Not sprayed 0 0
2016
TOMCAST 15 26 June; 8, 21, 28 July; 6 August 5 $740
CP2 24 June; 8, 21 July; 4 August 4 $592
BOTCAST 5, 21 July; 4 August. 3 $444
TOMCAST 15/25 26 June; 19 July; 4 August. 3 $444
TOMCAST 15/R 26 June; 8, 24 July 3 $444
Control Not sprayed 0 0
4.3.4 Yield
There were no differences in the overall yield or bulb-size distribution in either
year. Yield was substantially lower in 2016 compared to 2015 (Table 4.5). There was no
correlation between yield and tip dieback in 2015 (r = 0.14, P > 0.50) or 2016 (r = 0.004,
P > 0.90).

109
Table 4.5 Marketable yield and bulb size distribution of onion cv. La Salle following
selected spray-timing programs at the Holland Marsh, ON in 2015 and 2016.
Spray timing
Marketable yield
(t/ha)
Bulb size distribution (%)
Jumbo Medium Cull
2015
STEMCAST 46 ns 28 ns 67 ns 5 ns
BOTCAST 45 27 66 7
CP1 45 32 60 8
TOMCAST 15 44 25 66 9
Control 42 23 74 3
Local disease report 40 23 70 7
2016
TOMCAST15R 26 ns 1 ns 62 ns 37 ns
CP2 25 1 68 31
TOMCAST 15 25 1 57 42
BOTCAST 25 0 69 31
TOMCAST 1525 22 1 61 38
Control 20 1 64 35 1Means in a column followed by the same letter do not differ based on Tukey’s multiple
range test at P = 0.05. ns = not significant.
4.4 Discussion
Disease pressure was higher in 2015 compared to 2016. In both years, there were
very little to no differences in SLB incidence and severity among sprayed and unsprayed
onion, so the unsprayed control provided the highest economic returns. It can be
concluded that fungicide applications after initial infection had occurred may have been
unnecessary. Also, it is unclear whether the fungicides used in this study are effective in
110
controlling SLB on onion. Under high disease pressure, TOMCAST 15 provided a
reduction in SLB incidence and severity and fungicide cost saving when compared to
other spray timing programs in this study. Under low disease pressure, BOTCAST,
STEMCAST, and LDR recommended the lowest number of fungicide application.
The difference in SLB incidence and severity between the two years can be
attributed to the differences in weather. The weather in 2015 was warm with frequent
rainfall events, and 2016 was also warm, but with longer intervals between rainfall
events. The longer periods of dry weather in 2016 appear to be unfavourable for
development of SLB, which was in agreement with previous reports (Basallote-Ureba et
al. 1999; Prados-Ligero et al. 2003). Also, the warm and wet weather in 2015 was
favourable for abundant inoculum production and infection, as discussed earlier (see
chapter 2).
Regardless of the planting methods, initial SLB lesions were observed at the end
of June to the middle of July. This was in agreement with an earlier disease survey
conducted in the Holland Marsh (Paibomesai et al. 2012). The onion crops are usually at
the 4-6 leaf stage at this time, which provides an abundance of susceptible host tissues
and coincides with the abundance of airborne conidia, as earlier discussed (see chapter 2).
There was no correlation between the number of SLB lesions observed and
subsequent percentage leaf dieback. This was similar to the results presented in Chapter
3. These results indicate that leaf dieback on onion may be due to the activity of host-
specific toxins produced by S. vesicarium after infection rather than the initial number of
lesions (Singh et al. 1999; Wolpert et al. 2002). In contrast to previous reports (Shishkoff
111
and Lorbeer 1989; Basallote-Ureba et al. 1999), initial lesions observed on onion leaves
rarely coalesced.
All of the sprayed treatments had an overall lower SLB incidence compared to the
unsprayed control, but they did not reduce SLB severity below economic levels in
comparison to the control. Effective spray timing for the management of S. vesicarium
should recommend protective fungicide applications before infection takes place
(Llorente et al. 2000a; Gupta et al. 2010). Fungicides are less effective post-infection
because the severity of diseases caused by S. vesicarium is related to toxins produced
after infection (Singh et al. 1999, 2000; Llorente et al. 2000a).
Initial lesions of S. vesicarium on Allium crops develop 7-14 days after infection
(Shishkoff and Lorbeer 1989; Prados-Ligero et al. 1998; Suheri and Price 2000; Misawa
and Yasuoka 2012). In 2015, TOMCAST 15 and CP1 recommended a fungicide
application 13-15 days prior to the observation of the first SLB symptoms, which should
have provided protection from this initial infection. Therefore, the lower number of initial
lesions and SLB incidence in the TOMCAST and CP1 treatments can be attributed to the
application of protective fungicide at this time. In 2016, all spray timing programs
recommended the first fungicide application 6-15 days before the observation of initial
lesions. However, disease pressure in 2016 was very low and there were no difference in
the incidence between sprayed treatments and the unsprayed control. These results
indicate that fungicide application when disease pressure was low did not result in
significant reduction in disease.
Similarly, there were no differences in yield between the sprayed treatments and
the unsprayed control in either year, so the unsprayed control provided the highest

112
economic return. This result was similar to an earlier report on garlic (Basallote-Ureba et
al. 1998). It is, therefore, unclear if fungicide applications were effective or even
necessary in managing SLB at this site. Also, yield in both years was not correlated with
SLB levels. There are many other factors that affect onion yield, such as nutrition and
weed control (Brewster 2008), which were not investigated in this study. For example,
the trial in 2016 was very weedy during the bulbing stage (8-9 leaf stage), which may
account for the lower yields in 2016 compared to 2015.
Previous studies showed that mancozeb (Mishra and Gupta 2012) and fluopyram
plus pyrimethanil (Tesfaendrias et al. 2014) provided some reduction of SLB on onion. In
the current study, fungicide applications only provided an overall reduction of SLB
incidence of 16-29%, and severity by 12-21%. Recent studies in the USA (Hoepting
2015) and Europe (Alberoni et al. 2010) reported that S. vesicarium isolates from onions
and pear were insensitive to several fungicides, so it is possible that the pathogen
population at this site is insensitive to these fungicides.
Future research is needed to screen more fungicides for SLB management in the
Holland Marsh. Also, it will be important to investigate the sensitivity of local
S. vesicarium isolates to fungicides. Furthermore, spray timing programs should be
modified to include precipitation, as it was an important weather variable that affected
when disease was initiated (see Chapter 2). Growers should be advised to apply a
protective fungicide when the onion crop has developed enough foliage (≈ 3 leaf stages)
to receive it, since inoculum is available even before planting. This application may be
redundant in warm and dry years. However, the initial application of fungicides before

113
infection and development of symptom in both seasons of this trial reduced SLB
incidence.
114
CHAPTER FIVE
DETECTION OF STEMPHYLIUM LEAF BLIGHT ON ONION USING AERIAL
PHOTOGRAPHY
5.1 Introduction
Onion (Allium cepa L.) is grown on about 2460 ha in Ontario, which represents
45% of the fresh market production in Canada (Statistics Canada 2013). About 90% of
this production is located in the Holland Marsh (Valk 1988), where it contributes $33
million to the provincial economy (Mailvaganam 2016). Environmental conditions in the
Holland Marsh favour vegetable production and also favour several fungal diseases,
including stemphylium leaf blight (SLB) on onion.
Stemphylium leaf blight was observed for the first time in Ontario in 2008
(Paibomesai et al. 2012) after earlier reports of the pathogen on asparagus (Roddy 2011).
The disease affects only the foliage of onion, and high disease pressure results in the
reduction of bulb development (Rao and Pavgi 1975). Initial visual symptoms include
small, yellow to tan, water-soaked lesions, followed by coalescing of lesions and
extensive blighting of the leaf blade, starting at the tip (Shishkoff and Lorbeer 1989).
This results in early drying up of leaves and lodging of the crop (Rao and Pavgi 1975;
Basallote-Ureba et al. 1999).
One approach to management of SLB on Allium crops might be to use resistant
cultivars (Pathak et al. 2001; Mishra et al. 2009). However, no onion lines have strong
resistance (Pathak et al. 2001), so application of foliar fungicides (Gupta et al. 2010) is
often required to maintain yield and quality. Stemphylium vesicarium produces host-
specific toxins after infection that are associated with extensive tissue necrosis (Singh et

115
al. 1999, 2000). These toxins reduce the efficacy of fungicides applied after infection
(Alberoni et al. 2010; Puig et al. 2014). In pear, fungicide applications initiated after
visual detection of necrotic spots of S. vesicarium resulted in at least 10% loss (Puig et al.
2014). Therefore, early detection of SLB is important to minimize yield losses (Köhl et
al. 2009b; Llorente et al. 2012).
The presence of S. vesicarium in pear can be detected prior to symptom
development using molecular techniques (Köhl et al. 2009b). Molecular detection is
sensitive but not effective for use in commercial situations because it is destructive and
only a few plants can be sampled (Martinelli et al. 2014). Remote sensing has potential
for rapid detection of crop diseases with minimal disturbance to the crop (Bock et al.
2010; Martinelli et al. 2014). Disease detection involving the use of passive imaging
sensors that measure the radiation from the crop canopy can be precise and objective
compared to visual assessments (Zhang et al. 2005; Bock et al. 2010; Martinelli et al.
2014).
Remote sensing is defined as collection of data about an object without physical
contact (De Jong and van der Meer 2006). Remote sensing using passive imaging sensors
measures and captures the amount of reflected radiation from a crop canopy (Lorenzen
and Jensen 1991), while active sensors emit artificial radiation and measure the energy
reflected or backscattered (McGill 2004). Passive sensor equipment include digital
(visible and near-infrared), multispectral, and hyperspectral cameras (Sankaran et al.
2010; Garcia-Ruiz et al. 2013). Multispectral cameras have sensors that capture images
with several specific bands of the electromagnetic spectrum. Multispectral sensors
usually have between 3 and 10 band measurements for each pixel captured.

116
Hyperspectral cameras have sensors that capture images with narrower and more
numerous bands than multispectral sensors. Hyperspectral images can contain as many as
200 or more contiguous spectral bands (Adam et al. 2010).
Specialized cameras can capture images containing reflectance data in the visible
(400-685 nm), red-edge (690-730 nm), near-infrared (NIR, 730-850 nm), and shortwave-
infrared (SWIR, 850-2500 nm) spectra (Baranoski and Rokne 2005; Sankaran et al. 2010;
Garcia-Ruiz et al. 2013). These images can be analysed and specific vegetative indices
that are sensitive to disease presence can be calculated (Mahlein et al. 2012). Vegetative
indices compare the relative reflectance in two or more spectral regions (Hatfield and
Prueger 2010).
There are several vegetative indices that detect changes in the chlorophyll content
and leaf reflectance (Kumar and Silva, 1973; Hatfield and Prueger, 2010). For example,
the normalised difference vegetative index (NDVI) has been used to detect citrus trees
infected with Huanglongbing disease (Garcia-Ruiz et al. 2013) and oil palm trees infected
with ganoderma stem base rot (Shafri and Hamdan 2009). However, the major limitation
of vegetative indices for disease detection is that changes in chlorophyll content are
indicative of many kinds of stress, of which plant disease is only one (Bravo et al. 2004).
Advances in the technology and availability of unmanned aerial vehicles (UAVs)
have increased the potential for use of remote sensing in disease detection. Also, recent
improvements in passive imaging sensors have substantially reduced their size and
weight, so that they can be mounted unto relatively inexpensive UAVs (Sankaran et al.
2010; Martinelli et al. 2014). Combining UAVs with multispectral or hyperspectral
sensors has provided aerial images that have a high resolution compared to manned

117
aircraft and so can used to distinguish between diseased and healthy vegetation (Garcia-
Ruiz et al. 2013).
The overall goal of this study was to investigate the potential of incorporating
UAVs mounted with a relatively simple camera (red, green, infrared filters) into the
integrated pest management (IPM) program for onion at the Holland Marsh. The
potential of aerial infrared images in detecting SLB on onion and the relationship
between four selected vegetative indices and SLB incidence were investigated. The best
height and format to acquire aerial images for SLB detection on onion was also assessed.
5.2 Materials and Method
5.2.1 Aerial imaging
The acquisition of aerial images (visible and near-infrared) was conducted by
High Eye Imaging Inc. (Wasaga, ON). Aerial images of the research trials at the Jane
Street research site and Muck Crop Research Station were captured at about 2-week
intervals in 2015 and 2016 using a Xnite-Canon SX230NDVI (Canon USA Inc.,
Melville, NY) mounted on a modified Cine Star – 8 MK Heavy Lift RTF octocopter
UAV (The Quadrocopter Company, Columbia Falls, MT) (Fig. 5.1). Ground reflectance
measurements were not taken in this study.

118
Figure 5.1 A modified Cine Star – 8 MK Heavy Lift RTF octocopter mounted with a
camera for aerial image collection at the Holland Marsh, ON. 2015
5.2.2 Regions of interest
In 2015, SLB levels on two trials, the onion cultivar screening trial (Fig. 5.2a) and
the onion spray timing trial (Fig. 5.2b), were selected as two regions of interest (ROI). In
2016, only the spray timing trial was considered as the ROI due to poor emergence in the
cultivar trial. There were 12 onion cultivars (Table 5.1) grown in the cultivar trials each
year. In the spray timing trial, the effect of fungicide application timing treatments was
assessed on onion cv. La Salle (Table 5.2). In 2016, white stakes (60 cm) with 15 × 15
cm red-painted plywood pieces nailed to the top were used as ground control points for
the ROI.
In both years, the trials were arranged in a randomized complete block design
with four replicates. Each plot was 1.6 × 5 m, with four rows per plot and 2 m between
119
plots. In 2015, onion plugs in both ROIs were transplanted (2-3 seedlings per plug) using
a mechanical planter on 25 May. The spacing was 40 cm between rows and 10 cm
between plugs within-row. In 2016, the crop was direct seeded using a double row
Stanhay Precision Seeder at about 35 seeds m-1
on 4 May, with four double rows per plot.
In 2015, 12 onion cultivars were assessed for the susceptibility to stemphylium leaf
blight. These were Stanley (1), Prince (2), Highlander (3), Hendrix (4), Hamlet (5),
Trailblazer (6), Madras (7), Patterson (8), Milestone (9), Genesis (10), La Salle (11) and
Pontiac (12) (Fig. 5.2A).

120
Figure 5.2 Study area for (A) the onion cultivar trial and (B) fungicide spray-timing trial
in the Holland Marsh, ON in 2015.

121
Table 5. 1 Fungicide spray-timing programs evaluated on onion cv. La Salle in the spray
timing trials at Holland Marsh, ON in 2015 and 2016.
Number Treatment name 1
Reference
Both 2015 and 2016
1 BOTCAST Sutton et al. 1986
2 TOMCAST DSV 15 Pitblado 1992
6 Unsprayed control
2015 only
3 STEMCAST Chapter 3
4 Conidia plus phenology (CP1) Chapter 3
5 Local disease report Chapter 3
2016 only
3 TOMCAST 15/25 Chapter 3
4 TOMCAST 15/R Chapter 3
5 Conidia plus phenology (CP2) Chapter 3
1 Details on treatment, refer to chapter four
5.2.3 Data collection
In 2015, aerial images for SLB detection were taken in the ROIs on 29 June, 13
July, 27 July and 4 August. In 2016, aerial images were captured on 27 June, 11 July, 25
July and 2 August. The corresponding ground visual assessments of SLB incidence and
leaf dieback in each plot were collected the same day as the aerial images. In 2015,
images were captured with a camera that had the red-region filter replaced with a near-
infrared filter, and the images were saved in JPEG (joint photographic experts group)
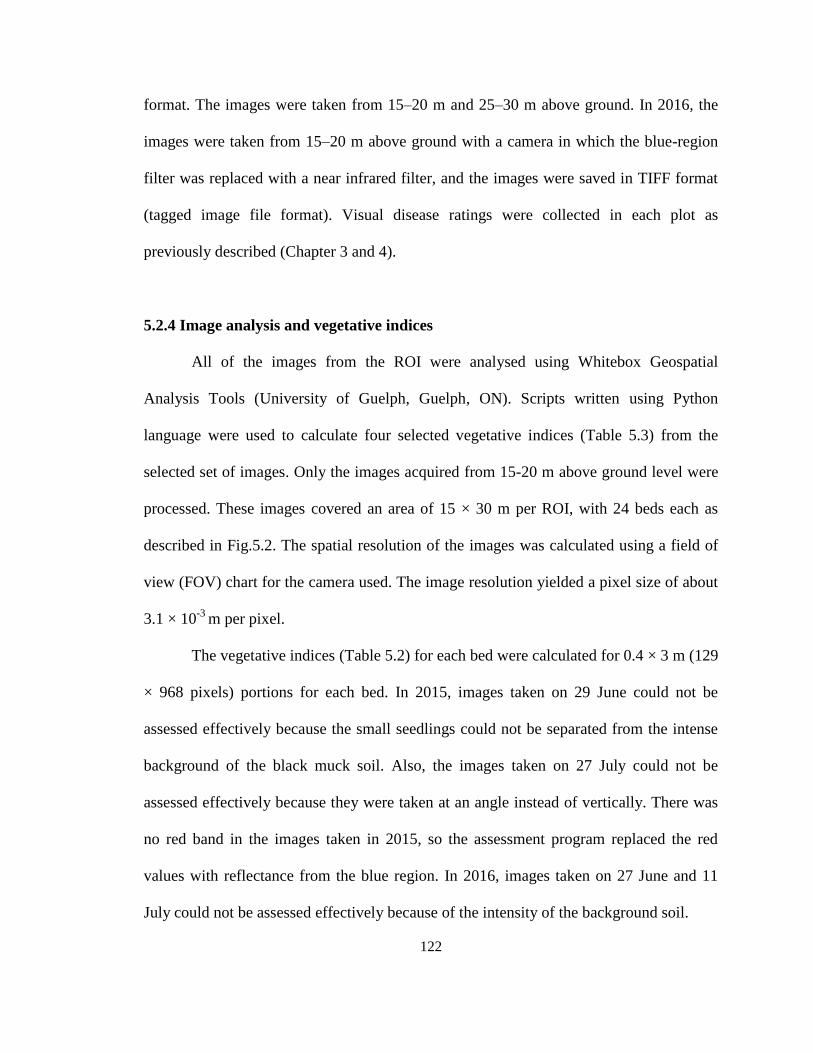
122
format. The images were taken from 15–20 m and 25–30 m above ground. In 2016, the
images were taken from 15–20 m above ground with a camera in which the blue-region
filter was replaced with a near infrared filter, and the images were saved in TIFF format
(tagged image file format). Visual disease ratings were collected in each plot as
previously described (Chapter 3 and 4).
5.2.4 Image analysis and vegetative indices
All of the images from the ROI were analysed using Whitebox Geospatial
Analysis Tools (University of Guelph, Guelph, ON). Scripts written using Python
language were used to calculate four selected vegetative indices (Table 5.3) from the
selected set of images. Only the images acquired from 15-20 m above ground level were
processed. These images covered an area of 15 × 30 m per ROI, with 24 beds each as
described in Fig.5.2. The spatial resolution of the images was calculated using a field of
view (FOV) chart for the camera used. The image resolution yielded a pixel size of about
3.1 × 10⁻³
m per pixel.
The vegetative indices (Table 5.2) for each bed were calculated for 0.4 × 3 m (129
× 968 pixels) portions for each bed. In 2015, images taken on 29 June could not be
assessed effectively because the small seedlings could not be separated from the intense
background of the black muck soil. Also, the images taken on 27 July could not be
assessed effectively because they were taken at an angle instead of vertically. There was
no red band in the images taken in 2015, so the assessment program replaced the red
values with reflectance from the blue region. In 2016, images taken on 27 June and 11
July could not be assessed effectively because of the intensity of the background soil.

123
Table 5. 2 Vegetative indices calculated from aerial images of onion trials at the Holland
Marsh, ON in 2015 and 2016.
Index Wavebands Crop parameter Reference
Normalised vegetative indices (NDVI)
Red NDVI
Intercepted
photosynthetically
active radiation
(PAR)/ Biomass
(Deering 1978;
Govaerts and Verhulst
2010)
Green NDVI
PAR/Biomass (Gitelson et al. 2003;
Govaerts and Verhulst
2010)
Chlorophyll indices (CI)
Green CI ( ) Chlorophyll (Gitelson et al. 2003)
Plant senescence reflective index (PSRI)
PSRI
( )
Plant senescence (Lee et al. 2008)
5.2.5 Statistical analysis
PROC GLM in SAS was used for analysis of variance of the visual assessments
of SLB incidence and the calculated vegetative indices. No outliers were identified using
Lund’s test. The data were not normally distributed when assessed using PROC
UNIVARIANT. The relationship between SLB incidence and vegetative indices was
assessed using Spearman’s rank correlation (nonparametric) at P < 0.05 in PROC CORR.

124
5.3 Results
5.3.1 Image analysis
The NIR images acquired at 15-20 m (Fig. 5.3A) had an average ground sampling
distance (GSD) of 0.5 cm/pixel and an average FOV of 15 × 20 m. These images had
higher resolution compared to images taken from 25-30 m (Fig. 5.3B). The images taken
from 25-30 m above ground had an average GSD of 0.75 cm per pixel with a wider
average FOV of 24 × 31 m.
Figure 5.3 An aerial near-infrared image of onion plots taken on 13 July at (A) 15-20 m
and (B) 25-30 m above ground at the MCRS, Holland Marsh, ON, 2015.

125
5.3.2 Disease and vegetative indices
Stemphylium leaf blight incidence and leaf dieback cultivar and spray-timing
trials were higher in 2015 than in 2016. Lesions were first detected on 29 June, 2015 and
11 July, 2016. Images taken on the earliest dates could not be analysed due to the high
intensity of the soil background.
There were significant difference in the incidence and percentage leaf dieback
differed among cultivars and spray-timing treatments (Table 5.3, 5.4 and 5.5). Incidence
and leaf dieback were higher in August (4 August, 2015 and 2 August, 2016) compared
to July (13 July, 3015 and 25 July, 2016) in both years. There were significant
differences in the vegetative indices measured on the different cultivars and different
spray-timing treatments. However, the differences in incidence and severity among the
onion cultivars and spray-timing treatment were not correlated with any of the vegetative
indices.
Onion cv. Prince and Stanley had the lowest NDVI value and Pontiac had the
highest NDVI on 13 July 2015. Whereas on 4 August 2015, Madras had the lowest NDVI
and Pontiac had highest NDVI. Onion cv. Hamlet had a significantly lower GNDVI
compared to other cultivars on 13 July 2015. However, on 4 August 2015, Hendrix,
Pontiac and Highlander had the lowest GNDVI and Prince, Stanley, and Madras had
highest GNDVI. Generally, GNDVI numbers were lower compared to NDVI (Table 5.3).
In contrast to 13 July measurements, NDVI and GNDVI values on 4 August were
negatively correlated (r= -0.87, P=0.0002).
On 13 July 2015, lowest CI value was recorded on onion cv. Genesis and Prince
had the highest CI value. Whereas, on 4 August 2015, Hendrix had the lowest CI value

126
and Madras had the highest (Table 5.3). On 13 July, the CI values were correlated with
GNDVI (r=0.98, P<0.0001), and PSRI (r=0.72, P=0.0082). The CI values measured on 4
August were correlated with NDVI (r= -0.86, P=0.0003), GNDVI (r=0.99, P<0.0001)
and PSRI (r=0.71, P=0.0099).
Plant senescence reflective index (PSRI) was higher compared to the other
vegetative indices. Similar to incidence and leaf dieback, PSRI was higher on in August
compared to July. On 13 July, Genesis had the lowest PSRI and Madras had the highest
PSRI. On 4 August, Hamlet had the lowest PSRI, and Prince and Stanley had the highest
PSRI (Table 5.3). The PSRI values were correlated to GNDVI (r=0.64, P=0.0082) and CI
(r=0.72, P=0.0082) on 13 July. However, on 4 August, PSRI was correlated with NDVI
(r= -0.71, P=0.0093), GNDVI (r=0.72, P=0.0080) and CI (r=0.71, P=0.0099).

127
Table 5.3 Stemphylium leaf blight incidence, severity and vegetative indices calculated
for onion cultivars screened for the susceptibility to SLB at the MCRS, Holland Marsh,
ON, 2015.
Cultivar Incidence 1 Severity
Vegetative indices 2
NDVI
GNDVI
CI
PSRI
13 July
Pontiac 51 c nd 0.22 a 0.06 bcd 0.08 cd 0.37 cd
Highlander 55 bc nd 0.13 ab 0.04 cd 0.05 cd 0.37 cd
LaSalle 55 bc nd 0.21 a 0.06 bcd 0.10 bcd 0.39 bcd
Prince 55 bc nd 0.09 b 0.20 a 0.35 a 0.49 abc
Stanley 55 bc nd 0.09 b 0.20 a 0.34 a 0.43 bcd
Hendrix 58 bc nd 0.16 ab 0.03 cd 0.03 cd 0.39 bcd
Patterson 59 abc nd 0.19 a 0.14 abc 0.23 abc 0.51 ab
Madras 59 abc nd 0.17 ab 0.17 ab 0.30 ab 0.59 a
Genesis 61 abc nd 0.21 a 0.02 cd 0.01 d 0.34 d
Trailblazer 63 ab nd 0.17 ab 0.10 abcd 0.16 abcd 0.47 abcd
Hamlet 66 ab nd 0.18 ab 0.01 d 0.03 cd 0.45 bcd
Milestone 70 a nd 0.20 a 0.09 abcd 0.13 abcd 0.39 bcd
4 August
Pontiac 68 b 35 b 0.21 ab 0.02 c 0.04 c 0.46 cd
Highlander 79 ab 62 a 0.23 a 0.04 c 0.09 bc 0.47 bcd
LaSalle 89 a 41 b 0.13 abcd 0.08 bc 0.13 bc 0.45 cd
Prince 78 ab 43 b 0.08 cd 0.16 ab 0.28 ab 0.62 a
Stanley 81 ab 38 b 0.12 bcd 0.11 bc 0.18 bc 0.62 a
Hendrix 80 ab 37 b 0.21 ab 0.01 c 0.02 c 0.44 cd
Patterson 82 ab 42 b 0.13 abcd 0.13 abc 0.21 abc 0.56 abc
Madras 85 ab 46 b 0.02 d 0.25 a 0.42 a 0.60 ab
Genesis 85 ab 42 b 0.23 ab 0.04 bc 0.09 bc 0.44 cd
Trailblazer 87 a 42 b 0.16 abc 0.09 bc 0.14 bc 0.53 abcd
Hamlet 83 ab 46 b 0.17 abc 0.07 bc 0.11 bc 0.40 d

128
Milestone 90 a 43 b 0.19 abc 0.03 c 0.03 c 0.50 abcd
1 Means in a column followed by the same letter do not differ based on Tukey’s multiple
range test at P > 05, ns = not significant, nd = no data.
2 Vegetative indices calculated: NDVI = normalized difference vegetative index, GNDVI
= green NDVI (GNDVI), CI = chlorophyll index and PSRI = plant senescence
reflectance index.
In the spray-timing trial, the unsprayed treatment had the highest SLB incidence
on in 2015 and CP1 had the lowest. Leaf dieback was significantly higher in the
unsprayed plots compared to other treatments (Table 5.4). There were no differences in
NDVI values on 13 July 2015. The unsprayed control and BOTCAST treatment had the
lowest NDVI on 4 August and STEMCAST had the highest NDVI (Table 5.4). Also,
there were significant differences in the GNDVI on 13 July but no difference on 4
August. On 13 July, BOTCAST and STEMCAST had the lowest GNDVI and LDR the
highest. The NDVI and GNDVI values measure on 13 July were correlated (r= -0.89,
P=0.0175).
There were significant differences in the CI calculated on 13 July and 4 August.
On 13 July, LDR and CP1 had the lowest CI and BOTCAST had the highest. On 4
August, CI was lowest in STEMCAST and CP1 and highest in the control (Table 5.4).
The CI values measured on 13 July were correlated with NDVI (r= -0.02, P=0.0120) and
GNDVI (r= -0.92, P=0.0081). The CI values measured on 4 August were only correlated
with NDVI (r= -91, P=0.0120).

129
There were significant differences in the PSRI calculated on 13 July and 4
August. On 13 July, PSRI was lowest in STEMCAST, and highest in the control
treatment. On 4 August, PSRI was highest in STEMCAST and lowest in BOTCAST
(Table 5.4). The PSRI and NDVI values measure on 4 August were correlated (r=0.88,
P=0.0198).
In 2016, the unsprayed treatment again had a significantly higher SLB incidence
compared to the other treatments. There were no differences in leaf dieback among the
sprayed treatment. However, there were differences in the vegetative indices measured
for each treatment (Table 5.5).
On 25 July, NDVI was lowest in TOMCAST 15R and highest in the control but
on 2 August, the unsprayed treatment had the lowest NDVI and TOMCAST 1525 had the
highest NDVI. There were no differences in the GNDVI in 2016 (Table 5.5). The NDVI
and GNDVI values measured on 25 July were correlated (r= -0.89, P=0.0175).
There were differences in the CI values. On 25 July, TOMCAST 15R had the
lowest CI and BOTCAST had the highest whereas, on 2 August, TOMCAST 1525 and
TOMCAST 15R had the lowest CI and the unsprayed had the highest (Table 5.5). The CI
values measured on 25 July correlated with NDVI (r=0.88, P=0.0219) and GNDVI (r= -
0.93, P=0.0081). However, on 2 August, CI values only correlated with NDVI (r= -0.85,
P=0.0266).
Similar to 2015, PSRI in 2016 was higher in August compared to July. On 25
July, there were significant differences in the PSRI calculated. On 25 July, BOTCAST
had the lowest PSRI and TOMCAST 1525 had the highest PSRI. However, there were no

130
differences in the PSRI measured on 2 August (Table 5.5). The PSRI and NDVI values
measured on 2 August were correlated (r=0.79, P=0.0321).
Table 5.4 Stemphylium leaf blight incidence, leaf dieback, and vegetative indices
measured on onions in a trial sprayed following selected fungicide application programs
at the MCRS, Holland Marsh, 2015.
Treatment 1
Incidence 2
Leaf
dieback
Vegetative indices 3
NDVI GNDVI CI PSRI
13 July
CP1 59 c nd 0.08 ns 0.16 ab 0.03 c 0.30 b
TOMCAST 15 65bc nd 0.10 0.07 b 0.15 ab 0.31 b
BOTCAST 73 ab nd 0.09 0.07 b 0.15 a 0.34 b
STEMCAST 74 ab nd 0.09 0.13 ab 0.08 bc 0.29 b
LDR 79 a nd 0.08 0.21 a 0.04 c 0.39 ab
Unsprayed 85 a nd 0.09 0.13 ab 0.12 ab 0.47 a
4 August
CP1 74 c 29 b 0.09 ab 0.06 ns 0.05 c 0.57 ab
TOMCAST 79 bc 29 b 0.09 ab 0.05 0.08 bc 0.58 ab
BOTCAST 85 b 30 b 0.06 b 0.04 0.12 ab 0.46 a
STEMCAST 86 b 36 b 0.10 a 0.05 0.05 c 0.63 b
LDR 90 ab 32 b 0.07 ab 0.05 0.12 ab 0.50 ab
Unsprayed 98 a 49 a 0.06 b 0.04 0.16 a 0.51 ab 1
Details of treatment in Table 5.3 and chapter 4.
2 Means in a column followed by the same letter do not differ based on Tukey’s multiple
range test at P > 05, ns = not significant, nd = not data.
3 Vegetative indices calculated: NDVI = normalized difference vegetative index, GNDVI
= green NDVI (GNDVI), CI = chlorophyll index and PSRI = plant senescence
reflectance index.

131
Table 5.5 Stemphylium leaf blight incidence, leaf dieback, and vegetative indices
measured on onions in a trial sprayed following selected fungicide application programs
at the MCRS, Holland Marsh, 2015.
Treatment 1 Incidence
2
Leaf
dieback
Vegetative indices 3
NDVI GNDVI CI PSRI
25 July
TOMCAST 15 7 b 4 ns 0.18 ab 0.27 ns 0.33 a 0.19 ab
TOMCAST 15/25 11 b 7 0.17 b 0.22 0.19 b 0.21 a
CP2 11 b 1 0.18 ab 0.24 0.09 b 0.17 ab
BOTCAST 12 b 6 0.20 ab 0.35 0.34 a 0.15 b
TOMCAST 15R 15 ab 5 0.16 b 0.21 0.08 b 0.19 ab
Control 25 a 10 0.28 a 0.41 0.20 ab 0.17 ab
2 August
TOMCAST 15 8 b 8 ns 0.21 ab 0.10 ns 0.03 bc 0.62 ns
TOMCAST 1525 12 b 8 0.23 a 0.10 0.02 c 0.64
CP2 12 b 10 0.15 bc 0.12 0.04 ab 0.76
BOTCAST 13 b 9 0.15 bc 0.11 0.04 ab 0.66
TOMCAST 15R 17 ab 12 0.22 ab 0.13 0.02 c 0.77
Control 27 a 17 0.11 c 0.09 0.05 a 0.74
1 Details of treatment in Table 5.3 and chapter 4
2 Means in a column followed by the same letter do not differ based on Tukey’s multiple
range test at P > 05, ns = not significant, nm=not measured
3 Vegetative indices calculated: NDVI = normalized difference vegetative index, GNDVI
= green NDVI (GNDVI), CI = chlorophyll index and PSRI = plant senescence
reflectance index

132
There were no differences in the vegetative indices calculated for JPEG and TIFF
images of the same area. The vegetative indices calculated for images taken with red
filter replaced (Fig. 5.4A) were not different from those with the blue filter replaced (Fig.
5.4B).
Figure 5.4 Aerial infrared image of onion trials taken on 4 August with a Xnite-Canon
SX230NDVI camera with the red-filter replaced (A) and blue-filter with a near-infrared
filter at the MCRS, Holland Marsh, 2016.
5.4 Discussion
The current study was the first to assess the potential for using remote sensing to
detect SLB incidence on onion. It was expected that onion crops with higher SLB
incidence would have lower NDVI, GNDVI, and CI values and higher PSRI values
compared to healthy onion or onion crops with lower incidence. However, this trend was
133
not observed. There were differences in the vegetative indices among the treatments in
several of the trials, but there was no significant relationship to levels of SLB. PSRI was
expected to be higher for older vegetation than for younger crops (Peñuelas et al. 1994).
This trend was observed in the current study at the Holland Marsh.
The incidence of SLB was higher in 2015 compared to 2016. The difference can
be attributed to differences in the weather conditions in 2015 and 2016 (Chapters 2 and
3). Incidence differed among onion cultivars (Chapter 3) and the spray-timing programs
(Chapter 4), but these differences were not captured by the assessments of the aerial
photographs. There were differences, however, in the vegetative indices for some
treatments. This variation was similar to that reported from Huanglongbing-infected
citrus trees (Li et al. 2012; Garcia-Ruiz et al. 2013). However, in contrast to these earlier
studies, the calculated vegetative indices showed no clear relationship with levels of SLB.
The observed trends might be associated with other physiological conditions, such as
foliage colour, maturation date (Hatfield and Prueger 2010), reflectance from foliage that
had received fungicide spray, and even how recently the fungicide had been applied.
Vegetative indices are influenced by crop senescence (Lee et al. 2008; Hatfield
and Prueger 2010). Severe SLB on onion causes extensive necrosis (Rao and Pavgi
1975), which increases the rate of senescence. Plant senescence reflectance index is the
index most sensitive to plant canopy senescence (Peñuelas et al. 1994). Although there
was no relationship between PSRI and SLB incidence, PSRI values in August were
consistently higher than in July. This observation was in agreement with previous
phenological studies in corn (Hatfield and Prueger 2010) and sunflower (Peñuelas et al.

134
1994). Differences in PSRI in this study likely were associated with difference in
senescence resulting from differences in days to maturity among the cultivars.
In the images taken by the commercial company and provided for use in this
study, reflectance information was compressed in a way that could not be split into
individual bands (green, red and NIR). In 2015, the images collected by the commercial
company were saved in JPEG format. Such images are small and easy to work with, but
have a lossy (irreversible) compression that results in loss of data. In 2016, the images
were saved in TIFF format, which are larger but retain more data compared to JPEG, but
can have both lossy and lossless (reversible) compression formats (Patel and Patel 2014).
However, there were no differences between the vegetative indices calculated from JPEG
or TIFF images, likely because of lossy compression of the TIFF images.
Stemphylium leaf blight produced profound physiological changes in onion
leaves. These changes, together with other factors such as phenology and fungicide
application, may have produced the variation in the vegetative indices observed among
the treatments. PSRI values were consistently higher in older onion beds. This indicated
that changes in the crop canopy could potentially be measured using remote sensing.
Canopy reflectance changes with changes in chlorophyll content (Kumar and
Silva 1973). Disease stress leads to a reduction in chlorophyll content, which results in an
increase in reflectance in the visible portion of the spectrum and a reduction in
reflectance in the NIR portion (Carter 1993; West et al. 2003). However, changes in
chlorophyll content are not related exclusively to disease stress (Moshou et al. 2004). The
current study indicated that physiological changes in the onion crop caused by SLB can
potentially be identified using aerial infrared images. However, early detection of
135
diseases may be difficult because of the shape of the onion leaves and the dark
background of the muck soil. Onion leaf blades are upright (Fritsch and Friesen 2002)
and do not form the thick, uniform canopy that might produce more consistent readings
from these indices.
Combining UAVs with an effective imaging platform has potential for use in
collecting objective data on onion crops. Additional research is needed on use of
multispectral cameras to measure the reflectance in the visible region, red-edge and NIR
regions of the spectrum. Specific vegetative indices might be developed for SLB using
reflectance from two or more spectra (Bock et al. 2010). Reflectance in individual
regions might also be more informative for early detection of S. vesicarium.
In addition to multispectral cameras, sensors to measure environmental conditions
such as solar radiation and cloud cover should be installed on the image platform
(camera) to aid in image resolution and interpretation. Another critical recommendation
for future studies is the selection of the right image data processing software prior to
image acquisition. This will aid in the selection of the right image capturing device and
storage formats that will conserve the data.
136
CHAPTER SIX
GENERAL DISCUSSION
Stemphylium vesicarium, cause of SLB, is a destructive fungal pathogen on
Allium crops worldwide. Under high disease pressure, onion crops develop small to no
bulbs and yield losses can be up to 90% (Rao and Pavgi 1975; Miller et al. 1978). The
disease was first reported on onion in Ontario in 2008, after an earlier report on asparagus
(Roddy 2011).
The current research is the first to investigate the epidemiology of SLB on onion
in Canada. The seasonal distribution of airborne inoculum was investigated and the
relationship between local weather conditions, inoculum availability and SLB incidence.
Ascospores and conidia were captured with a volumetric sampler in the Holland Marsh.
The concentrations of ascospores were highest at the start of the growing season (late
spring) and decreased with increasing temperatures. Conidia were present throughout the
growing season. The pseudothecia, which bear ascospores, have been reported to
degenerate with increasing temperatures above 15°C and with frequent rainfall (Prados-
Ligero et al. 2003). The daily distribution of both conidia and ascospores showed a
diurnal pattern, with the highest concentration of spores trapped between 0600-1200 h.
High concentrations of conidia (≈10 conidia m-3
air day-1
) coincided with the first
SLB incidence in both 2015 and 2016. Similar results had been reported on other Allium
crops (Suheri and Price 2001; Prados-Ligero et al. 2003; Misawa and Yasuoka 2012).
Conidial concentration peaked after SLB symptoms were observed in the field. This was
likely because the initial lesions on onion sporulated and produced conidia.

137
Airborne concentrations of both conidia and ascospores were higher in 2015
compared to 2016. This can be attributed to the warm and wet conditions in 2015. The
weather in 2016 was also warm, but with less frequent rainfall events. The incidence and
severity of SLB was much higher in 2015 than in 2016, as the moisture created
favourable environment for infection and production of conidia.
The presence of ascospores confirmed that the pathogen overwinters in or around
the Holland Marsh. No pseudothecia were found on infected onion tissues in this study.
Further research is needed to investigate the possible overwintering of the pathogen on
other crops and weeds close to onion fields as previous reported for Welsh onion
(Misawa and Yasuoka 2012).
Stemphylium vesicarium is reported to have a wide host range with the production
host specific toxins during infection (Köhl et al. 2009a; Koike et al. 2013). This study
investigated the pathogenicity and aggressiveness of isolates of S. vesicarium from
asparagus and onion on 12 onion cultivars at the Holland Marsh. Each isolate was
confirmed as S. vesicarium based on conidial characteristics (Simmons 1969), and
primer-specific PCR and DNA sequencing (Câmara et al. 2002). In contrast to previous
studies (Singh et al. 2000), the isolates assessed in the current study did not exhibit host
or location specificity.
Stemphylium leaf blight causes extensive leaf dieback on onion. The extent of the
necrosis is related to host-specific toxins produced by the pathogen (Singh et al. 2000;
Wolpert et al. 2002). Isolates from onion in Ontario caused more dieback than isolates
from onion in Nova Scotia or isolates from asparagus. These differences among isolates
138
may be associated with differences in aggressiveness of toxins from the different isolates
(Singh et al. 2000).
There was variation in the degree of susceptibility among onion cultivars. The
number of initial lesions and percent leaf dieback differed among cultivars in both growth
room and field trials. The cultivars were grouped based on SLB severity as low, moderate
and high susceptibility based on growth room and field trials. Growth room and field
experiment in 2015 were strongly correlated (r = 0.68, P = 0.02). Pontiac and Hendrix
exhibited low susceptibility, Patterson, Prince, Hamlet, Stanley, Genesis, and Braddock
were moderately susceptible, and Highlander, Trailblazer, and La Salle were highly
susceptible. There was no interaction between cultivar and isolate in the current study,
and there was no correlation between the number of initial lesions per leaf and final
percentage leaf dieback. A similar lack of correlation between the number of necrotic
spots and the final extent of tissue necrosis has been reported on pear (Montesinos et al.
1995a; Pattori et al. 2006).
Although commercial onion cultivars screened in this study were susceptible to
SLB, cvs. Highlander and La Salle were the most severely affected and Pontiac, Hendrix
and Milestone the least. At present, planting cultivars with lower susceptibility would
help in the management of the disease while other options are being explored.
Currently, the strategy for managing SLB on onion is routine application of
preventative fungicide. However, development of insensitivity has been reported in
S. vesicarium following routine applications of certain fungicide groups in Europe and
the USA. The effectiveness of selected spray-timing programs in reducing SLB
incidence, improving yield, and reducing cost were evaluated. Three spray timing

139
programs; BOTCAST, TOMCAST (DSV 15, DSV 15/25, DSV 15/Rain), and a
modification of existing programs especially for SLB (STEMCAST), were assessed, as
well as application based on the first local disease report (LDR), and spray application
based on conidia concentration plus crop phenology (CP1 and CP2) were evaluated in
2015 and 2016.
Symptoms of S. vesicarium diseases on Allium crops develop 7-14 days after
infection (Shishkoff and Lorbeer 1989; Prados-Ligero et al. 1998; Misawa and Yasuoka
2012). In 2015, the first SLB incidence was recorded on 29 June. The earliest fungicide
was recommended on 13 June by CP1 and TOMCAST 15. Fungicide application based
on recommendations from the other spray-timing treatments started on 29 June, after
symptoms were observed, and hence after infection had occurred. In 2016, the first SLB
incidence was recorded on 11 July. All of the spray-timing treatments, with the exception
of BOTCAST, recommended a fungicide application before initial infection occurred.
In 2015, SLB incidence and the number of lesions per leaf were lower in CP1 and
TOMCAST 15 compared to all of the other treatments. This was attributed to the early
initiation of fungicide application, which served as a protectant against initial infection.
Early application has previously been reported to be critical for management of SLB on
onion (Gupta et al. 2010). Under low disease pressure in 2016, there were no differences
in incidence or number of lesions between sprayed and unsprayed treatments.
At the end of the season in 2015, severity was only 18-21% lower in treatments
that received fungicide compared to the control. In 2016, there were no differences in
severity between sprayed and unsprayed treatments. Also, there was no correlation
between severity and initial number of lesions observed in either year. These

140
observations support the previous conclusion that SLB severity was related to toxins
produced by the pathogen and not the number of initial lesions. Post-infection application
of fungicides has also been reported to have little or no effect on reducing the severity of
SLB (Llorente et al. 2000a; Puig et al. 2014).
In New York, isolates of S. vesicarium from onion are insensitive to several
fungicides (Hoepting 2015). This may explain the low level of SLB suppression observed
among sprayed and unsprayed treatments in the current study. There is the need to assess
the fungicide sensitivity of S. vesicarium present in the Holland Marsh.
The final component of the current study assessed the potential for use of aerial
infrared photography to support the IPM program in detecting SLB on onion. Currently,
identification of SLB is based on visual assessment, which can be time-consuming and
laborious. Recent advancements in the use of unmanned aerial vehicles (UAVs) with
imaging platforms have increased the potential of for use in disease detection (Garcia-
Ruiz et al. 2013). The appropriate height for acquiring images, the various filters bands,
and the appropriate software for image analysis were investigated. Also, four vegetative
indices [normalised difference vegetative index (NDVI), green normalised difference
vegetative index (GNDVI), chlorophyll index (CI), and plant senescence reflectance
index (PSRI)] were computed from acquired images to assess their relationship with the
ground visual assessment.
In 2015 and 2016, four sets of images of onion trials at the MCRS were acquired
during the growing season and compared to ground visual assessments conducted the
same day. Images acquired from lower altitudes (15-20 m) were used for further analysis.
There were differences among treatments in the indices, but there was no correlation

141
between SLB levels and vegetative indices. The differences in the vegetative indices
were likely due to differences in canopy characteristics among cultivars and the
physiological changes (Hatfield and Prueger 2010) in onion canopy that had received
fungicides and those that had not received any fungicides.
Future research should be targeted at monitoring total daily counts of inoculum
rather than hourly to set an the conidia threshold that would warrant the application of
fungicides. This can be done with a rotorod spore trap or the Burkard spore sampler.
Since conidia are available throughout the season, these daily totals would be used to set
thresholds for the initiation of fungicide application. Also, the role of overwintering
pseudothecia and ascospores in the epidemiology of SLB on onion in the Holland Marsh
were not elucidated in the current study. Investigating the source of overwintering
pseudothecia and the role of ascospores in the infection on onion might help reduce the
overall inoculum level and the secondary production of conidia. The effects of the toxins
produced by different isolates of S. vesicarium on onion cultivars should also be
investigated. This could be used to screen onions for resistance.
There is the need to screen more fungicides for efficacy against SLB. Future
research is also needed to assess the fungicide sensitivity of S. vesicarium in the Holland
Marsh. Also, important weather variables such as rainfall and temperature exceeding 15
°C and LWD exceeding 5 h, which were observed as important for SLB infection on
onion in the Holland Marsh should be used to improve upon spray-timing programs for
SLB on onion.
Selection of appropriate cameras for aerial imaging and the appropriate software
should be considered in future research. Stemphylium leaf blight may be related to the

142
reflectance in a particular region of the spectrum, so the use of a multispectral camera
might increase the potential for early identification of SLB infection.
None of the management strategies evaluated in this study effectively reduced
SLB on onion. To minimise the losses caused by SLB, growers are advised to grow
cultivars with lower susceptibility, such as Pontiac and Hendrix, where possible. Also,
growers should apply fluopyram plus pyrimethanil when onions are at the 3-5 leaf stage
to reduce initial infection. Finally, fungicides with different modes of actions should be
alternated to reduce the possibility of S. vesicarium in the Holland Marsh becoming
insensitive to one or more fungicide groups.

143
LITERATURE CITED
Abtew, W. and Melesse, A., 2013. Vapor pressure calculation methods. In: Evaporation
and Evapotranspiration: Measurements and Estimations. Dordrecht: Springer
Netherlands, pp. 63–91.
Adam, E., Mutanga, O., and Rugege, D., 2010. Multispectral and hyperspectral remote
sensing for identification and mapping of wetland vegetation: A review. Wetlands
Ecology and Management 18 (3): 281–296.
Agriculture and Agri-food Canada, 2014. Statistical Overview of the Canadian
Vegetable Industry [online]. Available from: http://www.agr.gc.ca/eng/industry-
markets-and-trade/statistics-and-market-information/by-product-sector/horticulture-
industry/horticulture-sector-reports/statistical-overview-of-the-canadian-vegetable-
industry-2014/?id=1448648029689#a1.3 [Accessed 1 Jan 2016].
Alberoni, G., Cavallini, D., Collina, M., and Brunelli, A., 2010. Characterisation of the
first Stemphylium vesicarium isolates resistant to strobilurins in Italian pear
orchards. European Journal of Plant Pathology 126 (4): 453–457.
Aleixos, N., Blasco, J., Navarrón, F., and Moltó, E., 2002. Multispectral inspection of
citrus in real-time using machine vision and digital signal processors. Journal of
Computers and Electronics in Agriculture 33 (2): 121–137.
Alvarez, A.M., 1978. Bacterial blight of onion, a new disease caused by Xanthomonas
spp. Phytopathology 68 (8): 1132–1136.
Anderson, D.B., 1936. Relative humidity or vapor pressure deficit. Ecology 17 (2): 277–
282.
Angiosperm Phenology Group III., 2003. An update of the Angiosperm Phylogeny

144
Group classification for the ordens and families of flowering plants: APG II.
Botanical Journal of the Linnean Society 141 (2): 339–436.
Arseniuk, E., Góral, T., and Scharen, A.L., 1998. Seasonal patterns of spore dispersal
of Phaeosphaeria spp. and Stagonospora spp. Plant Disease 82 (2): 187–194.
Aveling, T.A.S. and Snyman, H.G., 1993. Aveling, Snyman, Naude - 1993 - Evaluation
of seed treatments for reducing Alternaria porri and Stemphylium vesicarium on
onion seed. Phytopathology 77 (10): 1010–1011.
Aveling, T.A., 1992. First report of Stemphylium vesicarium on garlic in South Africa.
Plant Disease, 76 (4): 426.
Baranoski, G.V.G. and Rokne, J.G., 2005. A practical approach for estimating the red
edge position of plant leaf reflectance. International Journal of Remote Sensing 26
(3): 503–521.
Basallote-Ureba, M.J., Prados-Ligero, A.M., and Melero-Vara, J.M., 1998.
Effectiveness of tebuconazole and procymidone in the control of stemphylium leaf
spots in garlic. Crop Protection 17 (6): 491–495.
Basallote-Ureba, M.J., Prados-Ligero, A. M., and Melero-Vara, J.M., 1999.
Aetiology of leaf spot of garlic and onion caused by Stemphylium vesicarium in
Spain. Plant Pathology 48 (1): 139–145.
Basallote, M.J., Prados, A.M., Perez de Algaba, A., and Melero Vara, J.M., 1993.
First report in spain of two leaf spots of garlic caused by Stemphylium vesicarium.
Plant Disease 77: 952.
Bayer CropScience Inc., 2016. Crop Science - Canada [online]. Luna
Tranquility.Available from:

145
https://www.cropscience.bayer.ca/Products/Fungicides/Luna-
Tranquility.aspx?xtor=SEC-73-%5BGOO%5D-%5BLuna%5D-%5Bp%5D-S-
%5Bluna tranquility%5D&xts=525586 [Accessed 28 Aug 2016].
Bertaud, D.S., 1986. The effects of light on bulbing in onions. In: Proceedings
Agronomy Society of New Zealand. Palmerston North: Agronomy Society of New
Zealand pp. 79–86.
Bessey, E.A., 1968. Fungi imperfecti: The imperfect fungi. In: Morphology and
Taxonomy of Fungi. New York: Hafner Publishing Company pp. 572–627.
Bock, C.H., Poole, G.H., Parker, P.E., and Gottwald, T.R., 2010. Plant disease
severity estimated visually, by digital photography and image analysis, and by
hyperspectral imaging. Critical Reviews in Plant Sciences 29 (2): 59–107.
Bosch-Serra, A.D. and Currah, L., 2002. Agronomy of onions. In: H.. Rabinowitch and
L. Currah (eds). Allium Crop Science: Recent Advances. New York: CAB
International, pp. 187–232.
Bradley, D.J., Gilbert, G.S., and Parker, I.M., 2003. Susceptibility of clover species to
fungal infection: The interaction of leaf surface traits and environment. American
Journal of Botany 90 (6): 857–864.
Bravo, C., Moshou, D., Oberti, R., West, J.S., McCartney, A., Bodria, L., and
Ramon, H., 2004. Foliar disease detection in the field using optical sensor fusion.
Agricultural Engineering International: The CIGR Journal of Scientific Research
and Development 6: 1–14.
Brewster, J.L., 2008. Onions and Other Vegetable Alliums. 2nd ed. Cambridge, MA:
CAB International.

146
Câmara, M.P.S., O’Neill, N.R., and van Berkum, P., 2002. Phylogeny of Stemphylium
spp. based on ITS and glyceraldehyde-3-phosphate dehydrogenase gene sequences.
Mycologia 94 (4): 660–672.
Carter, G.A., 1993. Responses of leaf spectral reflectance to plant stress. American
Journal of Botany 80 (3): 239–243.
Chaput, J., 1995. Identification of Diseases and Disorders of Onions [online]. Available
from: http://www.omafra.gov.on.ca/english/crops/facts/95-063.htm [Accessed 28 Jul
2015].
Chase, M.W., Reveal, J.L., and Fay, M.F., 2009. A subfamilial classification for the
expanded Asparagalean families Amaryllidaceae, Asparagaceae and
Xanthorrhoeaceae. Botanical Journal of the Linnean Society 161: 132–136.
Cohen, Y. and Rotem, J., 1987. Sporulation of foliar pathogens. In: G.F. Pegg and P.G.
Ayres (eds). Fungal Infection of Plants. Cambridge, MA: Cambridge University
Press, pp. 314–333.
Contreras-Medina, L.M., Osornio-Rios, R.A., Torres-Pacheco, I., Romero-
Troncoso, R. de J., Guevara-Gonzalez, R.G., and Millan-Almaraz, J.R., 2012.
Smart sensor for real-time quantification of common symptoms present in unhealthy
plants. Sensors 12 (1): 784–805.
Currah, L. and Proctor, F.J., 1990. Onions in Tropical Regions. Natural Resource
Institute Bulletin 35, Chatham, UK.
Deering, D.W., 1978. Rangeland reflectance characteristics measured by aircraft and
spacecraft sensors. Texas A & M University Press, pp 632.
Delalieux, S., Auwerkerken, A., Verstraeten, W.W., Somers, B., Valcke, R.,
147
Lhermitte, S., Keulemans, J., and Coppin, P., 2009. Hyperspectral reflectance and
fluorescence imaging to detect scab induced stress in apple leaves. Remote Sensing
1 (4): 858–874.
Eichhorn, J., Ziegler, J., Laun, N., Aldenhoff, L., Keil, B., Racca, P., Kleinhenz, B.,
and Kreuznach, B., 2009. Stemphylium forecast with TomCast – an online tool for
fungicide timing in asparagus [online]. Available from: www.dlrrheinpfalz.
[Accessed 2 Feb 2015].
Ellis, M.B., 1971. Dematiaceous Hyphomycetes. Surrey: CAB. UK: CAB International.
Environment Canada, 2016. Climatic data on line. National climate Archive [online].
Available from: http://climate.weather.gc.ca/index_e.html [Accessed 1 Mar 2016].
Everts, K.L., 1990. Influence of Environment on Conidial Concentration of Alternaria
porri in Air and on Purple Blotch Incidence on Onion. Phytopathology 80 (12):
1387.
Falloon, P.G., 1987. Etiology and epidemiology of stemphylium leaf spot and purple
spot of asparagus in California. Phytopathology 77 (3): 407-413
FAOSTATS, 2015. Food and agriculture organization of the United Nations statistics
division [online]. Production figures. Available from: http://www.fao.org/3/a-
i4691e.pdf [Accessed 16 Oct 2016].
FAO/IPGRI, 1997. Plant Production and Protection Div.; International Plant Genetic
Resources Inst., Food and agriculture organisation. Technical Guidelines for the
Safe Movement of Germplasm. Allium spp. IPGRI, Rome (Italy); Research Inst. of
Crop Production. Prague (Czech Republic).
Farr, D., Bills, G.., Chamuris, G.., and Rossman, A.Y., 1989. Fungi on plants and

148
plant products in the United States. Phytopathology 12 (2): 1252-1256
Fritsch, R.M. and Friesen, N., 2002. Evolution, domestication and taxonomy. In: H.
Rabinowitch and L. Currah (eds.). Allium Crop Science: Recent Advances . New
York: CAB International, pp. 5–30.
Gálvez, L., Gil-serna, J., García, M., Iglesias, C., and Palmero, D., 2016.
Stemphylium leaf blight of garlic (Allium sativum ) in Spain : Taxonomy and in
vitro fungicide response. Plant Pathology 32 (5): 388-395.
Garcia-Ruiz, F., Sankaran, S., Maja, J.M., Lee, W.S., Rasmussen, J., and Ehsani,
R., 2013. Comparison of two aerial imaging platforms for identification of
Huanglongbing-infected citrus trees. Journal of Computers and Electronics in
Agriculture 91: 106–115.
Garner, W.W. and Allard, H.A., 1920. Effect of the relative length of day and night
and other factors of the environment on growth and reproduction in plants. Journal
of Agricultural Research 18 (11): 553–606.
Gitelson, A. A, Gritz, Y., and Merzlyak, M.N., 2003. Relationships between leaf
chlorophyll content and spectral reflectance and algorithms for non-destructive
chlorophyll assessment in higher plant leaves. Journal of Plant Physiology, 160 (3)
271–282.
Govaerts, B. and Verhulst, N., 2010. The normalized difference vegetation index
(NDVI) GreenSeekerTM handheld sensor: Toward the integrated evaluation of crop
management Part A: Concepts and case studies. International Maize and Wheat
Improvement Center (CIMMYT), Mexico City, pp. 1-16.
Granke, L.L. and Hausbeck, M.K., 2010. Influence of environment on airborne spore

149
concentrations and severity of asparagus purple spot. Plant Disease 94 (25): 843–
850.
Grinstein, A., Frankel, H., Austerweil, M., and Kritzman, G., 1988. Air-assisted
placement spraying for Stemphylium control in seed onions. Crop Protection 7 (6):
356–360.
Gupta, R.P., Srivastava, P.., and Sharma, R., 2010. Plant health management. In:
National Horticultural Research andDevelopment FoundationNashik Report
FoundationNashik Report. Maharashtra, India: The Directorate: National
Horticultural Research and Development Foundation, pp. 13–15.
Hanelt, P., 1990. Taxonomy, evolution and history. In: H.. Rabinowitch and J.L.
Brewster, eds. Allium and allied crops Vol. I. Botany, Physiology and Genetics.
Florida: CRC Press, pp. 1–26.
Hassan, M.H.A., Allam, A.D.A., Abo-Elyousr, K.A. M., and Hussein, M.A.M., 2007.
First report of stemphylium leaf blight of onion caused by Stemphylium vesicarium
in Egypt. Plant Pathology 56 (4): 724–724.
Hatfield, J.L. and Prueger, J.H., 2010. Value of using different vegetative indices to
quantify agricultural crop characteristics at different growth stages under varying
management practices. Remote Sensing 2 (2): 562-578.
Hausbeck, M.K., 2005. Pest management in the future, a strategic plan for the Michigan
onion industry Workshop Summary Michigan State University East Lansing, MI.
Available from: http://www.ipmcenters.org/pmsp/pdf/MIonion.pdf [Accessed 8 May
2015]
Heath, O.V. and Hollies, M., 1965. Studies in the physiology of the onion plant. Journal
150
of Experimental Botany 16 (46): 128–144.
Hoepting, C., 2015. Managing Stemphylium leaf blight - Spray by number to prevent
fungicide resistance. Cornell Cooperative Extension Vegetable Program. Onion
World, pp. 6-8.
Isakeit, T., Miller, M.E., Barnes, L.W., Dickstein, E.R., and Jones, J.B., 2000. First
report of leaf blight of onion caused by Xanthomonas campestris in the continental
United States. Plant Disease, 84 (2): 201–201.
Jakhar, S.S., Duhan, J.C., and Suhag, L.S., 1996. Studies on conidial germination and
factors affecting disease development of stemphylium blight of onion. Indian
Phytopathology, 49 (4): 362–365.
Jensen, J., 2000. Remote Sensing of the Environment: An Earth Resource Perspective.
New Jersey: Prentice-Hall Inc.
de Jong, S. and van der Meer, F.D., 2006. Remote sensing image analysis: Including
the spatial domain. Dordrecht, Netherlands: Springer editions pp. 17-35.
Kamal, A.E. M., Mohamed, H.M., Aly, A. D., and Mohamed, H. H., 2008. Enhanced
onion resistance against Stemphylium leaf blight disease, caused by Stemphylium
vesicarium, by di-potassium phosphate and benzothiadiazole treatments. Plant
Pathology Journal, 24 (2): 171–177.
Keremane, M.L., Ramadugu, C., Rodriguez, E., Kubota, R., Shibata, S., Hall, D.G.,
Roose, M.L., Jenkins, D., and Lee, R.F., 2015. A rapid field detection system for
citrus huanglongbing associated ‘Candidatus liberibacter asiaticus’ from the psyllid
vector, Diaphorina citri Kuwayama and its implications in disease management.
Crop Protection 68: 41–48.

151
Kik, C., 2008. Allium genetic resources with particular reference to onion. In: O. Dae-
Geun and K. Chieri, (eds.). Proc. XXVII IHC - Cultivation and Utilization. Asian,
Sub-Tropic, Underutilized Horticultural Crops. Wageningen: Acta Horticulture, pp.
135–138.
Köhl, J., Groenenboom-De Haas, B., Goossen-Van De Geijn, H., Speksnijder, A.,
Kastelein, P., De Hoog, S., and Gerrits van Den Ende, B., 2009a. Pathogenicity
of Stemphylium vesicarium from different hosts causing brown spot in pear.
European Journal of Plant Pathology 124: 151–162.
Köhl, J., Groenenboom-de Haas, B.H., Kastelein, P., Rossi, V., and Waalwijk, C.,
2009b. Quantitative detection of pear-pathogenic Stemphylium vesicarium in
orchards. Phytopathology 99 (12): 1377–1386.
Koike, S.T., O’Neill, N., Wolf, J., Van Berkum, P., and Daugovish, O., 2013.
Stemphylium leaf spot of parsley in California caused by Stemphylium vesicarium.
Plant Disease 97 (3): 315–322.
Kumar, R. and Silva, L., 1973. Light ray tracing through a leaf cross section. Applied
Optics 12 (12): 2950–2954.
Lacy, M.L. and Pontius, G.A., 1983. Prediction of weather-mediated release of conidia
of Botrytis squamosa from onion leaves in the field. Phytopathology 73 (5):
670-676.
Lancaster, J.E., Triggs, C.M., de Ruiter, J.M., and Gandar, P.W., 1996. Bulbing in
onions : Photoperiod and temperature requirements and prediction of bulbing.
Annals of Botany 78: 423–430.
Lee, R., Baldwin, S., Kenel, F., McCallum, J., and Macknight, R., 2013. Flowering

152
locus genes control onion bulb formation and flowering. Nature Communications:
2884.
Lee, Y.J., Yang, C.M., Chang, K.W., and Shen, Y., 2008. A simple spectral index
using reflectance of 735 nm to assess nitrogen status of rice canopy. Agronomy
Journal 100 (1): 205–212.
Li, X., Lee, W.S., Li, M., Ehsani, R., Mishra, A.R., Yang, C., and Mangan, R.L.,
2012. Spectral difference analysis and airborne imaging classification for citrus
greening infected trees. Computers and Electronics in Agriculture 83: 32–46.
Llorente, I. and Montesinos, E., 2002. Effect of relative humidity and interrupted
wetness periods on brown spot severity of pear caused by Stemphylium vesicarium.
Phytopathology 92 (1): 99–104.
Llorente, I. and Montesinos, E., 2004. Development and field evaluation of a model to
estimate the maturity of pseudothecia of Pleospora allii on pear. Plant Disease 88:
215–219.
Llorente, I. and Montesinos, E., 2006. Brown spot of pear: an emerging disease of
economic importance in Europe. Phytopathology 90 (11): 1368–1375.
Llorente, I., Moragrega, C., Ruz, L., and Montesinos, E., 2012. An update on control
of brown spot of pear. Trees - Structure and Function 26: 239–245.
Llorente, I., Moragrega, C., Vilardell, P., and Montesinos, E., 2000. STREP : a
brown-spot disease predictor for scheduling fungicide sprays against Stemphylium
vesicarium on pear. EPPO Bulleting 30 (1): 143–148.
Llorente, I., Vilardell, A., Vilardell, P., and Montesinos, E., 2008. Evaluation of new
methods in integrated control of brown spot of pear (Stemphylium vesicarium,

153
teleomorph Pleospora allii). Acta Horticulturae, 800: 825–831.
Llorente, I., Vilardell, P., and Montesinos, E., 2011. Evaluation of a revision of the
BSPcast decision support system for control of brown spot of pear. Phytopathologia
Mediterranea 50: 139–149.
López, M.M., Bertolini, E., Olmos, A., Caruso, P., Gorris, M.T., Llop, P., Penyalver,
R., and Cambra, M., 2003. Innovative tools for detection of plant pathogenic
viruses and bacteria. International Microbiology 6: 233–243.
Lorbeer, J.W., 1993. A serious outbreak of Stemphylium leaf blight of onion in New
York. In: Proceedings of the 1993 National Onion Research Conference. Ithaca, NY,
USA.: Cornell University, pp. 32–37.
Lorbeer, J.W., Kuhar, T.P., and Hoffman, M., 2002. Monitoring and forecasting for
disease and insect attack in onions and Allium crops within IPM strategies. In:
Allium Crop Science: Recent Advances . New York: CAB International, pp. 293–
309.
Lorenzen, B. and Jensen, A., 1991. Spectral properties of a barley canopy in relation to
the spectral properties of single leaves and the soil. Remote Sensing of Environment
37 (1): 23–34.
Mahlein, A.-K., Oerke, E.-C., Steiner, U., and Dehne, H.W., 2012. Recent advances in
sensing plant diseases for precision crop protection. European Journal of Plant
Pathology 133 (1): 197–209.
Mailvaganam, S., 2016. Dry Onion: Area, Production, Farm Value, Price and Yield,
Ontario, 1979 - 2015 [online]. OMAFRA Report. Available from:
http://www.omafra.gov.on.ca/english/stats/hort/dryonion.htm [Accessed 29 Nov

154
2016].
Martinelli, F., Scalenghe, R., Davino, S., Panno, S., Scuderi, G., Ruisi, P., Villa, P.,
Stroppiana, D., and Boschetti, M., 2014. Advanced methods of plant disease
detection. Agronomy for Sustainable Development 35 (1): 1–25.
Matimati, I., Murungu, F.S., Handiseni, M., and Dube, Z.P., 2006. Effect of set size
and cultivar on marketable yield of onion (Allium cepa). Journal of New Seeds 8 (1):
61–70.
Maude, R.B., 1990. Leaf diseases of onion. In: H.. Rabinowitch and J.L. Brewster,
(eds.). Allium and allied crops. Vol. 2. Botany, Physiology and Genetics. Florida:
CRC Press, pp. 173–189.
McCartney, H.A. and Lacey, M.E., 1990. The production and release of ascospores of
Pyrenopeziza brassicae on oilseed rape. Plant Pathology 39 (1): 17–32.
McDonald, M.R.., Janse, S., Van Kooi, K., Riches, L., and Tesfaendrias, M., 2015.
Muck vegetable cultivar trials and research report 2015. Office of Research and
Department of Plant Agriculture, University of Guelph, ON. Report number 65.
McDonald, M.R.. and Vander Kooi, K., 2014a. Evaluation of cultivars for
susceptibility to stemphylium leaf blight on onions. Muck vegetable cultivar trials
and research report 2015. Office of Research and Department of Plant Agriculture,
University of Guelph, ON. Report number 64: 96-99.
McDonald, M.R. and Vander Kooi, K., 2014b. Evaluation of various fungicides for
control of stemphylium leaf blight on onions. Muck vegetable cultivar trials and
research report 2015. Office of Research and Department of Plant Agriculture,
University of Guelph, ON. Report number 64: 90-95.

155
McGill, M.J., 2004. Combined lidar-radar remote sensing: Initial results from
CRYSTAL-FACE. Journal of Geophysical Research, 109 (D7): D07203.
Menges, R., 1987. Weed seed population dynamics during six years of weed
management systems in irrigated soil. Weed Science 35: 328–332.
Meredith, D.S., 1966. Spore dispersal in Alternaria porri (Ellis) Neerg. on onions in
Nebraska. Annals of Applied Biology 57 (1): 67–73.
Meroni, M., Rossini, M., and Colombo, R., 2010. Characterization of leaf physiology
using reflectance and fluorescence hyperspectral measurements. In: B.P. Maselli, F.,
Menenti, M. (eds.) Optical observation of vegetation properties and characteristics.
Research Signpost, Trivadrum pp. 165–187.
Meyer, M.P., Hausbeck, M.K., and Podolsky, R., 2000. Optimal fungicide
management of purple spot of asparagus and impact on yield. Plant Disease 84 (13):
525–530.
Miller, M.E., Taber, R.A., and Amador, J.M., 1978. Stemphylium blight of onion in
South Texas. Plant Disease Reporter 62 (10): 851–853.
Misawa, T. and Yasuoka, S., 2012. The life cycle of Stemphylium vesicarium, the causal
agent of Welsh onion leaf blight. Journal of General Plant Pathology 78: 18–29.
Mishra, R.. . and Gupta, R.P., 2012. In vitro evaluation of plant extracts , bio-agents
and fungicides against Purple blotch and Stemphylium blight of onion. Journal of
Medicinal Plants Research 6 (45): 5840–5843.
Mishra, R.K., Verma, A., Singh, S., and Gupta, R.P., 2009. Screening of garlic lines
against purple blotch and stemphylium blight. Pest Management in Horticultural
Ecosystems 15 (2): 138–140.

156
Montesinos, E., Moragrega, C., Llorente, I., and Vilardell, P., 1995. Susceptibility of
selected pear cultivars to infection by Stemphylium vesicarium and the influence of
leaf and fruit age. Plant Disease 79: 471–473.
Montesinos, E., Moragrega, C., Llorente, I., Vilardell, P., Bonaterra, A., Ponti, I.,
Bugiani, R., Cavanni, P., and Brunelli, A., 1995. Development and evaluation of
an infection model for Stemphylium vesicarium on pear based on temperature and
wetness duration. Phytopathology 85 (5): 586-592
Montesinos, E. and Vilardell, P., 1992. Evaluation of FAST as a forecasting system for
scheduling fungicide sprays for control of Stemphylium vesicarium on pear. Plant
Disease 76 (12): 215-219
Moshou, D., Bravo, C., West, J., Wahlen, S., McCartney, A., and Ramon, H., 2004.
Automatic detection of ‘yellow rust’ in wheat using reflectance measurements and
neural networks. Computers and Electronics in Agriculture 44 (3): 173–188.
Paibomesai, M., Celetti, M., and Tesfaendrias, M., 2012. Update on Stemphylium leaf
blight in onions in Ontario. Hort Matters, OMAFRA Specialist in Horticulture and
Speciality Crops 12 (19): 11-12.
Patel, R. and Patel, B.P., 2014. An analytical study on comparison of different image
compression formats. International Journal for Innovative Research in Science &
Technology, 1 (7) 24–31.
Pathak, S.S., Black, S.J., Cherng, T.C., and Ko, S.S., 2001. Breeding onions for
stemphylium leaf blight resistance. Proc. II IS Edible Alliaceae Acta Horticulturae
555: 77–81.
Pattori, E., Rossi, V., Bugiani, R., and Giosuè, S., 2006. Virulence of Stemphylium

157
vesicarium isolates from pear and other host species. In: Pome Fruit Diseases.
IOBC/wprs Bulleting pp. 195–205.
Peñuelas, J., Gamon, J.A., Fredeen, A.L., Merino, J., and Field, C.B., 1994.
Reflectance indices associated with physiological changes in nitrogen- and water-
limited sunflower leaves. Remote Sensing of Environment 48 (2): 135–146.
Pitblado, R.E., 1992. Development and implementation of TomCast: A Weather-Timed
Fungicide Spray Program for Field Tomatoes. Ontario Ministry of Agriculture and
Food Publications, ON pp. 1-19.
Polischuk, V.P., Shadchina, T.M., Kompanetz, T.I., Budzanivskaya, I.G., Boyko,
A.L., and Sozinov, A.A., 1997. Changes in reflectance spectrum characteristic of
nicotiana debneyi plant under the influence of viral infection. Archives Of
Phytopathology And Plant Protection 31 (1): 115–119.
Poysal, V., Brammallz, R.A., and Pitblados, R.E., 1993. Effects of foliar fungicide
sprays on disease and yield of processing tomatoes in Ontario. Canadian Journal of
Plant Science, 1993, 73(4): 1209-1215.
Prados-Ligero, A.M., Melero-Vara, J.M., Corpas-Hervías, C., and Basallote-Ureba,
M.J., 2003. Relationships between weather variables, airborne spore concentrations
and severity of leaf blight of garlic caused by Stemphylium vesicarium in Spain.
European Journal of Plant Pathology 109(4): 301–310.
Prados-Ligero, A.M., González-Andújar, J.L., Melero-Vara, J.M., and Basallote-
Ureba, M.J., 1998. Development of Pleospora allii on garlic debris infected by
Stemphylium vesicarium. European Journal of Plant Pathology 104 (9): 861–870.
Puig, M., Moragrega, C., Ruz, L., Montesinos, E., and Llorente, I., 2014.
158
Postinfection activity of synthetic antimicrobial peptides against Stemphylium
vesicarium in pear. Phytopathology 104 (11): 1192-1200.
Qin, J., Burks, T.F., Ritenour, M.A., and Bonn, W.G., 2009. Detection of citrus
canker using hyperspectral reflectance imaging with spectral information
divergence. Journal of Food Engineering, 93 (2): 183–191.
Rabinowitch, H.. and Currah, L., 2002. Allium Crop Science: Recent Advances. New
York: CABI Publishing.
Rao, R.N.N. and Pavgi, M., 1975. Stemphylium leaf blight in onion. Mycopathologia 56
(1): 1–6.
Rejeb, I., Pastor, V., and Mauch-Mani, B., 2014. Plant responses to simultaneous
biotic and abiotic stress: Molecular mechanisms. Journal of Plants 3 (4): 458–475.
Rey, C., Stahl, J., Antonin, P., and Neury, G., 1974. Stades reperes de l'oignon de
semis. Revue Suiss de Viticulture, Arboriculture et Horticulture 6: 101–104.
Roddy, E., 2011. Asparagus diseases - Purple spot (Stemphylium) [online]. Available
from: http://www.omafra.gov.on.ca/english/crops/hort/asparagus-diseases-purple-
spot.htm [Accessed 11 Feb 2016].
Rossi, V., Bugiani, R., Giosué, S., and Natali, P., 2005. Patterns of airborne conidia of
Stemphylium vesicarium, the causal agent of brown spot disease of pears, in relation
to weather conditions. Aerobiologia Journal 21 (3–4): 203–216.
Rossi, V., Pattori, E., and Bugiani, R., 2008. Sources and seasonal dynamics of
inoculum for brown spot disease of pear. European Journal of Plant Pathology 121:
147–159.
Rouse, J.W., Haas, R., Schell, J.., and Deering, D., 1973. Monitoring vegetation
159
systems in the Great Plains with ERTS. In: Freden, S.C, Mercanti, E.P and Becker,
A.M (eds). Third Earth Resources Technology Satellite-1 Symposium- Volume I:
Technical Presentations NASA SP-351. NASA publication, Washington, D.C. pp.
309–317.
Salomon, R., 2002. Virus diseases in garlic and the propagation of disease free plants. In:
Rabinowitch, H. and L. Currah L. (eds). Allium Crop Science: Recent Advances .
New York: CAB International, pp. 311–327.
Sankaran, S., Mishra, A., Ehsani, R., and Davis, C., 2010. A review of advanced
techniques for detecting plant diseases. Computers and Electronics in Agriculture 72
(1): 1–13.
Sasaki, Y., Okamoto, T., Imou, K., and Torii, T., 1998. Automatic diagnosis of plant
disease: spectral reflectance of healthy and diseased leaves. In: Proceedings
AgEng’98 Conference. Oslo, pp. 6.
Schwartz, H.F. and Mohan, S.K., 2008. Compendium of Onion and Garlic Diseases.
2nd ed. Minnesota: Phytopathology 84 (3): 922-923.
Shafri, H.Z.M. and Hamdan, N., 2009. Hyperspectral imagery for mapping disease
infection in oil palm plantation using vegetation indices and red-edge techniques.
American Journal of Applied Sciences 6: 1031–1035.
Shishkoff, N. and Lorbeer, J.W., 1989. Etiology of Stemphylium leaf blight of onion.
Phytopathology 79 (3): 301-304.
Simmons, E.G., 1967. Typification of Alternaria, Stemphylium, and Ulocladium.
Mycologia, 59 (1): 67.
Simmons, E.G., 1969. Perfect states of Stemphylium. Mycologia 61 (1): 1–26.

160
Simmons, E.G., 1985. Perfect states of Stemphylium. Mycologia 38: 284-293.
Singh, P., Bugiani, R., Cavanni, P., Nakajima, H., Kodama, M., Otani, H., and
Kohmoto, K., 1999. Purification and biological characterization of host-specific
SV-toxins from Stemphylium vesicarium causing brown spot of European pear.
Phytopathology 89 (10): 947–953.
Singh, P., Park, P., Bugiani, R., Cavanni, P., Nakajima, H., Kodama, M., Otani, H.,
and Kohmoto, K., 2000. Effects of host-selective SV-toxin from Stemphylium
vesicarium, the cause of brown spot of European pear plants, on ultrastructure of
leaf cells. Journal of Phytopathology 148 (2): 87–93.
Srivastava, A.K., Borse, V.A., Gupta, R.P., and Srivastava, P.K., 1996. Mode of
perpetuation and role of nature in spread of Stemphylium blight and purple blotch
diseases of onion. Newsletter National Horticulture Research and Development
Foundation 96: 9-11.
Statistics Canada, 2013. Fruit and Vegetable Production, 2011 Census of Agriculture.
Available from: http://www.statcan.gc.ca/pub/22-003-x/22-003-x2011002-eng.pdf
[Accessed 10 May 2015].
Strandberg, J.O., 1977. Spore production and dispersal of Alternaria dauci.
Phytopathology 67 (10): 1262-1267.
Suheri, H. and Price, T. V., 2000. Infection of onion leaves by Alternaria porri and
Stemphylium vesicarium and disease development in controlled environments. Plant
Pathology 49 (3): 375–382.
Suheri, H. and Price, T. V., 2001. The epidemiology of purple leaf blotch on leeks in
Victoria, Australia. European Journal of Plant Pathology 107 (5): 503–510.

161
Sutton, J.C., James, T.D.W., and Rowell, P.M., 1986. Botcast: A forecasting system to
time the initial fungicide spray for managing botrytis leaf blight of onions.
Agriculture, Ecosystems and Environment 18 (2): 123–143.
Tesfaendrias, M.., Paibomesai, M., Celetti, M., and McDonald, M.R., 2014. The
battle against Stemphylium leaf blight of onion in Ontario, Canada. [online]
Available from:
http://www.hort.cornell.edu/expo/proceedings/2014/Onions/Stemphylium
Tesfaendrias.pdf [Accessed 4 Apr 2015]
Tomaz, I.. and Lima, A., 1988. An important disease of onion caused by Stemphylium
vesicarium (Wallr.) Simmons in Portugal. Horticultural Abstracts 68: 618.
Uzo, J.. and Currah, L., 1990. Cultural systems and agronimic practices in tropical
climates. In Rabinowitch L. and Brewster J. (eds.). Onions and Allied Crops
Volume II. CRC Press, Boca Raton, FL. pp. 49–62.
Valk, M., 1988. Onions. Guelph,Canada Ontario: Ministry of Agriculture and Food,
Queens Printer for Ontario, ON pp. 1-16.
Vavilov, N.I., 1951. The origin, variation, and immunity and breeding of cultivated
plants. Economic Botany 13: 1–6.
Wang, Y., Geng, Y., Pei, Y.F., and Zhang, X.G., 2010. Molecular and morphological
description of two new species of Stemphylium from China and France. Mycologia
102 (3): 708–717.
van der Werff, P.J., 1967. Daily census of fungus spores. Review of Palaeobotany and
Palynology 4 (14): 203–226.
West, J.S., Bravo, C., Oberti, R., Lemaire, D., Moshou, D., and McCartney, H.A.,

162
2003. The potential of optical canopy measurement for targeted control of field crop
diseases. Annual Review of Phytopathology 41 (1): 593–614.
Wolpert, T.J., Dunkle, L.D., and Ciuffetti, L.M., 2002. Host-selective toxins and a
virulence determinants: what’s in a name? Annual Review of Phytopathology 40:
251–285.
Wright, M.G., Hoffmann, M.P., Kuhar, T.P., Gardner, J., and Pitcher, S. A., 2005.
Evaluating risks of biological control introductions: A probabilistic risk-assessment
approach. Biological Control 35: 338–347.
Wu, D., Feng, L., Zhang, C., and He, Y., 2008. Early detection of botrytis cinerea on
eggplant leaves based on visible and near‐infrared spectroscopy, American Society
of Agricultural and Biological Engineers 51 (3): 1133–1139.
Yang, W., Chen, J., Chen, G., Wang, S., and Fu, F., 2013. The early diagnosis and fast
detection of blast fungus, Magnaporthe grisea, in rice plant by using its chitinase as
biochemical marker and a rice cDNA encoding mannose-binding lectin as
recognition probe. Biosensors and Bioelectronics 41: 820–826.
YARA, 2015. World onion production [online]. Crop Nutrition. Available from:
http://yara.co.uk/crop-nutrition/crops/onion-and-garlic/key-facts/world-onion-
production/ [Accessed 4 Apr 2015].
Zhang, M., Qin, Z., and Liu, X., 2005. Remote sensed spectral imagery to detect late
blight in field tomatoes. Precision Agriculture 6 (6): 489–508.
Zhang, M., Qin, Z., Liu, X., and Ustin, S.L., 2003. Detection of stress in tomatoes
induced by late blight disease in California, USA, using hyperspectral remote
sensing. International Journal of Applied Earth Observation and Geoinformation, 4

163
(4): 295–310.

164
APPENDIX 1: SUPPLEMENTARY TABLES FOR CHAPTER TWO
Table A1. 1 Hourly total ascospores and conidia captured in onion plots at the MCRS,
Holland Marsh, ON in 2015
Hour Total ascospore
(spores/m3 air)
Total conidia
(spores/m3 air)
00-0200 10 21
0200-0400 13 137
0400-0600 74 559
0600-0800 108 849
0800-1000 95 848
1000-1200 26 468
1200-1400 23 276
1400-1600 27 233
1600-1800 32 210
1800-2000 29 199
2000-2200 18 69
2200-2400 15 35
Total 470 3903
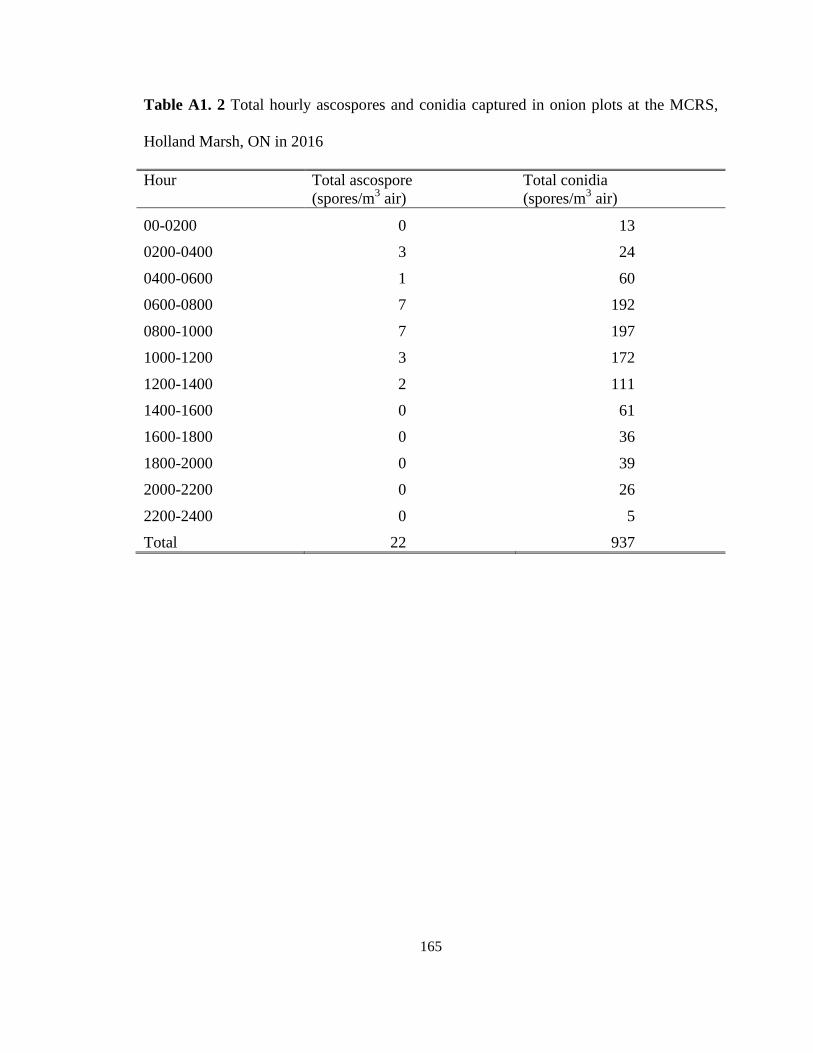
165
Table A1. 2 Total hourly ascospores and conidia captured in onion plots at the MCRS,
Holland Marsh, ON in 2016
Hour Total ascospore
(spores/m3 air)
Total conidia
(spores/m3 air)
00-0200 0 13
0200-0400 3 24
0400-0600 1 60
0600-0800 7 192
0800-1000 7 197
1000-1200 3 172
1200-1400 2 111
1400-1600 0 61
1600-1800 0 36
1800-2000 0 39
2000-2200 0 26
2200-2400 0 5
Total 22 937

166
Table A1. 3 Seasonal total ascospores and conidia captured in onion plots at the MCRS,
Holland Marsh, ON in 2015
Date
Total ascospore
(spores/m3 air)
Total conidia
(spores/m3 air)
20-May 0 0
21-May 0 0
22-May 0 0
23-May 0 8
24-May 5 5
25-May 20 2
26-May 29 3
27-May 16 5
28-May 33 0
29-May 23 2
30-May 8 9
31-May 0 2
1-Jun 51 3
2-Jun 54 6
3-Jun 37 2
4-Jun 21 4
5-Jun 4 8
6-Jun 52 15
7-Jun 16 26
8-Jun 4 8
9-Jun 14 29
10-Jun 5 45
11-Jun 8 39
12-Jun 0 2
13-Jun 13 54
14-Jun 4 35
15-Jun 7 52

167
16-Jun 3 69
17-Jun 4 62
18-Jun 3 69
19-Jun 4 91
20-Jun 3 55
21-Jun 3 45
22-Jun 3 50
23-Jun 0 62
24-Jun 9 83
25-Jun 0 71
26-Jun 2 84
27-Jun 2 60
28-Jun 1 13
29-Jun 3 65
30-Jun 1 49
1-Jul 0 60
2-Jul 2 48
3-Jul 2 39
4-Jul 0 50
5-Jul 1 34
6-Jul 1 45
7-Jul 0 34
8-Jul 0 71
9-Jul 0 85
10-Jul 0 87
11-Jul 0 97
12-Jul 0 85
13-Jul 0 60
14-Jul 0 75
15-Jul 0 54
16-Jul 0 55
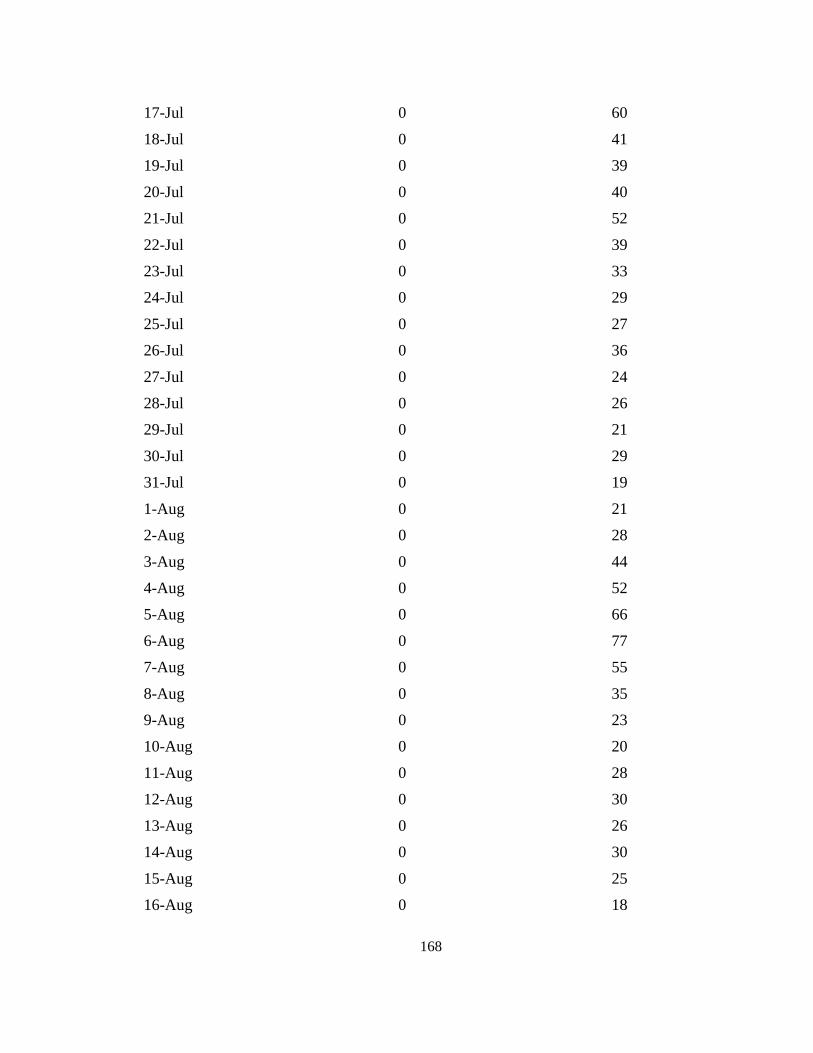
168
17-Jul 0 60
18-Jul 0 41
19-Jul 0 39
20-Jul 0 40
21-Jul 0 52
22-Jul 0 39
23-Jul 0 33
24-Jul 0 29
25-Jul 0 27
26-Jul 0 36
27-Jul 0 24
28-Jul 0 26
29-Jul 0 21
30-Jul 0 29
31-Jul 0 19
1-Aug 0 21
2-Aug 0 28
3-Aug 0 44
4-Aug 0 52
5-Aug 0 66
6-Aug 0 77
7-Aug 0 55
8-Aug 0 35
9-Aug 0 23
10-Aug 0 20
11-Aug 0 28
12-Aug 0 30
13-Aug 0 26
14-Aug 0 30
15-Aug 0 25
16-Aug 0 18

169
17-Aug 0 24
18-Aug 0 18
19-Aug 0 21
20-Aug 0 8
21-Aug 0 37
22-Aug 0 23
23-Aug 0 24
24-Aug 0 18
25-Aug 0 20
26-Aug 0 17
27-Aug 0 22
28-Aug 0 12
29-Aug 0 19
30-Aug 0 18
31-Aug 0 14
1-Sep 0 13
2-Sep 0 19
3-Sep 0 14
4-Sep 0 18
5-Sep 0 12
6-Sep 0 15
7-Sep 0 23
8-Sep 0 18
9-Sep 0 15
10-Sep 0 22
11-Sep 0 13
12-Sep 0 19
13-Sep 0 15
14-Sep 0 15
15-Sep 0 6
16-Sep 0 8

170
Total 470 3903

171
Table A1. 4 Seasonal total ascospores and conidia captured in onion plots at the MCRS,
Holland Marsh, ON in 2016
Date
Total ascospore
(spores/m3 air)
Total conidia
(spores/m3 air)
22-Apr 0 0
23-Apr 6 0
24-Apr 0 0
25-Apr 0 0
26-Apr 6 0
27-Apr 0 0
28-Apr 3 3
29-Apr 0 0
30-Apr 0 3
1-May 0 2
2-May 0 6
3-May 0 3
4-May 0 0
5-May 0 1
6-May 0 0
7-May 0 0
8-May 0 0
9-May 0 5
10-May 0 0
11-May 0 0
12-May 0 4
13-May 0 3
14-May 0 0
15-May 0 0
16-May 0 0
17-May 0 0
18-May 0 0

172
19-May 0 0
20-May 0 0
21-May 0 0
22-May 0 0
23-May 0 0
24-May 0 0
25-May 0 0
26-May 0 2
27-May 0 3
28-May 0 0
29-May 0 0
30-May 0 0
31-May 0 0
1-Jun 0 3
2-Jun 0 0
3-Jun 0 0
4-Jun 0 0
5-Jun 0 0
6-Jun 4 0
7-Jun 3 0
8-Jun 0 0
9-Jun 0 0
10-Jun 0 0
11-Jun 0 7
12-Jun 0 0
13-Jun 0 0
14-Jun 0 0
15-Jun 0 0
16-Jun 0 0
17-Jun 0 5
18-Jun 0 0

173
19-Jun 0 0
20-Jun 0 0
21-Jun 0 0
22-Jun 0 7
23-Jun 0 5
24-Jun 0 0
25-Jun 0 8
26-Jun 0 2
27-Jun 0 14
28-Jun 0 14
29-Jun 0 8
30-Jun 0 4
1-Jul 0 2
2-Jul 0 15
3-Jul 0 13
4-Jul 0 13
5-Jul 0 2
6-Jul 0 18
7-Jul 0 21
8-Jul 0 10
9-Jul 0 8
10-Jul 0 18
11-Jul 0 12
12-Jul 0 13
13-Jul 0 10
14-Jul 0 1
15-Jul 0 13
16-Jul 0 26
17-Jul 0 13
18-Jul 0 7
19-Jul 0 12

174
20-Jul 0 8
21-Jul 0 9
22-Jul 0 8
23-Jul 0 8
24-Jul 0 0
25-Jul 0 3
26-Jul 0 27
27-Jul 0 29
28-Jul 0 22
29-Jul 0 9
30-Jul 0 3
31-Jul 0 6
1-Aug 0 8
2-Aug 0 8
3-Aug 0 13
4-Aug 0 19
5-Aug 0 17
6-Aug 0 6
7-Aug 0 22
8-Aug 0 24
9-Aug 0 19
10-Aug 0 29
11-Aug 0 24
12-Aug 0 15
13-Aug 0 24
14-Aug 0 13
15-Aug 0 6
16-Aug 0 4
17-Aug 0 6
18-Aug 0 7
19-Aug 0 9

175
20-Aug 0 9
21-Aug 0 9
22-Aug 0 9
23-Aug 0 11
24-Aug 0 18
25-Aug 0 13
26-Aug 0 9
27-Aug 0 10
28-Aug 0 22
29-Aug 0 15
30-Aug 0 8
31-Aug 0 13
1-Sep 0 5
2-Sep 0 10
3-Sep 0 8
4-Sep 0 8
5-Sep 0 6
6-Sep 0 7
Total 22 933

176
Table A1. 5 Seasonal weather data recorded in onion plots at the MCRS, Holland Marsh, ON in 2015
Date
Temp.
(ᵒC)
VPD
(Kpa)
LWD
(h)
Rain
(m)
NVPD
(h)
NTemp.
(h)
WTemp.
(ᵒC)
DTemp.
(days)
DVPD
(days)
DLWD
(days)
TRain
(mm)
NRain
(days)
20-
May 8 0 2 0 11 1 5 0 1 0 0 0
21-
May 13 1 0 0 15 10 11 0 1 0 0 0
22-
May 9 0 2 0 13 0 13 0 2 0 0 0
23-
May 11 1 8 0 15 10 6 0 2 1 0 0
24-
May 19 1 0 0 21 16 17 1 2 1 0 0
25-
May 20 1 8 1 16 19 21 2 2 2 1 1
26-
May 24 1 8 0 15 24 23 3 2 3 0 1
27-
May 22 1 3 11 11 24 25 4 2 3 11 2
28-
May 19 1 9 0 11 18 19 5 2 4 0 2
29-
May 20 1 9 3 15 18 19 6 2 5 16 2
30-
May 20 0 2 7 11 20 23 7 2 5 23 3
31-
May 9 0 18 7 0 0 13 7 3 6 30 4
1-Jun 12 0 12 0 9 9 9 7 3 7 30 4
2-Jun 14 0 9 0 11 12 13 7 4 7 30 4
3-Jun 15 1 2 0 14 12 15 7 4 7 30 4
4-Jun 17 0 5 0 12 15 16 7 5 6 29 4

177
5-Jun 17 0 10 15 1 19 19 7 6 6 43 5
6-Jun 14 1 2 0 11 11 15 6 6 6 32 4
7-Jun 15 0 6 0 11 15 14 6 7 6 32 4
8-Jun 20 0 13 29 5 24 19 6 8 6 58 4
9-Jun 18 0 10 2 9 22 19 6 8 7 53 4
10-
Jun 19 0 11 1 11 17 18 7 8 7 47 3
11-
Jun 18 1 2 0 10 16 19 8 7 6 47 3
12-
Jun 15 0 11 29 0 17 18 9 7 6 76 4
13-
Jun 18 0 22 1 9 17 16 9 8 7 77 4
14-
Jun 17 0 10 12 2 20 19 9 8 8 89 5
15-
Jun 21 0 20 0 3 24 19 9 8 8 75 4
16-
Jun 20 0 14 6 10 23 22 10 9 9 81 5
17-
Jun 17 1 6 6 15 17 18 10 8 9 86 6
18-
Jun 19 1 1 0 12 16 18 10 7 8 58 5
19-
Jun 17 1 6 0 11 19 19 10 6 8 55 4
20-
Jun 17 1 7 0 15 16 15 10 5 8 54 4
21-
Jun 21 1 7 0 11 24 21 10 5 9 54 4
22-
Jun 20 1 8 7 13 18 19 10 4 9 32 4
23- 20 0 10 33 9 24 23 10 4 9 64 5

178
Jun
24-
Jun 19 1 5 0 12 16 17 10 3 8 52 4
25-
Jun 17 0 8 5 3 18 20 10 3 8 57 5
26-
Jun 18 0 17 0 12 17 17 10 3 8 51 4
27-
Jun 15 0 10 23 3 13 18 10 4 8 68 4
28-
Jun 14 0 20 8 0 9 15 9 5 9 76 5
29-
Jun 19 0 14 0 10 17 16 9 6 9 76 5
30-
Jun 16 0 12 1 0 16 19 9 7 9 77 5
1-Jul 18 0 20 0 3 23 17 9 8 9 77 5
2-Jul 17 1 9 0 12 14 16 9 8 9 70 4
3-Jul 16 0 8 0 11 14 15 9 8 9 37 3
4-Jul 18 1 8 0 12 15 17 9 8 10 37 3
5-Jul 20 0 9 0 13 17 20 9 8 10 32 2
6-Jul 22 1 10 0 12 22 22 9 7 10 32 2
7-Jul 21 0 6 28 4 24 23 9 7 10 37 2
8-Jul 18 0 18 0 10 18 18 10 7 10 29 1
9-Jul 18 0 11 0 10 14 17 10 7 10 29 1
10-Jul 19 1 10 0 13 16 18 10 6 10 28 1
11-Jul 22 1 10 0 13 17 21 10 5 10 28 1
12-Jul 22 1 9 0 14 20 22 10 5 10 28 1
13-Jul 23 1 8 0 14 22 23 10 4 10 28 1
14-Jul 22 0 5 5 8 24 23 10 5 9 33 2
15-Jul 16 0 7 0 10 13 18 10 5 9 33 2
16-Jul 17 0 9 0 12 15 16 10 6 9 33 2
17-Jul 17 0 9 2 0 20 18 10 6 9 6 1

179
18-Jul 25 0 13 0 12 24 20 10 6 9 6 1
19-Jul 25 1 8 0 12 24 26 10 5 9 6 1
20-Jul 22 1 8 0 15 20 22 10 5 9 6 1
21-Jul 21 1 9 2 13 24 23 10 5 9 8 1
22-Jul 19 1 0 0 13 17 19 10 5 8 8 1
23-Jul 18 1 7 0 14 15 18 10 5 8 8 1
24-Jul 20 1 9 0 14 16 19 10 4 9 3 0
25-Jul 24 1 8 0 12 24 24 10 3 9 3 0
26-Jul 23 1 10 0 14 21 23 10 2 9 3 0
27-Jul 24 1 8 0 13 23 24 10 1 9 2 0
28-Jul 24 1 10 0 13 22 24 10 0 9 2 0
29-Jul 25 1 10 0 14 24 25 10 0 9 2 0
30-Jul 25 1 2 0 21 24 26 10 0 8 2 0
31-Jul 22 1 6 0 16 20 22 10 0 8 0 0
1-Aug 20 1 5 2 13 21 21 10 0 8 2 1
2-Aug 19 0 11 18 8 16 19 10 1 8 21 2
3-Aug 20 1 15 1 11 24 20 10 1 8 22 2
4-Aug 19 0 6 3 8 23 20 10 2 8 25 3
5-Aug 17 0 11 0 10 14 17 10 3 8 25 3
6-Aug 17 0 9 0 11 14 16 10 4 8 25 3
7-Aug 18 0 10 0 11 14 18 10 5 8 25 3
8-Aug 17 0 11 0 9 15 18 10 6 8 25 3
9-Aug 18 1 9 0 12 15 17 10 6 9 25 3
10-
Aug 16 0 11 23 4 15 18 10 7 9 47 4
11-
Aug 20 0 18 1 9 24 19 10 8 10 45 3
12-
Aug 18 0 9 0 10 19 19 10 8 10 27 2
13-
Aug 19 0 9 0 11 16 16 10 9 10 26 2
14- 22 0 15 0 4 24 22 10 9 10 24 1

180
Aug
15-
Aug 23 1 14 0 10 24 22 10 8 10 24 1
16-
Aug 24 1 10 0 13 24 23 10 7 10 24 1
17-
Aug 25 1 8 0 13 24 25 10 6 10 24 1
18-
Aug 23 0 11 2 6 24 25 10 6 10 26 2
19-
Aug 24 0 12 0 9 24 23 10 7 10 26 2
20-
Aug 22 0 13 19 6 24 24 10 7 10 22 2
21-
Aug 18 0 6 0 9 20 19 10 7 10 22 2
22-
Aug 17 0 11 0 10 14 16 10 7 10 22 2
23-
Aug 18 0 11 0 9 15 17 10 7 10 22 2
24-
Aug 20 0 6 6 12 24 21 10 7 10 27 3
25-
Aug 16 0 10 1 5 13 17 10 8 10 28 3
26-
Aug 16 0 7 0 2 13 16 10 9 10 28 3
27-
Aug 15 0 14 0 5 10 15 10 10 10 28 3
28-
Aug 17 0 12 0 10 14 15 10 10 10 26 2
29-
Aug 18 0 11 0 5 16 18 10 10 10 26 2
30- 21 0 14 0 10 24 19 10 10 10 7 1

181
Aug
31-
Aug 22 0 9 0 9 23 21 10 10 10 7 1
1-Sep 23 0 14 0 9 24 23 10 10 10 7 1
2-Sep 24 0 12 0 10 24 23 10 10 10 7 1
3-Sep 23 0 16 1 5 24 24 10 10 10 2 0
4-Sep 22 1 14 0 13 24 22 10 9 10 1 0
5-Sep 23 1 8 0 13 20 21 10 8 10 1 0
6-Sep 24 1 11 0 11 24 24 10 7 10 1 0
7-Sep 26 1 12 0 13 24 25 10 6 10 1 0
8-Sep 25 1 12 0 11 24 26 10 5 10 1 0
9-Sep 21 0 8 7 12 23 25 10 5 10 7 1
10-
Sep 17 1 9 0 13 14 17 10 4 10 7 1
11-
Sep 16 0 10 1 6 14 17 10 4 10 8 1
12-
Sep 13 0 13 5 0 1 15 9 4 10 13 2
13-
Sep 12 0 20 7 0 0 12 8 4 10 19 3
14-
Sep 15 0 7 0 10 12 13 8 5 10 19 3
15-
Sep 19 1 11 0 11 15 16 8 5 10 19 3
16-
Sep 21 1 7 0 13 17 21 8 5 10 19 3
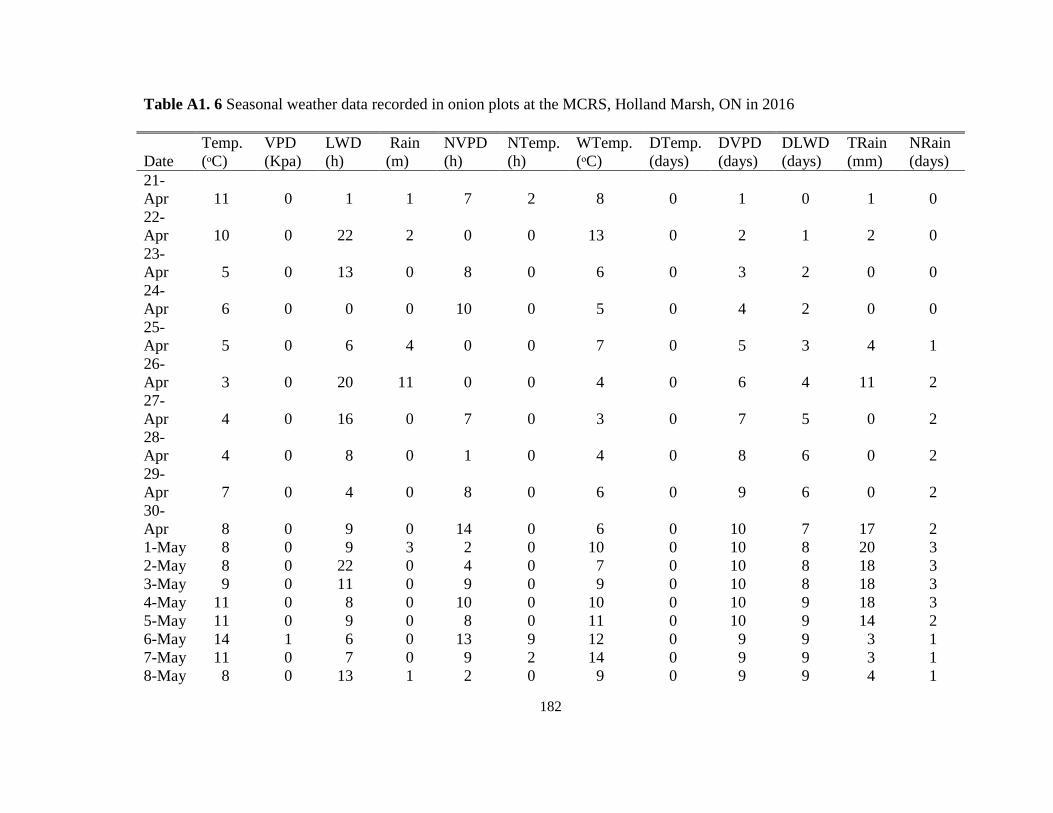
182
Table A1. 6 Seasonal weather data recorded in onion plots at the MCRS, Holland Marsh, ON in 2016
Date
Temp.
(ᵒC)
VPD
(Kpa)
LWD
(h)
Rain
(m)
NVPD
(h)
NTemp.
(h)
WTemp.
(ᵒC)
DTemp.
(days)
DVPD
(days)
DLWD
(days)
TRain
(mm)
NRain
(days)
21-
Apr 11 0 1 1 7 2 8 0 1 0 1 0
22-
Apr 10 0 22 2 0 0 13 0 2 1 2 0
23-
Apr 5 0 13 0 8 0 6 0 3 2 0 0
24-
Apr 6 0 0 0 10 0 5 0 4 2 0 0
25-
Apr 5 0 6 4 0 0 7 0 5 3 4 1
26-
Apr 3 0 20 11 0 0 4 0 6 4 11 2
27-
Apr 4 0 16 0 7 0 3 0 7 5 0 2
28-
Apr 4 0 8 0 1 0 4 0 8 6 0 2
29-
Apr 7 0 4 0 8 0 6 0 9 6 0 2
30-
Apr 8 0 9 0 14 0 6 0 10 7 17 2
1-May 8 0 9 3 2 0 10 0 10 8 20 3
2-May 8 0 22 0 4 0 7 0 10 8 18 3
3-May 9 0 11 0 9 0 9 0 10 8 18 3
4-May 11 0 8 0 10 0 10 0 10 9 18 3
5-May 11 0 9 0 8 0 11 0 10 9 14 2
6-May 14 1 6 0 13 9 12 0 9 9 3 1
7-May 11 0 7 0 9 2 14 0 9 9 3 1
8-May 8 0 13 1 2 0 9 0 9 9 4 1

183
9-May 7 0 12 0 9 0 7 0 9 10 4 1
10-
May 9 0 8 0 13 1 7 0 9 10 4 1
11-
May 12 1 6 0 13 10 11 0 8 10 1 0
12-
May 16 1 5 5 15 12 14 1 7 9 6 1
13-
May 16 0 11 19 10 5 18 2 7 9 25 2
14-
May 8 0 16 5 0 0 13 2 7 9 31 3
15-
May 3 0 1 1 0 0 4 2 7 8 32 3
16-
May 8 0 0 8 6 0 5 2 8 7 39 4
17-
May 10 0 13 0 9 0 9 2 8 7 39 4
18-
May 10 0 4 0 9 0 10 2 8 6 38 4
19-
May 14 1 0 0 12 7 13 2 7 5 38 4
20-
May 15 1 7 0 13 11 13 2 6 5 38 4
21-
May 16 1 4 0 15 10 16 3 6 4 38 4
22-
May 16 1 0 0 15 10 17 3 6 4 33 3
23-
May 17 1 0 0 15 12 15 3 5 3 14 2
24-
May 19 1 6 0 15 13 18 4 4 3 9 1
25- 22 1 0 0 20 16 22 5 3 3 8 1

184
May
26-
May 20 0 9 1 9 18 21 6 3 4 1 0
27-
May 24 1 14 0 14 23 22 7 2 4 1 0
28-
May 25 1 9 0 16 20 24 8 1 5 1 0
29-
May 25 1 5 0 19 24 26 9 1 5 1 0
30-
May 22 1 4 0 19 18 23 10 1 4 1 0
31-
May 17 1 8 0 13 12 19 10 1 5 1 0
1-Jun 16 1 8 0 12 10 15 10 1 6 1 0
2-Jun 20 1 9 1 12 13 19 10 1 7 2 0
3-Jun 19 1 10 0 14 13 19 10 1 7 2 0
4-Jun 20 1 8 0 15 16 19 10 1 8 2 0
5-Jun 19 0 12 9 6 12 21 10 1 8 10 1
6-Jun 17 0 13 0 9 8 18 10 2 8 10 1
7-Jun 15 0 10 0 8 2 16 9 3 8 10 1
8-Jun 10 0 0 0 2 0 12 8 4 8 10 1
9-Jun 12 1 1 0 12 5 10 7 4 8 10 1
10-Jun 16 1 4 0 16 12 13 7 4 7 10 1
11-Jun 22 1 6 12 18 16 19 7 4 7 23 2
12-Jun 16 1 0 0 19 3 20 7 4 6 22 2
13-Jun 13 0 0 0 10 0 14 6 5 5 22 2
14-Jun 15 1 8 0 13 11 13 6 5 5 22 2
15-Jun 18 1 7 0 13 12 17 6 4 5 13 1
16-Jun 21 1 16 14 14 14 20 6 3 5 26 2
17-Jun 22 1 11 0 16 16 21 7 2 5 26 2
18-Jun 22 1 8 0 14 15 22 8 1 6 26 2
19-Jun 24 1 10 0 16 17 24 9 1 7 26 2
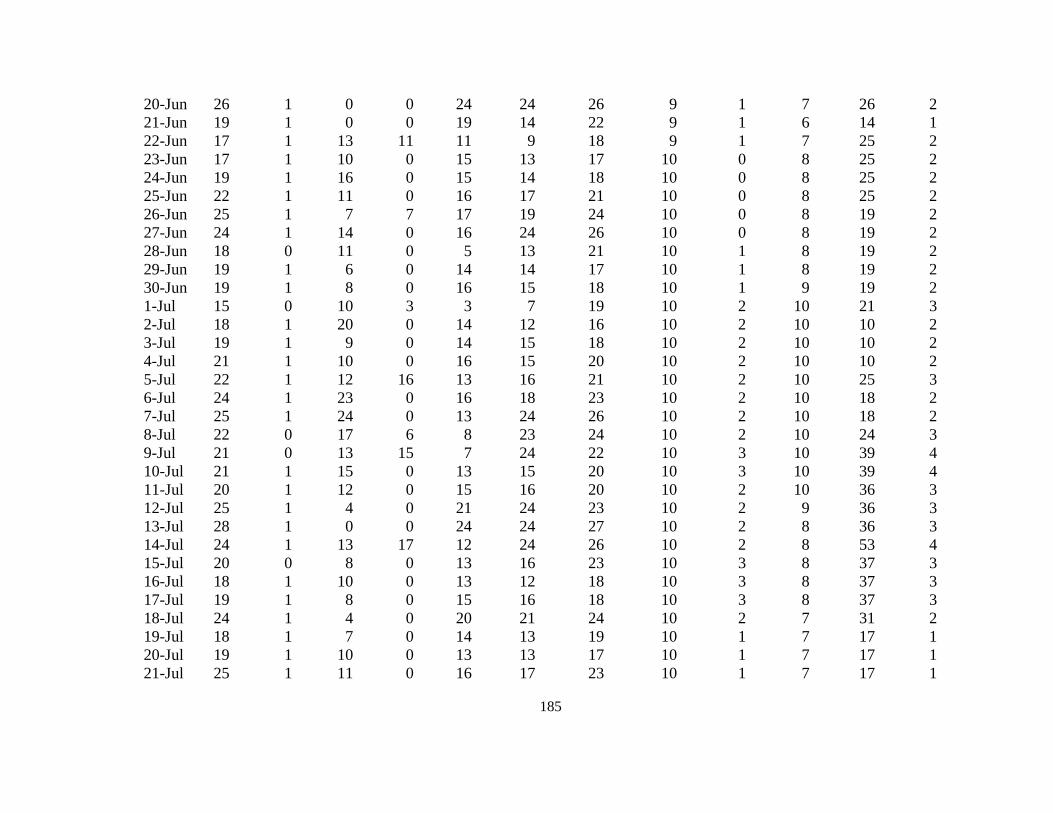
185
20-Jun 26 1 0 0 24 24 26 9 1 7 26 2
21-Jun 19 1 0 0 19 14 22 9 1 6 14 1
22-Jun 17 1 13 11 11 9 18 9 1 7 25 2
23-Jun 17 1 10 0 15 13 17 10 0 8 25 2
24-Jun 19 1 16 0 15 14 18 10 0 8 25 2
25-Jun 22 1 11 0 16 17 21 10 0 8 25 2
26-Jun 25 1 7 7 17 19 24 10 0 8 19 2
27-Jun 24 1 14 0 16 24 26 10 0 8 19 2
28-Jun 18 0 11 0 5 13 21 10 1 8 19 2
29-Jun 19 1 6 0 14 14 17 10 1 8 19 2
30-Jun 19 1 8 0 16 15 18 10 1 9 19 2
1-Jul 15 0 10 3 3 7 19 10 2 10 21 3
2-Jul 18 1 20 0 14 12 16 10 2 10 10 2
3-Jul 19 1 9 0 14 15 18 10 2 10 10 2
4-Jul 21 1 10 0 16 15 20 10 2 10 10 2
5-Jul 22 1 12 16 13 16 21 10 2 10 25 3
6-Jul 24 1 23 0 16 18 23 10 2 10 18 2
7-Jul 25 1 24 0 13 24 26 10 2 10 18 2
8-Jul 22 0 17 6 8 23 24 10 2 10 24 3
9-Jul 21 0 13 15 7 24 22 10 3 10 39 4
10-Jul 21 1 15 0 13 15 20 10 3 10 39 4
11-Jul 20 1 12 0 15 16 20 10 2 10 36 3
12-Jul 25 1 4 0 21 24 23 10 2 9 36 3
13-Jul 28 1 0 0 24 24 27 10 2 8 36 3
14-Jul 24 1 13 17 12 24 26 10 2 8 53 4
15-Jul 20 0 8 0 13 16 23 10 3 8 37 3
16-Jul 18 1 10 0 13 12 18 10 3 8 37 3
17-Jul 19 1 8 0 15 16 18 10 3 8 37 3
18-Jul 24 1 4 0 20 21 24 10 2 7 31 2
19-Jul 18 1 7 0 14 13 19 10 1 7 17 1
20-Jul 19 1 10 0 13 13 17 10 1 7 17 1
21-Jul 25 1 11 0 16 17 23 10 1 7 17 1

186
22-Jul 27 1 10 0 18 24 27 10 1 8 17 1
23-Jul 25 1 18 0 18 21 25 10 1 9 17 1
24-Jul 22 1 17 0 16 17 23 10 1 9 0 0
25-Jul 25 1 22 7 11 24 24 10 0 9 7 1
26-Jul 23 1 12 0 12 19 23 10 0 9 7 1
27-Jul 23 1 13 3 13 17 23 10 0 9 10 2
28-Jul 23 1 16 0 13 22 23 10 0 10 10 2
29-Jul 21 1 9 0 15 20 22 10 0 10 10 2
30-Jul 21 1 0 0 13 16 21 10 0 9 10 2
31-Jul 20 0 10 0 11 17 21 10 1 9 10 2
1-Aug 23 1 17 0 12 24 21 10 1 9 10 2
2-Aug 23 1 11 0 14 16 22 10 1 9 10 2
3-Aug 23 1 9 0 15 17 23 10 1 9 10 2
4-Aug 25 1 9 0 16 18 24 10 1 9 3 1
5-Aug 26 1 9 5 12 24 27 10 1 9 8 2
6-Aug 22 1 13 0 12 17 23 10 1 9 5 1
7-Aug 21 1 24 0 13 14 21 10 1 9 5 1
8-Aug 21 1 11 0 14 14 19 10 1 9 5 1
9-Aug 22 1 9 0 15 16 21 10 1 10 5 1
10-
Aug 26 1 5 0 16 23 25 10 0 9 5 1
11-
Aug 26 1 11 0 13 20 26 10 0 9 5 1
12-
Aug 27 1 13 0 11 24 28 10 0 9 5 1
13-
Aug 24 0 17 35 0 24 26 10 1 9 40 2
14-
Aug 22 0 20 0 9 23 23 10 2 9 40 2
15-
Aug 21 0 11 0 12 17 20 10 3 9 35 1
16- 21 0 15 20 0 23 22 10 4 9 55 2

187
Aug
17-
Aug 21 0 24 0 7 16 20 10 5 9 55 2
18-
Aug 22 0 24 0 9 18 21 10 6 9 55 2
19-
Aug 23 1 24 0 13 17 23 10 6 9 55 2
20-
Aug 25 1 24 0 10 24 25 10 6 10 55 2
21-
Aug 22 1 19 2 13 20 25 10 6 10 57 2
22-
Aug 17 0 20 0 10 10 17 10 7 10 57 2
23-
Aug 20 1 15 0 12 16 17 10 6 10 22 1
24-
Aug 23 1 14 0 15 17 21 10 5 10 22 1
25-
Aug 24 0 11 1 8 24 25 10 5 10 23 1
26-
Aug 22 1 14 0 11 17 23 10 4 10 3 0
27-
Aug 21 1 11 0 15 16 21 10 3 10 2 0
28-
Aug 23 1 8 0 12 22 23 10 2 10 2 0
29-
Aug 20 0 13 0 11 14 21 10 3 10 2 0
30-
Aug 21 1 11 0 10 16 20 10 3 10 2 0
31-
Aug 22 1 12 0 11 21 24 10 3 10 1 0
1-Sep 17 0 9 0 8 11 18 10 3 10 1 0

188
2-Sep 16 0 7 0 10 9 17 10 4 10 1 0
3-Sep 15 0 10 0 10 10 15 10 5 10 1 0
4-Sep 16 0 10 0 10 10 16 10 5 10 0 0
5-Sep 19 1 11 0 12 14 17 10 5 10 0 0
6-Sep 24 1 8 0 14 17 23 10 5 10 0 0
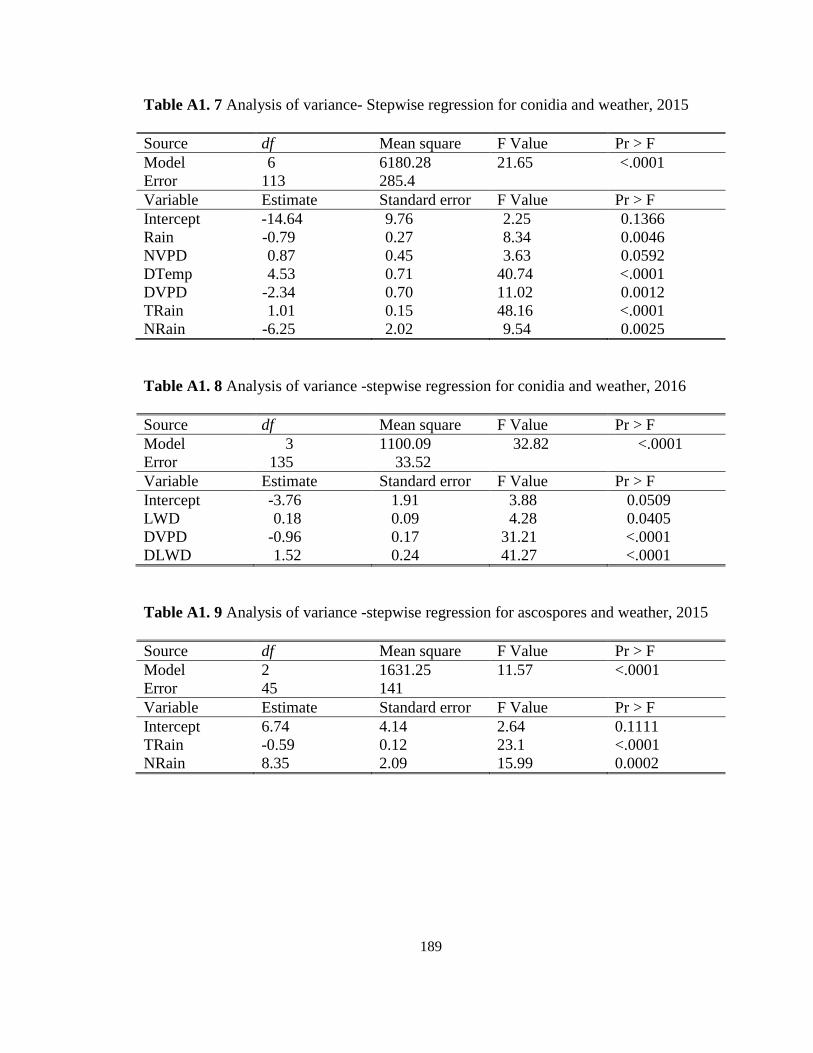
189
Table A1. 7 Analysis of variance- Stepwise regression for conidia and weather, 2015
Source df Mean square F Value Pr > F
Model 6 6180.28 21.65 <.0001
Error 113 285.4
Variable Estimate Standard error F Value Pr > F
Intercept -14.64 9.76 2.25 0.1366
Rain -0.79 0.27 8.34 0.0046
NVPD 0.87 0.45 3.63 0.0592
DTemp 4.53 0.71 40.74 <.0001
DVPD -2.34 0.70 11.02 0.0012
TRain 1.01 0.15 48.16 <.0001
NRain -6.25 2.02 9.54 0.0025
Table A1. 8 Analysis of variance -stepwise regression for conidia and weather, 2016
Source df Mean square F Value Pr > F
Model 3 1100.09 32.82 <.0001
Error 135 33.52
Variable Estimate Standard error F Value Pr > F
Intercept -3.76 1.91 3.88 0.0509
LWD 0.18 0.09 4.28 0.0405
DVPD -0.96 0.17 31.21 <.0001
DLWD 1.52 0.24 41.27 <.0001
Table A1. 9 Analysis of variance -stepwise regression for ascospores and weather, 2015
Source df Mean square F Value Pr > F
Model 2 1631.25 11.57 <.0001
Error 45 141
Variable Estimate Standard error F Value Pr > F
Intercept 6.74 4.14 2.64 0.1111
TRain -0.59 0.12 23.1 <.0001
NRain 8.35 2.09 15.99 0.0002
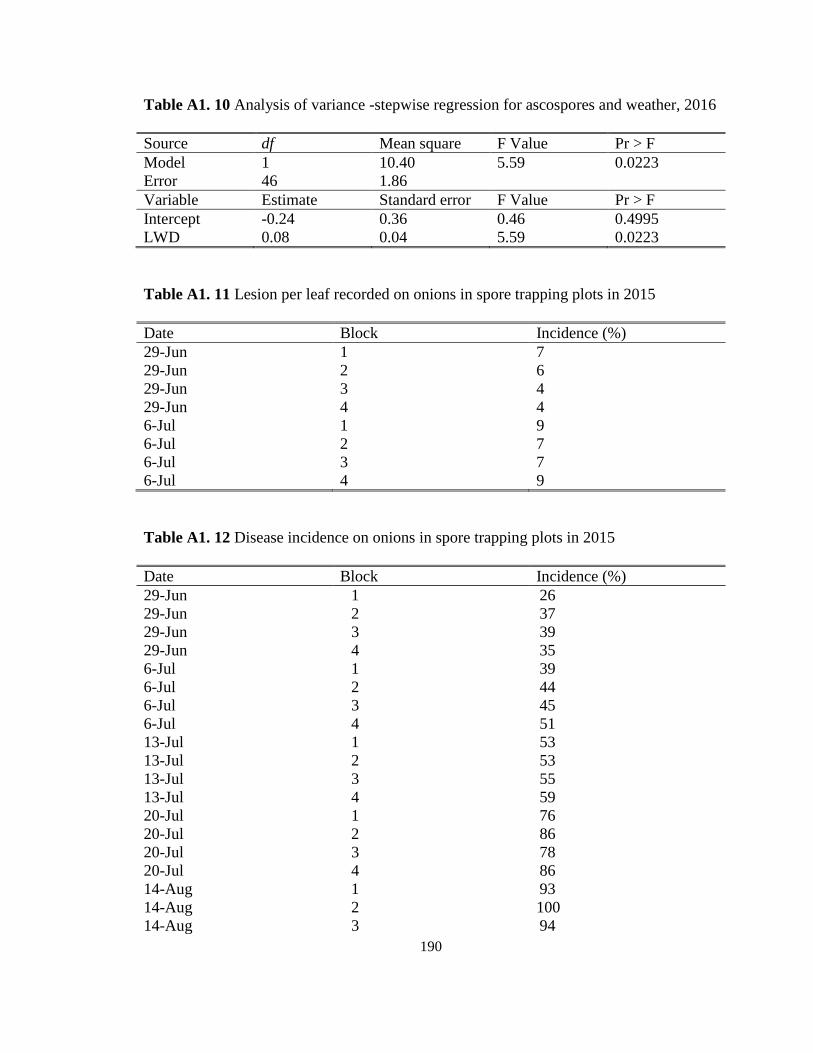
190
Table A1. 10 Analysis of variance -stepwise regression for ascospores and weather, 2016
Source df Mean square F Value Pr > F
Model 1 10.40 5.59 0.0223
Error 46 1.86
Variable Estimate Standard error F Value Pr > F
Intercept -0.24 0.36 0.46 0.4995
LWD 0.08 0.04 5.59 0.0223
Table A1. 11 Lesion per leaf recorded on onions in spore trapping plots in 2015
Date Block Incidence (%)
29-Jun 1 7
29-Jun 2 6
29-Jun 3 4
29-Jun 4 4
6-Jul 1 9
6-Jul 2 7
6-Jul 3 7
6-Jul 4 9
Table A1. 12 Disease incidence on onions in spore trapping plots in 2015
Date Block Incidence (%)
29-Jun 1 26
29-Jun 2 37
29-Jun 3 39
29-Jun 4 35
6-Jul 1 39
6-Jul 2 44
6-Jul 3 45
6-Jul 4 51
13-Jul 1 53
13-Jul 2 53
13-Jul 3 55
13-Jul 4 59
20-Jul 1 76
20-Jul 2 86
20-Jul 3 78
20-Jul 4 86
14-Aug 1 93
14-Aug 2 100
14-Aug 3 94

191
14-Aug 4 100
Table A1. 13 Leaf dieback on onion in spore trapping plots in 2015
Date Block Leaf dieback (%)
20-Jul 1 27
20-Jul 2 20
20-Jul 3 22
20-Jul 4 11
27-Jul 1 38
27-Jul 2 31
27-Jul 3 35
27-Jul 4 26
4-Aug 1 42
4-Aug 2 43
4-Aug 3 44
4-Aug 4 34
14-Aug 1 70
14-Aug 2 68
14-Aug 3 70
14-Aug 4 53
Table A1. 14 Lesion per leaf recorded on onions in spore trapping plots in 2016
Date Block Incidence (%)
7-Jul 1 2
7-Jul 2 4
7-Jul 3 0
7-Jul 4 2
11-Jul 1 2
11-Jul 2 5
11-Jul 3 1
11-Jul 4 5
19-Jul 1 3
19-Jul 2 5
19-Jul 3 7
19-Jul 4 5

192
Table A1. 15 Disease incidence on onions in spore trapping plots in 2016
Date Block Incidence (%)
11-Jul 1 12
11-Jul 2 13
11-Jul 3 11
11-Jul 4 11
19-Jul 1 17
19-Jul 2 13
19-Jul 3 14
19-Jul 4 15
25-Jul 1 17
25-Jul 2 14
25-Jul 3 17
25-Jul 4 18
3-Aug 1 23
3-Aug 2 16
3-Aug 3 28
3-Aug 4 19
11-Aug 1 26
11-Aug 2 16
11-Aug 3 31
11-Aug 4 25
Table A1. 16 Leaf dieback on onion in spore trapping plots in 2016
Date Block Leaf dieback(%)
19-Jul 1 9
19-Jul 2 5
19-Jul 3 0
19-Jul 4 15
25-Jul 1 14
25-Jul 2 12
25-Jul 3 4
25-Jul 4 24
3-Aug 1 14
3-Aug 2 19
3-Aug 3 13
3-Aug 4 29
11-Aug 1 23
11-Aug 2 31
11-Aug 3 18
11-Aug 4 34

193
APPENDIX 2: SUPPLEMENTARY TABLES FOR CHAPTER THREE
Table A2. 1 Controlled environment study- Pooled data: the number of lesion per leaf -
onion cultivars inoculated with different S. vesicarium isolates. (Data log transformed)
Random effects Estimate Standard
error
Z value Pr > Z
Block 0.01 0.01 0.69 0.2446
Residual 0.07 0.01 13.27 <.0001
Fixed effects Num df Den df F Pr > F
Cultivar 12 352 2.19 0.0117
Isolate 4 352 32.9 <.0001
Cultivar*isolate 48 352 1.03 0.4302
Repetition 1 352 0.13 0.7209
Cultivar*repetition 11 352 0.21 0.9971
Inoculum*repetition 4 352 0.09 0.9845
Cultivar*isolate*repetition 44 352 0.15 1.000
Table A2. 2 Controlled environment study- Pooled data: the percentage leaf dieback-
onion cultivars inoculated with different S. vesicarium isolates. (Data log transformed)
Random effects Estimate Standard
error
Z value Pr > Z
Block 0.00 0.00 0.67 0.2505
Residual 0.04 0.00 13.29 <.0001
Fixed effects Num df Den df F Pr > F
Cultivar 12 353 10.45 <.0001
Isolate 4 353 57.07 <.0001
Cultivar*isolate 48 353 1.18 0.207
Repetition 1 353 1.74 0.1883
Cultivar*repetition 11 353 0.36 0.9716
Inoculum*repetition 4 353 0.03 0.9987
Cultivar*isolate*repetition 44 353 0.03 1.000
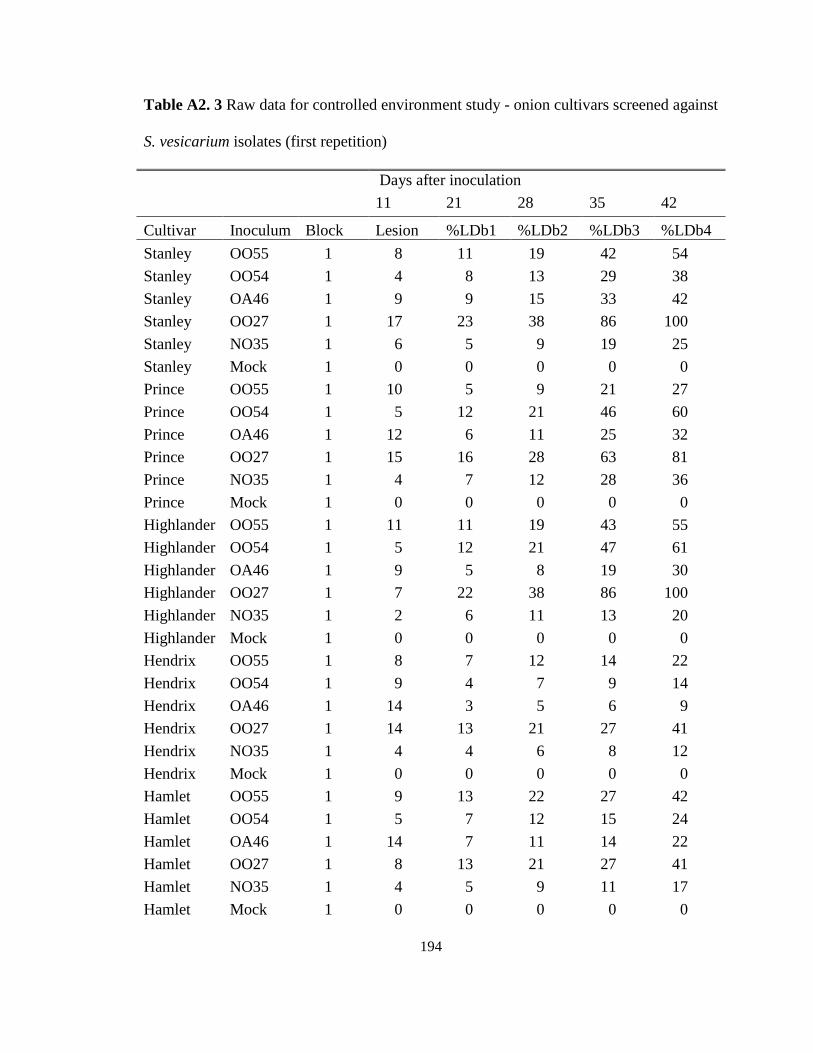
194
Table A2. 3 Raw data for controlled environment study - onion cultivars screened against
S. vesicarium isolates (first repetition)
Days after inoculation
11 21 28 35 42
Cultivar Inoculum Block Lesion %LDb1 %LDb2 %LDb3 %LDb4
Stanley OO55 1 8 11 19 42 54
Stanley OO54 1 4 8 13 29 38
Stanley OA46 1 9 9 15 33 42
Stanley OO27 1 17 23 38 86 100
Stanley NO35 1 6 5 9 19 25
Stanley Mock 1 0 0 0 0 0
Prince OO55 1 10 5 9 21 27
Prince OO54 1 5 12 21 46 60
Prince OA46 1 12 6 11 25 32
Prince OO27 1 15 16 28 63 81
Prince NO35 1 4 7 12 28 36
Prince Mock 1 0 0 0 0 0
Highlander OO55 1 11 11 19 43 55
Highlander OO54 1 5 12 21 47 61
Highlander OA46 1 9 5 8 19 30
Highlander OO27 1 7 22 38 86 100
Highlander NO35 1 2 6 11 13 20
Highlander Mock 1 0 0 0 0 0
Hendrix OO55 1 8 7 12 14 22
Hendrix OO54 1 9 4 7 9 14
Hendrix OA46 1 14 3 5 6 9
Hendrix OO27 1 14 13 21 27 41
Hendrix NO35 1 4 4 6 8 12
Hendrix Mock 1 0 0 0 0 0
Hamlet OO55 1 9 13 22 27 42
Hamlet OO54 1 5 7 12 15 24
Hamlet OA46 1 14 7 11 14 22
Hamlet OO27 1 8 13 21 27 41
Hamlet NO35 1 4 5 9 11 17
Hamlet Mock 1 0 0 0 0 0

195
Trailblazer OO55 1 15 11 21 27 41
Trailblazer OO54 1 10 8 15 18 39
Trailblazer OA46 1 15 10 20 25 54
Trailblazer OO27 1 17 12 24 29 63
Trailblazer NO35 1 6 8 16 20 44
Trailblazer Mock 1 0 0 0 0 0
Madras OO55 1 5 7 14 18 38
Madras OO54 1 13 10 19 24 51
Madras OA46 1 10 8 15 34 73
Madras OO27 1 8 9 18 40 46
Madras NO35 1 7 4 7 17 19
Madras Mock 1 0 0 0 0 0
Patterson OO55 1 13 10 19 43 50
Patterson OO54 1 15 15 28 64 73
Patterson OA46 1 10 11 22 50 58
Patterson OO27 1 16 30 58 67 86
Patterson NO35 1 3 12 24 54 62
Patterson Mock 1 0 0 0 0 0
Milestone OO55 1 18 7 13 29 34
Milestone OO54 1 8 8 15 33 38
Milestone OA46 1 12 4 9 19 22
Milestone OO27 1 11 8 15 35 40
Milestone NO35 1 6 6 12 26 30
Milestone Mock 1 0 0 0 0 0
Genesis OO55 1 7 12 23 51 59
Genesis OO54 1 9 7 13 29 34
Genesis OA46 1 10 7 14 26 30
Genesis OO27 1 6 17 32 60 69
Genesis NO35 1 5 8 14 27 31
Genesis Mock 1 0 0 0 0 0
LaSalle OO55 1 8 6 10 19 21
LaSalle OO54 1 5 6 10 19 21
LaSalle OA46 1 6 13 23 43 49
LaSalle OO27 1 10 15 25 47 54
LaSalle NO35 1 4 7 11 21 24
LaSalle Mock 1 0 0 0 0 0
Pontiac OO55 1 8 3 5 9 10

196
Pontiac OO54 1 3 4 7 12 14
Pontiac OA46 1 12 2 3 6 7
Pontiac OO27 1 8 12 21 39 45
Pontiac NO35 1 5 2 3 6 7
Pontiac Mock 1 0 0 0 0 0
Stanley OO55 2 4 15 26 48 55
Stanley OO54 2 2 9 16 29 45
Stanley OA46 2 4 8 13 25 39
Stanley OO27 2 8 12 22 40 63
Stanley NO35 2 3 4 8 14 22
Stanley Mock 2 0 0 0 0 0
Prince OO55 2 5 8 14 25 39
Prince OO54 2 2 6 11 20 31
Prince OA46 2 7 4 7 13 21
Prince OO27 2 5 12 21 39 61
Prince NO35 2 3 4 7 12 19
Prince Mock 2 0 0 0 0 0
Highlander OO55 2 3 15 26 48 74
Highlander OO54 2 4 11 20 37 57
Highlander OA46 2 8 2 2 5 7
Highlander OO27 2 8 24 37 70 88
Highlander NO35 2 1 4 6 11 17
Highlander Mock 2 0 0 0 0 0
Hendrix OO55 2 3 9 14 26 40
Hendrix OO54 2 2 11 18 33 51
Hendrix OA46 2 7 9 13 25 38
Hendrix OO27 2 8 5 8 14 22
Hendrix NO35 2 4 5 8 13 21
Hendrix Mock 2 0 0 0 0 0
Hendrix Mock 2 0 0 0 0 0
Hamlet OO55 2 3 13 20 34 52
Hamlet OO54 2 2 8 12 21 32
Hamlet OA46 2 8 7 11 18 28
Hamlet OO27 2 7 19 29 50 77
Hamlet NO35 2 1 6 9 16 24
Hamlet Mock 2 0 0 0 0 0
Trailblazer OO55 2 2 13 19 33 51

197
Trailblazer OO54 2 3 7 10 18 27
Trailblazer OA46 2 9 10 15 26 40
Trailblazer OO27 2 8 23 35 59 91
Trailblazer NO35 2 2 6 9 14 22
Trailblazer Mock 2 0 0 0 0 0
Madras OO55 2 3 7 10 18 28
Madras OO54 2 6 8 12 20 31
Madras OA46 2 8 3 5 9 14
Madras OO27 2 9 15 23 39 62
Madras NO35 2 3 2 4 6 10
Madras Mock 2 0 0 0 0 0
Patterson OO55 2 8 7 10 17 27
Patterson OO54 2 4 9 13 22 36
Patterson OA46 2 6 4 6 10 16
Patterson OO27 2 13 18 27 46 73
Patterson NO35 2 2 4 6 10 16
Patterson Mock 2 0 0 0 0 0
Milestone OO55 2 4 7 10 19 31
Milestone OO54 2 5 6 9 17 28
Milestone OA46 2 7 3 4 7 12
Milestone OO27 2 8 17 26 49 79
Milestone NO35 2 3 4 6 11 18
Milestone Mock 2 0 0 0 0 0
Genesis OO55 2 5 6 9 16 26
Genesis OO54 2 2 9 13 26 41
Genesis OA46 2 12 2 3 6 9
Genesis OO27 2 11 12 17 33 53
Genesis NO35 2 4 4 6 11 18
Genesis Mock 2 0 0 0 0 0
LaSalle OO55 2 3 5 7 13 21
LaSalle OO54 2 4 9 13 26 41
LaSalle OA46 2 11 3 5 10 16
LaSalle OO27 2 7 15 22 42 67
LaSalle NO35 2 3 6 9 18 28
LaSalle Mock 2 0 0 0 0 0
Pontiac OO55 2 2 2 4 7 11
Pontiac OO54 2 2 6 9 16 26
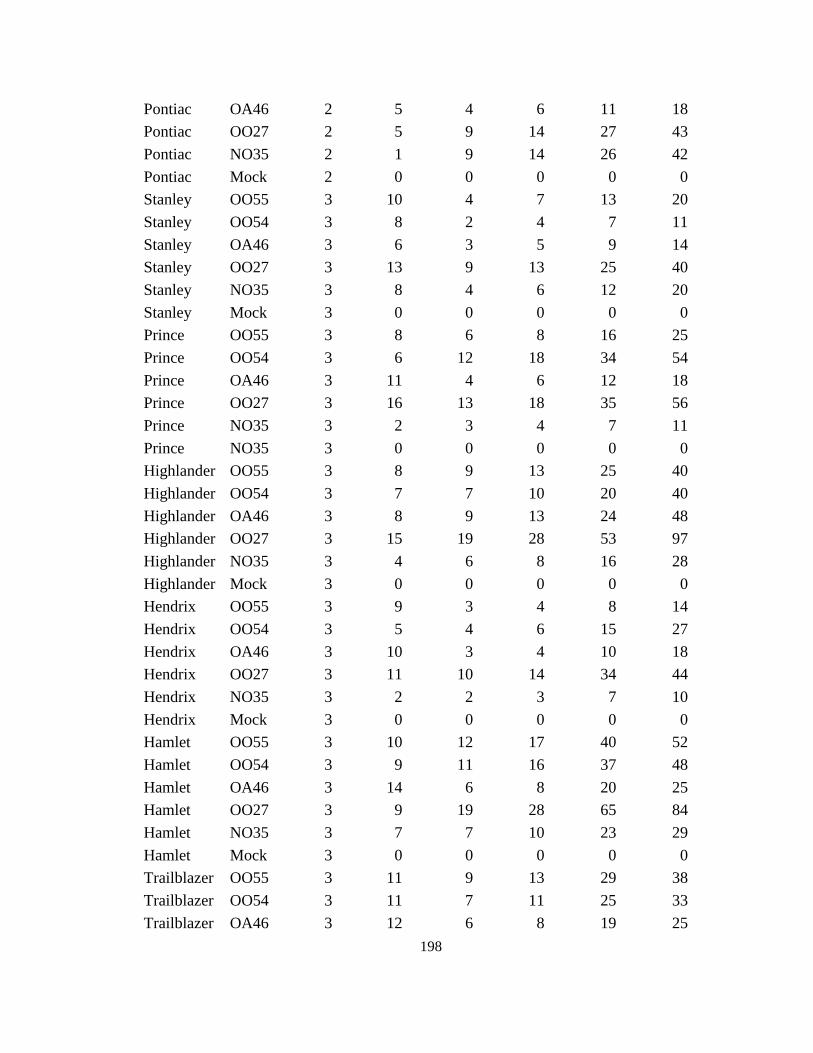
198
Pontiac OA46 2 5 4 6 11 18
Pontiac OO27 2 5 9 14 27 43
Pontiac NO35 2 1 9 14 26 42
Pontiac Mock 2 0 0 0 0 0
Stanley OO55 3 10 4 7 13 20
Stanley OO54 3 8 2 4 7 11
Stanley OA46 3 6 3 5 9 14
Stanley OO27 3 13 9 13 25 40
Stanley NO35 3 8 4 6 12 20
Stanley Mock 3 0 0 0 0 0
Prince OO55 3 8 6 8 16 25
Prince OO54 3 6 12 18 34 54
Prince OA46 3 11 4 6 12 18
Prince OO27 3 16 13 18 35 56
Prince NO35 3 2 3 4 7 11
Prince NO35 3 0 0 0 0 0
Highlander OO55 3 8 9 13 25 40
Highlander OO54 3 7 7 10 20 40
Highlander OA46 3 8 9 13 24 48
Highlander OO27 3 15 19 28 53 97
Highlander NO35 3 4 6 8 16 28
Highlander Mock 3 0 0 0 0 0
Hendrix OO55 3 9 3 4 8 14
Hendrix OO54 3 5 4 6 15 27
Hendrix OA46 3 10 3 4 10 18
Hendrix OO27 3 11 10 14 34 44
Hendrix NO35 3 2 2 3 7 10
Hendrix Mock 3 0 0 0 0 0
Hamlet OO55 3 10 12 17 40 52
Hamlet OO54 3 9 11 16 37 48
Hamlet OA46 3 14 6 8 20 25
Hamlet OO27 3 9 19 28 65 84
Hamlet NO35 3 7 7 10 23 29
Hamlet Mock 3 0 0 0 0 0
Trailblazer OO55 3 11 9 13 29 38
Trailblazer OO54 3 11 7 11 25 33
Trailblazer OA46 3 12 6 8 19 25

199
Trailblazer OO27 3 7 18 26 61 79
Trailblazer NO35 3 8 10 15 34 45
Trailblazer Mock 3 0 0 0 0 0
Madras OO55 3 11 7 11 25 32
Madras OO54 3 12 5 7 17 22
Madras OA46 3 6 5 8 18 24
Madras OO27 3 8 12 17 40 54
Madras NO35 3 7 4 6 15 20
Madras Mock 3 0 0 0 0 0
Patterson OO55 3 10 7 11 25 35
Patterson OO54 3 13 4 7 17 24
Patterson OA46 3 5 5 10 22 30
Patterson OO27 3 15 26 48 62 85
Patterson NO35 3 5 8 16 37 47
Patterson Mock 3 0 0 0 0 0
Milestone OO55 3 13 6 12 27 35
Milestone OO54 3 6 4 7 17 21
Milestone OA46 3 9 6 11 25 33
Milestone OO27 3 11 12 23 53 68
Milestone NO35 3 8 3 6 14 18
Milestone Mock 3 0 0 0 0 0
Genesis OO55 3 6 7 13 31 40
Genesis OO54 3 4 10 18 41 53
Genesis OA46 3 8 7 14 33 42
Genesis OO27 3 6 18 34 79 100
Genesis NO35 3 7 8 15 35 45
Genesis Mock 3 0 0 0 0 0
LaSalle OO55 3 4 11 21 31 40
LaSalle OO54 3 10 10 19 28 36
LaSalle OA46 3 13 12 21 32 41
LaSalle OO27 3 16 15 27 40 52
LaSalle NO35 3 7 7 12 18 23
LaSalle Mock 3 0 0 0 0 0
Pontiac OO55 3 7 3 5 7 9
Pontiac OO54 3 8 6 11 16 21
Pontiac OA46 3 13 6 11 16 21
Pontiac OO27 3 11 11 20 29 38

200
Pontiac NO35 3 4 4 7 11 14
Pontiac Mock 3 0 0 0 0 0
Stanley OO55 4 4 15 27 40 49
Stanley OO54 4 1 11 20 30 36
Stanley OA46 4 3 7 14 20 24
Stanley OO27 4 5 20 37 56 67
Stanley NO35 4 1 15 32 48 57
Stanley Mock 4 0 0 0 0 0
Prince OO55 4 4 28 60 89 100
Prince OO54 4 4 23 50 75 90
Prince OA46 4 3 6 14 20 25
Prince OO27 4 6 19 41 61 74
Prince NO35 4 4 13 28 41 49
Prince Mock 4 0 0 0 0 0
Highlander OO55 4 3 30 64 76 85
Highlander OO54 4 4 36 78 86 100
Highlander OA46 4 8 17 37 55 65
Highlander OO27 4 5 36 78 88 98
Highlander NO35 4 4 19 41 61 74
Highlander Mock 4 0 0 0 0 0
Hendrix OO55 4 4 11 23 34 41
Hendrix OO54 4 5 15 32 48 57
Hendrix OA46 4 8 8 18 27 33
Hendrix OO27 4 7 32 69 82 100
Hendrix NO35 4 1 12 25 38 45
Hendrix Mock 4 0 0 0 0 0
Hamlet OO55 4 4 28 60 89 100
Hamlet OO54 4 3 23 50 75 90
Hamlet OA46 4 4 13 28 41 49
Hamlet OO27 4 6 30 64 86 100
Hamlet NO35 4 2 21 46 68 82
Hamlet Mock 4 0 0 0 0 0
Trailblazer OO55 4 3 11 23 34 41
Trailblazer OO54 4 1 15 32 48 57
Trailblazer OA46 4 7 8 18 27 33
Trailblazer OO27 4 9 19 41 61 74
Trailblazer NO35 4 2 2 5 7 8

201
Trailblazer Mock 4 0 0 0 0 0
Madras OO55 4 5 17 37 55 65
Madras OO54 4 6 6 14 20 25
Madras OA46 4 7 15 32 58 69
Madras OO27 4 7 32 69 84 100
Madras NO35 4 3 8 18 33 40
Madras Mock 4 0 0 0 0 0
Patterson OO55 4 4 19 41 74 89
Patterson OO54 4 3 8 18 33 40
Patterson OA46 4 9 8 18 33 40
Patterson OO27 4 6 23 50 71 89
Patterson NO35 4 4 4 9 17 20
Patterson Mock 4 0 0 0 0 0
Milestone OO55 4 1 15 32 58 69
Milestone OO54 4 3 4 9 17 20
Milestone OA46 4 10 4 9 17 20
Milestone OO27 4 8 21 46 83 99
Milestone NO35 4 2 4 9 17 20
Milestone Mock 4 0 0 0 0 0
Genesis OO55 4 7 17 37 66 79
Genesis OO54 4 2 19 41 74 89
Genesis OA46 4 6 7 16 29 35
Genesis OO27 4 6 14 30 54 64
Genesis NO35 4 5 7 15 26 32
Genesis Mock 4 0 0 0 0 0
LaSalle OO55 4 6 8 17 31 37
LaSalle OO54 4 1 5 11 20 24
LaSalle OA46 4 4 8 17 31 37
LaSalle OO27 4 8 34 72 100 100
LaSalle NO35 4 1 7 15 26 32
LaSalle Mock 4 0 0 0 0 0
Pontiac OO55 4 2 11 24 43 51
Pontiac OO54 4 1 4 10 17 21
Pontiac OA46 4 2 4 10 17 21
Pontiac OO27 4 8 11 25 45 53
Pontiac NO35 4 0 0 0 0 0
Pontiac Mock 4 0 0 0 0 0

202
Table A2. 4 Raw data for controlled environment study - onion cultivars screened against
S. vesicarium isolates (second repetition)
Days after inoculation 14 24 31 38 45
Cultivar Inoculum Block Lesion %LDb1 %LDb2 %LDb3 %LDb4
Stanley OO55 1 5 9 16 36 46
Stanley OO54 1 5 7 11 25 32
Stanley OA46 1 12 7 12 28 36
Stanley OO27 1 18 19 33 74 95
Stanley NO35 1 5 4 7 17 21
Stanley Mock 1 0 0 0 0 0
Prince OO55 1 13 5 8 18 23
Prince OO54 1 3 10 18 40 51
Prince OA46 1 16 6 9 21 27
Prince OO27 1 18 14 24 54 69
Prince NO35 1 5 7 12 28 36
Prince Mock 1 0 0 0 0 0
Highlander OO55 1 17 11 19 44 56
Highlander OO54 1 7 13 21 48 62
Highlander OA46 1 12 5 9 19 30
Highlander OO27 1 10 23 39 87 91
Highlander NO35 1 1 6 11 13 21
Highlander Mock 1 0 0 0 0 0
Hendrix OO55 1 12 7 12 15 23
Hendrix OO54 1 11 4 7 9 14
Hendrix OA46 1 14 3 5 6 9
Hendrix OO27 1 10 13 22 27 42
Hendrix NO35 1 5 4 7 9 14
Hendrix Mock 1 0 0 0 0 0
Hamlet OO55 1 11 15 26 32 50
Hamlet OO54 1 7 9 15 18 28
Hamlet OA46 1 17 8 13 16 25
Hamlet OO27 1 8 15 25 32 49
Hamlet NO35 1 4 6 10 13 20
Hamlet Mock 1 0 0 0 0 0
Trailblazer OO55 1 16 11 22 27 42

203
Trailblazer OO54 1 11 8 15 19 41
Trailblazer OA46 1 16 11 21 26 55
Trailblazer OO27 1 18 12 24 30 65
Trailblazer NO35 1 8 9 17 21 45
Trailblazer Mock 1 0 0 0 0 0
Madras OO55 1 3 8 15 18 39
Madras OO54 1 20 10 19 24 52
Madras OA46 1 8 8 15 35 75
Madras OO27 1 5 9 18 41 47
Madras NO35 1 6 2 5 11 12
Madras Mock 1 0 0 0 0 0
Patterson OO55 1 17 6 12 28 32
Patterson OO54 1 19 9 18 41 47
Patterson OA46 1 9 7 14 32 37
Patterson OO27 1 19 19 37 84 97
Patterson NO35 1 5 8 15 35 40
Patterson Mock 1 0 0 0 0 0
Milestone OO55 1 23 4 8 19 22
Milestone OO54 1 9 5 10 21 25
Milestone OA46 1 11 3 6 13 14
Milestone OO27 1 14 5 10 22 26
Milestone NO35 1 7 4 8 17 20
Milestone Mock 1 0 0 0 0 0
Genesis OO55 1 6 8 15 33 38
Genesis OO54 1 8 4 8 19 22
Genesis OA46 1 10 5 9 17 20
Genesis OO27 1 8 11 21 38 44
Genesis NO35 1 2 6 10 19 22
Genesis Mock 1 0 0 0 0 0
LaSalle OO55 1 8 4 7 13 15
LaSalle OO54 1 3 4 7 13 15
LaSalle OA46 1 8 9 16 31 35
LaSalle OO27 1 10 10 18 34 39
LaSalle NO35 1 4 5 8 15 18
LaSalle Mock 1 0 0 0 0 0
Pontiac OO55 1 8 3 5 10 11
Pontiac OO54 1 2 4 7 14 16

204
Pontiac OA46 1 16 2 4 7 8
Pontiac OO27 1 8 14 24 44 51
Pontiac NO35 1 5 2 4 7 8
Pontiac Mock 1 0 0 0 0 0
Stanley OO55 2 5 17 30 55 63
Stanley OO54 2 1 10 18 33 51
Stanley OA46 2 3 9 15 29 44
Stanley OO27 2 10 14 25 46 72
Stanley NO35 2 1 5 9 17 26
Stanley Mock 2 0 0 0 0 0
Prince OO55 2 8 9 16 29 45
Prince OO54 2 3 7 12 23 36
Prince OA46 2 8 5 8 15 24
Prince OO27 2 3 14 24 45 70
Prince NO35 2 4 4 7 14 22
Prince Mock 2 0 0 0 0 0
Highlander OO55 2 5 17 30 55 85
Highlander OO54 2 3 13 23 42 66
Highlander OA46 2 10 2 3 6 9
Highlander OO27 2 10 31 48 90 100
Highlander NO35 2 1 5 8 14 22
Highlander Mock 2 0 0 0 0 0
Hendrix OO55 2 4 11 18 33 51
Hendrix OO54 2 2 15 23 42 66
Hendrix OA46 2 9 11 17 32 49
Hendrix OO27 2 10 7 11 18 28
Hendrix NO35 2 5 7 10 17 27
Hendrix Mock 2 0 0 0 0 0
Hamlet OO55 2 2 16 26 43 67
Hamlet OO54 2 1 10 16 27 42
Hamlet OA46 2 8 9 14 24 37
Hamlet OO27 2 7 20 31 53 82
Hamlet NO35 2 1 6 10 17 26
Hamlet Mock 2 0 0 0 0 0
Trailblazer OO55 2 2 14 22 36 56
Trailblazer OO54 2 4 8 12 20 30
Trailblazer OA46 2 10 11 17 29 45

205
Trailblazer OO27 2 8 26 39 65 68
Trailblazer NO35 2 1 6 9 16 25
Trailblazer Mock 2 0 0 0 0 0
Madras OO55 2 2 8 12 20 31
Madras OO54 2 7 9 13 22 35
Madras OA46 2 8 4 6 10 16
Madras OO27 2 11 17 25 43 69
Madras NO35 2 1 3 4 7 11
Madras Mock 2 0 0 0 0 0
Patterson OO55 2 10 7 11 19 30
Patterson OO54 2 3 10 15 25 40
Patterson OA46 2 6 4 6 11 17
Patterson OO27 2 16 20 30 51 81
Patterson NO35 2 0 4 7 11 18
Patterson Mock 2 0 0 0 0 0
Milestone OO55 2 3 8 11 21 34
Milestone OO54 2 6 7 10 19 31
Milestone OA46 2 9 3 4 8 13
Milestone OO27 2 10 19 29 55 87
Milestone NO35 2 3 4 7 13 20
Milestone Mock 2 0 0 0 0 0
Genesis OO55 2 6 6 9 18 29
Genesis OO54 2 2 10 15 28 46
Genesis OA46 2 18 2 3 6 10
Genesis OO27 2 13 13 19 37 59
Genesis NO35 2 6 4 6 12 20
Genesis Mock 2 0 0 0 0 0
LaSalle OO55 2 1 5 8 15 23
LaSalle OO54 2 5 10 15 28 46
LaSalle OA46 2 12 4 6 11 18
LaSalle OO27 2 10 16 24 46 74
LaSalle NO35 2 2 7 10 20 32
LaSalle Mock 2 0 0 0 0 0
Pontiac OO55 2 2 3 4 8 12
Pontiac OO54 2 2 6 9 18 29
Pontiac OA46 2 5 4 6 12 20
Pontiac OO27 2 6 10 16 30 47

206
Pontiac NO35 2 1 10 15 29 46
Pontiac Mock 2 0 0 0 0 0
Stanley OO55 3 13 5 7 14 22
Stanley OO54 3 6 3 4 7 12
Stanley OA46 3 5 3 5 10 16
Stanley OO27 3 15 10 15 28 45
Stanley NO35 3 9 5 7 14 23
Stanley Mock 3 0 0 0 0 0
Prince OO55 3 9 7 10 18 29
Prince OO54 3 10 14 20 39 62
Prince OA46 3 16 5 7 13 21
Prince OO27 3 16 14 21 40 64
Prince NO35 3 3 3 4 8 13
Prince Mock 3 0 0 0 0 0
Highlander OO55 3 10 10 15 29 46
Highlander OO54 3 8 8 12 23 45
Highlander OA46 3 5 10 14 27 55
Highlander OO27 3 18 22 32 60 62
Highlander NO35 3 3 6 9 18 32
Highlander Mock 3 0 0 0 0 0
Hendrix OO55 3 9 3 5 9 16
Hendrix OO54 3 3 5 7 17 31
Hendrix OA46 3 6 3 5 11 20
Hendrix OO27 3 9 11 17 39 50
Hendrix NO35 3 3 2 4 8 11
Hendrix Mock 3 0 0 0 0 0
Hamlet OO55 3 12 13 20 46 60
Hamlet OO54 3 9 12 18 42 55
Hamlet OA46 3 17 7 10 22 29
Hamlet OO27 3 10 22 32 74 96
Hamlet NO35 3 8 8 11 26 33
Hamlet Mock 3 0 0 0 0 0
Trailblazer OO55 3 11 10 14 34 44
Trailblazer OO54 3 12 9 12 29 38
Trailblazer OA46 3 15 6 9 22 28
Trailblazer OO27 3 7 20 30 69 90
Trailblazer NO35 3 6 11 17 39 51
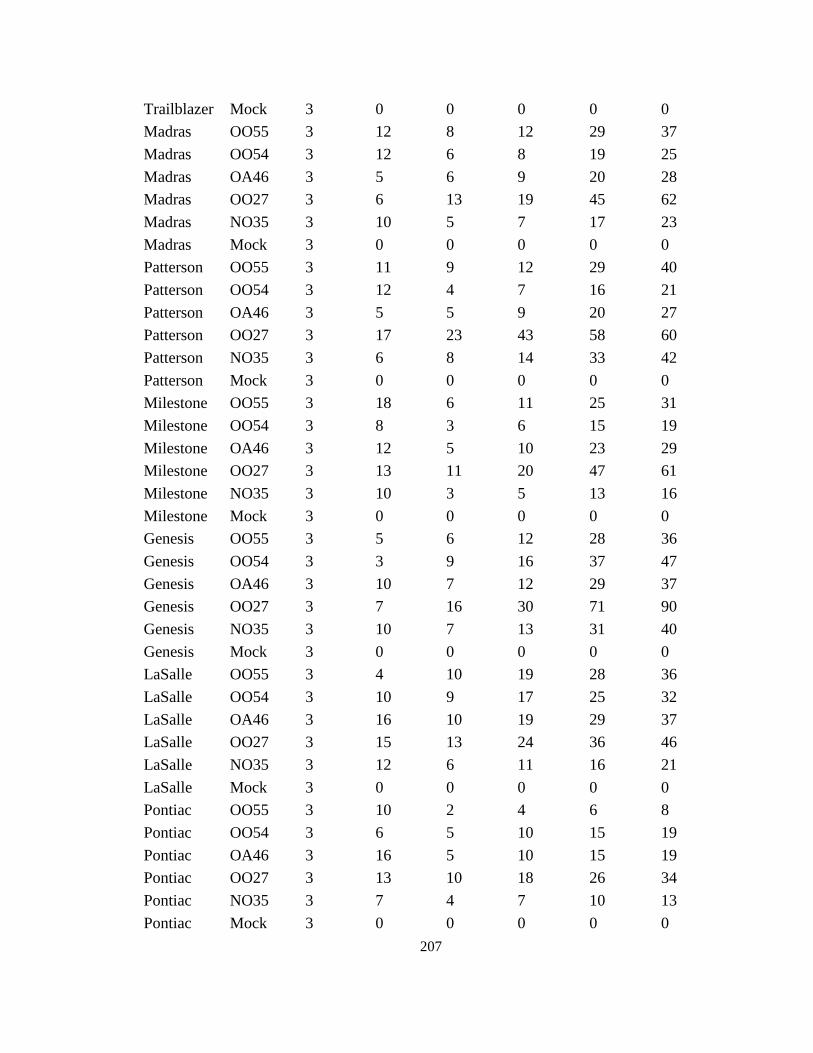
207
Trailblazer Mock 3 0 0 0 0 0
Madras OO55 3 12 8 12 29 37
Madras OO54 3 12 6 8 19 25
Madras OA46 3 5 6 9 20 28
Madras OO27 3 6 13 19 45 62
Madras NO35 3 10 5 7 17 23
Madras Mock 3 0 0 0 0 0
Patterson OO55 3 11 9 12 29 40
Patterson OO54 3 12 4 7 16 21
Patterson OA46 3 5 5 9 20 27
Patterson OO27 3 17 23 43 58 60
Patterson NO35 3 6 8 14 33 42
Patterson Mock 3 0 0 0 0 0
Milestone OO55 3 18 6 11 25 31
Milestone OO54 3 8 3 6 15 19
Milestone OA46 3 12 5 10 23 29
Milestone OO27 3 13 11 20 47 61
Milestone NO35 3 10 3 5 13 16
Milestone Mock 3 0 0 0 0 0
Genesis OO55 3 5 6 12 28 36
Genesis OO54 3 3 9 16 37 47
Genesis OA46 3 10 7 12 29 37
Genesis OO27 3 7 16 30 71 90
Genesis NO35 3 10 7 13 31 40
Genesis Mock 3 0 0 0 0 0
LaSalle OO55 3 4 10 19 28 36
LaSalle OO54 3 10 9 17 25 32
LaSalle OA46 3 16 10 19 29 37
LaSalle OO27 3 15 13 24 36 46
LaSalle NO35 3 12 6 11 16 21
LaSalle Mock 3 0 0 0 0 0
Pontiac OO55 3 10 2 4 6 8
Pontiac OO54 3 6 5 10 15 19
Pontiac OA46 3 16 5 10 15 19
Pontiac OO27 3 13 10 18 26 34
Pontiac NO35 3 7 4 7 10 13
Pontiac Mock 3 0 0 0 0 0
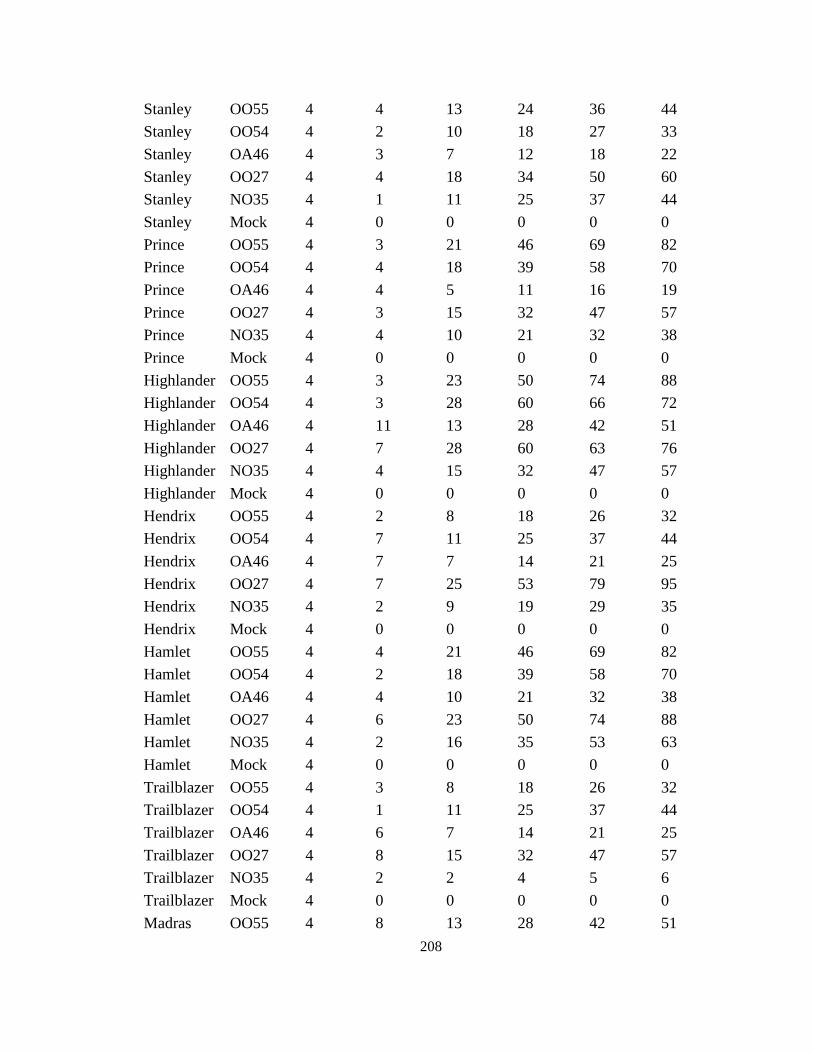
208
Stanley OO55 4 4 13 24 36 44
Stanley OO54 4 2 10 18 27 33
Stanley OA46 4 3 7 12 18 22
Stanley OO27 4 4 18 34 50 60
Stanley NO35 4 1 11 25 37 44
Stanley Mock 4 0 0 0 0 0
Prince OO55 4 3 21 46 69 82
Prince OO54 4 4 18 39 58 70
Prince OA46 4 4 5 11 16 19
Prince OO27 4 3 15 32 47 57
Prince NO35 4 4 10 21 32 38
Prince Mock 4 0 0 0 0 0
Highlander OO55 4 3 23 50 74 88
Highlander OO54 4 3 28 60 66 72
Highlander OA46 4 11 13 28 42 51
Highlander OO27 4 7 28 60 63 76
Highlander NO35 4 4 15 32 47 57
Highlander Mock 4 0 0 0 0 0
Hendrix OO55 4 2 8 18 26 32
Hendrix OO54 4 7 11 25 37 44
Hendrix OA46 4 7 7 14 21 25
Hendrix OO27 4 7 25 53 79 95
Hendrix NO35 4 2 9 19 29 35
Hendrix Mock 4 0 0 0 0 0
Hamlet OO55 4 4 21 46 69 82
Hamlet OO54 4 2 18 39 58 70
Hamlet OA46 4 4 10 21 32 38
Hamlet OO27 4 6 23 50 74 88
Hamlet NO35 4 2 16 35 53 63
Hamlet Mock 4 0 0 0 0 0
Trailblazer OO55 4 3 8 18 26 32
Trailblazer OO54 4 1 11 25 37 44
Trailblazer OA46 4 6 7 14 21 25
Trailblazer OO27 4 8 15 32 47 57
Trailblazer NO35 4 2 2 4 5 6
Trailblazer Mock 4 0 0 0 0 0
Madras OO55 4 8 13 28 42 51
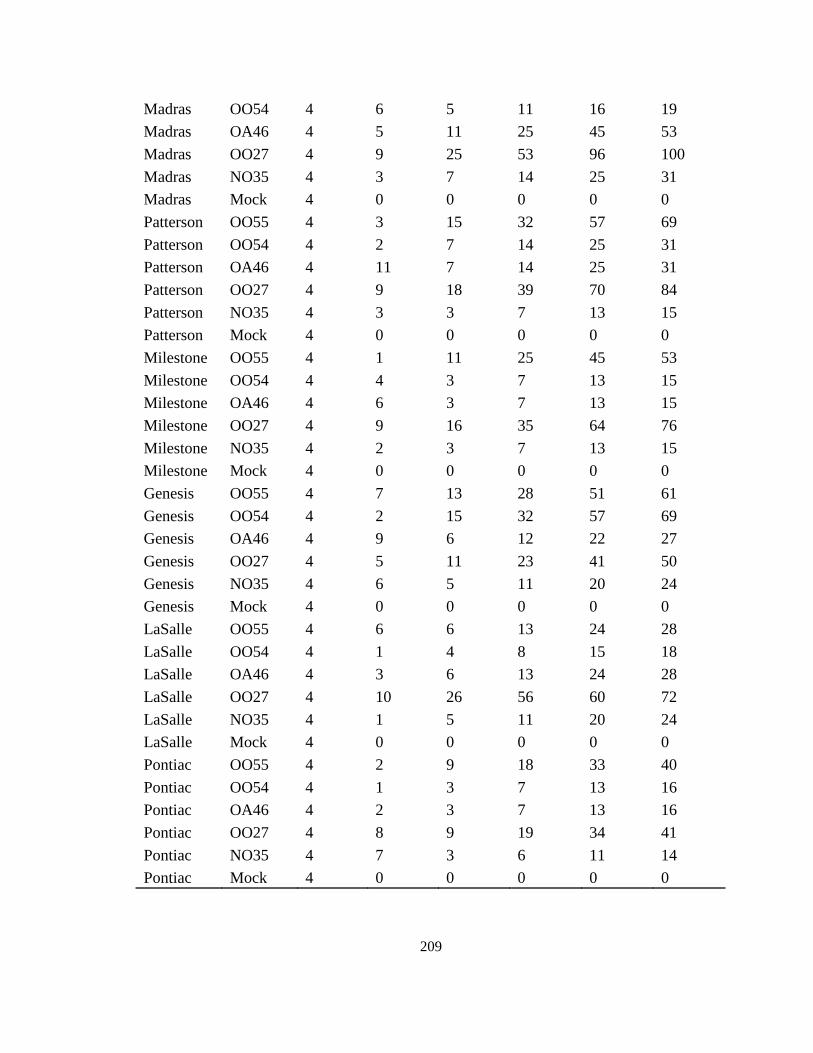
209
Madras OO54 4 6 5 11 16 19
Madras OA46 4 5 11 25 45 53
Madras OO27 4 9 25 53 96 100
Madras NO35 4 3 7 14 25 31
Madras Mock 4 0 0 0 0 0
Patterson OO55 4 3 15 32 57 69
Patterson OO54 4 2 7 14 25 31
Patterson OA46 4 11 7 14 25 31
Patterson OO27 4 9 18 39 70 84
Patterson NO35 4 3 3 7 13 15
Patterson Mock 4 0 0 0 0 0
Milestone OO55 4 1 11 25 45 53
Milestone OO54 4 4 3 7 13 15
Milestone OA46 4 6 3 7 13 15
Milestone OO27 4 9 16 35 64 76
Milestone NO35 4 2 3 7 13 15
Milestone Mock 4 0 0 0 0 0
Genesis OO55 4 7 13 28 51 61
Genesis OO54 4 2 15 32 57 69
Genesis OA46 4 9 6 12 22 27
Genesis OO27 4 5 11 23 41 50
Genesis NO35 4 6 5 11 20 24
Genesis Mock 4 0 0 0 0 0
LaSalle OO55 4 6 6 13 24 28
LaSalle OO54 4 1 4 8 15 18
LaSalle OA46 4 3 6 13 24 28
LaSalle OO27 4 10 26 56 60 72
LaSalle NO35 4 1 5 11 20 24
LaSalle Mock 4 0 0 0 0 0
Pontiac OO55 4 2 9 18 33 40
Pontiac OO54 4 1 3 7 13 16
Pontiac OA46 4 2 3 7 13 16
Pontiac OO27 4 8 9 19 34 41
Pontiac NO35 4 7 3 6 11 14
Pontiac Mock 4 0 0 0 0 0

210
Table A2. 5 2015 field trials: ANOVA of incidence on onion cultivars
Random effects Estimate Standard
error
Z value Pr > Z
Block 0.83 1.96 0.42 0.3357
Residual 33.01 7.89 4.18 <.0001
Fixed effects Num df Den df F Pr > F
Cultivar 11 35 4.41 .0004

211
Table A2. 6 Raw data field trials- 2015 data: incidence - onion cultivars
Assessment date
Cultivar Block 29June 06July 13July 20July 14August
Stanley 1 33 41 57 82 92
Prince 1 31 43 54 91 95
Highlander 1 24 33 45 62 74
Hendrix 1 33 41 57 61 83
Hamlet 1 48 60 70 100 100
Trailblazer 1 24 47 65 98 100
Madras 1 39 47 57 61 82
Patterson 1 31 43 52 71 92
Milestone 1 58 62 70 87 100
Genesis 1 51 56 65 79 93
LaSalle 1 26 39 53 76 93
Braddock 1 . . . . .
Pontiac 1 14 26 44 57 70
Stanley 2 39 45 54 64 82
Prince 2 40 49 59 76 89
Highlander 2 29 45 51 64 81
Hendrix 2 45 55 63 78 88
Hamlet 2 54 61 67 73 92
Trailblazer 2 28 46 67 82 86
Madras 2 53 53 63 86 100
Patterson 2 49 56 65 70 83
Milestone 2 61 64 70 94 100
Genesis 2 31 41 54 74 80
LaSalle 2 37 44 53 86 100
Pontiac 2 24 37 49 63 70
Stanley 3 27 42 54 73 87
Prince 3 29 39 49 66 79
Highlander 3 41 55 61 86 96
Hendrix 3 35 45 53 72 86
Hamlet 3 41 54 65 79 83
Trailblazer 3 23 45 57 81 96
Madras 3 46 53 59 74 93
Patterson 3 41 50 55 69 83
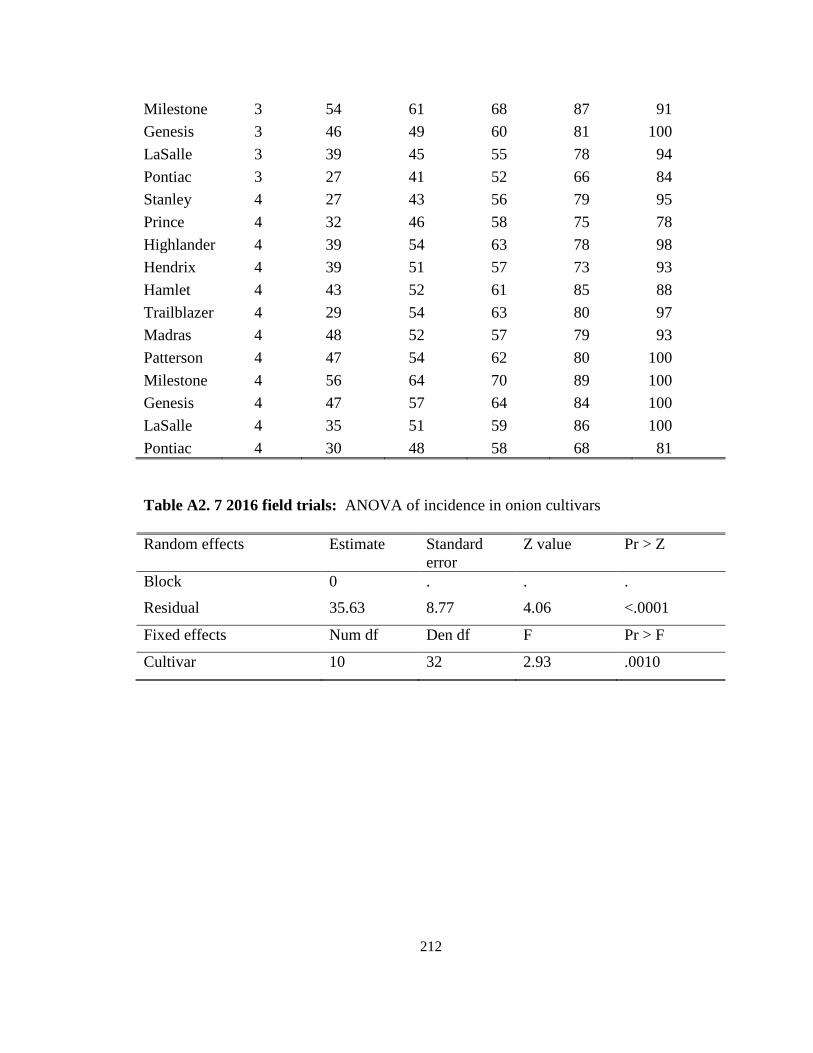
212
Milestone 3 54 61 68 87 91
Genesis 3 46 49 60 81 100
LaSalle 3 39 45 55 78 94
Pontiac 3 27 41 52 66 84
Stanley 4 27 43 56 79 95
Prince 4 32 46 58 75 78
Highlander 4 39 54 63 78 98
Hendrix 4 39 51 57 73 93
Hamlet 4 43 52 61 85 88
Trailblazer 4 29 54 63 80 97
Madras 4 48 52 57 79 93
Patterson 4 47 54 62 80 100
Milestone 4 56 64 70 89 100
Genesis 4 47 57 64 84 100
LaSalle 4 35 51 59 86 100
Pontiac 4 30 48 58 68 81
Table A2. 7 2016 field trials: ANOVA of incidence in onion cultivars
Random effects Estimate Standard
error
Z value Pr > Z
Block 0 . . .
Residual 35.63 8.77 4.06 <.0001
Fixed effects Num df Den df F Pr > F
Cultivar 10 32 2.93 .0010

213
Table A2. 8 Raw data field trials- 2016 data: incidence - onion cultivars
Assessment date
Cultivar Block 11July 19July 25July 03August 11August
Stanley 1 17 18 26 29 37
Prince 1 13 17 20 20 29
Highlander 1 12 16 20 20 21
Hendrix 1 2 9 14 22 23
Hamlet 1 17 17 23 31 39
Trailblazer 1 9 17 25 31 35
Braddock 1 13 21 27 30 30
Patterson 1 15 17 20 20 28
Milestone 1 18 25 31 37 41
Genesis 1 9 13 19 28 28
Madras 1 . . . . .
Pontiac 1 . . . . .
LaSalle 1 12 17 17 23 26
Stanley 2 12 16 23 29 31
Prince 2 16 19 24 25 25
Highlander 2 15 21 23 29 35
Hendrix 2 5 7 9 10 10
Hamlet 2 0 3 3 8 12
Trailblazer 2 14 22 29 30 34
Braddock 2 16 21 21 26 29
Patterson 2 12 16 19 24 26
Milestone 2 21 28 36 39 44
Genesis 2 5 14 24 29 32
Madras 2 . . . . .
Pontiac 2 . . . . .
LaSalle 2 13 13 14 16 16
Stanley 3 8 14 20 22 26
Prince 3 11 13 23 27 34
Highlander 3 8 14 17 22 29
Hendrix 3 3 6 11 16 24
Hamlet 3 14 19 25 29 32
Trailblazer 3 16 20 27 29 33
Braddock 3 12 14 23 23 25

214
Patterson 3 4 9 13 13 15
Milestone 3 16 23 28 33 35
Genesis 3 8 13 19 20 20
Madras 3 . . . . .
Pontiac 3 . . . . .
LaSalle 3 11 14 17 28 31
Stanley 4 15 20 27 27 27
Prince 4 8 11 21 24 30
Highlander 4 11 19 26 26 27
Hendrix 4 4 8 12 17 23
Hamlet 4 18 22 27 31 36
Trailblazer 4 9 16 20 30 34
Braddock 4 9 14 19 27 27
Patterson 4 13 20 23 27 27
Milestone 4 14 25 28 32 37
Genesis 4 18 23 23 29 31
Madras 4 . . . . .
Pontiac 4 . . . . .
LaSalle 4 11 15 18 19 25

215
Table A2. 9 Raw data field studies- 2015: lesions per leaf - onion cultivars
Assessment date
Cultivar Block 29June 06July
Stanley 1 4 7
Prince 1 4 7
Highlander 1 4 5
Hendrix 1 4 7
Hamlet 1 5 6
Trailblazer 1 3 7
Madras 1 3 4
Patterson 1 4 6
Milestone 1 7 9
Genesis 1 4 5
LaSalle 1 7 9
Braddock 1 . .
Pontiac 1 3 5
Stanley 2 5 6
Prince 2 4 5
Highlander 2 4 6
Hendrix 2 4 6
Hamlet 2 4 8
Trailblazer 2 4 8
Madras 2 4 6
Patterson 2 5 5
Milestone 2 7 9
Genesis 2 4 6
LaSalle 2 6 7
Braddock 2 . .
Pontiac 2 3 5
Stanley 3 6 7
Prince 3 6 8
Highlander 3 5 7
Hendrix 3 4 6
Hamlet 3 4 6
Trailblazer 3 3 3
Madras 3 5 7

216
Patterson 3 4 6
Milestone 3 7 8
Genesis 3 5 6
LaSalle 3 4 7
Braddock 3 . .
Pontiac 3 3 5
Stanley 4 4 7
Prince 4 4 7
Highlander 4 4 7
Hendrix 4 4 7
Hamlet 4 5 8
Trailblazer 4 3 8
Madras 4 5 7
Patterson 4 5 7
Milestone 4 8 10
Genesis 4 4 7
LaSalle 4 4 9
Pontiac 4 3 5
Table A2. 10 Raw data field studies- 2016: lesions per leaf - onion cultivars
Assessment dates
Cultivar Block 07July 11July 19July
Stanley 1 0 1 3
Prince 1 0 4 4
Highlander 1 0 1 3
Hendrix 1 0 2 3
Hamlet 1 2 4 5
Trailblazer 1 0 5 8
Braddock 1 0 2 7
Patterson 1 1 3 4
Milestone 1 4 4 8
Genesis 1 0 1 5
Madras 1 . . .
Pontiac 1 . . .
LaSalle 1 2 2 3

217
Stanley 2 1 2 5
Prince 2 0 3 3
Highlander 2 4 4 5
Hendrix 2 0 1 5
Hamlet 2 0 0 3
Trailblazer 2 7 7 7
Braddock 2 2 5 5
Patterson 2 2 2 3
Milestone 2 5 5 5
Genesis 2 0 1 5
Madras 2 . . .
Pontiac 2 . . .
LaSalle 2 4 5 5
Stanley 3 0 3 6
Prince 3 0 2 4
Highlander 3 2 2 3
Hendrix 3 0 2 3
Hamlet 3 4 5 6
Trailblazer 3 3 5 8
Braddock 3 4 7 9
Patterson 3 0 5 6
Milestone 3 1 5 8
Genesis 3 1 3 6
Madras 3 . . .
Pontiac 3 . . .
LaSalle 3 0 1 7
Stanley 4 4 4 6
Prince 4 1 5 5
Highlander 4 1 2 5
Hendrix 4 0 1 5
Hamlet 4 2 5 6
Trailblazer 4 0 6 6
Braddock 4 1 4 7
Patterson 4 4 4 5
Milestone 4 4 7 7
Genesis 4 1 5 6
Madras 4 . . .

218
Pontiac 4 . . .
LaSalle 4 2 5 5

219
Table A2. 11 Raw data field studies- 2015: leaf dieback on onion cultivars
Assessment dates
Cultivar Block 20July 27July 04August 14August
Stanley 1 10 18 37 56
Prince 1 19 32 38 50
Highlander 1 30 50 60 78
Hendrix 1 12 33 39 46
Hamlet 1 29 35 41 50
Trailblazer 1 7 33 44 62
Madras 1 15 56 64 72
Patterson 1 24 35 43 49
Milestone 1 14 31 42 42
Genesis 1 11 32 49 58
LaSalle 1 27 38 42 70
Braddock 1 . . . .
Pontiac 1 9 20 31 55
Stanley 2 22 41 41 61
Prince 2 13 26 43 55
Highlander 2 32 56 65 87
Hendrix 2 13 25 38 48
Hamlet 2 24 37 45 67
Trailblazer 2 7 21 37 69
Madras 2 13 27 27 44
Patterson 2 23 33 43 56
Milestone 2 13 28 50 53
Genesis 2 12 23 45 55
LaSalle 2 20 31 43 68
Braddock 2 . . . .
Pontiac 2 12 23 36 51
Stanley 3 7 27 40 55
Prince 3 10 36 45 55
Highlander 3 39 56 64 79
Hendrix 3 12 24 42 52
Hamlet 3 33 45 50 61
Trailblazer 3 16 28 43 53
Madras 3 21 32 47 49
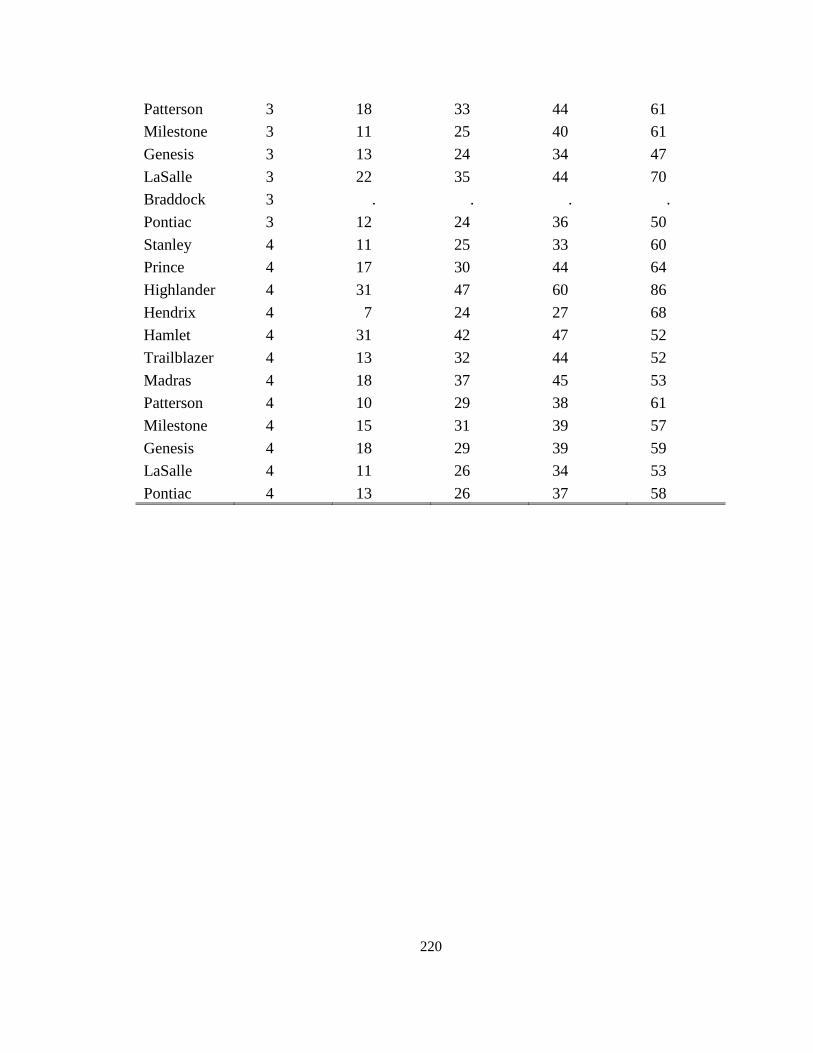
220
Patterson 3 18 33 44 61
Milestone 3 11 25 40 61
Genesis 3 13 24 34 47
LaSalle 3 22 35 44 70
Braddock 3 . . . .
Pontiac 3 12 24 36 50
Stanley 4 11 25 33 60
Prince 4 17 30 44 64
Highlander 4 31 47 60 86
Hendrix 4 7 24 27 68
Hamlet 4 31 42 47 52
Trailblazer 4 13 32 44 52
Madras 4 18 37 45 53
Patterson 4 10 29 38 61
Milestone 4 15 31 39 57
Genesis 4 18 29 39 59
LaSalle 4 11 26 34 53
Pontiac 4 13 26 37 58

221
Table A2. 12 Raw data field studies- 2016: leaf dieback on onion cultivars
Assessment dates
Cultivar Block 19July 25July 03August 11August
Stanley 1 3 8 13 21
Prince 1 0 3 5 13
Highlander 1 0 19 26 41
Hendrix 1 0 4 8 10
Hamlet 1 7 17 23 33
Trailblazer 1 2 9 20 26
Braddock 1 0 0 14 19
Patterson 1 10 13 17 22
Milestone 1 0 7 16 17
Genesis 1 12 15 25 25
Madras 1 . . .
Pontiac 1 . . .
LaSalle 1 9 14 14 23
Stanley 2 5 14 17 27
Prince 2 8 13 15 24
Highlander 2 9 19 23 29
Hendrix 2 0 4 8 21
Hamlet 2 0 0 12 19
Trailblazer 2 7 15 18 26
Braddock 2 4 14 20 33
Patterson 2 9 11 18 22
Milestone 2 8 13 18 25
Genesis 2 0 0 3 15
Madras 1 . . .
Pontiac 1 . . .
LaSalle 2 5 12 19 31
Stanley 3 0 0 6 15
Prince 3 0 3 10 33
Highlander 3 2 12 20 24
Hendrix 3 4 7 19 24
Hamlet 3 13 22 30 28
Trailblazer 3 4 11 25 33
Braddock 3 7 16 18 25

222
Patterson 3 0 5 13 20
Milestone 3 5 9 9 17
Genesis 3 7 16 22 27
Madras 1 . . .
Pontiac 1 . . .
LaSalle 3 0 4 13 18
Stanley 4 10 17 17 26
Prince 4 0 5 8 14
Highlander 4 6 10 23 34
Hendrix 4 0 0 5 11
Hamlet 4 8 19 23 25
Trailblazer 4 3 9 23 29
Braddock 4 0 8 19 22
Patterson 4 4 10 10 17
Milestone 4 8 13 17 20
Genesis 4 2 8 23 27
Madras 1 . . .
Pontiac 1 . . .
LaSalle 4 15 24 29 34

223
Table A2. 13 Raw data field studies- 2015 data: yield - onion cultivars
Cultivar Block
Mkt yield
(tha-1
) % Mkb %Jumbo %Medium %small
Stanley 1 65 96.55 2.30 94.25 3.45
Prince 1 43.3 91.76 1.18 90.59 8.24
Highlander 1 74 92.52 3.74 88.79 7.48
Hendrix 1 50.1 70.00 3.00 67.00 30.00
Hamlet 1 59.15 94.25 8.05 86.21 5.75
Trailblazer 1 62.05 95.10 7.84 87.25 4.90
Madras 1 51.75 95.24 2.86 92.38 4.76
Patterson 1 62.5 90.48 7.14 83.33 9.52
Milestone 1 58.6 92.16 6.86 85.29 7.84
Genesis 1 56.3 93.59 6.41 87.18 6.41
LaSalle 1 39 75.38 6.15 69.23 24.62
Pontiac 1 54 98.72 10.26 88.46 1.28
Stanley 2 49.7 86.96 11.59 75.36 13.04
Prince 2 65.3 96.47 16.47 80.00 3.53
Highlander 2 56.75 94.68 3.19 91.49 5.32
Hendrix 2 45.6 52.50 2.50 50.00 47.50
Hamlet 2 48.5 85.87 2.17 83.70 14.13
Trailblazer 2 47 84.62 7.69 76.92 15.38
Madras 2 56.55 91.36 6.17 85.19 8.64
Patterson 2 70.75 96.04 7.92 88.12 3.96
Milestone 2 53.15 96.61 18.64 77.97 3.39
Genesis 2 46.5 77.33 2.67 74.67 22.67
LaSalle 2 64.25 93.86 7.89 85.96 6.14
Pontiac 2 64.1 91.59 13.08 78.50 8.41
Stanley 3 43.4 94.00 22.00 72.00 6.00
Prince 3 74.05 95.24 3.57 91.67 4.76
Highlander 3 58 91.78 5.48 86.30 8.22
Hendrix 3 57.05 92.11 4.39 87.72 7.89
Hamlet 3 52.5 90.22 2.17 88.04 9.78
Trailblazer 3 47.9 92.86 3.57 89.29 7.14
Madras 3 45.6 86.42 7.41 79.01 13.58
Patterson 3 63.05 97.30 4.50 92.79 2.70
Milestone 3 56.65 97.30 12.16 85.14 2.70
Genesis 3 33.4 77.14 2.86 74.29 22.86
LaSalle 3 63.95 93.64 2.73 90.91 6.36
Pontiac 3 53.2 94.05 3.57 90.48 5.95
Stanley 4 61.75 94.57 6.52 88.04 5.43
Prince 4 57.85 92.31 4.40 87.91 7.69
Highlander 4 49.55 96.74 1.09 95.65 3.26
Hendrix 4 54.5 83.13 8.43 74.70 16.87
Hamlet 4 67.45 95.37 2.78 92.59 4.63

224
Trailblazer 4 43.9 85.07 1.49 83.58 14.93
Madras 4 59.7 93.20 3.88 89.32 6.80
Patterson 4 57.35 87.18 17.95 69.23 12.82
Milestone 4 45.5 97.30 2.70 94.59 2.70
Genesis 4 35.95 92.68 14.63 78.05 7.32
LaSalle 4 30.5 78.43 7.84 70.59 21.57
Pontiac 4 37.85 87.30 3.17 84.13 12.70
Table A2. 14 Raw data field studies- 2016 data: yield - onion cultivars
Cultivar Block
Mkt yield
(tha-1
) % Mkb %Jumbo %Medium %small
Braddock 1 27.45 72.34 10.64 61.70 27.66
Braddock 2 26.75 71.15 0.00 71.15 28.85
Genesis 1 49.50 90.48 12.70 77.78 9.52
Genesis 2 32.85 73.85 4.62 69.23 26.15
Hamlet 1 40.00 71.62 6.76 64.86 28.38
Hamlet 2 32.20 84.29 0.00 84.29 15.71
Hamlet 3 28.65 78.26 0.00 78.26 21.74
Hendrix 1 34.50 92.54 2.99 89.55 7.46
Hendrix 2 36.90 88.24 25.49 62.75 11.76
Hendrix 3 41.30 83.02 22.64 60.38 16.98
Highlander 1 32.60 81.58 0.00 81.58 18.42
Highlander 2 38.60 77.03 4.05 72.97 22.97
LaSalle 1 28.20 83.33 0.00 83.33 16.67
LaSalle 2 26.90 80.85 8.51 72.34 19.15
LaSalle 3 49.50 90.48 12.70 77.78 9.52
Milestone 1 47.70 81.25 7.50 73.75 18.75
Milestone 2 43.90 85.71 17.46 68.25 14.29
Patterson 1 34.15 69.86 2.74 67.12 30.14
Patterson 2 26.15 76.81 0.00 76.81 23.19
Patterson 3 23.20 64.86 0.00 64.86 35.14
Prince 1 31.75 71.43 3.17 68.25 28.57
Prince 2 32.00 77.63 0.00 77.63 22.37
Prince 3 29.70 81.67 1.67 80.00 18.33
Prince 4 28.20 80.70 8.77 71.93 19.30
Stanley 1 22.90 76.00 0.00 76.00 24.00
Stanley 2 35.60 75.00 6.25 68.75 25.00
Stanley 3 27.30 78.43 9.80 68.63 21.57
Trailblazer 1 31.75 88.31 0.00 88.31 11.69
Trailblazer 2 36.70 81.16 2.90 78.26 18.84
Trailblazer 3 23.00 68.12 0.00 68.12 31.88
Trailblazer 4 35.55 80.88 4.41 76.47 19.12
N.B: Missing data due to poor emergence
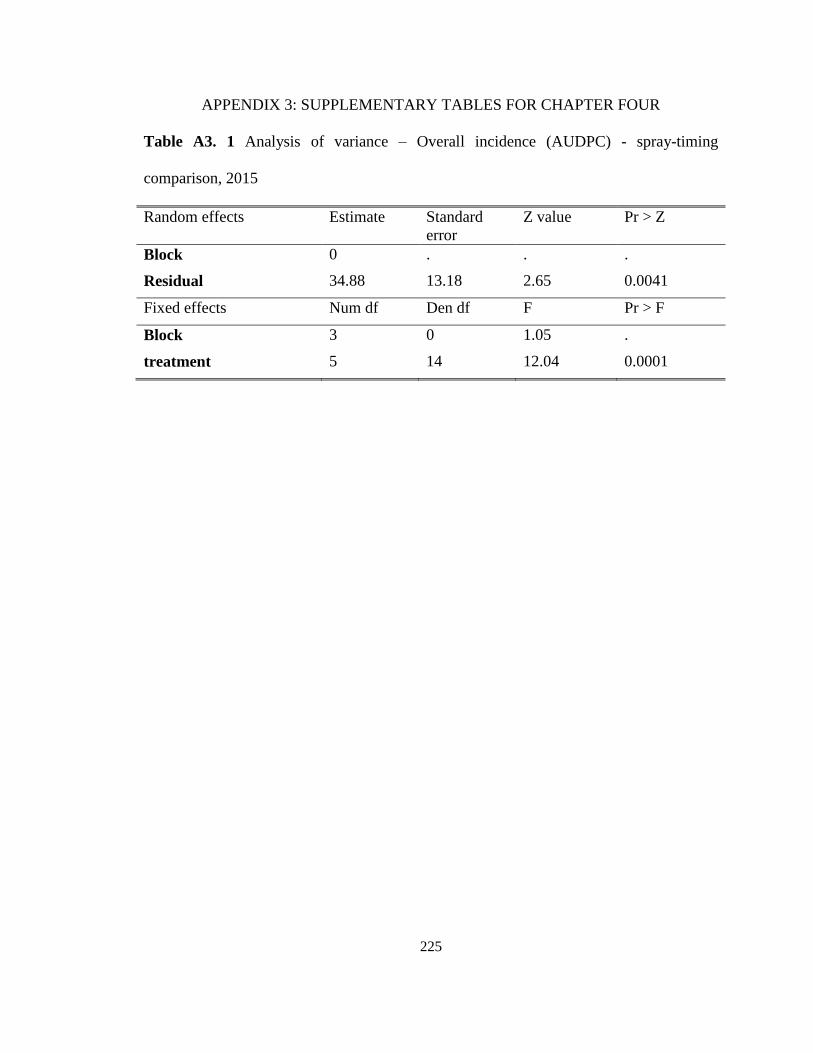
225
APPENDIX 3: SUPPLEMENTARY TABLES FOR CHAPTER FOUR
Table A3. 1 Analysis of variance – Overall incidence (AUDPC) - spray-timing
comparison, 2015
Random effects Estimate Standard
error
Z value Pr > Z
Block 0 . . .
Residual 34.88 13.18 2.65 0.0041
Fixed effects Num df Den df F Pr > F
Block 3 0 1.05 .
treatment 5 14 12.04 0.0001

226
Table A3. 2 Raw data- spray-timing comparison - 2015 incidence
Assessment date
Treatment 02July 09July 16July 31July AUDPC
BOTCAST 1 56 63 85 89 84
TOMCAST 15 1 36 46 73 75 67
STEMCAST 1 59 67 87 89 86
CP1 1 27 39 64 69 58
LDR 1 63 68 89 89 88
UNSPRAYED 1 66 70 92 94 92
BOTCAST 2 48 54 76 80 74
TOMCAST 15 2 32 38 63 77 61
STEMCAST 2 52 62 83 83 80
CP1 2 34 46 72 84 68
LDR 2 72 73 95 94 95
UNSPRAYED 2 58 68 93 100 92
BOTCAST 3 42 50 74 83 72
TOMCAST 15 3 38 48 76 81 71
STEMCAST 3 43 45 72 78 69
CP1 3 36 36 64 70 60
LDR 3 54 62 83 87 82
UNSPRAYED 3 59 69 91 97 91
BOTCAST 4 55 63 87 87 84
TOMCAST 15 4 41 52 80 83 74
STEMCAST 4 53 63 86 92 84
CP1 4 34 43 66 73 63
LDR 4 47 56 82 88 79
UNSPRAYED 4 59 69 94 100 93
Table A3. 3 Analysis of variance – Overall incidence (AUDPC) - spray-timing
comparison, 2016
Random effects Estimate Standard
error
Z value Pr > Z
Block 0 . . .
Residual 34.88 13.18 2.65 0.0041
Fixed effects Num df Den df F Pr > F
Block 3 0 1.05 .
treatment 5 14 12.04 0.0001
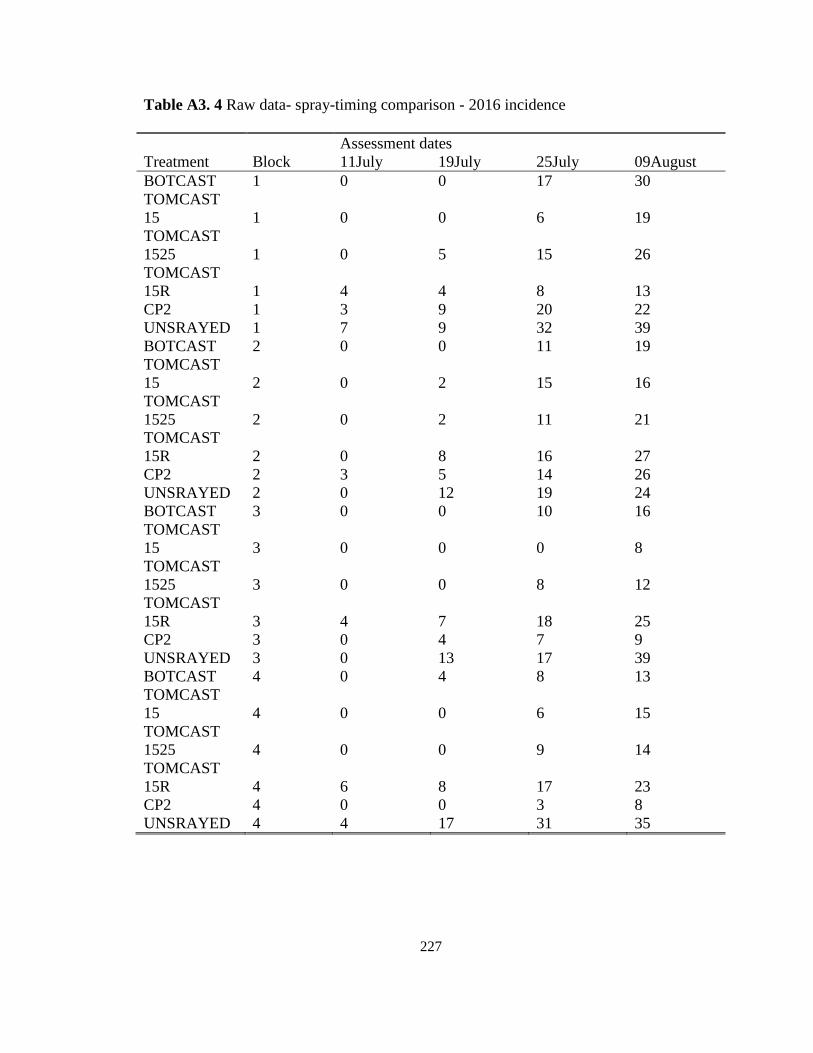
227
Table A3. 4 Raw data- spray-timing comparison - 2016 incidence
Assessment dates
Treatment Block 11July 19July 25July 09August
BOTCAST 1 0 0 17 30
TOMCAST
15 1 0 0 6 19
TOMCAST
1525 1 0 5 15 26
TOMCAST
15R 1 4 4 8 13
CP2 1 3 9 20 22
UNSRAYED 1 7 9 32 39
BOTCAST 2 0 0 11 19
TOMCAST
15 2 0 2 15 16
TOMCAST
1525 2 0 2 11 21
TOMCAST
15R 2 0 8 16 27
CP2 2 3 5 14 26
UNSRAYED 2 0 12 19 24
BOTCAST 3 0 0 10 16
TOMCAST
15 3 0 0 0 8
TOMCAST
1525 3 0 0 8 12
TOMCAST
15R 3 4 7 18 25
CP2 3 0 4 7 9
UNSRAYED 3 0 13 17 39
BOTCAST 4 0 4 8 13
TOMCAST
15 4 0 0 6 15
TOMCAST
1525 4 0 0 9 14
TOMCAST
15R 4 6 8 17 23
CP2 4 0 0 3 8
UNSRAYED 4 4 17 31 35
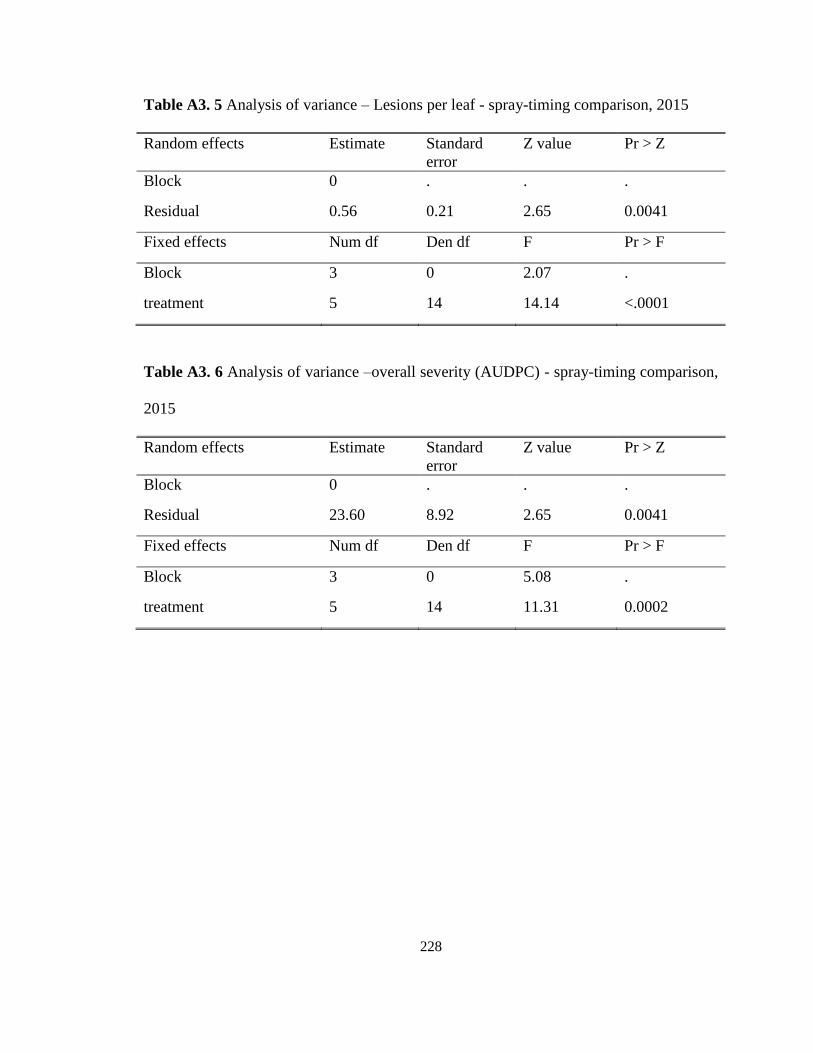
228
Table A3. 5 Analysis of variance – Lesions per leaf - spray-timing comparison, 2015
Random effects Estimate Standard
error
Z value Pr > Z
Block 0 . . .
Residual 0.56 0.21 2.65 0.0041
Fixed effects Num df Den df F Pr > F
Block 3 0 2.07 .
treatment 5 14 14.14 <.0001
Table A3. 6 Analysis of variance –overall severity (AUDPC) - spray-timing comparison,
2015
Random effects Estimate Standard
error
Z value Pr > Z
Block 0 . . .
Residual 23.60 8.92 2.65 0.0041
Fixed effects Num df Den df F Pr > F
Block 3 0 5.08 .
treatment 5 14 11.31 0.0002

229
Table A3. 7 Raw data- spray-timing comparison – 2015 lesions per leaf and severity.
Severity assessment dates
Treatment Block Lesions 23July 31July 06August 13August AUDPC
BOTCAST 1 8 6 15 21 27 17
TOMCAST
15 1 4 10 17 23 30 20
STEMCAST 1 7 7 16 24 33 20
CP1 1 4 7 18 25 38 21
LDR 1 9 18 23 31 43 29
UNSPRAYED 1 7 22 30 40 61 39
BOTCAST 2 5 14 21 34 57 31
TOMCAST
15 2 4 9 20 34 50 28
STEMCAST 2 7 23 42 52 64 46
CP1 2 4 14 21 34 57 31
LDR 2 6 11 21 32 45 27
UNSPRAYED 2 7 23 42 52 64 46
BOTCAST 3 6 8 25 34 42 28
TOMCAST
15 3 4 11 20 31 47 27
STEMCAST 3 6 13 19 32 45 27
CP1 3 4 12 21 21 45 24
LDR 3 7 11 18 30 48 26
UNSPRAYED 3 7 34 45 52 62 51
BOTCAST 4 7 11 28 31 45 29
TOMCAST
15 4 4 10 18 28 42 24
STEMCAST 4 7 16 28 34 44 31
CP1 4 4 15 27 35 43 31
LDR 4 7 16 29 35 43 32
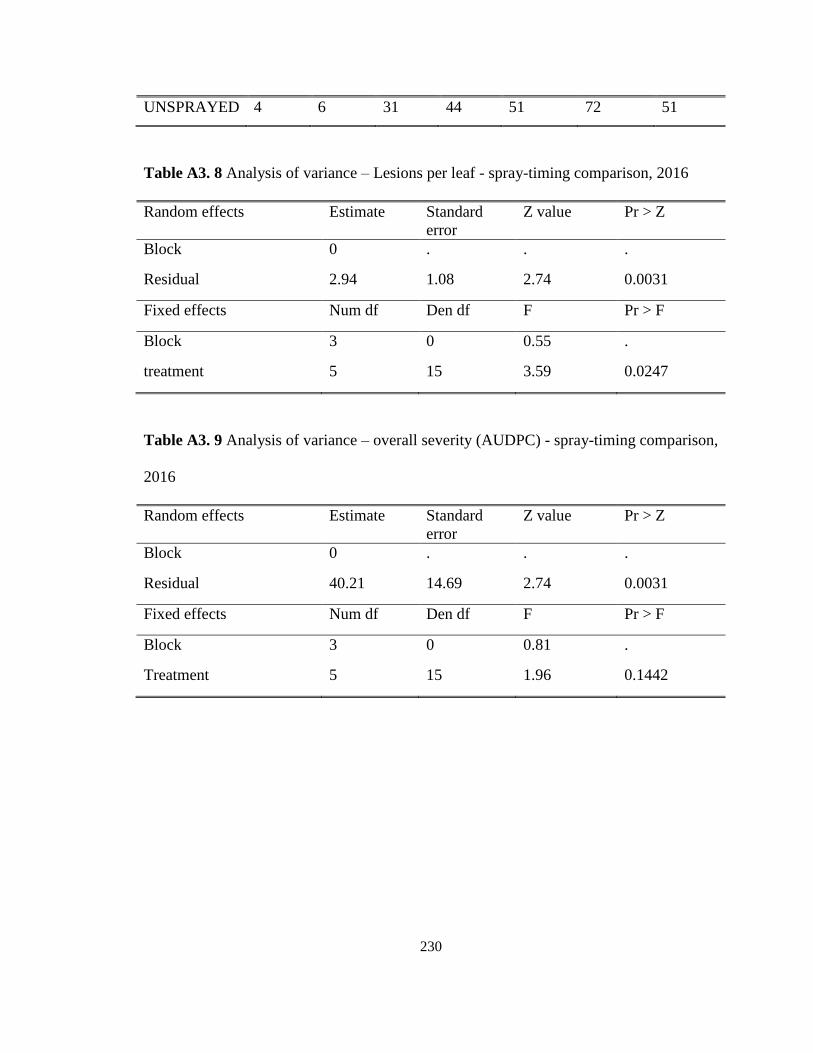
230
UNSPRAYED 4 6 31 44 51 72 51
Table A3. 8 Analysis of variance – Lesions per leaf - spray-timing comparison, 2016
Random effects Estimate Standard
error
Z value Pr > Z
Block 0 . . .
Residual 2.94 1.08 2.74 0.0031
Fixed effects Num df Den df F Pr > F
Block 3 0 0.55 .
treatment 5 15 3.59 0.0247
Table A3. 9 Analysis of variance – overall severity (AUDPC) - spray-timing comparison,
2016
Random effects Estimate Standard
error
Z value Pr > Z
Block 0 . . .
Residual 40.21 14.69 2.74 0.0031
Fixed effects Num df Den df F Pr > F
Block 3 0 0.81 .
Treatment 5 15 1.96 0.1442

231
Table A3.10 Raw data- spray-timing comparison – 2016 lesions per leaf and severity
Severity assessments dates
Treatment Block Lesions 25July 02August 09August 16August AUDPC
BOTCAST 1 0 0 7 28 40 19
TOMCAST
15 1 0 0 5 23 33 16
TOMCAST
1525 1 1 10 10 18 28 18
TOMCAST
15R 1 2 0 7 17 20 12
CP2 1 6 5 13 23 23 18
UNSRAYED 1 4 18 27 43 57 39
BOTCAST 2 0 7 8 17 23 15
TOMCAST
15 2 4 5 12 20 35 18
TOMCAST
1525 2 0 7 7 22 27 16
TOMCAST
15R 2 3 0 10 18 25 14
CP2 2 4 0 10 23 30 17
UNSRAYED 2 4 5 3 25 45 19
BOTCAST 3 0 15 18 18 30 22
TOMCAST
15 3 0 0 5 15 25 11
TOMCAST
1525 3 0 7 7 10 22 11
TOMCAST
15R 3 2 3 15 22 22 17
CP2 3 1 0 7 18 20 12
UNSRAYED 3 5 12 30 35 47 34
BOTCAST 4 1 0 3 12 18 8
TOMCAST
15 4 0 10 10 15 22 15
TOMCAST
1525 4 0 5 7 13 20 12
TOMCAST
15R 4 6 15 15 20 27 21
CP2 4 0 0 10 28 38 20
UNSRAYED 4 3 3 8 13 25 13

232
Table A3. 11 Analysis of variance – Marketable yield (tha-1
) - spray-timing comparison,
2015
Random effects Estimate Standard
error
Z value Pr > Z
Block 0 . . .
Residual 69.02 25.2034 2.74 0.0031
Fixed effects Num df Den df F value Pr > F
Block 3 0 0.95 .
Treatment 5 15 0.38 0.8562
Table A3. 12 Analysis of variance – Yield (percentage jumbo) - spray-timing
comparison, 2015
Random effects Estimate Standard
error
Z value Pr > Z
Block 0 . . .
Residual 107.05 39.09 2.74 0.0031
Fixed effects Num df Den df F value Pr > F
Block 3 0 0.11 .
Treatment 5 15 0.71 0.6269

233
Table A3. 13 Analysis of variance – Yield (% medium) - spray-timing comparison, 2015
Random effects Estimate Standard
error
Z value Pr > Z
Block 0 . . .
Residual 100.94 36.86 2.74 0.003
Fixed effects Num df Den df F value Pr > F
Block 3 0 0.43 .
Treatment 5 15 0.89 0.51
Table A3. 14 Analysis of variance – Yield (% culls) - spray-timing comparison, 2015
Random effects Estimate Standard
error
Z value Pr > Z
Block 0 . . .
Residual 6.28 2.29 2.74 0.003
Fixed effects Num df Den df F value Pr > F
Block 3 0 1.61 .
Treatment 5 15 1.83 0.17

234
Table A3. 15 Raw data – yield, spray-timing comparison, 2015
Bulb size distribution (%)
Treatment
Block
Yield
( t ha-1
)
Jumbo Medium small
BOTCAST 1 46 28 66 6
TOMCAST 15 1 46 21 73 6
STEMCAST 1 49 24 69 6
CP1 1 54 30 64 7
LDR 1 42 26 70 4
UNSPRAYED 1 48 18 80 2
BOTCAST 2 48 30 62 8
TOMCAST 15 2 44 29 60 11
STEMCAST 2 49 22 73 5
CP1 2 56 41 52 7
LDR 2 31 23 69 8
UNSPRAYED 2 40 18 73 8
BOTCAST 3 42 11 81 8
TOMCAST 15 3 42 10 83 7
STEMCAST 3 53 44 52 4
CP1 3 44 32 57 11
LDR 3 35 19 71 10
UNSPRAYED 3 46 32 66 2
BOTCAST 4 50 40 53 7
TOMCAST 15 4 43 40 49 11
STEMCAST 4 34 23 74 2
CP1 4 24 25 67 8
LDR 4 51 22 69 9
UNSPRAYED 4 35 11 78 11
Table A3. 16 Analysis of variance – Marketable yield (t ha-1
) - spray-timing comparison,
2016
Random effects Estimate Standard
error
Z value Pr > Z
Block 0 . . .
Residual 19.6861 7.1884 2.74 0.003
Fixed effects Num df Den df F value Pr > F
Block 3 0 1.02 .

235
Treatment 5 15 1.03 0.44
Table A3. 17 Analysis of variance – Yield (percentage jumbo) - spray-timing
comparison - 2016
Random effects Estimate Standard
error
Z value Pr > Z
Block 0 . . .
Residual 2.1528 0.7861 2.74 0.003
Fixed effects Num df Den df F value Pr > F
Block 3 0 0.38 .
Treatment 5 15 0.95 0.48
Table A3. 18 Analysis of variance – Yield (percentage medium) - spray-timing
comparison - 2016
Random effects Estimate Standard
error
Z value Pr > Z
Block 0 . . .
Residual 76.85 28.06 2.74 0.003
Fixed effects Num df Den df F value Pr > F
Block 3 0 0.07 .
Treatment 5 15 1.04 0.43
Table A3. 19 Analysis of variance – Yield (percentage culls) - spray-timing comparison -
2016
Random effects Estimate Standard
error
Z value Pr > Z
Block 0 . . .
Residual 88.94 32.48 2.74 0.003
Fixed effects Num df Den df F value Pr > F
Block 3 0 0.09 .
Treatment 5 15 0.75 0.60

236
Table A3. Raw data- yield, spray-timing comparison, 2016
Bulb size distribution (%)
Treatment
Block
Yield
(t ha-1
)
Jumbo Medium Small
BOTCAST 1 70 0 65 35
TOMCAST 15 1 83 4 59 37
TOMCAST 1525 1 76 0 64 36
TOMCAST 15R 1 75 2 52 47
CP2 1 87 1 68 30
UNSRAYED 1 83 0 78 22
BOTCAST 2 81 1 63 36
TOMCAST 15 2 83 0 58 42
TOMCAST 1525 2 84 1 63 36
TOMCAST 15R 2 83 2 59 39
CP2 2 84 1 62 37
UNSRAYED 2 89 3 73 23
BOTCAST 3 90 0 76 24
TOMCAST 15 3 78 0 59 41
TOMCAST 1525 3 77 0 61 39
TOMCAST 15R 3 88 5 73 22
CP2 3 87 0 70 30
UNSRAYED 3 68 0 43 57
BOTCAST 4 87 0 72 28
TOMCAST 15 4 76 1 53 46
TOMCAST 1525 4 80 2 58 40
TOMCAST 15R 4 79 0 58 42
CP2 4 91 0 71 29
UNSRAYED 4 79 0 61 39

237
APPENDIX 4: SUPPLEMENTARY TABLES FOR CHAPTER FIVE
Table A4. 1 Analysis of variance – Cultivar disease incidence (July 13) – remote sensing
2015
Random effects Estimate Standard
error
Z value Pr > Z
Block 0 . . .
Residual 20.43 5.03 4.06 <.0001
Fixed effects Num df Den df F value Pr > F
Block 3 0 1.60 .
cultivar 11 33 5.46 <.0001
Table A4. 2 Analysis of variance – Cultivar NDVI (July 13) – remote sensing 2015
Random effects Estimate Standard
error
Z value Pr > Z
Block 0 . . .
Residual 0.00 0.00 4.06 <.0001
Fixed effects Num df Den df F value Pr > F
Block 3 0 126.99 .
cultivar 11 33 5.60 <.0001
Table A4. 3 Analysis of variance – Cultivar GNDVI (July 13) – remote sensing 2015
Random effects Estimate Standard
error
Z value Pr > Z
Block 0 . . .
Residual 0.00 0.00 4.06 <.0001
Fixed effects Num df Den df F value Pr > F
Block 3 0 23.78 .
cultivar 11 33 8.00 <.0001

238
Table A4. 4 Analysis of variance – Cultivar CI (July 13) – remote sensing 2015
Random effects Estimate Standard
error
Z value Pr > Z
Block 0 . . .
Residual 0.00 0.00 4.06 <.0001
Fixed effects Num df Den df F value Pr > F
Block 3 0 18.33 .
cultivar 11 33 8.00 <.0001
Table A4. 5 Analysis of variance – Cultivar PSRI (July 13) – remote sensing 2015
Random effects Estimate Standard
error
Z value Pr > Z
Block 0 . . .
Residual 0.00 0.00 4.06 <.0001
Fixed effects Num df Den df F value Pr > F
Block 3 0 432.46 .
cultivar 11 33 8.00 <.0001

239
Table A4. 6 Raw data- Cultivar-Remote Sensing (13 July, 2015)
Cultivar Block IncJy13 NDVIjy13 GNDVIjy13 PSRIjy13 CIjy13
Stanley 1 57 0.0403 0.0964 0.2100 0.1642
Prince 1 54 0.0415 0.0971 0.2392 0.1687
Highlander 1 45 0.0998 0.0179 0.1790 0.0202
Hendrix 1 57 0.1026 0.0103 0.1889 0.0094
Hamlet 1 70 0.1052 0.0005 0.2213 0.0090
Trailblazer 1 65 0.0817 0.0466 0.2306 0.0772
Madras 1 57 0.0566 0.0830 0.2910 0.1451
Patterson 1 52 0.0697 0.0647 0.2484 0.1116
Milestone 1 70 0.0808 0.0396 0.1882 0.0631
Genesis 1 65 0.1032 0.0077 0.1673 0.0026
LaSalle 1 53 0.0820 0.0279 0.1888 0.0437
Pontiac 1 44 0.0920 0.0237 0.1817 0.0355
Stanley 2 54 0.0453 0.1014 0.43 0.1692
Prince 2 59 0.0465 0.1021 0.4884 0.1737
Highlander 2 51 0.0616 0.0229 0.368 0.0252
Hendrix 2 63 0.0747 0.0153 0.3878 0.0144
Hamlet 2 67 0.0858 0.0055 0.4526 0.014
Trailblazer 2 67 0.0867 0.0516 0.4712 0.0822
Madras 2 63 0.087 0.088 0.592 0.1501
Patterson 2 65 0.097 0.0697 0.5068 0.1166
Milestone 2 70 0.1048 0.0446 0.3864 0.0681
Genesis 2 54 0.1076 0.0127 0.3446 0.0076
LaSalle 2 53 0.1082 0.0329 0.3876 0.0487
Pontiac 2 49 0.1102 0.0287 0.3734 0.0405
Stanley 3 54 0.0906 0.4056 0.86 0.3384
Prince 3 49 0.093 0.4084 0.9768 0.3474
Highlander 3 61 0.1232 0.0916 0.736 0.0504
Hendrix 3 53 0.1494 0.0612 0.7756 0.0288
Hamlet 3 65 0.1716 0.022 0.9052 0.028
Trailblazer 3 57 0.1734 0.2064 0.9424 0.1644
Madras 3 59 0.174 0.352 1.184 0.3002
Patterson 3 55 0.194 0.2788 1.0136 0.2332
Milestone 3 68 0.2096 0.1784 0.7728 0.1362
Genesis 3 60 0.2152 0.0508 0.6892 0.0152
LaSalle 3 55 0.2164 0.1316 0.7752 0.0974
Pontiac 3 52 0.2204 0.1148 0.7468 0.081
Stanley 4 56 0.1812 0.2028 0.215 0.6768
Prince 4 58 0.186 0.2042 0.2442 0.6948
Highlander 4 63 0.2464 0.0458 0.184 0.1008
Hendrix 4 57 0.2988 0.0306 0.1939 0.0576
Hamlet 4 61 0.3432 0.011 0.2263 0.056
Trailblazer 4 63 0.3468 0.1032 0.2356 0.3288

240
Madras 4 57 0.348 0.176 0.296 0.6004
Patterson 4 62 0.388 0.1394 0.2534 0.4664
Milestone 4 70 0.4192 0.0892 0.1932 0.2724
Genesis 4 64 0.4304 0.0254 0.1723 0.0304
LaSalle 4 59 0.4328 0.0658 0.1938 0.1948
Pontiac 4 58 0.4408 0.0574 0.1867 0.162
Table A4. 7 Analysis of variance – Cultivar disease incidence (August 4) – remote
sensing 2015
Random effects Estimate Standard
error
Z value Pr > Z
Block 0 . . .
Residual 49.44 12.17 4.06 <.0001
Fixed effects Num df Den df F value Pr > F
Block 3 0 1.68 .
cultivar 11 33 2.74 0.0124
Table A4. 8 Analysis of variance – Cultivar NDVI (August 4) – remote sensing 2015
Random effects Estimate Standard
error
Z value Pr > Z
Block 0 . . .
Residual 0.00 0.00 4.06 <.0001
Fixed effects Num df Den df F value Pr > F
Block 3 0 70.05 .
cultivar 11 33 8.00 <.0001

241
Table A4. 9 Analysis of variance – Cultivar GNDVI (August 4) – remote sensing 2015
Random effects Estimate Standard
error
Z value Pr > Z
Block 0 . . .
Residual 0.00 0.00 4.06 <.0001
Fixed effects Num df Den df F value Pr > F
Block 3 0 19.50 .
Cultivar 11 33 8.00 <.0001
Table A4. 10 Analysis of variance – Cultivar CI (August 04) – remote sensing 2015
Random effects Estimate Standard
error
Z value Pr > Z
Block 0 . . .
Residual 0.01 0.00 4.06 <.0001
Fixed effects Num df Den df F value Pr > F
Block 3 0 19.60 .
Cultivar 11 33 8.00 <.0001
Table A4. 11 Analysis of variance – Cultivar PSRI (August 04) – remote sensing 2015
Random effects Estimate Standard
error
Z value Pr > Z
Block 0 . . .
Residual 0.00 0.00 4.06 <.0001
Fixed effects Num df Den df F value Pr > F
Block 3 0 535.61 .
Cultivar 11 33 8.00 <.0001

242
Table A4. 12 Raw data- Cultivar-Remote Sensing (04 August, 2015)
Cultivar Block IncAug4 NDVIag4 GNDVIag4 PSRIag4 CIag4
Stanley 1 84 0.0535 0.0488 0.3034 0.0848
Prince 1 87 0.0349 0.0771 0.3033 0.1365
Highlander 1 66 0.1131 0.0147 0.2292 0.0407
Hendrix 1 76 0.0982 0.0027 0.2135 0.0042
Hamlet 1 92 0.0819 0.0308 0.1971 0.0503
Trailblazer 1 92 0.0752 0.0401 0.2583 0.0672
Madras 1 74 0.0038 0.1197 0.2952 0.2032
Patterson 1 84 0.0584 0.0604 0.2765 0.1026
Milestone 1 92 0.0913 0.0084 0.2454 0.0093
Genesis 1 85 0.1103 0.0176 0.2134 0.0423
LaSalle 1 86 0.0607 0.0339 0.2190 0.0591
Pontiac 1 62 0.1027 0.004 0.2262 0.0145
Stanley 2 74 0.0585 0.0538 0.6168 0.0898
Prince 2 81 0.0399 0.0821 0.6166 0.1415
Highlander 2 73 0.1181 0.0197 0.4684 0.0457
Hendrix 2 80 0.1032 0.0077 0.437 0.0092
Hamlet 2 84 0.0869 0.0358 0.4042 0.0553
Trailblazer 2 78 0.0802 0.0451 0.5266 0.0722
Madras 2 92 0.0088 0.1247 0.6004 0.2082
Patterson 2 75 0.0634 0.0654 0.563 0.1076
Milestone 2 92 0.0963 0.0134 0.5008 0.0143
Genesis 2 72 0.1153 0.0226 0.4368 0.0473
LaSalle 2 92 0.0657 0.0389 0.448 0.0641
Pontiac 2 62 0.1077 0.009 0.4624 0.0195
Stanley 3 79 0.117 0.1076 1.2336 0.1796
Prince 3 71 0.0798 0.1642 1.2332 0.283
Highlander 3 88 0.2362 0.0394 0.9368 0.0914
Hendrix 3 78 0.2064 0.0154 0.874 0.0184
Hamlet 3 75 0.1738 0.0716 0.8084 0.1106
Trailblazer 3 88 0.1604 0.0902 1.0532 0.1444
Madras 3 86 0.0176 0.2494 1.2008 0.4164
Patterson 3 76 0.1268 0.1308 1.126 0.2152
Milestone 3 83 0.1926 0.0268 1.0016 0.0286
Genesis 3 92 0.2306 0.0452 0.8736 0.0946
LaSalle 3 86 0.1314 0.0778 0.896 0.1282
Pontiac 3 76 0.2154 0.018 0.9248 0.039
Stanley 4 87 0.234 0.2152 0.3084 0.3592
Prince 4 71 0.1596 0.3284 0.3083 0.566
Highlander 4 90 0.4724 0.0788 0.2342 0.1828
Hendrix 4 85 0.4128 0.0308 0.2185 0.0368
Hamlet 4 81 0.3476 0.1432 0.2021 0.2212
Trailblazer 4 89 0.3208 0.1804 0.2633 0.2888

243
Madras 4 86 0.0352 0.4988 0.3002 0.8328
Patterson 4 92 0.2536 0.2616 0.2815 0.4304
Milestone 4 92 0.3852 0.0536 0.2504 0.0572
Genesis 4 92 0.4612 0.0904 0.2184 0.1892
LaSalle 4 92 0.2628 0.1556 0.224 0.2564
Pontiac 4 73 0.4308 0.036 0.2312 0.078
Table A4. 13 Analysis of variance – Spray-timings- disease incidence (July 13) – remote
sensing 2015
Random effects Estimate Standard
error
Z value Pr > Z
Block 0 . . .
Residual 30.51 11.14 2.74 0.0031
Fixed effects Num df Den df F value Pr > F
Block 3 0 1.26 .
Treatment 5 15 11.28 0.0001
Table A4. 14 Analysis of variance – Spray-timings NDVI (July 13) – remote sensing
2015
Random effects Estimate Standard
error
Z value Pr > Z
Block 0 . . .
Residual 0.00 0.00 2.74 .0031
Fixed effects Num df Den df F value Pr > F
Block 3 0 8.72 .
Treatment 5 15 1.28 0.3252

244
Table A4. 15 Analysis of variance – Spray-timings GNDVI (July 13) – remote sensing
2015
Random effects Estimate Standard
error
Z value Pr > Z
Block 0 . . .
Residual 0.00 0.00 2.74 .0031
Fixed effects Num df Den df F value Pr > F
Block 3 0 3.29 .
Treatment 5 15 4.30 0.0125
Table A4. 16 Analysis of variance – Spray-timings CI (July 13) – remote sensing 2015
Random effects Estimate Standard
error
Z value Pr > Z
Block 0 . . .
Residual 0.00 0.00 2.74 0.0031
Fixed effects Num df Den df F value Pr > F
Block 3 0 10.82 .
Treatment 5 15 13.40 <.0001
Table A4. 17 Analysis of variance – Spray-timings PSRI (July 13) – remote sensing
2015
Random effects Estimate Standard
error
Z value Pr > Z
Block 0 . . .
Residual 0.00 0.00 2.74 .0031
Fixed effects Num df Den df F value Pr > F
Block 3 0 42.12 .
Treatment 5 15 7.06 0.0014

245
Table A4. 18 Raw data - Spray-timing trails- Cultivar-Remote Sensing (13 July, 2015)
Treatment Block Incjy13 NDVIjy13 GNDVIjy13 PSRIjy13 CIjy13
BOTCAST 1 77 0.1025 0.0583 0.2094 0.1113
TOMCAST 1 65 0.0965 0.0965 0.2024 0.1066
STEMCAST 1 79 0.0812 0.1935 0.1964 0.0591
CP1 1 57 0.0693 0.2791 0.2136 0.0365
LDR 1 81 0.0690 0.2697 0.2476 0.0273
Unsprayed 1 84 0.0846 0.1693 0.256667 0.0828
BOTCAST 2 68 0.0887 0.1203 0.242533 0.1261
TOMCAST 2 55 0.0924 0.0991 0.2013 0.1227
STEMCAST 2 75 0.0731 0.1497 0.181433 0.0711
CP1 2 64 0.0613 0.1739 0.179267 0.0179
LDR 2 87 0.0511 0.1509 0.266833 0.0369
Unsprayed 2 85 0.0609 0.0935 0.3667 0.0821
BOTCAST 3 66 0.0740 0.0291 0.4288 0.1163
TOMCAST 3 68 0.0824 0.0483 0.414733 0.1116
STEMCAST 3 64 0.0865 0.0967 0.4028 0.0641
CP1 3 57 0.0902 0.1395 0.4372 0.0415
LDR 3 75 0.0963 0.1349 0.505267 0.0323
Unsprayed 3 83 0.1031 0.0847 0.523333 0.1425
BOTCAST 4 79 0.1069 0.0601 0.495067 0.2421
TOMCAST 4 72 0.1087 0.0495 0.4126 0.2454
STEMCAST 4 78 0.1030 0.0616 0.372867 0.1422
CP1 4 58 0.0979 0.0574 0.368533 0.0357
LDR 4 74 0.1023 0.2697 0.540333 0.0737
Unsprayed 4 86 0.1219 0.1693 0.736733 0.1642
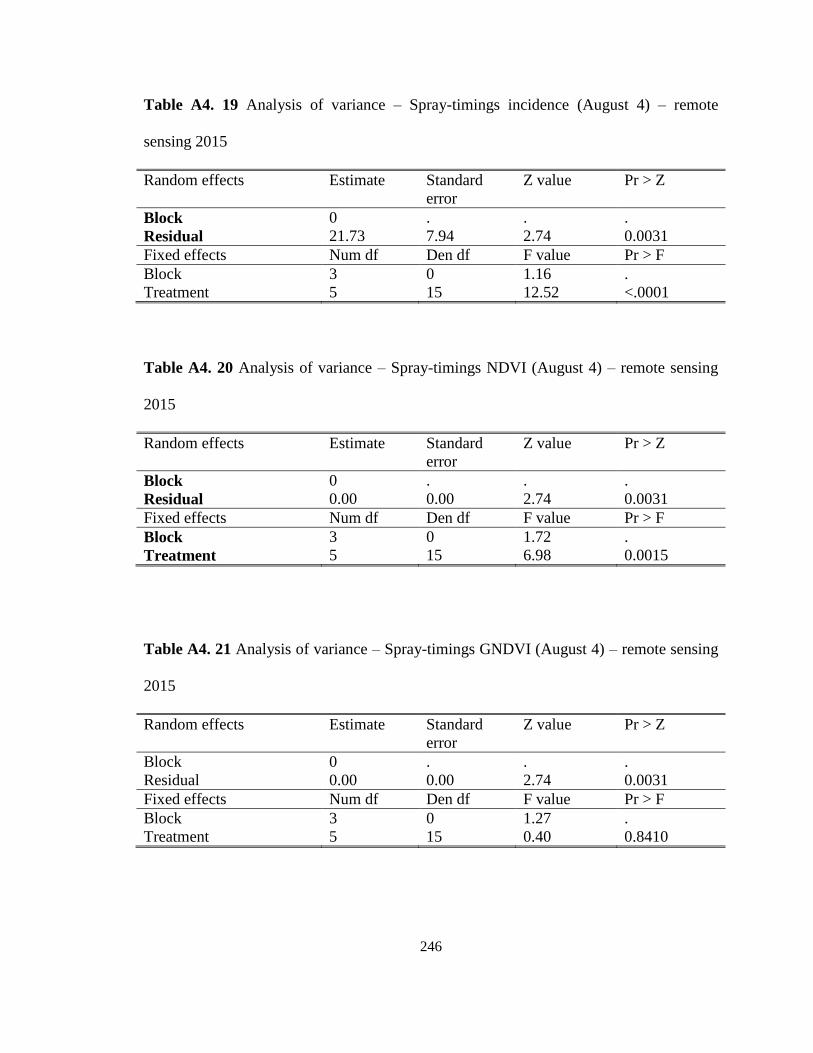
246
Table A4. 19 Analysis of variance – Spray-timings incidence (August 4) – remote
sensing 2015
Random effects Estimate Standard
error
Z value Pr > Z
Block 0 . . .
Residual 21.73 7.94 2.74 0.0031
Fixed effects Num df Den df F value Pr > F
Block 3 0 1.16 .
Treatment 5 15 12.52 <.0001
Table A4. 20 Analysis of variance – Spray-timings NDVI (August 4) – remote sensing
2015
Random effects Estimate Standard
error
Z value Pr > Z
Block 0 . . .
Residual 0.00 0.00 2.74 0.0031
Fixed effects Num df Den df F value Pr > F
Block 3 0 1.72 .
Treatment 5 15 6.98 0.0015
Table A4. 21 Analysis of variance – Spray-timings GNDVI (August 4) – remote sensing
2015
Random effects Estimate Standard
error
Z value Pr > Z
Block 0 . . .
Residual 0.00 0.00 2.74 0.0031
Fixed effects Num df Den df F value Pr > F
Block 3 0 1.27 .
Treatment 5 15 0.40 0.8410

247
Table A4. 22 Analysis of variance – Spray-timings CI (August 04) – remote sensing
2015
Random effects Estimate Standard
error
Z value Pr > Z
Block 0 . . .
Residual 0.00 0.00 2.74 0.0031
Fixed effects Num df Den df F value Pr > F
Block 3 0 16.52 .
Treatment 5 15 10.97 0.0001
Table A4. 23 Analysis of variance – Spray-timings PSRI (August 04) – remote sensing
2015
Random effects Estimate Standard
error
Z value Pr > Z
Block 0 . . .
Residual 0.00 0.00 2.74 0.0031
Fixed effects Num df Den df F value Pr > F
Block 3 0 123.87 .
Treatment 5 15 3.96 0.0173
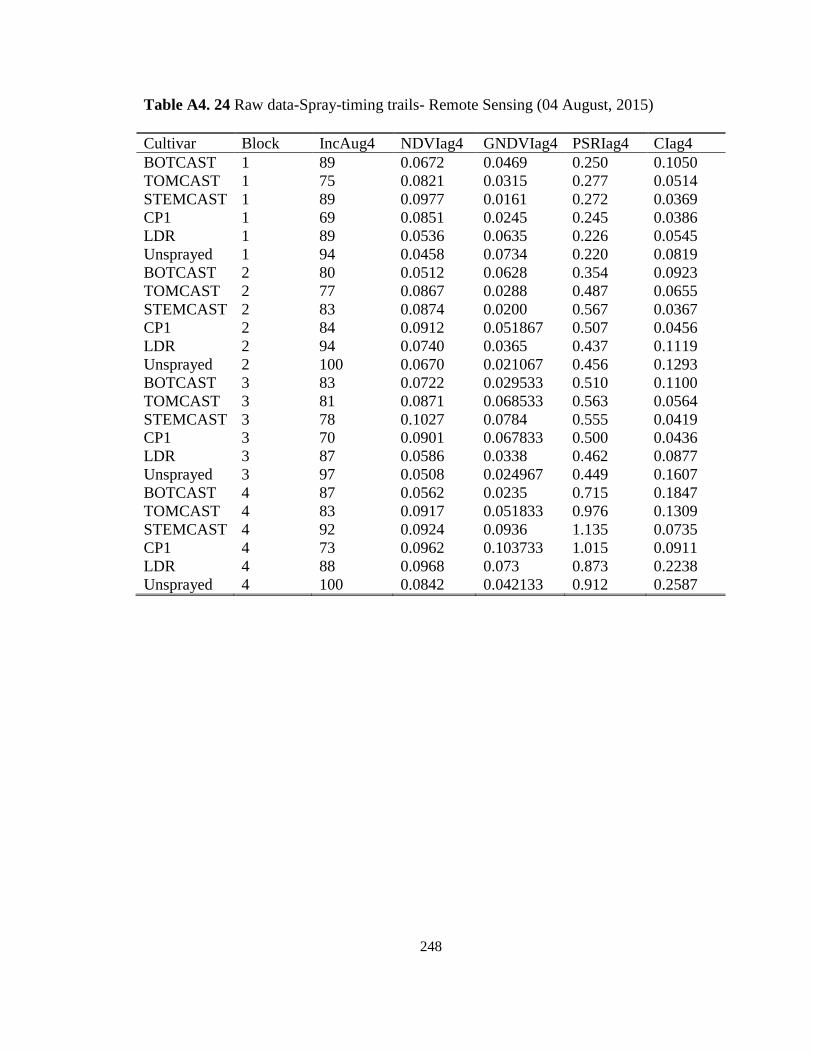
248
Table A4. 24 Raw data-Spray-timing trails- Remote Sensing (04 August, 2015)
Cultivar Block IncAug4 NDVIag4 GNDVIag4 PSRIag4 CIag4
BOTCAST 1 89 0.0672 0.0469 0.250 0.1050
TOMCAST 1 75 0.0821 0.0315 0.277 0.0514
STEMCAST 1 89 0.0977 0.0161 0.272 0.0369
CP1 1 69 0.0851 0.0245 0.245 0.0386
LDR 1 89 0.0536 0.0635 0.226 0.0545
Unsprayed 1 94 0.0458 0.0734 0.220 0.0819
BOTCAST 2 80 0.0512 0.0628 0.354 0.0923
TOMCAST 2 77 0.0867 0.0288 0.487 0.0655
STEMCAST 2 83 0.0874 0.0200 0.567 0.0367
CP1 2 84 0.0912 0.051867 0.507 0.0456
LDR 2 94 0.0740 0.0365 0.437 0.1119
Unsprayed 2 100 0.0670 0.021067 0.456 0.1293
BOTCAST 3 83 0.0722 0.029533 0.510 0.1100
TOMCAST 3 81 0.0871 0.068533 0.563 0.0564
STEMCAST 3 78 0.1027 0.0784 0.555 0.0419
CP1 3 70 0.0901 0.067833 0.500 0.0436
LDR 3 87 0.0586 0.0338 0.462 0.0877
Unsprayed 3 97 0.0508 0.024967 0.449 0.1607
BOTCAST 4 87 0.0562 0.0235 0.715 0.1847
TOMCAST 4 83 0.0917 0.051833 0.976 0.1309
STEMCAST 4 92 0.0924 0.0936 1.135 0.0735
CP1 4 73 0.0962 0.103733 1.015 0.0911
LDR 4 88 0.0968 0.073 0.873 0.2238
Unsprayed 4 100 0.0842 0.042133 0.912 0.2587
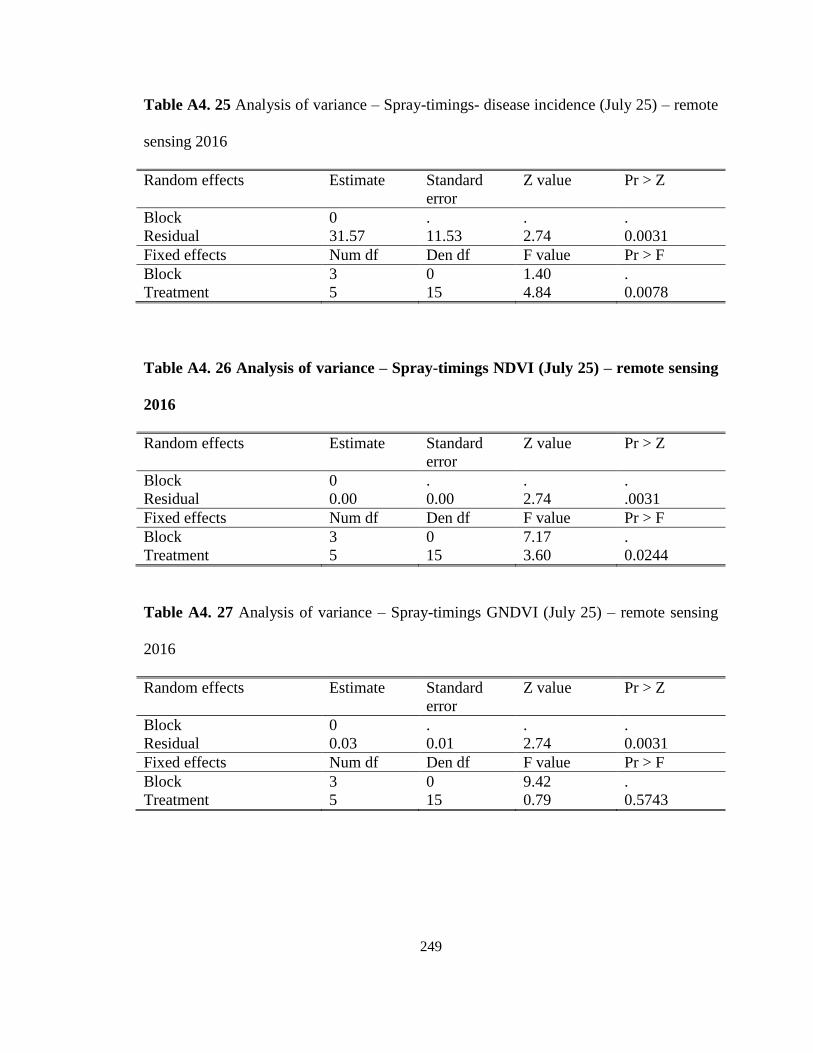
249
Table A4. 25 Analysis of variance – Spray-timings- disease incidence (July 25) – remote
sensing 2016
Random effects Estimate Standard
error
Z value Pr > Z
Block 0 . . .
Residual 31.57 11.53 2.74 0.0031
Fixed effects Num df Den df F value Pr > F
Block 3 0 1.40 .
Treatment 5 15 4.84 0.0078
Table A4. 26 Analysis of variance – Spray-timings NDVI (July 25) – remote sensing
2016
Random effects Estimate Standard
error
Z value Pr > Z
Block 0 . . .
Residual 0.00 0.00 2.74 .0031
Fixed effects Num df Den df F value Pr > F
Block 3 0 7.17 .
Treatment 5 15 3.60 0.0244
Table A4. 27 Analysis of variance – Spray-timings GNDVI (July 25) – remote sensing
2016
Random effects Estimate Standard
error
Z value Pr > Z
Block 0 . . .
Residual 0.03 0.01 2.74 0.0031
Fixed effects Num df Den df F value Pr > F
Block 3 0 9.42 .
Treatment 5 15 0.79 0.5743

250
Table A4. 28 Analysis of variance – Spray-timings CI (July 25) – remote sensing 2016
Random effects Estimate Standard
error
Z value Pr > Z
Block 0 . . .
Residual 0.00 0.00 2.74 0.0031
Fixed effects Num df Den df F value Pr > F
Block 3 0 3.70 .
Treatment 5 15 13.94 <.0001
Table A4. 29 Analysis of variance – Spray-timings PSRI (July 25) – remote sensing
2016
Random effects Estimate Standard
error
Z value Pr > Z
Block 0 . . .
Residual 0.00 0.00 2.74 .0031
Fixed effects Num df Den df F value Pr > F
Block 3 0 3.70 .
Treatment 5 15 13.94 <.0001

251
Table A4. 30 Raw data Spray-timing trails- Remote Sensing (25 July, 2016)
Treatment Block incjy25 NDVIjy25 GNDVIjy25 PSRIjy25 CIjy25
BOTCAST 1 17 0.1288 0.1461 0.0834 0.3710
TOM15 1 6 0.1352 0.0455 0.0922 0.3553
TOM1525 1 15 0.1410 0.0754 0.0908 0.1970
TOM15R 1 8 0.1504 0.1511 0.0817 0.1216
CP2 1 20 0.1611 0.2180 0.0753 0.0909
Unsprayed 1 32 0.1670 0.2107 0.0732 0.2760
BOTCAST 2 11 0.1698 0.1323 0.1180 0.4204
TOM15 2 15 0.1609 0.0940 0.1622 0.4090
TOM1525 2 11 0.1530 0.0774 0.1891 0.2370
TOM15R 2 16 0.1076 0.0963 0.1691 0.0596
CP2 2 14 0.1283 0.0897 0.1455 0.1229
Unsprayed 2 19 0.3217 0.2839 0.1520 0.1283
BOTCAST 3 10 0.2706 0.1782 0.1701 0.1817
TOM15 3 0 0.2311 0.0455 0.1878 0.1744
TOM1525 3 8 0.2301 0.1782 0.1849 0.1002
TOM15R 3 18 0.2819 0.1942 0.1667 0.0648
CP2 3 7 0.2956 0.3218 0.1540 0.0504
Unsprayed 3 17 0.3080 0.6449 0.1497 0.2227
BOTCAST 4 8 0.2437 0.9302 0.2382 0.3783
TOM15 4 6 0.2042 0.8991 0.3255 0.3834
TOM1525 4 9 0.1704 0.5644 0.3782 0.2222
TOM15R 4 17 0.0952 0.4009 0.3382 0.0558
CP2 4 3 0.1157 0.3302 0.2910 0.0776
Unsprayed 4 31 0.3418 0.4991 0.3040 0.1728

252
Table A4. 31 Analysis of variance – Spray-timings- disease incidence (August 02) –
remote sensing 2016
Random effects Estimate Standard
error
Z value Pr > Z
Block 0 . . .
Residual 38.41 14.02 2.74 0.0031
Fixed effects Num df Den df F value Pr > F
Block 3 0 1.40 .
Treatment 5 15 4.74 0.0085
Table A4. 32 Analysis of variance – Spray-timings NDVI (August 02) – remote
sensing 2016
Random effects Estimate Standard
error
Z value Pr > Z
Block 0 . . .
Residual 0.00 0.00 2.74 .0031
Fixed effects Num df Den df F value Pr > F
Block 3 0 27.41 .
Treatment 5 15 9.62 0.0003
Table A4. 33 Analysis of variance – Spray-timings GNDVI (August 02) – remote
sensing 2016
Random effects Estimate Standard
error
Z value Pr > Z
Block 0 . . .
Residual 0.03 0.01 2.74 0.0031
Fixed effects Num df Den df F value Pr > F
Block 3 0 1.08 .
Treatment 5 15 0.21 0.9546

253
Table A4. 34 Analysis of variance – Spray-timings CI (August 02) – remote sensing
2016
Random effects Estimate Standard
error
Z value Pr > Z
Block 0 . . .
Residual 0.00 0.00 2.74 0.0031
Fixed effects Num df Den df F value Pr > F
Block 3 0 16.54 .
Treatment 5 15 10.99 .0001
Table A4. 35 Analysis of variance – Spray-timings PSRI (August 02) – remote
sensing 2016
Random effects Estimate Standard
error
Z value Pr > Z
Block 0 . . .
Residual 0.01 0.00 2.74 .0031
Fixed effects Num df Den df F value Pr > F
Block 3 0 2.82 .
Treatment 5 15 2.90 .0503

254
Table A4. 36 Raw data Spray-timing trails- Remote Sensing (2 August, 2016)
Treatment Block incjy25 NDVIag1 GNDVIag1 PSRIag1 CIag1
BOTCAST 1 19 0.2239 0.1562 0.6710 0.0350
TOM15 1 7 0.2736 0.1050 0.6048 0.0171
TOM1525 1 17 0.3258 0.0536 0.5976 0.0123
TOM15R 1 9 0.2837 0.0818 0.8894 0.0129
CP2 1 22 0.1788 0.2118 0.5730 0.0182
Unsprayed 1 35 0.1527 0.2447 0.6700 0.0273
BOTCAST 2 12 0.1706 0.2094 0.6480 0.0308
TOM15 2 17 0.2889 0.0960 0.6294 0.0218
TOM1525 2 12 0.2914 0.0666 0.6831 0.0122
TOM15R 2 18 0.3041 0.1729 0.7895 0.0152
CP2 2 15 0.2466 0.1217 0.8177 0.0373
Unsprayed 2 21 0.1047 0.0329 0.7735 0.0431
BOTCAST 3 11 0.1128 0.0461 0.6447 0.0367
TOM15 3 0 0.1360 0.1071 0.5826 0.0188
TOM1525 3 9 0.1605 0.1225 0.5758 0.0140
TOM15R 3 20 0.1408 0.1060 0.5688 0.0145
CP2 3 8 0.0916 0.0528 0.7755 0.0292
Unsprayed 3 19 0.0794 0.0390 0.6980 0.0536
BOTCAST 4 9 0.0878 0.0367 0.6746 0.0616
TOM15 4 7 0.1432 0.0810 0.6547 0.0436
TOM1525 4 10 0.1444 0.1463 0.7120 0.0245
TOM15R 4 19 0.1504 0.1621 0.8254 0.0304
CP2 4 3 0.1019 0.0768 0.8556 0.0746
Unsprayed 4 34 0.0887 0.0444 0.8084 0.0862
Top Related