


Languages
Pages
Legal


Epidemiology and
Characteristics of
Influenza A H7N9
Infections
Daniel B. Jernigan, MD MPH
Influenza Division
Centers for Disease Control and Prevention
March 19, 2014

Objectives
Background on H7 influenza infections
Epidemiologic findings
Comparison of H7N9 and H5N1
Live poultry markets and human illness

Human Infections with H7 subtype Influenza A Viruses
H7 virus infection in humans is uncommon, but has been
documented in persons who have direct contact with infected
birds, especially during outbreaks of H7 virus among poultry.
Reported human H7 infections have been generally mild,
causing conjunctivitis and influenza-like illness1
1. Belser, Bridges, Katz, Tumpey. EID 2009;15(6):859-865

Human Infections with H7 subtype Influenza A Viruses
Netherlands – H7N7 In early 2003, an outbreak of HPAI H7N7
fowl plague occurred in the Netherlands1
Detection of H7N7 in 86 humans with poultry exposure and in three of their family members Most (91%) had conjunctivitis
One death in 57 yo veterinarian
>30 million birds either died or were culled
Mexico – H7N3 In mid 2012, outbreaks with HPAI H7N3
reported in Mexico2
Two human H7N3 cases were reported of conjunctivitis without fever or respiratory symptoms in persons exposed to poultry
3.8M birds either died or were culled
1. Fouchier, Schneeberger, Rozendaal, et al. PNAS 2004;101(5):1356-1361
2. CDC. MMWR 2012 Sep 14;61(36):726-7
3. Bull World Health Organ vol.81 n.6 Genebra Jan. 2003
4. Tam, Getty Images

Initial Influenza A(H7N9) Cases in China
Shanghai 2 cases
Anhui 1 case
On 31 March 2013, the China Health and Family
Planning Commission notified WHO of three
cases of human infection with influenza
A(H7N9)1,2
Cases were from:
Shanghai Municipality: 87yo M, 27yo M
Anhui Province 35yo F
All three cases presented with respiratory tract
infection with progression to severe pneumonia
and breathing difficulties
Two deaths, one in critical condition –
subsequently died
No poultry die-offs
1. MMWR / May 10, 2013 / Vol. 62 / No. 18
2. WHO Global Alert and Response (www.who.int/csr/don/2013_04_01/en/index.html)

Initial Influenza A(H7N9) Cases in China
Shanghai 2 cases
Anhui 1 case
In this region, around 575 million people
45% of China
8% of World1
In the 50 km around the 60 early cases
of H7N9, there were an estimated2:
131M people
241M domestic chickens
47M domestic ducks
22M pigs
1. National Bureau of Statistics - China Statistical Database , 2011 (http://219.235.129.58/welcome.do)
2. Butler D. Mapping the H7N9 avian flu outbreaks. www.nature.com
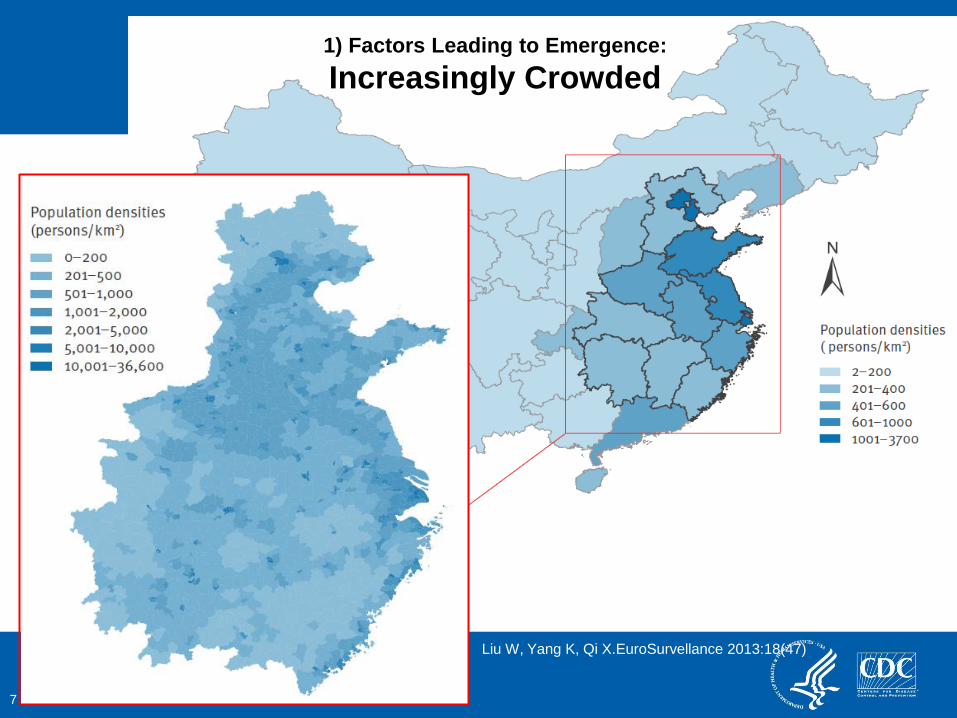
7
Liu W, Yang K, Qi X.EuroSurvellance 2013:18(47)
1) Factors Leading to Emergence:
Increasingly Crowded

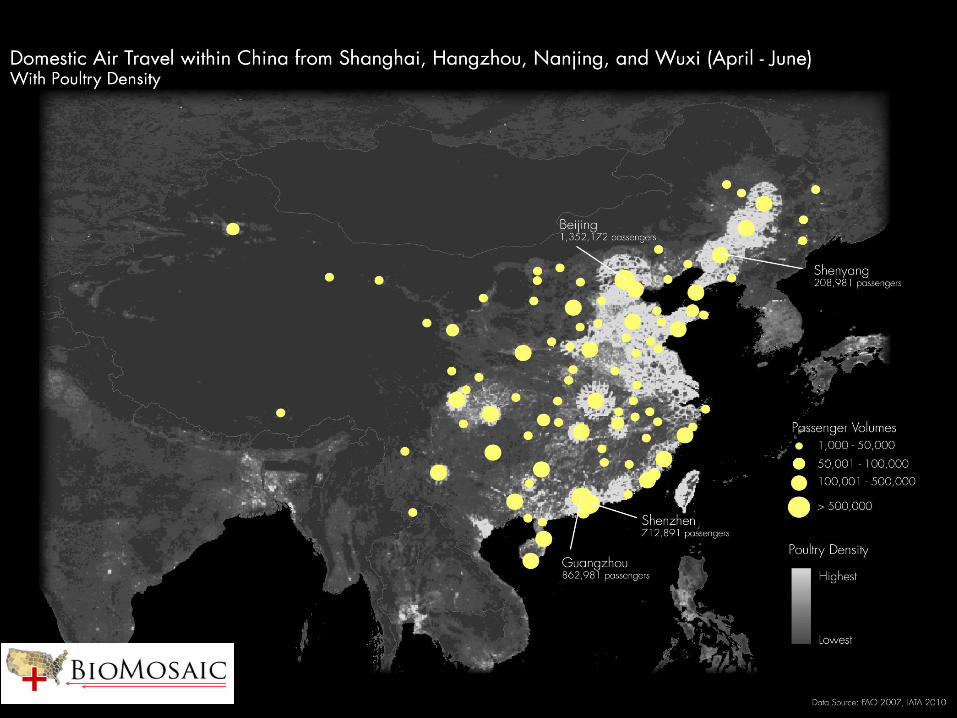
2) Factors Leading to Emergence:
Increasingly Connected
One can travel to almost any
major urban center in the world
within the incubation period of
most infectious diseases1
In 2011, 2.75B airline
passengers globally
1. Relmen, Choffnes, Mack. IOM 2010.
2. FDA. Global Engagement. http://www.fda.gov/AboutFDA/ReportsManualsForms/Reports/ucm298576.htm
3. Michael Markieta/ Arup
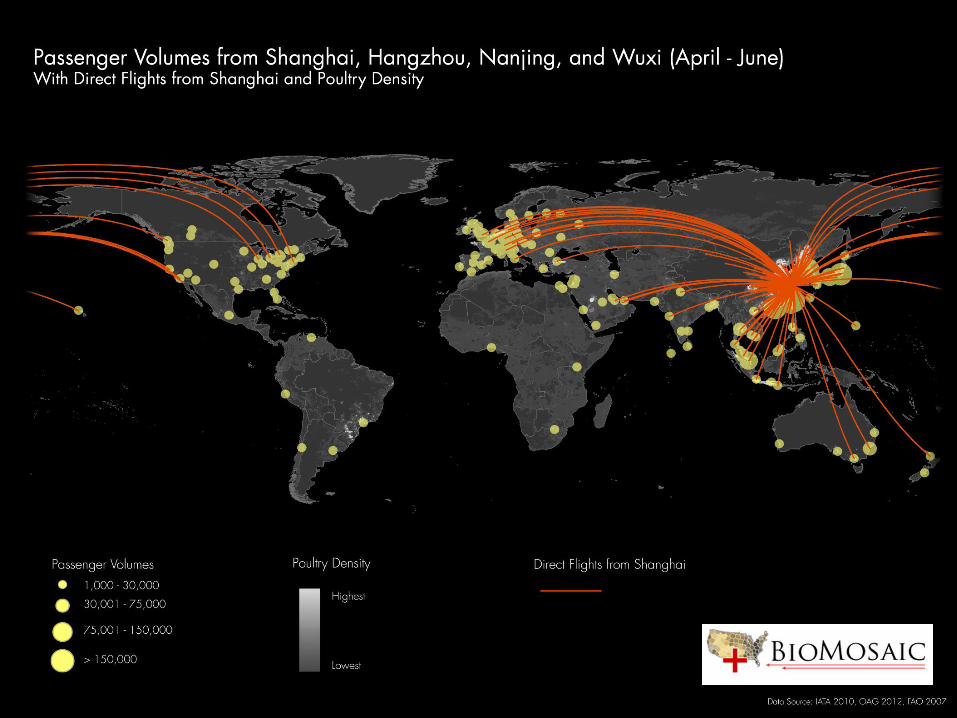
http://www.biodiaspora.com/

3) Factors Leading to Emergence:
Increasingly Converging Poultry Consumption and Population – Hong Kong, Shanghai, and China
10
To K, Chan J, Chen H, et al. Lancet 2013:13,809-821.
http://www.biodiaspora.com/

0
2
4
6
8
10
12
14
2/18 3/18 4/18 5/18 6/18 7/18 8/18 9/18 10/18 11/18 12/18 1/18 2/18 3/18 4/18 5/18
Nu
mb
er
of
Cas
es
Onset Date
Epidemic Curve for Confirmed Cases of Avian Influenza A(H7N9), 18 Feb 2013 – 17 Mar 2014 (N=392)*
Malaysia
China
Avian Influenza A (H7N9) Update –
China March 17, 2014
* Onset date unknown for 6 cases

H7N9 in a Post-SARS,
Post-H1N1 World
Long History of CDC Collaboration with
China and Beijing
• Sustainability CoAgs
• Laboratory Training/Exchange
• National Influenza Center support
• WHO Collaborating Center Initiated
Global Response
• WHO GISRS – virus sharing
• HHS funds through CDC CoAgs provide
rapid resources China’s neighbors
• H7N9 kits developed and manufactured
by CDC, FDA-cleared, distributed
globally
• Vaccine candidates synthesized, trials
initiated
13
www.influenzareagentresource.com

Surveillance Sources: Chinese National Influenza-Like Illness
Surveillance Network (CNISN)
Xu, Havers, Wang, et al. Monitoring avian influenza A(H7N9) virus through national influenza-like illness surveillance, China. EID, 2013
CNISN: >900 sentinel
facilities, submit swabs
Mar – Apr 2013
~60K swabs from all
provinces from ILI patients
and hospital labs
6 positive for PCR in
affected provinces

Severe Acute Respiratory Infection (SARI) Surveillance and Pneumonia
of Unknown Etiology (PUE) Surveillance
Severe Acute Respiratory Infection
(SARI) Surveillance
10 sites in major locations
Only one site with cases identified
Xiang N, Havers F, Chen T, et al EID 2013;19:1784
Pneumonia of Unknown Etiology Surveillance
A testing and reporting system established following SARS/H5
Routinely used for accessing testing for novel influenza and other rare
respiratory pathogens, only following rigorous review
March 2013, lowered requirements for improving access to testing following
emergence of H7N9
Most common means by which H7N9 cases identified

0
2
4
6
8
10
12
14
2/18 3/18 4/18 5/18 6/18 7/18 8/18 9/18 10/18 11/18 12/18 1/18 2/18 3/18 4/18 5/18
Nu
mb
er
of
Cas
es
Onset Date
Epidemic Curve for Confirmed Cases of Avian Influenza A(H7N9), 18 Feb 2013 – 17 Mar 2014 (N=392)*
Malaysia
China
Avian Influenza A (H7N9) Update –
China March 17, 2014
* Onset date unknown for 6 cases
H5 Seasonality H5 Seasonality
67yo F from Guangdong,
traveled to Sabah,
Malaysia

17

Geographic Distribution of Cases of Influenza A(H7N9)
in China for Spring and Fall Waves As of March 13, 2014
18

Hong Kong
Guangdong
Guangxi
Guizhou
Taiwan
Fujian
Hunan
Jiangxi
Zhejiang
Shanghai
Anhui
Jiangsu
Henan
Shandong
Beijing
Hebei
Jilin
Number of Cases of Influenza A(H7N9) in Chinese Provinces North to South and Spring to Fall
Cases Spring Cases Fall100 50

Hong Kong
Guangdong
Guangxi
Guizhou
Taiwan
Fujian
Hunan
Jiangxi
Zhejiang
Shanghai
Anhui
Jiangsu
Henan
Shandong
Beijing
Hebei
Jilin
Number of Cases of Influenza A(H7N9) in Chinese Provinces North to South and Spring to Fall
Cases Spring Cases Fall100 50

High Risk Areas for H7N9 Emergence in Asia
Identifying areas with a high risk of human infection with
the avian influenza A(H7N9) virus in East Asia
• Fuller T, Havers F, Xu C, et al. Journal of Infection, March 2014
Geospatial mapping with surveillance data used to
develop risk maps
Northern Vietnam has high risk of virus spread
21

22
0-17 years
18-34 years
35-59 years
60-74 years
>=75 years
Age of Patients with Influenza A(H7N9) in China, Cateqorized by Spring and Fall Occurrence
Spring % Fall % 40% 30% 0%
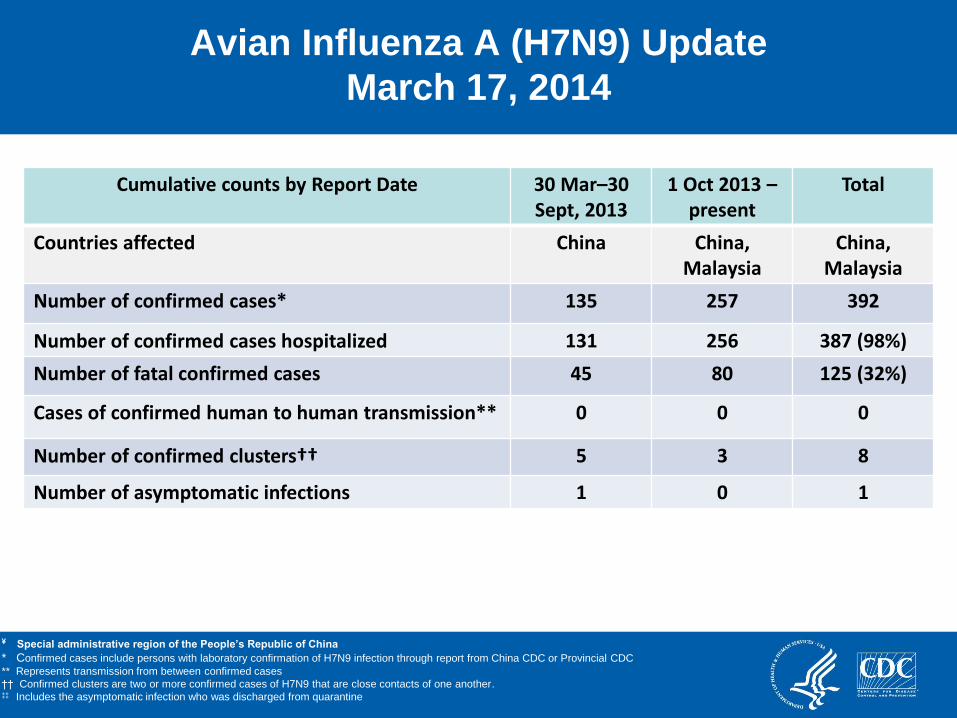
Avian Influenza A (H7N9) Update
March 17, 2014
Cumulative counts by Report Date 30 Mar–30 Sept, 2013
1 Oct 2013 – present
Total
Countries affected China China, Malaysia
China, Malaysia
Number of confirmed cases* 135 257 392
Number of confirmed cases hospitalized 131 256 387 (98%)
Number of fatal confirmed cases 45 80 125 (32%)
Cases of confirmed human to human transmission** 0 0 0
Number of confirmed clusters†† 5 3 8
Number of asymptomatic infections 1 0 1
¥ Special administrative region of the People’s Republic of China
* Confirmed cases include persons with laboratory confirmation of H7N9 infection through report from China CDC or Provincial CDC
** Represents transmission from between confirmed cases
†† Confirmed clusters are two or more confirmed cases of H7N9 that are close contacts of one another. ‡‡ Includes the asymptomatic infection who was discharged from quarantine
Prior human illness due to H7 has been
mild (conjunctivitis), and only one death

Demographic Characteristics of H7N9 Cases
Type of residence — no. (%)
• Urban 101 (73)
• Rural 38 (27)
**n=132, †n=371, §n=116, ¥n=231, ¤n= 347, **n=129, ††n=235, §§n=365, ¥¥n= 77, ***n=175
1 Overall poultry exposure is not included here as exposure data is not available for most cases reported between 30 Mar-30 Sept 2013. 2 Source Li, Preliminary Report: Epidemiology of the Avian Influenza A (H7N9) Outbreak in China. New England Journal of Medicine, April
24, 2013.
Spring cases
(n=135)
Fall cases
(n=152)
Overall
(n=287)
Male (N, %) 94 (69.6)* 161 (67.4) 255 (68.2)†
Days from Onset to Hospitalization
(median, IQR) 5 (3-7) § 4 (3-6)¥ 5 (3-7)¤
Days from Onset to Report (median, IQR) 8 (6-11) ** 8 (7-11) †† 8 (7-11) §§
Poultry Exposure (N, %)1 59 (77) ¥¥,2

Family Clusters
Four family clusters described in depth
All involved significant and prolonged exposures caring
for ill relatives or close family setting
Li Q, Zhou L, Zhou M, et al. NEJM 2014 Feb;370:520

Contact Evaluations
For 139 cases, 2,675 contacts were followed
Among 1,953 contacts with demographic information:
• 53% healthcare workers
• 26% family members or relatives
• 20% social contacts
All 2,675 were followed for 7 days
• 28 developed respiratory symptoms
• All were PCR negative for H7N9
Li Q, Zhou L, Zhou M, et al. NEJM 2014 Feb;370:520

Transmission Dynamics
Incubation Period: H7N9: 3.3 days (1.4-5.7)1
H3N2v: 2.91 days (2.7–3.1 days)5
Seasonal Flu: 2 days (1-4)4
R0: H7N9: 0.1 (95%CI 0.01 – 0.49)2
H3N2v: 0.2 (95%CI 0.1–0.4)3
Novel Flu: 0.34 (IQR: 0.05–0.98)4
Seasonal Flu: 1.28 (IQR: 1.19–1.37)4
Time to first 100 cases
H5N1 < H7N9 < H3N2v
1 Yu H, Wu J, Cowling B, et al. Lancet 2014;383:541.
2. Chowell G, Simonsen L, Towers S, et al. BMC
Medicine 2013;11:214
3. Cauchemez S, Epperson S, Biggerstaff M, et al.
PLoS Med 10(3): e1001399.
4. Biggerstaff M, Cauchemez S, Reed C, et al. In
Press. 2014
5. Jhung M, Epperson S, Biggerstaff M, et al CID
2013;57(12):1703–12
H7N9 Incubation Period: 3.3 days (1.4-5.7)1

Epi-curve of Avian Influenza A (H5N1) Virus Cases by Onset of Illness for 2003-2012
0
5
10
15
20
25
No
v
Feb
May
Au
g
No
v
Feb
May
Au
g
No
v
Feb
May
Au
g
No
v
Feb
May
Au
g
No
v
Feb
May
Au
g
No
v
Feb
May
Au
g
No
v
Feb
May
Au
g
No
v
Feb
May
Au
g
No
v
Feb
May
Au
g
No
v
2003 2004 2005 2006 2007 2008 2009 2010 2011 2012
Nu
mb
er
of
Cas
es
Onset of Illness
Azerbaijan (n=8)
Nigeria (n=1)
Cambodia (n=21)
China (n=43)
Djibouti (n=1)
Egypt (n=169)
Indonesia (n=192)
Iraq (n=4)
Thailand (n=25)
Turkey (n=12)
Vietnam (n=123)
100 cases reached in 18 months

0
1
2
3
4
5
6
7
8
9
10
2/18 2/25 3/4 3/11 3/18 3/25 4/1 4/8 4/15 4/22 4/29 5/6 5/13 5/20
Nu
mb
er
of
Cas
es
Illness Onset Date
Epi-curve of Avian Influenza A(H7N9) Virus Cases February—May 2013
100 cases reached in 2 months

Epi-curve for Influenza A (H3N2) Variant Virus Cases, July—September, 2012 (N=306)
4/19/2013
0
5
10
15
20
25
30
35
40
7/9 7/16 7/23 7/30 8/6 8/13 8/20 8/27 9/3 9/10
Nu
mb
er
of
Cas
es
Illness Onset Date
MN (n=4)
MD (n=12)
PA (n=11)
WI (n=20)
MI (n=6)
WV (n=3)
IL (n=4)
OH (n=106)
IN (n=138)
HI (n=1)
These slides contain unpublished data, please DO NOT distribute or reproduce.
100 cases reached in 2 weeks

Underlying Conditions of Confirmed H7N9 Cases in China (N=111)
Coexisting condition — no. (%)1
Any
Hypertension
Diabetes
Coronary heart disease
Immunosuppression*
Chronic obstructive pulmonary
disease
Cancer†
Cerebrovascular disease
Hepatitis B infection‡
Chronic renal disease
Pregnancy
Current Smoker
68 (61.3)
51 (45.9)
18 (16.2)
11 (9.9)
10 (9.0)
8 (7.2)
6 (5.4)
4 (3.6)
4 (3.6)
2 (1.8)
2 (1.8)
27 (24.3)
* Immunosuppression may have been caused by the presence of human immunodeficiency virus infection, chemotherapy or radiotherapy within 1
month before the onset of illness, or glucocorticoid therapy (equivalent of 30 mg of
prednisone per day) for 15 days before the onset of illness.
† Cancers included breast cancer, colorectal cancer, thyroid cancer, thymoma, and lymphoma. Of these cancers, only one case of lymphoma was
active, whereas the other cases were stable disease.
‡ Hepatitis B infection was defined as a positive assay for hepatitis B surface antigen, with or without an elevated level of alanine aminotransferase.
1. Gao, Lu, Cao, et al. Clinical findings in 111 cases of influenza A (H7N9) virus infection. NEJM June 13, 2013
2. Li Q, Zhou L, Zhou M, et al. NEJM 2014 Feb;370:520
3. Wang C, Yu H, Horby P, et al CID 2014
79/108 (73)2

Clinical Complications of Confirmed Cases – China
Complications — no. (%)
Pneumonia
ARDS
ICU Admit
Mechanical Ventilation
Noninvasive
Invasive
108(97.3)
79 (71.2)
85 (76.6)
31 (27.9)
65 (58.6)
Gao, Lu, Cao, et al. Clinical findings in 111 cases of influenza A (H7N9) virus infection. NEJM June 13, 2013

Comparison of Symptoms at Illness Onset
for H7N9 and H5N1 Cases
Cowling, Jin, Lau, et al. Comparative epidemiology of human infections with H7N9… Lancet June 24, 2013.

Comparison of Days of Hospitalization
for H7N9, H5N1, and pH1N1 Cases
Cowling, Jin, Lau, et al. Comparative epidemiology of human infections with H7N9… Lancet June 24, 2013.

36
0
2
4
6
8
10
12
14
16
18
20
22
24
26
28
0-9 10-19 20-29 30-39 40-49 50-59 60-69 70-79 >=80
Nu
mb
er
of
Ca
se
s
Age Group (Years)
Age Distribution of H5N1 Compared to Avian Influenza A(H7N9) cases in China
H5N1 cases (n=45)
H7N9 cases (n=129)
Median (IQR):
H5N1: 26 years (19-25)
H7N9: 61 years (48-73)
06/11/2013
Is H7N9 New, or Just Newly Recognized?
One seroepidemiologic study found 13.9% of poultry
workers and 0.8% of general population in Zhejiang
province had HI titers >401
Another serosurvey of 1544 poultry workers did not find
any evidence for human infection with the novel avian-
origin influenza A (H7N9) virus in poultry workers before
November 2012 in eastern China2
Phylogenetic studies suggest little to no dissemination of
H7N9 by waterfowl, and “Influenza A(H7N9) virus
probably emerged after a long silent circulation in live
poultry markets in eastern Asia”3
37
1. Yang JID 2013
2. Bai T et al. NEJM 2013;368 (24) 2339-2340.
3. Lebarbenchon C et al. EID 2013;19(10):1635-1638.

Evaluation of Pre-Existing Immunity in US
Studies using the HAI and MN assays and serum from
individuals vaccinated with the 2012-13 seasonal
trivalent inactivated influenza vaccine show no existing
cross-reactive antibodies to H7N9 either before or after
vaccination in young children, adult and older adults.
Preliminary results of NHANES sera collected from the
general US population in 2010 suggest there are very
little to no pre-existing cross-reactive antibodies against
H7N9 in all age groups tested (6-80+ yrs)
CDC Influenza Division Laboratory, J Katz et al

Shanghai Live Bird Markets and Human Illness

Animal Exposure among Cases of H7N9
Li Q, Zhou L, Zhou M, et al. NEJM 2014 Feb;370:520

Burden of H7N9 on Humans and Poultry Industry
Qi et al1
• The total direct medical cost was $2.6M.
• The mean cost for each patient was $1,619 for mild patients,
$22,292 for severe cases without death and $32,956 for severe
cases with death.
• The total cost of DALYs was $2.8M.
• The poultry industry losses amounted to $1.24B in 10 affected
provinces and $0.59 billion in eight nonaffected adjacent
provinces.
Wu et al2
• Economic loss associated with LPM closures about $8B
1. Qi J, Jiang D, Wang H, et al. BMJ Open 2014;4:e004189
2. Wu Y, Gao G. Sci China Life Sci 2013;56:493

42 06/14/2013
0
1
2
3
4
5
6
7
8
9
10
2/18 2/25 3/4 3/11 3/18 3/25 4/1 4/8 4/15 4/22 4/29 5/6 5/13 5/20 5/27 6/3 6/10
Nu
mb
er
of
Cas
es
Illness Onset Date
Hunan (n=2)
Fujian (n=5)
Jiangxi (n=6)
Taiwan (n=1)
Shandong (n=2)
Henan (n=4)
Beijing (n=2)
ZheJiang (n=46)
Jiangsu (n=27)
Anhui (n=4)
Shanghai (n=33)
Qidao (Shandong province) LBMs closed
ZuZhuang (Shandong province) LBMs closed
1 Onset dates not available for all cases
Median days onset to report: 8 (IQR: 6-11)
Nanjing, (Jiangsu province) LBMs closed
All ZheJiang province
LBMs closed
Hangzhou (ZheJiang province) LBMs
closed
Shanghai LBMs closed
Epi-Curve of Avian Influenza A (H7N9) Virus Cases by Onset of Illness Date and Province, Municipality, or Area,
18 Feb – 13 Jun 2013 (N=132)

Effect of Closure of Live Poultry Markets
Yu H, Wu J, Cowling B, et al. Lancet 2014(Feb);383:541.
Closure of LPMs dramatically reduced the mean daily number of
infections in four studied cities
Other factors, media, shopping behaviors, may have contributed

0
2
4
6
8
10
12
141
0/1
10
/8
10
/15
10
/22
10
/29
11
/5
11
/12
11
/19
11
/26
12
/3
12
/10
12
/17
12
/24
12
/31
1/7
1/1
4
1/2
1
1/2
8
2/4
2/1
1
2/1
8
2/2
5
3/4
3/1
1
3/1
8
3/2
5
4/1
4/8
4/1
5
4/2
2
4/2
9
Nu
mb
er
of
Cas
es
Illness Onset Date
Epi-Curve of Avian Influenza A (H7N9) Virus Cases by Onset of Illness Date and Province,
Municipality, or Area of China, 1 Oct 2013 – 17 Mar 2014 (N=256)*
Jilin (n=1) Guangxi (n=3) Guizhou (n=1)
Guangdong (n=88) Hebei (n=0) Hunan (n=15)
Fujian (n=16) Jiangxi (n=0) Taiwan (n=1)
Shandong (n=1) Henan (n=0) Beijing (n=2)
Zhejiang (n=92) Jiangsu (n=15) Anhui (n=6)
Shanghai (n=8) Hong Kong (n=7)
* Onset date unknown for 1 case
Lunar New Year
H5 Seasonality
200M people traveling

Live Poultry Market Closures
45

What’s Next?
Is H7N9 here to stay?
• The new H5N1?
Detection
• Improved surveillance in bird markets needed
• Surveillance for H7N9 in humans as sentinel for animal disease?
Prevention
• Role of vaccine for humans
Response
• Continued global coordination needed
46

Acknowledgements:
CDC D Iuliano
A Millman
F Havers
F Palomeque-Rodriguez
A Moen
MA Widdowson
J Bresee
J Villanueva
J Katz
R Donis
N Cox
HHS
China CDC
WHO HQ and Reg Offices
Top Related