


Languages
Pages
Legal

ENVIRONMENTAL IMPACT ASSESSMENT REPORT FOR
BS-VI FUEL QUALITY UP-GRADATIONAND CAPACITY EXPANSION OF PX/PTA
AT PANIPAT REFINERY, HARYANA
PROJECT PROPONENT
PREPARED BY
ABC TECHNO LABS INDIA PRIVATE LIMITED, CHENNAI
NABET/EIA/1316/RA001
JUNE 2017
SCHEDULE 4(a)
PETROLEUM REFINERY INDUSTRIES
TABLE OF CONTENTS
a JUNE 2017
TABLE OF CONTENTS
EXECUTIVE SUMMARY ................................................................................ 17
1.0 INTRODUCTION ................................................................................... 31
1.1 Background ......................................................................................... 31
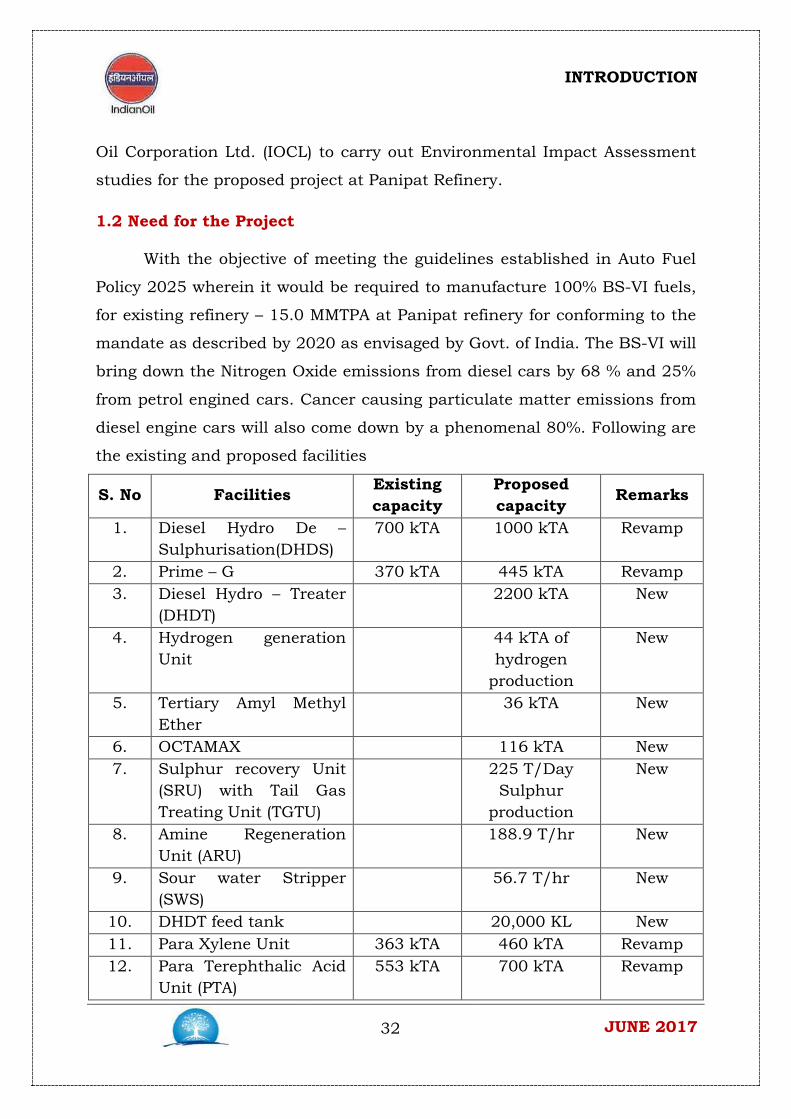
1.2 Need for the Project .............................................................................. 32
1.3 Need for EIA ......................................................................................... 33
1.4 Terms of Reference ............................................................................... 33
1.5 Approach and Methodology .................................................................. 33
1.6 Location of the site ............................................................................... 35
1.7 Structure of EIA Report ........................................................................ 38
2.0 PROJECT DESCRIPTION ......................................................................... 40
2.1 Introduction ......................................................................................... 40
2.2 Need of Project ..................................................................................... 40
2.3 Project Location ................................................................................... 41
2.4 Raw material Source, Requirement and its mode of Transportation ...... 44
2.5 Process Details ..................................................................................... 44
2.5.1 Diesel Hydro – Treater (DHDT) – 2200 kTA ..................................... 44
2.5.2 Hydrogen Generation Unit (HGU) – 44 kTA of Hydrogen Production 46
2.5.3 Amine Regeneration Unit (ARU) – 188.9 T/hr ................................. 48
2.5.4 Sour Water Stripper (SWS) – 56.7 T/hr .......................................... 49
2.5.5 Sulphur recovery Unit (SRU) with Tail Gas Treating Unit (TGTU) .... 51
2.5.6 PX-PTA Capacity Expansion ........................................................... 53
2.5.7 Revamp of existing RFCC Gasoline selective HDS ........................... 54
2.5.8 DHDT Feed Tank – 20,000 KL ........................................................ 55
2.6 Storage Units ....................................................................................... 55
2.7 Power Requirement .............................................................................. 55
2.8 Water Requirement and waste water generation ................................... 55
2.9 Flare System ........................................................................................ 58
2.10 Project cost and Schedule .................................................................. 58
3.0 DESCRIPTION OF ENVIRONMENT .......................................................... 59

TABLE OF CONTENTS
b JUNE 2017
3.1 Introduction ......................................................................................... 59
3.2 Scope of Baseline Study ....................................................................... 59
3.3 Climate and Meteorology ...................................................................... 62
3.3.1 Temperature .................................................................................. 62
3.3.2 Relative Humidity .......................................................................... 63
3.3.3 Atmospheric Pressure .................................................................... 63
3.4 Topography and Geology ...................................................................... 64
3.4.1 Topography .................................................................................... 64
3.4.2 Geology .......................................................................................... 65
3.5 Ambient Air Quality ............................................................................. 65
3.5.1 Methodology for Monitoring and Analysis ....................................... 65
3.5.2 Sampling and Analytical Techniques .............................................. 66
3.5.3 Ambient Air Quality Monitoring Locations ...................................... 66
3.5.4 Status of Ambient Air Quality......................................................... 67
3.5.4.1 Ambient Air Quality within Plant ................................................. 71
3.6 Water Environment .............................................................................. 73
3.6.1 Ground Water Quality .................................................................... 73
3.6.2 Surface water Quality .................................................................... 80
3.6.3 Treated Water Quality .................................................................... 83
3.7 Noise Environment ............................................................................... 83
3.7.1 Ambient Noise Monitoring .............................................................. 84
3.7.2 Noise Levels in the Study Area ....................................................... 84
3.8 Soil Environment ................................................................................. 85
3.8.1 Field Study, Sampling and Analysis ............................................... 85
3.8.2 Selection of Sampling Locations ..................................................... 86
3.8.3 Methodology .................................................................................. 86
3.8.4 Soil Quality .................................................................................... 87
3.8.4 Observation ................................................................................... 88
3.9 Socio Economic Environment ............................................................... 89
3.9.1 Demographic Aspects ..................................................................... 90
TABLE OF CONTENTS
c JUNE 2017
3.9.2 Infrastructure Facilities.................................................................. 92
3.9.2 Traffic Analysis .............................................................................. 93
3.10 Ecology .............................................................................................. 94
3.10.1 Study Methodology....................................................................... 95
3.10.2 Terrestrial Ecology ....................................................................... 95
3.10.3 Aquatic Ecology ........................................................................... 98
4.0 ANTICIPATED ENVIRONMENTAL IMPACTS AND MITIGATION MEASURES ................................................................................................................... 108
4.1 Introduction ....................................................................................... 108
4.2 Physical Environment ........................................................................ 108
4.2.1 Soil Environment ......................................................................... 108
4.2.2 Water Quality............................................................................... 110
4.2.3 Climatology and Meteorology ........................................................ 111
4.2.4 Air Quality ................................................................................... 111
4.2.5 Noise ........................................................................................... 112
4.2.5 Ecology ........................................................................................ 113
4.3 Demographic, Land Use And Socio-economic Environment ................ 114
4.3.1 Demography ................................................................................ 114
4.3.2 Land Use ..................................................................................... 114
4.3.3 Socio Economic ............................................................................ 114
5.0 ANALYSIS OF ALTERNATIVES .............................................................. 116
5.1 Introduction ....................................................................................... 116
5.2 Alternative Technology ....................................................................... 116
5.3 Alternative Site .................................................................................. 117
5.4 Alternatives for Storage ...................................................................... 118
5.5 Alternative for risk reduction at refinery ............................................. 118
6.0 ENVIRONMENTAL MONITORING PROGRAM ......................................... 119
6.1 Introduction ....................................................................................... 119
6.2 Environmental Monitoring and Reporting Procedure........................... 119
6.3 Objectives of Monitoring ..................................................................... 120
6.4 Monitoring Program ........................................................................... 120

TABLE OF CONTENTS
d JUNE 2017
6.4.1 Ambient Air Quality Monitoring .................................................... 120
6.4.2 Water Quality Monitoring ............................................................. 121
6.4.2 Noise Quality Monitoring .............................................................. 121
6.5 Monitoring Methodologies .................................................................. 123
6.6 Responsibility of Monitoring and Reporting System ............................ 123
6.7 Budget for Environmental Monitoring Plan ......................................... 125
6.8 Statutory Returns and Compliance Reports ........................................ 125
7.0 ADDITIONAL STUDIES .......................................................................... 126
7.1 Introduction ....................................................................................... 126
7.2 Public consultation ............................................................................ 126
7.3 Risk Assessment ................................................................................ 126
8.0 PROJECT BENEFITS ............................................................................. 128
9.0 ENVIRONMENTAL MANAGEMENT PLAN ............................................... 129
9.1 Design Phase ..................................................................................... 129
9.2 Construction Phase ............................................................................ 131
9.3 Operation Phase................................................................................. 132
9.4 Environmental Management Cell ........................................................ 142
9.5 Budget for Environmental Management Plan ...................................... 142
10.0 DISCLOSURE OF CONSULTANTS ....................................................... 145
10.1 Introduction ..................................................................................... 145
10.2 The Consultant: ABC Techno Labs India Private Limited .................. 145
10.3 Services of ABC Techno Labs India Private Limited ........................... 146
10.4 Sectors Accredited By NABET ........................................................... 147
10.5 Study Team...................................................................................... 148
LIST OF TABLES
Table 2. 1: Proposed and Existing facilities .................................................... 41
Table 2.2: Material Balance for DHDT ........................................................... 45
Table 2. 3 : Hydrogen Balance for Refinery .................................................... 47
Table 2.4 : Sulphur Balance for refinery ........................................................ 51
TABLE OF CONTENTS
e JUNE 2017
Table 2.5 : Material Balance for PTA Unit ...................................................... 54
Table 3.1: Environmental Attributes .............................................................. 59
Table 3.2: Frequency and Monitoring Methodology ....................................... 60
Table 3.3: Methodology adopted for Sampling and Analysis ........................... 66
Table 3.4 : Ambient Air Quality Monitoring Locations ................................... 67
Table 3.5 : Ambient Air Quality ..................................................................... 68
Table 3.6 : Air Quality Within the plant ......................................................... 72
Table 3.7 : Ground Water Quality Monitoring Stations .................................. 73
Table 3.8 : Indian Standard Specification for Drinking Water ........................ 74
Table 3.9 : Ground water Quality in the Study Area ...................................... 78
Table 3.10 : Surface Water Quality Monitoring Locations ............................... 80
Table 3.11: Surface Water Quality ................................................................. 81
Table 3.12: Treated Water Quality ................................................................. 83
Table 3.13: Noise Levels in Study area.......................................................... 85
Table 3.14 : Soil Sampling Locations ............................................................. 86
Table 3.15 : Soil Characteristics in the Study area ........................................ 87
Table 3.16 : Population Details ..................................................................... 89
Table 3.17 : Population Distribution ............................................................. 90
Table 3.18 : Distribution of Population by Social Structure in Study area (2011)
..................................................................................................................... 91
Table 3.19 : Distribution of Literates in the Study Area (2011) ....................... 91
Table 3.20 : Occupational Structure in the Study Area (2011) ...................... 92
Table 3.21 : Floral Checklist of the Study area .............................................. 99
Table 3.22 : Major Plant species used for social Forestry Plantation in Panipat,
Haryana ...................................................................................................... 104
Table 3.23 : Plants of Medicinal Importance & Other Allied Uses ................. 104
Table 3.24 : Record of Major Faunal Diversity in Study Area ....................... 105
Table 3.25 : Checklists of Macrophytic Plants in Aquatic Habitats ............... 106
Table 3.26 : Plankton Population Load (no/lit) in different Water Samples . 107
Table 3.27 : Checklist of Common Fishes of Study Area .............................. 107
Table 4.1: Anticipated Noise Levels from Various Sources ............................ 112

TABLE OF CONTENTS
f JUNE 2017
Table 6.1 : Environmental Monitoring Programme ....................................... 122
Table 6.2 : ResponsibilitiesofPersonneloftheHSEDepartment ........................ 125
Table 6.3 : Budgetary allocation for environmental monitoring .................... 125
Table 9.1 Budget of Environmental Management Plan (Construction Phase) 143
Table 9.2 Budget of Environmental Management Plan (Operation Phase) ..... 144
LIST OF FIGURES
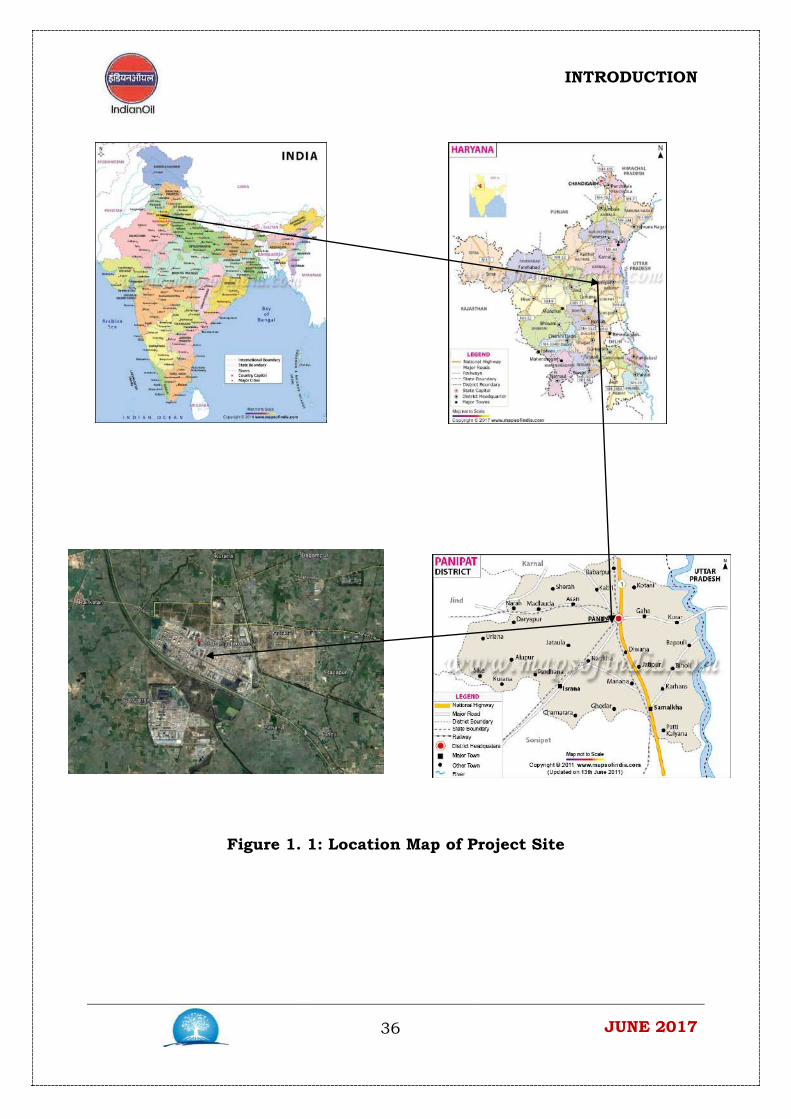
Figure 1. 1: Location Map of Project Site........................................................ 36
Figure 1.2: 10 km radius from Project Site .................................................... 37
Figure 2.1: Google Imagery of the Project Site ................................................ 42
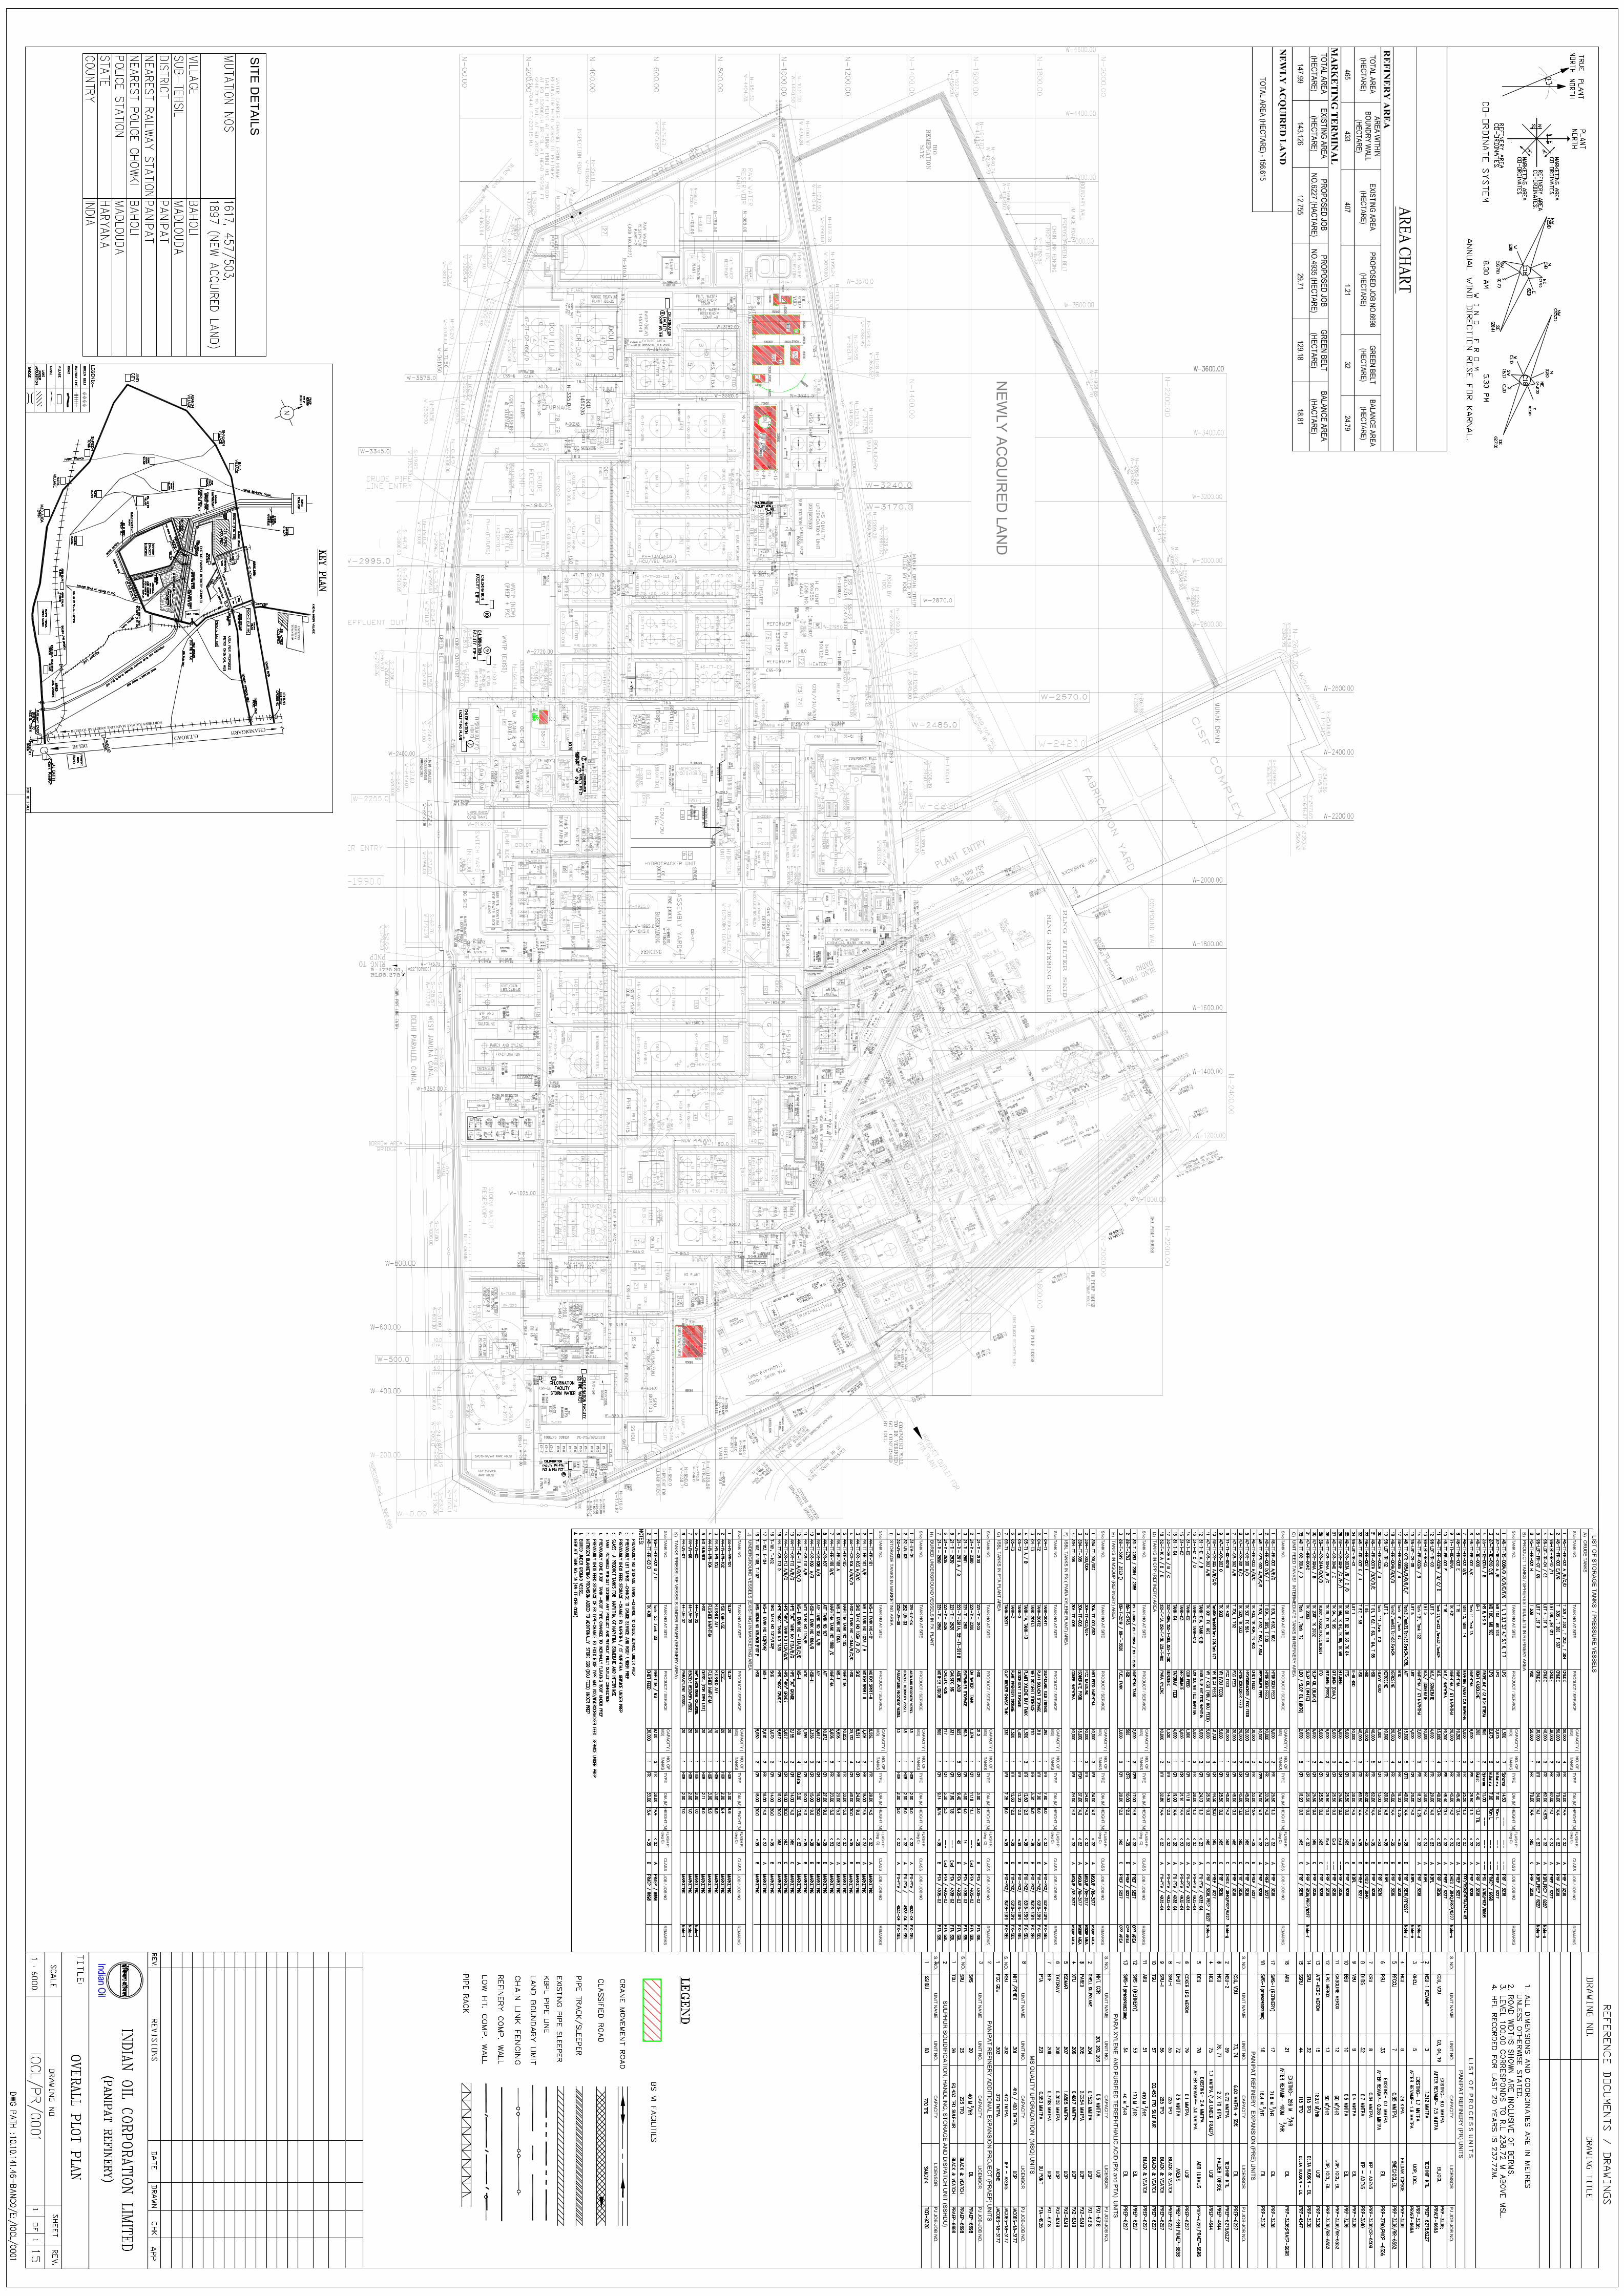
Figure 2.2:Plot Plan of Panipat Refinery ......................................................... 43
Figure 2.3: Water Balance ............................................................................. 57
Figure 3.1: Wind rose of the Project Site ........................................................ 64
Figure 3.2: Ambient Air Quality Monitoring Locations ................................... 67
Figure 3.3: Location of AAQ Station within Plant ........................................... 72
Figure 3.3: Groundwater and Surface water Monitoring Locations ................. 74
Figure 3.5 : Soil Quality Monitoring Locations ............................................... 87
Figure 3.6 : Site Connectivity ........................................................................ 94
Figure 6.1: HSE Organogram of Panipat Refinery ......................................... 124
Figure 9.1: Storm water Management inside the refinery ............................. 136
LIST OF ANNEXURES
Annexure - I: Approved Terms of Reference
Annexure - II: Process Scheme for all Units
Annexure – III: Effluent Treatment Plant
Annexure – IV: Risk Assessment Study
Annexure – V: Stack Emission Report
Annexure –VI: HSE Policy
Annexure – VII: Baseline data for Air, Noise, Water and Soil
EXECUTIVE SUMMARY
17 JUNE 2017
EXECUTIVE SUMMARY
Introduction
Panipat refinery, a unit of Indian Oil Corporation Limited (IOCL)
operates a 15.0 Million Metric Tons Per Annum (MMTPA) oil refinery at
Panipat in Haryana. The refinery was commissioned in 1997-98 and started
off with a crude oil processing capacity of 6.0 MMTPA (PR- Panipat Refinery).
The refinery capacity was raised to 12.0 MMTPA with the addition of another
crude unit and a full conversion hydrocracker as the secondary processing
unit and Delayed Coker unit for bottom processing (PREP- Panipat Refinery
Expansion Project). Through progressive revamps and addition of process
units the refining capacity has been brought to the present operating
capacity of 15.0 MMTPA (PRAEP- Panipat Refinery Additional Expansion
Project).
Now the company intends to go for BS VI Fuel up – gradation Capacity
Expansion of PX / PTA at Panipat Refinery which attracts Environmental
Clearance under EIA notification 2006. In this regard, M/s ABC Techno
Labs India Private Limited (ABC Techno Labs), NABET Accredited
Environmental Consultant Organization, has been engaged by M/s Indian
Oil Corporation Ltd. (IOCL) to carry out Environmental Impact Assessment
studies for the proposed project at Panipat Refinery
Project Description
The location of refinery for proposed BS – VI Quality Up-gradation and
Capacity Expansion of PX / PTA which is in existing premises of refinery.
The location of the project and Satellite image is provided in Figure 1 & 2
respectively.

EXECUTIVE SUMMARY
18 JUNE 2017
Figure 1: Location Map of Project Site

EXECUTIVE SUMMARY
19 JUNE 2017
Figure 2: Satellite Image of Project Site
Need for the Project
With the objective of meeting the guidelines established in Auto Fuel
Policy 2025 wherein it would be required to manufacture 100% BS-VI fuels,
for existing refinery – 15.0 MMTPA at Panipat refinery for conforming to the
mandate as described by 2020 as envisaged by Govt. of India. The BS-VI will
bring down the Nitrogen Oxide emissions from diesel cars by 68 % and 25%
from petrol engined cars. In order to meet the upgradation following are the
existing and proposed facilities
S. No Facilities Existing capacity
Proposed capacity Remarks
1. Diesel Hydro De –Sulphurisation(DHDS)
700 kTA 1000 kTA Revamp
2. Prime – G 370 kTA 445 kTA Revamp 3. Diesel Hydro – Treater
(DHDT) 2200 kTA New

EXECUTIVE SUMMARY
20 JUNE 2017
4. Hydrogen generationUnit
44 kTA of hydrogen
production
New
5. Tertiary Amyl MethylEther
36 kTA New
6. OCTAMAX 116 kTA New 7. Sulphur recovery Unit
(SRU) with Tail GasTreating Unit (TGTU)
225 T/Day Sulphur
production
New
8. Amine Regeneration Unit (ARU)
188.9 T/hr New
9. Sour water Stripper(SWS)
56.7 T/hr New
10. DHDT feed tank 20,000 KL New 11. Para Xylene Unit 363 kTA 460 kTA Revamp 12. Para Terephthalic Acid
Unit (PTA)553 kTA 700 kTA Revamp
Baseline Environmental Status
Air Environment
PM10, PM2.5, SO2, NOx, HC (Methane & Non Methane) CO, Benzene
and Benzo (a) pyrene were monitored at eight different locations during
December 2016 - February 2017 and the summary of the Baseline data of
AAQs are given below
Table 1. Summary of Baseline data of AAQs S. No Parameter Baseline value
(98th percentile) NAAQS
Standards 1. PM10 41.0 μg/m3 – 95.6μg/m3 100 μg/m3 2. PM2.5 31.1 μg /m3 – 57.6μg/m3 60μg/m3 3. SO2 18.0 μg/m3 – 32.5μg/m3 80 μg/m3 4. NOx 27.0 μg/m3 –43.0μg/m3 80 μg/m3 5. CO 1.0 mg/m3 – 2.0mg/m3 2 mg/m3 6. Ammonia <5.0 μg/m3– 82.6 μg/m3 400 μg/m3 7. Ozone <5.0 μg/m3– 33.6 μg/m3 80 μg/m3 8. HC – Methane < 0.1 - 3.1 ppm - 9. HC – Non Methane < 0.1 – 4.25 ppm - 10. Benzene <0.1 μg/m3 – 3.6μg/m3 5 μg/m3

EXECUTIVE SUMMARY
21 JUNE 2017
11. Benzo (a) Pyrene <0.1 ng/m3 1 ng/m3 12. Arsenic <1.0 – 3.1 ng/m3
13. Nickel <1.0 – 1.1 ng/m3 14. Lead <0.1 – 0.19 μg/m3
The AAQ results were found within the prescribed limits of NAAQS.
Noise Environment
A total of eightlocations within an area of 10 km radius around the
project site havebeen selected for measurement of ambient noise levels,
covering residential & sensitiveareas during the study period.During the day
time, the equivalent noise levels were found to vary in the range of (44.6 -
64) dB (A) while in the night time, the equivalent noise levels were observed
to be varyingin the range of (27 - 64) dB (A).
Water Environment
Ground water
The ground water quality was monitored in seven stations the study
area.The collected water samples were analyzed for physical and chemical
parameters as parameters described in IS: 10500:2012 and it was noted
that, TDS of ground water is 257 to 487 mg/l and 32 to 65 mg/l of chloride
which meets the acceptable limit of 250 mg/l. The iron content in ground
water sample is 0.12 to 0.24 mg/l and found within the permissible limit of
0.3 mg/l in the absence of alternate source of potable water.The results of
ground water were compared to Indian Standard Specification of drinking
water IS: 10500:2012 and were found within the permissible limits.
Surface Water
There is no river running around the proposed site. A good number of
manmade canals and drains exist within the impact zone, namely Western
Yamuna Canal, Main Drain No. 2, Munak Drain, Gagsina East Drain, Nahar
Kuna Hansi Drain, Phurla Drain, Gandha Nala, Gahana Feeder, Untala
Drain, Khandra Drain, Thirana Drain etc. To assess the quality of surface
6 ng/m3 20 ng/m3 0.5 μg/m3

EXECUTIVE SUMMARY
22 JUNE 2017
water, 3 stations are selected and monitored. The Quality was assessed and
found within the limits.
Soil Environment
The physico-chemical properties, nutrient content and infiltration
characteristics of soils within the study area have been analyzed at five
different locations during the study to establish the soil characteristics.
1. The texture of the soil is mostly Silty Sand.
2. The bulk density of the soil is varied from 1.19 to 1.29 g/cc.
3. The pH of the soils is varied from 7.9 to 9.58 shows alkaline in nature.
4. The electrical conductivity levels are average and not harmful to
germination.
Biological Environment
The area falling under the 10 km radial distance is surrounded by
both aquatic and terrestrial ecosystems.A total of 106 species of plants
(including wild, ornamental and cultivated plants), 25species of plants used
in social forestry, 20 species of medicinal plants were documented and
identified in the 10 km radial distance from the proposed project sites of the
studyarea.
A total of 48 species of birds, 2 species of amphibians, 4 species of reptiles,
8 mammals,15 fish species and no major wild life were observed and
recorded during the presentsurvey in the 10 km radial distance from the
proposed project site except Indian Peacock(Schedule I).Greenbelt
development under proposed SRU & ERU project shall be followed as per
theplan schedule mentioned in Environmental Management Plan. The
expenditure proposedfor green belt development is considered in EMP.
Socio-Economic Environment
The study area is moderately populated with the total population of 1,
49,040 (as per 2011Census). Scheduled Caste (SC) population is about 26%
of the total population. As per2011 Census, Scheduled Tribe (ST) population

EXECUTIVE SUMMARY
23 JUNE 2017
is not found in the study area. The overall literacy rate is about 65%. Male
literacy rate is 75% and female literacy rate is 56%. The primary sources of
drinking water are tube wells and water supply facilities.
Impact and Mitigation Measures
Air Quality
Construction Phase
• During the expansion, revamp phase, Activities like cleaning, levelling,
grading, construction, metal cutting, and erection of equipments like
Columns, Vessel Pumps will be carried out.
• A certain amount of particulate matter will be generated by truck
movements during the construction phase. However, the suspended
particulate matter in ambient air as a result of construction activities
may be relatively coarse and will be settled within a short distance.
Therefore, the impact will be restricted within the close vicinity of the
construction activity for short period of time.
Operation Phase
There will be no additional release of emissions due to combustion
sources due to proposed project. Presently in compliance to petrochemical
environmental standards, Leak detection survey is carried out monthly at all
the unit areas, offsites within the complex. It is to be noted that no fugitive
emissions are detected so far. Additional storage tanks will be operated
under same conditions/practices. It is envisaged that all leaks will be
identified through LDAR programme which is as per the existing practice.
Mitigation Measures
• Developing green belt in the proposed new premises.
• Ensuring preventive maintenance of equipment
• Regular monitoring of air polluting concentrations.
• Provision of Low NOx burners is envisaged in all furnaces.
EXECUTIVE SUMMARY
24 JUNE 2017
Noise
Construction Phase
During construction phase, metal cutting, and erection of equipment’s like
Columns, Vessel Pumps, cold cutting, hammering, vehicle movement,
Rotary etc can generate noise. Relatively high noise levels will be generated
during construction phase.
Operation Phase
Noise generation is expected from piling process and rotating machinery,
and other equipment. The other sources are pumps, compressor and
turbines.
Mitigation Measures
• Equipment specification and installation of acoustic enclosure which
ensure low level of noise generation.
• All the Diesel Tankers and trucks are essentially fitted with silencers
to control noise generation.
• Planting trees and developing and maintaining green belt area which
works as noise barrier.
• Quarterly Noise surveys are conducted and abnormalities are
resolved.
Therefore, impact on noise levels of the study area due operations at the
plant will be insignificant.
Water Quality
Construction Phase
During the construction phase the demand of drinking water and
construction water will be met from existing source. Adequate drinking
water, hygiene and sanitation facilities will be provided to the workers. The
construction phase may result in minor soil erosion from the plant site, as it
will clear of ground flora during plant erection. The run off from the
EXECUTIVE SUMMARY
25 JUNE 2017
construction site during rainfall may cause some increase in the quantity of
suspended solids and turbidity in the runoff in natural drain. However, this
impact will be of temporary nature and may not last as soon as excavated
soil established and construction debris is disposed off properly.
Mitigation measures
• Excavation for foundations of structures/vessels will be carried out
during dry season.
• Construction debris will be collected and disposed properly daily
basis.
• Sanitary facilities for workers will be provided.
Operation Phase
As part of additional facility additional effluent mostly from Sour water
stripper (approx 5 m3/hr, intermittent) will be generated. It is considered
that existing ETP will be adequate to handle this additional amount.
Additional Cooling Tower blow down (15 m3/hr), Boiler blow down (1 m3 / hr
from SRU), OWS and CRWS will also be accommodated in existing ETP
system. Thus the impact on water environment is insignificant
Ecology Construction Phase
The proposed facilities are to be developed within the available area of
the existing refinery complex. This area is a graded land without any thick
vegetation. The project site does not harbor any fauna of importance.
Therefore, the impact of construction activities on fauna will be
insignificant.
Operation Phase
During operation phase, no impact on green belt of the plant premises
and ecology of the study area is anticipated. Growth of plantation and
development of green belt at the plant is likely to improve the flora and
fauna at the site.
EXECUTIVE SUMMARY
26 JUNE 2017
Mitigation Measures
• Closing of trenches as soon as possible of construction.
• Prevent littering of work sites with wastes, especially plastic and
hazardous waste.
• Training of drivers to maintain speed limits.
Land Use The expansion, revamping of the units in Panipat refinery will have no
impact on land use in the study area, as land for construction of proposed
plant is already available within the existing refinery premises. The project
will be put up in the existing land area of 102.5 Ha (253 Acre) and no new
land is required.
Socio Economic
The construction and operation of the plant will have some beneficial
impact due to increase in incomes as local unskilled, semiskilled and skilled
persons as they will gain some direct and indirect employment. Since the
immigration of work force during construction and operation of the proposed
expansion, revamping and implementation of new technologies at the plant
will be likely to be very small, the impact on facilities and cultural aspects
are expected to be insignificant.

EXECUTIVE SUMMARY
27 JUNE 2017
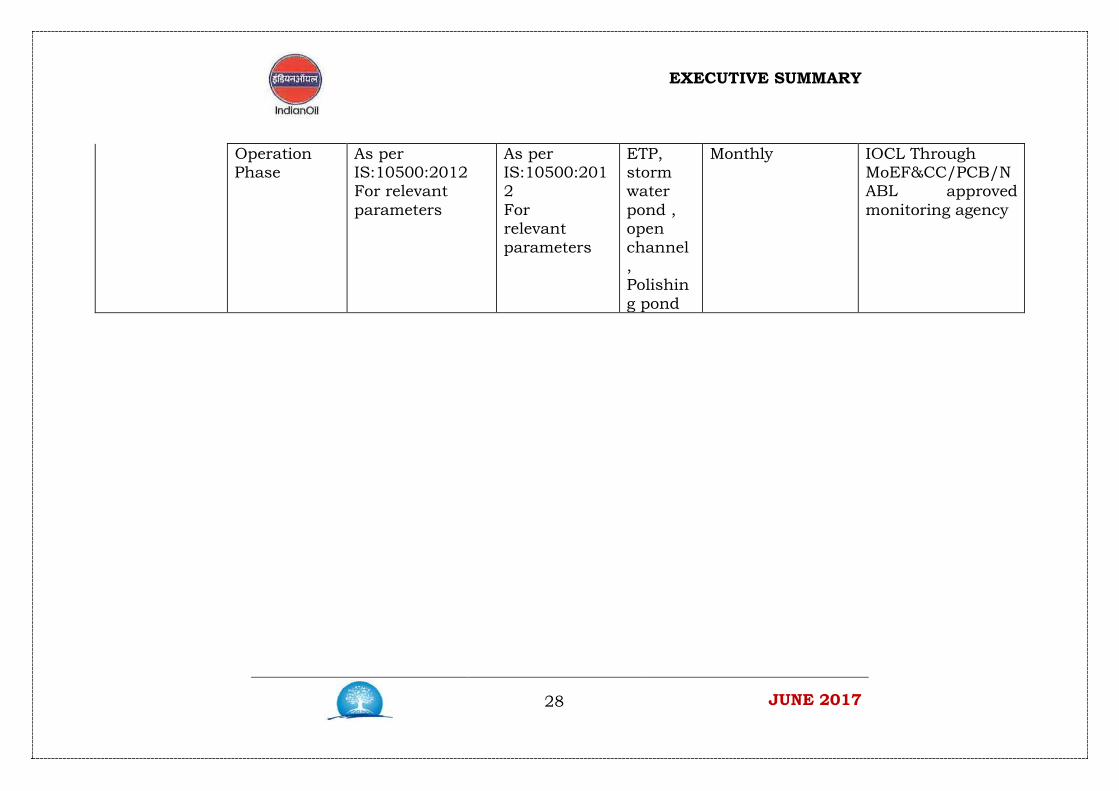
Environmental Monitoring Programme
Environmental Component
Project stage
Parameter Standards Location Duration/Frequency
Implementation
Ambient Air Construction Phase
PM2.5,PM10SO2, NO2,CO
National Ambient Quality Standard
At the plant site
Continuous Through online analyzers
Ambient air monitoring mobile van & AAQ monitoring stations
Operation Phase
HC and VOC
National Ambient Quality
Standard
All plant area
Quarterly IOCL Through MoEF&CC/ NABL approved monitoring agency
PM2.5,PM10SO2, NO2,CO & HC on Boundary
National Ambient Quality Standards
Ambient air quality monitoring stations in complex
1.Continuous through online analyzers 2.Through ambient air monitoring equipment
IOCL Through MoEF&CC/PCB/NABL approved monitoring agency
Water Quality Construction Phase
As per IS:10500:2012 For relevant parameters
As per Water Quality standards (IS10500:2012)
At the site, Near expansion revamping units
Monthly IOCL Through MoEF&CC/PCB/NABL approved monitoring agency
EXECUTIVE SUMMARY
28 JUNE 2017
Operation Phase
As per IS:10500:2012 For relevant parameters
As per IS:10500:2012 For relevant parameters
ETP, storm water pond , open channel , Polishing pond
Monthly IOCL Through MoEF&CC/PCB/NABL approved monitoring agency
EXECUTIVE SUMMARY
29 JUNE 2017
Project Benefits
India has been witnessing rapid urban and industrial growth in the
past two decades, and with the country’s current liberalization policy, this
growth is expected to accelerate further. The proposed project will result in
the supply of increased volumes of environmental friendly petroleum
products to meet the energy security of northern, western and southern
region of the country. The revamp project is being implemented for
improvement of revenue and emissions of the refinery. The project will help
to manufacture High Speed Diesel conforming to manufacturing
specifications of BS- VI. This project, besides general economic desirability,
would result in substantial socioeconomic benefit to the country in general
and more specifically to the region. Setting-up of this project will be a boon
to this region and is bound to improve living conditions and thereby result
in further reduction of population below poverty line, which is one of the
prime policy objectives of the Government.
Environmental Management Plan
During operational phase, the area of concern will be stack emissions,
liquid effluent and intermittent disposal of spent catalyst (solid waste) from
the proposed plant. During operation there will be stack emissions from the
new units of the plant after expansion. The Environmental Management
Plan (EMP) for the proposed projects has to ensure that the residual
environmental impacts are minimized by adopting best possible
economically viable techniques.
A comprehensive plan has been worked out keeping in view these
requirements. The plan encompasses the mitigation in three stages i.e.
design, construction and operation of the plant. The Health Safety and
Environmental Management at PR is carried out by Deputy General
Manager (HSE). The DGM (HSE) reports to GM (TS & HSE). The DGM is
assisted by Chief Manager and officers etc.
EXECUTIVE SUMMARY
30 JUNE 2017
Conclusion
Based on the environmental assessment, all possible environment
aspects have been adequately assessed and necessary control measures
have been formulated to meet with statutory requirements, in the
preparation of the EIA-EMP. In view of the Auto-Fuel Policy Vision 2025, the
Refineries will be required to supply fuels meeting the BS-IV specification
fuels by 1st April 2017 and BS-V/VI specification by 1st April, 2019. The
BS-VI will bring down the Nitrogen Oxide emissions from diesel cars by 68 %
and by 25% from petrol engine cars. BS VI grade will have reduced sulphur
content up to 10 PPM. This will reduce environment pollution substantially.
Cancer causing particulate matter emissions from diesel engine cars will
also come down by a phenomenal 80 %.Considering that the proposed
project of Panipat Refinery will contribute in reducing the pollution and help
in environment protection for the cause of society, an Environmental
Clearance may be accorded for the proposed project.
INTRODUCTION
31 JUNE 2017
1.0 INTRODUCTION
1.1 Background
Indian Oil Corporation Ltd. (IOCL) is India's largest public corporation in
terms of revenue and is one of the five Maharatna status companies of India,
apart from Coal India Limited, NTPC Limited, Oil and Natural Gas
Corporation and Steel Authority of India Limited. It is the highest ranked
Indian company and the world's 83rd largest public corporation in the
prestigious Fortune 'Global 500' listing. It is also the 20th largest petroleum
company in the world. Beginning in 1959 as Indian Oil Company Ltd.,
Indian Oil Corporation Ltd. Was formed in 1964 with the merger of Indian
Refineries Ltd. (Estd. 1958). Indian Oil and its subsidiaries account for 49%
petroleum products market share, 31% share in refining capacity and 67%
downstream sector pipelines capacity in India.
Panipat refinery, a unit of Indian Oil Corporation Limited (IOCL)
operates a 15.0 Million Metric Tons Per Annum (MMTPA) oil refinery at
Panipat in Haryana. The refinery was commissioned in 1997-98 and started
off with a crude oil processing capacity of 6.0 MMTPA (PR- Panipat Refinery).
The refinery capacity was raised to 12.0 MMTPA with the addition of another
crude unit and a full conversion hydrocracker as the secondary processing
unit and Delayed Coker unit for bottom processing (PREP- Panipat Refinery
Expansion Project). Through progressive revamps and addition of process
units the refining capacity has been brought to the present operating
capacity of 15.0 MMTPA (PRAEP- Panipat Refinery Additional Expansion
Project).
Now the company intends to go for BS VI Fuel up – gradation Capacity
Expansion of PX / PTA at Panipat Refinery which attracts Environmental
Clearance under EIA notification 2006. In this regard, M/s ABC Techno
Labs India Private Limited (ABC Techno Labs), NABET Accredited
Environmental Consultant Organization, has been engaged by M/s Indian
INTRODUCTION
32 JUNE 2017
Oil Corporation Ltd. (IOCL) to carry out Environmental Impact Assessment
studies for the proposed project at Panipat Refinery.
1.2 Need for the Project
With the objective of meeting the guidelines established in Auto Fuel
Policy 2025 wherein it would be required to manufacture 100% BS-VI fuels,
for existing refinery – 15.0 MMTPA at Panipat refinery for conforming to the
mandate as described by 2020 as envisaged by Govt. of India. The BS-VI will
bring down the Nitrogen Oxide emissions from diesel cars by 68 % and 25%
from petrol engined cars. Cancer causing particulate matter emissions from
diesel engine cars will also come down by a phenomenal 80%. Following are
the existing and proposed facilities
S. No Facilities Existing capacity
Proposed capacity Remarks
1. Diesel Hydro De –Sulphurisation(DHDS)
700 kTA 1000 kTA Revamp
2. Prime – G 370 kTA 445 kTA Revamp 3. Diesel Hydro – Treater
(DHDT) 2200 kTA New
4. Hydrogen generation Unit
44 kTA of hydrogen
production
New
5. Tertiary Amyl Methyl Ether
36 kTA New
6. OCTAMAX 116 kTA New 7. Sulphur recovery Unit
(SRU) with Tail Gas Treating Unit (TGTU)
225 T/Day Sulphur
production
New
8. Amine Regeneration Unit (ARU)
188.9 T/hr New
9. Sour water Stripper (SWS)
56.7 T/hr New
10. DHDT feed tank 20,000 KL New 11. Para Xylene Unit 363 kTA 460 kTA Revamp 12. Para Terephthalic Acid
Unit (PTA) 553 kTA 700 kTA Revamp
INTRODUCTION
33 JUNE 2017
1.3 Need for EIA
As per EIA Notification S.O. No 1533 issued on 14th September, 2006
and its subsequent amendments, the proposed BS – VI Quality Up-
gradation, Capacity Expansion of PX / PTA at Panipat Refinery falls under
Schedule 4(a) – Petroleum Refining Industry. Hence, this project requires
Environmental Clearance from Ministry of Environment & Forest (MoEF)
through Expert Appraisal Committee (EAC), accordingly, the EIA Report has
been prepared based on the Terms of Reference approved during 13th
Meeting of Expert Appraisal Committee held on 26th& 27thSeptember, 2016
for the proposed project at Panipat refinery.
1.4 Terms of Reference
During 13thExpert Appraisal Committee (EAC) meeting held on 26th&
27th September, 2016,the project was considered and after detailed
discussions the Committee prescribed the following additional points which
need to be added in model ToR applicable for category4(a). The EIA report
has been prepared as per TOR approved by SEAC. The compliance of TOR is
given in the beginning of EIA Report.
• Public hearing exempted as para 7 (ii) of EIA, Notification 2006.
• A separate chapter on status of compliance of Environmental
Conditions granted by State/Centre to be provided. As per circular
dated 30th May, 2012 issued by MoEF, a certified report by RO, MoEF
on status of compliance of conditions on existing unit to be provided
in EIA-EMP report
1.5 Approach and Methodology
The primary objective of the EIA study is to internalize and integrate the
environmental concerns /aspects and mitigation measures due to proposed
BS – VI Quality Up-gradation, Capacity Expansion of PX / PTA at Panipat
INTRODUCTION
34 JUNE 2017
Refinery. The EIA study for has been carried out with the following
objectives:
• Collection of baseline attributes in study area. The EIA covers baseline
environmental data, as per the guidelines of MoEF & CC. The scope
includes collection of baseline data to identify the various
environmental parameters such as air, water, soil, noise levels, socio -
economic factors, land use factors, the status of the flora- fauna and
wildlife in the adjoining areas of the proposed project site.
• Identification, prediction, evaluation & mitigation of biophysical, social
& other relevant effects of development on the environment during the
operational phase of the proposed project using mathematical /
simulation models as per applicable Indian law.
• Preparation of risk assessment & emergency preparedness / disaster
management plan for the project.
• Preparation of Environmental Management Plan (EMP) to be adopted
for mitigation of the anticipated adverse impacts of the proposed
expansion at plant during operational phase.
• Delineation of the post project environmental quality monitoring
program as per the requirements of the regulatory authorities.
To carry out EIA study for the proposed expansion, reconnaissance
survey was conducted by field team of ABC Techno Labs India Pvt. Ltd. and
sampling locations for various environmental parameters were identified on
the basis of:
• Predominant wind direction expected during the period of baseline
monitoring in the study area
• Topography, Location of village/towns/sensitive areas Identified
pollution pockets, if any within the study area Areas, which represent
baseline conditions; Collection, collation and analysis of baseline data
for various environmental attributes.

INTRODUCTION
35 JUNE 2017
The field studies and primary data collection have been conducted during
December 2016 to February 2017 to determine existing conditions of
various environmental attributes. The proposed project could have impact
on the physical, chemical and biological attributes of surrounding
environment. In assessing the environmental impacts, collection, collation
and interpretation of baseline data is of prime importance. Environmental
impact analysis and assessment is preferably carried out at the planning
stage itself.
1.6 Location of the site
The location of refinery for proposed BS – VI Quality Up-gradation and
Capacity Expansion of PX / PTA which is in existing premises of refinery on
Google satellite image and surrounding area is shown in Figure 1.1. The
IOCL refinery is located at Panipat District, Haryana, India. The latitude -
longitude of the refinery are as follows:
Latitude: 29°28'30.46"N
Longitude: 76°52'28.69"E
INTRODUCTION
36 JUNE 2017
Figure 1. 1: Location Map of Project Site
INTRODUCTION
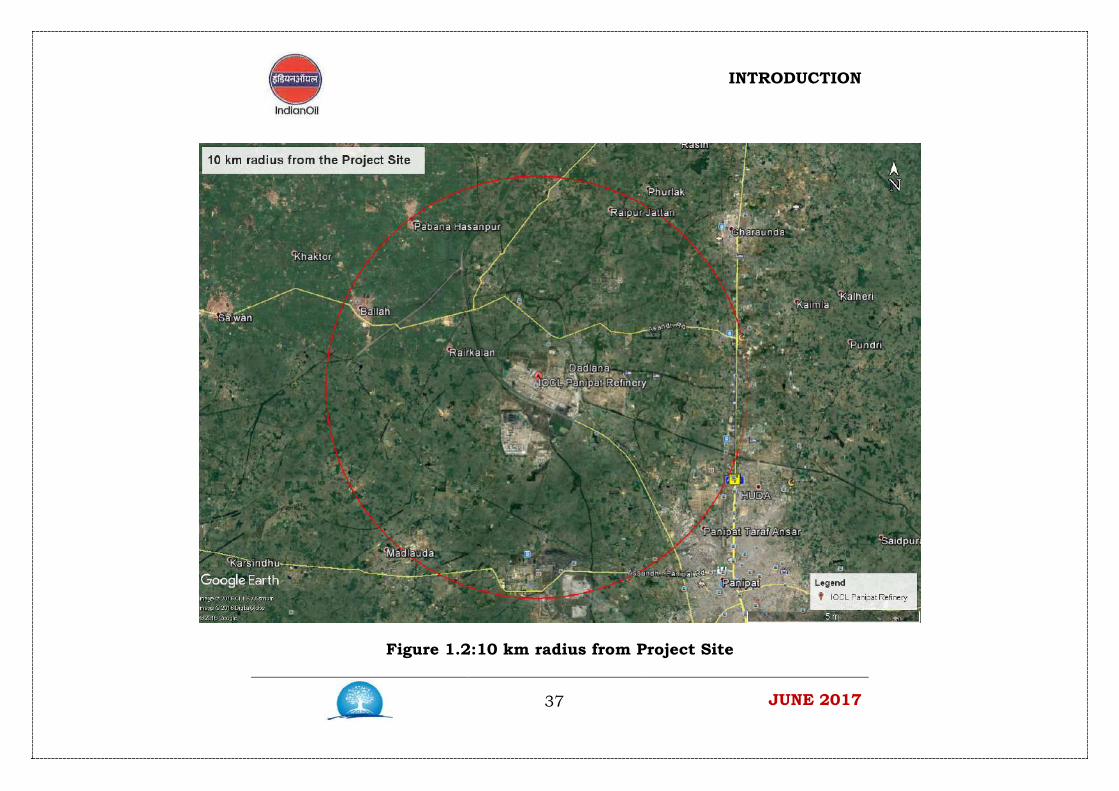
37 JUNE 2017
Figure 1.2:10 km radius from Project Site

INTRODUCTION
38 JUNE 2017
1.7 Structure of EIA Report
The EIA Report for proposed BS – VI Quality Up-gradation and
Capacity Expansion of PX / PTA at Panipat, Haryana has been prepared as
per TOR approved during 13thExpert Appraisal Committee (EAC) meeting
held on 26th& 27th September, 2016. The EIA report has been presented in
order to group the environmental parameters under physical, biological,
demographic & socio-economic environments, anticipated impacts and
mitigation measures. The EIA report has been prepared as contents given in
EIA Notification 2006 and subsequent amendments. The structure of EIA
Report is as given below:
Compliance of TOR
Executive Summary
Chapter 1: Introduction
This chapter provides background information, brief location settings
of the area. The terms of reference for preparation of EIA/ EMP and
structure of EIA report have also been described in this chapter.
Chapter 2: Description of the Project
This chapter deals project details, project layout, design details,
operating parameters, power requirements, water requirement and sources
of pollution and it management, cost of proposed expansion, etc.
Chapter 3: Description of the Environment
This chapter presents existing environmental status of the 10 km
radius study area around the proposed project including topography,
geological, drainage pattern, water environment, climate & meteorology,
ambient air quality, noise levels, flora & fauna, socioeconomic, etc.
Chapter 4: Anticipated Environmental Impacts & Mitigation Measures
This chapter describes the anticipated impact on the environment and
mitigation measures for proposed project. Assessment of anticipated

INTRODUCTION
39 JUNE 2017
Environmental Impacts. It gives the details of the impact on the baseline
parameters, both during the construction and operational phases and
suggests the mitigation measures to be implemented.
Chapter 5: Analysis of Alternatives
This chapter examines alternative means for the proposed project
Chapter 6: Environmental Monitoring Plan
This chapter describes Environmental Monitoring Plan for the
proposed project during construction and operation phases.
Chapter 7: Additional Studies
This chapter spelled out hazard identification, risk analysis and
disaster management plan for an unlikely event of emergency at refinery.
Chapter 8: Project Benefits
This chapter includes the benefits in terms of improvement in physical
infrastructure, social infrastructure, employment potential, etc.
Chapter 9: Environmental Management Plan (EMP)
This chapter describes environmental management plan to mitigate
adverse environmental impacts and to strengthen beneficial impacts.
Chapter 10: Disclosure of Consultant engaged
This chapter comprises the name of consultants engaged with their
brief resume and nature of consultancy rendered.
PROJECT DESCRIPTION
40 JUNE 2017
2.0 PROJECT DESCRIPTION
2.1 Introduction
Panipat refinery, a unit of Indian Oil Corporation Limited (IOCL)
operates a 15.0 Million Metric Tons Per Annum (MMTPA) oil refinery at
Panipat in Haryana. The refinery was commissioned in 1997-98 and started
off with a crude oil processing capacity of 6.0 MMTPA (PR- Panipat Refinery).
The refinery capacity was raised to 12.0 MMTPA with the addition of another
crude unit and a full conversion hydrocracker as the secondary processing
unit and Delayed Coker unit for bottom processing (PREP- Panipat Refinery
Expansion Project). Through progressive revamps and addition of process
units the refining capacity has been brought to the present operating
capacity of 15.0 MMTPA (PRAEP- Panipat Refinery Additional Expansion
Project). IOCL Panipat is also integrated with Naphtha Cracker and Aromatic
Complex.
As per the declaration of Government of India dated 6th Jan’16, it has
been proposed to implement BS-VI grade fuel in the entire country w.e.f. 1st
April 2020 i.e. switching over directly from BS-IV grade fuels to BS-VI grade
fuel. Thus it is imperative that the refinery upgradation should consider the
production of BS-VI grade fuels by inducting suitable new units and revamp
of exiting units.
2.2 Need of Project
In view of the Auto-Fuel Policy Vision 2025, the Refineries will be
required to supply fuels meeting the BS-IV specification fuels by 1st April
2017 and BS-VI specification by 1st April, 2020. Following are the existing
and new proposed facilities at the refinery for the BS VI fuel upgradation,
Capacity expansion of PX/PTA.

PROJECT DESCRIPTION
41 JUNE 2017
Table 2. 1: Proposed and Existing facilities
S. No Facilities Existing capacity
Proposed capacity
Remarks
1. Diesel Hydro De-Sulphurisation (DHDS)
700 kTA 1000 kTA Revamp
2. Prime – G 370 kTA 445 kTA Revamp 3. Diesel Hydro –
Treater (DHDT) 2200 kTA New
4. Hydrogen generation Unit
44 kTA of hydrogen
production
New
5. Tertiary Amyl Methyl Ether
36 kTA New
6. OCTAMAX 116 kTA New 7. Sulphur recovery
Unit (SRU) with Tail Gas Treating Unit (TGTU)
225 T/Day Sulphur
production
New
8. Amine Regeneration Unit (ARU)
188.9 T/hr New
9. Sour water Stripper (SWS)
56.7 T/hr New
10. DHDT feed tank 20,000 KL New 11. Para Xylene Unit 363 kTA 460 kTA Revamp 12. Para Terephthalic
Acid Unit (PTA) 553 kTA 700 kTA Revamp
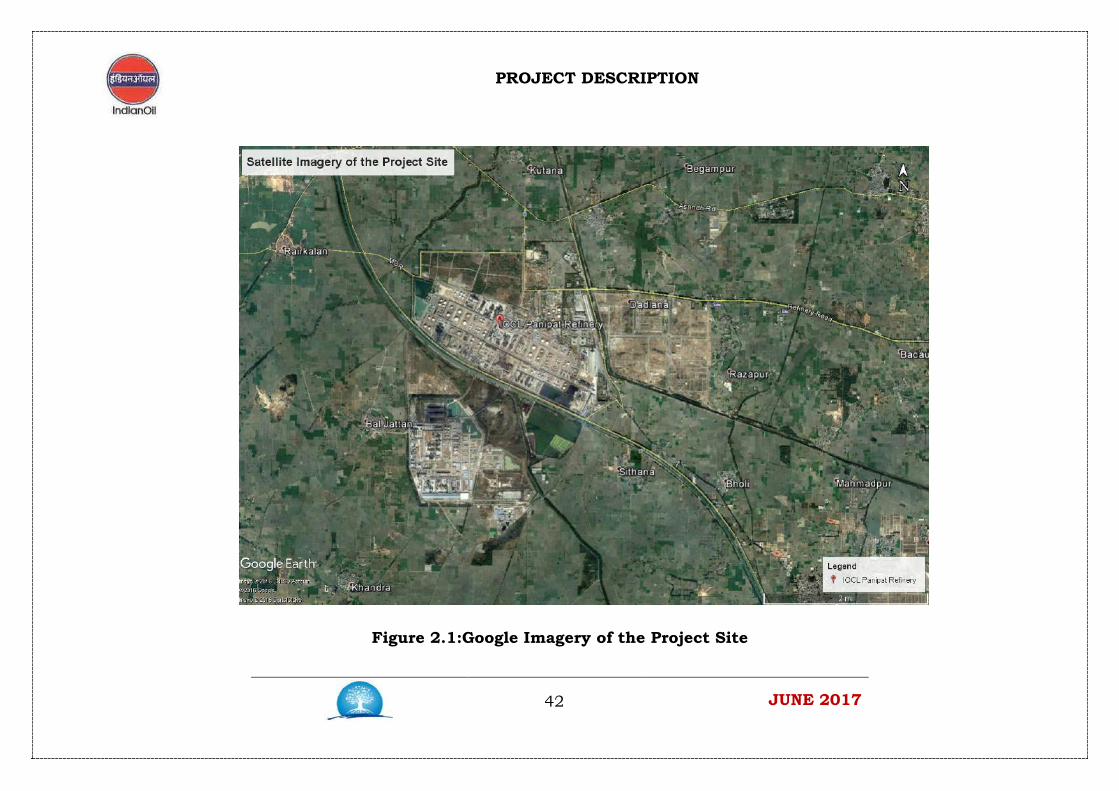
2.3 Project Location
The location of the project on Google satellite image and surrounding
area is shown in Figure 2.1. IOCL Panipat Refinery is located at Panipat
District in Haryana, India.
PROJECT DESCRIPTION
42 JUNE 2017
Figure 2.1:Google Imagery of the Project Site

PROJECT DESCRIPTION
44 JUNE 2017
2.4 Raw material Source, Requirement and its mode of Transportation
Crude oil of 145 grades from different regions of the world are
included in crude basket of Panipat Refinery. Low sulphur crude is sourced
from mostly West Africa and high sulphur from Middle East. High Sulphur
& low sulphur crude is typically 80:20. Refinery capacity remains unaltered
hence present mode of transportation for raw materials remained
unchanged. The crude oil is transported by means of Pipeline and products
by trucks, rake and pipelines.
2.5 Process Details
2.5.1 Diesel Hydro – Treater (DHDT) – 2200 kTA
A blend of straight run and cracked distillate materials are filtered in
a feed filter and fed to a surge drum. From this drum, the feed is pumped
under flow control and is mixed with makeup/recycle hydrogen streams.
The combined feed is then preheated in areactor feed/effluent exchanger
and then brought up to the required reaction temperature in a charge
heater. The heated feed is first routed to the HDS reactor that operates down
flow, and includes three beds in order to limit the temperature increase
inside the reactor. Cold quenches are injected at inter bed sections. The
HDS reactor effluent is quenched and sent to the HDT reactor that operates
in down flow and has two beds.
The HDT reactor effluent is used to exchange heat first with the
stripper feed in the stripper feed preheater and then with the reactor feed in
the reactor feed/effluent exchanger. Final cooling is achieved first in reactor
effluent air condenser and then in trim condenser. To avoid ammonium salt
deposits and the risk of corrosion, wash water is injected at the inlet of
reactor effluent air cooler. The wash water is a mixture of recycled water
from cold HP separator and stripped water from SWS. Trim cooler effluent is
collected in the cold HP separator, which is a V-L-L separator. The sour
water is partly recycled back as wash water, the hydrocarbon liquid is sent
PROJECT DESCRIPTION
45 JUNE 2017
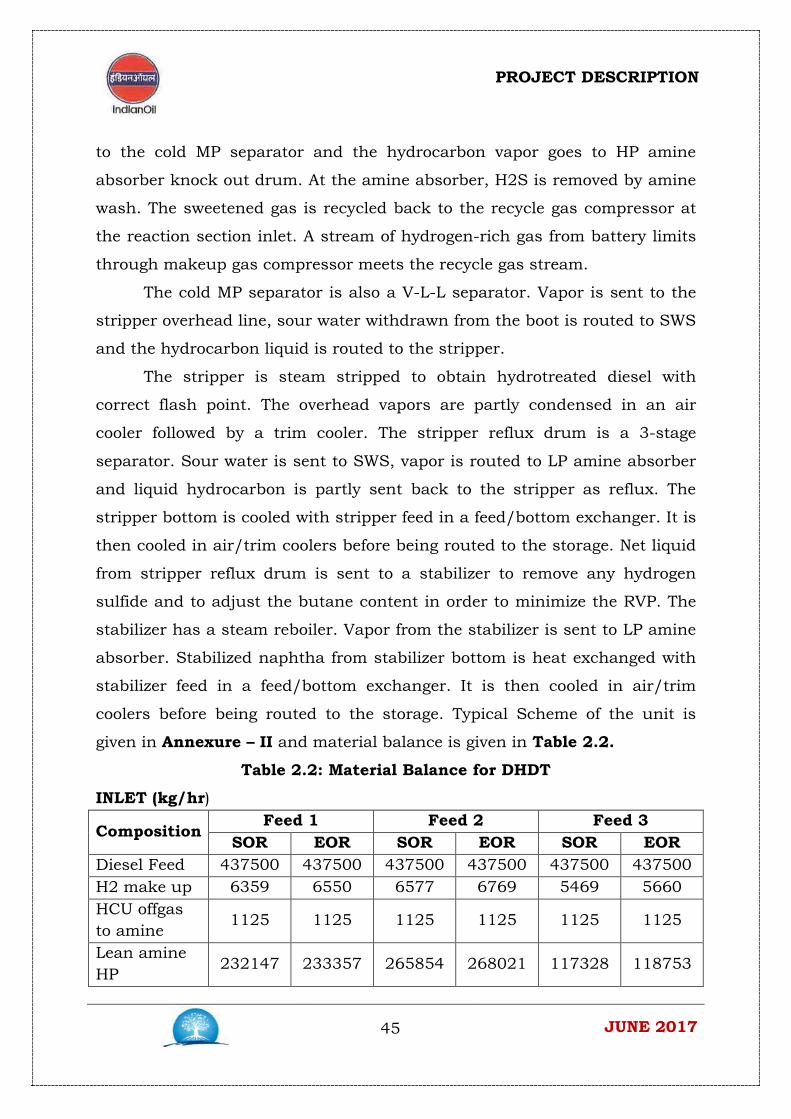
to the cold MP separator and the hydrocarbon vapor goes to HP amine
absorber knock out drum. At the amine absorber, H2S is removed by amine
wash. The sweetened gas is recycled back to the recycle gas compressor at
the reaction section inlet. A stream of hydrogen-rich gas from battery limits
through makeup gas compressor meets the recycle gas stream.
The cold MP separator is also a V-L-L separator. Vapor is sent to the
stripper overhead line, sour water withdrawn from the boot is routed to SWS
and the hydrocarbon liquid is routed to the stripper.
The stripper is steam stripped to obtain hydrotreated diesel with
correct flash point. The overhead vapors are partly condensed in an air
cooler followed by a trim cooler. The stripper reflux drum is a 3-stage
separator. Sour water is sent to SWS, vapor is routed to LP amine absorber
and liquid hydrocarbon is partly sent back to the stripper as reflux. The
stripper bottom is cooled with stripper feed in a feed/bottom exchanger. It is
then cooled in air/trim coolers before being routed to the storage. Net liquid
from stripper reflux drum is sent to a stabilizer to remove any hydrogen
sulfide and to adjust the butane content in order to minimize the RVP. The
stabilizer has a steam reboiler. Vapor from the stabilizer is sent to LP amine
absorber. Stabilized naphtha from stabilizer bottom is heat exchanged with
stabilizer feed in a feed/bottom exchanger. It is then cooled in air/trim
coolers before being routed to the storage. Typical Scheme of the unit is
given in Annexure – II and material balance is given in Table 2.2.
Table 2.2: Material Balance for DHDT
INLET (kg/hr)
Composition Feed 1 Feed 2 Feed 3
SOR EOR SOR EOR SOR EOR Diesel Feed 437500 437500 437500 437500 437500 437500 H2 make up 6359 6550 6577 6769 5469 5660 HCU offgas to amine
1125 1125 1125 1125 1125 1125
Lean amine HP
232147 233357 265854 268021 117328 118753

PROJECT DESCRIPTION
46 JUNE 2017
Str steam + wash water
11454 12428 15599 15562 12404 12454
Lean amine LP
55301 54187 59471 57286 40221 38752
Total 743886 745147 786126 786263 614047 614244
OUTLET (kg/hr) Composition Feed 1 Feed 2 Feed 3
SOR EOR SOR EOR SOR EOR Desulphurised Diesel
424597 418408 423604 417315 426973 420585
High pressure off-gas
0 0 0 0 0 0
Stabilized naphtha
8290 11204 8437 11456 8324 11449
Sweet off-gas 4688 8143 4698 8150 4456 7998 Sour water 12132 13138 16415 16416 13131 13131 Rich Amine 294179 294254 332972 332926 161163 161081 Total 743886 745147 786126 786263 614047 614244
2.5.2 Hydrogen Generation Unit (HGU) – 44 kTA of Hydrogen Production
The Hydrogen Generation Unit design is based on catalytic reforming
and pressure swing adsorption (PSA) system to produce 99.9 mole% pure
hydrogen gas. Hydrogen is produced by steam reforming of Regassified
Liquid Natural Gas (RLNG). In the HGU unit, RLNG after mixing with
recycled hydrogen and superheated steam enters the reformer furnace.
Superheated steam is again added at the outlet of pre-reformer to adjust the
steam-carbon ratio, and the mixture is heated. The superheated feed steam
mixture is distributed through multi-tubular reactor consisting of high alloy
reformer tubes containing nickel based catalyst. To carry out the reactions
producing CO, CO2 and H2, heat is supplied by a number of burners
burning PSA purge gas and RLNG. The reformed gas after being cooled
undergoes shift conversion in shift converters. These are cylindrical fixed

PROJECT DESCRIPTION
47 JUNE 2017
bed reactors containing iron/chromium oxide or copper/zinc oxide catalyst.
Shift conversion reaction converts most of CO into CO2 and H2 in presence
of the catalyst. The heat removed from the converted process gas is used to
vaporize and further heat the feed, and preheat boiler feed water and
demineralized water (make-up).
Hydrogen is purified to remove inert gas impurities like CO2, CO, CH4,
N2 and water vapor by high-pressure adsorption of these impurities on
molecular sieves, active carbon and alumina gel in Pressure Swing
Adsorption (PSA) system. All adsorbed gases are removed during desorption
and regeneration of the beds, and used as reformer fuel. Desorption of
impurities is done at low pressure and purge gas is used as fuel.Typical
Scheme of the unit is given in Annexure– IIand the Hydrogen balance for
the refinery is given in Table 2.3
Table 2. 3: Hydrogen Balance for Refinery
KTPA
Capacity,
KTPA
wt%
H2Consumption
KTPA
Remarks
DHDS 550 1.01 6
DHDT 3500 1.5 53 OHCU
1900
2.52
48
53KTPA@2100KTPA Capacity
FCHCU
1700
3.05
52
58KTPA@1900KTPA Capacity
RFCCGASOLINESELECTIVEHDS
370
0.5
2
LNNHT 410 0.1 0
ISOM 400 0.7 3
HYNHT 640 0.12 1
NewDHDT 2200 1.5 33 TOTAL– Operating
197
TOTAL–With17 %margin
230
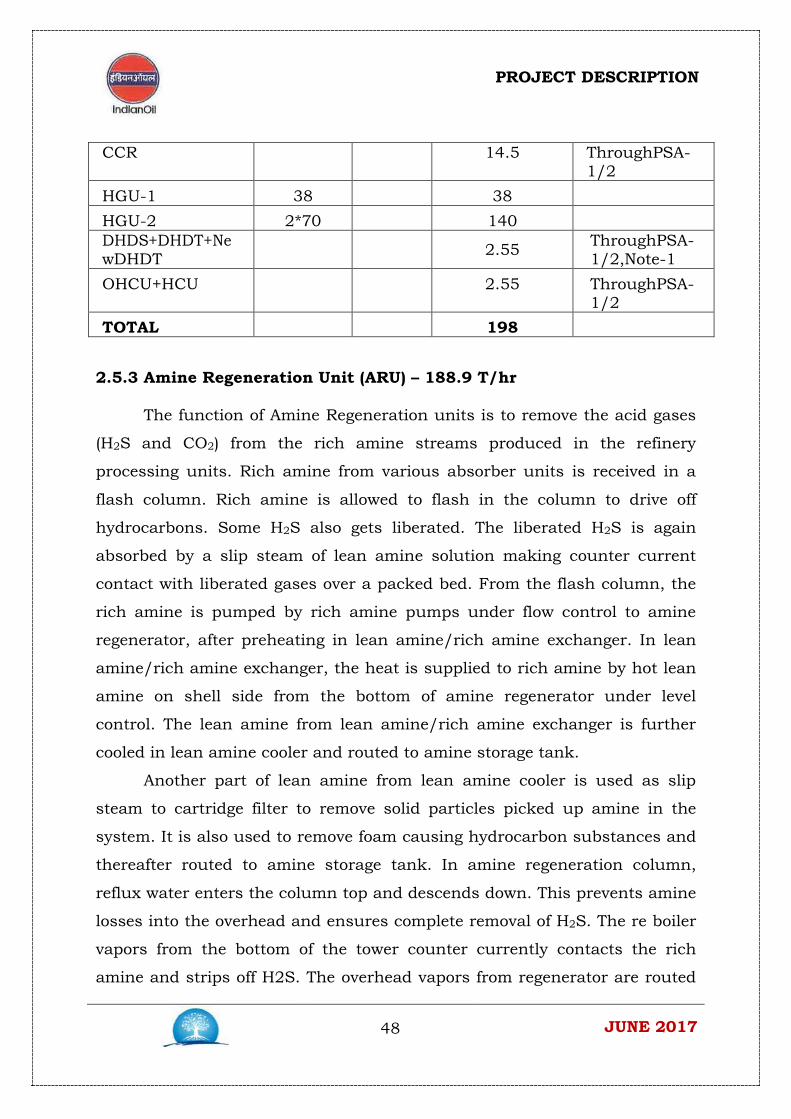
PROJECT DESCRIPTION
48 JUNE 2017
CCR 14.5 ThroughPSA-1/2
HGU-1 38 38
HGU-2 2*70 140 DHDS+DHDT+NewDHDT 2.55 ThroughPSA-
1/2,Note-1 OHCU+HCU 2.55 ThroughPSA-
1/2 TOTAL 198
2.5.3 Amine Regeneration Unit (ARU) – 188.9 T/hr
The function of Amine Regeneration units is to remove the acid gases
(H2S and CO2) from the rich amine streams produced in the refinery
processing units. Rich amine from various absorber units is received in a
flash column. Rich amine is allowed to flash in the column to drive off
hydrocarbons. Some H2S also gets liberated. The liberated H2S is again
absorbed by a slip steam of lean amine solution making counter current
contact with liberated gases over a packed bed. From the flash column, the
rich amine is pumped by rich amine pumps under flow control to amine
regenerator, after preheating in lean amine/rich amine exchanger. In lean
amine/rich amine exchanger, the heat is supplied to rich amine by hot lean
amine on shell side from the bottom of amine regenerator under level
control. The lean amine from lean amine/rich amine exchanger is further
cooled in lean amine cooler and routed to amine storage tank.
Another part of lean amine from lean amine cooler is used as slip
steam to cartridge filter to remove solid particles picked up amine in the
system. It is also used to remove foam causing hydrocarbon substances and
thereafter routed to amine storage tank. In amine regeneration column,
reflux water enters the column top and descends down. This prevents amine
losses into the overhead and ensures complete removal of H2S. The re boiler
vapors from the bottom of the tower counter currently contacts the rich
amine and strips off H2S. The overhead vapors from regenerator are routed
PROJECT DESCRIPTION
49 JUNE 2017
to regenerator overhead condenser, where most of the water vapors
condense and are pumped by amine regenerator reflux pumps as reflux to
the column. The acid gases are routed to the SRU. In case the pressure goes
high, acid gases are released to the acid flare. Re boiler heat by LP steam is
supplied to the column through amine regenerator re boiler. Scheme of the
unit is enclosed in Annexure– II.
2.5.4 Sour Water Stripper (SWS) – 56.7 T/hr
New Sour Water Stripper unit is designed to treat sour water from
DHDT, FCC gasoline Desulphurization Unit, NHT and HGU.The stripped
water from two stage stripper is sent separately to DHDT and NHT or to
ETP. Hot Sour water from aforesaid units is mixed with ammonia rich
recycle (to keep H2S in solution & for constructive recovery), cooled in a
water cooler to 37 0C, and received in a surge drum, a three stage (V-L-L)
separator. Any hydrocarbon that flashes is separated out and joins
ammonia stripper overhead line to be routed to incinerator. The entrained
oil, if any, is skimmed off from drum and drained to OWS. The sour water is
sent to sour water storage tanks under level control. The day tanks and
stripper feed pumps are normally located behind SRU ammonia incinerator
vent stack. The sour water day tanks serve the following purposes:
A floating skimmer (with swivel joints and steam traced “try” lines are
provided to skim off separated oil. The tanks are blanketed with nitrogen to
keep off air/oxygen. The tanks release vapors containing H2S, ammonia
(during out breathing if ammonia rich recycle stream is not available)
through a fisher assembly to join SRU ammonia incinerator vent stack to
release these vapors at safe height.
The sour water from tanks is pumped to the 1st stage H2S stripper
column under flow control through feed/bottom exchanger where the
incoming sour water feed is preheated against 2nd stage bottoms, i.e.,
stripper water. The feed enters the column feed tray. A slip stripped water
stream quantity is taken from the inlet of feed/bottom exchanger and sent
PROJECT DESCRIPTION
50 JUNE 2017
as hot wash water under flow control to the 1st stage stripper column. The
temperature of this wash stream is very important for column steady
performance.
H2S stripper is equipped with MP steam heated kettle re boiler to
provide the re boiling duty required. This column normally operates at a top
pressure of 7.0 Kg/Cm2g and pressure is controlled by PIC in overhead
vapour line. The stripping section removes most of the H2S coming in sour
water feed. The overhead wash section condenses most of the steam and
almost pure H2S is produced at the column top. This H2S gas is routed to
SRU for Sulphur Recovery, in a steam traced line.
The MP steam flows to re boiler. Condensate withdrawal scheme are
same as the single stage stripper column. MP condensate is routed to SRU
condensate handling system. The sour water from the H2S stripper bottom,
containing almost all ammonia and small quantity of unrecovered H2S, is
fed to second stage ammonia stripper column under level control.
The ammonia stripper overhead is floating with the SRU ammonia
incinerator header back pressure. The sour water is fed at the 2nd stage
stripper feed tray. Alternate feed tray is also provided for operational
flexibility. The section below feed tray is stripping section with two pass
trays. The required re boiling duty for this column is supplied by the LP
steam heated kettle re boiler, LP steam flow/condensate withdrawal control
schemes similar to the other two columns. The FRC cascading is with sour
water feed to H2S stripper to maintain a constant rate of steam to sour water
feed. This ratio should be sufficient to bring down ammonia content below
50 ppmw in stripped water from column bottoms. LP condensate is routed
to SRU condensate handling facility. The overhead pump-around circuit
consists of circulating reflux pumps and circulating reflux air cooler. The
small H2S quantity coming out from column top is routed to SRU ammonia
incinerator through a steam jacketed line.
PROJECT DESCRIPTION
51 JUNE 2017
An ammonia-rich slip stream from pump-around circuit (before air
cooler), under flow control, serves as recycle stream to be mixed in hot sour
water feed, before feed mix cooler, during normal operation.
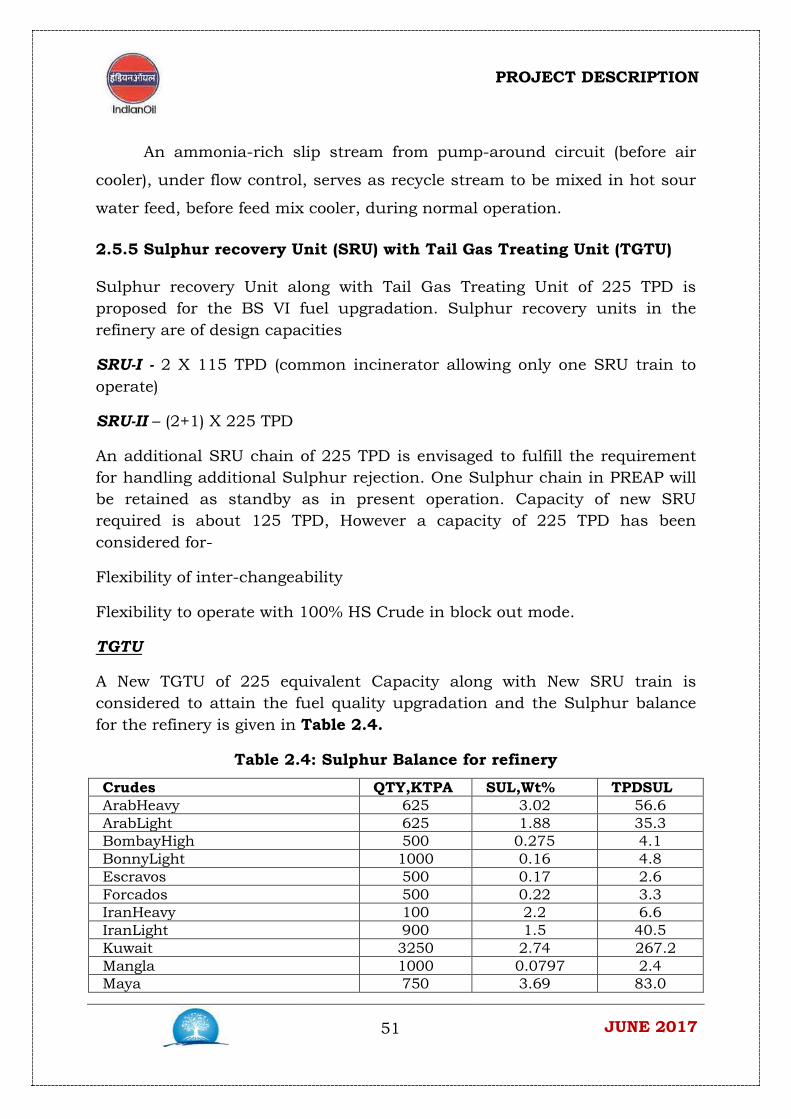
2.5.5 Sulphur recovery Unit (SRU) with Tail Gas Treating Unit (TGTU)
Sulphur recovery Unit along with Tail Gas Treating Unit of 225 TPD is proposed for the BS VI fuel upgradation. Sulphur recovery units in the refinery are of design capacities
SRU-I - 2 X 115 TPD (common incinerator allowing only one SRU train to operate)
SRU-II – (2+1) X 225 TPD
An additional SRU chain of 225 TPD is envisaged to fulfill the requirement for handling additional Sulphur rejection. One Sulphur chain in PREAP will be retained as standby as in present operation. Capacity of new SRU required is about 125 TPD, However a capacity of 225 TPD has been considered for-
Flexibility of inter-changeability
Flexibility to operate with 100% HS Crude in block out mode.
TGTU
A New TGTU of 225 equivalent Capacity along with New SRU train is considered to attain the fuel quality upgradation and the Sulphur balance for the refinery is given in Table 2.4.
Table 2.4: Sulphur Balance for refinery
Crudes QTY,KTPA SUL,Wt% TPDSUL ArabHeavy 625 3.02 56.6 ArabLight 625 1.88 35.3 BombayHigh 500 0.275 4.1 BonnyLight 1000 0.16 4.8 Escravos 500 0.17 2.6 Forcados 500 0.22 3.3 IranHeavy 100 2.2 6.6 IranLight 900 1.5 40.5 Kuwait 3250 2.74 267.2 Mangla 1000 0.0797 2.4 Maya 750 3.69 83.0

PROJECT DESCRIPTION
52 JUNE 2017
Murban 0 0.74 0.0 Quaiboe 750 0.12 2.7 Zafiro 500 0.25 3.8 BasraLt:BasraHy(90:10) 4000 3.25 389.6 BasraLt 0 3.16 0.0 BasraHy 0 4.03 0.0 TOTALCRUDE 15000 902.4 LNG 266 0.015 0.1 C7-8 180 0 0.0 C-9 100 0.014 0.0 PFO 112 0.04 0.1 C4 200 0 0.0 Alkylate 0 0 0.0 MRNAP 150 0.05 0.3 TOTAL OTHER STREAMS 0.7 TOTAL SUL IN FEED 903.0
PRODUCTS MIXEDLPG'S 649.0 0.015 0.3
RFCCPROPYLENE 112.3 0 0.0 BS-VIGASOLINE 1485 0.0008 0.03
BENZENE 20.3 0 0.0 PTASALES 553.0 0 0.0 PNCPFEED 1372.0 0.05 2.0 KEROSENE 0 0.2 0.0
JET 1125.0 0.2 6.75 BS-VIDIESEL 7750.0 0.0008 0.2
HIGHSUL.F.OIL 225.0 3.5 24.0 BITUMEN 360.0 5.5 59.4
COKE 874.0 6.0 157.0 TOTALPRODUCTS 14209.6 250
IFO 502 0.5 7.7 RFCCCoke 0.7
TOTAL 259 SULPHURREJECTED 652.0
ExistingSRUCapacities
SRU-I,TPD 2*115 115 SRU-II,TPD (2+1)*225 550
TOTAL(EXISTINGSRU),TPD 565
PROJECT DESCRIPTION
53 JUNE 2017
2.5.6 PX-PTA Capacity Expansion
A Para-xylene complex was setup to make the feed for the PTA plant.
The feed to PX complex comprised Naphtha from Panipat Refinery as well as
Naphtha from other IOC Refineries.The Para-xylene complex has a
production capability of 360 kilo Tons Per Annum (kTPA) of PX feed and PTA
plant has a capacity of 553 KTPA.
Need for Revamp
The markets for polyester fibre and PET resin has almost doubled over
the last 10 years and reached nearly 37 million t in 2014. It is projected to
grow by approximately 6% CAGR (compound annual growth rate) over the
next 10 years. This growth in demand has led to requirement of revamp of
PX-PTA plant.
Para Xylene Unit
Paraxylene production of 460 kTPA. The revamp will include addition
of new distillation Column, debottlenecking of major equipment including
Fired Heaters, Reactors, Fractionators, Combined Feed exchangers, major
Vessels.The Preparation of Process Package and licensing shall be done by
the licensor of the unit M/s UOP.
Purified Terephthalic Acid Unit
The PTA unit will be revamped to a production capacity of 700 KTPA.The
licensor of the Purified Terephthalic Acid unit is M/s Invista.
The major revamp activity will involve
• Replacement of 21-E1-1607A-D with a shell & tube heat exchanger
21-E1-1607.
• PAC Suction Chilling Option
• Replacement of the CTA Drier
• Apart from above debottlenecking of exchangers, vessels, columns
andtheir internals will be carried out.
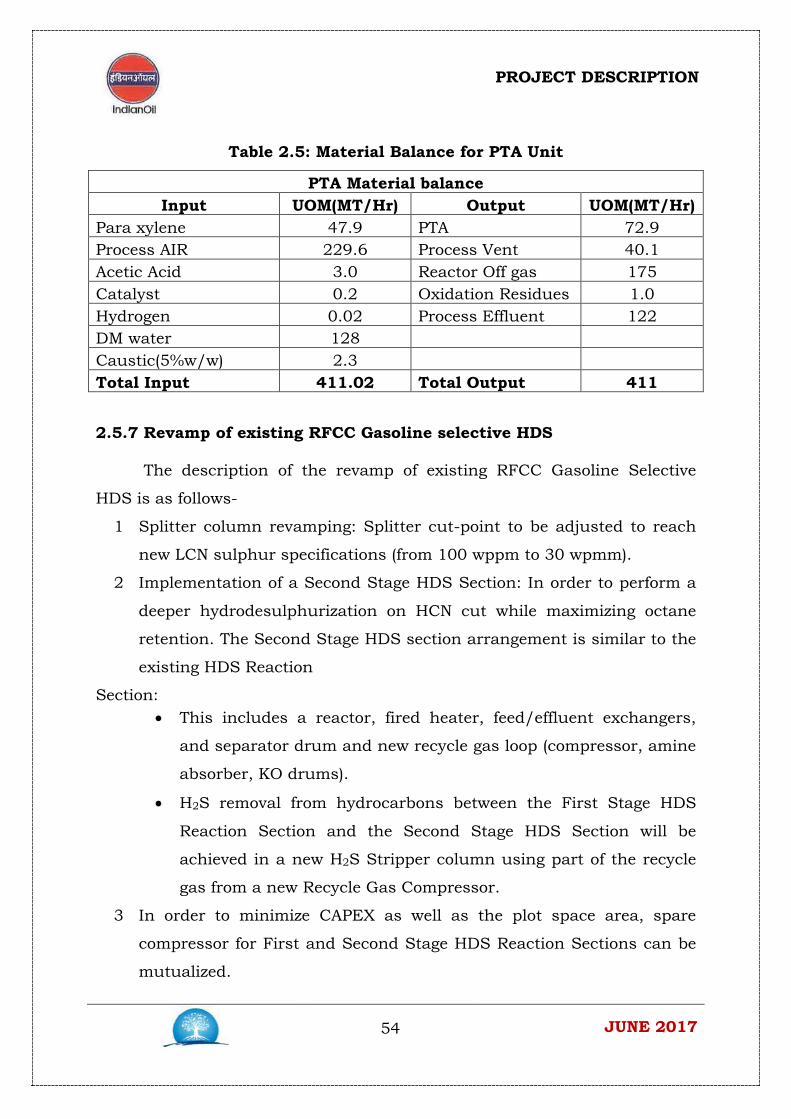
The material balance for the PTA unit is furnished in Table 2.5.
PROJECT DESCRIPTION
54 JUNE 2017
Table 2.5: Material Balance for PTA Unit
PTA Material balance Input UOM(MT/Hr) Output UOM(MT/Hr)
Para xylene 47.9 PTA 72.9 Process AIR 229.6 Process Vent 40.1 Acetic Acid 3.0 Reactor Off gas 175 Catalyst 0.2 Oxidation Residues 1.0 Hydrogen 0.02 Process Effluent 122 DM water 128 Caustic(5%w/w) 2.3
Total Input 411.02 Total Output 411
2.5.7 Revamp of existing RFCC Gasoline selective HDS
The description of the revamp of existing RFCC Gasoline Selective
HDS is as follows-
1 Splitter column revamping: Splitter cut-point to be adjusted to reach
new LCN sulphur specifications (from 100 wppm to 30 wpmm).
2 Implementation of a Second Stage HDS Section: In order to perform a
deeper hydrodesulphurization on HCN cut while maximizing octane
retention. The Second Stage HDS section arrangement is similar to the
existing HDS Reaction
Section: • This includes a reactor, fired heater, feed/effluent exchangers,
and separator drum and new recycle gas loop (compressor, amine
absorber, KO drums).
• H2S removal from hydrocarbons between the First Stage HDS
Reaction Section and the Second Stage HDS Section will be
achieved in a new H2S Stripper column using part of the recycle
gas from a new Recycle Gas Compressor.
3 In order to minimize CAPEX as well as the plot space area, spare
compressor for First and Second Stage HDS Reaction Sections can be
mutualized.

PROJECT DESCRIPTION
55 JUNE 2017
4 Re-use of the existing Finishing Reactor as one bed of Second Stage
HDS Reactor. The existing finishing reactor is reused to reach the
catalyst volume required for the future operation.
2.5.8 DHDT Feed Tank – 20,000 KL
Intermittent Feedstorage tank with floating roof is proposed to set up
for newDHDT unit for the BS VI fuel upgradation. The storage capacity of
the tank is about 20,000 m3.
2.6 Storage Units
The existing storage capacities are maintained as the capacity of the
refinery remains unchanged. In addition to the existing storage additional
storage capacity namely DHDT feed tank (1 no of nominal capacity 20000
m3), TAME feed tank (1 no of nominal capacity 5500 m3), TAME product
tank (2 no’s of nominal capacity 3600 m3 each), Methanol tank (2 nos. of
nominal capacity 500 m3 each) are proposed. Volatile Organic Compounds
are likely to be released from Storage tanks. Nitrogen blanketing facility will
be there for additional tanks, ensuring no release of VOC into atmosphere.
2.7 Power Requirement
Power Requirement for various utilities is in different forms of
Electricity, Steam and Fuel. Additional power will be required mainly for
facilities coming in DHDT, HGU, Prime-G Revamp, SRU & Cooling Towers &
minor amount for ARU,SWS and other facilities. Total power required will be
approximately28 MW. The requirement is met by captive power plant.
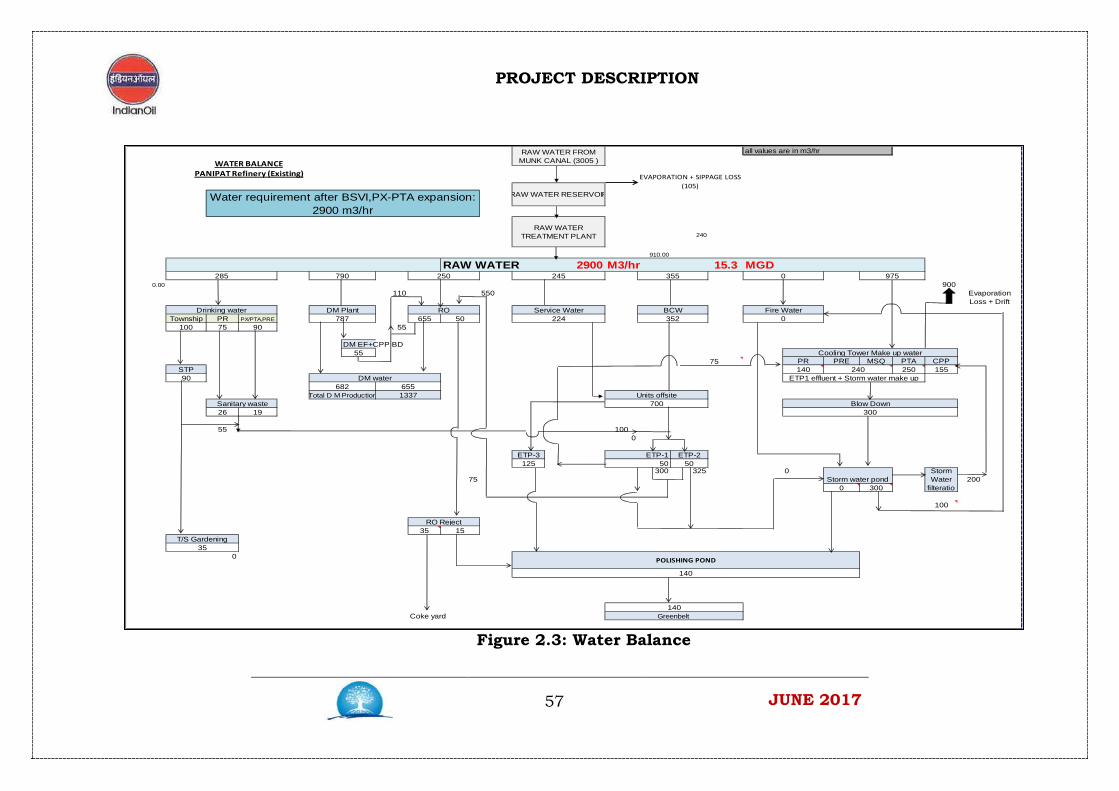
2.8 Water Requirement and waste water generation
The water demand will be met from Munak Regulator on Western
Yamuna Canal for Panipat Refinery. Present water consumption is within
the allocated water of 83,000 KLD. No additional water is required for the
proposed expansion, fuel upgradation and revamp.
PROJECT DESCRIPTION
56 JUNE 2017
As part of additional facility additional effluent mostly from Sour water
stripper (approx. 5 m3/hr, intermittent) will be generated. It is considered
that existing ETP (3 No’s) will be adequate to handle this additional amount.
Additional Cooling Tower blow down (15 m3/hr), Boiler blow down (1 m3/ hr
from SRU), OWS and CRWS will also be accommodated in existing ETP
system. The details of the Effluent Treatment Plant are given in Annexure–
III.
PROJECT DESCRIPTION
57 JUNE 2017
240
910.00
RAW WATER 2900 M3/hr 15.3 MGD
0.00 900110 550
Township PR PX/PTA,PRE 655 50100 75 90 55
DM EF+CPP BD55
75 PR PRE MSQ PTA CPPSTP 140 250 15590
26 19
55 1000
ETP-3 ETP-2125 50
300 325 075 200
0 300
100
35 15
0
Coke yard
Water requirement after BSVI,PX-PTA expansion: 2900 m3/hr
DM water682 655
Total D M Production 1337
787
285 790 250
Drinking water DM Plant RO
Evaporation Loss + Drift
140Greenbelt
Storm Water
filteratio
50
300
Units offsite700
Fire Water
POLISHING POND
140
0 975245 355
240ETP1 effluent + Storm water make up
Cooling Tower Make up water
RAW WATER FROM MUNK CANAL (3005 )
RAW WATER RESERVOIR
RAW WATER TREATMENT PLANT
all values are in m3/hr
EVAPORATION + SIPPAGE LOSS (105)
35
Blow Down
Storm water pond
Sanitary waste
RO Reject
T/S Gardening
ETP-1
Service Water BCW224 352 0
WATER BALANCEPANIPAT Refinery (Existing)
Figure 2.3: Water Balance

PROJECT DESCRIPTION
58 JUNE 2017
2.9Flare System
The flare system will be provided for safe disposal of combustible, toxic
gases, which are relieved from process plants and offsites during start-up,
shutdown and normal operation or in case of any emergency such as –
• Cooling water failure
• Power failure
• Combined cooling water and power failure
• External fire
• Any other operational failure
• Blocked outlet
• Reflux failure
• Local power failure
• Tube rupture
An additional load of 165264.4 kg/hr of LP flare and 15214.5 kg/hr of HP is
estimated from the new DHDT, HGU and incremental load from FCC
Gasoline HDS.As IOCL has informed that existing Flare system is already
operation. Therefore, additional flare system has been considered under BS
VI project. For this additional Flare load a New Flare Stack of size 64” and
associated systems is included in CAPEX. However, during execution a
detailed flare adequacy needs to be carried out with mitigation philosophies
adopted in new units as well as some of existing units to estimate the
requirement of Flare system.
2.10 Project cost and Schedule
The total cost involved for the proposed BS VI Fuel up – gradation and
Capacity Expansion of PX / PTA at Panipat Refinery is around Rs.2754.15
Crores. The project is scheduled to be completed by April, 2019.

DESCRIPTION OF ENVIRONMENT
59 JUNE 2017
3.0 DESCRIPTION OF ENVIRONMENT
3.1 Introduction
Baseline Environmental Studies have been conducted to determine the
existing status of various Environmental attributes viz., Climate and
Atmospheric conditions, Air, Water, Noise, Soil, Hydro geological, Land use
pattern, Ecological and Socio-Economical environment, prior to setting up of
the proposed project. This study would help to undertake corrective
mitigation measures for protection of the environment on account of any
change deviation of attributes due to activities of the proposed project.
3.2 Scope of Baseline Study An area, covering a 10 km radial distance from the project site is
considered as the study area for the purpose of the baseline studies. Primary
data on Water, Air, Land, Flora, Fauna & Socio-Economic data were collected
by a team of Engineers and Scientists. Secondary data was collected from
various Departments of State/Central Government Organizations, Semi-
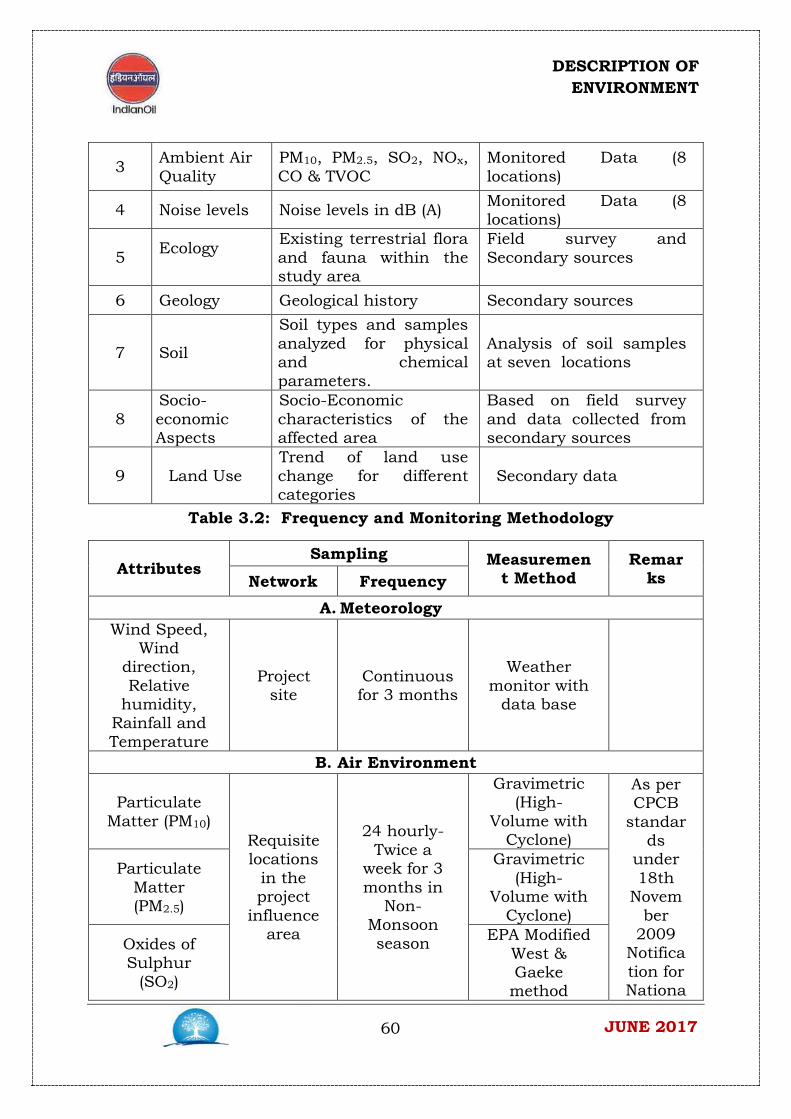
Government and Public Sector Organizations. Table 3.1 gives various
environmental attributes considered for formulating environmental baseline
and Table 3.2 gives the frequency and monitoring methodology for various
environmental attributes.
Table 3.1: Environmental Attributes
S. N Attribute Parameter Source of Data
1 Climatology & Meteorology
Wind Speed, Wind direction, Relative humidity, Rainfall and Temperature
Indian Meteorological Department and Site specific information
2 Water Quality
Physical and Chemical parameters
Monitored Data (Surface water – 2 locations and ground water - 7 locations)
DESCRIPTION OF ENVIRONMENT
60 JUNE 2017
3 Ambient Air Quality
PM10, PM2.5, SO2, NOx, CO & TVOC
Monitored Data (8 locations)
4 Noise levels Noise levels in dB (A) Monitored Data (8 locations)
5 Ecology
Existing terrestrial flora and fauna within the study area
Field survey and Secondary sources
6 Geology Geological history Secondary sources
7 Soil
Soil types and samples analyzed for physical and chemical parameters.
Analysis of soil samples at seven locations
8 Socio-economic Aspects
Socio-Economic characteristics of the affected area
Based on field survey and data collected from secondary sources
9 Land Use Trend of land use change for different categories
Secondary data
Table 3.2: Frequency and Monitoring Methodology
Attributes Sampling Measuremen
t Method Remar
ks Network Frequency A. Meteorology
Wind Speed, Wind
direction, Relative
humidity, Rainfall and Temperature
Project site
Continuous for 3 months
Weather monitor with
data base
B. Air Environment
Particulate Matter (PM10)
Requisite locations
in the project
influence area
24 hourly-Twice a
week for 3 months in
Non- Monsoon season
Gravimetric (High-
Volume with Cyclone)
As per CPCB
standards
under 18th
November
2009 Notification for Nationa
Particulate Matter (PM2.5)
Gravimetric (High-
Volume with Cyclone)
Oxides of Sulphur
(SO2)
EPA Modified West & Gaeke method

DESCRIPTION OF ENVIRONMENT
61 JUNE 2017
Oxides of Nitrogen
(NOx)
Arsenite Modified Jacob &
Hochheiser
l Ambien
t Air Quality Standa
rds (NAAQ
S)
Total Volatile Organic
Compounds (TVOC)
-- EPA Method TO 17
Carbon Monoxide Gas Analyzer
(NDIR)
C. Noise
Hourly equivalent noise levels
Requisite locations
in the project
influence area
Once Instrument : Sound level
meter
IS: 4954 1968
D. Water Parameters for water
quality: pH, temp,
turbidity, Total
hardness, total
alkalinity, chloride, sulphate, nitrate, fluoride, sodium,
potassium, Electrical
Conductivity, Ammonical nitrogen, Nitrate-
Nitrogen total phosphorus, BOD, COD, Calcium,
Magnesium, Total
Set of grab
samples At
requisite locations
for ground
and surface water
Once
Samples for water quality collected and analyzed as per IS : 2488 (Part 1-5) methods for sampling and testing of Industrial effluents Standard methods for examination of water and wastewater analysis published by American Public Health Association.

DESCRIPTION OF ENVIRONMENT
62 JUNE 2017
Dissolved Solids, Total Suspended
Solids E. Land Environment
Parameter for soil quality: pH, texture,
electrical conductivity,
organic matter,
nitrogen, phosphate,
sodium, calcium,
potassium and
Magnesium.
Requisite soil
samples be
collected as per BIS
specification
within project
influence area
Once in season
Collected and analyzed as per soil analysis reference book, M.L.Jackson
F. Biological Environment
Terrestrial & Aquatic Flora and Fauna
Requisite locations
in the project
influence area
Once in season
Collected and analyzed as
per IUCN Red Data book.
3.3 Climate and Meteorology
The climate of the area is characterized by a hot and dry summer from
March to May, a south-west monsoon or rainy season from June to
September, a pleasant post-monsoon or retreating monsoon from October to
November and a cool winter from December to February.
3.3.1 Temperature
The monthly maximum and minimum température recorded on-site
during the aforesaid monitoring period (1st December, 2016 – 28th February,
2017) varies between (32 to 1)°C and (16 to 6.2)°C respectively with overall
maximum and minimum températures being 37.3°C and 6.2°C respectively.
DESCRIPTION OF ENVIRONMENT
63 JUNE 2017
It could be observed that, the pattern of data recorded on-site generally
matches with the past data of IMD.
3.3.2 Relative Humidity
The monthly minimum and maximum relative humidity recorded
onsite during the said monitoring period varied between (33-41)% and (76-
69)% respectively, the overall minimum and maximum being 33% & 76%
respectively.
3.3.3 Atmospheric Pressure
The overall minimum and maximum atmospheric pressures recorded
on-site during the said monitoring period were 754.1 mm Hg and 760.3 mm
Hg respectively. Such values compare well with the past IMD data.
3.3.4 Rainfall
The average annual rainfall at Karnal, Haryana is 800 mm/year (As
per IMD), 80% of which occurs during monsoon months (June- September).
Total 33mm rainfall was recorded during the monitoring period.
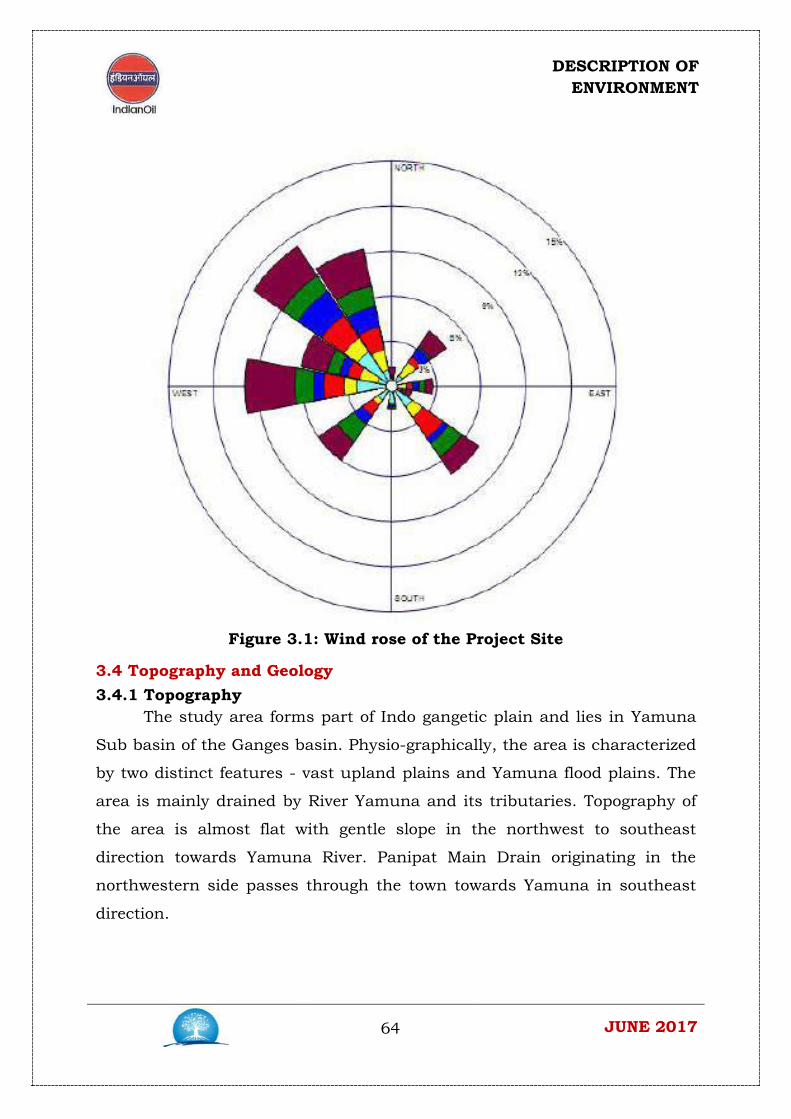
DESCRIPTION OF ENVIRONMENT
64 JUNE 2017
Figure 3.1: Wind rose of the Project Site
3.4 Topography and Geology 3.4.1 Topography
The study area forms part of Indo gangetic plain and lies in Yamuna
Sub basin of the Ganges basin. Physio-graphically, the area is characterized
by two distinct features - vast upland plains and Yamuna flood plains. The
area is mainly drained by River Yamuna and its tributaries. Topography of
the area is almost flat with gentle slope in the northwest to southeast
direction towards Yamuna River. Panipat Main Drain originating in the
northwestern side passes through the town towards Yamuna in southeast
direction.

DESCRIPTION OF ENVIRONMENT
65 JUNE 2017
3.4.2 Geology
The study area is occupied by geological formations of Quaternary Age
comprising of recentalluvial deposits belonging to the vast Gangetic alluvial
plains. The district has two types ofsoils – tropical arid brown and arid
brown soils. The arid brown soils are found in major partsof the area
whereas tropical arid brown soils are found in north eastern part of the
district.
3.5 Ambient Air Quality
The sources of air pollution in the region are industrial emissions,
vehicular traffic, dust arising from unpaved village roads and domestic fuel
burning. The prime objective of the baseline air quality study was to
establish the existing ambient air quality of the area. This will be useful for
assessing the conformity to standards of the ambient air quality during the
operation of the proposed power project.
3.5.1 Methodology for Monitoring and Analysis
Envirotech APM 460 BL Respirable Dust Sampler (RDS) and Sampler
(Envirotech APM 550)/ Ecotech (AAS 127) fine particulate matter were
deployed for ambient air quality monitoring. The baseline data of air
environment is monitored for the below mentioned parameters:
• Particulate Matter (PM2.5); • Particulate Matter (PM10); • Sulphur dioxide (SO2); • Di oxides of Nitrogen (NO2); • Ozone (O3); • Lead (Pb); • Carbon Monoxide (CO); • Ammonia (NH3); • Benzene (C6H6); • Benzo (a) Pyrene (BaP); • Arsenic (As); • Nickel (Ni)

DESCRIPTION OF ENVIRONMENT
66 JUNE 2017
3.5.2 Sampling and Analytical Techniques
PM2.5 and PM10 have been estimated by gravimetric method. Modified
West and Gaeke method (IS-5182 part-II, 1969) have been adopted for
estimation of SO2. Jacobs-Hochheiser method (IS-5182 part-IV, 1975) has
been adopted for the estimation of NO2.
Samples for carbon monoxide were analyzed using NDIR techniques.
The techniques adopted for sampling and analysis are given in Table
3.3along with the minimum detection limits for each parameter.
Table 3.3: Methodology adopted for Sampling and Analysis
S.No. Parameter Technique Detectable Limit
(µg / m3) 1 Particulate Matter
(PM10) Gravimetric [EPA -40 (CFR Part 50)]
2.0
2 Particulate Matter (PM2.5)
Gravimetric [EPA -40 (CFR Part 50)]
2.0
3 Sulphur Dioxide (SO2) Improved West and Gaeke 5.0 4 Nitrogen Dioxide (NO2) Modified Jacob & Hochheiser 5.0 5 Carbon Monoxide (CO) NDIR [IS 13270 : 1992] 0.1 6 Ammonia (NH3) Nesslers Method (APHA) 20 7 Ozone (O3) KI Absorption Method 5.0 8 Lead (Pb) AAS Method [IS 5182 (Part
22) : 2004] 0.1
9 Arsenic (As) AAS Method [IS 5182 (Part 22) : 2004]
0.001
10 Nickel (Ni) AAS Method [IS 5182 (Part 22) : 2004]
0.001
11 Benzene (C6H6) Adsorption & Desorption followed by GC [IS 5182 (Part 11) : 2006]
0.01
12 Benzo (a) pyrene (BaP) Solvent Extraction followed by GC Analysis [IS 5282 (Part 12) : 1991]
0.00
3.5.3 Ambient Air Quality Monitoring Locations
Eight stations were for ambient air quality monitoring based as per
guidelines of CPCB. Ambient air quality monitoring locations are shown in
Table 3.4 and Figure 3.2.
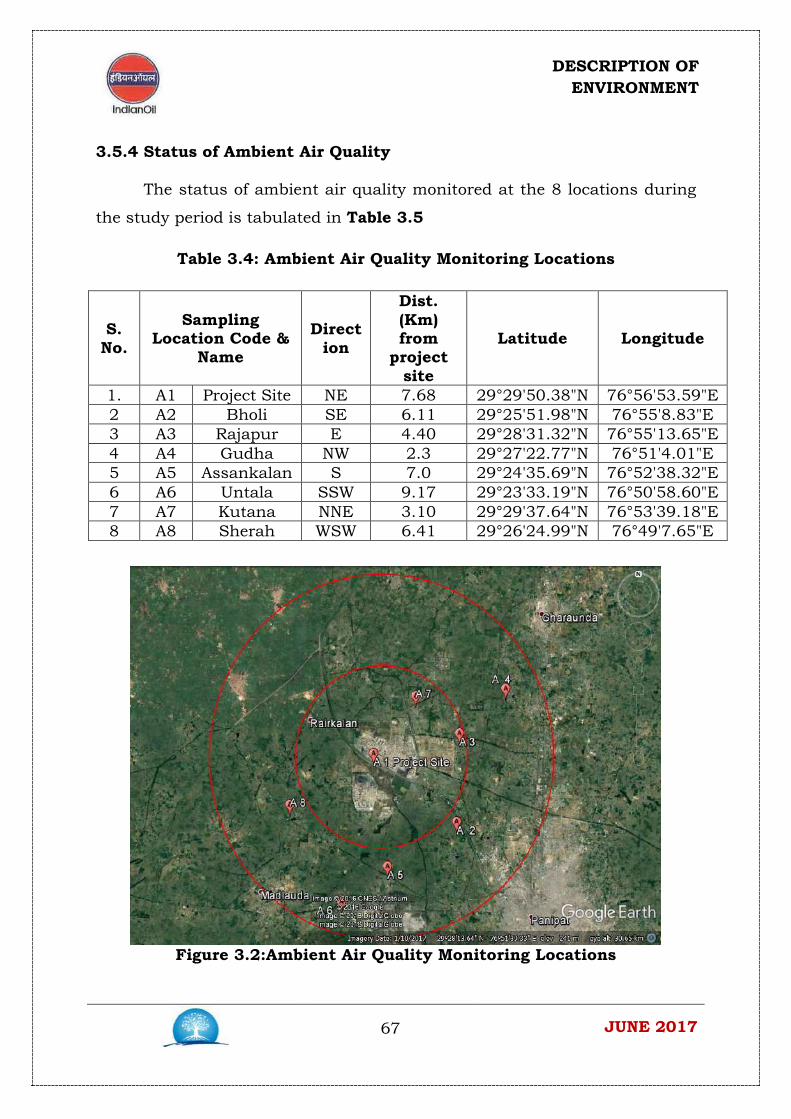
DESCRIPTION OF ENVIRONMENT
67 JUNE 2017
3.5.4 Status of Ambient Air Quality
The status of ambient air quality monitored at the 8 locations during
the study period is tabulated in Table 3.5
Table 3.4: Ambient Air Quality Monitoring Locations
Figure 3.2:Ambient Air Quality Monitoring Locations
S. No.
Sampling Location Code &
Name
Direction
Dist. (Km) from
project site
Latitude Longitude
1. A1 Project Site NE 7.68 29°29'50.38"N 76°56'53.59"E 2 A2 Bholi SE 6.11 29°25'51.98"N 76°55'8.83"E 3 A3 Rajapur E 4.40 29°28'31.32"N 76°55'13.65"E 4 A4 Gudha NW 2.3 29°27'22.77"N 76°51'4.01"E 5 A5 Assankalan S 7.0 29°24'35.69"N 76°52'38.32"E 6 A6 Untala SSW 9.17 29°23'33.19"N 76°50'58.60"E 7 A7 Kutana NNE 3.10 29°29'37.64"N 76°53'39.18"E 8 A8 Sherah WSW 6.41 29°26'24.99"N 76°49'7.65"E
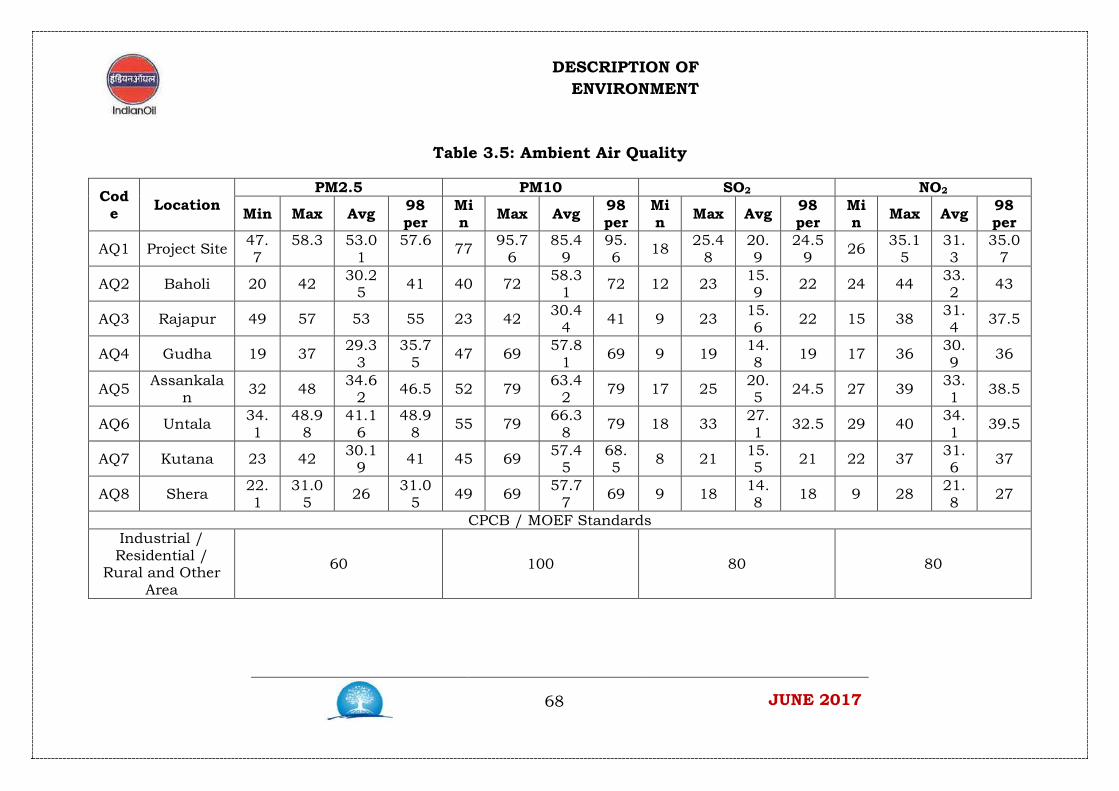
DESCRIPTION OF ENVIRONMENT
68 JUNE 2017
Table 3.5: Ambient Air Quality
Code Location
PM2.5 PM10 SO2 NO2
Min Max Avg 98 per
Min Max Avg 98
perMin Max Avg 98
perMin Max Avg 98
per
AQ1 Project Site 47.7
58.3 53.01
57.6 77 95.76
85.49
95.6 18 25.4
8 20.9
24.59 26 35.1
5 31.3
35.07
AQ2 Baholi 20 42 30.25 41 40 72 58.3
1 72 12 23 15.9 22 24 44 33.
2 43
AQ3 Rajapur 49 57 53 55 23 42 30.44 41 9 23 15.
6 22 15 38 31.4 37.5
AQ4 Gudha 19 37 29.33
35.75 47 69 57.8
1 69 9 19 14.8 19 17 36 30.
9 36
AQ5 Assankalan 32 48 34.6
2 46.5 52 79 63.42 79 17 25 20.
5 24.5 27 39 33.1 38.5
AQ6 Untala 34.1
48.98
41.16
48.98 55 79 66.3
8 79 18 33 27.1 32.5 29 40 34.
1 39.5
AQ7 Kutana 23 42 30.19 41 45 69 57.4
5 68.5 8 21 15.
5 21 22 37 31.6 37
AQ8 Shera 22.1
31.05 26 31.0
5 49 69 57.77 69 9 18 14.
8 18 9 28 21.8 27
CPCB / MOEF Standards Industrial / Residential /
Rural and Other Area
60 100 80 80

DESCRIPTION OF ENVIRONMENT
69 JUNE 2017
Code Location CO O3 NH3 MHC
Min Max Avg 98 per Min Max Avg 98
per Min Max Avg 98 per Min Max Avg 98
per
AQ1 Project Site 0.7 1.1 0.93 1.1 18 36.25 24.41 33.62 1.1 83.19 72.89 82.59 0.4 3.1 1.62 3.1 AQ2 Bholi 0.7 1.1 0.8 1.06 <5.0 <5.0 <5.0 <5.0 <5.0 <5.0 <5.0 <5.0 0.4 3.1 1.62 3.1 AQ3 Rajapur 0.6 1.1 0.8 1.05 <5.0 <5.0 <5.0 <5.0 <5.0 <5.0 <5.0 <5.0 <0.4 <0.4 <0.4 <0.4 AQ4 Gudha 0.8 1.1 0.9 1.06 <5.0 <5.0 <5.0 <5.0 <5.0 <5.0 <5.0 <5.0 <0.4 <0.4 <0.4 <0.4 AQ5 Assankalan 1 2.1 1.41 2 <5.0 <5.0 <5.0 <5.0 <5.0 <5.0 <5.0 <5.0 <0.4 <0.4 <0.4 <0.4 AQ6 Untala 1.1 2.1 1.47 2 <5.0 <5.0 <5.0 <5.0 <5.0 <5.0 <5.0 <5.0 <0.4 <0.4 <0.4 <0.4 AQ7 Kutana 0.7 1.1 0.9 1.02 <5.0 <5.0 <5.0 <5.0 <5.0 <5.0 <5.0 <5.0 <0.4 <0.4 <0.4 <0.4 AQ8 Shera 0.8 1.1 0.9 1.0 <5.0 <5.0 <5.0 <5.0 <5.0 <5.0 <5.0 <5.0 <0.4 <0.4 <0.4 <0.4
CPCB / MOEF Standards Industrial / Residential /
Rural and Other Area
4 80 400
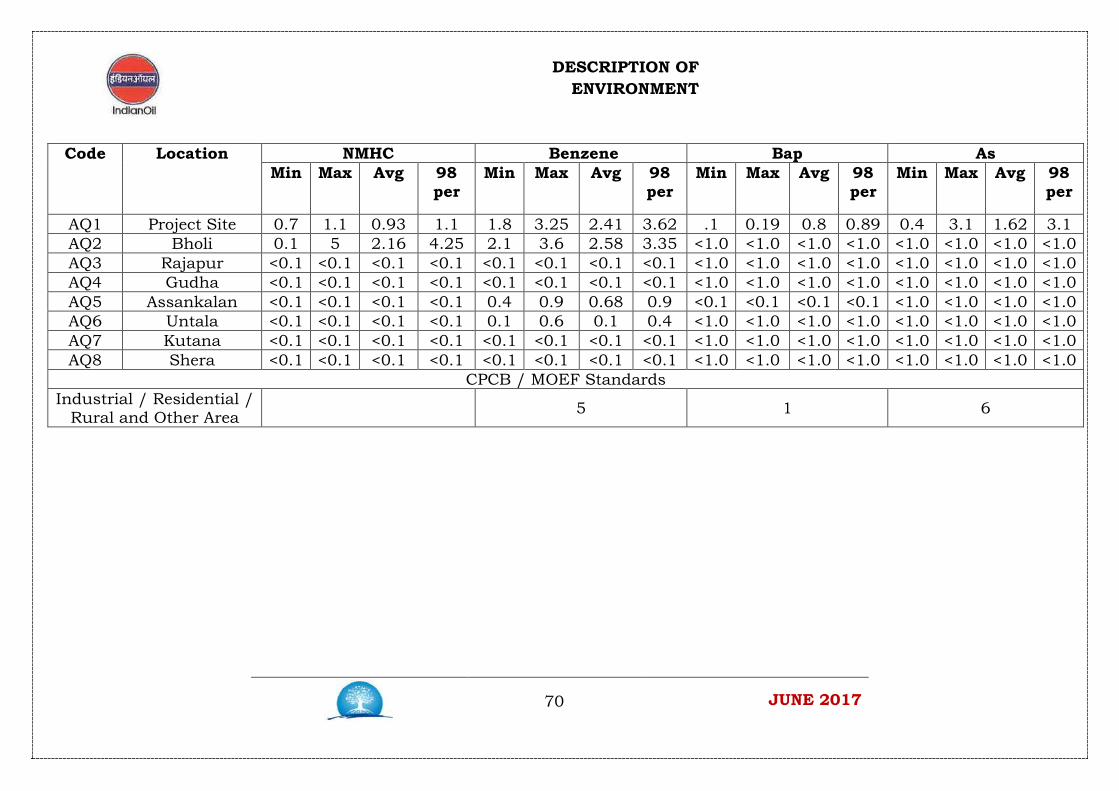
DESCRIPTION OF ENVIRONMENT
70 JUNE 2017
Code Location NMHC Benzene Bap As Min Max Avg 98
per Min Max Avg 98
per Min Max Avg 98
per Min Max Avg 98
per
AQ1 Project Site 0.7 1.1 0.93 1.1 1.8 3.25 2.41 3.62 .1 0.19 0.8 0.89 0.4 3.1 1.62 3.1 AQ2 Bholi 0.1 5 2.16 4.25 2.1 3.6 2.58 3.35 <1.0 <1.0 <1.0 <1.0 <1.0 <1.0 <1.0 <1.0 AQ3 Rajapur <0.1 <0.1 <0.1 <0.1 <0.1 <0.1 <0.1 <0.1 <1.0 <1.0 <1.0 <1.0 <1.0 <1.0 <1.0 <1.0 AQ4 Gudha <0.1 <0.1 <0.1 <0.1 <0.1 <0.1 <0.1 <0.1 <1.0 <1.0 <1.0 <1.0 <1.0 <1.0 <1.0 <1.0 AQ5 Assankalan <0.1 <0.1 <0.1 <0.1 0.4 0.9 0.68 0.9 <0.1 <0.1 <0.1 <0.1 <1.0 <1.0 <1.0 <1.0 AQ6 Untala <0.1 <0.1 <0.1 <0.1 0.1 0.6 0.1 0.4 <1.0 <1.0 <1.0 <1.0 <1.0 <1.0 <1.0 <1.0 AQ7 Kutana <0.1 <0.1 <0.1 <0.1 <0.1 <0.1 <0.1 <0.1 <1.0 <1.0 <1.0 <1.0 <1.0 <1.0 <1.0 <1.0 AQ8 Shera <0.1 <0.1 <0.1 <0.1 <0.1 <0.1 <0.1 <0.1 <1.0 <1.0 <1.0 <1.0 <1.0 <1.0 <1.0 <1.0
CPCB / MOEF Standards Industrial / Residential /
Rural and Other Area 5 1 6
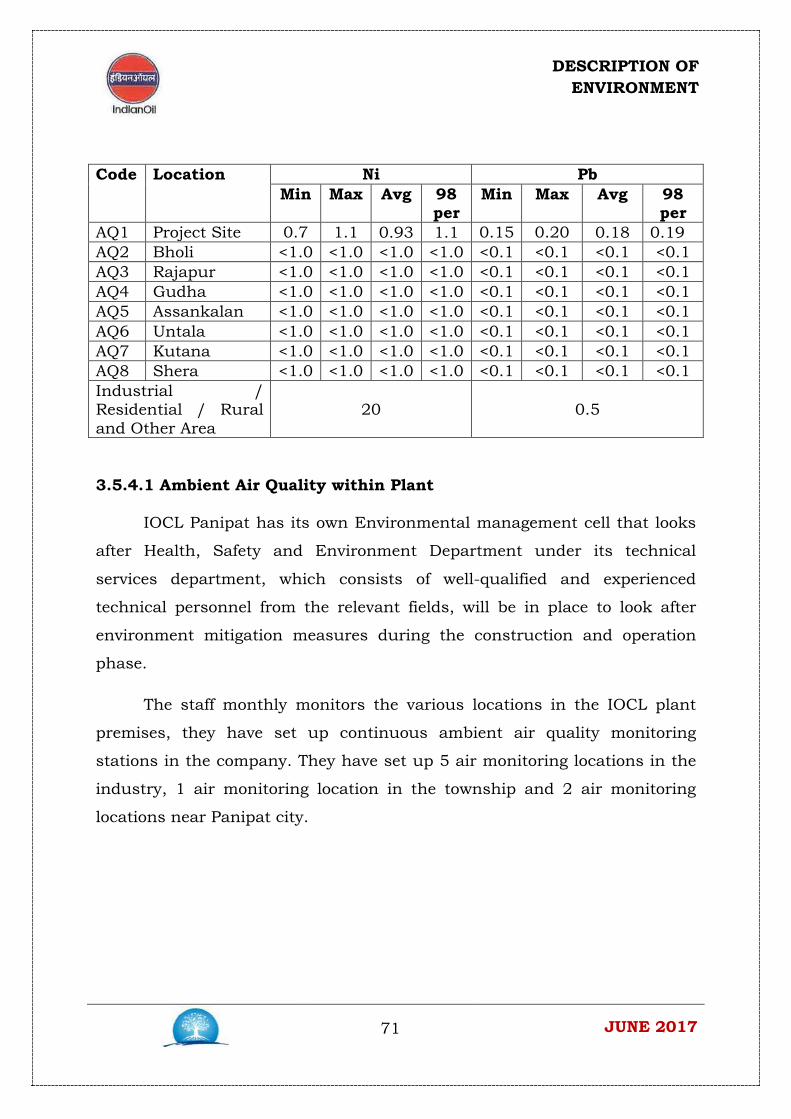
DESCRIPTION OF ENVIRONMENT
71 JUNE 2017
3.5.4.1 Ambient Air Quality within Plant
IOCL Panipat has its own Environmental management cell that looks
after Health, Safety and Environment Department under its technical
services department, which consists of well-qualified and experienced
technical personnel from the relevant fields, will be in place to look after
environment mitigation measures during the construction and operation
phase.
The staff monthly monitors the various locations in the IOCL plant
premises, they have set up continuous ambient air quality monitoring
stations in the company. They have set up 5 air monitoring locations in the
industry, 1 air monitoring location in the township and 2 air monitoring
locations near Panipat city.
Code Location Ni Pb Min Max Avg 98
per Min Max Avg 98
per AQ1 Project Site 0.7 1.1 0.93 1.1 0.15 0.20 0.18 0.19 AQ2 Bholi <1.0 <1.0 <1.0 <1.0 <0.1 <0.1 <0.1 <0.1 AQ3 Rajapur <1.0 <1.0 <1.0 <1.0 <0.1 <0.1 <0.1 <0.1 AQ4 Gudha <1.0 <1.0 <1.0 <1.0 <0.1 <0.1 <0.1 <0.1 AQ5 Assankalan <1.0 <1.0 <1.0 <1.0 <0.1 <0.1 <0.1 <0.1 AQ6 Untala <1.0 <1.0 <1.0 <1.0 <0.1 <0.1 <0.1 <0.1 AQ7 Kutana <1.0 <1.0 <1.0 <1.0 <0.1 <0.1 <0.1 <0.1 AQ8 Shera <1.0 <1.0 <1.0 <1.0 <0.1 <0.1 <0.1 <0.1 Industrial / Residential / Rural and Other Area
20 0.5
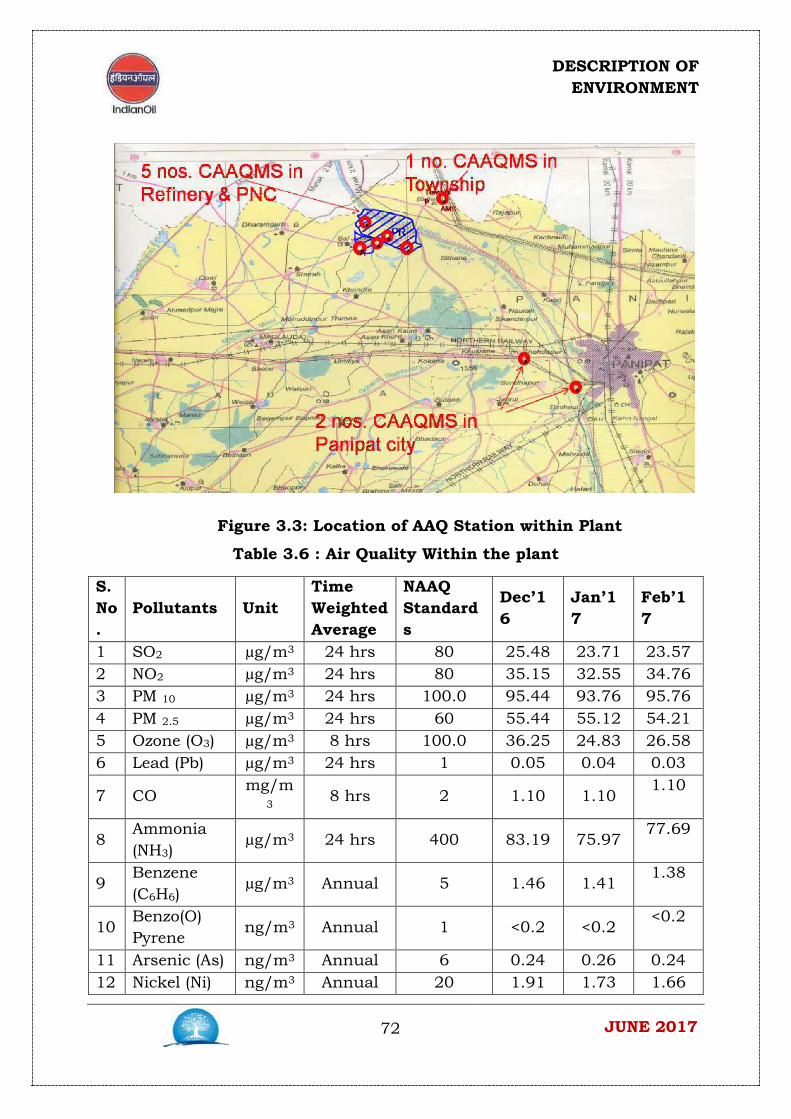
DESCRIPTION OF ENVIRONMENT
72 JUNE 2017
Figure 3.3: Location of AAQ Station within Plant
Table 3.6 : Air Quality Within the plant
S. No.
Pollutants Unit Time Weighted Average
NAAQ Standards
Dec’16
Jan’17
Feb’17
1 SO2 µg/m3 24 hrs 80 25.48 23.71 23.57 2 NO2 µg/m3 24 hrs 80 35.15 32.55 34.76 3 PM 10 µg/m3 24 hrs 100.0 95.44 93.76 95.76 4 PM 2.5 µg/m3 24 hrs 60 55.44 55.12 54.21 5 Ozone (O3) µg/m3 8 hrs 100.0 36.25 24.83 26.58 6 Lead (Pb) µg/m3 24 hrs 1 0.05 0.04 0.03
7 CO mg/m
3 8 hrs 2 1.10 1.10
1.10
8 Ammonia (NH3)
µg/m3 24 hrs 400 83.19 75.97 77.69
9 Benzene (C6H6)
µg/m3 Annual 5 1.46 1.41 1.38
10 Benzo(O) Pyrene
ng/m3 Annual 1 <0.2 <0.2 <0.2
11 Arsenic (As) ng/m3 Annual 6 0.24 0.26 0.24 12 Nickel (Ni) ng/m3 Annual 20 1.91 1.73 1.66

DESCRIPTION OF ENVIRONMENT
73 JUNE 2017
3.6Water Environment
3.6.1 Ground Water Quality
Ground water has been found as the most important source for catering
the domestic needs of water consumption of local population throughout the
study area. Therefore, any kind of deterioration owing to the industrial or
the urban activities in the quality of ground water will pose serious threat to
health and attention needs to be paid towards maintaining the quality of
water using all possible tools such as regular monitoring with spontaneous
remedial suggestions, if required. With this view, 7 monitoring stations (tube
wells) in the study area are identified for assessment of ground water
quality. These stations have been spread over the study area. The locations
of the ground water quality monitoring stations are listed in Table-3.7 and
Figure 3.4.
Table 3.7: Ground Water Quality Monitoring Stations
S.N Code Location Direction Dist. (Km)
Latitude Longitude
1 GW1 Bahauli E 8.36 29°28'7.73"N 76°57'44.14"E 2 GW2 Near PTA -
ETP Area - - - -
3 GW3 Baljatan WSW 2.97 29°27'20.94"N 76°51'3.59"E 4 GW4 Assankalan S 6.82 29°24'36.67"N 76°52'37.91"E 5 GW5 Untala SSW 9.05 29°23'32.78"N 76°50'59.41"E 6 GW6 Bhalsi SW 9.62 29°24'24.81"N 76°48'31.41"E 7 GW7 Near CISF
Road NNE 1.79 29°29'15.59"N 76°52'45.76"E

DESCRIPTION OF ENVIRONMENT
74 JUNE 2017
Figure 3.4: Groundwater and Surface water Monitoring Locations
3.6.1.1 Sampling and Analysis
The collected water samples were analyzed for physical and chemical
parameters as parameters described in IS: 10500:2012. Table 3.8 gives
desirable and permissible limits prescribed for potable water in IS: 10500:
2012.
Table 3.8 : Indian Standard Specification for Drinking Water
S.N Characteristic Requirement (Acceptable
Limit)
Permissible Limit in the Absence of Alternate Source
Protocol
I Organoleptic and Physical Parameters i) Colour, Hazen
units, Max 5 15 IS 3025 (Part 4)
ii) Odour Agreeable Agreeable IS 3025 (Part 5a) iii) pH value 6.5-8.5 No relaxation IS 3025 (Part 11) iv) Taste Agreeable Agreeable IS 3025 (Part
7&8) v) Turbidity,
NTU, Max 1 5 IS 3025 (Part 10)

DESCRIPTION OF ENVIRONMENT
75 JUNE 2017
S.N Characteristic Requirement (Acceptable
Limit)
Permissible Limit in the Absence of Alternate Source
Protocol
vi) Total dissolved solids, mg/l, Max
500 2000 IS 3025 (Part 16)
II General Parameters Concerning Substances Undesirable in Excessive Amounts
i) Aluminium (as Al), mg/l, Max
0.03 0.2 IS 3025 (Part 55)
ii) Ammonia (as total ammonia-N), mg/l, Max
0.5 No relaxation IS 3025 (Part 34)
iii) Anionic detergents (as MBAS) mg/l, Max
0.2 1.0 IS 13428
iv) Barium (as Ba), mg/l, Max
0.7 No relaxation IS 15302
v) Boron (as B), mg/l, Max
0.5 1.0 IS 3025 (Part 57)
vi) Calcium (as Ca), mg/l, Max
75 200 IS 3025 (Part 40)
vii) Chloramines (as Cl2), mg/l, Max
4.0 No relaxation IS IS 3025 (Part 26)
viii) Chloride (as Cl), mg/l, Max
250 1000 IS 3025 (Part 32)
ix) Copper (as Cu), mg/l, Max
0.05 1.5 IS 3025 (Part 42)
x) Fluoride (as F) mg/l, Max
1.0 1.5 IS 3025 (Part 60)
xi) Free residual chlorine, mg/l, Min
0.2 1 IS 3025 (Part 26)
xii) Iron (as Fe), mg/l, Max
0.3 No relaxation IS 3025 (Part 53)
xiii) Magnesium (as Mg), mg/l, Max
30 100 IS 3025 (Part 46)
xiv) Manganese (as Mn), mg/l, Max
0.1 0.3 IS 3025 (Part 59)
xv) Mineral oil, 0.5 No relaxation IS 3025 (Part 39)

DESCRIPTION OF ENVIRONMENT
76 JUNE 2017
S.N Characteristic Requirement (Acceptable
Limit)
Permissible Limit in the Absence of Alternate Source
Protocol
mg/l, Max xvi) Nitrate (as
NO3), mg/l, Max
45 No relaxation IS 3025 (Part 34)
xvii) Phenolic compounds (as C6H5OH), mg/l, Max
0.001 0.002 IS 3025 (Part 43)
xviii) Selenium (as Se), mg/l, Max
0.01 No relaxation IS 3025 (Part 56)
xix) Silver (as Ag), mg/l, Max
0.1 No relaxation IS 13428
xx) Sulphate (as SO4) mg/l, Max
200 400 IS 3025 (Part 24)
xxi) Sulphide (as H2S), mg/l, Max
0.05 No relaxation IS 3025 (Part 29)
xxii) Total alkalinity as Calcium, mg/l, Max
200 600 IS 3025 (Part 23)
xxiii) Total hardness (as CaCO3), mg/l, Max
200 600 IS 3025 (Part 21)
xxiv) Zinc (as Zn), mg/l, Max
5 15 IS 3025 (Part 49)
III Parameters Concerning Toxic Substances i) Cadmium (as
Cd), mg/l, Max 0.003 No relaxation IS 3025 (Part 41)
ii) Cyanide (as CN), mg/l, Max
0.05 No relaxation IS 3025 (Part 27)
iii) Lead (as Pb), mg/l, Max
0.01 No relaxation IS 3025 (Part 47)
iv) Mercury (as Hg), mg/l, Max
0.001 No relaxation IS 3025 (Part 48)
v) Molybdenum (as Mo), mg/l, Max
0.07 No relaxation IS 3025 (Part 2)
vi) Nickel (as Ni), mg/l, Max
0.02 No relaxation IS 3025 (Part 54)

DESCRIPTION OF ENVIRONMENT
77 JUNE 2017
S.N Characteristic Requirement (Acceptable
Limit)
Permissible Limit in the Absence of Alternate Source
Protocol
vii) Polychlorinated biphenyls, mg/l, Max
0.0005 viii) No relaxation APHA 6630
viii) Polynuclear aromatic hydrocarbons (as PAH), mg/l, Max
0.0001 No relaxation APHA 6630
ix) Total Arsenic (as As), mg/l, Max
0.01 0.05 IS 3025 (Part 37)
x) Total chromium (as Cr), mg/l, Max
0.05 No relaxation IS 3025 (Part 52
xi) Trihalomethanes
a) Bromoform, mg/l, Max
0.1 No relaxation ASTM D 3973-85 or
APHA 6232 b) Dibromochloro
methane, mg/l, Max
0.1 No relaxation ASTM D 3973-85 or
APHA 6232 c) Bromodichloro
methane, mg/l, Max
0.06 No relaxation
ASTM D 3973-85 or
APHA 6232 d) Chloroform,
mg/l, Max 0.2 No relaxation ASTM D 3973-
85 or APHA 6232
IV Bacteriological Quality of Drinking Water i All water
intended for drinking, a) E. coli or thermotolerant coliform bacteria (TCB)
Shall not be detectable in any 100 ml sample
Source: Bureau of Indian Standard Code IS: 10500:2012.

DESCRIPTION OF ENVIRONMENT
78 JUNE 2017
Table 3.9 : Ground water Quality in the Study Area
Sn.
Parameters
Units
GW1 GW2 GW3 GW4 GW5 GW6 GW7
1 pH - 7.90 7.72 8.21 7.56 7.63 7.40 8.67 2 Colour Haze
n <1 <1 <1 <1 <1 <1 <1
3 Odour
Un Objection-able
Un Objection-able
Un Objection-able
Un Objection-able
Un Objection-able
Un Objection-able
Un Objection-able
4 Turbidity NTU <1 <1 <1 <1 <1 <1 <1
5 TDS mg/l 487 362 257 332 451 326 442 6 Hardne
ss as CaCO3
mg/l 391 294 189 257 322 278 265
7 Nitrate as NO3
mg/l 3.9 6.6 4.4 7.4 8.2 3.5 7.8
8 Chloride as Cl mg/l 42 59 35 32 45 39 65
9 Sulphate as SO4
mg/l 15 23 19 26 42 37 35
10 Calcium as Ca
mg/l 87 78 43 63 88 58 74
11 Magnesium as Mg
mg/l 44 29 21 23 31 42 25
12 Iron as Fe mg/l 0.13 0.12 0.13 0.18 0.21 0.24 0.22
13 Fluoride as F mg/l 0.70 0.45 0.21 0.52 0.82 0.87 0.90
14 Total Alkalinity as CaCO3
mg/l 382 293 185 255 320 275 290
15 Zinc as Zn mg/l 0.09 0.1 0.07 0.09 0.11 0.015 0.14
16 Copper as Cu mg/l BDL BDL BDL BDL BDL BDL BDL
17 Cyanide as CN
mg/l BDL BDL BDL BDL BDL BDL BDL

DESCRIPTION OF ENVIRONMENT
79 JUNE 2017
Sn.
Parameters
Units
GW1 GW2 GW3 GW4 GW5 GW6 GW7
18 Arsenic as As mg/l BDL BDL BDL BDL BDL BDL BDL
19 Mercury as Hg mg/l BDL BDL BDL BDL BDL BDL BDL
20 Lead as Pb mg/l BDL BDL BDL BDL BDL BDL BDL
21 Chromium as Cr+6
mg/l BDL BDL BDL BDL BDL BDL BDL
3.6.1.2 Observations
• Colour: The colour of ground water sample is found<1 hazen unit.
• Odour: The odour of ground water sample is agreeable and meets the
desirable limit for drinking water standard.
• pH: The pH value of ground water river water sample is 7.4 to 8.67
and always meets the drinking water desirable standard.
• Total Dissolved Solids (TDS): TDS of ground water is 257 to 487
mg/l.
• Total Hardness: Total hardness value ground water sample is 189 to
391 mg/l.
• Iron: The iron content in ground water sample is 0.12 to 0.24 mg/l
and found within the permissible limit of 0.3 mg/l in the absence of
alternate source of potable water.
• Chloride: Chloride content of ground water sample is 32 to 65 mg/l
and meets the acceptable limit of 250 mg/l.
• Calcium: Calcium content in ground water 43 to 88 mg/l and found
within the acceptable limit of 75 mg/l.
• Magnesium: Magnesium content in ground water sample is 21 to 44
mg/l and found within the acceptable limit of 75 mg/l.

DESCRIPTION OF ENVIRONMENT
80 JUNE 2017
• Sulphate: Sulphate content in ground water river water sample is
15.0 to 42.0 mg/l and meets the acceptable limit of 200 mg/l for
potable water.
• Nitrate: Nitrate content in ground water is 3.5 to 8.2 mg/l and meets
the acceptable limit of 45 mg/l for potable water.
• Fluoride: Fluoride content of water sample is 0.21 to 0.90 mg/l and
meets the acceptable limit of 1 mg/l for potable water.
Conclusions: The results of ground water were compared to Indian
Standard Specification of drinking water IS: 10500:2012 and were found
within the permissible limits.
3.6.2 Surface water Quality There is no river running around the proposed site. A good number of
manmade canals and drains exist within the impact zone, namely Western
Yamuna Canal, Main Drain No. 2, Munak Drain, Gagsina East Drain, Nahar
Kuna Hansi Drain, Phurla Drain, Gandha Nala, Gahana Feeder, Untala
Drain, Khandra Drain, Thirana Drain etc. These drains and nalas form a
network spreading in the impact zone and they ultimately meet Yamuna. Of
them, Western Yamuna Canal is the nearest major canal flowing within 2
km in the northern part of the location of the proposed site. The raw water
requirement is fulfilled by Western Yamuna Canal. To assess the quality of
surface water, 3 stations are selected and monitored. The sampling stations
and their brief description are given in Table-3.10
Table 3.10 : Surface Water Quality Monitoring Locations
S.N Code
Location Direction
Dist. (Km)
Latitude Longitude
1 SW 1 On Munak river ESE 2.21 29°27'26.27"N
76°53'30.59"E
2 SW2 Drain no.2 , Sithana village
ESE 0.84 29°27'3.24"N
76°54'20.95"E
3 SW 3 Western Yamuna Canal
S 3.69 29°27'50.81"N
76°52'34.72"E
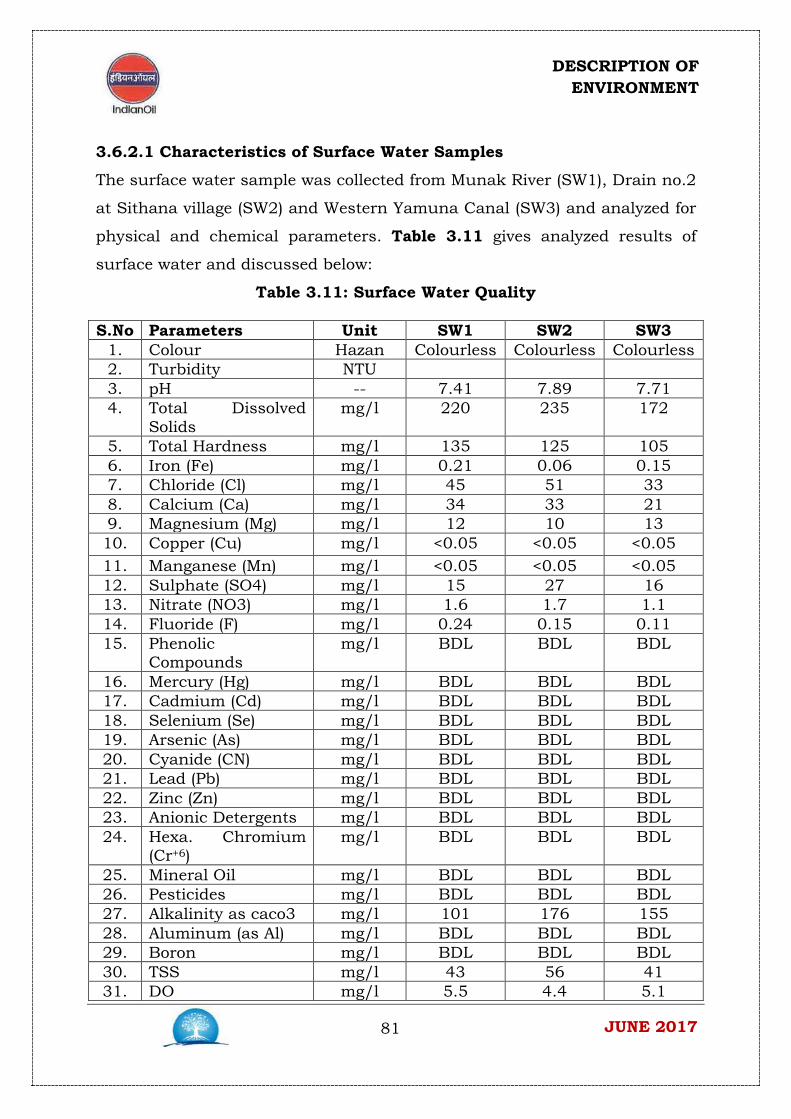
DESCRIPTION OF ENVIRONMENT
81 JUNE 2017
3.6.2.1 Characteristics of Surface Water Samples
The surface water sample was collected from Munak River (SW1), Drain no.2
at Sithana village (SW2) and Western Yamuna Canal (SW3) and analyzed for
physical and chemical parameters. Table 3.11 gives analyzed results of
surface water and discussed below:
Table 3.11: Surface Water Quality
S.No Parameters Unit SW1 SW2 SW3 1. Colour Hazan Colourless Colourless Colourless 2. Turbidity NTU 3. pH -- 7.41 7.89 7.71 4. Total Dissolved
Solids mg/l 220 235 172
5. Total Hardness mg/l 135 125 105 6. Iron (Fe) mg/l 0.21 0.06 0.15 7. Chloride (Cl) mg/l 45 51 33 8. Calcium (Ca) mg/l 34 33 21 9. Magnesium (Mg) mg/l 12 10 13 10. Copper (Cu) mg/l <0.05 <0.05 <0.05 11. Manganese (Mn) mg/l <0.05 <0.05 <0.05 12. Sulphate (SO4) mg/l 15 27 16 13. Nitrate (NO3) mg/l 1.6 1.7 1.1 14. Fluoride (F) mg/l 0.24 0.15 0.11 15. Phenolic
Compounds mg/l BDL BDL BDL
16. Mercury (Hg) mg/l BDL BDL BDL 17. Cadmium (Cd) mg/l BDL BDL BDL 18. Selenium (Se) mg/l BDL BDL BDL 19. Arsenic (As) mg/l BDL BDL BDL 20. Cyanide (CN) mg/l BDL BDL BDL 21. Lead (Pb) mg/l BDL BDL BDL 22. Zinc (Zn) mg/l BDL BDL BDL 23. Anionic Detergents mg/l BDL BDL BDL 24. Hexa. Chromium
(Cr+6) mg/l BDL BDL BDL
25. Mineral Oil mg/l BDL BDL BDL 26. Pesticides mg/l BDL BDL BDL 27. Alkalinity as caco3 mg/l 101 176 155 28. Aluminum (as Al) mg/l BDL BDL BDL 29. Boron mg/l BDL BDL BDL 30. TSS mg/l 43 56 41 31. DO mg/l 5.5 4.4 5.1
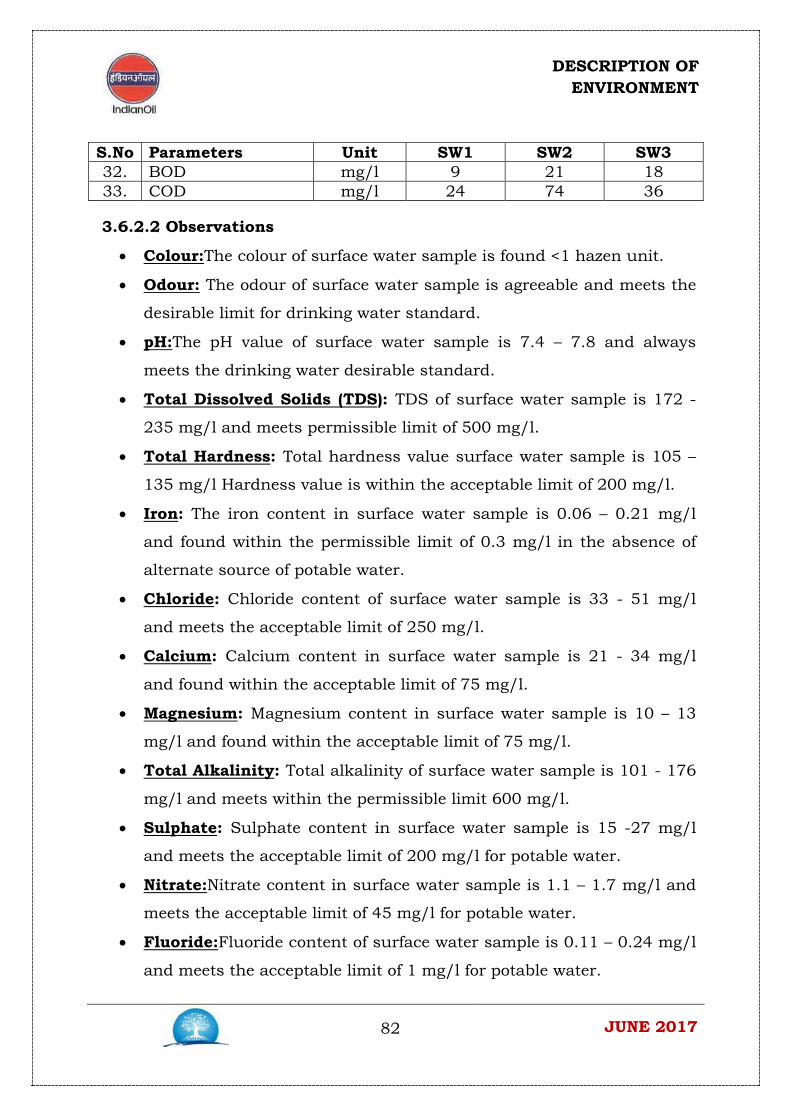
DESCRIPTION OF ENVIRONMENT
82 JUNE 2017
S.No Parameters Unit SW1 SW2 SW3 32. BOD mg/l 9 21 18 33. COD mg/l 24 74 36
3.6.2.2 Observations
• Colour:The colour of surface water sample is found <1 hazen unit.
• Odour: The odour of surface water sample is agreeable and meets the
desirable limit for drinking water standard.
• pH:The pH value of surface water sample is 7.4 – 7.8 and always
meets the drinking water desirable standard.
• Total Dissolved Solids (TDS): TDS of surface water sample is 172 -
235 mg/l and meets permissible limit of 500 mg/l.
• Total Hardness: Total hardness value surface water sample is 105 –
135 mg/l Hardness value is within the acceptable limit of 200 mg/l.
• Iron: The iron content in surface water sample is 0.06 – 0.21 mg/l
and found within the permissible limit of 0.3 mg/l in the absence of
alternate source of potable water.
• Chloride: Chloride content of surface water sample is 33 - 51 mg/l
and meets the acceptable limit of 250 mg/l.
• Calcium: Calcium content in surface water sample is 21 - 34 mg/l
and found within the acceptable limit of 75 mg/l.
• Magnesium: Magnesium content in surface water sample is 10 – 13
mg/l and found within the acceptable limit of 75 mg/l.
• Total Alkalinity: Total alkalinity of surface water sample is 101 - 176
mg/l and meets within the permissible limit 600 mg/l.
• Sulphate: Sulphate content in surface water sample is 15 -27 mg/l
and meets the acceptable limit of 200 mg/l for potable water.
• Nitrate:Nitrate content in surface water sample is 1.1 – 1.7 mg/l and
meets the acceptable limit of 45 mg/l for potable water.
• Fluoride:Fluoride content of surface water sample is 0.11 – 0.24 mg/l
and meets the acceptable limit of 1 mg/l for potable water.

DESCRIPTION OF ENVIRONMENT
83 JUNE 2017
3.6.3 Treated Water Quality
IOCL PR regular monitors the ETP waste water samples. The waste
water sampling results at ETP1 and ETP 2 showed that the all the
wastewater were within permissible limits. The results are tabulated below:
Table 3.12: Treated Water Quality
PARAMETER LIMIT Dec’16 Jan’17 Feb’17 ETP-1 ETP-2 ETP-1 ETP-2 ETP-1 ETP-2
pH 6.0 - 8.5
7.07 7.15 6.72 7.11 8.15 8.19
Oil & Grease 5.0 2.80 2.40 4.80 4.40 4.40 4.20 BOD 15.0 13.00 14 14.00 13 14 14 COD 125.0 67.46 75.40 76.60 110.70 114 109 TSS 20.0 16 18 18.00 18 19 19
Phenols 0.35 <0.01 <0.01 <0.01 <0.01 <0.01 <0.01 Sulphides 0.5 <0.05 <0.05 <0.05 <0.05 <0.05 <0.05
CN 0.20 <0.02 <0.02 <0.02 <0.02 <0.02 <0.02 Ammonia as N 15.0 <0.5 <0.5 9.30 5.54 4.64 5.50
TKN 40.0 1.20 1.53 14.04 13.10 6.60 9.40 P 3.0 1.22 0.31 0.64 0.31 0.18 0.11
Cr (Hexavalent) 0.1 <0.05 <0.05 <0.05 <0.05 <0.05 <0.05 Cr (Total) 2.0 <0.05 <0.05 <0.05 <0.05 <0.05 <0.05
Pb 0.1 <0.01 <0.01 <0.01 <0.01 <0.01 <0.01 Hg 0.01 <0.00
1 <0.001 <0.00
1 <0.001 <0.00
1 <0.00
1 Zn 5.0 0.24 0.28 0.63 0.37 0.19 0.12 Ni 1.0 0.19 0.17 0.28 0.21 <0.01 <0.01 Cu 1.0 <0.02 <0.02 <0.02 <0.02 <0.02 <0.02 V 0.2 <0.2 <0.2 <0.2 <0.2 <0.2 <0.2
Benzene 0.1 ND ND ND ND ND ND Benzo (a) -
Pyrene 0.2 ND ND ND ND ND ND
3.7 Noise Environment
A total of eight locations within an area of 10 km radius around the
project site have been selected for measurement of ambient noise levels,
covering residential & sensitive areas. These locations have been displayed
in Table 3.13.

DESCRIPTION OF ENVIRONMENT
84 JUNE 2017
Major Sources of Noise in Study Area
The study area is of both industrial & residential in nature. Vehicular
movement on the roads is a source of noise in those residential & industrial
areas. This increases the ambient noise levels. There are also a number of
other domestic noise sources such as television, radio, loud speakers, etc.
3.7.1 Ambient Noise Monitoring
In the present study, a sound level meter has measured sound
pressure levels. Since loudness of sound is important for its effects on
people, the dependence of loudness on frequency must be taken into
account in environmental noise assessment. This has been achieved by
using A-weighting filters in the noise measuring instrument which gives a
direct reading of approximate loudness. Moreover, A-weighted equivalent
continuous sound pressure level (Leq) values have been computed from the
values of A-weighted sound pressure level (SPL) measured with the help of a
noise meter. At each location, readings were taken at uniform interval over a
twenty-four hours period, divided into day and night shifts. For a particular
location daytime Leq has been computed from the SPL values measured
between 6.00 A.M to 10.00 P.M and night time Leq from the SPL values
measured between 10.00 P.M to 6.00 A.M such that comparison could be
made with the National Ambient Noise Standards.
3.7.2 Noise Levels in the Study Area
Noise levels in Leq at the respective locations separately for Day and
Night times have been presented in Table 3.13. During the day time, the
equivalent noise levels were found to vary in the range of (44.6 - 64) dB (A)
while in the night time, the equivalent noise levels were observed to be
varying in the range of (27-45) dB (A). The highest value of equivalent noise
level pressure was found to be 64 dB (A) at Project Site while the lowest
value was found to be 44.6 dB(A) during day time. As usual, the day time
noise levels were found to be higher than those, observed at night level.
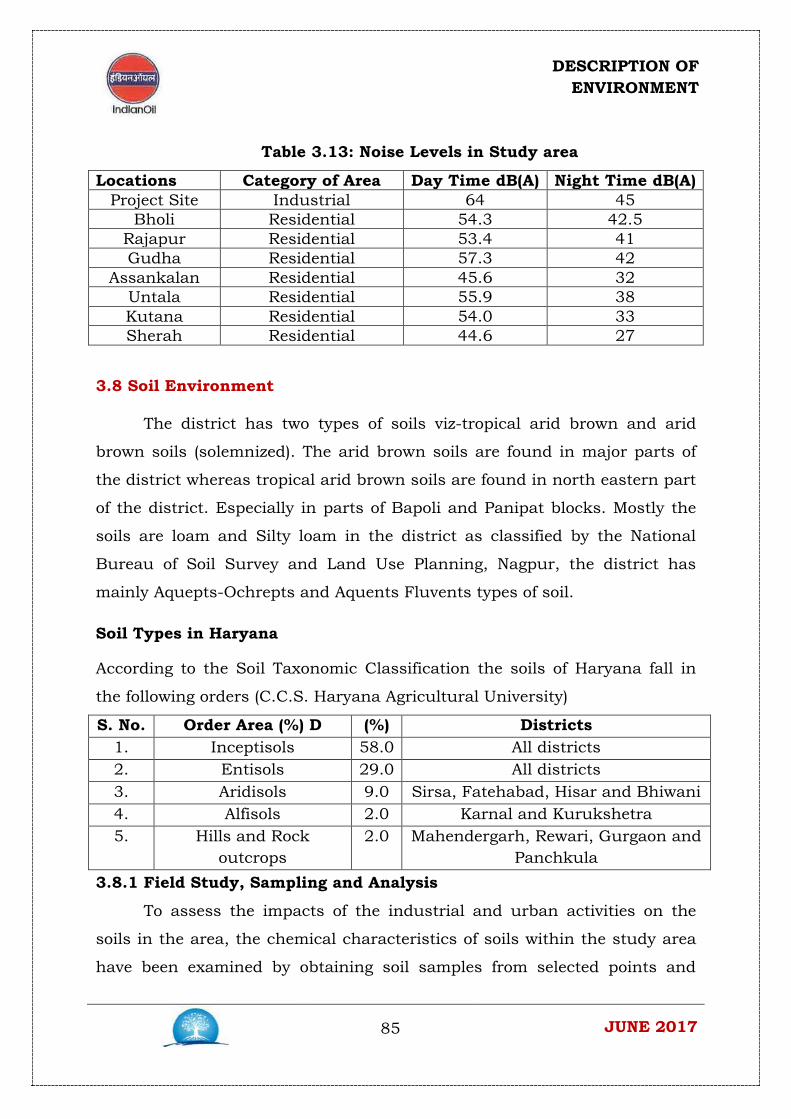
DESCRIPTION OF ENVIRONMENT
85 JUNE 2017
Table 3.13: Noise Levels in Study area
Locations Category of Area Day Time dB(A) Night Time dB(A) Project Site Industrial 64 45
Bholi Residential 54.3 42.5 Rajapur Residential 53.4 41 Gudha Residential 57.3 42
Assankalan Residential 45.6 32 Untala Residential 55.9 38 Kutana Residential 54.0 33 Sherah Residential 44.6 27
3.8 Soil Environment
The district has two types of soils viz-tropical arid brown and arid
brown soils (solemnized). The arid brown soils are found in major parts of
the district whereas tropical arid brown soils are found in north eastern part
of the district. Especially in parts of Bapoli and Panipat blocks. Mostly the
soils are loam and Silty loam in the district as classified by the National
Bureau of Soil Survey and Land Use Planning, Nagpur, the district has
mainly Aquepts-Ochrepts and Aquents Fluvents types of soil.
Soil Types in Haryana
According to the Soil Taxonomic Classification the soils of Haryana fall in
the following orders (C.C.S. Haryana Agricultural University)
S. No. Order Area (%) D (%) Districts 1. Inceptisols 58.0 All districts 2. Entisols 29.0 All districts 3. Aridisols 9.0 Sirsa, Fatehabad, Hisar and Bhiwani 4. Alfisols 2.0 Karnal and Kurukshetra 5. Hills and Rock
outcrops 2.0 Mahendergarh, Rewari, Gurgaon and
Panchkula 3.8.1 Field Study, Sampling and Analysis
To assess the impacts of the industrial and urban activities on the
soils in the area, the chemical characteristics of soils within the study area
have been examined by obtaining soil samples from selected points and
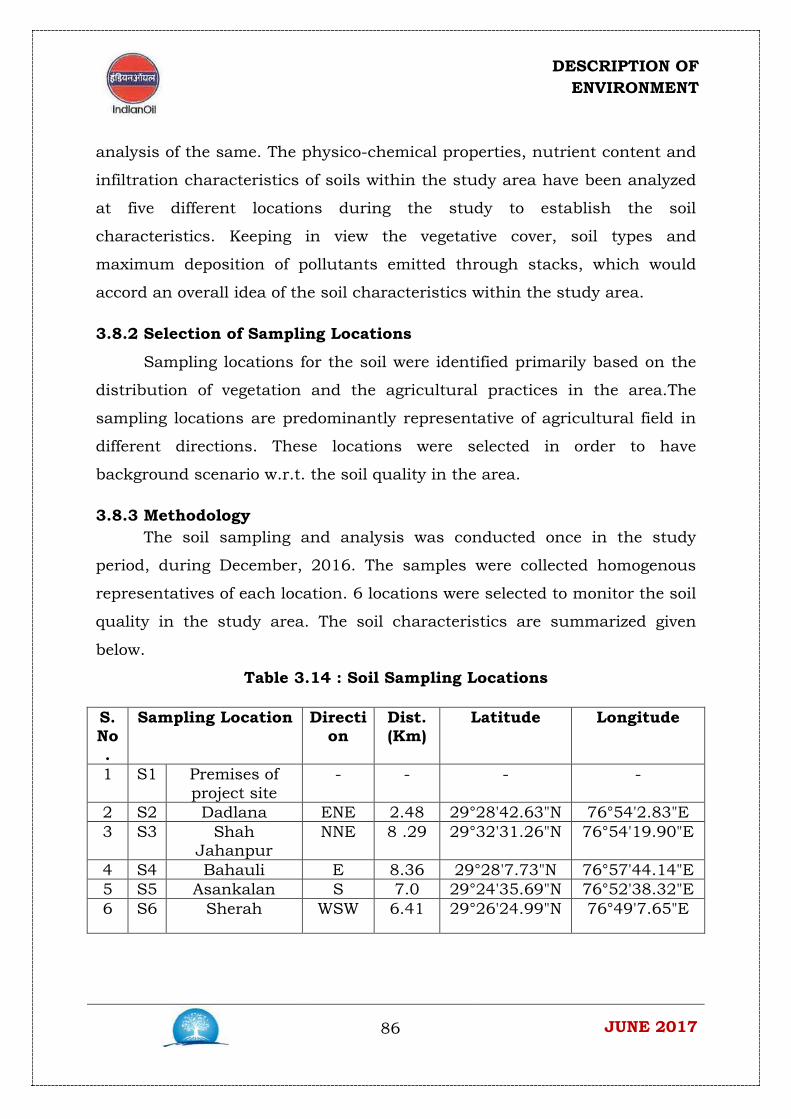
DESCRIPTION OF ENVIRONMENT
86 JUNE 2017
analysis of the same. The physico-chemical properties, nutrient content and
infiltration characteristics of soils within the study area have been analyzed
at five different locations during the study to establish the soil
characteristics. Keeping in view the vegetative cover, soil types and
maximum deposition of pollutants emitted through stacks, which would
accord an overall idea of the soil characteristics within the study area.
3.8.2 Selection of Sampling Locations
Sampling locations for the soil were identified primarily based on the
distribution of vegetation and the agricultural practices in the area.The
sampling locations are predominantly representative of agricultural field in
different directions. These locations were selected in order to have
background scenario w.r.t. the soil quality in the area.
3.8.3 Methodology The soil sampling and analysis was conducted once in the study
period, during December, 2016. The samples were collected homogenous
representatives of each location. 6 locations were selected to monitor the soil
quality in the study area. The soil characteristics are summarized given
below.
Table 3.14 : Soil Sampling Locations
S. No.
Sampling Location Direction
Dist. (Km)
Latitude Longitude
1 S1 Premises of project site
- - - -
2 S2 Dadlana ENE 2.48 29°28'42.63"N 76°54'2.83"E 3 S3 Shah
Jahanpur NNE 8 .29 29°32'31.26"N 76°54'19.90"E
4 S4 Bahauli E 8.36 29°28'7.73"N 76°57'44.14"E 5 S5 Asankalan S 7.0 29°24'35.69"N 76°52'38.32"E 6 S6 Sherah WSW 6.41 29°26'24.99"N 76°49'7.65"E

DESCRIPTION OF ENVIRONMENT
87 JUNE 2017
Figure 3.5:Soil Quality Monitoring Locations
3.8.4 Soil Quality
The value of important physical and chemical parameters of these soil
samples are given in Table 3.15
Table 3.15 : Soil Characteristics in the Study area
SN Parameters
Unit Project site
Dadlana
Shah Jahanpur
Bahauli
Asankalan
Shera
1 Colour Brownish
Brownish
Brownish
Brownish
Brownish
Brownish
2 Texture Sility sand
Sility sand
Sility sand
Sility sand
Sility sand
Sility sand
3 Water Holding Capacity
% 42.40 47.0 40.21 44.53 40.56 46.15
4 Bulk Density
gm/ cc
1.19 1.21 1.31 1.27 1.25 1.29
5 pH 8.0 7.9 7.9 8.5 8.7 9.58 6 Sodium meq/
100g 34.20 30.61 29.31 31.33 41.78 32.70
7 Phosphor mg/ 6.1 7.3 7.6 7.4 6.2 8.2
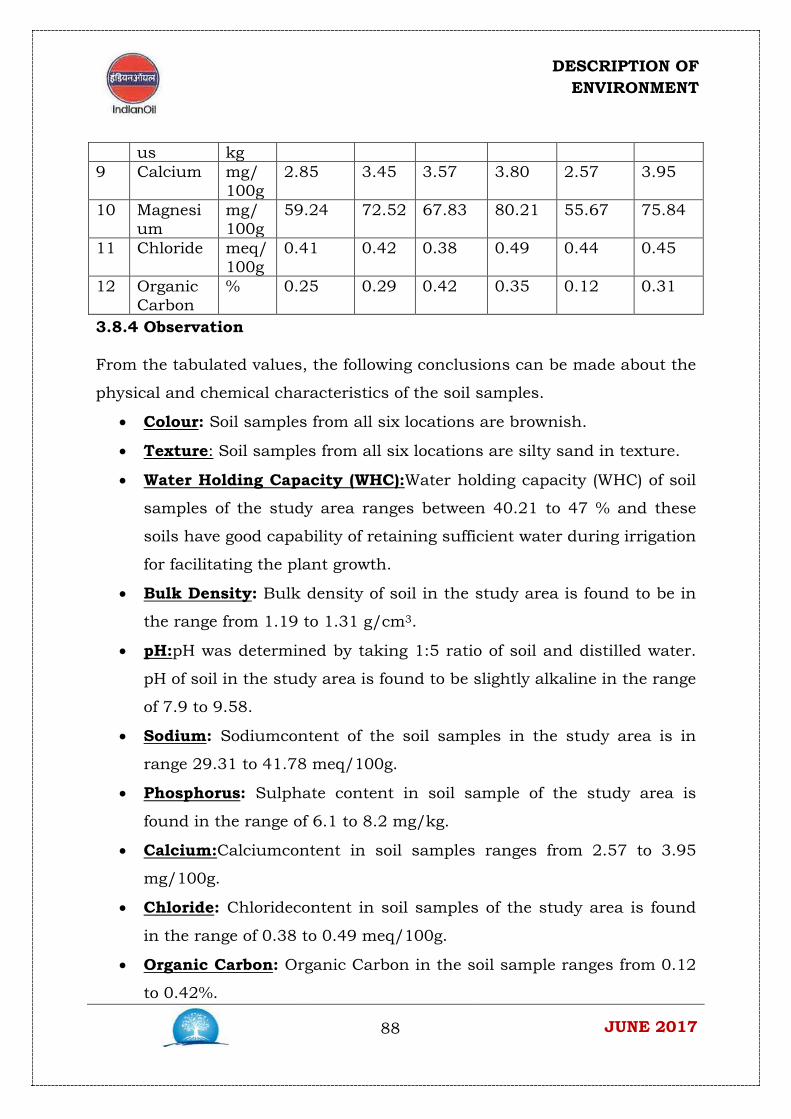
DESCRIPTION OF ENVIRONMENT
88 JUNE 2017
us kg 9 Calcium mg/
100g 2.85 3.45 3.57 3.80 2.57 3.95
10 Magnesium
mg/ 100g
59.24 72.52 67.83 80.21 55.67 75.84
11 Chloride meq/100g
0.41 0.42 0.38 0.49 0.44 0.45
12 Organic Carbon
% 0.25 0.29 0.42 0.35 0.12 0.31
3.8.4 Observation
From the tabulated values, the following conclusions can be made about the
physical and chemical characteristics of the soil samples.
• Colour: Soil samples from all six locations are brownish.
• Texture: Soil samples from all six locations are silty sand in texture.
• Water Holding Capacity (WHC):Water holding capacity (WHC) of soil
samples of the study area ranges between 40.21 to 47 % and these
soils have good capability of retaining sufficient water during irrigation
for facilitating the plant growth.
• Bulk Density: Bulk density of soil in the study area is found to be in
the range from 1.19 to 1.31 g/cm3.
• pH:pH was determined by taking 1:5 ratio of soil and distilled water.
pH of soil in the study area is found to be slightly alkaline in the range
of 7.9 to 9.58.
• Sodium: Sodiumcontent of the soil samples in the study area is in
range 29.31 to 41.78 meq/100g.
• Phosphorus: Sulphate content in soil sample of the study area is
found in the range of 6.1 to 8.2 mg/kg.
• Calcium:Calciumcontent in soil samples ranges from 2.57 to 3.95
mg/100g.
• Chloride: Chloridecontent in soil samples of the study area is found
in the range of 0.38 to 0.49 meq/100g.
• Organic Carbon: Organic Carbon in the soil sample ranges from 0.12
to 0.42%.

DESCRIPTION OF ENVIRONMENT
89 JUNE 2017
3.9 Socio Economic Environment
The Baseline Demographic and Socio economic characteristics with
regards to demography, literacy and occupational status have been
described, based on the Primary Census Abstract, 2011, while the relevant
details of the Infrastructure Facilities have also been extracted from the
Primary Census Abstract, 2011. The proposed project is located at village
Baljatan, tehsil Matlauda, and district Panipat in the state of Haryana. The
study area comprises of 25 villages, a small part of town under Panipat
Municipal Committee which falls in urban category. Socio-economic studies
for this small urban area have not been undertaken. Demographic
characteristics in terms of population and list of villages are given in Table
3.16
Table 3.16 : Population Details
Name of Village No. of House Holds
Total Populatio
n
Male Population
Female Population
Rairkalan 1068 5399 2877 2522 Baljattan 512 3045 1595 1450 Kurana 143 725 415 310 Begampur 143 725 415 310 Razapur 596 3327 1737 1590 Sithana 1100 5722 3035 2687 Mahmadpur 397 2085 1101 984 Sikanderpur 1727 8894 4844 4050 Panipat Taraf Ansar 8828 42877 22967 19910 Shodapur 1219 6423 3458 2965 Faridpur 484 2237 1204 1033 Kachrauli 1074 5400 2869 2531 Badauli 749 3822 2020 1802 Gudha 785 4180 2207 1973 Kutana 449 2307 1182 1125 Nauhra 749 3822 2020 1802 Assan Kalan 919 4960 2588 2372 Asan Khurd 1511 6873 3767 3106

DESCRIPTION OF ENVIRONMENT
90 JUNE 2017
Mahayudinpur Thirana
362 1905 1023 882
Shadipur 5 21 8 13 Shera 757 4062 2185 1877 Khandra 392 2153 1181 972 Dharam Garh 609 3248 1726 1522 Munak 2088 11507 6050 5457 Babarpur 385 1902 1030 878 Dadlana 2922 11413 6181 5232
Total 29973 149040 79685 69355
The study area is moderately populated with the total population of
1, 49,040 (as per 2011 Census). Scheduled Caste (SC) population is about
24.26% of the total population. As per 2011 Census, Scheduled Tribe (ST)
population is not found in the study area. The sex ratio is about 858 females
per 1000 males. The overall literacy rate is about 54.8%. Male literacy rate is
34.1% and female literacy rate is 20.7%. The primary sources of drinking
water are tube wells and water supply facilities.
3.9.1 Demographic Aspects
Distribution of Population
The total population of the study area was 1, 49,040 as per Census Data of
2011. The distribution of the total population in the study area is presented
in Table 3.17
Table 3.17 : Population Distribution
Particulars Number No of households 29973 Total Population 149040 Male Population 79685
Female Population 69355
Social Structure
In 2011, about 26% of the total population belonged to Scheduled Castes
(SC). No Scheduled Tribes (ST) in the study area.
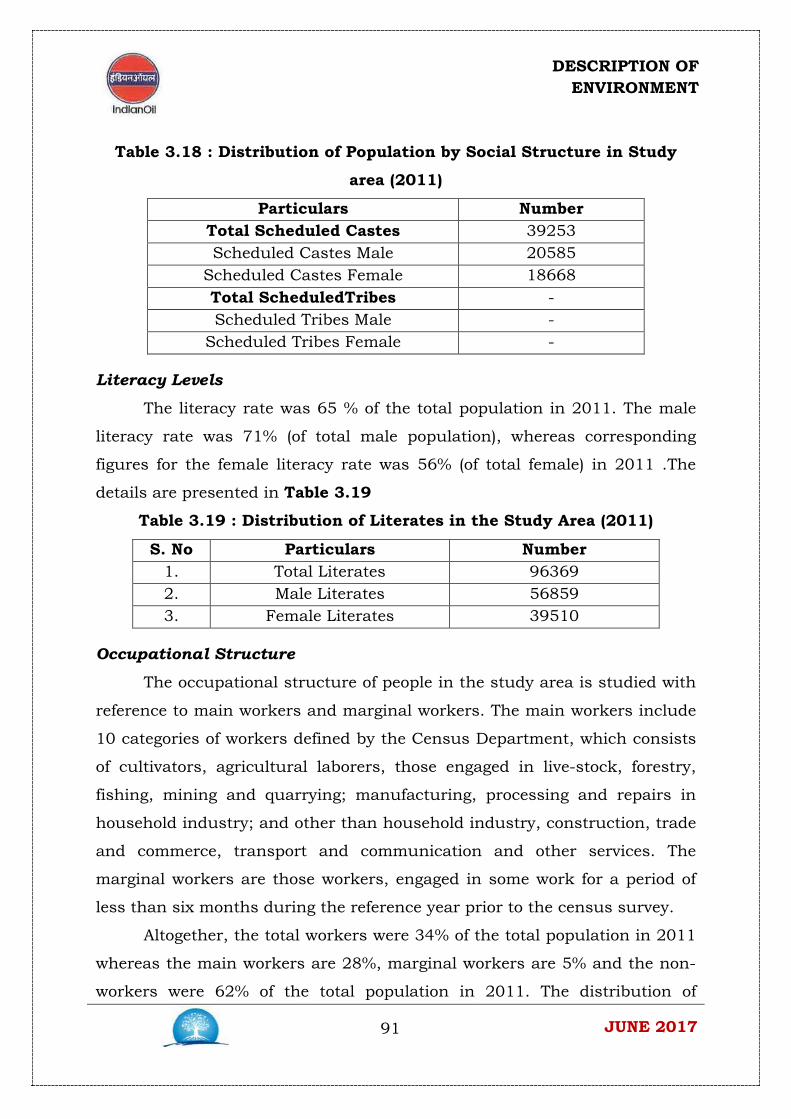
DESCRIPTION OF ENVIRONMENT
91 JUNE 2017
Table 3.18 : Distribution of Population by Social Structure in Study
area (2011)
Particulars Number Total Scheduled Castes 39253 Scheduled Castes Male 20585
Scheduled Castes Female 18668 Total ScheduledTribes - Scheduled Tribes Male -
Scheduled Tribes Female -
Literacy Levels
The literacy rate was 65 % of the total population in 2011. The male
literacy rate was 71% (of total male population), whereas corresponding
figures for the female literacy rate was 56% (of total female) in 2011 .The
details are presented in Table 3.19
Table 3.19 : Distribution of Literates in the Study Area (2011)
S. No Particulars Number 1. Total Literates 96369 2. Male Literates 56859 3. Female Literates 39510
Occupational Structure
The occupational structure of people in the study area is studied with
reference to main workers and marginal workers. The main workers include
10 categories of workers defined by the Census Department, which consists
of cultivators, agricultural laborers, those engaged in live-stock, forestry,
fishing, mining and quarrying; manufacturing, processing and repairs in
household industry; and other than household industry, construction, trade
and commerce, transport and communication and other services. The
marginal workers are those workers, engaged in some work for a period of
less than six months during the reference year prior to the census survey.
Altogether, the total workers were 34% of the total population in 2011
whereas the main workers are 28%, marginal workers are 5% and the non-
workers were 62% of the total population in 2011. The distribution of
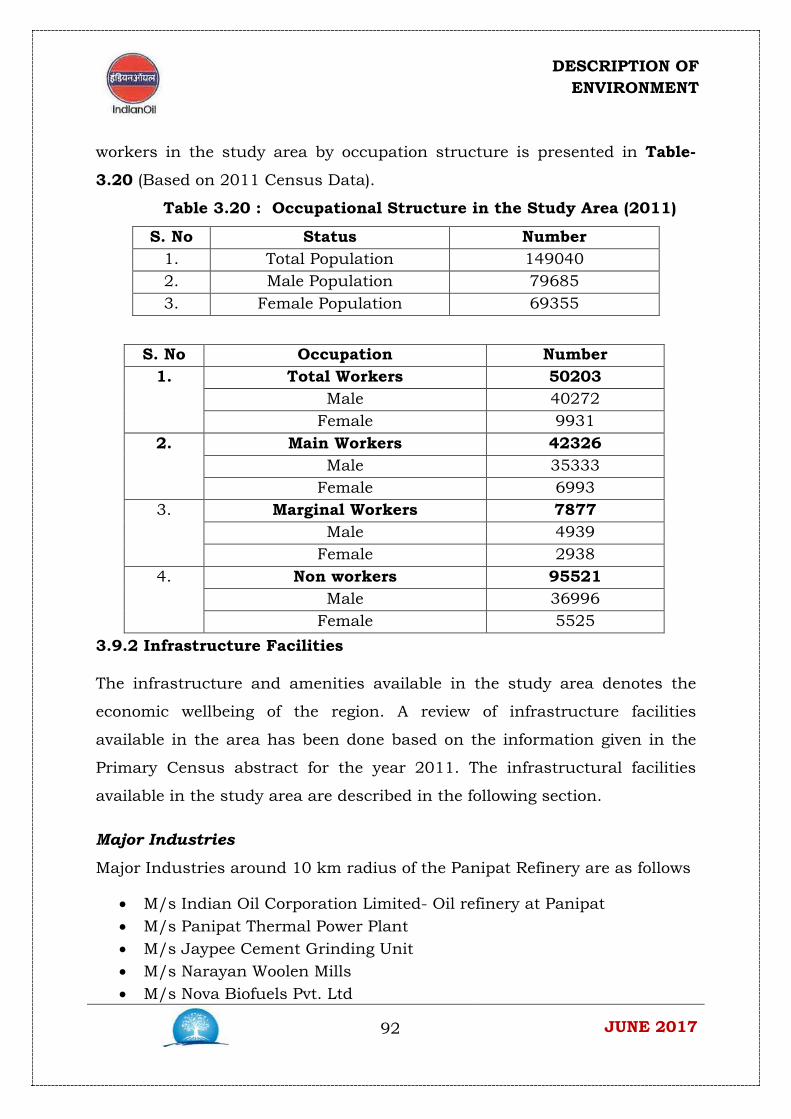
DESCRIPTION OF ENVIRONMENT
92 JUNE 2017
workers in the study area by occupation structure is presented in Table-
3.20 (Based on 2011 Census Data).
Table 3.20 : Occupational Structure in the Study Area (2011)
S. No Status Number 1. Total Population 149040 2. Male Population 79685 3. Female Population 69355
S. No Occupation Number 1. Total Workers 50203
Male 40272 Female 9931
2. Main Workers 42326 Male 35333
Female 6993 3. Marginal Workers 7877
Male 4939 Female 2938
4. Non workers 95521 Male 36996
Female 5525 3.9.2 Infrastructure Facilities
The infrastructure and amenities available in the study area denotes the
economic wellbeing of the region. A review of infrastructure facilities
available in the area has been done based on the information given in the
Primary Census abstract for the year 2011. The infrastructural facilities
available in the study area are described in the following section.
Major Industries
Major Industries around 10 km radius of the Panipat Refinery are as follows
• M/s Indian Oil Corporation Limited- Oil refinery at Panipat • M/s Panipat Thermal Power Plant • M/s Jaypee Cement Grinding Unit • M/s Narayan Woolen Mills • M/s Nova Biofuels Pvt. Ltd
DESCRIPTION OF ENVIRONMENT
93 JUNE 2017
Educational Facilities
The educational facilities are almost evenly distributed in the area. In all,
there are 42 primary schools, 27 middle schools and a few other educational
institutions in the rural sector of the study area. Higher education facilities
are available in the urban sector of the study area.
Medical Facilities
Medical facility in some form or the other is available to the population
residing with the rural segment of the study area. However, medical facilities
i.e. Hospitals, Nursing Homes, Health Centers etc. are readily available
within the urban segment of the study area.
Drinking Water Facilities
Tap water or ground water is being used in the different villages located in
the rural sector of theconcerned C.D Blocks. As per 2011 Census, total 41
wells and 47 tanks is within the rural area.In the urban area tube well and
tap water are the sources of drinking water.
Electricity
Most of the villages in the concerned C.D Blocks have electricity available for
domestic purposes.
Communication Transport & Access Facilities
Around 70% of the villages in the concerned C.D Blocks have post office
available within 10 km distance. Pucca road is available in all the villages in
the study area. In the urban area surface rail, taxies, buses and auto-
rickshaws etc. are available for communication.
3.9.2 Traffic Analysis
IOCL Panipat refinery is of 253 acres land attached to the NH 115, NH
114.The Refinery has a well-developed infrastructure for utilities. PR has
already provided internally the facility for parking of vehicles, tankers Buses

DESCRIPTION OF ENVIRONMENT
94 JUNE 2017
and trucks.The proposed project surroundings already has general
infrastructure facilities for dispatch of products, approach road.No roads are
designed with sharp/curved turns in the company premises. The majorpart
of transportation of raw products and manufactured products is done
bypipeline. Hence there are no chances of trafficcongestion within and
outside the Refinery premises.
Figure 3.6: Site Connectivity
3.10Ecology
Study was carried out through field survey along with literature
reviews/desk research to understand the ecological (both terrestrial and
aquatic) condition of the study area (December 2016- February 2017).
The concept of ecology has been increasingly used as conceptual focus
for conservation policy and to measure species extinction and ecosystem
loss in response to natural and human induced selection pressures. Thus,
in any environmental analysis where integration of ecological thoughts into
planning process is required, such kind of analysis of biological
DESCRIPTION OF ENVIRONMENT
95 JUNE 2017
environmental status survey is very significant. So, this type of assessment
includes evaluation of both the terrestrial & aquatic ecology.
3.10.1 Study Methodology
Biological environment is a good bio-indicator of changing
environmental quality. Reconnaissance survey was undertaken around the
proposed project site. In the present survey 10 km radius area around the
project site was considered as study area. Both terrestrial and aquatic
ecological analysis was carried out in the field and in the laboratory.
Assessment of flora and fauna was undertaken in the study area. The field
study was undertaken during December 2016.
In addition to the field study, literature review /desk research was
carried out to determine the existing conditions within the study area and to
identify habitats and species of potential importance that may be affected by
the Project.
The following parameters were primarily considered in the study.
• Assessment of present state of vegetation, flora and fauna in the study
area.
• Collection of data from literature about the flora and faunal accounts
• Identification of rare endangered plants and animal species (if any).
• Identification of important plants/animal species having diverse
economic values.
3.10.2 Terrestrial Ecology The natural flora and fauna of the land habitats constitute terrestrial
ecosystem. The study of terrestrial ecosystem is important as a part of the
monitoring environmental changes. Due to rapid industrialization, currently
the ecological status of an area changed dramatically. Thus impact
evaluation of any developmental activities is highly essential with a view to
formulation of migratory plan layout.
DESCRIPTION OF ENVIRONMENT
96 JUNE 2017
A) Floral Survey
Though natural vegetation of this area is very poor except some
degraded patches of evergreen scrub or thorny forests, but overall floral
diversity is fairly high. The major components of natural forest are Dhak of
Palas (Butea monosperma), Jand (Prosopis cineraria), Kaur (Capparis
decidua), Hins (Capperis sepraria), Kikar (Acacia nilotica) and Datepalm
(Phoenix sylvestris).
During present field survey, a large number of plant species were
recorded in different habitats. They are listed. There is no rare and
endangered plant species in the present study area.
B) Plantation Forestry
As the natural forest area was currently very poor in this district,
enormous attempt has been made for raising plantation forestry in Govt. as
well as private land either through social forestry programme or by
organized strip plantation by the forest department. Over last two decades
such attempts were undertaken. Many fast-growing trees, ornamental
plants and also fruit trees were planted through these programs. Usually
through mass strip plantation programme along the railway line, road, canal
bank, drain bank, and also even in degraded notified forest land, a
considerable volume of wood biomass was expected in this area. Four major
plant categories were used for this purpose viz. Shisam, Kikar, Eucalyptus,
and other mixed types.
In addition various private land and also panchayat areas were taken
up for social forestry programs. A total of more than twenty five plant
species were regularly utilized for planting in this programme during onset
on monsoon period. The details of plant species used in the social forestry
programs are given in the Table-3.22. Among them once again the most
prevalent species that are used for these purposes were Kikar, Eucalyptus,
Khair, Shisham, Teak and Neem.

DESCRIPTION OF ENVIRONMENT
97 JUNE 2017
Plants of Economic Importance
A good number of plants found in this area having enormous
importance as medicine & other allied uses. There are listed in
Table3.23However none of the plants can be considered as rare &
endangered as suggested by IUCN. There is no wild germplasm stock in the
area under survey.
C) Faunal Survey
The project site proper proposed is currently under extensive
cultivation. There were isolated trees, canal bank strip plantations, and
thorny scrub vegetation remnants in the peripheral regions. However, in the
buffer region (i.e. around 20 kms from the site) a good number of village
settlements with small orchards, industrial complexes like refineries,
thermal power plant and urban settlement areas like Panipat Township.
There were scattered plantation in the industrial leasehold areas, upland
cultivated area, small village orchards, and strip plantation also along the
canals, roads etc. There is no trace of reserve forest or protected forest
except patchy remnants of thorny deciduous forest patch. There were
scattered marshes, irrigation canals and a few ponds particularly in and
around villages.
The afforested habitats provide resource for good number of faunal
livelihood. The major faunal records were made here on the basis of the
current field visits done. The details are given in the Table-3.24. On the
whole it reveals that a sizeable number of animal species comprising of two
amphibian, four reptiles, fourty eight birds and eight mammals were quite
common to this area.
As the original habitat was very much transformed for agriculture and
there were continuous industrialization in this area, the faunal diversities
were very much disturbed. In spite of these facts birds were most prevalent
in this area. The most abundantly noticed birds are Cattle Egret, Pariah
Kite, Red Wattled Lapwing, Pigeon, Bawk Moyna and Redvented Bulbul.

DESCRIPTION OF ENVIRONMENT
98 JUNE 2017
D) Endangered Animals
There is no wildlife sanctuary or national park in and around the
study area. However, none of the species recorded so far in the faunal
diversity list appears to be endangered animals except monitor lizard and
pea fowl, whose occurrence is now threatened due to poaching for
commercial purpose.
E) Agriculture
The present study area and so also the entire Panipat District of
Haryana is one of the prime agricultural divisions of the country, where
most of the land is under cultivation. Quite a good number of crops were
grown in this area. The major crops are paddy, jowar, bajra, makai and
sugarcane in kharif seasons, while that of rabi seasons crops are wheat,
barley, sunflower, arahar, mung, chana, masoor, rapeseed, pea and
barseem. The average yield rate of paddy and wheat are 20-25 Q/hect and
36-37 Q/hect respectively. The cultivation in this area is highly mechanized
and there is profound facilities for canal and deep tube well irrigation. As
per present record a total of over 27,000 tube wells were installed in this
district. The farmers also use both chemical and bio-fertilizer in adequate
quantity.
3.10.3 Aquatic Ecology
There are a number of canals and drains connected with river
Yamuna. Over 350 pond of small and medium size of which, 50% dry up
during dry months. Aquatic biotic communities like Phytoplankton and
Zooplanktons, Macrophytes and Fishes were studied.
A) Macrophytes
For studies on Macrophytes, marsh areas, canal and drains, water
bodies of different size were surveyed within the radius of about 10 km from
the proposed site. A check list of macrophytes is given in the Table.3.25
DESCRIPTION OF ENVIRONMENT
99 JUNE 2017
Among them water hyacinth, duckweed and hogla plants were most
common.
B) Planktons
Four sites were selected for plankton analysis. These are (i) Western
Yamuna Canal (near Munak village) as upstream point, (ii) Western Yamuna
Canal (near Sithana village) as downstream point, (iii) one pond near Kabri
village and (iv) Drain no – 2 near IOCL Refinery. The detail of planktonic
diversities and their population load (no/lit) is given in Table-3.26
C) Fishes
A total of species of fishes were recorded as exists in different types of
water bodies in the study area. A checklist of fish species is given in the
Table-3.27. Among the fishes, four common carps are cultured in village
ponds and jheels, white both carps and other catfishes were found in the
rivers and canal system.
Fisheries
The pisciculture activities were restricted only in the Yamuna River,
canals and village ponds. The culture fisheries were common practices in
the confined water bodies over the years. Transported fish seeds core
supplied by State Fisheries Department to the villagers and commercial
entrepreneurs for pisciculture in confined water bodies. The yield rate is
fairly high. The major carps like Rahu (Labeo rohita), Catla (Catla catla),
Mrigal (Cirrhina mrigala) and Cyprinus carp (Cyprinus carpio) were primarily
cultured.
With respect to capture fisheries, a good number of fishes were reported to
be captured from rivers and canal system in particulars. The major fishes
were species of Mystus, Channa, Silonia, Rita and Puntius etc.
Table 3.21 : Floral Checklist of the Study area
S. No
Scientific Name Local Name Family Habitats Occurrence
A) Trees 1 Acacia nilotica Kikar Fabaceaae 1,2

DESCRIPTION OF ENVIRONMENT
100 JUNE 2017
2 Acacia Senegal Khairi Leguminosae 1 3 Albizia lebbek Kala siris Leguminosae 2 4 Albizia procera Safed siris Leguminosae 2 5 Alslonia
scholoris Chatim Apocyanaceae 2,3
6 Ailanthes excelsa
Aruna Simarubiacene 2
7 Azadiracta indica
Neem Meliaceae 2
8 Banhinia purpurea
Kachnar Leguminosae 2
9 Bomax ceiba Simal 10 Butea
monosperma Dhak Leguminosae 1,2
11 Cassia fistula Amaltas Leguminosae 2,6 12 Cassia siamea -- Legminosae 2,6 13 Casuarina
equisetifolia Jau Casuarinaceae 2,6
14 Callistemon speciosus
-- Myrfaceae 2,6
15 Crataeva nurvala
Barna Capparidaceae 1
16 Dalbergia sissoo Shisham Leguminosae 1,2,6 17 Delonix regia Gulmohar Leguminosae 2,6 18 Diospyros
cordifolia Bistendu Ebenaceae 2
19 Erythrina arborescens
Mother Leguminosae 2,6
20 Eucalyptus globosus
-- Mytraceae 2,3,6
21 Ficus bengalensis
Bargad Urticaceae 2,6
22 Ficus religiosa Pipal Urticaceae 2,6 23 Ficus palmata Anjir Urticaceae 2 24 Ficus glomerata Gullor Urticaceae 2 25 Holoptelea
integrifolia Papri Urticaceae 2,6
26 Inga dulcis Wilayli Imli
Leguminosae 2,3,6
27 Leucaena leucocephala
Subabul Leguminosae 2,3
28 Magnolia champaka
Champ Magnoliaceae 6
29 Mangifera indica Am Anacardiaceae 2,6
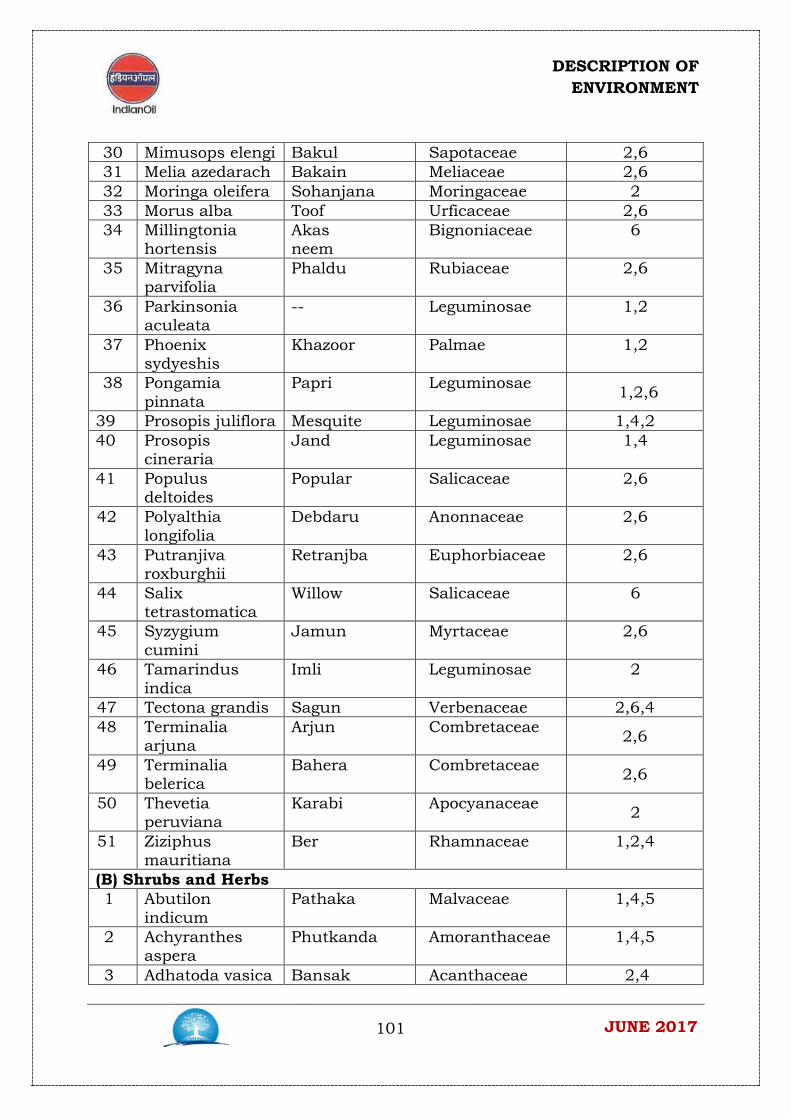
DESCRIPTION OF ENVIRONMENT
101 JUNE 2017
30 Mimusops elengi Bakul Sapotaceae 2,6 31 Melia azedarach Bakain Meliaceae 2,6 32 Moringa oleifera Sohanjana Moringaceae 2 33 Morus alba Toof Urficaceae 2,6 34 Millingtonia
hortensis Akas neem
Bignoniaceae 6
35 Mitragyna parvifolia
Phaldu Rubiaceae 2,6
36 Parkinsonia aculeata
-- Leguminosae 1,2
37 Phoenix sydyeshis
Khazoor Palmae 1,2
38 Pongamia pinnata
Papri Leguminosae 1,2,6
39 Prosopis juliflora Mesquite Leguminosae 1,4,2 40 Prosopis
cineraria Jand Leguminosae 1,4
41 Populus deltoides
Popular Salicaceae 2,6
42 Polyalthia longifolia
Debdaru Anonnaceae 2,6
43 Putranjiva roxburghii
Retranjba Euphorbiaceae 2,6
44 Salix tetrastomatica
Willow Salicaceae 6
45 Syzygium cumini
Jamun Myrtaceae 2,6
46 Tamarindus indica
Imli Leguminosae 2
47 Tectona grandis Sagun Verbenaceae 2,6,4 48 Terminalia
arjuna Arjun Combretaceae 2,6
49 Terminalia belerica
Bahera Combretaceae 2,6
50 Thevetia peruviana
Karabi Apocyanaceae 2
51 Ziziphus mauritiana
Ber Rhamnaceae 1,2,4
(B) Shrubs and Herbs 1 Abutilon
indicum Pathaka Malvaceae 1,4,5
2 Achyranthes aspera
Phutkanda Amoranthaceae 1,4,5
3 Adhatoda vasica Bansak Acanthaceae 2,4
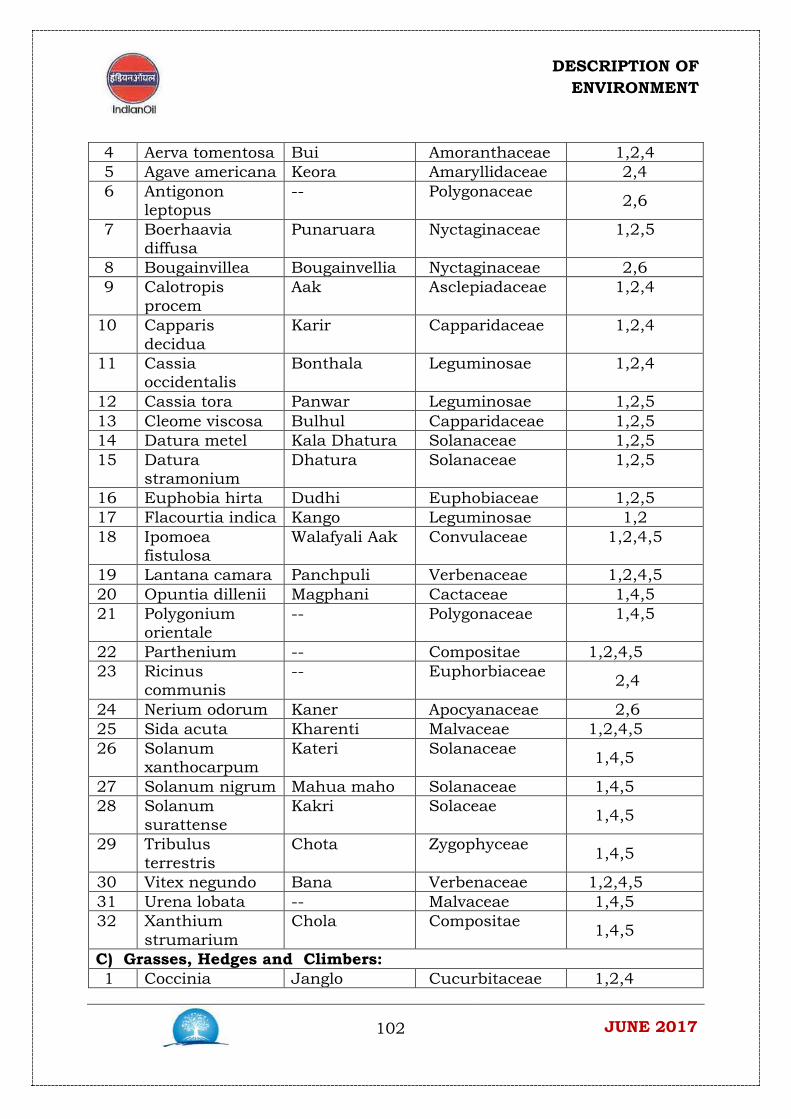
DESCRIPTION OF ENVIRONMENT
102 JUNE 2017
4 Aerva tomentosa Bui Amoranthaceae 1,2,4 5 Agave americana Keora Amaryllidaceae 2,4 6 Antigonon
leptopus -- Polygonaceae 2,6
7 Boerhaavia diffusa
Punaruara Nyctaginaceae 1,2,5
8 Bougainvillea Bougainvellia Nyctaginaceae 2,6 9 Calotropis
procem Aak Asclepiadaceae 1,2,4
10 Capparis decidua
Karir Capparidaceae 1,2,4
11 Cassia occidentalis
Bonthala Leguminosae 1,2,4
12 Cassia tora Panwar Leguminosae 1,2,5 13 Cleome viscosa Bulhul Capparidaceae 1,2,5 14 Datura metel Kala Dhatura Solanaceae 1,2,5 15 Datura
stramonium Dhatura Solanaceae 1,2,5
16 Euphobia hirta Dudhi Euphobiaceae 1,2,5 17 Flacourtia indica Kango Leguminosae 1,2 18 Ipomoea
fistulosa Walafyali Aak Convulaceae 1,2,4,5
19 Lantana camara Panchpuli Verbenaceae 1,2,4,5 20 Opuntia dillenii Magphani Cactaceae 1,4,5 21 Polygonium
orientale -- Polygonaceae 1,4,5
22 Parthenium -- Compositae 1,2,4,5 23 Ricinus
communis -- Euphorbiaceae 2,4
24 Nerium odorum Kaner Apocyanaceae 2,6 25 Sida acuta Kharenti Malvaceae 1,2,4,5 26 Solanum
xanthocarpum Kateri Solanaceae 1,4,5
27 Solanum nigrum Mahua maho Solanaceae 1,4,5 28 Solanum
surattense Kakri Solaceae 1,4,5
29 Tribulus terrestris
Chota Zygophyceae 1,4,5
30 Vitex negundo Bana Verbenaceae 1,2,4,5 31 Urena lobata -- Malvaceae 1,4,5 32 Xanthium
strumarium Chola Compositae 1,4,5
C) Grasses, Hedges and Climbers: 1 Coccinia Janglo Cucurbitaceae 1,2,4
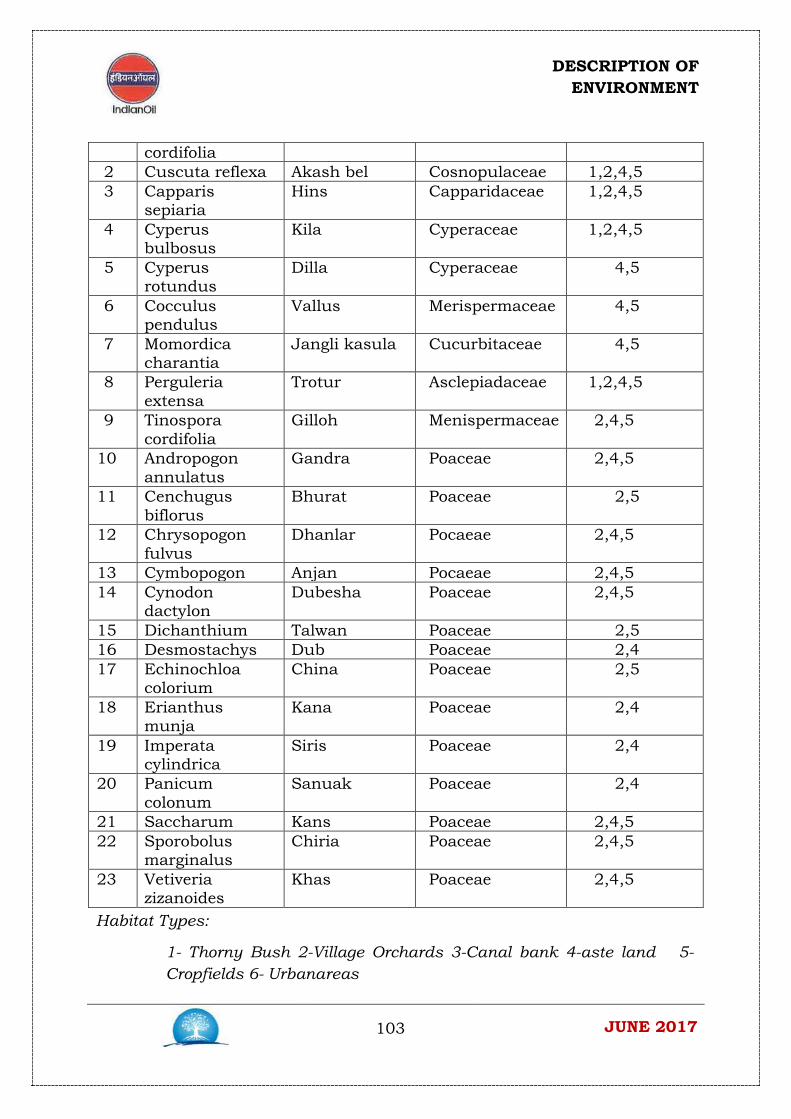
DESCRIPTION OF ENVIRONMENT
103 JUNE 2017
cordifolia 2 Cuscuta reflexa Akash bel Cosnopulaceae 1,2,4,5 3 Capparis
sepiaria Hins Capparidaceae 1,2,4,5
4 Cyperus bulbosus
Kila Cyperaceae 1,2,4,5
5 Cyperus rotundus
Dilla Cyperaceae 4,5
6 Cocculus pendulus
Vallus Merispermaceae 4,5
7 Momordica charantia
Jangli kasula Cucurbitaceae 4,5
8 Perguleria extensa
Trotur Asclepiadaceae 1,2,4,5
9 Tinospora cordifolia
Gilloh Menispermaceae 2,4,5
10 Andropogon annulatus
Gandra Poaceae 2,4,5
11 Cenchugus biflorus
Bhurat Poaceae 2,5
12 Chrysopogon fulvus
Dhanlar Pocaeae 2,4,5
13 Cymbopogon Anjan Pocaeae 2,4,5 14 Cynodon
dactylon Dubesha Poaceae 2,4,5
15 Dichanthium Talwan Poaceae 2,5 16 Desmostachys Dub Poaceae 2,4 17 Echinochloa
colorium China Poaceae 2,5
18 Erianthus munja
Kana Poaceae 2,4
19 Imperata cylindrica
Siris Poaceae 2,4
20 Panicum colonum
Sanuak Poaceae 2,4
21 Saccharum Kans Poaceae 2,4,5 22 Sporobolus
marginalus Chiria Poaceae 2,4,5
23 Vetiveria zizanoides
Khas Poaceae 2,4,5
Habitat Types:
1- Thorny Bush 2-Village Orchards 3-Canal bank 4-aste land 5-Cropfields 6- Urbanareas
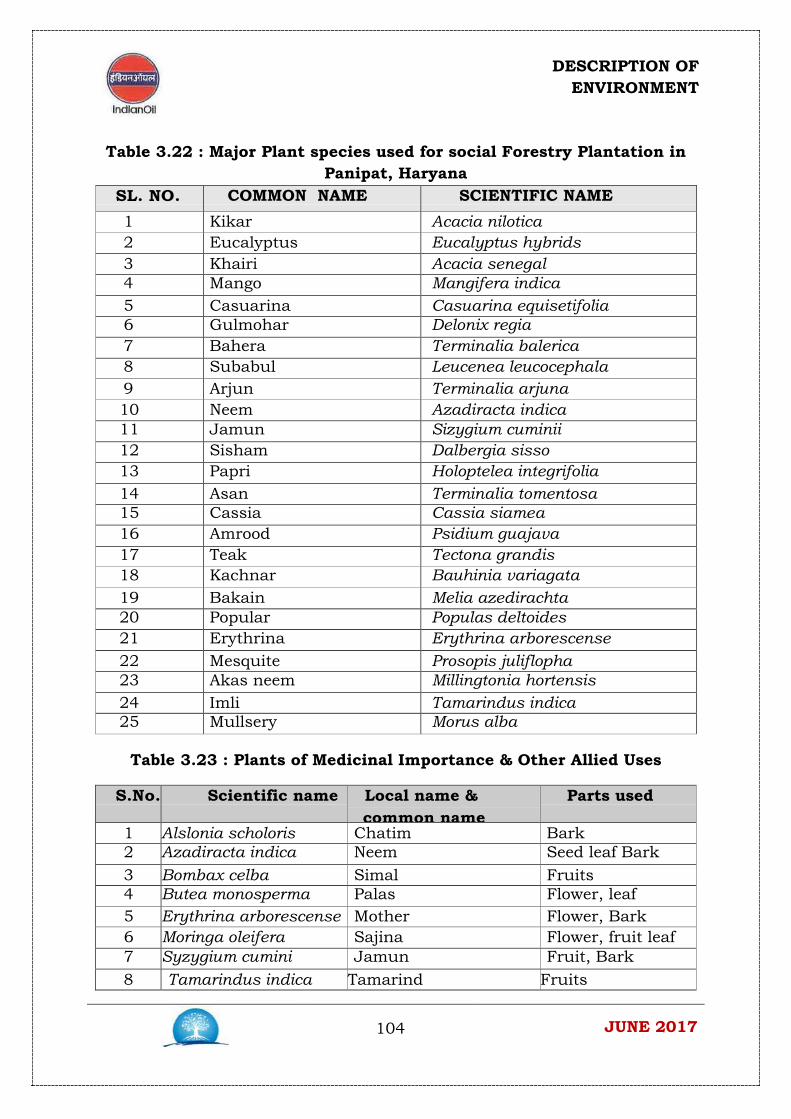
DESCRIPTION OF ENVIRONMENT
104 JUNE 2017
Table 3.22 : Major Plant species used for social Forestry Plantation in Panipat, Haryana
SL. NO. COMMON NAME SCIENTIFIC NAME 1 Kikar Acacia nilotica 2 Eucalyptus Eucalyptus hybrids 3 Khairi Acacia senegal 4 Mango Mangifera indica 5 Casuarina Casuarina equisetifolia 6 Gulmohar Delonix regia 7 Bahera Terminalia balerica 8 Subabul Leucenea leucocephala 9 Arjun Terminalia arjuna 10 Neem Azadiracta indica 11 Jamun Sizygium cuminii 12 Sisham Dalbergia sisso 13 Papri Holoptelea integrifolia 14 Asan Terminalia tomentosa 15 Cassia Cassia siamea 16 Amrood Psidium guajava 17 Teak Tectona grandis 18 Kachnar Bauhinia variagata 19 Bakain Melia azedirachta 20 Popular Populas deltoides 21 Erythrina Erythrina arborescense 22 Mesquite Prosopis juliflopha 23 Akas neem Millingtonia hortensis 24 Imli Tamarindus indica 25 Mullsery Morus alba
Table 3.23 : Plants of Medicinal Importance & Other Allied Uses
S.No. Scientific name Local name & common name
Parts used
1 Alslonia scholoris Chatim Bark 2 Azadiracta indica Neem Seed leaf Bark 3 Bombax celba Simal Fruits 4 Butea monosperma Palas Flower, leaf 5 Erythrina arborescense Mother Flower, Bark 6 Moringa oleifera Sajina Flower, fruit leaf 7 Syzygium cumini Jamun Fruit, Bark 8 Tamarindus indica Tamarind Fruits

DESCRIPTION OF ENVIRONMENT
105 JUNE 2017
9 Terminalia arjuna Arjun Bark 10 Terminalia balerica Bahera Fruit, Bark 11 Thevetia nerifolia Karabi Fruit 12 Zizyphus mauritiana Ber Fruit 13 Achyranthes aspera Phutkanda Stem, root 14 Adhatoda vasica Basaka Leaf 15 Datura metal Dhutra Seeds 16 Sida acuta Kharenti Whole Plant 17 Solanum
th Kateri Fruit
18 Tribulos terrestris Chota Cokhru Whole plant 19 Vitex negundo Nisenda Leaf 20 Vertiveria zizanoides Khas Root
Table 3.24 : Record of Major Faunal Diversity in Study Area S. No Common name Scientific name Distribution (A) Amphibia
1 Cricket Frog Rana limnocharis C 2 Frog Rana tigrina C
(B) Reptilia 1 Garden Lizard Calotes sp C 2 Monitor Lizard Varanus sp C 3 Common Krait Bungarus caeruleus C 4 Rat Snake Ptyas mucosus C
(C) Aves 1 Dabchick Podiceps ruficollis O 2 Cormorant Phalacrocorax sp O 3 Purple Heron Ardea purpurea O 4 Pond Heron Ardeola grayii C 5 Cattle Egret Bubulcus ibis V 6 Large/Int. Egret Ardea/ Egretta sp O 7 Openbill Stark Anastomus oscitans O 8 Black Ibis Pseudibis papillosa O 9 Whistling Teal Dendrocygna sp O
10 Pariah Kite Milvus migrans V 11 Scavenger Vulture Neophron percnopterus O 12 Partridge Francolinus sp O 13 Peafowl Pavo cristatus O 14 Blackwinged stilt Himantopus C 15 Redwattled Lapwing Vanellus indicus V 16 Blue Rock Pigeon Columba livia V 17 Ring Dove Streptopelia decaocto V 18 Roseringed Parakeet Psittacula krameri C 19 Koel Eudynamys O 20 Crow-Phosant Centropus sinensis O 21 Lesser Pied Kingfisher Ceryle rudis O 22 White breasted Halcyon smyrnensis C
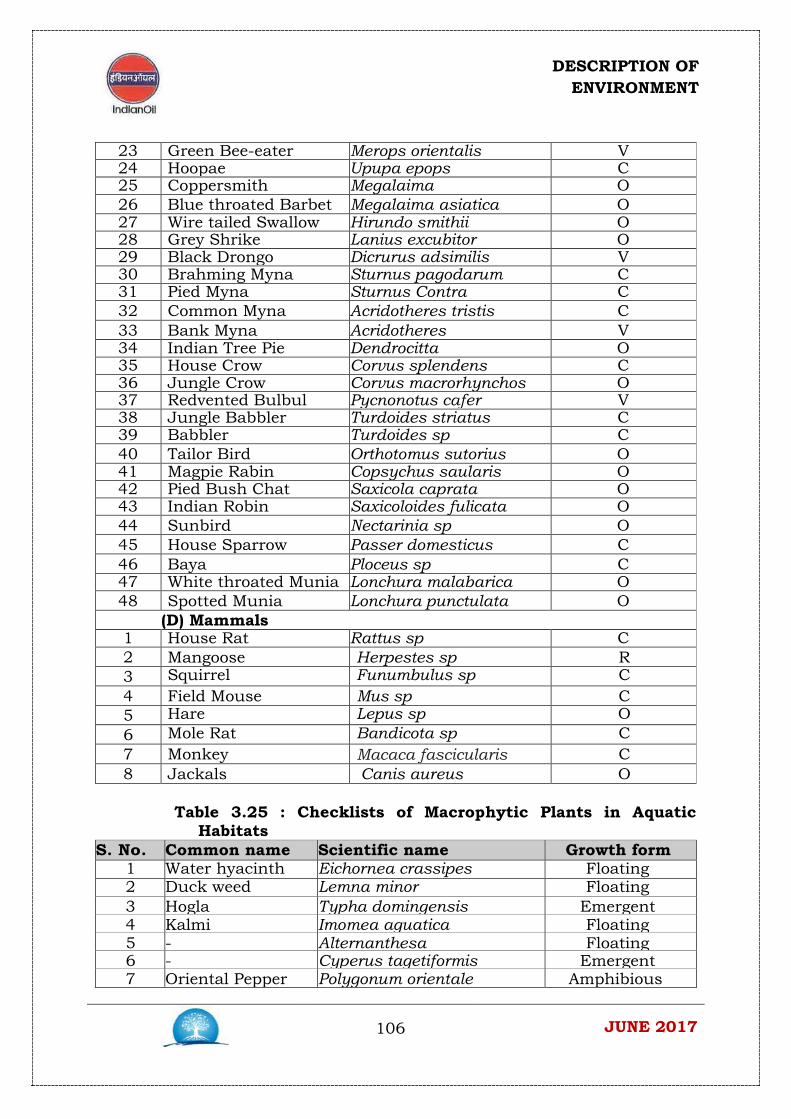
DESCRIPTION OF ENVIRONMENT
106 JUNE 2017
23 Green Bee-eater Merops orientalis V 24 Hoopae Upupa epops C 25 Coppersmith Megalaima O 26 Blue throated Barbet Megalaima asiatica O 27 Wire tailed Swallow Hirundo smithii O 28 Grey Shrike Lanius excubitor O 29 Black Drongo Dicrurus adsimilis V 30 Brahming Myna Sturnus pagodarum C 31 Pied Myna Sturnus Contra C 32 Common Myna Acridotheres tristis C 33 Bank Myna Acridotheres V 34 Indian Tree Pie Dendrocitta O 35 House Crow Corvus splendens C 36 Jungle Crow Corvus macrorhynchos O 37 Redvented Bulbul Pycnonotus cafer V 38 Jungle Babbler Turdoides striatus C 39 Babbler Turdoides sp C 40 Tailor Bird Orthotomus sutorius O 41 Magpie Rabin Copsychus saularis O 42 Pied Bush Chat Saxicola caprata O 43 Indian Robin Saxicoloides fulicata O 44 Sunbird Nectarinia sp O 45 House Sparrow Passer domesticus C 46 Baya Ploceus sp C 47 White throated Munia Lonchura malabarica O 48 Spotted Munia Lonchura punctulata O
(D) Mammals 1 House Rat Rattus sp C 2 Mangoose Herpestes sp R 3 Squirrel Funumbulus sp C 4 Field Mouse Mus sp C 5 Hare Lepus sp O 6 Mole Rat Bandicota sp C 7 Monkey Macaca fascicularis C 8 Jackals Canis aureus O
Table 3.25 : Checklists of Macrophytic Plants in Aquatic
Habitats S. No. Common name Scientific name Growth form
1 Water hyacinth Eichornea crassipes Floating 2 Duck weed Lemna minor Floating 3 Hogla Typha domingensis Emergent 4 Kalmi Imomea aguatica Floating 5 - Alternanthesa
Floating
6 - Cyperus tagetiformis Emergent 7 Oriental Pepper Polygonum orientale Amphibious
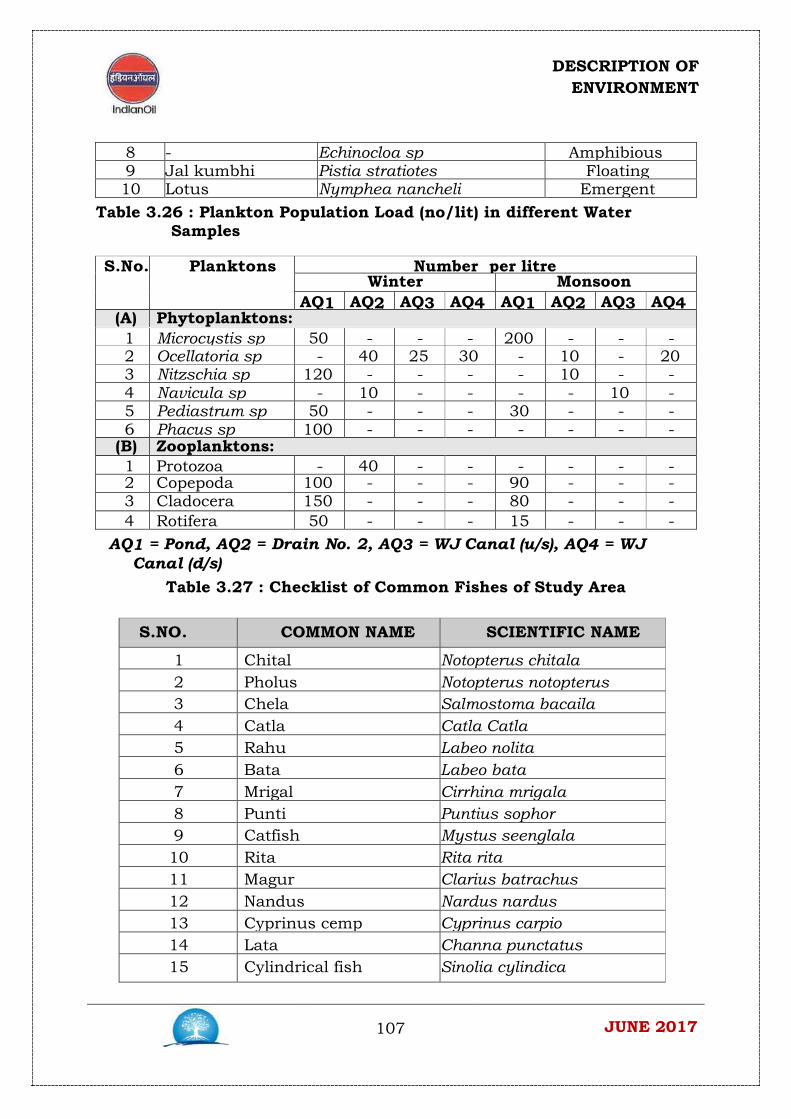
DESCRIPTION OF ENVIRONMENT
107 JUNE 2017
8 - Echinocloa sp Amphibious 9 Jal kumbhi Pistia stratiotes Floating 10 Lotus Nymphea nancheli Emergent
Table 3.26 : Plankton Population Load (no/lit) in different Water Samples
S.No. Planktons Number per litre Winter Monsoon
AQ1 AQ2 AQ3 AQ4 AQ1 AQ2 AQ3 AQ4 (A) Phytoplanktons: 1 Microcystis sp 50 - - - 200 - - - 2 Ocellatoria sp - 40 25 30 - 10 - 20 3 Nitzschia sp 120 - - - - 10 - - 4 Navicula sp - 10 - - - - 10 - 5 Pediastrum sp 50 - - - 30 - - - 6 Phacus sp 100 - - - - - - -
(B) Zooplanktons: 1 Protozoa - 40 - - - - - - 2 Copepoda 100 - - - 90 - - - 3 Cladocera 150 - - - 80 - - - 4 Rotifera 50 - - - 15 - - -
AQ1 = Pond, AQ2 = Drain No. 2, AQ3 = WJ Canal (u/s), AQ4 = WJ Canal (d/s)
Table 3.27 : Checklist of Common Fishes of Study Area
S.NO. COMMON NAME SCIENTIFIC NAME
1 Chital Notopterus chitala 2 Pholus Notopterus notopterus 3 Chela Salmostoma bacaila 4 Catla Catla Catla 5 Rahu Labeo nolita 6 Bata Labeo bata 7 Mrigal Cirrhina mrigala 8 Punti Puntius sophor 9 Catfish Mystus seenglala 10 Rita Rita rita 11 Magur Clarius batrachus 12 Nandus Nardus nardus 13 Cyprinus cemp Cyprinus carpio 14 Lata Channa punctatus 15 Cylindrical fish Sinolia cylindica
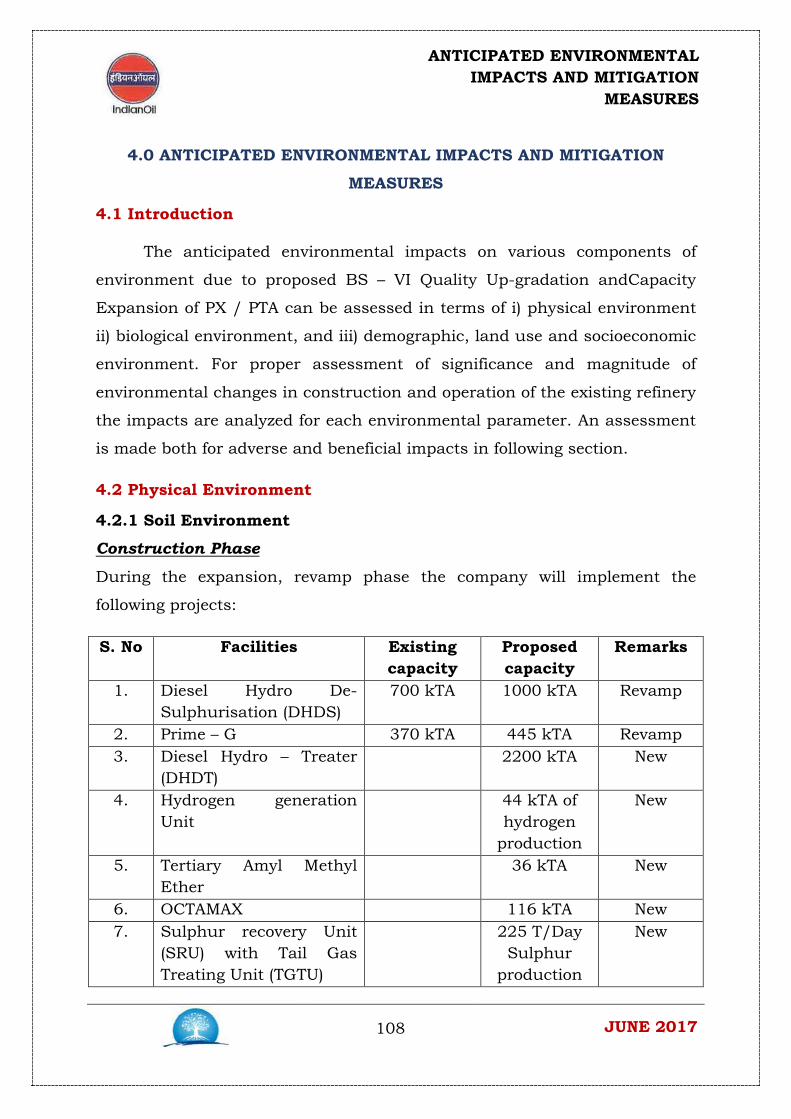
ANTICIPATED ENVIRONMENTAL IMPACTS AND MITIGATION
MEASURES
108 JUNE 2017
4.0 ANTICIPATED ENVIRONMENTAL IMPACTS AND MITIGATION
MEASURES
4.1 Introduction
The anticipated environmental impacts on various components of
environment due to proposed BS – VI Quality Up-gradation andCapacity
Expansion of PX / PTA can be assessed in terms of i) physical environment
ii) biological environment, and iii) demographic, land use and socioeconomic
environment. For proper assessment of significance and magnitude of
environmental changes in construction and operation of the existing refinery
the impacts are analyzed for each environmental parameter. An assessment
is made both for adverse and beneficial impacts in following section.
4.2 Physical Environment
4.2.1 Soil Environment
Construction Phase
During the expansion, revamp phase the company will implement the
following projects:
S. No Facilities Existing capacity
Proposed capacity
Remarks
1. Diesel Hydro De-Sulphurisation (DHDS)
700 kTA 1000 kTA Revamp
2. Prime – G 370 kTA 445 kTA Revamp 3. Diesel Hydro – Treater
(DHDT) 2200 kTA New
4. Hydrogen generation Unit
44 kTA of hydrogen
production
New
5. Tertiary Amyl Methyl Ether
36 kTA New
6. OCTAMAX 116 kTA New 7. Sulphur recovery Unit
(SRU) with Tail Gas Treating Unit (TGTU)
225 T/Day Sulphur
production
New
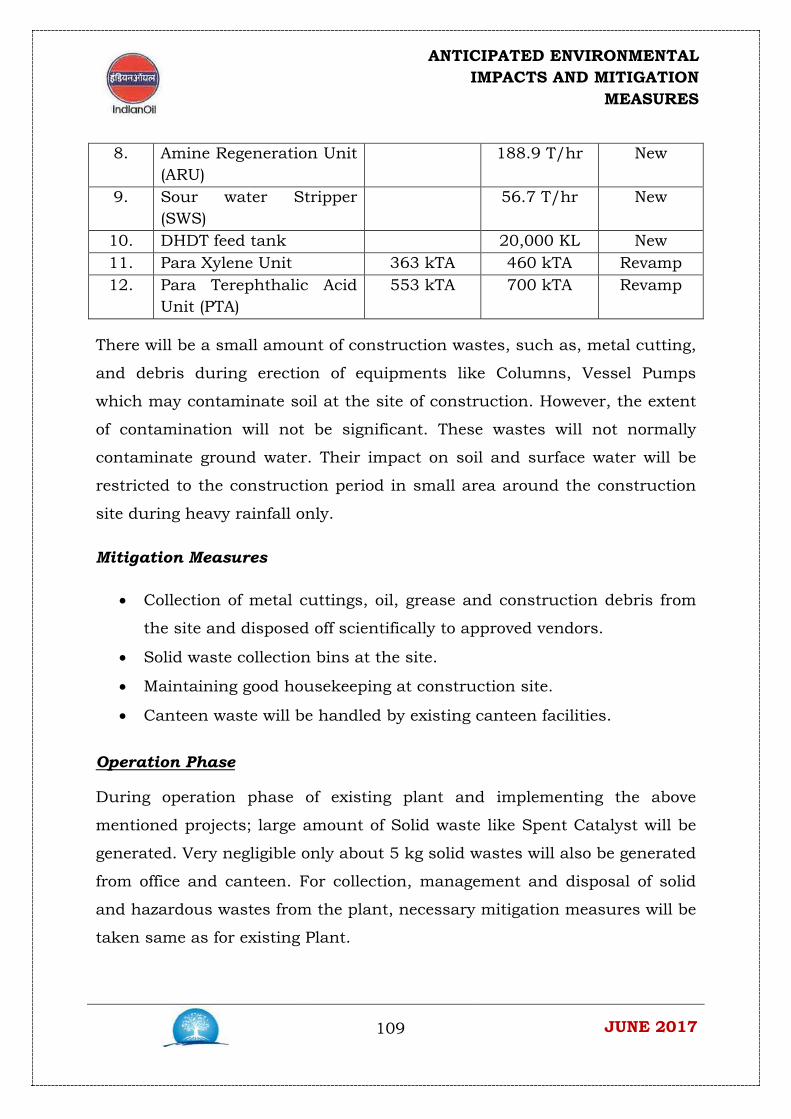
ANTICIPATED ENVIRONMENTAL IMPACTS AND MITIGATION
MEASURES
109 JUNE 2017
8. Amine Regeneration Unit (ARU)
188.9 T/hr New
9. Sour water Stripper (SWS)
56.7 T/hr New
10. DHDT feed tank 20,000 KL New 11. Para Xylene Unit 363 kTA 460 kTA Revamp 12. Para Terephthalic Acid
Unit (PTA) 553 kTA 700 kTA Revamp
There will be a small amount of construction wastes, such as, metal cutting,
and debris during erection of equipments like Columns, Vessel Pumps
which may contaminate soil at the site of construction. However, the extent
of contamination will not be significant. These wastes will not normally
contaminate ground water. Their impact on soil and surface water will be
restricted to the construction period in small area around the construction
site during heavy rainfall only.
Mitigation Measures
• Collection of metal cuttings, oil, grease and construction debris from
the site and disposed off scientifically to approved vendors.
• Solid waste collection bins at the site.
• Maintaining good housekeeping at construction site.
• Canteen waste will be handled by existing canteen facilities.
Operation Phase
During operation phase of existing plant and implementing the above
mentioned projects; large amount of Solid waste like Spent Catalyst will be
generated. Very negligible only about 5 kg solid wastes will also be generated
from office and canteen. For collection, management and disposal of solid
and hazardous wastes from the plant, necessary mitigation measures will be
taken same as for existing Plant.

ANTICIPATED ENVIRONMENTAL IMPACTS AND MITIGATION
MEASURES
110 JUNE 2017
Mitigation Measures
• Maintaining housekeeping at plant.
• The Spent Catalyst wastes from the different units will be replaced
once in 1, 5, 6 and 10 years depending on its requirement. The spent
catalyst will be disposed to authorized CPCB recycler.
• Additional Approx. 5-10 kg day municipal wastes (paper plastic, food
wastes, etc) will be generated, which will be collected and segregated.
• Recyclable wastes like paper and plastic wastes will be sent for
recycling. Biodegradable wastes like food and vegetable wastes will be
disposed compost pit. Non- biodegradable and non- recyclable wastes
will be sent to common landfill site.
4.2.2 Water Quality
Construction Phase
During the construction phase the demand of drinking water and
construction water will be met from existing source. Adequate drinking
water, hygiene and sanitation facilities will be provided to the workers. The
construction phase may result in minor soil erosion from the plant site, as it
will clear of ground flora during plant erection. The run off from the
construction site during rainfall may cause some increase in the quantity of
suspended solids and turbidity in the runoff in natural drain. However, this
impact will be of temporary nature and may not last as soon as excavated
soil established and construction debris is disposed off properly.
Mitigation measures
• Excavation for foundations of structures/vessels will be carried out
during dry season.
• Construction debris will be collected and disposed properly daily
basis.
• Sanitary facilities for workers will be provided.
ANTICIPATED ENVIRONMENTAL IMPACTS AND MITIGATION
MEASURES
111 JUNE 2017
Operation Phase
As part of additional facility additional effluent mostly from Sour water
stripper (approx 5 m3/hr, intermittent) will be generated. It is considered
that existing ETP will be adequate to handle this additional amount.
Additional Cooling Tower blow down (15 m3/hr), Boiler blow down (1 m3 / hr
from SRU), OWS and CRWS will also be accommodated in existing ETP
system. Thus the impact on water environment is insignificant
4.2.3 Climatology and Meteorology
The construction and operation phase of proposed expansion of
existing Plant will have no impact on meteorology of the area. Therefore, no
mitigation measure is required.
4.2.4 Air Quality
Construction Phase
• During the expansion, revamp phase, Activities like cleaning, levelling,
grading, construction, metal cutting, and erection of equipments like
Columns, Vessel Pumps will be carried out.
• A certain amount of particulate matter will be generated by truck
movements during the construction phase. However, the suspended
particulate matter in ambient air as a result of construction activities
may be relatively coarse and will be settled within a short distance.
Therefore, the impact will be restricted within the close vicinity of the
construction activityfor short period of time.
Mitigation Measures
• Cordoning off construction area by tin sheets & garden net
• Dust suppression measures like water sprinkling as per requirement.
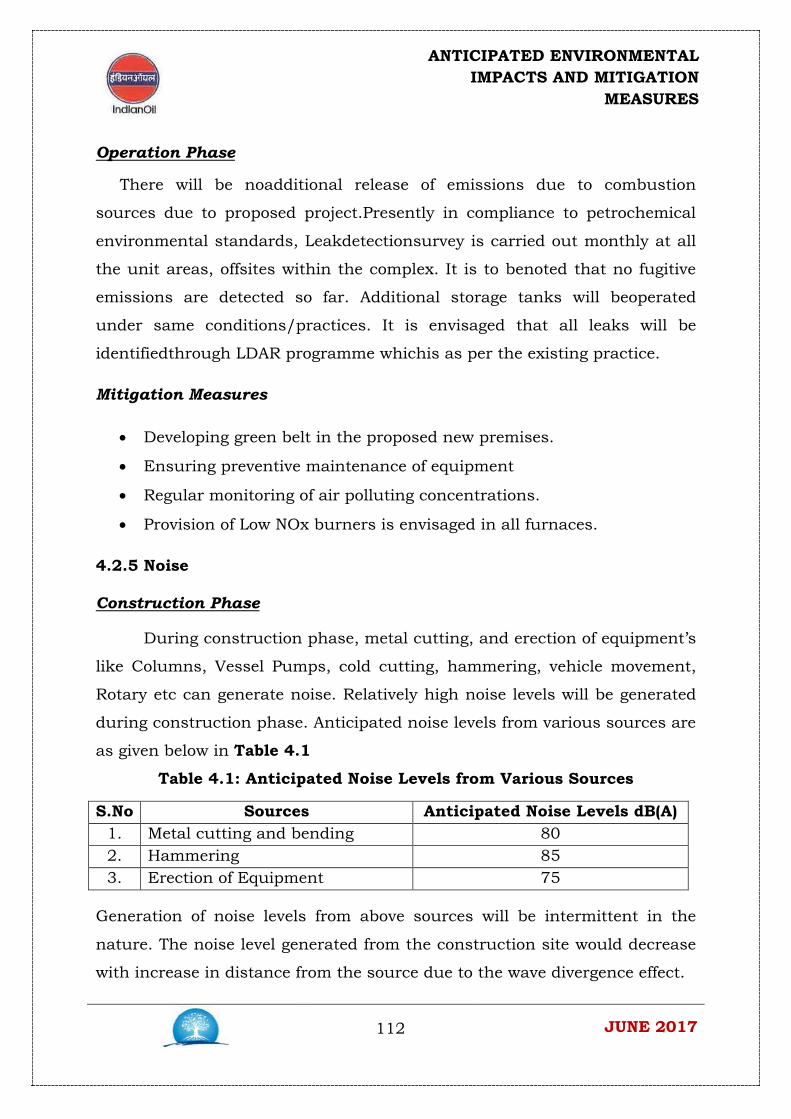
ANTICIPATED ENVIRONMENTAL IMPACTS AND MITIGATION
MEASURES
112 JUNE 2017
Operation Phase
There will be noadditional release of emissions due to combustion
sources due to proposed project.Presently in compliance to petrochemical
environmental standards, Leakdetectionsurvey is carried out monthly at all
the unit areas, offsites within the complex. It is to benoted that no fugitive
emissions are detected so far. Additional storage tanks will beoperated
under same conditions/practices. It is envisaged that all leaks will be
identifiedthrough LDAR programme whichis as per the existing practice.
Mitigation Measures
• Developing green belt in the proposed new premises.
• Ensuring preventive maintenance of equipment
• Regular monitoring of air polluting concentrations.
• Provision of Low NOx burners is envisaged in all furnaces.
4.2.5 Noise
Construction Phase
During construction phase, metal cutting, and erection of equipment’s
like Columns, Vessel Pumps, cold cutting, hammering, vehicle movement,
Rotary etc can generate noise. Relatively high noise levels will be generated
during construction phase. Anticipated noise levels from various sources are
as given below in Table 4.1
Table 4.1: Anticipated Noise Levels from Various Sources
S.No Sources Anticipated Noise Levels dB(A) 1. Metal cutting and bending 80 2. Hammering 85 3. Erection of Equipment 75
Generation of noise levels from above sources will be intermittent in the
nature. The noise level generated from the construction site would decrease
with increase in distance from the source due to the wave divergence effect.
ANTICIPATED ENVIRONMENTAL IMPACTS AND MITIGATION
MEASURES
113 JUNE 2017
Mitigation Measures
• Use of ear muff and ear plugs to workers working in high noise area.
• Enclosures are already fitted with noise generating sources.
Therefore, no significant impact is anticipated on noise levels during
construction phase of proposed fuel upgradation, expansion and revamp at
the plant.
Operation Phase
Noise generation is expected from piling process and rotating machinery,
and other equipment. The other sources are pumps, compressor and
turbines.
Mitigation Measures
• Equipment specification and installation of acoustic enclosure which
ensure low level of noise generation.
• All the Diesel Tankers and trucks are essentially fitted with silencers
to control noise generation.
• Planting trees and developing and maintaining green belt area which
works as noise barrier.
• Quarterly Noise surveys are conducted and abnormalities are
resolved.
Therefore, impact on noise levels of the study area due operations at the
BGR plant will be insignificant.
4.2.5 Ecology
Construction Phase
The proposed facilities are to be developed within the available area of
the existing refinery complex. This area is a graded land without any thick
vegetation. The project site does not harbor any fauna of importance.
Therefore, the impact of construction activities on fauna will be
insignificant.
ANTICIPATED ENVIRONMENTAL IMPACTS AND MITIGATION
MEASURES
114 JUNE 2017
Mitigation Measures
• Closing of trenches as soon as possible of construction.
• Prevent littering of work sites with wastes, especially plastic and
hazardous waste.
• Training of drivers to maintain speed limits.
Operation Phase
During operation phase, no impact on green belt of the plant premises
and ecology of the study area is anticipated. Growth of plantation and
development of green belt at the plant is likely to improve the flora and
fauna at the site.
4.3 Demographic, Land Use And Socio-economic Environment
4.3.1 Demography
During construction phase, around 3,500 workers will be deployed,
mostly from local area. The construction activity of proposed plant will not
displace any person. During Operation phase the plant will not require large
work force. Existing production employees are sufficient to operate and
handle the plant. Therefore, large scale immigration will not take place and
the impact on demography of the area will be insignificant.
4.3.2 Land Use
The expansion, revamping of the units in Panipat refinery will have no
impact on land use in the study area, as land for construction of proposed
plant is already available within the existing refinery premises. The project
will be put up in the existing land area of 102.5 Ha (253 Acre) and no new
land is required.
4.3.3 Socio Economic
The construction and operation of the plant will have some beneficial
impact due to increase in incomes as local unskilled, semiskilled and skilled
persons as they will gain some direct and indirect employment. Since the
ANTICIPATED ENVIRONMENTAL IMPACTS AND MITIGATION
MEASURES
115 JUNE 2017
immigration of work force during construction and operation of the proposed
expansion, revamping and implementation of new technologies at the plant
will be likely to be very small, the impact on facilities and cultural aspects
are expected to be insignificant.
At the centre of the socio-economic impact lies the question of
whether economic development and growth can go hand in hand with
environmental protection. The expansion, revamping activity at the plant is
not likely to have any negative impact if, the proposed mitigation for
environmental management are implemented by the IOCL management. The
proposed changes will have definite beneficial impacts, even though
marginal, on infrastructures facilities, gross economic product, employment
opportunities, socio-economic aspects of the area.

ANALYSIS OF ALTERNATIVES
116 JUNE 2017
5.0 ANALYSIS OF ALTERNATIVES
5.1 Introduction
The Panipat refinery, a unit of Indian Oil Corporation Limited (IOCL)
operates at 15.0 Million Metric Tons Per Annum (MMTPA) has proposed for
BS – VI Quality Up-gradation and Capacity Expansion of PX / PTA Unit.
For this purpose, a comparative analysis of various alternatives was
considered to avoid or minimize the impacts that would be inevitable in the
process. The process of analysis involves identifying the constraints,
avoiding activities causing adverse impact and maintaining the economic
feasibility
5.2 Alternative Technology
The consideration of technological alternatives for proposed expansion
and revamping is one of the more proactive side of environmental
assessment - enhancing the project through examining options instead of
only focusing on the more defensive task of reducing adverse impacts of a
single option of the project. This requires the systematic comparison of
feasible alternatives for technology and operational alternatives. Alternatives
are compared in terms of their potential environmental impacts, capital and
recurrent costs, suitability under local conditions, etc. IOCL is implementing
the following projects at Panipat refinery
S. No Facilities Existing capacity
Proposed capacity
Remarks
1. Diesel Hydro De-Sulphurisation (DHDS)
700 kTA 1000 kTA Revamp
2. Prime – G 370 kTA 445 kTA Revamp 3. Diesel Hydro –
Treater (DHDT) 2200 kTA New
4. Hydrogen generation Unit
44 kTA of hydrogen
production
New
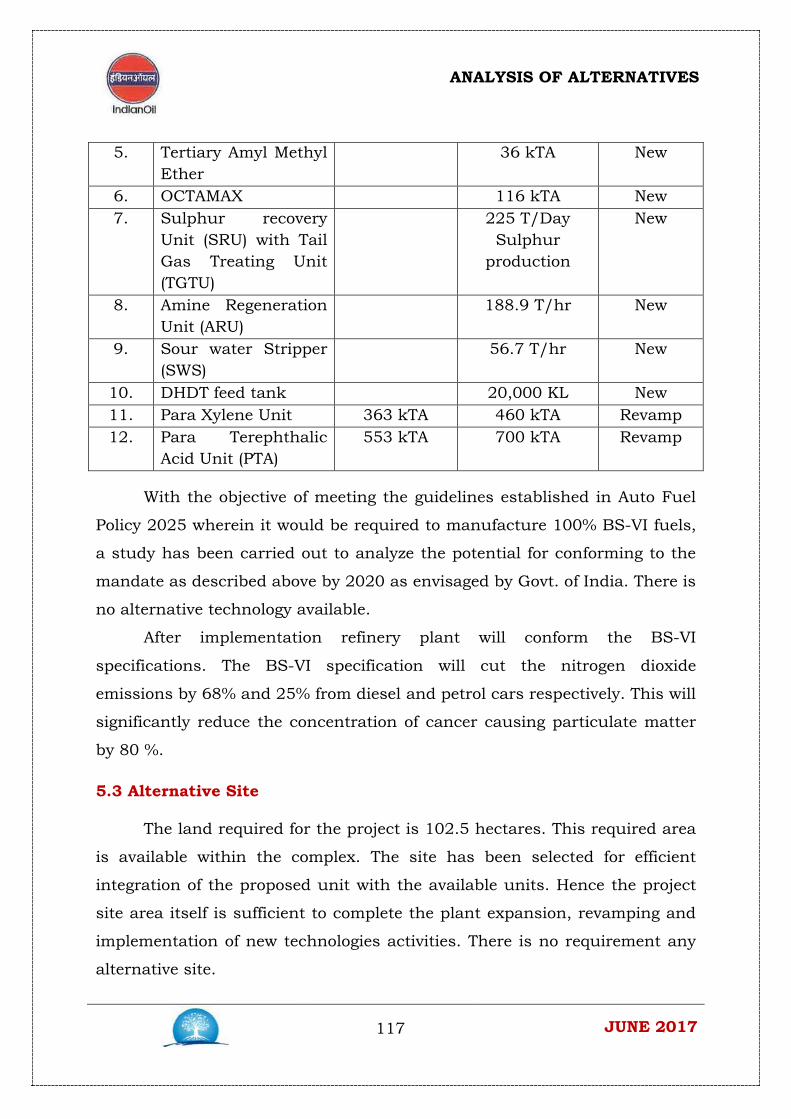
ANALYSIS OF ALTERNATIVES
117 JUNE 2017
5. Tertiary Amyl Methyl Ether
36 kTA New
6. OCTAMAX 116 kTA New 7. Sulphur recovery
Unit (SRU) with Tail Gas Treating Unit (TGTU)
225 T/Day Sulphur
production
New
8. Amine Regeneration Unit (ARU)
188.9 T/hr New
9. Sour water Stripper (SWS)
56.7 T/hr New
10. DHDT feed tank 20,000 KL New 11. Para Xylene Unit 363 kTA 460 kTA Revamp 12. Para Terephthalic
Acid Unit (PTA) 553 kTA 700 kTA Revamp
With the objective of meeting the guidelines established in Auto Fuel
Policy 2025 wherein it would be required to manufacture 100% BS-VI fuels,
a study has been carried out to analyze the potential for conforming to the
mandate as described above by 2020 as envisaged by Govt. of India. There is
no alternative technology available.
After implementation refinery plant will conform the BS-VI
specifications. The BS-VI specification will cut the nitrogen dioxide
emissions by 68% and 25% from diesel and petrol cars respectively. This will
significantly reduce the concentration of cancer causing particulate matter
by 80 %.
5.3 Alternative Site
The land required for the project is 102.5 hectares. This required area
is available within the complex. The site has been selected for efficient
integration of the proposed unit with the available units. Hence the project
site area itself is sufficient to complete the plant expansion, revamping and
implementation of new technologies activities. There is no requirement any
alternative site.
ANALYSIS OF ALTERNATIVES
118 JUNE 2017
5.4 Alternatives for Storage
The refinery, located in Panipat, already has a well-developed
infrastructure set up within the premises. There are already various
capacity tanks provided onsite and offsite for storage of manufactured fuels
products.
5.5 Alternative for risk reduction at refinery
The management system for occupational health provides the
framework for the process of identifying hazards, assessing associated risks,
taking action and reviewing the outcome. The objective is to prevent
occupational diseases and to promote the employee health. In occupational
health, the deliverable is the absence of occupational diseases resulting in a
healthy and productive worker. Therefore all the occupational risks will be
mitigated at the refinery.
ENVIRONMENTAL MONITORING PROGRAM
119 JUNE 2017
6.0 ENVIRONMENTAL MONITORING PROGRAM
6.1 Introduction
Environmental monitoring is an essential tool for sustainable
development & ensuring effective implementation of environmental
management plan & mitigation measures adopted. Environmental
monitoring will undertake primarily to determine the environmental effects
of human activities and secondarily to increase understanding of cause –
effect relationships between human activity and environmental change.
Environment monitoring is a repetitive & systematic measurement of the
characteristics of environmental components to test specific hypotheses of
the effect of human activities on the environment. Environmental monitoring
program enables the proponent to identify the deviation of environmental
quality due to the proposed project activities.
Therefore, regular monitoring programme of the environmental
parameters is essential to take into account the changes in the
environmental quality.
6.2 Environmental Monitoring and Reporting Procedure
Development of the programme during the planning process shall be
conducted or supported by environmental specialists. However, the
implementation responsibility rests with working managers of the
organization, who should, therefore, ensure they fully understand and
subscribe to the commitments being made. These commitments will include
the legal and statutory controls imposed on the operation as well as other
corporate commitment to responsible environment management.
Panipat refinery has an Engineering Group to review the effectiveness
of environment management system during construction and operational
phase of proposed project. The Health, Safety and Environment (HSE) is a
part of Engineering Group who works for monitoring and meet regularly to
ENVIRONMENTAL MONITORING PROGRAM
120 JUNE 2017
review the effectiveness of the EMP implementation. The data collected on
various EMP measures would be reviewed by EMC and if needed corrective
action will be formulated for implementation.
6.3 Objectives of Monitoring
To ensure the effective implementation of the proposed mitigation measures,
the broad objectives of monitoring plan are:
• To assess the changes in environmental conditions
• To evaluate the performance of mitigation measures proposed in the
environmental monitoring programme.
• To suggest improvements in management plan, if required
• To enhance environmental quality
• To undertake compliance monitoring of the proposed project operation
and evaluation of mitigative measure.
6.4 Monitoring Program
To check the efficacy of the adopted mitigation measures and
environmental Management plan, post project monitoring is carried out for
various environmental parameters. In case, the monitored results of
environmental parameter are found to exceed the allowable/stipulated
values, the Environmental Management Cell suggests remedial actions and
gets these suggestions implemented through the concerned personnel.
6.4.1 Ambient Air Quality Monitoring
The air quality (at the project site and ambient air quality in the
surrounding nearby villages) will indicate to which extent the mitigation
measures are being followed. Ambient air quality parameters suggested
during operation phase within existing plant are Particulate Matters (PM2.5),
Particulate Matter (PM10), Nitrogen Dioxide (NO2), Sulphur Dioxide (SO2),
Carbon Monoxide (CO), HC and VOC. These are to be monitored at
designated locations.

ENVIRONMENTAL MONITORING PROGRAM
121 JUNE 2017
During operation phase, the major source of air emissions will be from
DHDT unit along with the vehicular emissions from Plant. Six monthly
ambient air quality monitoring should be carried out at boundaries of Plant.
The continuous ambient air quality monitoring station is also to be
envisaged.
6.4.2 Water Quality Monitoring
The up-stream and downstream surface water quality (w.r.t. project
site), will indicate the quality and extent of wastewater from the project site.
Likewise the monitoring of ground water, up-gradient and down-gradient of
project site will indicate seepage of pollutants in to ground water from the
construction site.
There will not be any source for ground and surface water
contamination during construction and operation phases. However, ground
water sampling and analysis can be carried out at the Plant during
operation phases.
The locations, duration and pollution parameters to be monitored and
necessary institutional arrangements are detailed in the environmental
monitoring plan. The monitoring of the ground water quality will be carried
out at one location in accordance to Indian Standard Drinking Water
Specification-IS 10500:2012 for relevant parameters as directed by State
Pollution Control Board.
6.4.2 Noise Quality Monitoring
The noise levels at the project site and surrounding premises has been
planned to be assessed to which the construction workers are exposed
during construction phase. This will indicate the level of noise mitigation
measures being followed during the construction phase.
The measurement of noise levels would be carried out at suggested
locations in accordance to the Ambient Noise Standards formulated by
Ministry of Environment, Forest and Climate Change (MoEF&CC). Noise
levels would be monitored on twenty-four hourly basis. Noise measurements
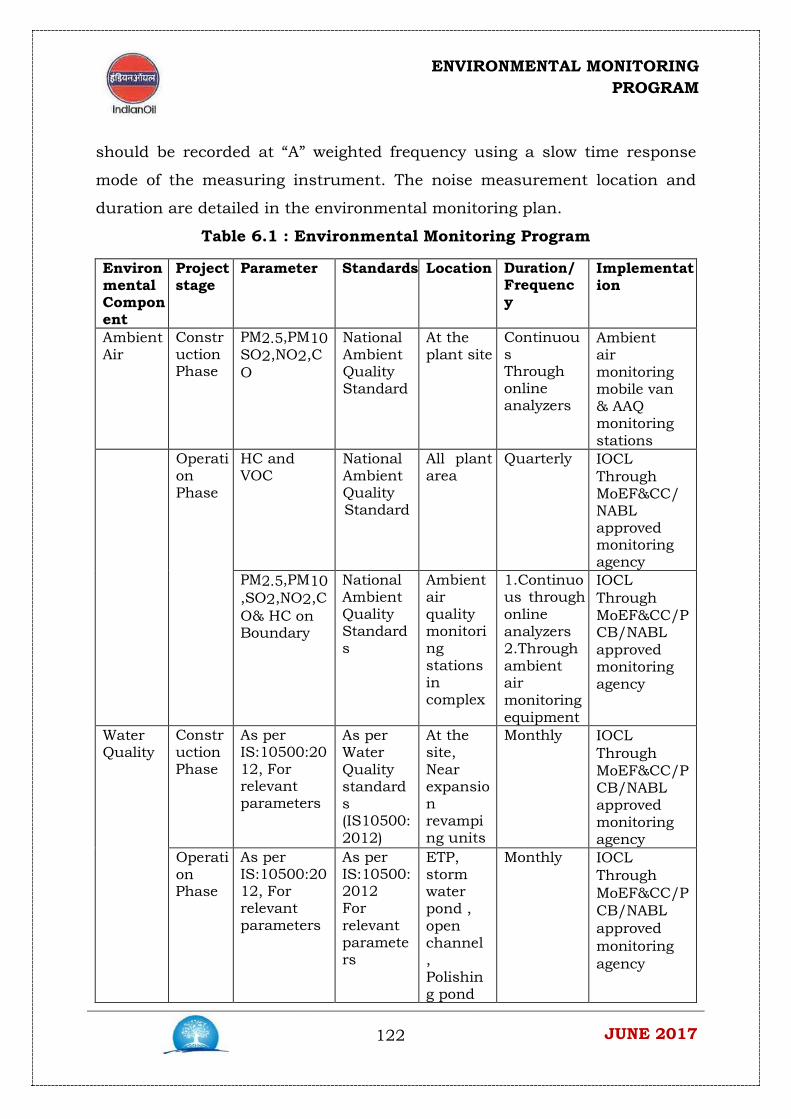
ENVIRONMENTAL MONITORING PROGRAM
122 JUNE 2017
should be recorded at “A” weighted frequency using a slow time response
mode of the measuring instrument. The noise measurement location and
duration are detailed in the environmental monitoring plan.
Table 6.1 : Environmental Monitoring Program
Environmental Component
Project stage
Parameter Standards Location Duration/Frequency
Implementation
Ambient Air
Construction Phase
PM2.5,PM10SO2,NO2,CO
National Ambient Quality Standard
At the plant site
Continuous Through online analyzers
Ambient air monitoring mobile van & AAQ monitoring stations
Operation Phase
HC and VOC
National Ambient Quality Standard
All plant area
Quarterly IOCL Through MoEF&CC/ NABL approved monitoring agency
PM2.5,PM10,SO2,NO2,CO& HC on Boundary
National Ambient Quality Standards
Ambient air quality monitoring stations in complex
1.Continuous through online analyzers 2.Through ambient air monitoring equipment
IOCL Through MoEF&CC/PCB/NABL approved monitoring agency
Water Quality
Construction Phase
As per IS:10500:2012, For relevant parameters
As per Water Quality standards (IS10500:2012)
At the site, Near expansion revamping units
Monthly IOCL Through MoEF&CC/PCB/NABL approved monitoring agency
Operation Phase
As per IS:10500:2012, For relevant parameters
As per IS:10500:2012 For relevant parameters
ETP, storm water pond , open channel , Polishing pond
Monthly IOCL Through MoEF&CC/PCB/NABL approved monitoring agency
ENVIRONMENTAL MONITORING PROGRAM
123 JUNE 2017
6.5 Monitoring Methodologies
Monitoring of environmental samples shall be done as per the
guidelines provide by MoEF & CC/CPCB. The methods conducted or applied
shall be approved or sanctioned by the any recognized body or authority i.e.
MoEF & CC/CPCB.
6.6 Responsibility of Monitoring and Reporting System
The overall responsibility of monitoring the above parameters shall lie
with the Management. The HSE division shall be responsible for day to day
monitoring of effluent, raw water and treated water quality. The ambient air
quality, stack emissions, soil, noise and water quality shall be monitored by
either third party (approved MoEF/NABL laboratory) or by the EMC.
Reports and documents shall be prepared complying with the
statutory rules & regulations. Proper and due care shall be taken to adhere
to the laid down rules and regulation by the government. Records shall be
maintained for the analysis of raw effluents and treated effluents, ambient
air quality data, stack emissions monitoring results, meteorological data and
noise levels.
The industry shall maintain the records as per the Hazardous waste
regulations and EPA regulations and apply for the annual consents for the
air and water, and renewal of authorization for the storage of hazardous
waste as per Hazardous Waste (Handling & Management) Rules, 2016. The
records of hazardous waste manifest will be maintained.
These reports / documents shall be regularly and periodically
reviewed and any changes / discrepancies found in mitigation measures/
operation / management / technology shall be brought into notice
instantaneously and all possible corrective actions shall be taken to match
the discrepancies been witnessed.
Reporting system provides the necessary feedback for project
management to ensure quality of the works and that the management plan
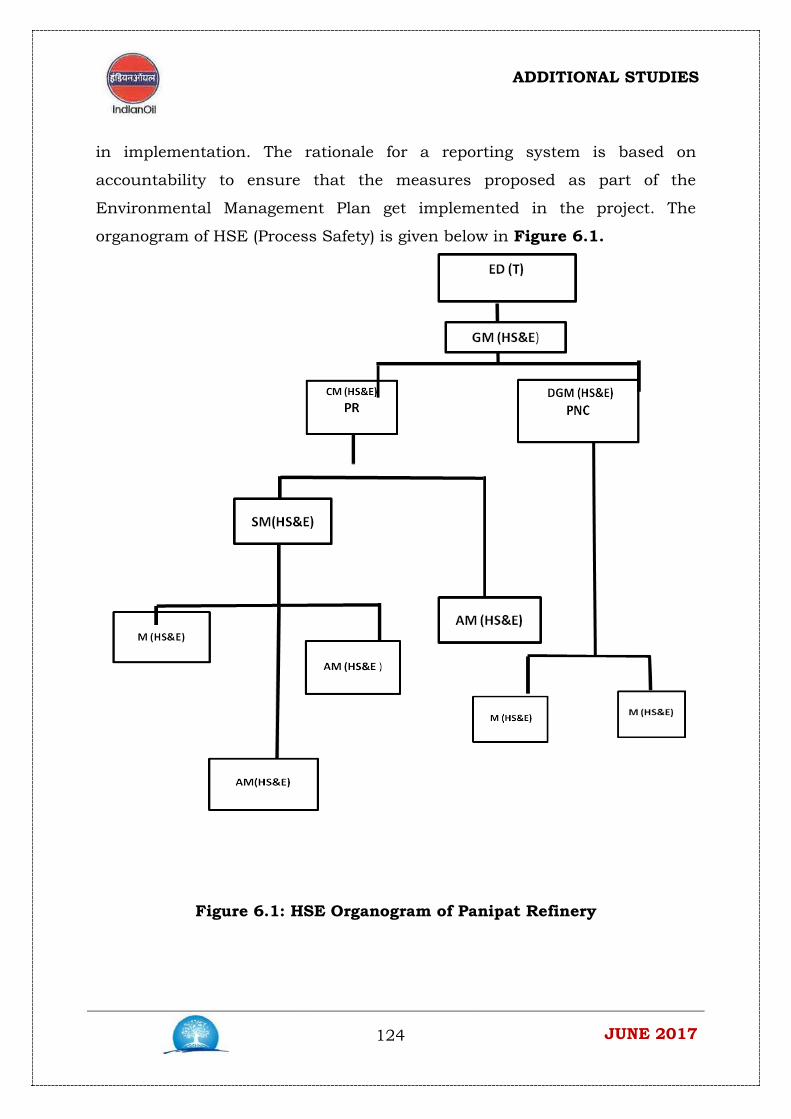
ADDITIONAL STUDIES
124 JUNE 2017
in implementation. The rationale for a reporting system is based on
accountability to ensure that the measures proposed as part of the
Environmental Management Plan get implemented in the project. The
organogram of HSE (Process Safety) is given below in Figure 6.1.
Figure 6.1: HSE Organogram of Panipat Refinery
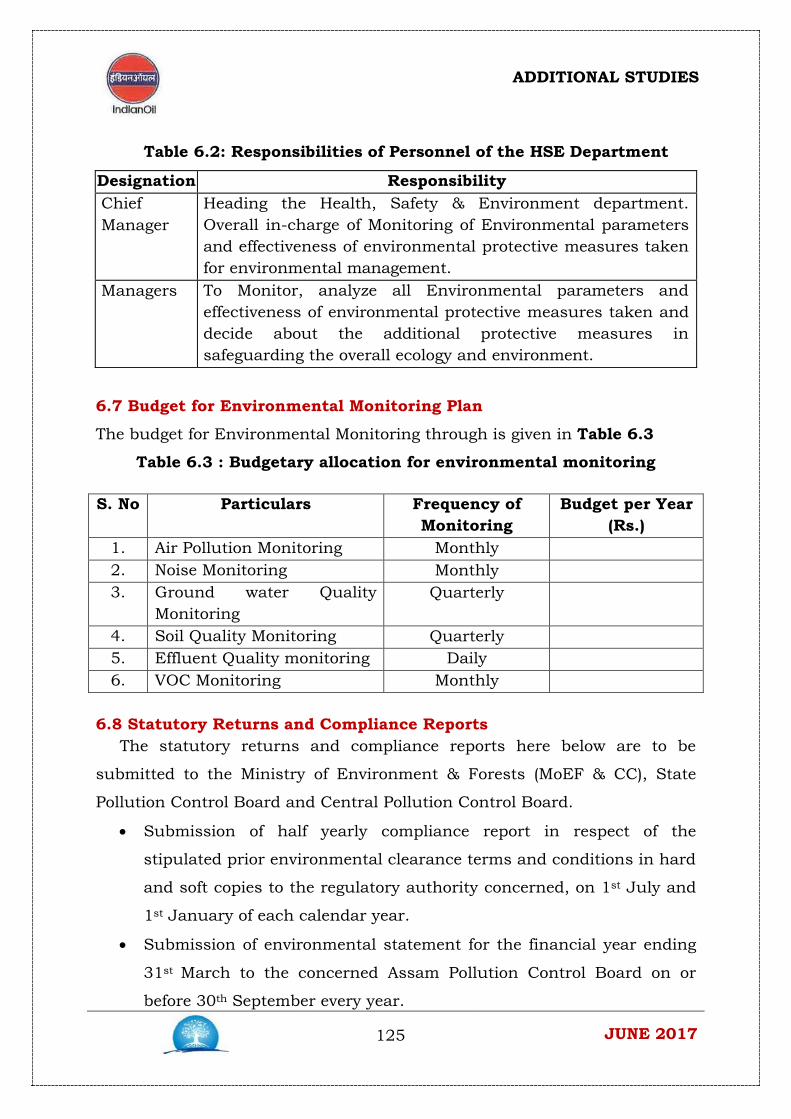
ADDITIONAL STUDIES
125 JUNE 2017
Table 6.2: Responsibilities of Personnel of the HSE Department
Designation Responsibility Chief Manager
Heading the Health, Safety & Environment department. Overall in-charge of Monitoring of Environmental parameters and effectiveness of environmental protective measures taken for environmental management.
Managers To Monitor, analyze all Environmental parameters and effectiveness of environmental protective measures taken and decide about the additional protective measures in safeguarding the overall ecology and environment.
6.7 Budget for Environmental Monitoring Plan
The budget for Environmental Monitoring through is given in Table 6.3
Table 6.3 : Budgetary allocation for environmental monitoring
S. No Particulars Frequency of Monitoring
Budget per Year (Rs.)
1. Air Pollution Monitoring Monthly 2. Noise Monitoring Monthly 3. Ground water Quality
Monitoring Quarterly
4. Soil Quality Monitoring Quarterly 5. Effluent Quality monitoring Daily 6. VOC Monitoring Monthly
6.8 Statutory Returns and Compliance Reports
The statutory returns and compliance reports here below are to be
submitted to the Ministry of Environment & Forests (MoEF & CC), State
Pollution Control Board and Central Pollution Control Board.
• Submission of half yearly compliance report in respect of the
stipulated prior environmental clearance terms and conditions in hard
and soft copies to the regulatory authority concerned, on 1st July and
1st January of each calendar year.
• Submission of environmental statement for the financial year ending
31st March to the concerned Assam Pollution Control Board on or
before 30th September every year.
ADDITIONAL STUDIES
126 JUNE 2017
7.0 ADDITIONAL STUDIES
7.1 Introduction
In addition to the main EIA study, Rapid Risk Assessment have been
carried out and summary of RRA study are provided in Section 7.3.
7.2 Public consultation
The Expert Appraisal Committee of Industry exempted the Public
hearing is under section 7 (ii) of EIA Notification, 2006 for the BS – VI
Quality Up-gradation and Capacity Expansion of PX / PTA at Panipat
Refinery.
7.3 Risk Assessment
The study team identified 30 numbers of scenarios for the RRA study.
Considering the risk contours and FN curve for combination of all scenarios,
DNV- PHAST RISK (SAFETI) software has been used for estimating the risk.
The following interpretations are derived from the risk results of this study:
• Individual risk is in the ALARP region of the UK HSE Individual
risk acceptance criteria.
• The societal risk is in the ALARP region of the UK HSE Societal
risk acceptance criteria.
Recommendations
Individual Risk Values at control room, electrical sub-station, workshop, fire
station, PSA, security barrack, medical building, administration building,
security building are found to be in ALARP region.
When the Plant is in Operation, Permit system should be introduced for
outside visitors’ entry. Also the number of outside persons at any time
within facility should be well regulated.
• The failure frequencies assumed for the RRA are for that of a well-
maintained Oil & Gas Facilities as per standard norms. Hence the

ADDITIONAL STUDIES
127 JUNE 2017
facility shall be maintained well as per internationally acceptable
practices.
• Appropriate Personal Protective equipment (PPE) as per standards
shall be used by the personnel working in the area.
• Emergency procedures, SOP shall be maintained and followed
accordingly.
• Safety Audits shall be regularly done as per norms and
recommendations of OISD. Risk Analysis Study in future shall be
required if there is any change in the plant facility.
It is welcomed to note that these recommendations are already in practice at
Panipat refinery.
A detailed risk assessment report for the BS – VI Quality Up-gradation and
Capacity Expansion of PX / PTA Unit at Panipat Refinery is enclosed as
Annexure – IV.
PROJECT BENEFITS
128 JUNE 2017
8.0 PROJECT BENEFITS
India has been witnessing rapid urban and industrial growth in the
past two decades, and with the country’s current liberalization policy, this
growth is expected to accelerate further. As a consequence of the rapid rate
of industrialization in India, petroleum products needs are increasing at an
equally rapid rate and the supply-demand gap is widening and steps must
be taken to address this issue. The proposed project will result in the supply
of increased volumes of environmental friendly petroleum products to meet
the energy security of northern, western and southern region of the country.
The revamp project is being implemented for improvement of revenue
and emissions of the refinery. The project will help to manufacture High
Speed Diesel conforming to manufacturing specifications of BS- VI. The BS-
VI will bring down the Nitrogen Oxide emissions from diesel cars by 68 %
and 25% from petrol engine cars. Cancer causing particulate matter
emissions from diesel engine cars will also come down by a phenomenal 80
%.Also, BS –VI grade fuel will bring down sulphur content to 10 PPM. This
will further reduce environment pollution substantially.
This project, besides general economic desirability, would result in
substantial socio economic benefit to the country in general and more
specifically to the region. Setting-up of this project will be a boon to this
region and is bound to improve living conditions and thereby result in
further reduction of population below poverty line, which is one of the prime
policy objectives of the Government. It is expected that by creation of
employment potential, the poor/weaker section of the society will see an
liftment in their living conditions. Improvement in the overall socio-economic
status of the vicinity of project area, in the thematic areas of health,
education, livelihood and infrastructure is expected.
ENVIRONMENTAL MANAGEMENT PLAN
129 JUNE 2017
9.0 ENVIRONMENTAL MANAGEMENT PLAN
Environmental Management Plan (EMP) is the planning and
implementation of various pollution abatement measures for the proposed
project. The EMP lists out all the measures to be taken during the
Design/Engineering, Construction, Commissioning and operational stages of
the project. The Environmental Management Plan (EMP) for the proposed
projects has to ensure that the residual environmental impacts are
minimized by adopting best possible economically viable techniques.
A comprehensive plan has been worked out keeping in view these
requirements. The plan encompasses the mitigation in three stages i.e.
design, construction and operation of the plant. The proposed EMP
appropriate for each stage is described in the subsequent sections of this
chapter. IOCL is a vibrant, integrated and diversified petroleum company of
national importance committed to sustainable development.
IOCL have sound Environmental Management System and
Occupational Health and Safety Management Systems in place for carrying
out their operations in a manner consistent with its commitment to
sustainable development.
9.1 Design Phase
The EMP in the design stage endeavors to mitigate the problems related
to health, safety and environment at the process technology/source level
itself. Government of India has made many legislations/rules for the
protection and improvement of environment in India. Various environmental
legislations/rules applicable to the proposed project facilities are as follows.
The Environment (Protection) Act, 1986, amended up to 1991
The Environment (Protection) Rules, 1986, amended up to 2008,
schedule 1,S.No.3
Environment (Protection) Third Amendment Rules, 2002
ENVIRONMENTAL MANAGEMENT PLAN
130 JUNE 2017
Environment (Protection) fifth Amendment Rules, 2009, schedule VI,
part D, Item III, s.no.6
Environment (Protection) Amendment Rules, 2012
The Public Liability Insurance Act, 1991, amended 1992
The Public Liability Insurance Rules, 1991, amended 1993
The Water (Prevention and Control of Pollution) Act, 1974, as
amended upto1988.
No. 19 of 2003, [17/3/2003] - The Water (Prevention and Control of
Pollution) Cess (Amendment) Act, 2003.
The Water (Prevention and Control of Pollution) Rules, 1975
The Water (Prevention and Control of Pollution) Cess Rules 1977 as
amended upto 1992
The Water (Prevention and Control of Pollution) Cess Rules 1978 as
amended upto 1992.
The Water (Prevention and Control of Pollution) Amendment Rules,
2011.
The Air (Prevention and Control of Pollution) Act 1981, as amended
upto 1987.
The Air (Prevention and Control of Pollution) (Union Territories) Rules,
1983
Hazardous Wastes (Management and Handling) Rules, 2008, amended
up to2016.
Manufacture, Storage and Import of Hazardous Chemical Rules, 2016
Noise Pollution (Regulation and Control) Rules, 2000, amended up to
2010.
Common Hazardous waste Incinerator rules, The Environment
(Protection) Rules,1986, amended upto 2008, schedule 1, s.no.100
E Waste (Management and Handling) Rules, 2011
The Batteries (Management and Handling) Rules, 2001
ENVIRONMENTAL MANAGEMENT PLAN
131 JUNE 2017
Proposed project shall be designed taking into account the above-referred
legislations/rules and as per the directives of Environmental Clearance
documents. The mitigation measures for the potential negative impacts
anticipated from the proposed project and environmental monitored
schedule are described in this chapter.
9.2 Construction Phase
Environmental impacts during the construction phase can be
attributed to the site preparation activity and the mobilization of workforce.
The EMP for this phase is described below.
Air Environment
Dust generated as result of clearing, levelling and site grading
operations will be suppressed by using water sprinklers if dusty conditions
are encountered. It will be ensured that the construction machinery using
diesel driven prime movers are properly maintained to minimize exhaust
emission of CO, SPM and HC. Dust suppression measures like water
sprinkling will be done as per requirement. The Construction activity will be
restricted to day time as far as possible to avoid disturbance to surrounding
areas.
Noise Environment
All noise generating equipment’s used during the construction phase
shall be provided with noise control devices. Wherever required, personal
protective equipments such as earplugs, earmuffs etc. will be provided to the
persons engaged in noisy operations. This will minimize their exposure to
noise levels.
Water Environment
The water requirement for the construction phase shall be provided
through the existing tube well tapping system. Potable water and proper
sanitation facilities will be provided to the construction workers at the site.
ENVIRONMENTAL MANAGEMENT PLAN
132 JUNE 2017
Land Environment
Surplus earth (if any) and Construction debris will be used for
landfill/site gradation. Metal scrap and packaging materials will be sold for
reprocessing.
Safety Measures
The site will have necessary security arrangements to prevent entry of
unauthorized personnel and proper control of hazardous materials on site.
All the employees, with special emphasis on contractor employees, will be
trained in safety aspects related to their job. There will be a special
emphasis on safe handling of material, safety in welding and fabrication
activities and safety in working at heights. All the personnel will be provided
with safety appliances such as face shields, helmets, safety goggles, safety
shoes, hand gloves etc. as per the job requirement.
Hazardous chemicals (if any) used during the construction will be
stored and handled as per the statutory regulations in line with Hazardous
waste (Management and Handling) rules notified in 2016 (provide for a
control on the generation, collection, treatment, transport, import, storage
disposal of waste) and amendment of these rules in 2000 under the
Environment (Protection) Act, 1986.
Socio Economic Environment
The demand for work force provides ample opportunities for providing
temporary skilled, unskilled and semiskilled labour. It is expected that the
unskilled and semi-skilled labour would be available from the adjoining
villages. However there would be influx of skilled and specialized manpower
to the area, which would create demand for housing and other facilities.
9.3 Operation Phase
It is envisaged that with strict adherence to the pollution prevention
and control measures during the design stage of the projects, the
environmental impacts could be moderated to the minimum possible level
ENVIRONMENTAL MANAGEMENT PLAN
133 JUNE 2017
during the operation phase. The environmental management plan during
the operational phase of the plant shall therefore be directed to the
following:
• Ensuring the operations of various process units as per specified
operating guidelines/operating manuals.
• Strict adherence to maintenance schedule for various
machinery/equipment.
• Good Housekeeping practices
• Post project environmental monitoring
Air Environment
Some of the important operational measures, which can reduce the impact
on air environment, are as follows:
• To control fugitive emission from the Hydrocarbon processing areas,
the valves, flanges pumps and Compressors seals; the gasket
materials etc. should be maintained on periodical basis.
• The loading / unloading operation from the storage tanks should
preferably be done during early part of the day when ambient
temperature is low.
• The flaring of hydrocarbons should be avoided to the extent possible.
Stack Emission
In order to keep a check on the emissions of various criteria air pollutants
viz. SO2, NOx, SPM, CO from all the point sources viz. all heater stacks,
Boiler stacks of existing refinery are being monitored with the help of on-line
analyzing instruments for one or more of these pollutants depending upon
the type of fuel being used there. The various new stacks of proposed
projects will also be connected to the existing on-line monitoring network.
Noise Environment
As incorporated during the design stage, the in-plant areas where
noise levels are high enough to have adverse impacts, the usage of ear plugs
ENVIRONMENTAL MANAGEMENT PLAN
134 JUNE 2017
or earmuffs shall be strictly enforced. Further, the plantation of suitable
plants species to reduce noise levels within the refinery area shall also be
taken on priority basis. Although the predicted noise level rise outside the
plant battery limit is very marginal and is unlikely to have any adverse
impact on the surrounding community, it is proposed to monitor the noise
in the operational areas near the refinery in connection with noise
minimization program.
Water environment
The water required for the refinery is being tapped from the Munak
Regulator. These will be tapped in sequential manner. Tracking of
consumption of water and installation of rainwater harvesting structures to
collect and use rainwater, thereby reducing abstraction.
Land Environment
The solid waste generated in the form of packaging material etc. shall
be sold off for making it suitable for reuse by reprocessing. In order to
improve the aesthetics of the plant, extensive horticulture development and
landscaping within and around the plant boundary shall be taken up. The
solids wastes identified to be disposed off in the landfill shall be done as per
established procedure for land filling.
Primarily, spent catalyst solid waste is generated from the DHDT and
HGU units can be sent back to catalyst suppliers. The activated carbon from
ARU shall be used as land fill/road making.
The Hazardous Waste/Chemicals during the operation stage will be
stored and handled as per the statutory regulations in line with Hazardous
waste (Management and Handling) rules notified in 2016 (provide for a
control on the generation, collection, treatment, transport, import, storage
disposal of waste) and amendment of these rules in 2000 under the
Environment (Protection) Act, 1986.

ENVIRONMENTAL MANAGEMENT PLAN
135 JUNE 2017
Oil Sludge Management
During operation of existing and proposed tanks, approx. 2700 M3oily
sludge will be generated at the time of cleaning of tanks once in every 10 -11
years. This oily sludge may contaminate soil if not disposed properly. ETPs
also generate oily sludge but the quantity remains lower as compared to the
tank bottom sludge. Therefore, oily sludge may be treated through
bioremediation technique (Oil zapper, a bacterial consortium that degrades
oily sludge) through Bioremediation.
Bioremediation is a process that uses naturally occurring
microorganisms to transform harmful substances to nontoxic compounds..
Bioremediation technology using the microbial consortium is a very
good environment friendly process for disposal of hydrocarbon
contaminations. Oil-Zapper refers mixture of five microbial strains – are
capable of eating up oil, they take in the pollutants and give out carbon
dioxide without producing any harmful residues. Approximately 1 kg of oil
zapper today can neutralize a ton of sludge in a matter of months.
Storm water management
The Refinery has constructed Storm Water Ponds of total capacity 1.5
Lac KL. These ponds received water from all over the Refinery through the
network of Storm Water Drains. Water from various areas/units through
open channel and water during monsoon period is collected in Storm Water
Ponds .To improve the quality of Storm Water 9 nos. oil catch pits have been
constructed to prevent the ingress of oil in the Storm Water Ponds.The
collected storm water is then treated in dedicated storm water filtration
system. After filtration this storm water is reused in Fire water network,
green belt (through Polishing Pond) and cooling water makeup (based on
quality and as per requirement).
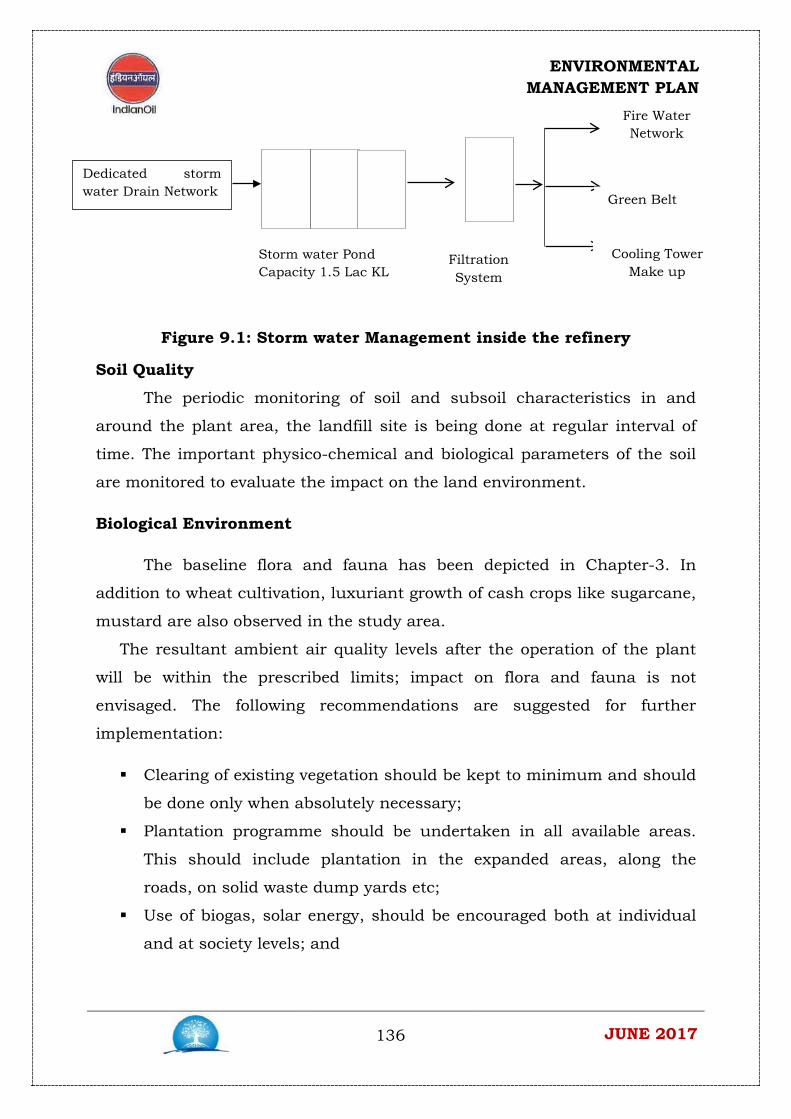
ENVIRONMENTAL MANAGEMENT PLAN
136 JUNE 2017
Figure 9.1: Storm water Management inside the refinery
Soil Quality
The periodic monitoring of soil and subsoil characteristics in and
around the plant area, the landfill site is being done at regular interval of
time. The important physico-chemical and biological parameters of the soil
are monitored to evaluate the impact on the land environment.
Biological Environment
The baseline flora and fauna has been depicted in Chapter-3. In
addition to wheat cultivation, luxuriant growth of cash crops like sugarcane,
mustard are also observed in the study area.
The resultant ambient air quality levels after the operation of the plant
will be within the prescribed limits; impact on flora and fauna is not
envisaged. The following recommendations are suggested for further
implementation:
Clearing of existing vegetation should be kept to minimum and should
be done only when absolutely necessary;
Plantation programme should be undertaken in all available areas.
This should include plantation in the expanded areas, along the
roads, on solid waste dump yards etc;
Use of biogas, solar energy, should be encouraged both at individual
and at society levels; and
Dedicated storm water Drain Network
Storm water Pond Capacity 1.5 Lac KL
Filtration System
Fire Water Network
Green Belt
Cooling Tower Make up

ENVIRONMENTAL MANAGEMENT PLAN
137 JUNE 2017
Plantation should be done along the roads, without affecting plant
operational safety. This will not only improve the flora in the region
but will add to the aesthetics of the region.
GREENBELT DEVELOPMENT
EXISTING GREENBELT DETAILS
An extensive and diversified green belt exists around Panipat Refinery and
Petrochemical Complex. This includes green belt of Panipat Refinery,
Panipat Naphtha Cracker, Eco Park and other parks in township. This green
belt works as good shield against to environment pollution at PRPC. The
details of this green belt as follows:-
GREENBELT - Preserving the Forest & flora & fauna:
Panipat refinery, since conceptualization of the project, is trying to balance
the eco-system in a more systematic way. The refinery was commissioned in
the year 1998 (October) and has developed a Green belt having more than 5
lacs surviving trees, as on March 2017, in close co-ordination with Haryana
Forest department. The details are given below:
ECO-PARK (Green belt):
Location: Total area under green belt is 395 Hectare including area of
Eco park of 127.80 hectare and other plantation zones in township ,
roadside & plant areas. The tree plantation was started in the year 1993-94
i.e. much before commissioning of the plant. Trees planted in first phase
wereNeem, Sisam, Jamun, Mango,Amaltash, Gulmohar, Kachnar, Arjun,
Peepal, Papari, Kikar, Bottle brush etc.,

ENVIRONMENTAL MANAGEMENT PLAN
138 JUNE 2017
There are about 5 Lac trees, which have survived as on March 2017 with
a survival rate of 90%.Plants planted in 2015 – 16 & 2016 – 17 were
6142 & 10016 respectively
About Rs. 30 lacs per annum is being spent on maintaining the Eco
Park through Haryana Forest Department.
Peripheral Green Belt on 14km long boundary of the Refinery.
SPECIES:
The species of trees have been meticulously selected depending upon
availability of water, their pollution control properties and wind direction.
Therefore, about 40 different species have been planted and some of the
varieties are:
Papri, Poplar, Sulabul, Semai, Arjun, Teak, Amaltas, Mango, Jamum,
Kachnar, Sisham, Gul Mohar, Neem, Kaner Bottle Brush, Silver Oak,
Kasarina, Chandni, Toon, Bouganvelai.
Similarly, another greenbelt has been developed around PNC. The trees
have been planted at a spacing of 2m x 4m
The trees planted are:
(a)Tall fruit plants like Mango, Jack fruit, Jamun and Kadamb
(b)Medium size fruit plants like Aonla, Guava, Ber and Aru
(c) Medium sized shrubs like Lemon, Karonda, and Anar.

ENVIRONMENTAL MANAGEMENT PLAN
139 JUNE 2017
PLANTATION AROUND PANIPAT NAPHTHA CRACKER
New Green belt area has been developed at the village Baljatan,
which is adjacent to Panipat Naphtha Cracker area. The green belt is
situated at the outer periphery of the PNC. It consists of 50m wide strips
along 7 km long periphery of PNC. This green belt has been developed with
an objective of growing mixed varieties of plants including fruit plants at the
spacing of 4m x 4m. Trees, which grows up to the height of 20-25 feet are
planted at the spacing of 8m x 8m (one alternate trees in each direction of
grid of 4m x 4m).Plants planted in the remaining pits grew up to 10 – 15 m.
In order to provide greenery in the initial years, small fruit bearing shrubs
are planted between two fruits plants
PLANTATION IN REFINERY TOWNSHIP:
There are about 12000 trees in the Refinery Township in an area of 20 ha
consisting of varieties of species mainly consisting of fruit bearing trees. . A
beautiful herbal park has also been developed in Refinery Township under
the consultation and guidance of a renowned horticulturist from
Yamunanagar Herbal Park.
ROSE GARDEN AND HERBAL PARK IN WWTP:
A Rose Garden and an herbal Park has been developed within the premises
of Panipat Refinery by using the treated water. The WWTP of PR is unique in
the sense that it is a living example of concept that Plant (Treatment) and
Green Belt Developed by PRPC
ENVIRONMENTAL MANAGEMENT PLAN
140 JUNE 2017
Plants can co-exist together supporting each other for their survival. The
WWTP supports the Rose Garden and the Herbal Park to meet the
requirement of the water, whereas the plants/ garden in turn in purifying
the air by generating oxygen in day time by Photosynthesis process and
supports the plant operation.
ANNUAL FLOWER SHOW AT REFINERY TOWNSHIP:
In order to encourage gardening and preservation of the environment
amongst the township residents, every year during the winter months
(January- February), annual flower show is being organized on a large scale,
where in lot of competitions are held in various fields and prizes are
distributed by eminent personalities.
PANIPAT & KARNAL- OUR CITIES.
Panipat Green Fund: Apart from our own initiatives, Panipat Refinery has
taken a lot of interest in greening the environment by contributing towards
Panipat Green Fund, which has been formed by District Conservator of
Forest, Panipat. The refinery has been associating for tree plantation in
Panipat City, since 1998-99.
In order to conserve the environment, Panipat refinery and the District
authorities are working hand in hand of Karnal and Panipat for the following
purposes:
To provide 1000 tree guard at National Highways, Panipat and Karnal
Beautification of National Park, Narain Singh Park & Hero Park at
Model Town of Panipat
Development of Hali Park, Marla Park, Librarywala Park.
DAV parks in the Panipat city and nearby locations
Panipat Refinery encourages forestry projects in nearby villages, schools &
Panchayat land. A massive medicinal tree plantation was organized in
Sithana Village Goshalaa.
Every year we are planting more than 1000trees around PR & 1000 trees
around PNC as per yearly target.
ENVIRONMENTAL MANAGEMENT PLAN
141 JUNE 2017
EXPENDITURE IN LAST TWO YEARS
Panipat Refinery spent the following amount on greenery plantation in last
two years.
Amount
2015-16 2016-17
35 40.1 *Figures in Lakhs
Occupational Health and Safety
For the proposed project, action plan for the implementation of OHSA
Standards as per OSHAS/USEPA is as shown below:
• Display of Occupational Health & Safety Policy;
• To comply with statutory legal compliance related to the OHC dept.;
• Develop Onsite and Offsite emergency plan as Emergency Procedures
to respond to Potential Emergencies;
• Schedule Regular Emergency Evacuation Drills by active participation
and evaluation as and when drill planned by safety department;
• Six monthly periodic medical examinations of all workers working
with the hazardous process;
• Reporting of all incidence and accidents by Accident & Incidence
Reporting
• System;
• Investigation of all incidence and accidents by Investigation Report
System;
• MSDS of all chemicals of company;
• Review of first aid facility;
• Preparing first aider & its information at work place;
• Identifying training needs of all the departments;
• Awareness of Occupational Hazards & General health promotional in
workers by conducting lectures for occupational health hazards in
annual planner at training center;
ENVIRONMENTAL MANAGEMENT PLAN
142 JUNE 2017
• Up-keep of ambulance & OHC by maintaining records
Health
In order to provide safe working environment and safeguard occupational
health andhygiene, the following measures will be undertaken:
• Periodic compulsory medical examination for all the plant employees
as per
• OSHA requirement and specific medical examination.
• All the employees shall be trained in Health, Safety and Environment
(HSE) aspects related to their job.
• Exposure of workers to noise, particularly in areas housing equipment
which produce 85 dB(A) or more will be monitored by noise
decimeters. Audiometric tests are also done at periodic intervals for all
the plant employees.
• Regular (6 monthly) periodic medical checkup of contract and
subcontract workers working at hazardous processes is done as per
clause 68 T of Factory’s Act.
9.4 Environmental Management Cell
A Health, Safety and Environment Department under its technical
services department in Refinery, which consists of well-qualified and
experienced technical personnel from the relevant fields, will be in place to
look after environment mitigation measures during the construction and
operation phase.
9.5 Budget for Environmental Management Plan
Details of various areas of EMP in construction and operation phase
and amount which shall be spent in respective area is shown below in Table
9.1
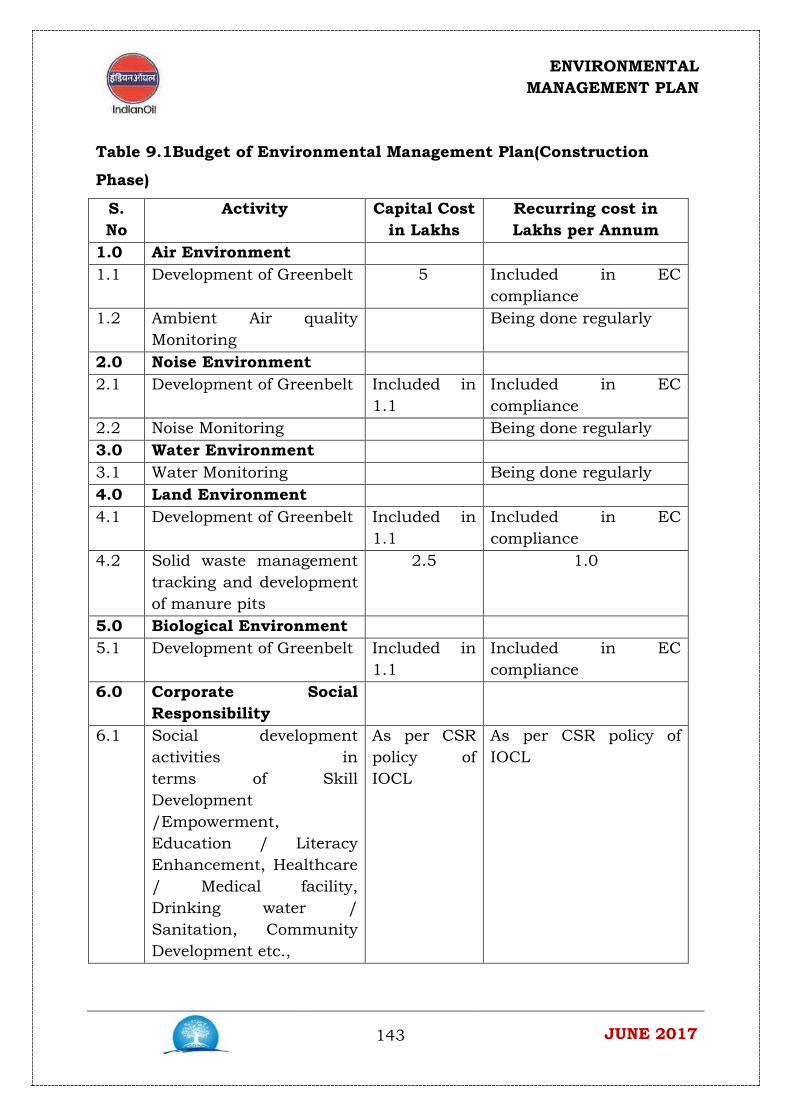
ENVIRONMENTAL MANAGEMENT PLAN
143 JUNE 2017
Table 9.1Budget of Environmental Management Plan(Construction
Phase)
S. No
Activity Capital Cost in Lakhs
Recurring cost in Lakhs per Annum
1.0 Air Environment 1.1 Development of Greenbelt 5 Included in EC
compliance 1.2 Ambient Air quality
Monitoring Being done regularly
2.0 Noise Environment 2.1 Development of Greenbelt Included in
1.1 Included in EC compliance
2.2 Noise Monitoring Being done regularly 3.0 Water Environment 3.1 Water Monitoring Being done regularly 4.0 Land Environment 4.1 Development of Greenbelt Included in
1.1 Included in EC compliance
4.2 Solid waste management tracking and development of manure pits
2.5 1.0
5.0 Biological Environment 5.1 Development of Greenbelt Included in
1.1 Included in EC compliance
6.0 Corporate Social Responsibility
6.1 Social development activities in terms of Skill Development /Empowerment, Education / Literacy Enhancement, Healthcare / Medical facility, Drinking water / Sanitation, Community Development etc.,
As per CSR policy of IOCL
As per CSR policy of IOCL
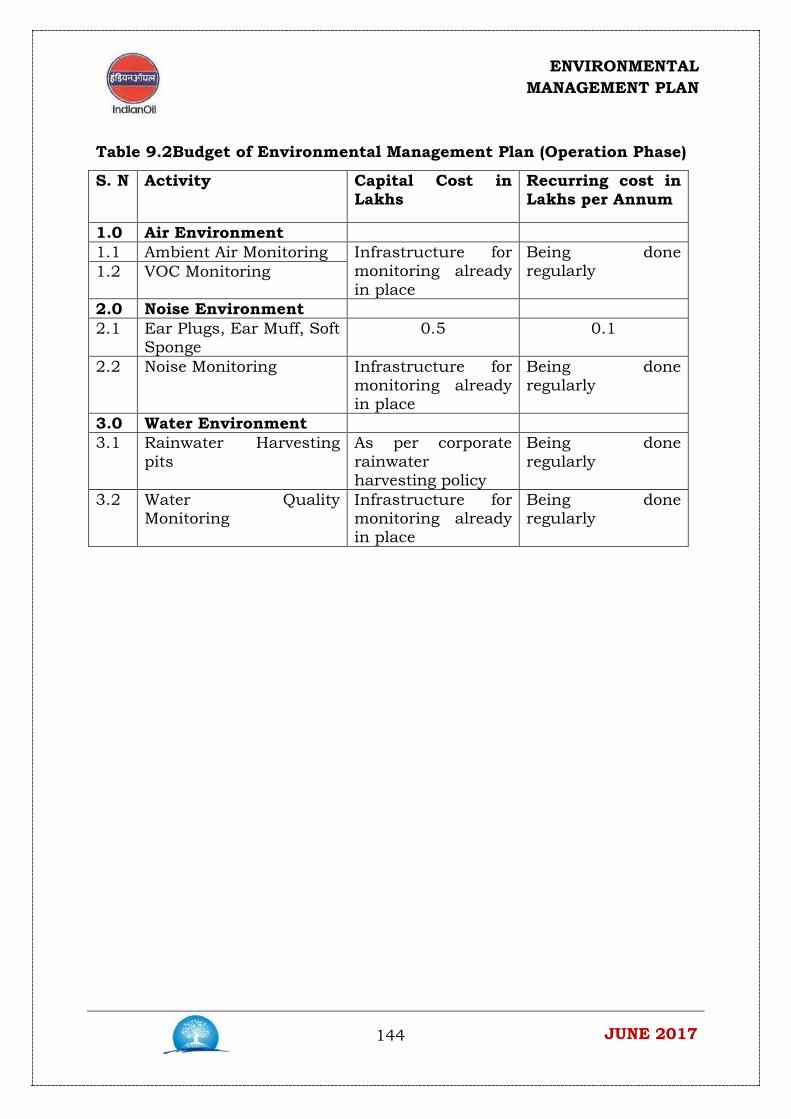
ENVIRONMENTAL MANAGEMENT PLAN
144 JUNE 2017
Table 9.2Budget of Environmental Management Plan (Operation Phase)
S. N Activity Capital Cost in Lakhs
Recurring cost in Lakhs per Annum
1.0 Air Environment 1.1 Ambient Air Monitoring Infrastructure for
monitoring already in place
Being done regularly 1.2 VOC Monitoring
2.0 Noise Environment 2.1 Ear Plugs, Ear Muff, Soft
Sponge 0.5 0.1
2.2 Noise Monitoring Infrastructure for monitoring already in place
Being done regularly
3.0 Water Environment 3.1 Rainwater Harvesting
pits As per corporate rainwater harvesting policy
Being done regularly
3.2 Water Quality Monitoring
Infrastructure for monitoring already in place
Being done regularly

DISCLOSURE OF CONSULTANTS
145 JUNE 2017
10.0 DISCLOSURE OF CONSULTANTS
10.1 Introduction
This chapter describes about the environmental consultant engaged in
preparation of EIA report for the BS – VI Quality Up-gradation and Capacity
Expansion of PX / PTA at Panipat Refinery.
10.2 The Consultant: ABC Techno Labs India Private Limited
ABC Techno Labs India Private Limited (formerly ABC Environ
Solutions Pvt. Ltd.) is an ISO 9001, ISO 14001 & OHSAS 18001 Certified
Company & leading Environmental Engineering & Consultancy Company
constantly striving towards newer heights since its inception in 2006. Our
Company is dedicated to provide strategic services in the areas of
Environment, Infrastructure, Energy, Engineering and Multilab.
It is the first firm to be accredited by NABET (National Accreditation
Board for Education and Training), Quality Council of India, as an EIA
Consultant, approved for carrying out EIA studies and obtaining
environmental clearance for various sectors such as Thermal Power Plants,
Infrastructure, Industrial Estates / Complexes/ Areas, Mining, Township &
area development and Building construction projects etc. ABC Techno Labs
is equipped with in-house, spacious laboratory, accredited by NABL
(National Accreditation Board for Testing & Calibration Laboratories),
Department of Science & Technology, Government of India.
Since establishment ABC Techno Labs focus on sustainable
development of Industry and Environment based on sound engineering
practices, innovation, quality, R&D and most important is satisfying
customers need. The company has successfully completed more than 100
projects of variety of industries, in the field of pollution control and
environmental management solutions. The company is also dealing in the
projects of waste minimization and cleaner production technology.

DISCLOSURE OF CONSULTANTS
146 JUNE 2017
The team of technocrats and scientist are well experienced to deal
with the design, Manufacture, Fabrication, Installation, commissioning of
Effluent/Wastewater treatment plants, Sewage Treatment plants, and
Combined Treatment plants.
The company is having well experienced team of Scientists &
Engineers who are looking after environmental projects & well equipped
analytical laboratory with a facility including analysis of physical, chemical
and biological parameters as per the requirements of the State Pollution
Control Board and our clients.
10.3 Services of ABC Techno Labs India Private Limited
Environmental Services
• Environmental Impact Assessment (EIA)
• Environmental Management Plan (EMP)
• Social Impact Assessment (SIA)
• Environmental Baseline data collection for Air, Meteorology, Noise,
Water, Soil, Ecology, Socio-Economic and Demography etc;
• Environmental Monitoring
• Socio Economic Studies
• Resettlement & Rehabilitation Plan
• Ecological & Human Health Risk Assessment Studies
• Ecological Impact Assessment
• Environmental Management Framework
• Solid Waste Management
• Hazardous Waste Management
• Internship & Training
Turnkey projects • Water Treatment Plants
• Sewage Treatment Plant

DISCLOSURE OF CONSULTANTS
147 JUNE 2017
• Recycling & Water Conservation Systems
• Zero Discharge System
Other services • Operation & Maintenance of Water & Waste Water Plants
• Water & Waste Water Treatment Chemicals
• Pilot Plant studies
• Feasibility studies & preparation of budgetary estimates
Laboratory services
• Chemical Testing
• Environmental Testing
• Microbiological Testing
• Food Testing
• Metallurgical Testing
10.4 Sectors Accredited By NABET
S. No. Sectors Name 1. Mining of minerals (Opencast only) Mining (Open cast and
Underground) 2. Offshore Oil and gas exploration, development & productions 3. Irrigation projects only 4. Thermal Power Plant 5. Mineral Beneficiation including palletisation 6. Metallurgical industries (sec. ferrous only) 7. Cement Plants 8. Petroleum refining industry 9. Leather/skin/hide processing industry 10. Chemical Fertilizers 11. Pesticides industry and pesticide specific intermediates 12. Petro-chemical Complexes (industries based on processing of
petroleum fractions & natural gas and/or reforming to aromatics) 13. Synthetic organic chemicals industry (dyes & dye intermediates;
bulk drugs and intermediates excluding drug formulations; synthetic rubbers; basic organic chemicals, other synthetic organic chemicals and chemical intermediates)

DISCLOSURE OF CONSULTANTS
148 JUNE 2017
14. Distilleries 15. Sugar Industry 16. Oil & Gas transportation pipeline (crude and refinery
/Petrochemical products)passing through national parks / sanctuaries / coral reefs / ecologically sensitive areas including LNG Terminal
17. Isolated storage & handling of hazardous chemicals (As per threshold planning quantity indicated in column 3 of Schedule 2 & 3 of MSIHC Rules 2016)
18. Airports 19. Industrial estates/ parks/ complexes/ Areas, export processing
zones(EPZs), Special economic zones (SEZs), Biotech parks, Leather complexes
20. Ports, harbours, jetties, marine terminals, break waters and dredging
21. Highways, Railways, transport terminals, mass rapid transport systems
22. Common effluent treatment plants (CETPs) 23. Common municipal solid waste management facility (CMSWMF) 24. Building and large construction projects including shopping malls,
multiplexes, commercial complexes, housing estates, hospitals, institutions
25. Townships and Area development Projects 10.5 Study Team
ABC Techno Labs India Private Limited has carried out this
Environmental Impact Assessment (EIA) study. The multidisciplinary team
included expertise in Environmental Impact Assessment, Air & Water
pollution & Control measures, Noise Control measures, Ecology & bio-
diversity, Land use, Geology, Environmental Chemistry and Socio-Economic
planner. The team members involved in EIA study area:

DISCLOSURE OF CONSULTANTS
149 JUNE 2017
S.No. Name Role 1. Dr. Muthiah Mariappan EIA coordinator
2. Dr. R.K. Jayaseelan Functional Area Expert – Land use, Water Pollution, Prevention & Control and Hydrogeology.
3. Dr. Chaitanya Sathe FAE – Water Pollution & EIA Review 4. Mr. Vivek Mariappan FAE – Risks and Hazards 5. Dr. Muthiah Mariappan FAE – Solid Waste Management 6. Dr. N. Sukumaran FAE – Ecology & Biodiversity 7. Dr. Thillai Govindarajan FAE – Geology
8. Mr. R. Rajendran FAE – Air Pollution, Prevention and Control - Noise & Vibration
9. Dr. Geetha Shreeneevasakam FAE – Socio-Economic Expert
Top Related