


Languages
Pages
Legal


ENSCO International | 2002 Annual Report | Positioning for the Future

2002 2001 2000 1999 1998
(in millions, except per share amounts and ratios)
Revenues $ 698.1 $ 817.4 $ 533.8 $ 363.7 $ 813.2Net Income 59.3 207.3 85.4 0.3 253.9Basic Earnings Per Share 0.42 1.51 0.62 0.00 1.82Diluted Earnings Per Share 0.42 1.50 0.61 0.00 1.81Working Capital 189.2 312.0 171.6 138.4 316.9Total Assets 3,061.5 2,323.8 2,108.0 1,983.7 1,992.8Long-Term Debt 547.5 462.4 422.2 371.2 375.5Stockholders’ Equity 1,967.0 1,440.2 1,328.9 1,234.6 1,245.0Current Ratio 2.0 3.1 2.5 2.0 3.0Long-Term Debt to Total Capital 0.22 0.24 0.24 0.23 0.23
Weighted Average CommonShares Outstanding
Basic 140.7 136.9 137.6 136.5 139.6Diluted 141.4 137.9 139.3 137.7 140.6
98 99 00
stockholders’ equity
(in $ millions) (in $ millions) (in $ millions)
net income
01 02
1,24
5.0
1,23
4.6
1,32
8.9
1,44
0.2
1,96
7.0
98 99 00 01 02
253.
9
0.3
85.4
207.3
59.3
total assets
98 99 00 01 02
1,99
2.8
1,983
.7
2,10
8.0
2,32
3.8
3,06
1.5

ENSCO I n t e rn a t i on a l I n co rpor a t ed
1
2 LETTER TO OUR STOCKHOLDERS
5 POSITIONING FOR THE FUTURE
6 ENSCO 105 - A NEW GENERATION
OF PREMIUM JACKUP RIG
8 ENSCO 81 - INVESTING TO MEET
OUR CUSTOMERS’ NEEDS
10 ENSCO 7500 - NEW DEPTH
OF SERVICE
13 OPERATIONS AND
FINANCIAL INFORMATION
55 DIRECTORS AND OFFICERS
56 STOCKHOLDER INFORMATION
ENSCO is one of the world’s leading offshore oil and gas drilling contractors
with a modern fleet of 56 offshore drilling rigs. The Company is geographically
balanced, with operations in North America, Europe, West Africa, the Middle
East, Asia Pacific, South America and the Caribbean. ENSCO is based in Dallas,
Texas, and is publicly traded on the New York Stock Exchange under the symbol ESV.
1H00 2H00 1H02 2H021H01 2H01
100%
80%
60%
40%
20%
0%
jackup rig revenue
Domestic International

Two thousand twowas a year of growthand refinement forENSCO. Significantprogress was madeon several fronts.
We strengthened ourcompetitive positionin the premium jack-
up market through the addition of six modern jackuprigs. ENSCO now has the youngest premium jackup rigfleet among the world’s publicly traded offshore contractdrilling companies. We continued our rig enhancementprogram, with increased emphasis on our Gulf ofMexico jackup rig fleet. We repositioned rigs interna-tionally to take advantage of strong markets in thePacific Rim and the Middle East. Today, the Company iswell balanced with almost an equal number of jackuprigs committed to domestic and international markets.We continued to refine our asset base to improve focusand earnings potential. The recently announced sale ofour Gulf of Mexico marine vessel fleet is in keeping withthis philosophy.
Our increased international presence in 2002, combinedwith stronger overseas jackup markets, helped to alleviateweaker results from our Gulf of Mexico operations.ENSCO’s revenue in 2002 was $698.1 million comparedto $817.4 in 2001, and net income decreased to $59.3million from $207.3 million the year earlier. Our 2002results included a $46.1 million after tax non-cash
charge taken in the fourth quarter of 2002 for impairmentof the Company’s Venezuela assets and operations. Thiswrite-down was necessitated by the ongoing politicaland economic uncertainty in the Country, and the dis-mantling of the national oil company. Six of our bargerigs remain in Venezuela and, while we remain confidentof potential future work opportunities for these rigs, thetiming of a resumption of activity is uncertain.
ENSCO’s financial position remains strong. Our debt tototal capitalization ratio was 22% at the end of 2002,and our long-term debt net of cash was only 16% oftotal capitalization.
Our financial strength continues to facilitate oppor-tunistic expansion. In August 2002, we strengthenedour position in the high-specification jackup rig marketthrough the acquisition of Chiles Offshore Inc. Theaddition of four active premium jackup rigs enabled usto realize immediate cash flow benefit. Construction ofthe fifth rig was completed in November 2002 and therig began operations shortly thereafter.
The Chiles fleet consisted of the newest premium jack-up rigs in the world, with all five rigs having been builtsince 1999. We also added the ENSCO 102 in May 2002,a rig in which ENSCO owns a 25% joint-venture interest.The Company, which has marketing and operationalresponsibilities for the rig, has the option to acquire theremaining 75% interest at any time through May 2004.
We also continued to strengthen our competitive positionthrough rig enhancements, a program we began in themid-nineties. We have completed upgrades on all of ourrigs in the North Sea and the Pacific Rim, with theexception of one rig in Southeast Asia that is scheduledfor 2003. Major upgrades were completed on two ofour large Gulf of Mexico jackups in 2002, and moderateenhancements were undertaken on three of our smallerdomestic jackup rigs. When the planned enhancementprogram is completed in 2005, we will have invested inexcess of $1 billion to extend service life and enhancefleet capability. Almost half of our jackup rig fleet will beable to address deeper and more rigorous drillingrequirements. These rigs will be equipped with greaterloading and lifting capacity, improved hydraulic pumpingcapability, state-of-the-art drilling fluid systems, andenhanced environmental protection. We believe that, asdrilling requirements become more stringent and asfleet renewal grows more imperative, maintaining abalance between capability and cost will be crucial.
We continue to reposition assets to achieve bettergeographic balance. This balance enables us to weatherregional market volatility, while the longer term contractsavailable in many international markets provide more earn-ings stability. We mobilized three of our jackups from theGulf of Mexico to the Pacific Rim and the Middle East inresponse to opportunities in those areas. We entered theWest African jackup market by securing a term contractwith a major oil company and relocating a rig from theNorth Sea to Nigeria. Additionally, we relocated a barge rigfrom Venezuela to Indonesia in response to a term contract.
To Our S tockho l de r s
2
To further refine our fleet, we are pruning under-performing assets. Representative of this undertaking, wepreviously retired two platform rigs and sold four bargerigs. In 2002, we continued the process by retiring twoadditional platform rigs, reducing the original fleet ofnine to five, and decided to sell the two oldest barge rigsin Venezuela, thereby reducing the fleet from the originalthirteen to seven. Additionally, we recently announced thepending divestiture of the marine vessel fleet.
We are enhancing the effectiveness of our managementsystems and controls by setting, and meeting, highstandards of honesty, integrity and safety. Our systemsand processes are being institutionalized as we plan,prosecute, audit and improve - continuously.
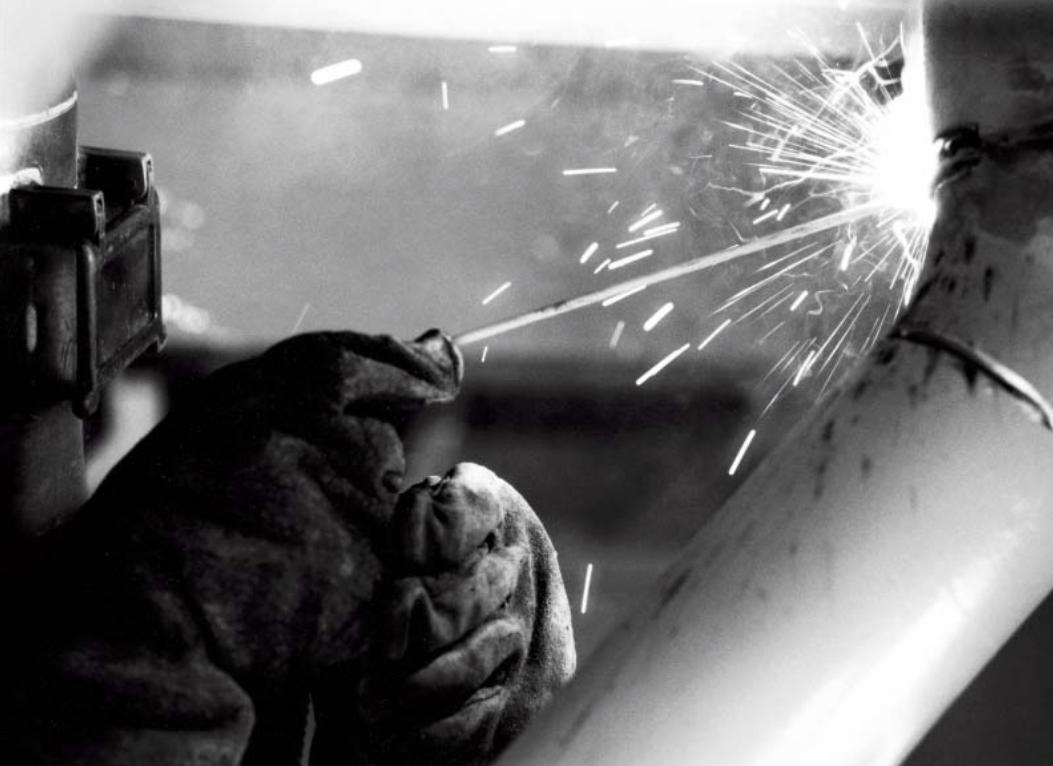
We consider our safety, health, and environmental program(SHE) a prime example of our ongoing commitment toexcellence. Stated simply, protecting our employeesfrom injury and the environment from harm, are funda-mental to ENSCO’s success. Our commitment will ensurethat ENSCO’s SHE performance is exemplary. In 2002,ENSCO reduced its injury incident rate to the lowestlevel in the Company’s history, and the majority of ouroperational areas are achieving SHE performance levelsthat are significantly better than the industry norm.
This is the third year of the past four that ENSCO’s Gulfof Mexico operations has been named by the MineralManagement Service as one of three finalists for “SafeContractor of the Year”, an award the Company won in2000. ENSCO also was recently recognized by a major
international customer as being the first contractor inthe Gulf of Mexico to deliver an EnvironmentalManagement System that met the customer’s stringentrequirements. While this is a significant achievement forboth the customer and the Company, it represents onlyanother step toward our goal of establishing ENSCO’sSHE program as the industry standard.
This commitment to excellence also extends to corporategovernance. ENSCO is proactive in a rapidly changingregulatory environment, and is achieving leading-edgecompliance with the letter and spirit of the Sarbanes-Oxley Act of 2002. Additionally, the Company has imple-mented new corporate accountability requirements asmandated by the Securities Exchange Commission andNew York Stock Exchange. Details and full disclosureof ENSCO’s ethics and corporate governance standardsare fully disclosed on the Company’s websitewww.enscous.com.
Despite current economic and geo-political uncertainties,we remain on course. We are increasing our presencein the high-end of the premium jackup rig marketthrough rig enhancements, acquisitions and, in a highlydisciplined and conservative manner, new construction.In keeping with this strategy, we recently announced anagreement to construct a new high-specification jackuprig through a joint-venture much like that used for theENSCO 102. The new rig, to be named ENSCO 106, willaddress the heart of the high-performance premiumjackup market in a cost-effective manner. The arrange-ment will give ENSCO a 25% ownership in the rig with
the opportunity to purchase the remaining 75% interestwithin two years of its delivery date.
In closing, this letter would not be complete without atribute to a recently departed long-term employee ofENSCO. Steve Gruver and his family perished in a privateplane crash in September. Steve had been with ENSCOsince 1987 and served in management positions aroundthe world, most recently as General Manager of NorthAmerica Operations. Steve and his family were an integralpart of the ENSCO family and will be sorely missed.
We would also be remiss if we did not recognizeChristopher Gaut, ENSCO’s former Senior Vice Presidentand Chief Financial Officer, who resigned in February2003 to assume a senior position at a major oilfieldservice company. Cris served ENSCO for fifteen yearsand made a significant contribution to the Company’ssuccess. We are grateful to Cris for his years of serviceand wish him our best in his new endeavor.
As we begin 2003, we remain patient, disciplined, andfocused. Through the dedication and hard work of ourpeople, we continue to successfully prosecute our businessplan for the ultimate benefit of all of our stakeholders.
Carl F. ThorneChairman and Chief Executive OfficerMarch 10, 2003
A YEAR OF POS IT IONING, PARTNERSH IP AND GROWTH
3

ENSCO is one of the world’s premier offshore oil andgas drilling contractors. Since its inception in 1987, theCompany has focused on building a premium fleet ofoffshore rigs, second to none in terms of quality andreliability, operated to epitomize service and safety. TheCompany has opportunistically built its asset basethrough acquisitions, rig upgrades and selective newbuild programs, financed principally through internallygenerated funds. By delivering high-quality equipment,manned by knowledgeable, capable crews, ENSCO hasefficiently and safely served the needs of operatingcompanies around the world.
The offshore industry continues to evolve as technologyopens new frontiers. By way of example, most drillingon the Gulf of Mexico continental shelf has historicallybeen to shallow horizons, typically to less than 10,000feet. Only a very small percentage of the wells drilled onthe shelf have been deeper than 15,000 feet. That ischanging. Deeper, more complex wells are now beingdrilled in search of larger reserves.
Increasingly, operating companies are looking fordrilling equipment that can construct more complexwells in less time, safely, and without environmentalharm. As drilling requirements become more demanding,smaller, lower-specification jackup rigs are becomingless competitive. This is the primary reason for effectiveutilization of premium jackup rigs in the Gulf of Mexicobeing above 90% over the course of 2002, while utilizationfor less capable jackup rigs was significantly lower.
Given this trend to more difficult drilling applications,ENSCO continues to strengthen its position in the high-specification jackup market. During 2002, ENSCOacquired five ultra-premium jackup rigs and tookdelivery of another rig built under a joint venture with ashipyard. The Company recently announced a secondjoint-venture ultra premium jackup rig to be deliveredin 2005.
Since the mid-nineties, ENSCO has invested heavily inwhat will be over a billion-dollar enhancement programto improve the capabilities and life expectancy of itsexisting fleet. The upgrade and renewal program isscheduled to be completed by the end of 2005.
Not only is the industry evolving to deeper, more complexdrilling, it is also exploring new deepwater frontiers. Asoperating companies move farther offshore and asdeepwater infrastructure is developed, the need forcost-effective development tools will be critical. TheCompany’s deepwater entrée, the ENSCO 7500 semisub-mersible rig, is well suited to address this market. Therig, completed in late 2000 at a cost of approximately$200 million, has been well received by customers.ENSCO will continue to look for opportunities to furtheraddress this market with capable, cost-effective equip-ment like the ENSCO 7500.
Pos i t i on i n g fo r t h e Fu t u re
5

E N S C O 1 0 5
R i g S p e c i f i c a t i o n s
Rig Name: ENSCO 105
Type: Jackup
Design: KFELS MOD V-B
Maximum Water Depth: 400’
Maximum Drilling Depth: 30,000’
Variable Load-Drilling:6,649 Kips
Cantilever Movement:70’ aft x 30’ (+/- 15’ off center)
Derrick-Hook Load Capacity:1.5 million lbs.
Mud Pumps: Three 2,200 hp
Zero Discharge: Yes
Classifications: A.B.S.
Quarters: 90 P.O.B.

For many years, the Marathon LeTourneau 116-C (MLT116-C) rig has been considered the workhorse jackuprig. However, as exploration and development projects
dictate more difficult drilling applications, operatingcompanies are looking for more efficient rig designsand sophisticated equipment. Newer and more technically
equipped rigs such as ENSCO 105, a Keppel Fels Mod V-Bdesign, offer greater flexibility and capability to opera-tors. The ENSCO 105, completed in November 2002, isthe Company’s newest high-specification jackup rig andcomplements the Company’s even more capable, harsh-environment jackup rigs, Keppel Fels Mod V-A design,the ENSCO 101 and ENSCO 102.
The state-of-the-art ENSCO 105 is capable of working inup to 400-foot water depths and is well suited for inter-national work with living quarters and platform space tohandle assignments in remote locations. The ENSCO105 has the ability to drill to 30,000-foot depths and hasa larger deck area and greater loading parameters forhandling larger casing programs and extra equipment.The cantilever reaches a full 70 feet, enabling thedrilling package to be extended over larger productionplatforms, a feature often required in developmentdrilling. For handling the added downhole weight asso-ciated with deep or extended-reach wells, the rig’s largederrick is capable of lifting 1.5 million lbs. (hook-loadcapacity). The ENSCO 105 is outfitted with three 2,200-horsepower mud pumps (rated to 7,500 psi) andENSCO’s enhanced mud system. The third mud pumpprovides redundancy for standard applications anddelivers additional hydraulic capacity to increasedrilling efficiency on more difficult wells. Presently, theCompany’s fleet offers eight rigs, including the ENSCO7500, nine once the ENSCO 106 is delivered, that areequipped with the larger mud pumps.
ENSCO 105 - A NEW GENERAT ION OF PREM IUM JACKUP R IG
7
H
20 73
C O M P A R I S O N O F T H E E N S C O 1 0 5 T O A M L T 1 1 6 - C J A C K U P R I G
The derrick is 32’ x 35’ providingmore pipe racking capacity.
MLT 116-C hull outline
Larger hull provides spacefor increased mud storagefrom 1,600 lbs. to 3,000 lbs.and room for three 2,200 hpmud pumps.
The cantilever load capacity at 45’ is increased approximately 20%.
A longer reach cantilever with
considerably largerdrilling pattern
enables the rig to drillmore wells withoutmajor repositioning.

E N S C O 8 1
R i g S p e c i f i c a t i o n s
Rig Name: ENSCO 81
Type: Jackup
Design: MLT 116-C
Maximum Water Depth: 350’
Maximum Drilling Depth: 30,000’
Variable Load-Drilling:5,045 Kips
Cantilever Movement:47’ 6” aft x 24’ (+/- 12’ off center)
Derrick-Hook Load Capacity:1.5 million lbs.
Mud Pumps: Three 1,600 hp
Zero Discharge: Yes
Classifications: A.B.S.
Quarters: 90 P.O.B.

Commencing in the mid-nineties, ENSCO initiated amajor rig upgrade and refurbishment program.Accomplished in less time and on a more cost-effectivebasis than would be possible through new construction,the Company’s jackup rig fleet is now one of the mostmodern, functional, and competitive fleets in the industry.Capability and performance enhancements are made tomeet more demanding customer requirements andafford the Company the opportunity to achieve higherutilization and day rates. To date, twenty-nine ofENSCO’s jackup rigs have undergone varied levels ofenhancement and life extension upgrades. This billion-dollar plus program is financed by internally generatedcash flow.
All upgrade and/or refurbishment projects includecertain common baseline improvements, including hullsteel and piping replacement (as required); jackingsystem reconstruction; installation of the ENSCO propri-etary “mud tower” or solids control system; quartersrefurbishment with restoration of internal furnishingand systems; and other quarters refinements to providepleasant, well-lighted accommodations. Leg extensionwork is also common to allow operation in deeperwater. As a matter of policy, every rig is fitted withcontainment systems to provide singlepoint dischargefor gray water in accordance with the Company’senvironmental management plan.
ENSCO has focused its efforts primarily on larger unitsthat are the most technically and commercially suitedfor upgrade. The enhancement of ENSCO 81, completedin early 2003, included structural reinforcement, derrickreplacement, and equipment changes to allow greaterdeck and cantilever loading as well as the handling ofheavier hook-loads. The addition of a third mud pumptogether with associated high-pressure piping upgradeshas increased hydraulic capability. Power generation,power distribution and well control systems wereenhanced as necessary to support the improvements.Living quarters and office space were also expanded.
Five additional major rig upgrades are planned for theGulf of Mexico jackup fleet over the next few yearswhich will largely complete the enhancement programon ENSCO’s larger jackup rigs. Minor work on theCompany’s 250-foot jackups is also underway, with sixrigs completed and another seven planned through theend of 2005.
ENSCO 81 - INVEST ING TO MEET OUR CUSTOMERS ’ NEEDS
9
143.
2 176.
0
282.
3 330.
8
248.
1
256.
1
145.
2
226.
9
1995 1996 1997 1998 1999 2000 2001 2002
capital expenditures
New Construction and AcquisitionSustaining Enhancements
(in $ millions)

ENSCO has demonstrated its ability to compete in thedeepwater market with its proprietary semisub-mersible design, the ENSCO 7500. Delivered in 2000 ata construction cost well below comparable newly builtdeepwater rigs, the ENSCO 7500 has performed welland continues to meet or exceed expectations. ENSCO’ssemisubmersible rig, operating under a long-termcontract in the Gulf of Mexico, has been sublet to variousoperators and has received several commendationsfrom these customers.
The ENSCO 7500 addresses the heart of the deepwatermarket, and is suited for operation in all deepwaterareas except ultra-harsh environments like the NorthSea. By designing the rig for the broader market andavoiding the significant extra cost required to address avery limited harsh-environment market, ENSCO wasable to deliver a cost-effective deepwater rig that iscapable of earning an attractive return. The ENSCO7500 has been cited by one Wall Street firm as having thehighest rate of return of any new deepwater rig project.
The design of the ENSCO 7500 incorporates simple flatsteel construction for the columns with equipment posi-tioned on the deck of the rig for ease of assembly andmaintenance. With a variable load capacity in excess of8,000 short tons and with water depth capability of upto 8,000 feet, the rig is well suited for exploration anddevelopment activity in deepwater markets like the Gulf
of Mexico, West Africa, and Brazil. Further refinementsof the ENSCO 7500 design have now been completed,and drawings and specifications are on the shelf so as to
facilitate rapid response when ENSCO is presented anopportunity to expand in the deepwater market.
ENSCO 7500 - NEW DEPTH OF SERV ICE
10

E N S C O 7 5 0 0
R i g S p e c i f i c a t i o n s
Rig Name: ENSCO 7500
Type: Semisubmersible-Dynamically Positioned
Maximum Water Depth: 8,000’
Maximum Drilling Depth: 30,000’
Variable Load-Drilling:8,000 Kips
Derrick-Hook Load Capacity:1.5 million lbs.
Mud Pumps: Three 2,200 hp
Zero Discharge: Yes
Classifications: A.B.S.
Quarters: 122 P.O.B.


Opera t i on s a nd F i n an c i a l I n fo rma t i on
14 offshore equipment listing
17 operating statistics
18 management’s discussion and
analysis of financial condition
and results of operations
31 reports of management and
independent accountants
33 consolidated statement of
income
34 consolidated balance sheet
35 consolidated statement of
cash flows
36 notes to consolidated
financial statements
54 selected consolidated
financial data

14
O f f s ho re Equ i pmen t L i s t i n g
jackup rigs
Year Built/ Maximum Water Depth/ Current CustomerRig Name Rebuilt Rig Make Drilling Depth Location as of 2/15/03
North AmericaENSCO 55 1981/1997 FG-780II-C 300’/25,000’ Gulf of Mexico Bois d’ArcENSCO 60 1981/1997 Lev-111-C 300’/25,000’ Gulf of Mexico LLOG ExplorationENSCO 64 1973/2002 MLT-53-S 350’/30,000’ Gulf of Mexico LLOG Exploration(1)
ENSCO 67 1976/1996 MLT-84-S 400’/30,000’ Gulf of Mexico LLOG ExplorationENSCO 68 1976 MLT-84-S 350’/30,000’ Gulf of Mexico LLOG ExplorationENSCO 69 1976/1995 MLT-84-S 400’/25,000’ Gulf of Mexico W&T OffshoreENSCO 74 1999 MLT Enhanced 116-C 400’/30,000’ Gulf of Mexico W&T OffshoreENSCO 75 1999 MLT Super 116-C 400’/30,000’ Gulf of Mexico ExxonMobilENSCO 81 1979/2003 MLT-116-C 350’/30,000’ Gulf of Mexico BP(2)
ENSCO 82 1979/2003 MLT-116-C 300’/30,000’ Gulf of Mexico Shipyard(3)
ENSCO 83 1979 MLT-82 SD-C 250’/25,000’ Gulf of Mexico ATPENSCO 84 1981 MLT-82 SD-C 250’/25,000’ Gulf of Mexico Apache EnergyENSCO 86 1981 MLT-82 SD-C 250’/30,000’ Gulf of Mexico ExxonMobilENSCO 87 1982 MLT-116-C 350’/25,000’ Gulf of Mexico Noble EnergyENSCO 88 1982 MLT-82 SD-C 250’/25,000’ Gulf of Mexico TransworldENSCO 89 1982 MLT-82 SD-C 250’/25,000’ Gulf of Mexico UnocalENSCO 90 1982/2002 MLT-82 SD-C 250’/25,000’ Gulf of Mexico ExxonMobilENSCO 93 1982/2002 MLT-82 SD-C 250’/25,000’ Gulf of Mexico Ocean EnergyENSCO 95 1981 Hitachi-250-C 250’/25,000’ Gulf of Mexico ChevronTexacoENSCO 98 1977 MLT-82 SD-C 250’/25,000’ Gulf of Mexico Shipyard(4)
ENSCO 99 1985 MLT-82 SD-C 250’/30,000’ Gulf of Mexico ExxonMobilENSCO 105 2002 KFELS-MOD V-B 400’/30,000’ Gulf of Mexico ChevronTexaco(5)
Europe/West AfricaENSCO 70 1981/1996 Hitachi-300-C NS 250’/30,000’ Denmark DONGENSCO 71 1982/1995 Hitachi-300-C NS 225’/25,000’ Denmark MaerskENSCO 72 1981/1996 Hitachi-300-C NS 225’/25,000’ United Kingdom ConocoPhillipsENSCO 80 1978/1995 MLT-116-CE 225’/30,000’ Netherlands NAMENSCO 85 1981/1995 MLT-116-C 225’/25,000’ United Kingdom BHPENSCO 92 1982/1996 MLT-116-C 225’/25,000’ Netherlands Shipyard(6)
ENSCO 100 1987/2000 MLT-150-88-C 325’/30,000’ Nigeria ShellENSCO 101 2000 KFELS-MOD V-A 400’/30,000’ Denmark DONG
E N S C O 2 0 0 2 A N N U A L R E P O R T

15
jackup rigs (continued)
Year Built/ Maximum Water Depth/ Current CustomerRig Name Rebuilt Rig Make Drilling Depth Location as of 2/15/03
Asia PacificENSCO 50 1983/1998 FG-780II-C 300’/25,000’ Cambodia ChevronTexacoENSCO 51 1981/2002 FG-780II-C 300’/25,000’ Brunei Brunei ShellENSCO 52 1983/1997 FG-780II-C 300’/25,000’ Malaysia Petronas CarigaliENSCO 53 1982/1998 FG-780II-C 300’/25,000’ Australia ROC, TAPENSCO 54 1982/1997 FG-780II-C 300’/25,000’ India CairnENSCO 56 1982/1997 FG-780II-C 300’/25,000’ Australia Apache EnergyENSCO 57 1982/2003 FG-780II-C 300’/25,000’ Singapore Shipyard(7)
ENSCO 94 1981/2001 Hitachi-250-C 250’/25,000’ Qatar Ras LaffanENSCO 96 1982/1997 Hitachi-250-C 250’/25,000’ Qatar Ras LaffanENSCO 97 1980/1997 MLT-82 SD-C 250’/25,000’ Qatar MaerskENSCO 102 2002 KFELS-MOD V-A 400’/30,000’ Malaysia Sarawak ShellENSCO 104 2002 KFELS-MOD V-B 400’/30,000’ Australia ConocoPhillips
South America/CaribbeanENSCO 76 2000 MLT Super 116-C 350’/30,000’ Trinidad and Tobago BP
semisubmersible rig
Maximum Water Depth/ Current CustomerRig Name Year Built Rig Type Drilling Depth Location as of 2/15/03
ENSCO 7500 2000 Dynamically Positioned 8,000’/30,000’ Gulf of Mexico ConocoPhillips(8)
E N S C O 2 0 0 2 A N N U A L R E P O R T

E N S C O 2 0 0 2 A N N U A L R E P O R T
barge rigs
Year Built/ Maximum Current CustomerRig Name Rebuilt Drilling Depth Location as of 2/15/03
ENSCO I 1999 30,000’ Indonesia TFEENSCO II 1999 30,000’ Venezuela ChevronTexacoENSCO III 1999 30,000’ Venezuela Available(9)
ENSCO XI 1994 25,000’ Venezuela Stacked(9)
ENSCO XII 1994 25,000’ Venezuela Available(9)
ENSCO XIV 1994 25,000’ Venezuela Stacked(9)
ENSCO XV 1994 25,000’ Venezuela Stacked(9)
platform rigs
Year Built/ Maximum Current CustomerRig Name Rebuilt Drilling Depth Location as of 2/15/03
ENSCO 23 1980/1998 25,000’ Gulf of Mexico Available(9)
ENSCO 24 1980/1998 25,000’ Gulf of Mexico Available(9)
ENSCO 25 1980/1998 30,000’ Gulf of Mexico ChevronTexacoENSCO 26 1982/1999 30,000’ Gulf of Mexico Available(9)
ENSCO 29 1981/1997 30,000’ Gulf of Mexico W&T Offshore
marine fleet
No. of YearVessel Type Vessels Built Horsepower Length Current Location
AHTS(10) 5 1975-1983 5,800-12,000 195’-230’ Gulf of MexicoSupply 22 1977-1985 1,800-3,500 166’-230’ Gulf of Mexico
(1) The ENSCO 64 was idle on February 15, 2003 but has secured acontract with LLOG Exploration and commenced drilling opera-tions on February 25, 2003.
(2) The ENSCO 81 was in the shipyard on February 15, 2003, but iscommitted to BP and expected to commence drilling operationsin March 2003.
(3) The ENSCO 82, which entered the shipyard in early February2003, is expected to leave the shipyard in August 2003 and iscurrently uncommitted.
(4) The ENSCO 98, which entered the shipyard in early February2003, is expected to leave the shipyard in mid-year 2003 and iscurrently uncommitted.
(5) The ENSCO 105 was idle on February 15, 2003, but has secured acontract with ChevronTexaco and expected to commence drillingoperations in early March 2003.
(6) The ENSCO 92 was in the shipyard on February 15, 2003, but iscommitted to Gaz de France and expected to commence work inMay 2003.
(7) The ENSCO 57, which entered the shipyard in early February2003, is expected to leave the shipyard in mid-year 2003 and iscurrently uncommitted.
(8) The ENSCO 7500 is currently operating for ConocoPhillips undera contract assignment from Burlington Resources.
(9) Rigs classified as available are being actively marketed and cancommence work on short notice. Stacked rigs do not have oper-ating crews immediately available and may require some recom-missioning before commencing operations.
(10) Anchor handling towing supply vessels.
16

E N S C O 2 0 0 2 A N N U A L R E P O R T
Oper a t i n g S t a t i s t i c s
2002(1) 2001 2000 1999 1998
offshore drilling rig utilization and day ratesUtilization:
Jackup rigsNorth America 88% 82% 99% 93% 93%Europe/West Africa 81% 88% 59% 48% 97%Asia Pacific 78% 96% 73% 46% 61%South America/Caribbean 100% – – – –
Total jackup rigs 84% 86% 86% 75% 88%Semisubmersible rig - North America(2) 92% 92% 77% – –Barge rig - Asia Pacific(3) 40% – – – –Barge rigs - South America/Caribbean 17% 34% 33% 31% 100%Platform rigs 57% 56% 57% 51% 89%
Total 73% 74% 73% 65% 90%
Average day rates: Jackup rigs
North America $ 26,726 $ 46,751 $ 34,839 $18,400 $43,473Europe/West Africa 74,759 65,172 38,560 51,266 95,307Asia Pacific 58,836 42,313 37,548 41,217 49,328South America/Caribbean 77,223 – – – –
Total jackup rigs 45,160 49,942 35,816 24,286 54,242Semisubmersible rig - North America(2) 185,655 180,146 173,905 – –Barge rig - Asia Pacific(3) 41,750 – – – –Barge rigs - South America/Caribbean 39,987 42,553 39,897 35,113 22,069Platform rigs 25,852 27,299 24,369 23,204 25,534
Total $ 47,503 $ 50,371 $ 35,303 $24,945 $45,112
marine fleet utilization and day ratesUtilization:
AHTS(4) 69% 67% 55% 65% 67%Supply 76% 83% 72% 74% 87%Mini-supply(5) – – 13% 25% 73%
Total 75% 80% 65% 62% 81%
Average day rates:AHTS(4) $ 12,211 $ 12,456 $ 13,325 $13,600 $15,870Supply 5,276 7,121 3,960 2,774 6,917Mini-supply(5) – – 1,889 2,019 4,041
Total $ 6,437 $ 7,921 $ 5,271 $ 4,394 $ 7,308
(1) Offshore Drilling Rig Utilization and Day Rates include the resultsof the Chiles rigs from the August 7, 2002 acquisition date. Of thefive jackup rigs acquired, one is operating offshore Trinidad andTobago and its results are included in the South America/Caribbean region, one is operating offshore Australia and itsresults are included in the Asia Pacific region, and three are oper-ating in the Gulf of Mexico and their results are included in the
North America region (including one rig that was under construc-tion at the August 7, 2002 acquisition date that subsequentlyentered service in December 2002).
(2) The ENSCO 7500, the Company’s deepwater semisubmersible rig,commenced drilling operations in December 2000.
(3) The Company mobilized a barge rig from Venezuela to Indonesiathat commenced a long-term contract in December 2002.
(4) Anchor handling towing supply vessels.(5) The Company sold two mini-supply vessels in the fourth quarter of
1999 and sold its remaining six mini-supply vessels during 2000.
17

18
Mana gemen t ’s D i s cu s s i on and Ana l y s i s o f F i n an c i a l Cond i t i on a nd Re su l t s o f Oper a t i on s
business environmentThe Company is one of the leading international providersof offshore drilling and marine transportation services tothe oil and gas industry. The Company’s operations areconcentrated in the geographic regions of North America,Europe/West Africa, Asia Pacific and South America/Caribbean.
Demand for the Company’s services is significantlyaffected by worldwide expenditures for oil and gas drilling.Expenditures for oil and gas drilling may fluctuate substan-tially from year to year and from region to region. Suchfluctuations result from many factors, including demandfor oil and gas, world economic conditions, the legislativeenvironment in the U.S. and other countries in which theCompany operates, production levels and other activities ofOPEC and other oil and gas producers, and the impact thatthese and other events have on the current and expectedfuture pricing of oil and natural gas.
The Company’s domestic offshore drilling operationsare conducted in the Gulf of Mexico. The U.S. naturalgas market and trends in oil company spending largelydetermine domestic offshore drilling industry conditions.U.S. natural gas prices increased significantly during 2000,and demand, and ultimately day rates, for offshore drillingrigs increased as many oil companies accelerated drillingprograms in response to historically high natural gasprices. Jackup rigs mobilized to the Gulf of Mexico frominternational markets to take advantage of this strongdemand. During 2001, natural gas prices decreased fromrecord levels, and oil company Gulf of Mexico drillingbudgets were sharply reduced over the course of the yearand remained at moderate levels during 2002. Currently,demand for jackup drilling rigs in the Gulf of Mexico issignificantly lower than that realized in early 2001.Although some jackup rigs have now departed the Gulf ofMexico for international service, the supply of jackup rigsis still in excess of current demand. As a result of thisimbalance, day rates are significantly lower today than theywere in 2000 and early 2001. The Company does notexpect any significant improvement in domestic day rates
during the first half of 2003.Industry conditions in most international offshore
drilling markets have improved over the last two years, asmany of the major international and government-owned oilcompanies have increased spending in those markets.Cutbacks in OPEC production and an improved outlook foroil demand contributed to higher oil prices in 1999 and2000, and a more favorable climate for oil company spending.Although oil prices declined somewhat over the course of2001, increased drilling activity related to major natural gasdevelopment projects in Asia Pacific and the Middle Eastcontributed to increased demand for jackup drilling rigs inthose regions. Demand and day rates for international jackuprigs strengthened during 2001 and much of 2002, particu-larly in Europe and Asia Pacific. However, in the second halfof 2002, day rates began to decrease modestly in Europe.Day rates for jackup rigs in Europe have stabilized to datein 2003 at the levels in effect at the end of 2002, but currentactivity levels could lead to some near term softening ofday rates in Europe. Recently, concerns related to globaleconomic activity and the impact on oil demand growthhave contributed to more modest increases in oil companyspending. Uncertainty with regard to the Middle East andthe political unrest in Venezuela have also contributed tocautiousness by oil companies, and this may impact spendingplans over the course of 2003. Although the outlook isuncertain, at this time the Company expects day rates andutilization for international jackup rigs to remain relativelystable throughout 2003.
results of operationsOn August 7, 2002, the Company completed its mergerwith Chiles Offshore Inc. (“Chiles”), which has beenaccounted for as a purchase business combination inaccordance with generally accepted accounting principlesin the United States, with the Company treated as theacquirer. Under the terms of the Merger Agreement, eachChiles shareholder received 0.6575 of a share of theCompany’s common stock and $5.25 in cash in
exchange for each share of Chiles common stock held.Upon completion of the transaction, the Company issuedapproximately 13.3 million shares of its common stockand paid approximately $106.6 million in cash to the holdersof Chiles common stock. The Company’s financial state-ments include the operating results of Chiles from theAugust 7, 2002 acquisition date. The acquired Chilesoperations consisted of a fleet of five ultra premium jackuprigs, including two rigs operating in the Gulf of Mexico,one rig operating offshore Australia, one rig operatingoffshore Trinidad and Tobago, and one rig under con-struction that subsequently entered service in the Gulf ofMexico. The acquisition of Chiles further strengthened theCompany’s position in the premium jackup market, whichthe Company believes currently represents one of thestrongest segments of the offshore drilling market.
The Company’s results for 2002 as compared to 2001generally reflect a weakened demand for drilling rigs in theGulf of Mexico and the resulting decrease in industry dayrates. The reduced operating results in domestic drillingoperations are somewhat offset by the continued strength ofthe Company’s international operations, particularly in theAsia Pacific region, where operating results have improvedsubstantially from the prior year as a result of increased dayrates and the increased size of the Company’s Asia Pacificrig fleet. The decrease in overall operating results in 2002as compared to 2001 is also attributable to a $59.9 millionimpairment charge in 2002 related to the Company’s bargerigs in Venezuela and $28.8 million of lump sum, earlycontract termination payments received in 2001 also relatedto the Company’s Venezuelan operations.
The Company’s 2001 results reflect a continuedimprovement in industry conditions from those experi-enced during 2000. In 2001, the Company experiencedimproved operating results from both its marine trans-portation and contract drilling segments, including bothdomestic and international regions of its contract drillingsegment. The improvement in operating results is primarilyattributable to increased day rates and the contributions of
E N S C O 2 0 0 2 A N N U A L R E P O R T

19
the recently constructed ENSCO 7500 and ENSCO 101,which commenced drilling operations in December 2000and April 2001, respectively.
The following table highlights the Company’s consoli-dated operating results for each of the three years in theperiod ended December 31, 2002 (in millions):
2002 2001 2000
operating resultsRevenues $698.1) $817.4) $533.8)Operating expenses
Contract drilling andmarine transportation 389.7) 358.9) 290.6)
Depreciation and amortization 123.8) 115.2) 98.7)Impairment of assets 59.9) 9.2) –)General and administrative 18.6) 16.8) 13.3)
Operating income 106.1) 317.3) 131.2)Other expense, net (19.0) (25.4) (6.0)Provision for income taxes 27.8) 84.6) 39.8)Net income $ 59.3) $207.3) $ 85.4)
The following is an analysis of the Company’s revenues andoperating margin for each of the three years in the periodended December 31, 2002 (in millions):
2002 2001 2000
revenuesContract drilling
Jackup rigsNorth America $172.2 $307.8 $277.4Europe/West Africa 180.6 166.5 63.9Asia Pacific 182.1 104.4 72.7South America/Caribbean 11.4 – –
Total jackup rigs 546.3 578.7 414.0Semisubmersible rig -
North America 61.6 60.1 3.5Barge rig - Asia Pacific 2.5 – –Barge rigs - South America/
Caribbean 17.7 78.0 44.9Platform rigs 21.4 35.9 33.7
Total contract drilling 649.5 752.7 496.1Marine transportation
AHTS(1) 15.4 15.2 13.6Supply 33.2 49.5 23.9Mini-supply – – .2
Total marine transportation 48.6 64.7 37.7Total $698.1 $817.4 $533.8
2002 2001 2000
operating margin(2)
Contract drillingJackup rigs
North America $ 44.0) $181.1 $154.7)Europe/West Africa 98.8) 96.5 16.8)Asia Pacific 100.7) 54.1 28.5)South America/Caribbean 6.1) – –)
Total jackup rigs 249.6) 331.7 200.0)Semisubmersible rig -
North America 40.0) 42.1 2.6)Barge rig - Asia Pacific (.3) – –)Barge rigs - South America/
Caribbean 4.0) 47.5 20.3)Platform rigs 7.3) 10.9 11.7)
Total contract drilling 300.6) 432.2 234.6)Marine transportation
AHTS(1) 3.8) 5.5 4.4)Supply 4.0) 20.8 4.4)Mini-supply –) – (.2)
Total marine transportation 7.8) 26.3 8.6)Total $308.4) $458.5 $243.2)
(1) Anchor handling towing supply vessels.(2) Defined as operating revenues less contract drilling and marine
transportation expenses; excludes depreciation and amortization,impairment of assets and general and administrative expenses.
E N S C O 2 0 0 2 A N N U A L R E P O R T

20
Discussions relative to each of the Company’s operatingsegments and geographic operations are set forth below.
Contract Drilling. The following is an analysis of the geo-graphic locations of the Company’s offshore drilling rigs atDecember 31, 2002, 2001 and 2000.
2002 2001 2000
Jackup rigs:North America(1)(2) 22 21 22Europe/West Africa 8 8 8Asia Pacific(1)(2) 12 8 7South America/Caribbean(2) 1 – –
Total jackup rigs 43 37 37Semisubmersible rig - North America 1 1 1Barge rig - Asia Pacific(3) 1 – –Barge rigs - South America/Caribbean(3)(4) 6 7 9Platform rigs(5) 5 5 7
Total 56 50 54
(1) In December 2001, the Company mobilized a jackup rig from theGulf of Mexico to perform a long-term contract offshore Qatarthat commenced in February 2002. During the first quarter of2002, the Company mobilized two jackup rigs from the Gulf ofMexico to Singapore where they entered a shipyard for enhancementand repairs. These rigs subsequently commenced operations inVietnam and Brunei in July 2002 and December 2002, respectively.
(2) The Company acquired five ultra premium jackup rigs on August7, 2002, in connection with the Chiles merger, including two thatwere operating in the Gulf of Mexico, one operating offshoreAustralia, one operating offshore Trinidad and Tobago and afifth rig that was under construction on the acquisition date butsubsequently commenced operations in the Gulf of Mexico inDecember 2002.
(3) In August 2002, the Company mobilized a barge rig fromVenezuela to Singapore where it entered a shipyard for enhancement.The barge rig subsequently commenced operations under a long-term contract in Indonesia in December 2002.
(4) In December 2001, the Company removed the two oldest, leastcapable barge rigs in its fleet from service. The Company expectsto sell the two rigs during 2003.
(5) In September 2001, the Company retired two platform rigs.
In 2002, revenues for the Company’s contract drilling segmentdecreased by $103.2 million, or 14%, and operating margindecreased by $131.6 million, or 30%, from 2001. Thesedecreases are primarily attributable to lower average dayrates for the Company’s North America jackup rig fleet,which decreased 43% from the prior year. In addition, theCompany received $28.8 million in 2001 from the early ter-mination of long-term contracts for two of the Company’sbarge rigs in Venezuela. The overall decrease in revenuesand operating margin is partially offset by the operatingresults from the five jackup rigs acquired from Chiles inAugust 2002, and from the newly constructed ENSCO 102,a deep water harsh environment jackup rig. The five rigsacquired from Chiles contributed $44.2 million of revenueand $23.5 million of operating margin during the last fivemonths of 2002. The ENSCO 102, which began operating inthe third quarter of 2002, added $8.1 million of revenueand $2.5 million of operating margin in 2002. Contractdrilling expenses increased by $28.4 million, or 9%, dueprimarily to the increase in the size of the Company’s jackuprig fleet, an increase in mobilization expense and anincrease in insurance costs.
In 2001, revenues for the Company’s contract drillingsegment increased by $256.6 million, or 52%, and operatingmargin increased by $197.6 million, or 84%, from 2000.These increases are primarily attributable to higher averageday rates for the Company’s jackup rig fleet, whichincreased 39% from the prior year. The increase is alsoattributable to the impact of operating the ENSCO 7500 andENSCO 101, the Company’s recently constructed semisub-mersible and harsh environment jackup rigs that com-menced drilling operations in December 2000 and April2001, respectively. In addition, the Company received$28.8 million in 2001 from the early termination of two
long-term contracts for two of the Company’s barge rigs inVenezuela. Contract drilling expenses increased by $59.0million, or 23%, from the prior year due primarily to theoperations of the ENSCO 7500 and ENSCO 101, higherpersonnel costs and $6.3 million of nonrecurring reductionsin operating expenses during 2000 in connection with thefavorable resolution of personnel tax liabilities and personalinjury claims and related disputes with insurance carriers.
North America Jackup RigsIn 2002, revenues for the Company’s North America jackuprigs decreased by $135.6 million, or 44%, and the operatingmargin decreased by $137.1 million, or 76%, as comparedto 2001. The decrease in revenues and operating margin isdue primarily to a 43% decline in average day rates and themobilization of three jackup rigs from the Gulf of Mexico tothe Asia Pacific region in the fourth quarter of 2001 andfirst quarter of 2002. The decrease in revenues and operatingmargin is partially offset by the operating results of theENSCO 74, ENSCO 75 and ENSCO 105 acquired from Chilesin August 2002. These three rigs contributed $18.1 millionof revenue and $8.8 million of operating margin for 2002.Construction of the ENSCO 105 was completed in the fourthquarter of 2002 and the rig operated 21 days in 2002.Contract drilling expenses increased by $1.5 million, or1%, in 2002 compared to 2001. Contract drilling expensesincreased as a result of the addition of the three rigsacquired from Chiles and an increase in insurance cost forthe fleet, offset in part by the impact of three rigs leaving theGulf of Mexico.
In 2001, revenues for the Company’s North Americajackup rigs increased by $30.4 million, or 11%, and theoperating margin increased by $26.4 million, or 17%,from 2000. The increases in revenues and operatingmargin are primarily attributable to a 34% increase inaverage day rates. Contract drilling expenses increased by$4.0 million, or 3%, from 2000 due primarily to anincrease in personnel costs.
E N S C O 2 0 0 2 A N N U A L R E P O R T

21
Europe/West Africa Jackup RigsIn 2002, revenues for the Europe/West Africa jackup rigsincreased by $14.1 million, or 8%, and the operating marginincreased by $2.3 million, or 2%, as compared to the prioryear. The increase in revenues and operating margin is dueprimarily to a 15% increase in average day rates, partiallyoffset by lower utilization, which decreased to 81% in thecurrent year from 88% in 2001. In August 2002, theCompany mobilized the ENSCO 100 jackup rig from theNorth Sea to Nigeria where it commenced drilling operationsin September 2002. Contract drilling expenses increased by$11.8 million, or 17%, due primarily to costs associatedwith relocating the ENSCO 100 from Europe to WestAfrica, increased shorebase support cost and an increase ininsurance costs.
In 2001, revenues for the Europe jackup rigsincreased by $102.6 million, or 161%, and the operatingmargin increased by $79.7 million, or 474%, as comparedto 2000. The increase in revenues and operating margin isprimarily attributable to a 69% increase in average dayrates and to an increase in utilization to 88% in 2001 from59% in 2000. Contract drilling expenses increased by $22.9million, or 49%, from the prior year due primarily tohigher utilization.
Asia Pacific Jackup RigsIn 2002, revenues for the Asia Pacific jackup rigs increasedby $77.7 million, or 74%, and operating margin increasedby $46.6 million, or 86%, as compared to 2001. Theincrease in revenues and operating margin is due primarilyto higher average day rates, which increased 39% from theprior year, and the increase in the size of the Asia Pacificjackup rig fleet. The ENSCO 94, ENSCO 54 and ENSCO 51were mobilized from the Gulf of Mexico and commencedoperations in the Asia Pacific region in February 2002, July2002 and December 2002, respectively. In addition, thenewly constructed ENSCO 102 entered service in July 2002and the ENSCO 104 operating results are included fromthe August 7, 2002 Chiles acquisition date. These five rigs
contributed $50.1 million of revenue and $21.2 million ofoperating margin to the Asia Pacific region in 2002.Contract drilling expenses increased by $31.1 million, or62%, as compared to 2001 due primarily to expensesassociated with the five rigs added to the fleet, includingrelated mobilization expenses, and an increase in insurancecosts on the remaining rigs in the fleet.
In 2001, revenues for the Asia Pacific jackup rigsincreased by $31.7 million, or 44%, and the operatingmargin increased by $25.6 million, or 90%, as comparedto 2000. These increases are due primarily to a 13%increase in average day rates and to an increase in utilizationto 96% in 2001 from 73% in 2000. Contract drillingexpenses increased by $6.1 million, or 14%, in 2001 dueprimarily to higher utilization and $3.3 million in nonre-curring reductions in operating expenses during 2000 inconnection with the favorable resolution of personnel taxliabilities and personal injury claims related to disputeswith insurance carriers.
South America/Caribbean Jackup RigThe Company has one jackup rig, the ENSCO 76, acquiredin connection with the Chiles acquisition, operating undera long-term contract in Trinidad and Tobago. The results ofthe ENSCO 76 operations are included in the Company’soperating results from the date of the Chiles acquisition onAugust 7, 2002. Revenue and operating margin for 2002 forthe period subsequent to the Chiles acquisition were $11.4million and $6.1 million, respectively.
North America Semisubmersible RigThe Company completed construction of the ENSCO 7500,a dynamically positioned deepwater semisubmersible rig,in the fourth quarter of 2000 and the rig commenceddrilling operations in the Gulf of Mexico in December 2000under an approximate $190 million, three-year contract.
In 2002, revenues for the ENSCO 7500 increased by$1.5 million, or 2%, and operating margin decreased by$2.1 million, or 5%, as compared to 2001. The increase in
revenue is primarily attributable to a 3% increase in averageday rates which resulted from contractual rate adjustmentsthat compensate the Company for certain cost increases.The decrease in operating margin is due primarily to highercontract drilling expenses, which increased by $3.6 million,or 20%, due primarily to costs associated with steel hullrepairs during the first quarter of 2002 and an increase ininsurance costs.
Asia Pacific Barge RigThe ENSCO I, one of the Company’s larger barge rigs, wasmobilized from Venezuela in August 2002 to a shipyard inSingapore for modifications and enhancements to fulfill along-term contract in Indonesia. Shipyard modificationswere completed, and contract operations commenced, inlate December 2002. Substantially all of the $2.5 million ofrevenue for 2002 is attributable to the mobilization of therig from Venezuela to the drilling location in Indonesia.
South America/Caribbean Barge RigsIn 2002, revenues for the South America/Caribbean bargerigs decreased by $60.3 million, or 77%, and operatingmargin decreased by $43.5 million, or 91.6%, as comparedto 2001. The decrease in revenues and operating margin isdue primarily to lower utilization, which decreased to 17%in 2002 from 34% in the prior year, and the termination oftwo contracts in 2001. In September and November of2001, a customer elected to terminate two long-termcontracts after approximately half of the respective five-yearcontract terms had been completed. The terminationsresulted from the customer’s disappointing oil productionrates from the reservoir and the ensuing reduction in theirdrilling plans, and were not due to any fault with theCompany’s drilling rigs. In connection with the two contractterminations, the Company received lump sum, earlycontract termination payments totaling $28.8 million, all ofwhich was recognized as revenue during 2001. Contractdrilling expenses decreased by $16.8 million, or 55%, fromthe prior year due primarily to lower utilization.
E N S C O 2 0 0 2 A N N U A L R E P O R T

22
In 2001, excluding the $28.8 million early contracttermination revenue discussed above, revenues for theSouth America/Caribbean barge rigs increased by $4.3million, or 10%, and operating margin decreased by $1.6million, or 8%, from 2000. The increase in revenues isprimarily attributable to a 7% increase in average day rates,which resulted from contractual rate adjustments thatcompensate the Company for certain cost increases.Contract drilling expenses increased by $5.9 million, or24%, from the prior year, which contributed to a decreasein operating margin. The increase in contract drillingexpenses is primarily due to higher personnel costs resultingfrom collective contracts with the unions representingpetroleum industry personnel in Venezuela and to anincrease in costs associated with idle rigs.
Platform RigsIn 2002, revenues for the platform rigs decreased by $14.5million, or 40%, and operating margin decreased by $3.6million, or 33%, from 2001. The decrease in revenues andoperating margin is primarily due to two rigs, one of whichwas idle during 2002 compared to being 80% utilized duringthe prior year and a second rig that earned a minimal standbyrate during substantially all of 2002 compared to earning afull day rate in 2001. Contract drilling expenses for the plat-form rigs decreased by $10.9 million, or 44%, from the prioryear due primarily to the two rigs discussed above.
In 2001, revenues for the platform rigs increased by$2.2 million, or 7%, and operating margin decreased by$800,000, or 7%, as compared to 2000. The increase inrevenues is primarily due to a 12% increase in average dayrates. Contract drilling expenses increased by $3.0 million,or 14%, from the prior year primarily due to higher per-sonnel related costs. The 2001 contract drilling expensesalso increased, and the operating margin declined, as aresult of $900,000 in nonrecurring reductions in contractdrilling expenses in 2000 in connection with the favorableresolution of personal injury claims and related disputeswith insurance carriers.
Marine Transportation. At December 31, 2002, theCompany had a marine transportation fleet of 27 vessels,consisting of five anchor handling towing supply (“AHTS”)vessels and 22 supply vessels. The Company sold one supplyvessel during the fourth quarter of 2002. All of theCompany’s marine transportation vessels are located in theGulf of Mexico.
In 2002, revenues for the Company’s marine trans-portation segment decreased by $16.1 million, or 25%, andoperating margin decreased by $18.5 million, or 70%,from 2001. These decreases are primarily attributable tolower average day rates, which decreased 19% from theprior year, and lower utilization, which decreased to 75%in 2002 from 80% in 2001. Marine transportation expensesincreased by $2.4 million, or 6%, from the prior year dueprimarily to increases in regulatory drydocking costs andinsurance costs.
In 2001, revenues for the Company’s marine trans-portation segment increased by $27.0 million, or 72%, andoperating margin increased by $17.7 million, or 206%.These increases are primarily due to higher average dayrates for supply vessels, which increased 80% from theprior year, and higher fleet utilization, which increased to80% in 2001 from 65% in 2000. Marine transportationexpenses increased by $9.3 million, or 32%, from theprior year due primarily to increased utilization and higherpersonnel related costs.
Depreciation and Amortization. Effective January 1, 2002,the Company adopted the Financial Accounting StandardsBoard’s Statement of Financial Accounting Standards No.142, “Goodwill and Other Intangible Assets,” which, amongother things, eliminated the requirement to amortizegoodwill. Accordingly, the Company recognized no goodwillamortization in 2002, compared to $3.0 million of goodwillamortization in the prior year.
Depreciation and amortization expense in 2002increased by $8.6 million, or 7%, as compared to 2001.The increase is primarily attributable to the Chiles rigs
acquired in August 2002 and depreciation on capitalenhancement projects completed in 2002 and 2001,partially offset by the recognition of $3.0 million of good-will amortization in 2001 and $1.3 million of depreciationin the prior year associated with two barge rigs that weretaken out of service in December 2001.
Depreciation and amortization expense in 2001increased by $16.5 million, or 17%, as compared to 2000.The increase is primarily attributable to an $8.8 millionincrease in depreciation expense associated with theENSCO 101 and ENSCO 7500, which were placed in servicein July 2000 and December 2000, respectively, and a $5.9million increase in depreciation expense associated withthe ENSCO 100, for which depreciation expense was sus-pended until November 2000 while the rig was undergoingconversion from a water injection unit to a conventionaldrilling unit.
Impairment of Assets. The Company’s South America/Caribbean barge rig fleet operations have historically beenconcentrated on Lake Maracaibo in Venezuela. LakeMaracaibo market conditions have been depressed forseveral years due to reduced or deferred exploration anddevelopment spending by Venezuela’s national oil company,Petroleos de Venezuela, S.A. (“PdVSA”), which resultedfrom reduced demand for Venezuelan oil production,economic decline and OPEC quota reductions. In addition,the economic and political situation in Venezuela hasbecome increasingly unstable during recent years. As aresult of the uncertainty surrounding its South America/Caribbean barge rig fleet, the Company has evaluated thecarrying value of the barge rigs for impairment on a regularbasis during recent years.
During the fourth quarter of 2002 the economic andpolitical environment in Venezuela deteriorated severely. Astrike originating within PdVSA spread nationwide, involvingthe entire oil industry and the banking system, and causingsubstantial economic upheaval. The strike, mass termina-tions of PdVSA employees, and political interference in the
E N S C O 2 0 0 2 A N N U A L R E P O R T

23
management of PdVSA resulted in the near shutdown of theVenezuelan oil industry. Exchange controls have now beenenacted and many Venezuela businesses have ceased orreduced operations causing substantial layoffs. As a resultof these adverse developments, the Company recognized a$59.9 million impairment charge related to its Venezuela-based assets in the fourth quarter of 2002. (See Note 3 tothe Company’s Consolidated Financial Statements for a furtherdiscussion of the impairment of the Company’s assets inVenezuela.)
In December 2001, the Company decided to sell thetwo oldest, least capable rigs in its South America/Caribbean barge rig fleet and removed those rigs fromservice. The carrying value of the two rigs was reduced toestimated net realizable value and the Company recognizeda $9.2 million impairment charge for the year endedDecember 31, 2001.
General and Administrative. General and administrativeexpense in 2002 increased by $1.8 million, or 11%, ascompared to 2001. The increase is primarily attributable tohigher personnel costs, including additional personnelattributable to the Chiles acquisition, and costs associatedwith relocating the Company’s corporate headquarters.
General and administrative expense in 2001 increasedby $3.5 million, or 26%, as compared to 2000. Theincrease is primarily attributable to increases in performance-based compensation and professional fees.
Other Income (Expense). Other income (expense) foreach of the three years in the period ended December31, 2002, is as follows (in millions):
2002 2001 2000
Interest income $ 5.1) $ 8.3) $ 7.1)Interest expense, net:
Interest expense (36.2) (35.0) (30.1)Capitalized interest 5.1) 2.2) 16.7)
(31.1) (32.8) (13.4)Other, net 7.0) (.9) .3)
$(19.0) $(25.4) $ (6.0)
Interest income decreased $3.2 million in 2002, ascompared to 2001, due to lower average interest rates.Interest income increased $1.2 million in 2001, as com-pared to 2000, due primarily to higher average investedcash balances, partially offset by a decrease in averageinterest rates.
Interest expense increased $1.2 million in 2002, ascompared to 2001, due primarily to the additional debtassumed in the Chiles acquisition. See “Liquidity and CapitalResources - Financing and Capital Resources” for furtherinformation on the debt assumed from Chiles. Interestexpense increased $4.9 million in 2001, as compared to2000. The increase is primarily attributable to increasedaverage debt balances, resulting from the 15-year bondsissued in January 2001 to finance the cost of the ENSCO7500, partially offset by a decrease in effective interest rates.
Capitalized interest increased $2.9 million in 2002, ascompared to 2001, due to an increase in the amount investedin construction and enhancement projects, primarily theENSCO 105 (acquired from Chiles in August 2002).Construction of the ENSCO 105 was completed and the rigcommenced operations in December 2002. Capitalizedinterest decreased $14.5 million in 2001, as compared to2000. The decrease is attributable to a reduction in capital
invested in the ENSCO 7500 and ENSCO 101 constructionprojects, which were completed in 2000.
Other, net for 2002 includes a $5.8 million gain inconnection with the settlement of an insurance claimrelated to the ENSCO 51, which sustained damage from anatural gas fire, a $600,000 gain on the sale of a supply vesseland net gains resulting from changes in foreign currencyexchange rates, partially offset by an $800,000 loss relatedto the decrease in fair value of certain treasury rate lockagreements obtained in connection with the Chiles acquisition.See “Market Risk” for further information on the Chilestreasury rate lock agreements. Other, net in 2001 includes a$625,000 provision for the settlement of a class action, anti-trust lawsuit (see “Item 3. Legal Proceedings” and Note 12to the Company’s Consolidated Financial Statements).
Provision for Income Taxes. The Company recordedincome tax expense of $27.8 million, $84.6 million and$39.8 million in the years ended December 31, 2002, 2001and 2000, respectively. The $56.8 million decrease inincome tax provision from 2001 to 2002 is primarily attrib-utable to decreased profitability in 2002, partially offset byan increase in the effective tax rate. The effective tax rateincreased from 29.0% in 2001 to 31.9% in 2002 due pri-marily to the recognition of a limited deferred tax benefit inconnection with the $59.9 million impairment chargerecorded in 2002. The $44.8 million increase in incometax provision from 2000 to 2001 is primarily due toincreased profitability in 2001, partially offset by a decreasein the effective tax rate. The effective tax rate decreased to29.0% in 2001 from 31.8% in 2000 primarily due tochanges in the relative portions of the Company’s earningsgenerated by foreign subsidiaries whose earnings are beingpermanently reinvested and taxed at lower rates and, to alesser extent, to increases in certain tax credits and incomenot subject to tax.
E N S C O 2 0 0 2 A N N U A L R E P O R T

24
liquidity and capital resources
Cash Flow from Operations and Capital Expenditures
Year Ended December 31,(in millions) 2002 2001 2000
Cash flow from operations $210.1 $421.5 $137.8Capital expenditures:
New construction and acquisitions $ 31.8 $ 19.6 $162.5
Enhancements 154.6 95.7 72.8Sustaining 40.5 29.9 20.8
$226.9 $145.2 $256.1
In 2002, cash flow from operations decreased by$211.4 million, or 50%, as compared to 2001. Thedecrease in cash flow from operations is primarily attributableto a decrease in the Company’s level of profitability and adecrease in cash flow from working capital changes in2002. In 2001, cash flow from operations increased by$283.7 million, or 206%, as compared to 2000. Theincrease in cash flow from operations in 2001 is attributableto an increase in the Company’s level of profitability and anincrease in cash flow from working capital changes.
The Company continues to expand the size and qualityof its drilling rig and marine vessel fleets. During the lastthree years, the Company has invested $323.1 millionupgrading the capability and extending the service lives ofits drilling rigs and marine vessels as part of its ongoingenhancement program and an additional $213.9 millionrelating to new construction and acquisitions. TheCompany also utilized $106.6 million of cash in connectionwith the Chiles acquisition in August 2002.
Management anticipates that capital expenditures in2003 will total approximately $250 million, including anestimated $200 million for upgrades and enhancementsand $50 million for sustaining operations. The Company
may also elect to exercise its option to acquire the remaining75% interest in the ENSCO 102 or make capital expendi-tures to construct or acquire additional rigs in 2003,depending on market conditions and opportunities. (See“Off-Balance Sheet Arrangements” and Note 5 to theCompany’s Consolidated Financial Statements for informationconcerning the Company’s investment in, and option toacquire, the ENSCO 102.)
Financing and Capital Resources. The Company’s long-termdebt, total capital and long-term debt to capital ratios aresummarized below (in millions, except percentages):
At December 31,2002 2001 2000
Long-term debt $ 547.5 $ 462.4 $ 422.2Total capital 2,514.5 1,902.6 1,751.1Long-term debt to
total capital 21.8% 24.3% 24.1%
In connection with the acquisition of Chiles on August7, 2002, the Company assumed Chiles’ floating rate termloan agreement (the “Interim Construction Loan”), whichprovides approximately $80.0 million of interim financingfor the construction of the ENSCO 105 (formerly theChiles Galileo). Amounts borrowed under the InterimConstruction Loan will be repaid with proceeds from long-term bonds that the Company intends to issue in October2003. The bonds will be repaid in equal semiannualpayments of principal and all borrowings under both theInterim Construction Loan and long-term bonds are guar-anteed by the United States Maritime Administration(“MARAD”). The Interim Construction Loan is collateralizedby the ENSCO 105 and the Company has guaranteed theperformance of its obligations under the InterimConstruction Loan to MARAD. As of December 31, 2002,the Company had $54.3 million outstanding under theInterim Construction Loan.
In connection with the acquisition of Chiles on August7, 2002, the Company assumed Chiles’ bonds that wereoriginally issued to provide long-term financing for theENSCO 76 (formerly the Chiles Coronado). The bonds areguaranteed by MARAD and are being repaid in 24 equalsemiannual principal installments of $2.9 million, whichcommenced in January 2000 and will end in July 2011.Interest on the bonds is payable semiannually, in Januaryand July, at a fixed rate of 5.63%. The bonds are collateral-ized by the ENSCO 76 and the Company has guaranteed theperformance of its obligations under the bonds to MARAD.As of December 31, 2002, the Company had $52.1 millionoutstanding under the bonds.
On January 25, 2001, the Company issued $190.0million of 15-year bonds to provide long-term financing forthe ENSCO 7500. The bonds are guaranteed by MARAD andare being repaid in 30 equal semiannual principal install-ments of $6.3 million, which commenced in June 2001 andwill end in December 2015. Interest on the bonds ispayable semiannually, in June and December, at a fixed rateof 6.36%. The bonds are collateralized by the ENSCO 7500and the Company has guaranteed the performance of itsobligations under the bonds to MARAD. As of December 31,2002, the Company had $164.7 million outstanding underthe bonds.
In July 2002, the Company cancelled its existing$185.0 million credit agreement and replaced it with a new$250.0 million unsecured revolving credit agreement (the“Credit Agreement”) with a syndicate of banks that maturesin July 2007. Interest on amounts borrowed under theCredit Agreement is based on LIBOR plus an applicablemargin rate (currently .525%), depending on theCompany’s credit rating. The Company pays a facility fee(currently .225% per annum) on the total $250.0 millioncommitment, which also is based on the Company’s creditrating. In addition, the Company is required to pay a uti-lization fee of .25% per annum on outstanding advancesunder the facility if such advances exceed 33% of the total$250.0 million commitment. The Company is required to
E N S C O 2 0 0 2 A N N U A L R E P O R T

25
maintain certain financial covenants under the CreditAgreement, including a specified level of interest coverage,debt ratio and tangible net worth. The Company had noamounts outstanding under the Credit Agreement atDecember 31, 2002.
The Company’s total capital increased $611.9 millionduring the year ended December 31, 2002, due primarilyto $449.1 million of common stock issued and $102.0 millionof net long-term debt assumed in connection with theChiles acquisition. In addition, total capital increased in2002 due to the profitability of the Company, partially offsetby the payment of $14.2 million in dividends. TheCompany’s total capital increased $151.5 million during theyear ended December 31, 2001, primarily due to the prof-itability of the Company and the net increase in long-termdebt, partially offset by the payment of $84.2 million for therepurchase of the Company’s common stock and $13.7million in dividends.
Off-Balance Sheet Arrangements. During the fourth quarterof 2000, the Company entered into an agreement withKeppel FELS Limited (“KFELS”), a major international ship-yard, and acquired a 25% ownership interest in a harshenvironment jackup rig under construction, which wassubsequently named the ENSCO 102. During the secondquarter of 2002, the Company and KFELS established a jointventure company, ENSCO Enterprises Limited (“EEL”), toown and charter the ENSCO 102. Upon completion of rigconstruction in May 2002, the Company and KFELS trans-ferred their respective interests in the ENSCO 102 to EEL inexchange for promissory notes in the amount of $32.5million and $97.3 million, respectively. The Company hasan option to purchase the ENSCO 102 from EEL, at a formuladerived price, which expires in May 2004. The Companyand KFELS have initial ownership interests in EEL of 25%and 75%, respectively.
Concurrent with the transfer of the rig to EEL, theCompany agreed to charter the ENSCO 102 from EEL for atwo-year period that expires in May 2004. Under the terms
of the charter, the majority of the net cash flow generatedby the ENSCO 102 operations is remitted to EEL in the formof charter payments. However, the charter obligation isdetermined on a cumulative basis such that cash flowdeficits incurred prior to initial rig operations are satisfiedprior to the commencement of charter payments. Charterproceeds received by EEL are used to pay interest on thepromissory notes and any cash remaining after all accruedinterest has been paid is used to repay the outstanding principalof the KFELS promissory note. Pursuant to an agreementbetween the Company and KFELS, the respective ownershipinterests of the Company and KFELS in EEL are adjustedconcurrently with repayments of principal on the KFELSpromissory note such that each party’s ownership interestis equal to the ratio of its outstanding promissory notebalance to the aggregate outstanding principal balance ofboth promissory notes. (See Note 5 to the Company’sConsolidated Financial Statements for summary financialstatements of EEL and a further discussion of theCompany’s investment.)
The Company’s equity interest in, and related charterarrangement with, EEL constitute a variable interest in anunconsolidated entity, as defined in the FinancialAccounting Standards Board’s FASB Interpretation No. 46,“Consolidation of Variable Interest Entities, anInterpretation of ARB No. 51.” While the Company hascertain contingent obligations relative to its investment inEEL, any unsatisfied obligations or net losses of EEL wouldbe incurred by the Company and KFELS essentially inproportion to their respective ownership interests in EEL.The Company has utilized the KFELS joint venture arrangementto increase its presence in the premium jackup rig market,while limiting present exposure through minimal capitalinvestment, and management believes the Company’s purchaseoption provides the flexibility to expand its premium jackuprig fleet in a cost-efficient manner.
Contractual Obligations and Commercial Commitments.The Company’s significant contractual obligations as ofDecember 31, 2002, and the periods in which such obligationsare due, are as follows:
Payments due by period2004 2006
and and AfterTotal 2003 2005 2007 2007
Long-term debt $571.9 $21.6 $43.1 $193.1 $314.1Operating leases 13.2 4.0 5.2 3.3 .7Total contractual
cash obligations $585.1 $25.6 $48.3 $196.4 $314.8
The Company has no significant commercial commit-ments or capital lease obligations.
Liquidity. The Company’s liquidity position is summarizedin the table below (in millions, except ratios):
At December 31,2002 2001 2000
Cash and short-term investments $185.5 $310.4 $106.6Working capital 189.2 312.0 171.6Current ratio 2.0 3.1 2.5
At December 31, 2002, the Company had $147.1million of cash and cash equivalents and $38.4 million ofshort-term investments, as well as $250.0 million availablefor borrowing under its Credit Agreement. Managementexpects to fund the Company’s short-term liquidity needs,including $275.6 million in contractual obligations andanticipated capital expenditures during 2003, as well as anyworking capital requirements, from its cash and cash equiv-alents, short-term investments and operating cash flow.
E N S C O 2 0 0 2 A N N U A L R E P O R T

26
Management expects to fund the Company’s long-term liquidity needs, including contractual obligations andanticipated capital expenditures, from its cash and cashequivalents, investments, operating cash flow and, if necessary,funds drawn under its Credit Agreement or other futurefinancing arrangements.
The Company has historically funded the majority ofits liquidity from operating cash flow. While future operatingcash flow cannot be accurately predicted, managementbelieves its long-term liquidity will continue to be fundedprimarily by operating cash flow.
market riskThe Company uses various methods to manage its exposureto foreign currency exchange risk. The Company predomi-nantly structures its drilling rig contracts in U.S. dollars,which significantly reduces the portion of the Company’scash flows and assets denominated in foreign currencies.The Company also employs various strategies, including theuse of derivative instruments, to match foreign currencydenominated assets with equal or near equal amounts offoreign currency denominated liabilities, thereby minimizingexposure to earnings fluctuations caused by changes inforeign currency exchange rates. The Company occasionallyutilizes derivative instruments to hedge forecasted foreigncurrency denominated transactions. At December 31,2002, the Company had foreign currency exchange contractsoutstanding to exchange $3.3 million U.S. dollars forAustralian dollars. The fair value of the Company’s out-standing foreign currency exchange contracts at December31, 2002, a net unrealized loss of $2,000, is included inaccrued liabilities.
The Company uses various derivative financial instru-ments to manage its exposure to interest rate risk. TheCompany occasionally uses interest rate swap agreementsto effectively convert the variable interest rate on debt to afixed rate, and interest rate lock agreements to hedgeagainst increases in interest rates on pending financing. AtDecember 31, 2002, the Company had no outstanding
interest rate swap agreements.In connection with the acquisition of Chiles on August
7, 2002, the Company obtained $80.0 million notionalamount of outstanding treasury rate lock agreements.Chiles entered into the treasury rate lock agreements duringthe first and second quarters of 2002 and they mature inOctober 2003. Upon acquisition, the Company designatedapproximately $65.0 million notional amount of thetreasury rate lock agreements as an effective hedge againstthe variability in cash flows of $76.5 million of MARADguaranteed bonds the Company intends to issue in October2003. The bonds will provide long-term financing for therecently constructed ENSCO 105. The Company deemed theremaining $15.0 million notional amount of treasury ratelock agreements obtained in the Chiles acquisition to bespeculative in nature. In October 2002, the Company settled$10.0 million of the $15.0 million notional amount oftreasury rate lock agreements deemed as speculative. Thefair value of the treasury rate lock agreements at December31, 2002, which is included in accrued current liabilities,has declined $3.7 million from the August 7, 2002 Chilesacquisition date, and a cumulative $8.6 million since theirinception. The Company recognized an $800,000 loss during2002 in connection with the treasury rate lock agreements,which resulted from the decrease in fair value of treasuryrate lock agreements deemed to be speculative.
The Company utilizes derivative instruments andundertakes hedging activities in accordance with its estab-lished policies for the management of market risk. TheCompany does not enter into derivative instruments fortrading or other speculative purposes. It is the Company’sintention to settle the remaining $5.0 million notionalamount of speculative treasury rate lock agreementsobtained in connection with the Chiles acquisition prior totheir maturity. Management believes that the Company’s useof derivative instruments and related hedging activities donot expose the Company to any material interest rate risk,foreign currency exchange rate risk, commodity price risk,credit risk or any other market rate or price risk.
outlook and forward-looking statementsChanges in industry conditions and the correspondingimpact on the Company’s operations cannot be accuratelypredicted because of the short-term nature of many of theCompany’s contracts and the volatility of oil and natural gasprices, which impact expenditures for oil and gas drilling.Whether recent levels of regional and worldwide expendituresfor oil and gas drilling will increase, decrease or remainunchanged, is not determinable at this time.
The Company’s domestic offshore drilling operationsare conducted in the Gulf of Mexico. The U.S. natural gasmarket and trends in oil company spending largely deter-mine domestic offshore drilling industry conditions. U.S.natural gas prices increased significantly during 2000, anddemand, and ultimately day rates, for offshore drilling rigsincreased as many oil companies accelerated drillingprograms in response to historically high natural gasprices. Jackup rigs mobilized to the Gulf of Mexico frominternational markets to take advantage of this strongdemand. During 2001, natural gas prices decreased fromrecord levels, and oil company Gulf of Mexico drillingbudgets were sharply reduced over the course of the yearand remained at moderate levels during 2002. Today,demand for jackup drilling rigs in the Gulf of Mexico issignificantly lower than that realized in early 2001.Although some jackup rigs have now departed the Gulf ofMexico for international service, the supply of jackup rigsis still in excess of current demand. As a result of thisimbalance, day rates are significantly lower today than theywere in 2000 and early 2001. The Company does not expectany significant improvement in domestic day rates duringthe first half of 2003.
Industry conditions in most international offshoredrilling markets have improved over the last two years, asmany of the major international and government-owned oilcompanies have increased spending in those markets.Cutbacks in OPEC production and an improved outlook foroil demand contributed to higher oil prices in 1999 and
E N S C O 2 0 0 2 A N N U A L R E P O R T

27
2000, and a more favorable climate for oil companyspending. Although oil prices declined somewhat over thecourse of 2001, increased drilling activity related to majornatural gas development projects in Asia Pacific and theMiddle East contributed to increased demand for jackupdrilling rigs in those regions. Demand and day rates forinternational jackup rigs strengthened during 2001 andmuch of 2002, particularly in Europe and Asia Pacific.However, in the second half of 2002, day rates began todecrease modestly in Europe. Day rates for jackup rigs inEurope have stabilized to date in 2003 at the levels in effectat the end of 2002, but current activity levels could lead tosome near term softening of day rates in Europe. Today,concerns related to global economic activity and the impacton oil demand growth have contributed to more modestincreases in oil company spending. Uncertainty with regardto the Middle East and the political unrest in Venezuela havealso contributed to cautiousness among oil companies, andthis may impact spending plans over the course of 2003.Although the outlook is uncertain, at this time the Companyexpects day rates and utilization for international jackuprigs to remain relatively stable throughout 2003.
The Company continues its upgrade program on severalof its North America jackup rigs, particularly in light of thecurrent Gulf of Mexico market weakness. The Companymoved three of its North America jackup rigs to pursueinternational opportunities, the ENSCO 94 in December2001, to Doha, Qatar for a long-term contract and theENSCO 51 and ENSCO 54 in the first quarter of 2002. TheENSCO 51 is operating in Brunei and the ENSCO 54 iscurrently operating under a contract in India.
The Chiles merger in August 2002 increased theCompany’s Gulf of Mexico jackup rig count to 22 with threeof the five rigs acquired in the Chiles merger located in theGulf of Mexico. Currently, 19 of the Company’s 22 NorthAmerica jackup rigs are working. The three idle rigs areundergoing shipyard modifications and upgrades andregulatory work. The ENSCO 81 is completing shipyardwork and will commence operating under a contract in
March 2003. The ENSCO 82 and ENSCO 98 entered a ship-yard in early February 2003 and are scheduled to return toservice in August and June 2003, respectively.
Currently, six of the Company’s seven jackup rigs inthe Europe region are working, with the one idle rig in ashipyard undergoing enhancements to the crew quartersand regulatory work in preparation for operations in theNetherlands commencing in May 2003. In August 2002, theCompany mobilized the ENSCO 100 jackup rig from theNorth Sea to Nigeria where it commenced drilling opera-tions in September 2002.
The Company’s Asia Pacific rig fleet has increased to12 jackup rigs, with the addition of the three jackup rigsmobilized from the Gulf of Mexico, the completion of theENSCO 102 in May 2002 and the addition of the ENSCO 104as a result of the Chiles merger on August 7, 2002.Currently 11 of the Company’s 12 Asia Pacific unit rigs areoperating, with one rig, the ENSCO 57, in a shipyard. TheENSCO 57 completed its contract in Thailand in January2003 and was mobilized to a shipyard in Singapore forenhancements and regulatory work, with shipyard workcompletion projected mid-year 2003. Currently the ENSCO57 is uncommitted.
The Company’s South America/Caribbean jackup rig,the ENSCO 76, is operating under a long-term contract off-shore Trinidad and Tobago.
The ENSCO 7500, the Company’s deep water semisub-mersible rig that began Gulf of Mexico operations in December2000, is committed under contract until March 2004.
Currently, five of the Company’s six barge rigs locatedin Venezuela are without contract, with one barge rig, theENSCO II, contracted through May 2004. During the fourthquarter of 2002 the economic and political environment inVenezuela deteriorated severely. A strike originating withinPdVSA spread nationwide, involving the entire oil industryand the banking system, and causing substantial economicupheaval. The strike, mass terminations of PdVSA employeesand political interference in the management of PdVSAresulted in the near shutdown of the Venezuelan oil industry.
Exchange controls have now been enacted and manyVenezuela businesses have ceased or reduced operations,causing substantial layoffs. Further substantial contractionof the Venezuela economy is possible. The Companybelieves the timing of an expected recovery of drilling activityin Venezuela is uncertain and unlikely in the near term.
The Company mobilized one of its large barge rigsfrom Venezuela in the third quarter of 2002. The rig isnow operating under a long-term contract in Indonesiaafter completing shipyard enhancements and modificationsin Singapore.
Currently, two of the Company’s five platform rigs areoperating under short-term contracts. The Company’s plat-form rigs have experienced utilization in the 50% to 60%range since 1999. The Company’s platform rigs are allcapable of completing deep well programs as the rigs arerated for 25,000 to 30,000 feet wells. The rigs are best suit-ed for long-term, deep well drilling applications where theplatform rig components will stay in place for a substantialperiod of time. The Company’s platform rigs competeagainst smaller, easier to mobilize and assemble, self-erecting platform rigs for shallow well drilling. TheCompany is not able to predict when there will be a recoveryof drilling activity that will require increased use of the classof platform rigs owned and operated by the Company.
The Company’s marine transportation segment experi-enced decreased fleet utilization and day rates in 2002. TheCompany expects the marine transportation market toremain soft in the near-term as a result of the recent slowdown in Gulf of Mexico drilling activity. The Company hasentered into an agreement to sell all of its marine trans-portation vessels and expects to cease conducting marinetransportation operations upon close of the transaction,which is subject to certain regulatory approvals, in the secondquarter of 2003.
This report contains forward-looking statements bymanagement and the Company that are subject to a numberof risks and uncertainties. Generally, forward-looking state-ments include words or phrases such as “anticipates,”
E N S C O 2 0 0 2 A N N U A L R E P O R T

28
“believes,” “expects,” “plans,” “intends” and words andphrases of similar impact. The forward-looking statementsinclude, but are not limited to, statements regarding futureoperations, industry conditions and business environment,as well as statements regarding future levels of, or trends in,day rates, utilization, revenues, operating expenses, capitalexpenditures and financing. The forward-looking state-ments are made pursuant to safe harbor provisions of thePrivate Securities Litigation Reform Act of 1995. Numerousfactors could cause actual results to differ materially fromthose in the forward-looking statements, including thefollowing: (i) industry conditions and competition, (ii)fluctuations in the price of oil and natural gas, (iii) regionaland worldwide expenditures for oil and gas drilling, (iv)demand for oil and gas, (v) operational risks and insurance,(vi) risks associated with operating in foreign jurisdictions,(vii) environmental liabilities that may arise in the futurethat are not covered by insurance or indemnity, (viii) theimpact of current and future laws and government regulation,as well as repeal or modification of same, affecting the oiland gas industry, the environment, taxes and the Company’soperations in particular, (ix) changes in costs associatedwith rig construction or enhancement, as well as changes indates rigs being constructed or undergoing enhancementwill enter service, (x) renegotiations, nullification, orbreaches of contracts with customers, vendors, subcon-tractors or other parties, (xi) unionization or similarcollective actions by the Company’s employees, (xii) con-solidation among the Company’s competitors or customers,(xiii) uncertainty with regards to the Middle East, (xiv) thepolitical unrest in Venezuela, (xv) general economicconcerns and the impact of high oil and gas commodityprices and (xvi) the risks described elsewhere herein andfrom time to time in the Company’s reports to the Securitiesand Exchange Commission.
critical accounting policiesThe Company’s significant accounting policies are includedin Note 1 to the Consolidated Financial Statements. These
policies, along with the underlying assumptions andjudgments made by the Company’s management in theirapplication, have a significant impact on the Company’sconsolidated financial statements. The Company identifiesits most critical accounting policies as those that are themost pervasive and important to the portrayal of theCompany’s financial position and results of operations, andthat require the most difficult, subjective and/or complexjudgments by management regarding estimates aboutmatters that are inherently uncertain. The Company’s mostcritical accounting policies are those related to propertyand equipment, impairment of assets and income taxes.
Property and Equipment. At December 31, 2002, the carryingvalue of the Company’s property and equipment totaled$2,258.0 million, which represents 74% of total assets. Thiscarrying value reflects the application of the Company’sproperty and equipment accounting policies, which incor-porate estimates, assumptions and judgments by manage-ment relative to the capitalized costs, useful lives and salvagevalues of the Company’s rigs and vessels.
The Company develops and applies property andequipment accounting policies that are designed to appro-priately and consistently capitalize those costs incurred toenhance, improve and extend the useful lives of its assetsand expense those costs incurred to repair or maintain theexisting condition or useful lives of its assets. The develop-ment and application of such policies requires judgmentand assumptions by management relative to the nature of,and benefits from, expenditures on Company assets. TheCompany establishes property and equipment accountingpolicies that are designed to depreciate or amortize itsassets over their estimated useful lives. The assumptionsand judgments used by management in determining theestimated useful lives of its property and equipment reflectboth historical experience and expectations regardingfuture operations, utilization and performance of its assets.The use of different estimates, assumptions and judgmentsin the establishment of property and equipment accounting
policies, especially those involving the useful lives of theCompany’s rigs and vessels, would likely result in materiallydifferent carrying values of assets and results of operations.
Impairment of Assets. The Company evaluates the carryingvalue of its property and equipment when events or changesin circumstances indicate that the carrying value of suchassets may be impaired. The Company tests its $350.2 millionof goodwill for impairment on an annual basis, or whenevents or changes in circumstances indicate that the carryingvalue of the Company’s drilling segment likely exceeds itsfair value. Generally, extended periods of idle time and/orinability to contract assets at economical rates are an indi-cation that an asset may be impaired. However, the offshoredrilling and marine transportation industries are highlycyclical and it is not unusual for assets to be unutilized orunderutilized for significant periods of time and subse-quently resume full or near full utilization when businesscycles change. Likewise, during periods of supply anddemand imbalance, assets are frequently contracted at ornear cash break-even rates for extended periods of timeuntil demand comes back into balance with supply.Impairment situations may arise with respect to specificindividual assets, groups of assets, such as a type of drillingrig or class of marine vessel, or assets in a certain geographiclocation. The Company’s assets are mobile and may bemoved from markets with excess supply, if economicallyfeasible. The Company’s jackup rigs, semisubmersible rig andmarine transportation vessels are suited for, and accessibleto, broad and numerous markets throughout the world.However, there are fewer economically feasible marketsavailable to the Company’s barge rigs and platform rigs.
Asset impairment evaluations are, by nature, highlysubjective. They involve expectations of future cash flows tobe generated by the Company’s assets, and are based onmanagement’s assumptions and judgments regardingfuture industry conditions and operations, as well as man-agement’s estimates of future expected utilization, contractrates, expense levels and capital requirements of the
E N S C O 2 0 0 2 A N N U A L R E P O R T

29
Company’s drilling rigs and marine vessels. The estimates,assumptions and judgments used by management in theapplication of the Company’s asset impairment policiesreflect both historical experience and an assessment ofcurrent operational, industry, economic and political envi-ronments. The use of different estimates, assumptions,judgments and expectations regarding future industryconditions and operations, would likely result in materiallydifferent carrying values of assets and results of operations.
Income Taxes. The Company conducts operations andearns income in numerous foreign countries and is subjectto the laws of taxing jurisdictions within those countries, aswell as U.S. federal and state tax laws. At December 31,2002, the Company has a $323.4 million net deferredincome tax liability and $49.2 million of accrued liabilitiesfor income taxes currently payable.
The carrying values of deferred income tax assets andliabilities reflect the application of the Company’s incometax accounting policies in accordance with Statement ofFinancial Accounting Standards No. 109, “Accounting forIncome Taxes” (“SFAS 109”), and are based on manage-ment’s assumptions and estimates regarding future operatingresults and levels of taxable income, as well as manage-ment’s judgments regarding the interpretation of theprovisions of SFAS 109. The carrying values of liabilities forincome taxes currently payable are based on management’sinterpretation of applicable tax laws, and incorporatemanagement’s assumptions and judgments regarding theuse of tax planning strategies in various taxing jurisdictions.The use of different estimates, assumptions and judgmentsin connection with accounting for income taxes, especiallythose involving the deployment of tax planning strategies,may result in materially different carrying values of incometax assets and liabilities and results of operations.
new accounting pronouncementsIn July 2001, the Financial Accounting Standards Board(“FASB”) issued Statement of Financial Accounting
Standards No. 142, “Goodwill and Other Intangible Assets”(“SFAS 142”). SFAS 142 supersedes Accounting PrinciplesBoard Opinion No. 17, “Intangible Assets,” eliminates therequirement to amortize goodwill and indefinite-livedintangible assets, addresses the amortization of intangibleassets with a defined life and requires impairment testingand recognition for goodwill and intangible assets. TheCompany adopted SFAS 142 effective January 1, 2002. (SeeNote 1 to the Company’s Consolidated Financial Statementsfor a summary of the impact of the adoption of SFAS 142 onthe Company’s net income, basic earnings per share anddiluted earnings per share.)
In June 2001, the FASB issued Statement of FinancialAccounting Standards No. 143, “Accounting for AssetRetirement Obligations” (“SFAS 143”). SFAS 143 addressesfinancial accounting and reporting for obligations associatedwith the retirement of tangible long-lived assets and theassociated asset retirement costs. The Company wasrequired to adopt SFAS 143 on January 1, 2003 and doesnot expect SFAS 143 to have a material impact on its con-solidated financial position or results of operations.
In August 2001, the FASB issued Statement of FinancialAccounting Standards No. 144, “Accounting for theImpairment or Disposal of Long-Lived Assets” (“SFAS144”). This statement supercedes Statement of FinancialAccounting Standards No. 121, “Accounting for theImpairment of Long-Lived Assets and for Long-Lived Assetsto Be Disposed Of” (“SFAS 121”), and the accountingand reporting provisions of Accounting Principles BoardOpinion No. 30 (“APB 30”). SFAS 144 retains the funda-mental provisions of SFAS 121 and the basic requirementsof APB 30; however, it establishes a single accountingmodel to be used for long-lived assets to be disposed ofby sale and it expands the presentation of discontinuedoperations to include more disposal transactions. TheCompany adopted the provisions of SFAS 144 effectiveJanuary 1, 2002. (See Note 3 to the Company’sConsolidated Financial Statements.)
In April 2002, the FASB issued Statement of FinancialAccounting Standards No. 145, “Rescission of FASBStatements No. 4, 44, and 64, Amendment of FASBStatement No. 13, and Technical Corrections” (“SFAS145”). SFAS 145 amends, updates, clarifies and simplifiesvarious accounting pronouncements and impacts the finan-cial accounting and/or reporting for gains and losses fromextinguishment of debt, extinguishments of debt made tosatisfy sinking-fund requirements, intangible assets ofmotor carriers, and leases. Some provisions of SFAS 145became effective in May 2002 and the remaining provisionswere adopted by the Company, as required, on January 1,2003. The Company does not expect the adoption of theremaining provisions to have a material impact on its con-solidated financial position or results of operations.
In June 2002, the FASB issued Statement of FinancialAccounting Standards No. 146, “Accounting for CostsAssociated with Exit or Disposal Activities” (“SFAS 146”).SFAS 146 addresses financial accounting and reporting forcosts associated with exit or disposal activities and nullifiesEmerging Issues Task Force Issue No. 94-3, “LiabilityRecognition for Certain Employee Termination Benefits andOther Costs to Exit an Activity (including Certain CostsIncurred in a Restructuring)” (“EITF 94-3”). SFAS 146requires liability recognition for a cost associated with anexit or disposal activity on the date the liability is incurred,rather than on the date of commitment to an exit plan, asprovided under EITF 94-3. The Company was required toadopt SFAS 146 on January 1, 2003 and does not expectSFAS 146 to have a material impact on its consolidatedfinancial position or results of operations.
In November 2002, the FASB issued Interpretation No.45, “Guarantor’s Accounting and Disclosure Requirementsfor Guarantees, Including Indirect Guarantees ofIndebtedness of Others” (“FIN 45”). FIN 45 expands existingaccounting guidance and disclosure requirements forcertain guarantees and requires recognition, at the inceptionof a guarantee, of a liability for the fair value of an obligationundertaken in connection with issuing a guarantee. The
E N S C O 2 0 0 2 A N N U A L R E P O R T

30
disclosure requirements of FIN 45 are effective for theCompany’s December 31, 2002 financial statements and theremaining provisions of FIN 45 apply to guarantees issuedor modified after December 31, 2002. The Company doesnot expect this Interpretation to have a material impact onits consolidated financial position or results of operations.
In December 2002, the FASB issued Statement ofFinancial Accounting Standards No. 148, “Accounting forStock-Based Compensation - Transition and Disclosure”(“SFAS 148”), which provides optional transition guidancefor those companies electing to voluntarily adopt theaccounting provisions of Statement of Financial AccountingStandards No. 123, “Accounting for Stock-BasedCompensation” (“SFAS 123”). In addition, SFAS 148amends the disclosure requirements of SFAS 123 andrequires certain disclosures in both annual and interimfinancial statements. The Company will continue to accountfor stock-based compensation in accordance with APB 25.As such, the Company does not expect this standard to havea material impact on its consolidated financial position orresults of operations. The Company has adopted the disclosureprovisions of SFAS 148 at December 31, 2002. (See Note 10to the Company’s Consolidated Financial Statements.)
In January 2003, the FASB issued Interpretation No.46, “Consolidation of Variable Interest Entities, anInterpretation of ARB No. 51” (“FIN 46”). FIN 46 requiresa company to consolidate a variable interest entity, asdefined, when the company will absorb a majority of thevariable interest entity’s expected losses, receive a majorityof the variable interest entity’s expected residual returns, orboth. FIN 46 also requires certain disclosures relating toconsolidated variable interest entities and unconsolidatedvariable interest entities in which a company has a signifi-cant variable interest. The disclosure provisions of FIN 46are effective for all financial statements issued after January31, 2003. The consolidation provisions of FIN 46 applyimmediately to variable interest entities created afterJanuary 31, 2003, and to variable interest entities in whicha company obtains an interest after January 31, 2003. With
respect to variable interest entities in which a companyholds a variable interest that it acquired before February 1,2003, the consolidation provisions are required to beapplied no later than the company’s first fiscal year or interimperiod beginning after June 15, 2003. The Company’s equityinterest in, and related charter arrangement with, ENSCOEnterprises Limited (“EEL”) constitute a variable interest ina variable interest entity under FIN 46. The Company hasnot completed an assessment of the impact of the FIN 46consolidation provisions on its investment in EEL. However,management currently does not expect to consolidate EEL.The Company has adopted the disclosure provisions of FIN46 in its December 31, 2002 financial statements (see“Liquidity and Capital Resources - Off-Balance SheetArrangements” and Note 5 to the Company’s ConsolidatedFinancial Statements).
E N S C O 2 0 0 2 A N N U A L R E P O R T
Repor t s o f Mana gemen t a nd I ndependen t Accoun t an t s
31
report of managementThe management of ENSCO International Incorporated andits subsidiaries has responsibility for the preparation, integrityand reliability of the consolidated financial statements andrelated financial information contained in this report.
The consolidated financial statements have been pre-pared in conformity with accounting principles generallyaccepted in the United States of America and prevailingpractices of the industries in which the Company operates.In some instances, these financial statements includeamounts that are based on management’s best estimatesand judgments.
The Company maintains a system of procedures andcontrols over financial reporting that is designed to providereasonable assurance to the Company’s management andBoard of Directors regarding the integrity and the fair andreliable preparation and presentation, in all materialrespects, of its published financial statements. This system offinancial controls and procedures is reviewed, modified, andimproved as changes occur in business conditions and oper-ations, and as a result of suggestions from the Company’sindependent accountants. There are inherent limitations inthe effectiveness of any system of internal control and even aneffective system of internal control can provide only reason-able assurance with respect to the financial statement prepa-ration and may vary over time. Management believes that theCompany’s internal control system provides reasonableassurance that material errors or irregularities will be pre-vented or detected within a timely period and is cost effective.
As part of management’s responsibility for monitoringcompliance with established policies and procedures, itrelies on, among other things, audit procedures performedby internal auditors and independent accountants to giveassurance that established policies and procedures areadhered to in all areas subject to their audits. The Board ofDirectors, operating through its Audit Committee com-posed solely of outside directors, meets periodically withmanagement, the internal auditors and the independentaccountants to review and assess the activities of each. Both
the independent accountants and the internal auditors meetwith the Audit Committee, without management present, toreview the results of their audits and their assessment of theadequacy of the systems of internal accounting control andthe quality of financial reporting.
reports of independent accountantsTo the Board of Directors and Stockholders of ENSCOInternational Incorporated
We have audited the accompanying consolidatedbalance sheet of ENSCO International Incorporated (aDelaware corporation), and subsidiaries as of December31, 2002 and 2001, and the related consolidated state-ments of income and cash flows for each of the years in thetwo-year period then ended. These consolidated financialstatements are the responsibility of the Company’s manage-ment. Our responsibility is to express an opinion on theseconsolidated financial statements based on our audits.
We conducted our audits in accordance with auditingstandards generally accepted in the United States ofAmerica. Those standards require that we plan and performthe audit to obtain reasonable assurance about whetherthe financial statements are free of material misstatement.An audit includes examining, on a test basis, evidencesupporting the amounts and disclosures in the financialstatements. An audit also includes assessing the accountingprinciples used and significant estimates made by manage-ment, as well as evaluating the overall financial statementpresentation. We believe that our audits provide a reasonablebasis for our opinion.
In our opinion, the consolidated financial statementsreferred to above present fairly, in all material respects, theconsolidated financial position of ENSCO InternationalIncorporated and subsidiaries as of December 31, 2002and 2001, and the results of their operations and their cashflows for each of the years then ended, in conformity withaccounting principles generally accepted in the UnitedStates of America.
As discussed in Note 1 to the consolidated financialstatements, the Company changed its method of accountingfor goodwill and other intangible assets in accordance withStatement of Financial Accounting Standards No. 142,“Goodwill and Other Intangible Assets” in 2002. As discussedin Note 7 to the consolidated financial statements, theCompany changed its method of accounting for derivativeinstruments and hedging activities in accordance withStatement of Financial Accounting Standards No. 133,“Accounting for Derivative Instruments and HedgingActivities” in 2001.
KPMG LLPDallas, TexasJanuary 27, 2003, except as to note 16 which is as ofFebruary 20, 2003.
E N S C O 2 0 0 2 A N N U A L R E P O R T

32
To the Board of Directors and Stockholders of ENSCOInternational Incorporated
In our opinion, the accompanying consolidated state-ments of income and of cash flows for the year endedDecember 31, 2000, present fairly, in all material respects,the results of operations and cash flows of ENSCOInternational Incorporated for the year ended December31, 2000, in conformity with accounting principles generallyaccepted in the United States of America. These financialstatements are the responsibility of the Company’s manage-ment; our responsibility is to express an opinion on thesefinancial statements based on our audit. We conductedour audit of these statements in accordance with auditingstandards generally accepted in the United States ofAmerica, which require that we plan and perform the auditto obtain reasonable assurance about whether the financialstatements are free of material misstatement. An auditincludes examining, on a test basis, evidence supporting theamounts and disclosures in the financial statements, assessingthe accounting principles used and significant estimatesmade by management, and evaluating the overall financialstatement presentation. We believe that our audit providesa reasonable basis for our opinion.
PricewaterhouseCoopers LLPDallas, TexasJanuary 25, 2001
E N S C O 2 0 0 2 A N N U A L R E P O R T

Conso l i d a t ed S t a t emen t o f I n come
33
Year Ended December 31,(in millions, except per share amounts) 2002) 2001) 2000)
RevenuesContract drilling $649.5) $752.7) $496.1)Marine transportation 48.6) 64.7) 37.7)
698.1) 817.4) 533.8)Operating Expenses
Contract drilling 348.9) 320.5) 261.5)Marine transportation 40.8) 38.4) 29.1)Depreciation and amortization 123.8) 115.2) 98.7)Impairment of assets 59.9) 9.2) –)General and administrative 18.6) 16.8) 13.3)
592.0) 500.1) 402.6)Operating Income 106.1) 317.3) 131.2)Other Income (Expense)
Interest income 5.1) 8.3) 7.1)Interest expense, net (31.1) (32.8) (13.4)Other, net 7.0) (.9) .3)
(19.0) (25.4) (6.0)Income Before Income Taxes 87.1) 291.9) 125.2)Provision for Income Taxes
Current income tax expense 21.0) 59.6) 17.8)Deferred income tax expense 6.8) 25.0) 22.0)
27.8) 84.6) 39.8)Net Income $ 59.3) $207.3) $ 85.4)Earnings Per Share
Basic $ .42) $ 1.51) $ .62)Diluted .42) 1.50) .61)
Weighted Average Common Shares OutstandingBasic 140.7) 136.9) 137.6)Diluted 141.4) 137.9) 139.3)
Cash Dividends Per Common Share $ .10) $ .10) $ .10)
The accompanying notes are an integral part of these financial statements.
E N S C O 2 0 0 2 A N N U A L R E P O R T

34
Conso l i d a t ed B a l a n ce Shee t
December 31,(in millions, except par value amount) 2002) 2001)assets
Current AssetsCash and cash equivalents $ 147.1) $ 278.8)Short-term investments 38.4) 31.6)Accounts receivable, net 162.8) 116.5)Prepaid expenses and other 39.2) 34.4)
Total current assets 387.5) 461.3)Property and Equipment, at Cost 3,090.0) 2,386.6)
Less accumulated depreciation 832.0) 671.3)Property and equipment, net 2,258.0) 1,715.3)
Goodwill 350.2) 103.8)Other Assets, Net 65.8) 43.4)
$3,061.5) $2,323.8)
liabilities and stockholders’ equity
Current LiabilitiesAccounts payable $ 15.0) $ 10.1)Accrued liabilities 161.8) 126.5)Current maturities of long-term debt 21.5) 12.7)
Total current liabilities 198.3) 149.3)Long-Term Debt 547.5) 462.4)Deferred Income Taxes 332.3) 259.1)Other Liabilities 16.4) 12.8)Commitments and ContingenciesStockholders’ Equity
Common stock, $.10 par value, 250.0 million shares authorized,172.6 million and 157.8 million shares issued 17.2) 15.8)
Additional paid-in capital 1,383.5) 888.6)Retained earnings 835.3) 790.2)Restricted stock (unearned compensation) (5.8) (5.4)Accumulated other comprehensive loss (12.1) (9.9)Treasury stock, at cost, 23.6 million and 23.2 million shares (251.1) (239.1)
Total stockholders’ equity 1,967.0) 1,440.2)$3,061.5) $2,323.8)
The accompanying notes are an integral part of these financial statements.
E N S C O 2 0 0 2 A N N U A L R E P O R T

Conso l i d a t ed S t a t emen t o f Ca sh F l ows
35
Year Ended December 31,(in millions) 2002) 2001) 2000)
Operating ActivitiesNet income $ 59.3) $207.3) $ 85.4)Adjustments to reconcile net income to net cash provided by operating activities:
Depreciation and amortization 123.8) 115.2) 98.7)Impairment of assets 59.9) 9.2) –)Deferred income tax provision 6.8) 25.0) 22.0)Tax benefit from stock compensation 4.0) 3.0) 7.0)Amortization of other assets 12.2) 10.2) 7.0)Net gain on asset dispositions (6.3) (1.5) (1.6)Other 1.6) 1.8) 1.5)Changes in operating assets and liabilities:
(Increase) decrease in accounts receivable (30.6) 43.1) (73.8)Increase in prepaid expenses and other assets (22.0) (17.8) (14.6)Increase (decrease) in accounts payable (13.5) (3.1) 5.1)Increase in accrued and other liabilities 14.9) 29.1) 1.1)
Net cash provided by operating activities 210.1) 421.5) 137.8)Investing Activities
Additions to property and equipment (226.9) (145.2) (256.1)Net cash used in Chiles acquisition (99.9) –) –)Proceeds from disposition of assets 25.1) 5.0) 9.4)Sale (purchase) of short-term investments (6.8) (31.6) 20.9)Sale (purchase) of long-term investments 23.0) (23.0) –)Acquisition of minority interest –) –) (9.7)
Net cash used by investing activities (285.5) (194.8) (235.5)Financing Activities
Proceeds from long-term borrowings 4.4) 52.7) 137.3)Reduction of long-term borrowings (63.7) (12.7) (77.6)Repurchase of common stock –) (84.2) –)Cash dividends paid (14.2) (13.7) (13.8)Proceeds from exercise of stock options 19.5) 7.1) 16.9)Deferred financing costs (1.3) (3.3) (.1)Other (1.0) (.4) (2.8)
Net cash provided (used) by financing activities (56.3) (54.5) 59.9)Increase (Decrease) in Cash and Cash Equivalents (131.7) 172.2) (37.8)Cash and Cash Equivalents, Beginning of Year 278.8) 106.6) 144.4)Cash and Cash Equivalents, End of Year $147.1) $278.8) $106.6)
The accompanying notes are an integral part of these financial statements.
E N S C O 2 0 0 2 A N N U A L R E P O R T

36
Note s t o Conso l i d a t ed F i n an c i a l S t a t emen t s
1. description of the business and summary of significantaccounting policies
BusinessENSCO International Incorporated (the “Company”) is oneof the leading international providers of offshore drillingand marine transportation services to the oil and gas industry.The Company’s contract drilling and marine transportationoperations are integral to the exploration, development andproduction of oil and gas. Business levels for the Company,and its corresponding operating results, are significantlyaffected by worldwide levels of offshore exploration anddevelopment spending by oil and gas companies. Levels ofoffshore exploration and development spending may fluctuatesubstantially from year to year and from region to region.Such fluctuations result from many factors, includingdemand for oil and gas, regional and global economicconditions, political and legislative environments in majoroil-producing countries, the production levels and relatedactivities of OPEC and other oil and gas producers, techno-logical advancements that impact the methods or cost of oiland gas exploration and development, and the impact thatthese and other events have on the current and expectedfuture pricing of oil and natural gas (see Note 13 “SegmentInformation” for additional information concerning theCompany’s operations by segment and geographic region).On August 7, 2002, the Company acquired Chiles OffshoreInc. (see Note 2 “Acquisition”).
Principles of ConsolidationThe accompanying consolidated financial statementsinclude the accounts of the Company and its majorityowned subsidiaries. All significant intercompany accountsand transactions have been eliminated.
Pervasiveness of EstimatesThe preparation of financial statements in conformitywith generally accepted accounting principles requires
management to make certain estimates and assumptionsthat affect the reported amounts of assets and liabilities, therelated revenues and expenses, and disclosure of gain andloss contingencies at the date of the financial statements.Actual results could differ from those estimates.
Foreign Currency TranslationThe U.S. dollar is the functional currency of all theCompany’s foreign subsidiaries. The financial statementsof foreign subsidiaries are remeasured in U.S. dollarsbased on a combination of both current and historicalexchange rates. Gains and losses caused by the remea-surement process are reflected in the consolidated state-ment of income. Translation gains and losses wereinsignificant for each of the three years in the periodended December 31, 2002. In prior years, the financialstatements of certain foreign subsidiaries were main-tained in the local foreign currency. Foreign currencytranslation adjustments for those subsidiaries were accu-mulated as a separate component of stockholders’ equityand are included in accumulated other comprehensiveloss at December 31, 2002 and 2001.
Cash EquivalentsThe Company considers all highly liquid investments to becash equivalents if they have maturities of three months orless at the date of purchase.
Short-Term InvestmentsShort-term investments are comprised of highly liquidinvestments having maturities of greater than three monthsbut less than one year at the date of purchase. All of theCompany’s short-term investments are classified as held-to-maturity and stated at amortized cost.
Property and EquipmentAll costs incurred in connection with the acquisition,construction, enhancement and improvement of assets arecapitalized, including allocations of interest incurred during
periods that drilling rigs or marine vessels are underconstruction or undergoing major enhancements andimprovements. Maintenance and repair costs are chargedto operating expenses. Upon sale or retirement of assets,the related cost and accumulated depreciation are removedfrom the accounts and the resulting gain or loss is includedin income.
The Company primarily provides for depreciation onthe straight-line method, after allowing for salvage values,over the estimated useful lives of its assets. However, certaindrilling rigs and marine vessels acquired prior to 1991,with an aggregate carrying value of $13.4 million atDecember 31, 2002, are depreciated using the units-of-production method. Under the units-of-production method,depreciation is based on the utilization of the drilling rigsand vessels with a minimum provision when the rigs or vesselsare idle. Drilling rigs and related equipment are depreciatedover estimated useful lives ranging from four to 30 years.Marine vessels are depreciated over estimated useful livesranging from 12 to 20 years. Other equipment, includingcomputer software costs, is depreciated over estimated usefullives ranging from two to six years. Buildings and improve-ments are depreciated over estimated useful lives rangingfrom two to 30 years.
GoodwillIn July 2001, the Financial Accounting Standards Board(“FASB”) issued Statement of Financial AccountingStandards No. 142, “Goodwill and Other Intangible Assets”(“SFAS 142”). SFAS 142 supersedes Accounting PrinciplesBoard Opinion No. 17, “Intangible Assets,” eliminates therequirement to amortize goodwill and indefinite-livedintangible assets, addresses the amortization of intangibleassets with a defined life and requires impairment testingand recognition for goodwill and intangible assets. TheCompany adopted SFAS 142 effective January 1, 2002.
The impact of the adoption of SFAS 142 on theCompany’s net income, basic earnings per share and dilutedearnings per share for the years ended December 31, 2002,
E N S C O 2 0 0 2 A N N U A L R E P O R T

37
2001 and 2000, as if the adoption took place on January 1,2000, is presented in the following table (in millions exceptper share amounts):
2002 2001 2000
Reported net income $59.3 $207.3 $85.4Add back goodwill amortization – 3.0 3.3Adjusted net income $59.3 $210.3 $88.7Reported basic earnings per share $ .42 $ 1.51 $ .62Goodwill amortization – .03 .02Adjusted basic earnings per share $ .42 $ 1.54 $ .64Reported diluted earnings per share $ .42 $ 1.50 $ .61Goodwill amortization – .03 .02Adjusted diluted earnings per share $ .42 $ 1.53 $ .63
Prior to January 1, 2002 the Company amortizedgoodwill on the straight-line basis over 40 years.Accumulated amortization of goodwill was $17.3 million atDecember 31, 2002 and 2001. The Company recorded$246.4 million of goodwill during 2002 in connection withthe acquisition of Chiles Offshore Inc. (see Note 2“Acquisition”). All of the Company’s goodwill is attributableto the Company’s drilling segment. The Company completeda goodwill impairment test during the fourth quarter of2002 that resulted in no indication of impairment.
Impairment of AssetsThe Company tests goodwill for impairment on an annualbasis, or when events or changes in circumstances indicatethat the carrying value of the Company’s drilling segmentlikely exceeds its fair value. The Company evaluates thecarrying value of its other long-lived assets, consistingprimarily of property and equipment, when events orchanges in circumstances indicate that the carrying value ofsuch assets may be impaired. For property and equipmentused in the Company’s operations, the determination ofimpairment is based upon expectations of undiscounted
future cash flows, before interest, of the related asset.Property and equipment held for sale is recorded at thelower of net book value or net realizable value.
In August 2001, the FASB issued Statement of FinancialAccounting Standards No. 144, “Accounting for theImpairment or Disposal of Long-Lived Assets” (“SFAS144”). This statement supercedes Statement of FinancialAccounting Standards No. 121, “Accounting for theImpairment of Long-Lived Assets and for Long-Lived Assetsto Be Disposed Of” (“SFAS 121”), and the accounting andreporting provisions of Accounting Principles BoardOpinion No. 30 (“APB 30”). SFAS 144 retains the funda-mental provisions of SFAS 121 and the basic requirements ofAPB 30; however, it establishes a single accounting model tobe used for long-lived assets to be disposed of by sale and itexpands the presentation of discontinued operations toinclude more disposal transactions. The Company adoptedthe provisions of SFAS 144 effective January 1, 2002.
The Company recorded impairment charges of $59.9million and $9.2 million in 2002 and 2001, respectively,related to certain assets in Venezuela (see Note 3“Venezuela Contract Terminations and Impairment”).
Operating Revenue and ExpensesSubstantially all of the Company’s drilling and marine servicescontracts are performed on a day rate basis and the term ofsuch contracts is typically for a specific period of time or theperiod of time required to complete a specific task, such asdrilling a well. Contract revenue and expenses are recog-nized on a per day basis, as the work is performed.
In connection with some contracts, the Companyreceives lump-sum fees or similar compensation for themobilization of equipment and personnel prior to contractcommencement or the demobilization of equipment andpersonnel upon contract completion. The net of mobilizationcosts incurred and the compensation received is deferredand recognized over the related contract period.Demobilization costs and related compensation are recog-nized as incurred, upon contract completion. Costs associ-
ated with the mobilization of equipment and personnel tomore promising market areas without contracts areexpensed as incurred. Deferred mobilization costs areincluded in prepaid expenses and other current assets andtotaled $800,000 at December 31, 2002 and 2001.Deferred mobilization revenue is included in accruedliabilities and totaled $1.3 million and $200,000 atDecember 31, 2002 and 2001, respectively.
In connection with some contracts, the Companyreceives up-front, lump-sum fees or similar compensationfor capital improvements to its rigs or vessels. Such com-pensation is deferred and recognized as revenue over therelated contract period. The cost of such capital improve-ments is capitalized and depreciated over the useful life ofthe asset. Deferred revenue associated with capitalimprovements is included in accrued liabilities and totaled$1.1 million and $400,000 at December 31, 2002 and2001, respectively.
The Company must obtain certifications from variousregulatory bodies in order to operate its drilling rigs andmarine vessels and must maintain such certifications throughperiodic inspections and surveys. The costs incurred in con-nection with maintaining such certifications, includinginspections, tests, surveys and drydock, as well as remedialstructural work and other compliance costs, are deferredand amortized over the corresponding certification periods.Deferred regulatory certification and compliance costs areincluded in prepaid expenses and other current assets andother assets, net, and totaled $15.1 million and $14.1 millionat December 31, 2002 and 2001, respectively.
Derivative Financial InstrumentsEffective January 1, 2001, the Company adopted Statementof Financial Accounting Standards No. 133, “Accounting forDerivative Instruments and Hedging Activities” (“SFAS133”), as amended. The Company uses derivative financialinstruments (“derivatives”), on a limited basis, to reduceits exposure to various market risks, primarily interest raterisk and foreign currency risk. The Company employs an
E N S C O 2 0 0 2 A N N U A L R E P O R T

38
interest rate risk management strategy that uses derivativesto minimize or eliminate unanticipated fluctuations in earn-ings and cash flows arising from changes in, and volatilityof, interest rates. The Company maintains a foreign currencyrisk management strategy that occasionally utilizes deriva-tives to reduce its exposure to unanticipated fluctuationsin earnings and cash flows caused by changes in foreigncurrency exchange rates. The Company does not enter intoderivatives for trading or other speculative purposes.
All derivatives are recorded on the Company’s consol-idated balance sheet at fair value and are generally reportedin other current assets or accrued current liabilities.Accounting for the gains and losses resulting from changesin the fair value of derivatives depends on the use of thederivative and whether it qualifies for hedge accounting.Derivatives qualify for hedge accounting when they areformally designated as hedges at inception of the associatedderivative contract and are effective in reducing the riskexposure that they are designated to hedge. The Company’sassessment for hedge effectiveness is formally documentedat hedge inception and the Company reviews hedge effec-tiveness throughout the designated hedge period on at leasta quarterly basis. Changes in the fair value of derivativesthat are designated as hedges of the fair value of recognizedassets or liabilities or unrecognized firm commitments(“fair value hedges”) are recorded in earnings currently.Changes in the fair value of derivatives that are designatedas hedges of the variability in expected future cash flowsassociated with existing recognized assets or liabilities orforecasted transactions (“cash flow hedges”) are recordedin the accumulated other comprehensive loss section ofstockholders’ equity. Amounts recorded in accumulatedother comprehensive loss associated with cash flow hedgesare subsequently reclassified into earnings as earnings areaffected by the underlying hedged forecasted transaction.
The Company occasionally enters into derivatives thateconomically hedge certain risks, but the Company doesnot designate such derivatives as hedges or the derivativesotherwise do not qualify for hedge accounting under SFAS
133. In these situations, there generally exists a naturalhedging relationship where changes in the fair value of thederivatives offset changes in the fair value of the underlyinghedged items. Changes in the fair value of these derivativesare recognized in earnings currently.
Income TaxesDeferred tax assets and liabilities are recognized for theanticipated future tax effects of temporary differencesbetween the financial statement basis and the tax basis of theCompany’s assets and liabilities using the enacted tax ratesin effect at year end. A valuation allowance for deferred taxassets is recorded when it is more likely than not that thebenefit from the deferred tax asset will not be realized.
Stock-Based Employee CompensationThe Company uses the intrinsic value method of accountingfor employee stock options in accordance with AccountingPrinciples Board Opinion No. 25, “Accounting for StockIssued to Employees” (“APB 25”). Under the intrinsic valuemethod, if the exercise price of the Company’s stockoptions equals or exceeds the market value of the underly-ing stock on the date of grant, no compensation expenseis recognized.
In December 2002, the FASB issued Statement ofFinancial Accounting Standards No. 148, “Accounting forStock-Based Compensation - Transition and Disclosure”(“SFAS 148”), which provides optional transition guidancefor those companies electing to voluntarily adopt theaccounting provisions of Statement of Financial AccountingStandards No. 123, “Accounting for Stock-BasedCompensation” (“SFAS 123”). In addition, SFAS 148amends the disclosure requirements of SFAS 123 andrequires certain disclosures in both annual and interimfinancial statements. The Company will continue to accountfor stock-based compensation in accordance with APB 25.As such, the Company does not expect this standard to havea material impact on its consolidated financial position orresults of operations. The Company has adopted the disclo-
sure provisions of SFAS 148 at December 31, 2002 (seeNote 10 “Employee Benefit Plans”).
Earnings Per ShareFor each of the three years in the period ended December31, 2002, there were no adjustments to net income for pur-poses of calculating basic and diluted earnings per share.The following is a reconciliation of the weighted averagecommon shares used in the basic and diluted earnings pershare computations (in millions):
Year Ended December 31,2002 2001 2000
Weighted average common shares outstanding (basic) 140.7 136.9 137.6
Potentially dilutive common shares:Restricted stock grants – .1 .3Stock options .7 .9 1.4
Weighted average common shares outstanding (diluted) 141.4 137.9 139.3
Options to purchase 3.3 million shares of commonstock in 2002, 2.1 million shares of common stock in 2001and 71,000 shares of common stock in 2000 were notincluded in the computation of diluted earnings per sharebecause the exercise price of the options exceeded theaverage market price of the common stock.
ReclassificationsCertain previously reported amounts have been reclassifiedto conform to the 2002 presentation.
2. acquisitionOn August 7, 2002, the Company acquired Chiles OffshoreInc. (“Chiles”) pursuant to a Merger Agreement by andamong the Company, Chore Acquisition, Inc., a wholly-owned subsidiary of the Company, and Chiles (the “Merger
E N S C O 2 0 0 2 A N N U A L R E P O R T

39
Agreement”). Under the terms of the Merger Agreement,each Chiles shareholder received 0.6575 of a share of theCompany’s common stock and $5.25 in cash in exchangefor each share of Chiles common stock held. The Companyissued approximately 13.3 million shares of its commonstock, and paid approximately $106.6 million in cash to theholders of Chiles common stock.
The merger has been accounted for as a purchasebusiness combination in accordance with generally acceptedaccounting principles in the United States, with theCompany treated as the acquirer. The $567.9 million pur-chase price has been calculated using the number of theCompany’s common shares issued in the acquisition and a$33.65 per share average trading price of the Company’scommon stock for a period of time immediately before andafter the merger was announced, plus cash consideration of$5.25 per share of Chiles common stock outstandingimmediately prior to the merger, estimated direct mergerfees and expenses and the estimated fair value of vestedChiles employee stock options.
The purchase price has been allocated to assetsacquired and liabilities assumed based on estimated fairmarket values at the date of acquisition. The purchase priceallocation is preliminary and further refinements may bemade. The purchase price included, at estimated fairvalue at August 7, 2002, current assets of $29.8 million,drilling rigs and other property and equipment of $547.9million and the assumption of current liabilities of $38.7million, long-term debt of $153.0 million and other long-term liabilities of $64.6 million. The acquired long-termdebt included $51.2 outstanding under Chiles’ revolvingcredit facility, which the Company repaid on August 8,2002. The Company also recorded $246.5 million of good-will, which is supported by the nature of the offshoredrilling industry, the acquisition of long-lived drillingequipment, and the assembled workforce of Chiles. Theacquisition of Chiles will further strengthen the Company’sposition in the premium jackup market, which theCompany believes currently represents one of the strongest
segments of the offshore drilling market.Unaudited pro forma combined operating results of
the Company and Chiles for the years ended December 31,2002 and 2001, assuming the merger was completed as ofJanuary 1, 2001, are summarized as follows (in millions,except per share data):
2002 2001
Revenue $754.0 $891.6Operating income 124.8 347.0Net income before extraordinary item 68.9 229.8Net income 68.6 229.8Earnings per share
Basic $ .46 $1.53Diluted .46 1.52
The pro forma information presented above does notpurport to represent what the Company’s results actuallywould have been had the transaction occurred on theJanuary 1, 2001, nor does the pro forma information pur-port to project the Company’s results of operations for anyfuture period.
3. venezuela contract terminations and impairment
In 1999, the Company completed construction of threebarge rigs that commenced five-year contracts for the samecustomer on Lake Maracaibo in Venezuela. In Septemberand November of 2001, the customer elected to terminatetwo of the three long-term contracts after approximately halfof the five-year contract terms had been completed. The ter-minations resulted from the customer’s disappointing oilproduction rates from the reservoir and the ensuing reduc-tion in their drilling plans, and were not due to any fault withthe Company’s drilling rigs. In connection with the two con-tract terminations, the Company received lump sum, earlycontract termination payments totaling $28.8 million, all ofwhich was recognized as revenue during 2001.
The Company’s South America/Caribbean barge rigfleet operations have historically been concentrated onLake Maracaibo in Venezuela. Lake Maracaibo market con-ditions have been depressed for several years due toreduced or deferred exploration and development spendingby Venezuela’s national oil company, Petroleos deVenezuela, S.A. (“PdVSA”), which resulted from reduceddemand for Venezuelan oil production, economic declineand OPEC quota reductions. In addition, the economic andpolitical situation in Venezuela has become increasinglyunstable during recent years. As a result of the uncertaintysurrounding its South America/Caribbean barge rig fleet,the Company has evaluated the carrying value of the bargerigs for impairment on a regular basis during recent years.
In December 2001, the Company decided to sell thetwo oldest, least capable rigs in its South America/Caribbean barge rig fleet and removed those rigs from service.The carrying value of the two rigs was reduced to estimatednet realizable value and the Company recognized a $9.2million impairment charge for the year ended December31, 2001. During the third quarter of 2002 the Companymobilized a barge rig out of Venezuela to perform a long-term contract in Indonesia. While several of the Company’sbarge rigs are suited for other markets, both locally andglobally, such markets are not nearly as extensive as themarkets available to jackup or semisubmersible rigs.
During the fourth quarter of 2002, the economic andpolitical environment in Venezuela deteriorated severely. Astrike originating within PdVSA spread nationwide, involvingthe entire oil industry and the banking system, and causingsubstantial economic upheaval. The strike, mass termina-tions of PdVSA employees, and political interference in themanagement of PdVSA resulted in the near shutdown of theVenezuelan oil industry. Exchange controls have now beenenacted and many Venezuela businesses have ceased orreduced operations, causing substantial layoffs. Furthersubstantial contraction of the Venezuela economy is possible.These adverse developments resulted in a reduction inmanagement’s expectations of future cash flows to be
E N S C O 2 0 0 2 A N N U A L R E P O R T

40
generated by the barge rigs and the recognition of a $59.9million impairment charge in the fourth quarter of 2002.
In order to calculate the impairment charge, theCompany utilized the traditional present value method todetermine the fair value of its barge rigs. Expected futurecash flows to be generated by the barge rigs were developedbased on management assumptions and judgmentsregarding future Venezuela industry conditions and opera-tions, and included estimates of future utilization, day rates,expense levels and capital requirements of the barge rigs,discounted at a ten percent rate commensurate with therisk of the expected future cash flows.
The timing of an expected recovery of drilling activityin Venezuela is uncertain and considered unlikely in thenear term. The Company will continue monitoring the situationin Venezuela and evaluating the carrying value of its bargerigs for impairment. At December 31, 2002, the carryingvalue of the Company’s six barge rigs in Venezuela totaled$52.7 million.
4. property and equipmentProperty and equipment at December 31, 2002 and 2001consists of the following (in millions):
2002 2001
Drilling rigs and equipment $2,873.4 $2,125.0Marine vessels 121.1 105.9Other 27.7 30.6Work in progress 67.8 125.1
$3,090.0 $2,386.6
The Company acquired five ultra premium jackup rigsin connection with the Chiles merger, including one that wasunder construction at the August 7, 2002 acquisition dateand was subsequently completed during the fourth quarterof 2002. Additions to property and equipment in 2002included $563.6 million in connection with these five rigs.
During the fourth quarter of 2000, the Companyentered into an agreement with a major international ship-yard and, in connection therewith, acquired a 25% owner-ship interest in a harsh environment jackup rig underconstruction. The Company contributed $30.0 million($15.0 million in 2000 and $15.0 million in 2002) andcertain management and procurement services for its 25%interest. In May 2002, upon completion of rig construction,the Company contributed its 25% interest in the rig to ajoint venture (see Note 5 “Investment in Joint Venture”).
The Company completed construction of a harsh envi-ronment jackup rig, the ENSCO 101, and a deepwater semi-submersible rig, the ENSCO 7500, in February 2000 andDecember 2000, respectively. Additions to property andequipment for the ENSCO 101 and ENSCO 7500 totaled $14.6million and $114.4 million in 2001 and 2000, respectively.
In addition to the rig construction projects discussedabove, the Company’s additions to property and equipmentin 2002, 2001 and 2000 included $170.6 million, $102.9million and $71.6 million, respectively, in connection withmajor modifications and enhancements of rigs and vessels.
The Company evaluates the performance of its drillingrigs and marine vessels on an ongoing basis, and seeksopportunities to sell those that are less capable or lesscompetitive. In connection with such evaluations, theCompany sold a marine vessel in the third quarter of 2002for $700,000 and recognized a gain of $600,000 on thesale. The Company sold seven marine vessels during 2000for aggregate proceeds of $6.1 million and recognized a netgain of $500,000 on the sales.
5. investment in joint ventureDuring the fourth quarter of 2000, the Company enteredinto an agreement with Keppel FELS Limited (“KFELS”), amajor international shipyard, and acquired a 25% ownershipinterest in a harsh environment jackup rig under construction,which was subsequently named the ENSCO 102. During thesecond quarter of 2002, the Company and KFELS estab-lished a joint venture company, ENSCO Enterprises Limited
(“EEL”), to own and charter the ENSCO 102. Upon com-pletion of rig construction in May 2002, the Company andKFELS transferred their respective interests in the ENSCO102 to EEL in exchange for promissory notes in the amountof $32.5 million and $97.3 million, respectively. TheCompany has an option to purchase the ENSCO 102 fromEEL, at a formula derived price, which expires in May 2004.The Company and KFELS have initial ownership interests inEEL of 25% and 75%, respectively.
Concurrent with the transfer of the rig to EEL, theCompany agreed to charter the ENSCO 102 from EEL for atwo-year period that expires in May 2004. Under the termsof the charter, the majority of the net cash flow generatedby the ENSCO 102 operations is remitted to EEL in the formof charter payments. However, the charter obligation isdetermined on a cumulative basis such that cash flowdeficits incurred prior to initial rig operations are satisfiedprior to the commencement of charter payments. Charterproceeds received by EEL are used to pay interest on thepromissory notes and any cash remaining after all accruedinterest has been paid is used to repay the outstandingprincipal of the KFELS promissory note. Pursuant to anagreement between the Company and KFELS, the respectiveownership interests of the Company and KFELS in EEL areadjusted concurrently with repayments of principal on theKFELS promissory note such that each party’s ownershipinterest is equal to the ratio of its outstanding promissorynote balance to the aggregate outstanding principal balanceof both promissory notes.
A summary of the unaudited financial statements ofEEL as of and for the period ended December 31, 2002,is as follows:
E N S C O 2 0 0 2 A N N U A L R E P O R T

41
ENSCO Enterprises LimitedCondensed Balance Sheet December 31, 2002(in millions)(Unaudited)
assets
Charter revenue receivable $ 0.3)Property and equipment, net of
accumulated depreciation 127.9)$128.2)
liabilities and stockholders’ equity
Interest payable $ 6.4)Notes payable 129.8)Stockholders’ equity
Common stock –)Accumulated deficit (8.0)
Total stockholders’ equity (8.0)$128.2)
ENSCO Enterprises LimitedCondensed Statement of Operations Period from May 7, 2002 (Inception) to December 31, 2002(in millions)(Unaudited)
Charter revenue $ 0.3)Depreciation expense (1.9)Interest expense (6.4)
Net loss $(8.0)
The ENSCO 102 commenced drilling operations undera term contract in September 2002. During December2002, all of the cash flow deficits incurred prior to initial
rig operations were satisfied and EEL began recognizingcharter revenue. At December 31, 2002, the Company’sownership interest in EEL remained 25%.
At December 31, 2002, the Company’s net investmentin EEL totaled $37.0 million and is included in other assets,net on the consolidated balance sheet. The $5.0 millionexcess of the Company’s investment carrying value over itsequity in the underlying net assets of EEL is being amortizedover the estimated 30-year useful life of the ENSCO 102. TheCompany has recognized $500,000, net of intercompanyeliminations, from its equity in the losses of EEL, which isincluded in operating expenses on the consolidated state-ment of income for the year ended December 31, 2002.
In January 2003, the FASB issued Interpretation No. 46,“Consolidation of Variable Interest Entities, an Interpretation ofARB No. 51” (“FIN 46”). FIN 46 requires a company toconsolidate a variable interest entity, as defined, when thecompany will absorb a majority of the variable interest entity’sexpected losses, receive a majority of the variable interest enti-ty’s expected residual returns, or both. FIN 46 also requirescertain disclosures relating to consolidated variable interestentities and unconsolidated variable interest entities in which acompany has a significant variable interest. The disclosureprovisions of FIN 46 are effective for all financial statementsissued after January 31, 2003. The consolidation provisions ofFIN 46 apply immediately to variable interest entities createdafter January 31, 2003, and to variable interest entities inwhich a company obtains an interest after January 31, 2003.With respect to variable interest entities in which a companyholds a variable interest that it acquired before February 1,2003, the consolidation provisions are required to be appliedno later than the company’s first fiscal year or interim periodbeginning after June 15, 2003. The Company’s equity interestin, and related charter arrangement with, EEL constitute a vari-able interest in a variable interest entity under FIN 46. TheCompany has not completed an assessment of the impact of theFIN 46 consolidation provisions on its investment in EEL. TheCompany has adopted the disclosure provisions of FIN 46.
6. long-term debtLong-term debt at December 31, 2002 and 2001 consists ofthe following (in millions):
2002) 2001)
Interim construction loan $ 54.3) $ –)5.63% Bonds due 2011 52.1) –)6.36% Bonds due 2015 164.7) 177.4)6.75% Notes due 2007 149.5) 149.4)7.20% Debentures due 2027 148.4) 148.3)
569.0) 475.1)Less current maturities (21.5) (12.7)Total long-term debt $547.5) $462.4)
Interim Construction LoanIn connection with the acquisition of Chiles on August 7,2002, the Company assumed Chiles’ floating rate term loanagreement (the “Interim Construction Loan”), which providesapproximately $80.0 million of interim financing for theconstruction of the ENSCO 105 (formerly the ChilesGalileo). Interest on amounts borrowed under the InterimConstruction Loan is payable semiannually at a variable ratebased on the Lender’s cost of funds plus .30% (1.76% atDecember 31, 2002). Amounts borrowed under theInterim Construction Loan will be repaid with proceedsfrom 17-year bonds that the Company intends to issue inOctober 2003. The bonds will be repaid in 34 semiannualpayments of principal and interest and all borrowingsunder both the Interim Construction Loan and 17-yearbonds are guaranteed by the United States MaritimeAdministration (“MARAD”). The Interim Construction Loanis collateralized by the ENSCO 105 and the Company hasguaranteed the performance of its obligations under theInterim Construction Loan to MARAD. The outstandingprincipal balance of the Interim Construction Loan at theAugust 7, 2002 acquisition date was $50.0 million.
E N S C O 2 0 0 2 A N N U A L R E P O R T

42
5.63% Bonds Due 2011In connection with the acquisition of Chiles on August 7,2002, the Company assumed Chiles’ bonds that were origi-nally issued to provide long-term financing for the ENSCO76 (formerly the Chiles Coronado). The bonds are guaranteedby MARAD and are being repaid in 24 equal semiannualprincipal installments of $2.9 million, which commencedin January 2000 and will end in July 2011. Interest on thebonds is payable semiannually, in January and July, at afixed rate of 5.63%. The bonds are collateralized by theENSCO 76 and the Company has guaranteed the performanceof its obligations under the bonds to MARAD. The out-standing principal balance of the bonds at the August 7,2002 acquisition date was $52.9 million and the Companyrecorded an approximate $700,000 discount on the debt.
6.36% Bonds Due 2015On January 25, 2001, the Company issued $190.0 millionof 15-year bonds to provide long-term financing for theENSCO 7500. The bonds are guaranteed by MARAD and arebeing repaid in 30 equal semiannual principal installmentsof $6.3 million, which commenced in June 2001 and willend in December 2015. Interest on the bonds is payablesemiannually, in June and December, at a fixed rate of6.36%. The bonds are collateralized by the ENSCO 7500and the Company has guaranteed the performance of itsobligations under the bonds to MARAD. Net proceeds fromthe bond issuance totaled $49.5 million after settlement ofinterest rate lock contracts, underwriting fees and repay-ment of an interim construction loan.
Notes Due 2007 and Debentures Due 2027In November 1997, the Company issued $300.0 million ofunsecured debt in a public offering, consisting of $150.0million of 6.75% Notes due November 15, 2007 (the“Notes”) and $150.0 million of 7.20% Debentures dueNovember 15, 2027 (the “Debentures”). Interest on theNotes and the Debentures is payable semiannually in Mayand November. The Notes and the Debentures were issued
pursuant to a $500.0 million universal shelf registrationstatement filed with the Securities and ExchangeCommission in October 1997.
The Notes and Debentures may be redeemed at anytime at the option of the Company, in whole or in part, at aprice equal to 100% of the principal amount thereof plusaccrued and unpaid interest, if any, and a make-wholepremium. The indenture under which the Notes and theDebentures were issued contains limitations on the incur-rence of indebtedness secured by certain liens, and limita-tions on engaging in certain sale/leaseback transactionsand certain merger, consolidation or reorganizationtransactions. The Notes and Debentures are not subject toany sinking fund requirements.
Revolving Credit AgreementIn July 2002, the Company cancelled its existing $185.0million credit agreement and replaced it with a new $250.0million unsecured revolving credit agreement (the “CreditAgreement”) with a syndicate of banks. Interest on amountsborrowed under the Credit Agreement is based on LIBORplus an applicable margin rate (currently .525%), depend-ing on the Company’s credit rating. The Company pays acommitment fee (currently .225% per annum) on the total$250.0 million commitment, which also is based on theCompany’s credit rating. In addition, the Company isrequired to pay a utilization fee of .25% per annum on out-standing advances under the facility if such advances exceed33% of the total $250.0 million commitment. The Companyis required to maintain certain financial covenants under theCredit Agreement, including a specified level of interestcoverage, debt ratio and tangible net worth. The Companyhad no amounts outstanding under the Credit Agreement atDecember 31, 2002 and no amounts outstanding under theprevious $185.0 million credit agreement at December 31,2001. The Credit Agreement matures in July 2007.
Senior Subordinated Notes Due 2004In connection with the acquisition of Dual Drilling
Company (“Dual”) in June 1996, the Company assumedDual’s 9.875% Senior Subordinated Notes due 2004 (the“Dual Notes”). Interest on the Dual Notes was payablesemiannually and the Dual Notes were redeemable at theoption of the Company, in whole or in part, at annuallydecreasing prices. On March 15, 2000, the Company exer-cised its option to redeem all of the Dual Notes at a priceequal to 103.29% of the face amount, or $74.2 million,plus accrued interest. The excess of the amount paid overthe carrying value of the Dual Notes totaled $500,000 andhas been charged to “Other, net” under Other Income(Expense) in the consolidated statement of income for theyear ended December 31, 2000.
MaturitiesMaturities of long-term debt, excluding amortization of dis-counts, are $21.6 million in each of the four years endingDecember 31, 2006, $171.6 million for the year endingDecember 31, 2007 and $314.1 million thereafter. TheCompany is in compliance with the covenants of all of itsdebt instruments.
7. derivative financial instrumentsEffective January 1, 2001, the Company adopted Statementof Financial Accounting Standards No. 133, “Accounting forDerivative Instruments and Hedging Activities” (“SFAS133”), as amended. The adoption of SFAS 133 had noimpact on the Company’s net income. However, in accor-dance with the provisions of SFAS 133, the Companyrecorded a one-time, non-cash transition adjustment tocomprehensive income and the accumulated other com-prehensive loss section of stockholders’ equity effectiveJanuary 1, 2002, as follows (in millions):
Recognition of outstanding derivative instruments at fair value $ 3.8
Reclassification of unrealized losses on derivative instruments 7.4
Total transition adjustment $11.2
E N S C O 2 0 0 2 A N N U A L R E P O R T

43
The $3.8 million transition adjustment resulted fromthe recognition of the fair value of the Company’s outstandingtreasury rate lock agreements to set the interest rate on$150.0 million of its pending 15-year bonds. The treasuryrate lock agreements, which were designated and effectiveas cash flow hedges, were settled for $2.7 million onJanuary 25, 2001, concurrent with the issuance of theCompany’s bonds. The $2.7 million unrealized loss is beingreclassified from accumulated other comprehensive loss tointerest expense over the 15-year life of the bonds. The $1.1million change in the fair value of the treasury rate lockagreements from January 1, 2001 to January 25, 2001 hasbeen included in other comprehensive income (loss) forthe year ended December 31, 2001.
The $7.4 million transition adjustment resultedfrom the reclassification of unrealized losses on derivativespreviously reported as deferred finance costs and includedin other assets on the consolidated balance sheet. Theseunrealized losses are being reclassified from accumulatedother comprehensive loss to interest expense over the lifeof the associated debt.
In connection with the acquisition of Chiles on August7, 2002, the Company obtained $80.0 million notionalamount of outstanding treasury rate lock agreements.Chiles entered into the treasury rate lock agreementsduring the first and second quarters of 2002 and theymature in October 2003. Upon acquisition, the Companydesignated approximately $65.0 million notional amount ofthe treasury rate lock agreements as an effective hedgeagainst the variability in cash flows of $76.5 million ofMARAD guaranteed bonds the Company intends to issue inOctober 2003. The bonds will provide long-term financingfor the recently constructed ENSCO 105. The Companydeemed the remaining $15.0 million notional amount oftreasury rate lock agreements obtained in the Chiles acqui-sition to be speculative in nature. In October 2002, theCompany settled $10.0 million of the $15.0 million notionalamount of treasury rate lock agreements deemed as specu-lative. The fair value of the treasury rate lock agreements at
December 31, 2002, which is included in accrued currentliabilities, has declined $3.7 million from the August 7,2002 Chiles acquisition date, and a cumulative $8.6 millionsince their inception. The Company recognized an$800,000 loss during 2002 in connection with the treasuryrate lock agreements, which resulted from the decrease infair value of treasury rate lock agreements deemed to bespeculative. It is the Company’s intention to settle theremaining $5.0 million notional amount of speculativetreasury rate lock agreements obtained in connection withthe Chiles acquisition prior their maturity.
The Company estimates that $900,000 of unrealizedlosses on derivatives included in accumulated other com-prehensive loss at December 31, 2002 will be reclassified toearnings as interest expense during the next twelve months.
8. comprehensive incomeThe components of the Company’s comprehensive incomefor the years ended December 31, 2002, 2001 and 2000,are as follows (in millions):
2002) 2001) 2000Net Income $ 59.3) $207.3) $85.4Other comprehensive income (loss)
Transition adjustment for cumulative effect of adopting SFAS 133 –) (11.2) –
Net change in fair value of derivatives (2.6) 1.5) –
Reclassification of unrealized gains and losses on derivativesfrom other comprehensive income(loss) into net income .4) .9) –
Net other comprehensive income (loss) (2.2) (8.8) –Total comprehensive
income $ 57.1) $198.5) $85.4
The components of the accumulated other compre-hensive loss section of stockholders’ equity at December31, 2002 and 2001, are as follows (in millions):
December 31,2002 2001
Cumulative translation adjustment $ 1.1 $1.1Net unrealized losses on derivatives 11.0 8.8Total accumulated other
comprehensive loss $12.1 $9.9
9. stockholders’ equityThe Company initiated the payment of a $.025 per sharequarterly cash dividend on its common stock during thethird quarter of 1997. Cash dividends of $.10 per sharewere paid in each of the three years in the period endedDecember 31, 2002.
On August 7, 2002, the Company issued 13.3 millionshares of its common stock, valued at $33.65 per share, or$449.1 million, in connection with the Chiles merger.During 2001, the Company repurchased 4.3 million sharesof its common stock at a cost of $84.2 million (an averagecost of $19.37 per share).
E N S C O 2 0 0 2 A N N U A L R E P O R T

E N S C O 2 0 0 2 A N N U A L R E P O R T
A summary of activity in the various stockholders’ equity accounts for each of the three years in the period ended December 31, 2002 is as follows (shares in thousands, dollars in millions):
Restricted AccumulatedAdditional Stock Other
Common Stock Paid-In Retained (Unearned Comprehensive TreasuryShares Amounts Capital Earnings Compensation) Loss Stock
BALANCE, December 31, 1999 155,910 $15.6 $ 850.3 $525.0) $(6.3) $ (1.1) $(148.9)Net income – – – 85.4) –) –) –)Cash dividends paid – – – (13.8) –) –) –)Common stock issued under
employee and director incentiveplans, net 1,364 .1 19.2 –) –) –) (5.0)
Amortization of unearnedstock compensation – – – –) 1.4) –) –)
Tax benefit from stockcompensation – – 7.0 –) –) –) –)
BALANCE, December 31, 2000 157,274 15.7 876.5 596.6) (4.9) (1.1) (153.9)Net income – – – 207.3) –) –) –)Cash dividends paid – – – (13.7) –) –) –)Common stock issued under
employee and director incentiveplans, net 567 .1 9.1 –) (1.4) –) (1.0)
Repurchase of common stock – – – –) –) –) (84.2)Amortization of unearned
stock compensation – – – –) .9) –) –)Tax benefit from stock
compensation – – 3.0 –) –) –) –)Net other comprehensive income (loss) – – – –) –) (8.8) –)
BALANCE, December 31, 2001 157,841 15.8 888.6 790.2) (5.4) (9.9) (239.1)Net income – – – 59.3) –) –) –)Cash dividends paid – – – (14.2) –) –) –)Common stock issued under
employee and director incentiveplans, net 1,459 .1 31.7 –) (1.3) –) (12.0)
Amortization of unearnedstock compensation – – – –) 1.1) –) –)
Common stock issued inChiles acquisition 13,345 1.3 459.2 –) (.2) –) –)
Tax benefit from stockcompensation – – 4.0 –) –) –) –)
Net other comprehensive income (loss) – – – –) –) (2.2) –)BALANCE, December 31, 2002 172,645 $17.2 $1,383.5 $835.3) $(5.8) $(12.1) $(251.1)
44

45
At December 31, 2002 and 2001, the outstandingshares of the Company’s common stock, net of treasuryshares, were 149.0 million and 134.6 million, respectively.
On February 21, 1995, the Board of Directors of theCompany adopted a shareholder rights plan and declared adividend of one preferred share purchase right (a “Right”)for each share of the Company’s common stock outstandingon March 6, 1995. Each Right initially entitled its holder topurchase 1/100th of a share of the Company’s Series AJunior Participating Preferred Stock for $50.00, subject toadjustment. In March 1997, the plan was amended toincrease the purchase price from $50.00 to $250.00. TheRights generally will not become exercisable until 10 daysafter a public announcement that a person or group hasacquired 15% or more of the Company’s common stock(thereby becoming an “Acquiring Person”) or the com-mencement of a tender or exchange offer upon consum-mation of which such person or group would own 15% ormore of the Company’s common stock (the earlier of suchdates being called the “Distribution Date”). Rights will beissued with all shares of the Company’s common stockissued from March 6, 1995 to the Distribution Date. Untilthe Distribution Date, the Rights will be evidenced by thecertificates representing the Company’s common stock andwill be transferrable only with the Company’s commonstock. If any person or group becomes an AcquiringPerson, each Right, other than Rights beneficially owned bythe Acquiring Person (which will thereupon become void),will thereafter entitle its holder to purchase, at the Rights’then current exercise price, shares of the Company’s com-mon stock having a market value of two times the exerciseprice of the Right. If, after a person or group has becomean Acquiring Person, the Company is acquired in a mergeror other business combination transaction or 50% or moreof its assets or earning power are sold, each Right (otherthan Rights owned by an Acquiring Person which will havebecome void) will entitle its holder to purchase, at theRights’ then current exercise price, that number of sharesof common stock of the person with whom the Company
has engaged in the foregoing transaction (or its parent)which at the time of such transaction will have a marketvalue of two times the exercise price of the Right. After anyperson or group has become an Acquiring Person, theCompany’s Board of Directors may, under certain circum-stances, exchange each Right (other than Rights of theAcquiring Person) for shares of the Company’s commonstock having a value equal to the difference between themarket value of the shares of the Company’s common stockreceivable upon exercise of the Right and the exercise priceof the Right. The Company will generally be entitled toredeem the Rights for $.01 per Right at any time until 10days after a public announcement that a 15% position hasbeen acquired. The Rights expire on February 21, 2005.
10. employee benefit plans
Stock OptionsIn May 1998, the stockholders approved the ENSCOInternational Incorporated 1998 Incentive Plan (the “1998Plan”). The 1998 Plan replaced the Company’s previousstock incentive plan, the ENSCO International Incorporated1993 Incentive Plan (the “Incentive Plan”). Under the 1998Plan, a maximum of 11.3 million shares are reserved forissuance as options and awards of restricted stock. Stockoptions generally become exercisable in 25% incrementsover a four-year period and to the extent not exercised,expire on the fifth anniversary of the date of grant.
In May 1996, the stockholders approved the ENSCOInternational Incorporated 1996 Non-Employee Directors’Stock Option Plan (the “Directors’ Plan”). Under theDirectors’ Plan, a maximum of 600,000 shares are reservedfor issuance. Options granted under the Directors’ Planbecome exercisable six months after the date of grant andexpire, if not exercised, five years thereafter.
The exercise price of stock options granted under the1998 Plan and the Directors’ Plan is the market value of thestock at the date the option is granted.
In connection with the acquisition of Chiles on August7, 2002, the Company assumed Chiles’ stock option planand the outstanding stock options thereunder. The plan wasrenamed the ENSCO International Incorporated 2000 StockOption Plan (the “2000 Plan”) and the option awards havebeen converted to ENSCO common stock equivalents interms of exercise prices and number of shares exercisable.Exercise prices of the assumed options range from $10.74per share to $25.48 per share and the options expire at var-ious dates through February 2012 (6.2 years weightedaverage remaining contractual life). No further options willbe granted under the 2000 Plan and it will be terminatedupon the exercise or expiration date of the last outstandingoption. At December 31, 2002, options to purchase349,842 shares of the Company’s common stock remainedoutstanding under the 2000 Plan.
The Company uses the intrinsic value method ofaccounting for employee stock options in accordance withAPB 25. No compensation expense related to employeestock options is included in the Company’s net income, asthe exercise price of the Company’s stock options equalsthe market value of the underlying stock on the date ofgrant. The following table includes disclosures required bySFAS 123, as amended by SFAS 148, and illustrates the effecton net income and earnings per share as if the Companyhad applied the fair value recognition provisions of SFAS123 (in millions, except per share amounts):
E N S C O 2 0 0 2 A N N U A L R E P O R T

46
Year Ended December 31,2002) 2001) 2000)
Net income, as reported $ 59.3) $207.3) $85.4)Less stock-based employee
compensation expense, net of tax (12.6) (6.5) (4.8)Pro forma net income $ 46.7) $200.8) $80.6)
Basic earnings per share:As reported $ 0.42) $ 1.51) $0.62)Pro forma 0.33) 1.47) 0.59)
Diluted earnings per share:As reported 0.42) 1.50) 0.61)Pro forma 0.33) 1.47) 0.58)
The fair value of each option grant is estimated on thedate of grant using the Black-Scholes option pricing modelwith the following weighted average assumptions:
2002 2001 2000
Risk-free interest rate 3.9% 4.7% 6.6%Expected life (in years) 4.5% 4.2% 3.8%Expected volatility 52.5% 53.3% 52.7%Dividend yield .4% .3% .3%
The pro forma adjustments above may not be repre-sentative of pro forma adjustments in future years since theestimated fair value of stock options is amortized toexpense over the vesting period, additional options may begranted in future years and the assumptions used to deter-mine fair value can vary significantly.
A summary of stock option transactions under the1998 Plan, Directors’ Plan, 2000 Plan and Incentive Plan isas follows (shares in thousands):
E N S C O 2 0 0 2 A N N U A L R E P O R T
2002 2001 2000Weighted Weighted WeightedAverage Average AverageExercise Exercise Exercise
Shares Price Shares Price Shares Price
Outstanding at beginning of year 4,845) $23.57 3,427) $15.80 4,736) $14.87Granted 1,464) 30.74 2,118) 33.98 104) 32.24Assumed in Chiles acquisition 490) 17.91 –) – –) –Exercised (1,395) 21.61 (520) 14.57 (1,351) 13.93Forfeited (163) 27.63 (180) 24.35 (62) 13.39
Outstanding at end of year 5,241) $25.44 4,845) $23.57 3,427) $15.80Exercisable at end of year 1,886) $19.15 1,780) $19.83 1,433) $20.23Weighted average fair value of
options granted during the year $13.98 $15.74 $14.93
The following table summarizes information about stock options outstanding under the 1998 Plan, Directors’ Plan, 2000Plan and Incentive Plan at December 31, 2002 (shares in thousands):
Options Outstanding Options ExercisableNumber Weighted Average Number
Outstanding Remaining Weighted Average Exercisable Weighted AverageExercise Prices at 12/31/02 Contractual Life Exercise Price at 12/31/02 Exercise Price
$ 9 - $12 1,492 1.5 years $ 9.17 1,030 $ 9.2516 - 29 625 5.1 years 24.88 235 22.6130 - 32 1,015 4.4 years 31.76 2 30.6633 - 34 1,935 3.3 years 33.88 488 33.8935 - 36 174 3.3 years 36.15 131 35.85
5,241 3.2 years $25.44 1,886 $19.15
At December 31, 2002, 5.6 million shares were available for grant as options or incentive grants under the 1998 Planand 345,000 shares were available for grant as options under the Directors’ Plan.

47
Incentive Stock GrantsKey employees, who are in a position to contribute materiallyto the Company’s growth and development and to its long-term success, are eligible for incentive stock grants underthe 1998 Plan and previously under the ENSCO IncentivePlan. A maximum of 1.1 million shares may be issued asincentive stock grants under the 1998 Plan. Shares of commonstock subject to incentive grants generally vest at a rate of10% per year, as determined by a committee of the Boardof Directors. Compensation expense is measured using themarket value of the common stock on the date of grant andis recognized on a straight-line basis over the vesting period.
An aggregate 2.8 million shares of common stock havebeen issued as incentive stock grants under the 1998 Plan andprevious plans, of which 2.4 million were vested at December31, 2002. Incentive stock grants issued during the three yearsin the period ended December 31, 2002, were as follows:60,000 shares at a weighted average fair value of $26.82 pershare in 2002, 40,000 shares at a weighted average fair valueof $37.86 per share in 2001, and 10,000 shares at a weightedaverage fair value of $35.19 per share in 2000. At December31, 2002, there were 915,000 shares of common stockavailable for incentive stock grants under the 1998 Plan.Incentive stock grants for 278,500 shares of common stockwere outstanding at December 31, 2002, and vest as follows:55,500 shares in years 2003 and 2004, 43,500 shares in2005, 33,000 shares in 2006, 30,000 shares in 2007, 22,000shares in 2008, 12,000 shares in 2009, 11,000 shares in2010, 10,000 shares in 2011 and 6,000 shares in 2012.
Savings PlanThe Company has a profit sharing plan (the “ENSCO SavingsPlan”) which covers eligible employees with more than oneyear of service, as defined. Profit sharing contributionsrequire Board of Directors approval and may be in cash orgrants of the Company’s common stock. The Companyrecorded profit sharing contribution provisions of $3.6million, $8.5 million and $3.5 million for the years endedDecember 31, 2002, 2001 and 2000, respectively.
The ENSCO Savings Plan includes a 401(k) savingsplan feature which allows eligible employees with more thanthree months of service to make tax deferred contributionsto the plan. The Company makes matching contributionsbased on the amount of employee contributions and ratesset by the Company’s Board of Directors. Matching contri-butions totaled $4.8 million, $4.2 million and $1.6 millionin 2002, 2001 and 2000, respectively. The Company hasreserved 1.0 million shares of common stock for issuanceas matching contributions under the ENSCO Savings Plan.
Supplemental Executive Retirement PlanThe Company’s Supplemental Executive Retirement Plan(the “SERP”) provides a tax deferred savings plan forcertain highly compensated employees whose participationin the profit sharing and 401(k) savings plan features of theENSCO Savings Plan is restricted due to funding and contri-bution limitations of the Internal Revenue Code. The SERPis a non-qualified plan and eligibility for participation isdetermined by the Company’s Board of Directors. Thecontribution and Company matching provisions of the SERPare identical to the ENSCO Savings Plan, except that eachparticipant’s contributions and matching contributionsunder the SERP are further limited by contribution amountsunder the 401(k) savings plan feature of the ENSCO SavingsPlan. Matching contributions totaled $205,000 in 2002,$200,000 in 2001 and $93,000 in 2000. A SERP liability of$4.4 million and $3.9 million is included in other liabilitiesat December 31, 2002 and 2001, respectively.
11. income taxesThe Company had income of $49.6 million, $193.8 millionand $122.8 million from its operations before income taxesin the United States and income of $37.5 million, $98.1million and $2.4 million from its operations before incometaxes in foreign countries for the years ended December31, 2002, 2001 and 2000, respectively.
The components of the provision for income taxes foreach of the three years in the period ended December 31,2002 are as follows (in millions):
2002) 2001) 2000)
Current income tax expense (benefit):Federal $ (6.0) $32.5) $13.1)State .7) 1.0) –)Foreign 26.3) 26.1) 4.7)
21.0) 59.6) 17.8)Deferred income tax expense (benefit):
Federal 21.3) 26.6) 23.4)Foreign (14.5) (1.6) (1.4)
6.8) 25.0) 22.0)Total income tax expense $ 27.8) $84.6) $39.8)
Significant components of deferred income tax assets(liabilities) as of December 31, 2002 and 2001 are com-prised of the following (in millions):
2002) 2001)
Deferred tax assets:Net operating loss carryforwards $ .9) $ .9)Foreign tax credit carryforwards 29.5) 23.1)Alternative minimum tax credit
carryforwards 2.6) 4.4)Liabilities not deductible for tax purposes 4.4) 3.0)Accrued benefits 1.9) 2.3)Other 2.6) –)Total deferred tax assets 41.9) 33.7)
Deferred tax liabilities:Property (335.9) (247.6)Intercompany transfers of property (21.6) (23.7)Maritime capital construction fund (3.4) (9.4)Other (4.4) (6.7)Total deferred tax liabilities (365.3) (287.4)
Net deferred tax liabilities $(323.4) $(253.7)Net current deferred tax asset $ 8.9) $ 5.4)Net noncurrent deferred tax liability (332.3) (259.1)
Net deferred tax liability $(323.4) $(253.7)
E N S C O 2 0 0 2 A N N U A L R E P O R T

48
The consolidated effective income tax rate for each of thethree years in the period ended December 31, 2002, differsfrom the United States statutory income tax rate as follows:
2002 2001 2000
Statutory income tax rate 35.0% 35.0% 35.0%Foreign taxes (4.0) (7.3) (4.4)Goodwill amortization –) 1.0) .9)Other .9) .3) .3)Effective income tax rate 31.9% 29.0% 31.8%
At December 31, 2002, the Company had net operatingloss carryforwards of $2.4 million and foreign tax creditcarryforwards of $29.5 million. If not utilized, the netoperating loss carryforwards expire in 2007 and the foreigntax credit carryforwards expire from 2003 through 2007.As a result of certain acquisitions in prior years, the utilizationof a portion of the Company’s net operating loss carryfor-wards is subject to limitations imposed by the InternalRevenue Code of 1986. However, the Company does notexpect such limitations to have an effect upon its ability toutilize its net operating loss carryforwards.
It is the policy of the Company to consider that incomegenerated in foreign subsidiaries is permanently invested. Asignificant portion of the Company’s undistributed foreignearnings at December 31, 2002 was generated by controlledforeign corporations. A portion of the undistributed foreignearnings were taxed, for U.S. tax purposes, in the year thatsuch earnings arose. Upon distribution of foreign earningsin the form of dividends or otherwise, the Company may besubject to additional U.S. income taxes. However, deferredtaxes related to the future remittance of these funds are notexpected to be significant.
12. commitments and contingencies
LeasesThe Company is obligated under leases for certain of itsoffices and equipment. Rental expense relating to operatingleases was $5.6 million in 2002, $4.3 million in 2001 and$3.2 million in 2000. Future minimum rental paymentsunder the Company’s noncancelable operating leaseobligations having initial or remaining lease terms in excessof one year are as follows: $4.0 million in 2003; $3.1million in 2004; $2.1 million in 2005; $1.7 million in 2006;$1.6 million in 2007 and $0.7 million thereafter.
Anti-trust LawsuitIn September 2000, the Company and a number of otheroffshore drilling companies were named as a defendant ina purported class action, anti-trust lawsuit. The lawsuitalleged, among other things, that the Company and morethan 15 other defendant companies, whose collectiveoperations represent a majority of the U.S. offshore contractdrilling industry, conspired to avoid competition for drillinglabor by illegally fixing or suppressing the wages and benefitspaid their drilling employees in violation of certain provi-sions of the Sherman and Clayton Acts. The plaintiffs allegeddamages in excess of $5 billion, which could be trebledunder anti-trust laws, as well as attorney’s fees and costs.Although the Company denied the plaintiffs’ claims, it hasagreed to settle the case in order to avoid costly and timeconsuming litigation. In connection with the settlement andin consideration for the release of all claims regarding theCompany’s alleged actions, the Company paid the plaintiffs$625,000. The settlement was accrued in “Other, net”under Other Income (Expense) for the year endedDecember 31, 2001.
13. segment informationThe Company’s operations are categorized into two operatingsegments which are differentiated based on the core servicesprovided by the Company, (1) contract drilling services and(2) marine transportation services. At December 31, 2002,the Company’s contract drilling segment operated a fleet of56 offshore drilling rigs, including 43 jackup rigs, sevenbarge rigs, five platform rigs and one semisubmersible rig.At December 31, 2002, the Company’s marine transportationsegment owned and operated a fleet of 27 oilfield supportvessels. Operating income for each segment includes anallocation of general and administrative expenses of theCompany’s corporate office. Assets and depreciationexpense of the Company’s corporate office are not allocatedto the operating segments and are included in the “Other”column in the table below. Segment information for each ofthe three years in the period ended December 31, 2002 isas follows (in millions):
E N S C O 2 0 0 2 A N N U A L R E P O R T

49
INDUSTRY SEGMENTContract MarineDrilling Transportation Other Total
2002Revenues $ 649.5 $48.6) $ –) $ 698.1Operating income (loss) 108.8 (.2) (2.5) 106.1Assets 2,888.5 84.9) 88.1) 3,061.5Capital expenditures 208.1 8.7) 10.1) 226.9Depreciation and amortization 114.5 6.8) 2.5) 123.8
2001Revenues $ 752.7 $64.7) $ –) $ 817.4Operating income (loss) 300.9 18.9) (2.5) 317.3Assets 1,899.4 85.0) 339.4) 2,323.8Capital expenditures 128.2 13.8) 3.2) 145.2Depreciation and amortization 115.7 6.2) 2.5) 124.4
2000Revenues $ 496.1 $37.7) $ –) $ 533.8Operating income (loss) 130.0 3.2) (2.0) 131.2Assets 1,897.6 76.6) 133.8) 2,108.0Capital expenditures 230.2 22.4) 3.5) 256.1Depreciation and amortization 92.1 4.6) 2.0) 98.7
The Company’s operations are concentrated in four geographic regions: North America, Europe/West Africa, Asia Pacific and South America/Caribbean. At December 31, 2002, theCompany’s North America operations consisted of 22 jackup rigs, five platform rigs, one semisubmersible rig and 27 oilfield support vessels, all located in the U.S. waters of the Gulf of Mexico.The Company’s Europe/West Africa operations consist of eight jackup rigs, seven of which are currently deployed in various territorial waters of the North Sea and one is located offshoreNigeria. In Asia Pacific, the Company’s operations currently consist of 12 jackup rigs and one barge rig deployed in various locations. In South America/Caribbean, the Company’s opera-tions consist of six barge rigs located in Lake Maracaibo, Venezuela and one jackup rig located offshore Trinidad and Tobago. The Company attributes revenues to the geographic locationwhere such revenue is earned and assets to the geographic location of the drilling rig or marine vessel at December 31 of the applicable year. For new construction projects, assets are attrib-uted to the location of future operation if known or to the location of construction if the ultimate location of operation is undetermined. Operating income of the contract drilling segmentincludes impairment charges of $59.9 million and $9.2 million for the years ended December 31, 2002 and 2001, respectively.
E N S C O 2 0 0 2 A N N U A L R E P O R T

E N S C O 2 0 0 2 A N N U A L R E P O R T
Information by country for those countries that account for more than 10% of total revenues or 10% of the Company’s long-lived assets is as follows (in millions):
Revenues Long-lived Assets2002 2001 2000 2002 2001 2000
United States $303.8 $468.5 $352.3 $1,063.8 $ 778.0 $ 705.5Netherlands 11.5 35.9 10.1 33.2 201.1 288.3Venezuela 17.0 73.3 44.9 53.1 145.5 177.7Denmark 98.6 69.3 11.1 206.5 212.6 65.0United Kingdom 70.5 61.2 42.6 117.6 76.5 153.8Other foreign countries 196.7 109.2 72.8 783.8 301.6 295.0
Total $698.1 $817.4 $533.8 $2,258.0 $1,715.3 $1,685.3
Revenues from one customer in 2002 were $90.8million, or 13% of consolidated revenues and revenuesfrom this customer did not exceed 10% of consolidatedrevenues in 2001 and 2000. Revenues from two customersexceeded 10% of consolidated revenue in both 2001 and2000. Revenues from the first customer were $110.9 million,or 14% of consolidated revenue, in 2001 and $60.5 million,or 11% of consolidated revenue, in 2000. Revenues fromthe second customer were $100.5 million, or 12% ofconsolidated revenue, in 2001 and $96.6 million, or 18%of consolidated revenue, in 2000.
14. supplemental financial information
Consolidated Balance Sheet InformationAccounts receivable, net at December 31, 2002 and 2001consists of the following (in millions):
2002) 2001)
Trade $160.5) $111.1)Other 6.2) 9.3)
166.7) 120.4)Allowance for doubtful accounts (3.9) (3.9)
$162.8) $116.5)
Prepaid expenses and other current assets at December31, 2002 and 2001 consists of the following (in millions):
2002 2001
Prepaid expenses $10.9 $ 9.5Inventory 8.8 5.1Deferred tax asset 8.9 5.4Deferred regulatory certification
and compliance costs 7.9 9.7Other 2.7 4.7
$39.2 $34.4
Other assets, net at December 31, 2002 and 2001consists of the following (in millions):
2002 2001
Investment in joint venture $37.0 $ –Long-term investments – 23.0Deferred finance costs 9.8 5.2Prepaid taxes on intercompany
transfers of property 5.8 6.5Deferred regulatory certification and
compliance costs 7.3 4.4Other 5.9 4.3
$65.8 $43.4
Accrued liabilities at December 31, 2002 and 2001consists of the following (in millions):
2002 2001
Operating expenses $ 31.7 $20.9Accrued capital additions 33.7 26.9Taxes 54.4 46.8Payroll 22.3 23.9Accrued interest 5.8 4.7Derivative financial instruments 8.6 –Other 5.3 3.3
$161.8 $126.5
Consolidated Statement of Income InformationMaintenance and repairs expense for the years endedDecember 31, 2002, 2001 and 2000 is as follows (in millions):
2002 2001 2000
Maintenance and repairs $50.9 $44.7 $42.3
50

E N S C O 2 0 0 2 A N N U A L R E P O R T51
Consolidated Statement of Cash Flows InformationCash paid for interest and income taxes for each of the threeyears in the period ended December 31, 2002 is as follows(in millions):
2002 2001 2000
Interest, net of amounts capitalized $27.7 $30.3 $15.5Income taxes 7.2 12.2 22.4
Capitalized interest totaled $5.1 million in 2002, $2.2million in 2001, and $16.7 million in 2000.
In connection with the acquisition of Chiles on August7, 2002, the Company recorded current assets of $29.8 mil-lion, property and equipment of $547.9 million, goodwill of$246.5 million, current liabilities of $38.7 million, long-term debt of $153.0 million, other long-term liabilities of$64.6 million, and common stock and additional paid-incapital of $461.8 million.
In connection with the Company’s acquisition of the15% minority interest in ENSCO Drilling (Caribbean), Inc.(“Caribbean”) on February 10, 2000, the Company reducedthe value of Caribbean’s property and equipment by $6.6million, which represented the excess of the net assetsacquired over the Company’s acquisition cost.
Financial InstrumentsThe carrying amounts and estimated fair values of the Company’s debt instruments at December 31, 2002 and 2001 are asfollows (in millions):
2002 2001Estimated Estimated
Carrying Fair Carrying FairAmount Value Amount Value
6.75% Notes $149.5 $167.0 $149.4 $154.17.20% Debentures 148.4 164.4 148.3 150.46.36% Bonds, including current maturities 164.7 178.7 177.4 177.35.63% Bonds, including current maturities 52.1 60.4 – –Interim construction loan, including current maturities 54.3 54.3 – –
The estimated fair values of the Notes, Debentures and Bonds were determined using quoted market prices. The esti-mated fair value of the Interim Construction Loan was determined using interest rates available to the Company at December31, 2002 for issuance of debt with similar terms and remaining maturities.
The estimated fair value of the Company’s cash and cash equivalents, short-term and long-term investments, receivables,trade payables and other liabilities approximated their carrying values at December 31, 2002 and 2001. The Company hascash, receivables and payables denominated in currencies other than functional currencies. These financial assets and lia-bilities create exposure to foreign currency exchange risk. When warranted, the Company hedges such risk by entering intopurchase options or futures contracts. The Company does not enter into such contracts for trading purposes or to engage inspeculation. The fair value of such contracts outstanding at December 31, 2002 and 2001 was insignificant.
Concentration of Credit RiskThe Company is exposed to credit risk relating to its receivables from customers, its cash and cash equivalents, its short-termand long-term investments and its use of derivative instruments in connection with the management of interest rate risk andforeign currency risk. The Company minimizes its credit risk relating to receivables from customers, which consist primari-ly of major and independent oil and gas producers as well as government-owned oil companies, by performing ongoing cred-it evaluations. The Company also maintains reserves for potential credit losses, which to date have been within management’sexpectations. The Company minimizes its credit risk relating to cash and investments by maintaining such instruments in high-grade investments through a portfolio of major financial institutions, and by monitoring the financial condition of those finan-cial institutions. The Company minimizes its credit risk relating to the counterparties to its derivative instruments by trans-acting with multiple, high-quality counterparties, thereby limiting exposure to individual counterparties, and by monitoringthe financial condition of those counterparties.

52
15. unaudited quarterly financial data
A summary of unaudited quarterly consolidated financial information for 2002 and 2001 is as follows (in millions, except per share amounts):
2002 First Quarter Second Quarter Third Quarter Fourth Quarter Year
RevenuesContract drilling $130.0) $146.1) $179.2) $194.2) $649.5)Marine transportation 12.3) 11.1) 12.6) 12.6) 48.6)
142.3) 157.2) 191.8) 206.8) 698.1)Direct operating expenses
Contract drilling 78.8) 74.1) 93.5) 102.5) 348.9)Marine transportation 9.5) 10.2) 10.9) 10.2) 40.8)
88.3) 84.3) 104.4) 112.7) 389.7)Operating margin 54.0) 72.9) 87.4) 94.1) 308.4)Depreciation and amortization 28.5) 29.4) 31.7) 34.2) 123.8)Impairment of assets –) –) –) 59.9) 59.9)General and administrative 4.4) 4.6) 4.8) 4.8) 18.6)Operating income (loss) 21.1) 38.9) 50.9) (4.8) 106.1)Interest income 1.5) 1.6) 1.1) .9) 5.1)Interest expense, net (7.8) (8.1) (7.7) (7.5) (31.1)Other income (expense) 8.2) –) (1.8) .6) 7.0)Income (loss) before income taxes 23.0) 32.4) 42.5) (10.8) 87.1)Provision (benefit) for income taxes 6.8) 9.1) 12.0) (.1) 27.8)Net income (loss) $ 16.2) $ 23.3) $ 30.5) $(10.7) $ 59.3)Earnings (loss) per share
Basic $ .12) $ .17) $ .21) $ (.07) $ .42)Diluted .12) .17) .21) (.07) .42)
E N S C O 2 0 0 2 A N N U A L R E P O R T

53
2001 First Quarter Second Quarter Third Quarter Fourth Quarter Year
RevenuesContract drilling $180.5) $197.8) $210.3) $164.1) $752.7)Marine transportation 14.8) 17.7) 17.2) 15.0) 64.7)
195.3) 215.5) 227.5) 179.1) 817.4)Direct operating expenses
Contract drilling 80.3) 80.1) 81.2) 78.9) 320.5)Marine transportation 9.3) 9.6) 9.7) 9.8) 38.4)
89.6) 89.7) 90.9) 88.7) 358.9)Operating margin 105.7) 125.8) 136.6) 90.4) 458.5)Depreciation and amortization 28.9) 29.1) 28.6) 28.6) 115.2)Impairment of assets –) –) –) 9.2) 9.2)General and administrative 3.7) 4.2) 4.0) 4.9) 16.8)Operating income 73.1) 92.5) 104.0) 47.7) 317.3)Interest income 2.3) 2.3) 2.0) 1.7) 8.3)Interest expense, net (8.3) (8.5) (8.2) (7.8) (32.8)Other income (expense) .2) –) (1.2) .1) (.9)Income before income taxes 67.3) 86.3) 96.6) 41.7) 291.9)Provision for income taxes 20.4) 25.1) 27.3) 11.8) 84.6)Net income $ 46.9) $ 61.2) $ 69.3) $ 29.9) $207.3)Earnings per share
Basic $ .34) $ .44) $ .51) $ .22) $ 1.51)Diluted .34) .44) .51) .22) 1.50)
E N S C O 2 0 0 2 A N N U A L R E P O R T
16. subsequent eventOn February 20, 2003, the Company reached an agreementto sell its 27-vessel marine transportation fleet for $79.0million in cash. The transaction, which is subject to various
regulatory consents, is expected to close during the secondquarter of 2003, at which time the Company will ceaseconducting marine transportation operations. Managementbelieves this transaction will allow the Company to further
focus on expansion of the size and capability of its offshorerig fleet.

54
Se l e c t ed Conso l i d a t ed F i n an c i a l Da t a
The selected consolidated financial data set forth below for the five years in the period ended December 31, 2002 has been derived from the Company’s audited consolidated financialstatements. This information should be read in conjunction with the audited consolidated financial statements and notes thereto.
Year Ended December 31,(in millions, except per share amounts) 2002* 2001) 2000 1999 1998)
Consolidated Statement of Income DataRevenues $ 698.1) $ 817.4) $ 533.8 $ 363.7 $ 813.2)Operating expenses
Contract drilling and marine transportation 389.7) 358.9) 290.6) 250.8 329.1)Depreciation and amortization 123.8) 115.2) 98.7) 98.2 83.5)Impairment of assets 59.9) 9.2) –) – –)General and administrative 18.6) 16.8) 13.3) 11.2 15.4)
Operating income 106.1) 317.3) 131.2) 3.5 385.2)Other income (expense), net (19.0) (25.4) (6.0) 1.7 (2.7)Income before income taxes and minority interest 87.1) 291.9) 125.2) 5.2 382.5)Provision for income taxes 27.8) 84.6) 39.8) 3.5 123.8)Minority interest –) –) –) 1.4 4.8)Net income $ 59.3) $ 207.3) $ 85.4) $ .3 $ 253.9)Basic earnings per share $ .42) $ 1.51) $ .62) $ – $ 1.82)Diluted earnings per share .42) 1.50) .61) – 1.81)Weighted average common shares outstanding:
Basic 140.7) 136.9) 137.6) 136.5 139.6)Diluted 141.4) 137.9) 139.3) 137.7 140.6)
Cash dividends per common share $ .10) $ .10) $ .10) $ .10 $ .10)
Consolidated Balance Sheet DataWorking capital $ 189.2) $ 312.0) $ 171.6) $ 138.4 $ 316.9)Total assets 3,061.5) 2,323.8) 2,108.0) 1,983.7 1,992.8)Long-term debt, net of current portion 547.5) 462.4) 422.2) 371.2 375.5)Stockholders’ equity 1,967.0) 1,440.2) 1,328.9) 1,234.6 1,245.0)
* The Company acquired Chiles on August 7, 2002. Consolidated Statement of Income Data includes the results of Chiles from the acquisition date.
E N S C O 2 0 0 2 A N N U A L R E P O R T
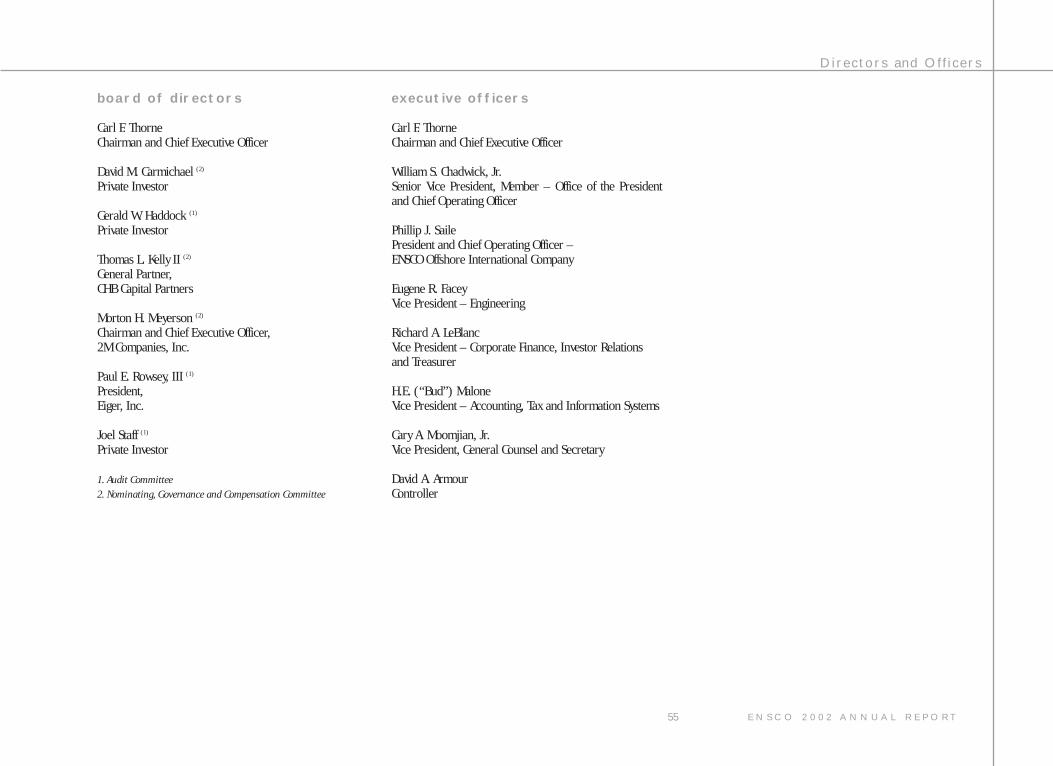
Di re c to r s a nd O f f i c e r s
55
board of directors
Carl F. ThorneChairman and Chief Executive Officer
David M. Carmichael (2)
Private Investor
Gerald W. Haddock (1)
Private Investor
Thomas L. Kelly II (2)
General Partner, CHB Capital Partners
Morton H. Meyerson (2)
Chairman and Chief Executive Officer, 2M Companies, Inc.
Paul E. Rowsey, III (1)
President, Eiger, Inc.
Joel Staff (1)
Private Investor
1. Audit Committee2. Nominating, Governance and Compensation Committee
* As of March 31, 2003
executive officers
Carl F. ThorneChairman and Chief Executive Officer
William S. Chadwick, Jr.Senior Vice President, Member – Office of the Presidentand Chief Operating Officer
Phillip J. SailePresident and Chief Operating Officer – ENSCO Offshore International Company
Eugene R. FaceyVice President – Engineering
Richard A. LeBlancVice President – Corporate Finance, Investor Relationsand Treasurer
H.E. (“Bud”) MaloneVice President – Accounting, Tax and Information Systems
Cary A. Moomjian, Jr.Vice President, General Counsel and Secretary
David A. ArmourController
E N S C O 2 0 0 2 A N N U A L R E P O R T

56
S tockho l de r I n fo rma t i on
Quarterly Closing Stock Price
2001 High Low
First $44.49 $30.19Second $40.44 $22.88Third $23.68 $12.81Fourth $26.23 $13.91
2002
First $30.70 $20.87Second $35.50 $26.70Third $28.98 $21.19Fourth $31.62 $24.15
Stock ExchangeThe Company’s Common Stock (“ESV”) is traded on theNew York Stock Exchange. At February 15, 2003, therewere approximately 1,500 stockholders of record of theCompany’s Common Stock.
Stock Dividends The Company paid four quarterly cash dividends of $.025per share during 2002.
Independent Accountants KPMG LLP Dallas, Texas
Transfer Agent American Stock Transfer and Trust Company40 Wall StreetNew York, New York 10005-2392(718) 921-8200(800) 937-5449
Notice of Annual MeetingThe Annual Meeting of Stockholders will be held at 10:00 a.m., May 13, 2003, at the Fairmont Hotel,1717 N. Akard Street, Dallas, Texas 75201-2344
Form 10-K and Additional Information The Company’s Annual Report on Form 10-K filed with theSecurities Exchange Commission is available in the SECFilings section of the Company’s website and also will beprovided without charge by request to ENSCO’s InvestorRelations Department.
Analysts requesting additional information should contactENSCO’s Investor Relations Department. Communicationsconcerning transfer requirements, lost certificates andchanges of address should be directed to the Transfer Agent.
Corporate Governance, Board and Board Committees, Website DataThe Corporate Governance section of the Company’s web-site, www.enscous.com/CorpGov.asp, contains informationregarding (i) the composition of the Company’s Board ofDirectors and Board Committees, (ii) CorporateGovernance in general, (iii) the ENSCO CorporateGovernance Policy, (iv) the ENSCO Code of BusinessConduct Policy, (v) “whistleblower” reporting provisions,and (vi) the charters of the committees of the Company’sBoard of Directors. A copy of foregoing information also isavailable to any person without charge by request toENSCO’s Investor Relations Department. Additionally, theCompany’s website contains a direct link to the Company’sSEC filings, including reports required under Section 16 ofthe Securities Exchange Act of 1934.
Investor Relations DepartmentENSCO International Incorporated500 North Akard Street, Suite 4300Dallas, Texas 75201-3331(214) 397-3000
Executive OfficesENSCO International Incorporated500 North Akard Street, Suite 4300Dallas, Texas 75201-3331(214) 397-3000http://www.enscous.com
E N S C O 2 0 0 2 A N N U A L R E P O R T


ENSCO INTERNATIONAL INCORPORATED
500 N. Akard StreetSuite 4300Dallas, Texas 75201-3331
Top Related