


Languages
Pages
Legal

Enhanced Biological Phosphorus Removal at the
Marquette Area WWTP
2012 MWEA Administrators Conference
Frankenmuth, Michigan
Outline
• the City and the plant
• Tankage, a good candidate.
• Process Specifics and Control
• Conditions to watch for
• Performance Summary: Chapter 1 and Chapter 2


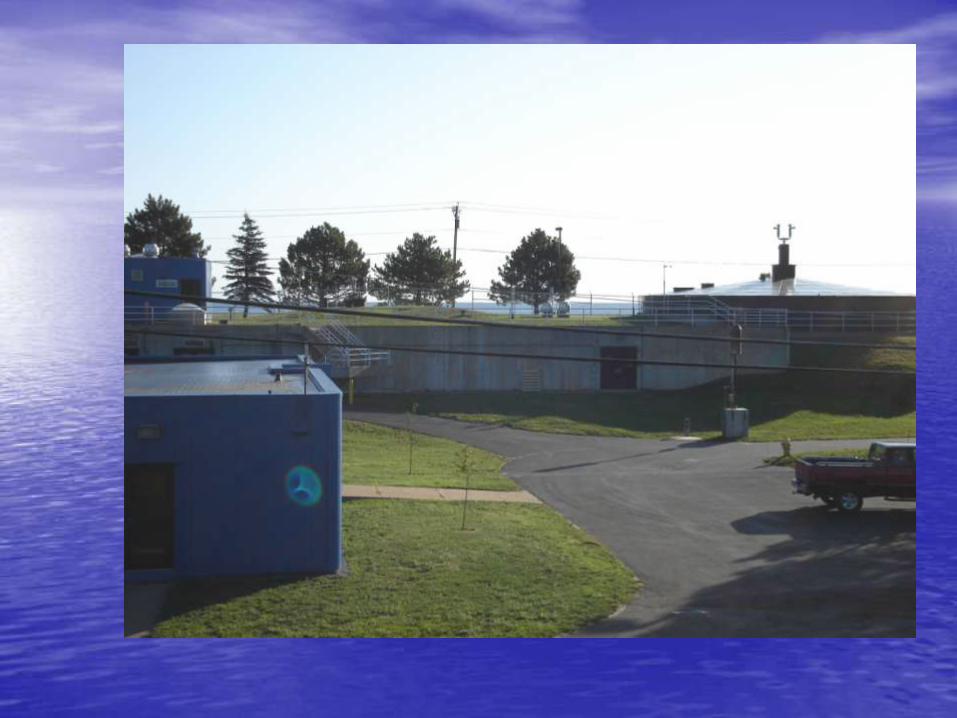
The real Marquette…

Marquette Area WWTP
• Original construction 1953
• Secondary Treatment upgrade 1978
• Second, Secondary Treatment upgrade 2008
• Discharge
• Flow Rate

RAW
SEWAGE
PLUME
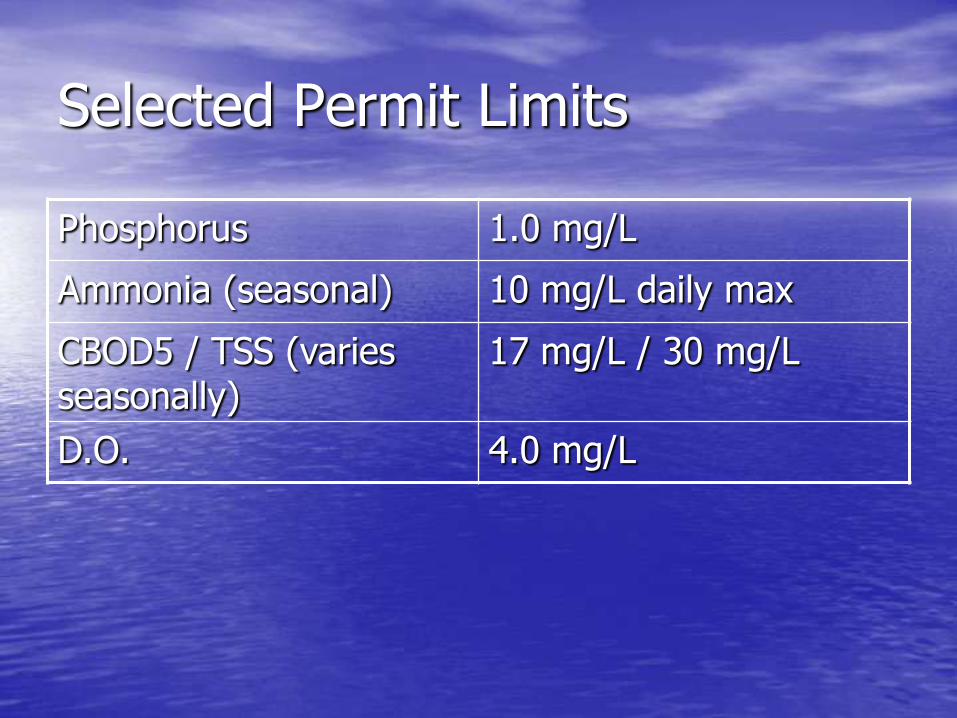
Selected Permit Limits
Phosphorus 1.0 mg/L
Ammonia (seasonal) 10 mg/L daily max
CBOD5 / TSS (varies seasonally)
17 mg/L / 30 mg/L
D.O. 4.0 mg/L


History of the Bio-P Tanks
• Original construction 1953: primary clarifiers, 2 x 115,000 gallons
• New Purpose: modified UCT bio-P tanks
• Cartoon illustrations

RAS
Primary Clarifier #1
Primary Clarifier #2
Started with this…
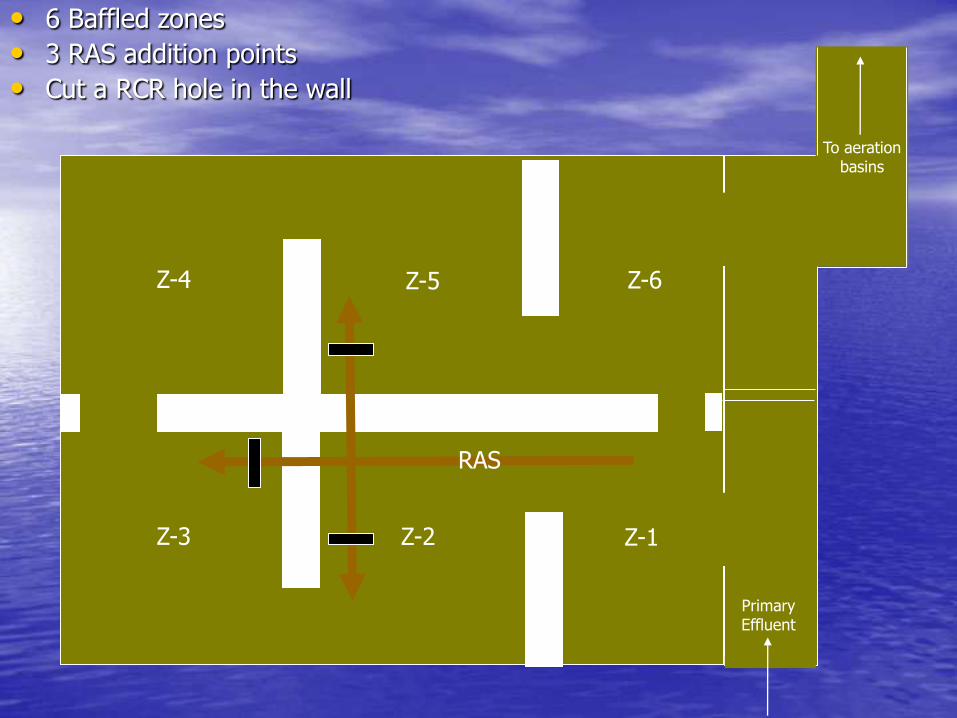
To aerationbasins
RAS
PrimaryEffluent
RAS
Z-1Z-2Z-3
Z-4 Z-5 Z-6
• 6 Baffled zones
• 3 RAS addition points
• Cut a RCR hole in the wall
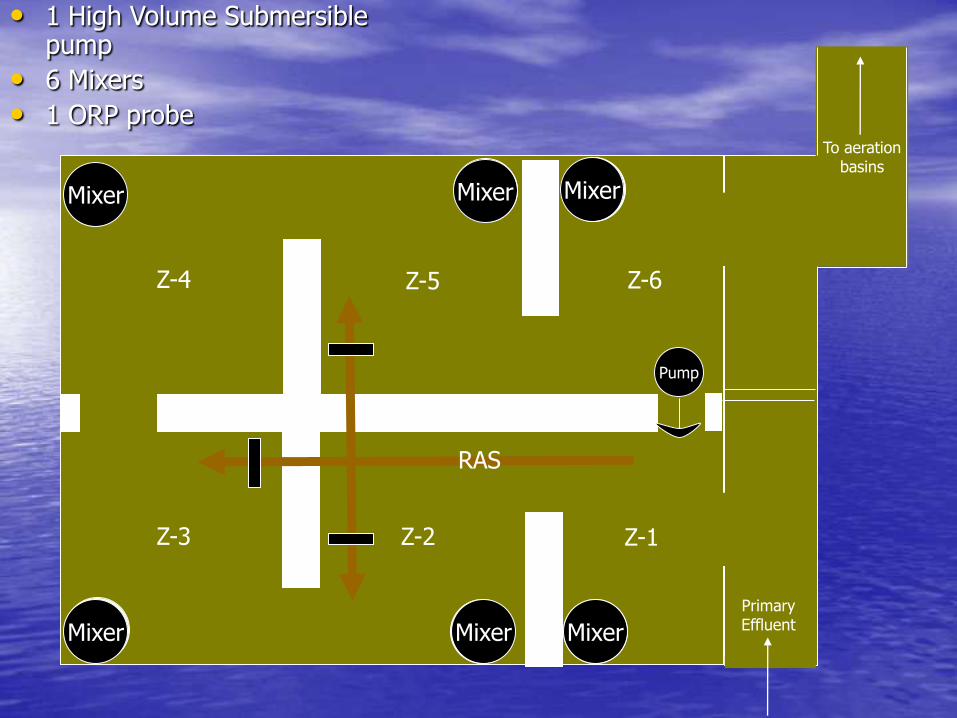
To aerationbasins
RAS
PrimaryEffluentMixer
MixerMixerMixer
Mixer Mixer MixerMixerMixer
Mixer Mixer
Pump
RAS
Z-1Z-2Z-3
Z-4 Z-5 Z-6
• 1 High Volume Submersible pump
• 6 Mixers
• 1 ORP probe
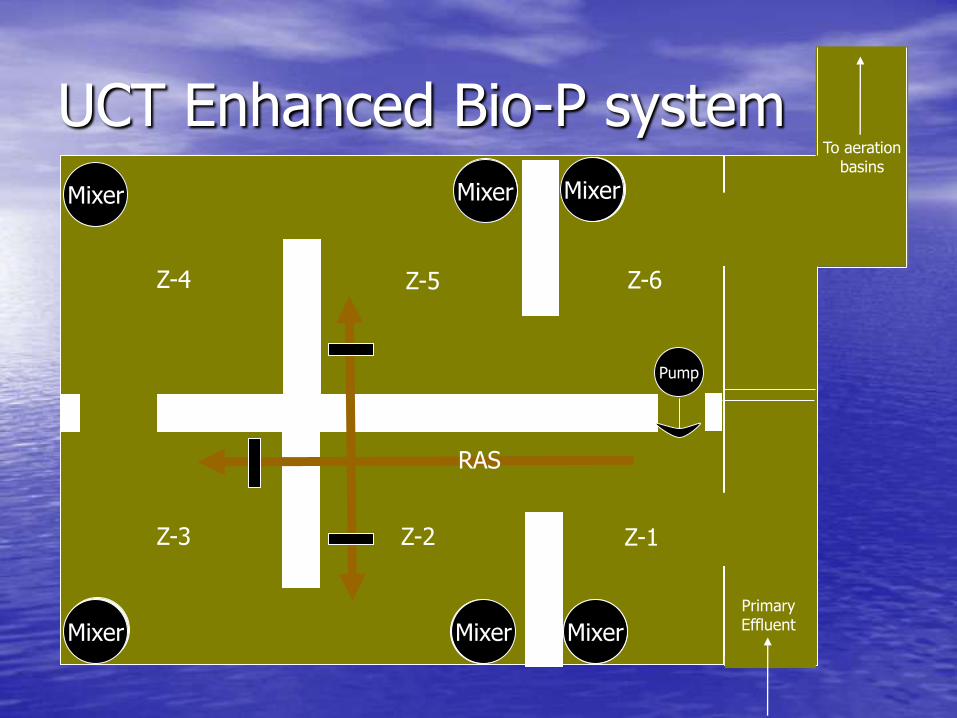
To aerationbasins
RAS
PrimaryEffluentMixer
MixerMixerMixer
Mixer Mixer MixerMixerMixer
Mixer Mixer
Pump
RAS
Z-1Z-2Z-3
Z-4 Z-5 Z-6
UCT Enhanced Bio-P system
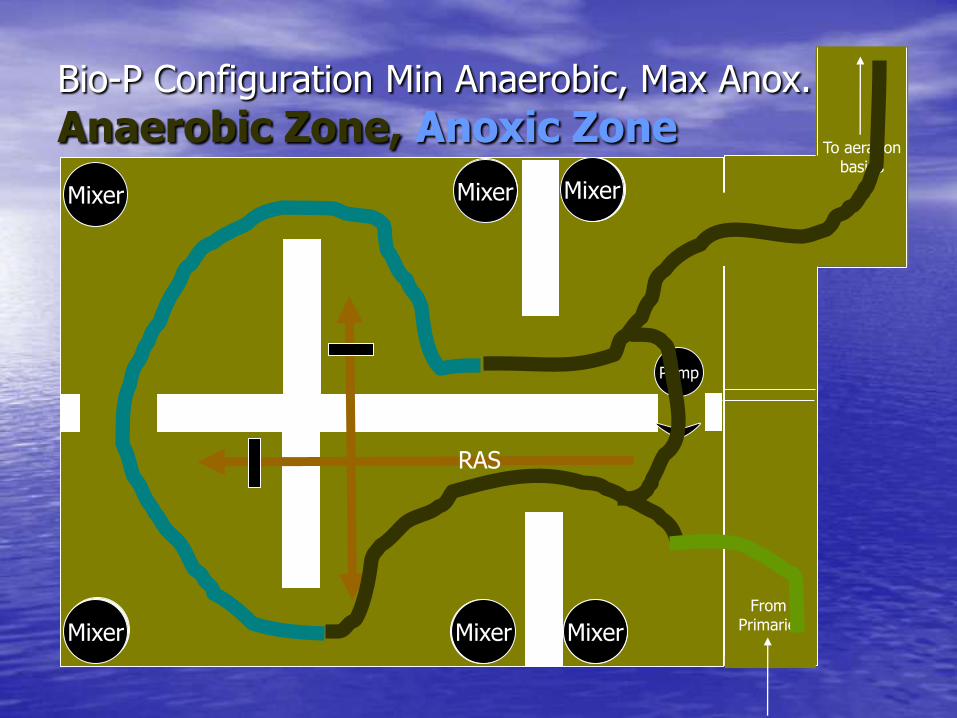
To aerationbasins
RAS
FromPrimariesMixer
MixerMixerMixer
Mixer Mixer MixerMixerMixer
Mixer Mixer
Pump
RAS
Bio-P Configuration Min Anaerobic, Max Anox.
Anaerobic Zone, Anoxic Zone


Flow Diagram
Bio-P Process
Anaerobic ConditionP Release
Anoxic Condition
Denitrification
Aerobic Condition
Phosphorus Uptake


ORP
OxygenCondition
0 mg/L DOConcentration
0 –~8 mg/L
DO
ORP, -500 mV
To +1000- mV
Anoxic Condition
Anaerobic Condition
Aerobic Condition
OxidizersFree elemental oxygen, O2NO3…any other type of oxidantReducersBiomass, ML bacteria
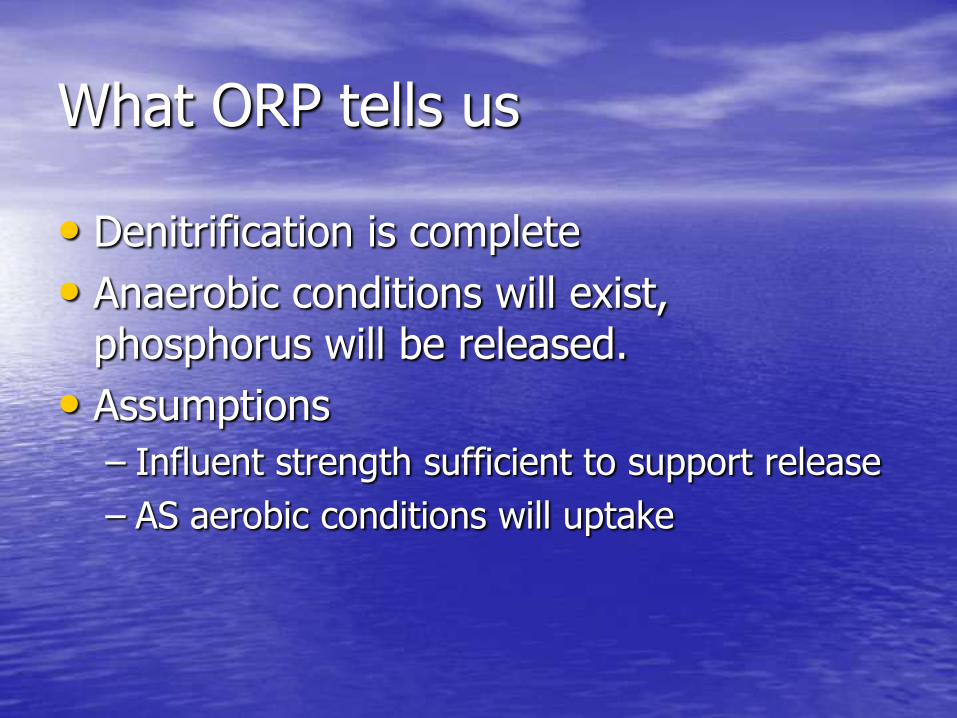
What ORP tells us
• Denitrification is complete
• Anaerobic conditions will exist, phosphorus will be released.
• Assumptions
– Influent strength sufficient to support release
– AS aerobic conditions will uptake

Precautions

Phosphorus Removal Mechanisms
• Chemical coagulation
– Chemical sludge
– Bound up, dead end
• Biological uptake
– Phosphorus rich W.A.S.
• This can come back to haunt you!
328mg/L

Problematic Encounters
• Clarifier Collector Failures
• WAS tank aeration diffuser failure
• Root control
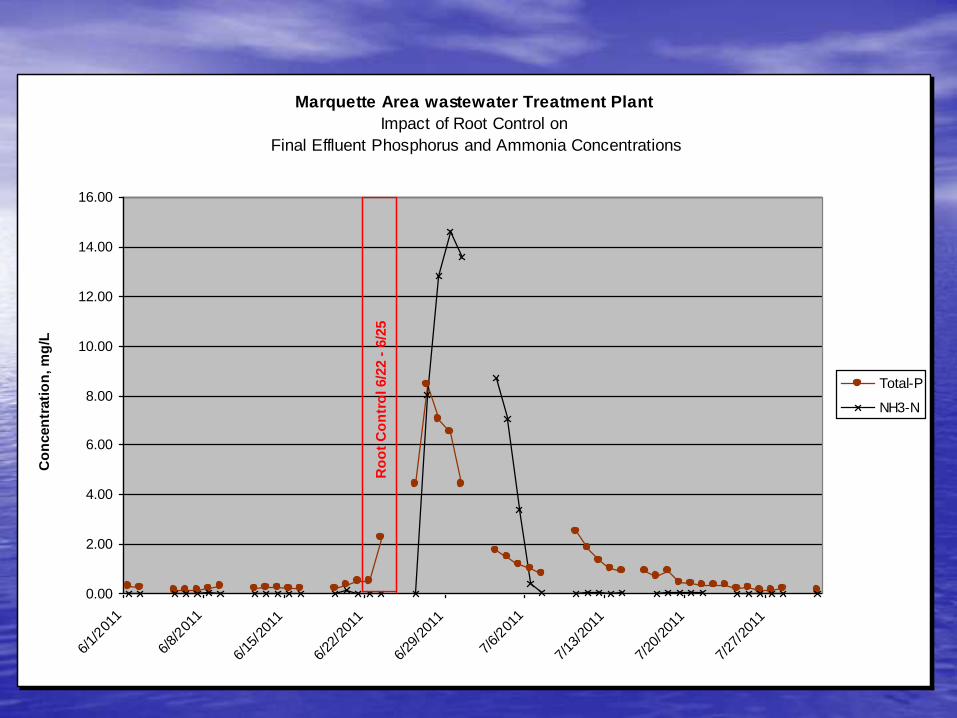
Marquette Area wastewater Treatment Plant
Impact of Root Control on
Final Effluent Phosphorus and Ammonia Concentrations
0.00
2.00
4.00
6.00
8.00
10.00
12.00
14.00
16.00
6/1/
2011
6/8/
2011
6/15
/201
1
6/22
/201
1
6/29
/201
1
7/6/
2011
7/13
/201
1
7/20
/201
1
7/27
/201
1
Co
ncen
trati
on
, m
g/L
Total-P
NH3-N
Ro
ot
Co
ntr
ol 6/2
2 -
6/2
5
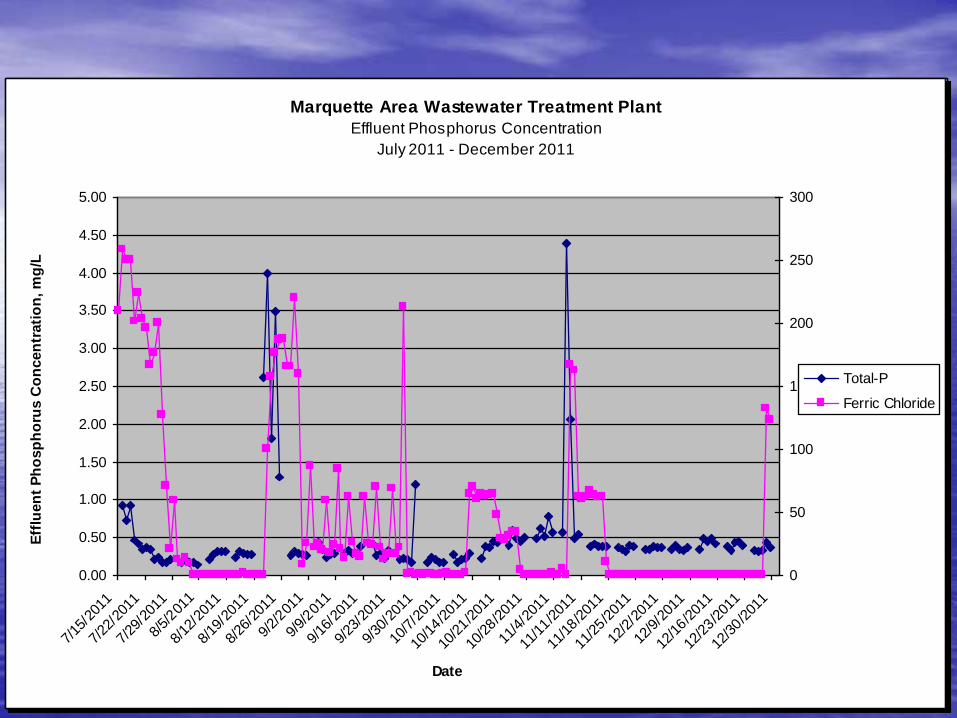
Marquette Area Wastewater Treatment Plant
Effluent Phosphorus Concentration
July 2011 - December 2011
0.00
0.50
1.00
1.50
2.00
2.50
3.00
3.50
4.00
4.50
5.00
7/15
/201
1
7/22
/201
1
7/29
/201
1
8/5/
2011
8/12
/201
1
8/19
/201
1
8/26
/201
1
9/2/
2011
9/9/
2011
9/16
/201
1
9/23
/201
1
9/30
/201
1
10/7
/201
1
10/1
4/201
1
10/2
1/201
1
10/2
8/201
1
11/4
/201
1
11/1
1/201
1
11/1
8/201
1
11/2
5/201
1
12/2
/201
1
12/9
/201
1
12/1
6/201
1
12/2
3/201
1
12/3
0/201
1
Date
Eff
luen
t P
ho
sp
ho
rus C
on
cen
trati
on
, m
g/L
Total-P
Marquette Area Wastewater Treatment Plant
Effluent Phosphorus Concentration
July 2011 - December 2011
0.00
0.50
1.00
1.50
2.00
2.50
3.00
3.50
4.00
4.50
5.00
7/15
/201
1
7/22
/201
1
7/29
/201
1
8/5/
2011
8/12
/201
1
8/19
/201
1
8/26
/201
1
9/2/
2011
9/9/
2011
9/16
/201
1
9/23
/201
1
9/30
/201
1
10/7
/201
1
10/1
4/201
1
10/2
1/201
1
10/2
8/201
1
11/4
/201
1
11/1
1/201
1
11/1
8/201
1
11/2
5/201
1
12/2
/201
1
12/9
/201
1
12/1
6/201
1
12/2
3/201
1
12/3
0/201
1
Date
Eff
luen
t P
ho
sp
ho
rus C
on
cen
trati
on
, m
g/L
0
50
100
150
200
250
300
Total-P
Ferric Chloride
Averages for 6 Months
• 0.50 mg/L phosphorus
• 41 gallons per day for ferric
Summary
• Incredibly power biological tool…but
• Beware of non aerated ML sludge potential
• Be wary of keeping any excess WAS
• Added complexity: Increased likelihood of permit violation
• Have a Hair Trigger response with chemical addition
• Sidestream load equalization and ferric chloride addition to the process
• Layperson understanding of process.

The End
Top Related