


Languages
Pages
Legal


British Journal of Environmental Sciences
Vol.2, No.4, pp.11-28, December 2014
Published by European Centre for Research Training and Development UK (www.eajournals.org)
11
ISSN 2055-0219(Print), ISSN 2055-0227(online)
ENGINEERING PROPERTIES AND USES OF SOIL DERIVE FROM
MAASTRITCHIAN AJALI FORMATION IN A PART OF SE NIGERIA
Onunkwo – A, A, Uzoije A.P, Onyekuru, S, O
Dept. of Geosciences, Federal University of Technology, Owerri, Nigeria.
ABSTRACT: The study is necessitated by the recent move by Imo State government of Nigeria
to raise Okigwe town to urban status. Ajali Formation being the prominent geological terrain in
Okigwe area, most structures would be erected on the soil derived from it. The parameter
measured include grain size, atterberg limits, and compaction, shear strength, permeability and
porosity as well as bulk density. The result shows that the soil underlain by Ajali Formation
within Okigwe area is sandy silt with low clay content and has plasticity index, bulk density,
porosity and permeability values of 9.65%, 2.06%,kg/m3, 0.45 and 0.35cm/s respectively.The
value for the optimum moisture content (OMC) maximum dry density(MDD) shear strength,
angle of internal friction are 13.5%, 2.06kg/m3, 106.86KN/M2 and 28.4o. These values indicate
that the soil derived from Maastrichtian Ajali Formation within Okigwe area of south eastern
Nigeria is of high strength, porous and permeable and can be used as a recharge site for
regional aquifer, but cannot be used as a waste disposal area or for road construction. The soil
due to its low plasticity index with no swelling characteristics and high shear strength is a good
site for building foundations, but cannot be used in dam construction. It is ideal for projects
requiring good drainage and embankments. However, for the soil to be used in any engineering
construction works, it has to be compacted to its maximum dry density value of 2.06kg/m3 within
the range of optimum moisture content of 13.5% as to achieve maximum strength.
KEYWORDS: Soil, Uses, Engineering Properties, Ajali Formation, Okigwe , SE Nigeria.
INTRODUCTION
Since Imo State Government wishes to raise Okigwe town to Urban Status, this study becomes
necessary since soil factors affect the designs, construction and stability of engineering structures
such as dams, bridges road construction, canals, buildings and water supply structures (Bell
1992). The type and characteristics of soil depends on its origin (Barnes, 2000). The engineering
properties namely permeability, consolidation, compaction and shear strength are governed by
the mode of formation, stress history, groundwater conditions and physicochemical
characteristics of the surficial deposits derived from parent material (Craig, 2004). The work is
intended to determine through experimental procedure some of the geotechnical properties and
engineering applications of soils derived from maastritchian Ajali Formation within Okigwe in
Anambra /Imo sedimentary basin of SE Nigeria. Geotechnical engineers classify soil according
to their engineering properties as they relate to use for foundation support or building material
Budhu, (2007). According to Joseph, (2008) Structures of all types - buildings, bridges,
British Journal of Environmental Sciences
Vol.2, No.4, pp.11-28, December 2014
Published by European Centre for Research Training and Development UK (www.eajournals.org)
12
ISSN 2055-0219(Print), ISSN 2055-0227(online)
highways, dams and canals rest directly on soil and solid foundation is necessary to ensure that
these structure remain safely free of undue settlement and collapse (Att well and Former, 1976).
According to Terzaghi and Peck (1995), soil laboratory analysis is an important step in the
evaluation of soil engineering properties. Quantitatively, since soil conditions vary from one
location to another, no construction site presents soil conditions exactly like any other (Das
Braja, (2006). According to Montgomery (2000), Major soil tests commonly carried out for
engineering purposes include atterberg limit tests (Liquid limit, plastic limit and plasticity index)
porosity and permeability test shear strength, bulk density and compaction. Montgomery, (2000)
pointed out the importance of atterberg limits in engineering works. Atterberg limits are used to
distinguish between silt and clay. According to the author, the consistency of a given soil
depends on its water content as described by atterberg limits.
According to Craig, (2004), Soil permeability/Porosity has many implications in engineering
works, for example a pond built in permeable soil will loose water through seepage. The design
of earth dams is based upon permeability of the soil used; also, the stability of slopes and
retaining structures can be greatly affected by the permeability of the soil involved. Joseph,
(2008) pointed out that knowledge of the permeability properties of soil is necessary in the
estimation of groundwater seepage and also the stability of slopes and retaining structures can
be greatly affected by the permeability of the soil involved. Joseph, (2008) pointed out that
knowledge of the permeability properties of soil is necessary in the estimation of ground water
seepage and also helps in the stability analysis of earth structure and earth retaining walls
subjected to seepage forces. Shear strength of soil is important in engineering works as it
signifies its resistance to deformation. According to Burland, (2005) soil derives its strength
from two sources namely Cohesion and frictional resistance between particles. In his work,
Kaneko et al, (1993) indicated that the safety of any geotechnical structure is dependent on the
strength of soil. Understanding the shear strength of a soil is the basis in the analysis of soil
stability problems, such as Lateral pressure in earth retaining structures, Slope Stability and
bearing capacity.
Bulk density reflects the soils ability to function as structural support Kramer, (2000). According
to the author high bulk density is an indicator of low soil porosity and compaction. In his work,
Price (2008), indicated that high bulk density of soil reduced vegetative cover, exposes the soil to
erosion and leads to water logging in areas of flat surfaces. The importance of soil compaction in
engineering work was clearly spelt out by Rober, (2001). He pointed out that soil compaction
properties is one of the most common and cost effective means of stabilizing soil. Design
specifications state the required density maximum and water content used in increasing the
bearing capacity of foundations and reduction in hydraulic conductivities.
In third world countries including Nigeria, little attention is paid to soil analysis prior to
construction to ascertain the carry capacity of the soil in question. This is due probably to the
activities of quakes and unavailability of soil analysis data bank. This perhaps is a strong factor

British Journal of Environmental Sciences
Vol.2, No.4, pp.11-28, December 2014
Published by European Centre for Research Training and Development UK (www.eajournals.org)
13
ISSN 2055-0219(Print), ISSN 2055-0227(online)
for frequent structure collapse and its attendant loss of human and material resources in Nigeria
and other parts of the world (Onunkwo Akunne, et al 2011). To meet up with the standard of soil
specifications, the federal government of Nigeria set up a standard as reference point for various
soil properties before use as to avoid economic loses. Therefore, this work is intended to
determine through experimental procedure some of the geotechnical properties and likely
engineering applications of soil derived from Maastrichtian Ajali Formation within
Anambra/Imo sedimentary basin of south eastern Nigeria as case study and this also serves as a
soil data bank for engineering work.
MATERIALS AND METHOD
Description of the study areas
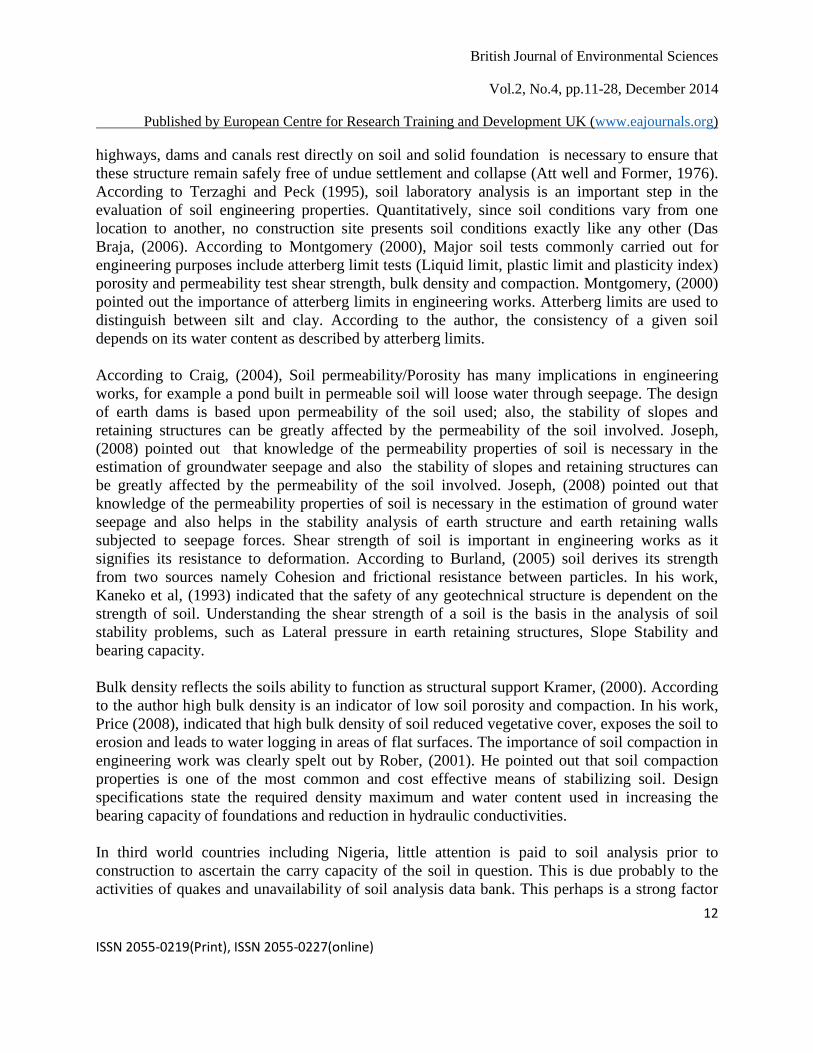
Okigwe lies within latitude 50 46N to 50 539 and longitude 70 18 E to 7 0 25’E as shown in
topographic map fig1. It is characterized by massive elevated land form that slops from eastern
to western axis, and has a gradation as a result of variation in lithology, Reyment, (1965).
According to Iloeje (1981), there is non homogeneity in the structural features of the overall
topography from escarpment and valleys that run in the same northeastern direction with
elevated land form . According to Mananu (1995), the area has a tropical climate and
experiences two climatic seasons-the rainy and dry seasons.The rainy season is characterized by
rain bearing south west wind from the Atlantic ocean whiledryseason is characterized by dusty
northeast harmattan wind from Sahara desert . According to the author, the mean annual rainfall
is 1750mm, while the mean temperature is 26.50c to 270 .Vegetation is of tropical rainforest but
as a result of greater demand for agricultural activities like grazing and cultivation, the rain forest
has been replaced by economic crops like oil palm tree. The extensive deforestation has changed
the area to grass land structure. The drainage pattern is dendritic [see fig 1`] typical of
homogeneous geology Mananu, (1995). Geologically the area lies within Imo sedimentary basin
of south eastern Nigeria.The geology is made of Nskukka Formation, Ajali Formations and
Mamu Formation respectively.Mamu Formation been the oldest of the three is overlain by Ajali
sand stone while Ajali sand stone is over lain by the youngest Nsukka Formation and Imo Shale
in the study areas. This sequence indicates that the Ajali Aquifer is confined [Reyment,( 1965),
Nwayide 1979, 1986, Anyanwu and Aura 1990]
The Ajali sandstone is a coarse friable and cross bedded sandstone and consists of 90% sub
angular quartz [Hoque and Ezepue 1977]. The Ajali sand stone consists of bands of white
mudstone occurring at intervals and increasing in thickness down wards,( Reyment (1965). The
stratigraphic succession of the areas is shown in table 1, while the geologic map of the area is
shown in fig 2
British Journal of Environmental Sciences
Vol.2, No.4, pp.11-28, December 2014
Published by European Centre for Research Training and Development UK (www.eajournals.org)
14
ISSN 2055-0219(Print), ISSN 2055-0227(online)
Table 1- STRATIGRAPHIC SEQUENCES IN IMO BASIN (AFTER NWAJIDE 2005)
Age Basin Sratigraphic Unit
Thanctian
Danian
Maastrichtian
Campanian
Niger
Delta
Anambra
Basin
Coal
Measure
Imo Shale
Nsukka Formation
Ajali Formation
Mamu Formation
Nkporo
Fm
Nkporo
Shale
Enugu
Fm
Owelli
SSt
Afikpo
SSt
Otabi
SSt
Lafia
SSt
Santonian Southern
Benue
Through
AWGU Formation
fig1: Topographic map of the study area

British Journal of Environmental Sciences
Vol.2, No.4, pp.11-28, December 2014
Published by European Centre for Research Training and Development UK (www.eajournals.org)
15
ISSN 2055-0219(Print), ISSN 2055-0227(online)
Fig 2: Geological map of map of the study area.
SOIL SAMPLING TECHNIQUES AND ANALYTICAL METHODS
A total of eight (8) soil samples were collected within the area underlain byAjali Formation to
represent the areal distribution of the Formation in Okigwe area. Method of stratified random
sampling techniques was adopted for the sampling of the soil underlain by the Formation. Soil
collection and laboratory analysis were performed in accordance with ASTMD 4318 – 98 (2000)
provisions.
Equipment used include soil auger, British electric shaker machine for dry sieving, cassgrande
apparatus for atterberg limit, and moisture content tests, proctor compaction apparatus for
compaction test, triaxial cylinder test for shear strength, consolidometer for consolidation test,
permeameter for porosity and permeability tests. The laboratory investigations carried out on the

British Journal of Environmental Sciences
Vol.2, No.4, pp.11-28, December 2014
Published by European Centre for Research Training and Development UK (www.eajournals.org)
16
ISSN 2055-0219(Print), ISSN 2055-0227(online)
soils include natural moisture content, atterberg limit, sieve analysis (dry sieving) compaction
tests, shear strength, porosity and permeability tests. All experimental procedure are as in
ASTM, 1988 and ASTMD 4318 – 98 (2000) specifications. All details of analytical procedures
are reported in Robert (2001).
RESULT AND DISCUSSION
The average results of laboratory experiment are shown in tables 2, 3, 4, 5, 6… 10 and figures 3,
4, 5 and 6 respectively.
Table 2 SUMMARY OF THE AVERAGE VALUES OF THE MEASURED SOIL
SAMPLES.
TEST AVERAGE
REMARKS
Liquid limit
Plastic limit
Plasticity index
Bulk density
Permeability
Porosity
Optimum moisture
Content
Maximum Dry Density
Cohesion (C)
Shear Strength
Angle of internal friction
Moisture content
Coefficient of Uniformity
29.6%
19.9%
9.65%
1.63
0.35cm/s
0.45
13.5%
2.06mg/m3
10.5KN/m2
106.86KN/m2
28.40
9.35%
0.003.
Good for building foundation according to
Fed. Nig
Good for building foundation according to
Fed. Nig
Good for building foundation according to
Fed. Nig
Goodfor engineering works
Low (Anon 1981)
In terms of federal government of Nigeria specification control N058 Government of East
Central State the liquid limit and plasticity index are ideal for sub base course materials and for
building foundation.
TABLE 3: RESULT OBTAINED FROM GRAIN SIZE TESTS
Initial mass before washing and drying = 60.0g mass after washing and drying = 34.4g mass of
fines [mass lost to washing] = 25.6g of fines =42.7%.

British Journal of Environmental Sciences
Vol.2, No.4, pp.11-28, December 2014
Published by European Centre for Research Training and Development UK (www.eajournals.org)
17
ISSN 2055-0219(Print), ISSN 2055-0227(online)
Dry sieving of residue, mass=34.4g.
SIEVE SIZE
(MM)
MASS
RETAINED(G)
MASS PASSING(G) % PASSING
2.0 1.1 58.9 98.2
1.18 2.5 56.4 94.0
0.85 2.7 53.7 89.5
0.600 3.0 50.7 84.5
0.425 3.1 47.6 79.3
0.300 5.4 42.2 70.3
0.150 14.6 27.6 46.0
0.075 3.9 23.7 39.5
Pan 0.3 23.4 -------
In the same way as table 3, the average value of 8 samples gave a graph of fig 3, signifying that
the soil is better classified as sandy silt.
TABLE 4: RESULT OBTAINED FROM TRIAXIAL SHEAR TEST
Length of sample = 60.0mm
Width of sample=60.0mm
Area of sample = 0.0036m2
The normal stress computation computed from (where L is load and A is area) is shown as;
Load (Kg) Load(KN) Area(m2 ) 5(normal stress)
24 0.24 0.0036 66.6
44 0.44 0.0036 122.2
64 0.64 0.0036 177.8

British Journal of Environmental Sciences
Vol.2, No.4, pp.11-28, December 2014
Published by European Centre for Research Training and Development UK (www.eajournals.org)
18
ISSN 2055-0219(Print), ISSN 2055-0227(online)
The shear stress computation for the eight samples of the soil is shown below.
(1)sample
(1)
(1)load (kg)
(2)
(2)MAX
HR
(3)
(3) X.002
(MM)
(4)
4X0.88
(KN)
Area
(m2)
(….)
KN/M2
1 24
44
64
93
151
220
0.186
0.302
0.440
0.164
0.266
0.387
0.0036 45.5
73.8
107.6
2 24
44
64
90
153
218
0.180
0.306
0.436
0.158
0.269
0.384
0.0036 44.0
74.8
106.6
3 24
44
64
98
160
227
0.196
0.320
0.454
0.173
0.282
0.399
0.0036 47.9
78.2
111
4 24
44
64
103
166
235
0.206
0.332
0.470
1.181
0.292
0.414
0.0036 50.4
31.2
114.9
5 24
44
65
100
162
230
0.200
0.324
0.460
0.176
0.285
0.460
0.0036 48.9
79.2
112.4
6 24
44
64
103
164
232
0.206
0.328
0.464
0.181
0.289
0.408
0.0036 50.4
80.2
113.4
7 24
44
64
111
170
240
0.222
0.340
0.480
0.195
0.299
0.422
0.0036 54.3
83.I
1217.3
8 24
44
93
159
0.186
0.318
0.164
0.272
0.0036 45.5
11.7
64 222 0.444 0.391 108.5
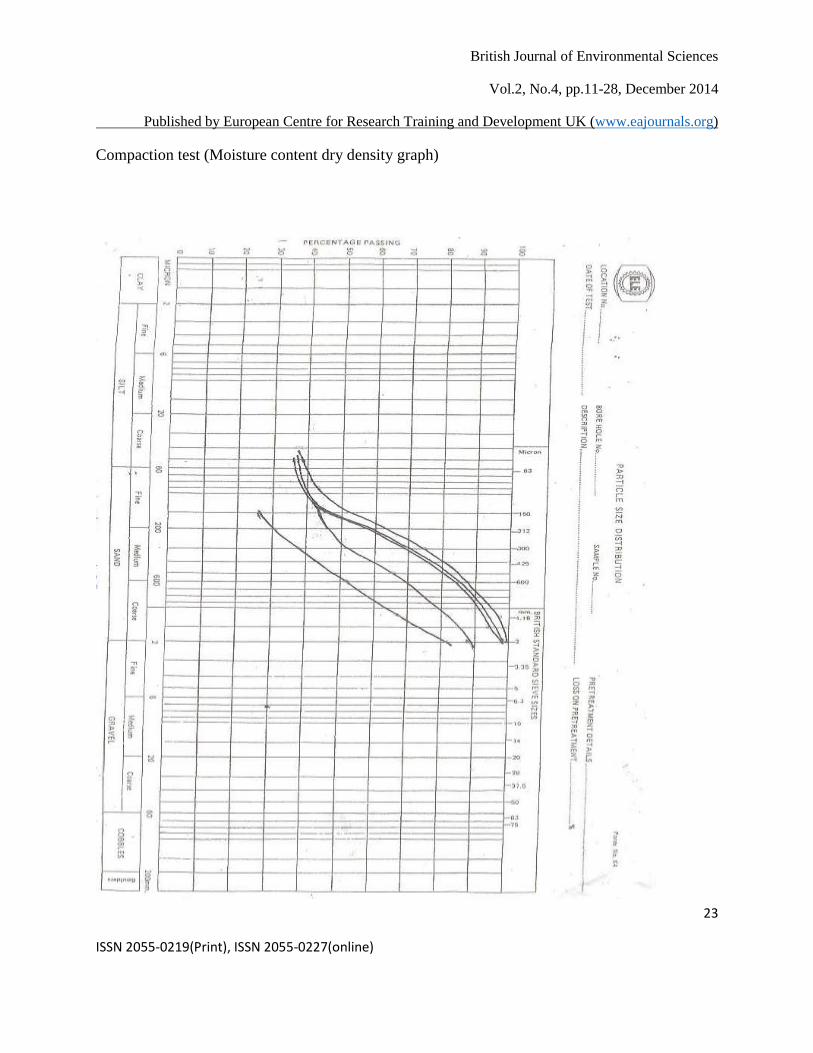
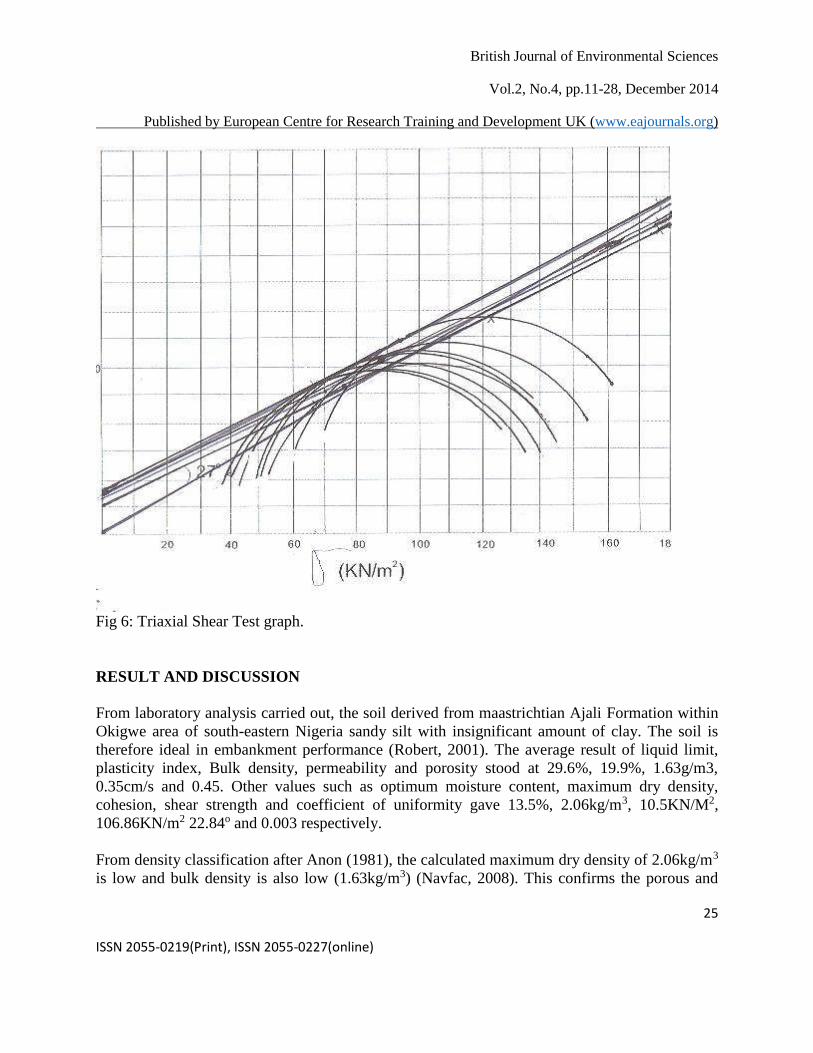
The value of shear strength (τ) obtained from the graph of fig 6 using equation (1): gives
C=10.75, Q= 28.4o, τ =106.86KN.
Shear strength (τ)= C + σ tan Ф ………………(1)
Where τ = shear strength. C =cohesion (kn/m2) , Q = fractional angle between grain, σ =177.8

British Journal of Environmental Sciences
Vol.2, No.4, pp.11-28, December 2014
Published by European Centre for Research Training and Development UK (www.eajournals.org)
19
ISSN 2055-0219(Print), ISSN 2055-0227(online)
TABLE 5: RESULT OF THE COMPUTATION OF COEFFICIENT OF
PERMEABILITY USING ALLEN HAZENS METHOD.
Sample D10 (mm) K=100x D10 Cm/s
1 0.0032 0.32
2 0.0025 0.25
3 0.0045 0.45
4 0.0017 0.17
5 0.0045 0.45
6 0.0025 0.25
7 0.0020 0.20
8 0.0075 0.75
Table 5: indicates that the permeability of the soil stand as 0.35 cm/s. This is high (Heyman
1972). Therefore the soil can be used as drainage material (James, 2008).
TABLE 6: RESULT OF COMPUTATION OF POROSITY OF THE SAMPLES
Sample Sb W Sd Gs V Vs Vv N (%)
1 1.73 17.2 1.49 2.75 1.0 0.54 0.46 46
2 1.58 3.9 1.49 2.75 1.0 0.54 0.46 46
3. 1.89 8.0 1.74 2.75 1.0 0.63 0.37 37
4. 1.63 5.3 1.55 2.75 1.0 0.57 0.43 43
5. 1.46 12.2 1.30 2.75 1.0 0.47 0.53 53
6. 1.58 7.8 1.47 2.75 1.0 0.54 0.46 46
7. 1.53 10.4 1.39 2.75 1.0 0.51 0.49 49
8. 1.70 10.0 1.55 2.75 1.0 0.57 0.43 43
Where Sb = Bulk weight, density (g/cm3)
W = Moisture content (%)
Sd = Dry unit weight (g/cm3)
Gs = Specific gravity
V = Total volume of sample (g/V3)
Vs = Volume of solids = Sd/Gs (m3)
Vv = Volume of voids = v – vs (cm3)
n = Porosity = Vv/V (%)
From table 6 the average porosity of the soil is 0.45. This is also high and indicates that it can’t
be used as waste disposal site (Joseph, 1985).

British Journal of Environmental Sciences
Vol.2, No.4, pp.11-28, December 2014
Published by European Centre for Research Training and Development UK (www.eajournals.org)
20
ISSN 2055-0219(Print), ISSN 2055-0227(online)
TABLE 7: RESULTS OBTAINED FROM THE BULK DENSITY
Sample Wi W2 W3 V D
1 128.2 60.3 67.9 39.3 1.73
2 121.3 60.3 61.0 39.3 1.55
3. 134.7 60.3 74.4 39.3 1.55
4. 124.2 60.3 63.9 39.3 1.89
5. 117.6 60.3 57.3 39.3 1.46
6. 1.58 7.8 1.47 39.3 1.58
7. 1.53 10.4 1.39 39.3 1.53
8. 1.70 10.0 1.55 39.3 1.70
Where WI is the weight of ring + Sample (g)
W2 = wt of ring (g)
W3 = wt of sample (g)
V = volume of sample (Cm3)
D = bulk density (mg/m3)
TABLE 8: RESULT OF OBTAINED FROM MOISTURE CONTENT TEST
Sample C Mcws MCS Mc Ms Mw W D
1 25S 44.2 41.2 23.8 17.4 3.0 7.20/3.0 1.49
2 B 52.4 48.5 23.8 19.5 2.47 3.9 1.49
3 35 50.5 48.2 19.5 28.7 2.3 8.0 1.75
4 20 33.5 32.8 19.7 13.1 0.7 5.3 1.55
5 41 41.7 39.1 17.8 21.3 2.6 12.2 1.30
6 M 41.9 40.6 23.9 16.7 1.3 7.8 1.47
7 4 39.6 37.7 19.5 18.2 1.9 10.4 1.39
8 15 48.7 46.0 19.1 26.9 2.7 10.0 1.55
Where C= can identification Mcws = Can + wet Soil
Mcs = Can + dry Soil , Mc= Canlg) Ms = Dry Soil(9) Mw=water
W=water content (%), D= Dry density (Mg/m2)

British Journal of Environmental Sciences
Vol.2, No.4, pp.11-28, December 2014
Published by European Centre for Research Training and Development UK (www.eajournals.org)
21
ISSN 2055-0219(Print), ISSN 2055-0227(online)
TABLE 9: Result Obtained From Compaction Test (Moisture Content /Dry Unit Weight)
Sample 1 Sample 2 Sample 3 Sample 4
Trial no 1 2 3 1 2 3 1 2 3 1 2 3
Can I d no 37 42 17 100 33 77 25 20B 10 35 46 77
Can+wet
soil
90.1 76.7 72.2 88.9 77.9 71.1 95.4 76.2 68.7 79.9 57.4 79.0
Can+drysoil 85.9 70.3 63.5 84.3 71.3 62.0 90.6 69.2 60.2 77.5 53.8 71.9
Can (g) 21.3 23.9 19.1 19.5 23.8 17.4 20.0 19.5 19.1 17.5 19.5 23.9
Dry Soil (g) 64.6 46.4 44.4 64.8 47.5 44.6 70.6 49.7 41.1 60.0 34.3 48.0
Water (g) 4.2 6.4 8.7 4.6 6.6 91 4.8 7.0 8.5 2.4 3.6 7.1
Water
content
(w)%
6.5 13.1 19.6 7.1 17.9 20.4 6.8 14.1 20.7 4.0 10.5 14.8
Dry Density
(ing/m3)
1.81 2.04 2.07 1.81 1.98 2.06 1.81 1.99 2.02 1.91 2.11 2.08
Sample 5 Sample 6 Sample 7 Sample 8
Trial no 1 2 3 1 2 3 1 2 3 1 2 3
Can I d no 134 100 44 10 13 21 35 18 13 100 36 37
Can+wet
soil
84.0 63.9 80.4 74.4 48.5 65.3 72.7 37.7 66.9 82.2 61.5 59.4
Can+drysoil 81.5 39.8 73.1 71.9 45 585 70.6 34.5 60.0 794 57.6 54.4
Can (g) 21.7 22.5 23.8 17.5 14.8 13.5 23.9 5.4 13.2 18.5 19.0 19.2
Dry Soil (g) 59.5 37.5 49.3 54.4 30.2 45.0 46.7 29 46.8 60.7 38.6 35.2
Water (g) 2.5 4.1 7.3 2.5 3.5 6.8 2.1 3.2 6.9 2.8 3.9 5.0
Water
content
(w)%
42 11.0 14.8 4.6 11.6 151 4.5 11.0 14.7 4.6 10.1 14.2
Dry Density
(ing/m3)
1.81 2.04 2.07 1.81 1.98 2.06 1.81 1.99 2.02 1.91 2.11 2.08
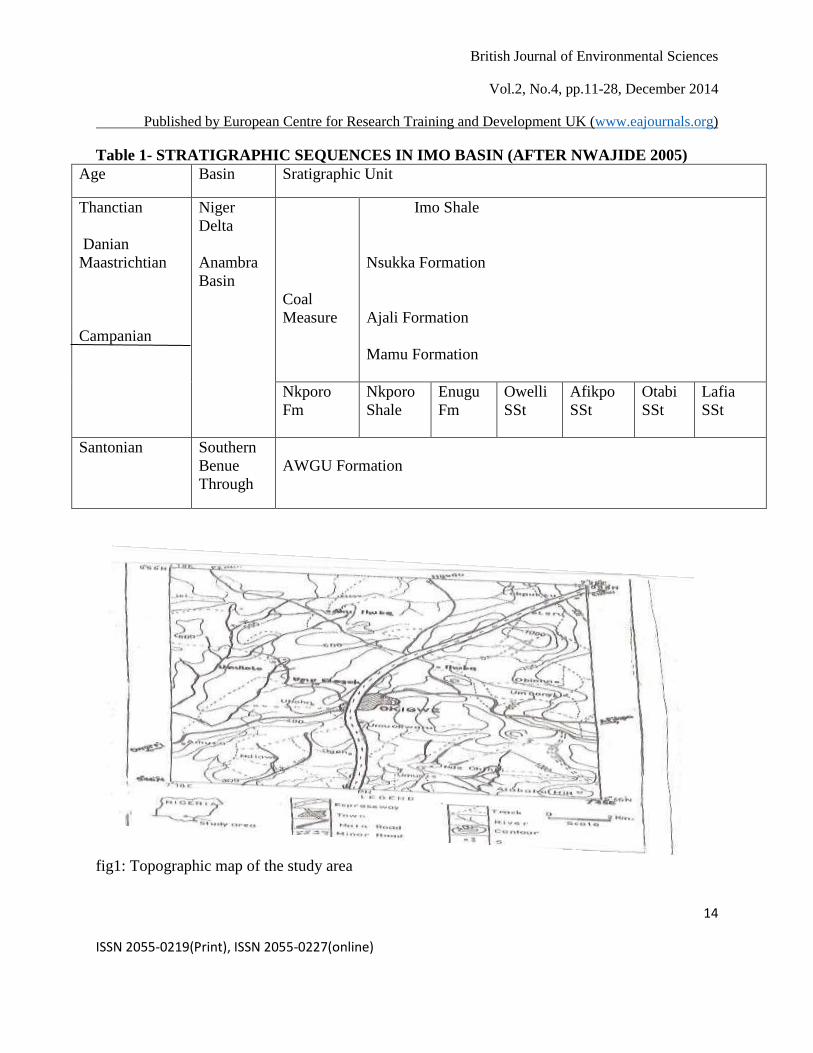
From table 8 and fig 3; the optimum moisture content (OMC) is 13.5% while the maximum dry
density (MDD) is 2.06. This means for any engineering work in the area the soil should be
compacted at calculated OMC and MDD for Maximum Strength.

British Journal of Environmental Sciences
Vol.2, No.4, pp.11-28, December 2014
Published by European Centre for Research Training and Development UK (www.eajournals.org)
22
ISSN 2055-0219(Print), ISSN 2055-0227(online)
TABLE 10 SUMMARY OF AVERAGE VALUES FOR THE MEASURED
SAMPLES
Test Average Value
Liquid limit 29.6%
Plastic Limit 19.9%
Plasticity Index 9.65
Bulk density 1.63mg/m3
Permeability 0.35 cm/s
Porosity 0.45
Optimum Moisture content 13.5
Max dry density 10.5KN/M2
Shear strength 106.86KN/m2
Angle of Internal friction 28.4
Moisture content 9.35%
Coefficient of Uniformity 0.003
Fig
3:
British Journal of Environmental Sciences
Vol.2, No.4, pp.11-28, December 2014
Published by European Centre for Research Training and Development UK (www.eajournals.org)
23
ISSN 2055-0219(Print), ISSN 2055-0227(online)
Compaction test (Moisture content dry density graph)

British Journal of Environmental Sciences
Vol.2, No.4, pp.11-28, December 2014
Published by European Centre for Research Training and Development UK (www.eajournals.org)
24
ISSN 2055-0219(Print), ISSN 2055-0227(online)
Fig 4: Sieve Analysis Result
Fig 5: Atterberg Limit Test graph.
British Journal of Environmental Sciences
Vol.2, No.4, pp.11-28, December 2014
Published by European Centre for Research Training and Development UK (www.eajournals.org)
25
ISSN 2055-0219(Print), ISSN 2055-0227(online)
Fig 6: Triaxial Shear Test graph.
RESULT AND DISCUSSION
From laboratory analysis carried out, the soil derived from maastrichtian Ajali Formation within
Okigwe area of south-eastern Nigeria sandy silt with insignificant amount of clay. The soil is
therefore ideal in embankment performance (Robert, 2001). The average result of liquid limit,
plasticity index, Bulk density, permeability and porosity stood at 29.6%, 19.9%, 1.63g/m3,
0.35cm/s and 0.45. Other values such as optimum moisture content, maximum dry density,
cohesion, shear strength and coefficient of uniformity gave 13.5%, 2.06kg/m3, 10.5KN/M2,
106.86KN/m2 22.84o and 0.003 respectively.
From density classification after Anon (1981), the calculated maximum dry density of 2.06kg/m3
is low and bulk density is also low (1.63kg/m3) (Navfac, 2008). This confirms the porous and

British Journal of Environmental Sciences
Vol.2, No.4, pp.11-28, December 2014
Published by European Centre for Research Training and Development UK (www.eajournals.org)
26
ISSN 2055-0219(Print), ISSN 2055-0227(online)
permeable nature of the soil (Roscoe, 1985). The federal government of Nigeria specifies that
values of plasticity index of the soil should be less than 20% and liquid limit should be less than
30% for the soil to be used in building foundation. The liquid limit value of 29.6% and plasticity
index value of 9.65% calculated for the soil of Ajali Formation within Okigwe area is an
indication that the soil is ideal for building construction since it confound with the federal
government of Nigeria specification for building purposes. According to Ola, (1981), Seed et al
(1962), the plasticity index value of 9.65% shows that the soil has low swelling capacity and
buildings set up in this environment is not likely to develop kracks. This fact was confirmed by
Welthman and Head (1983) who classified the dry density favourable for engineering as 1.78 to
2,58kg/m3 and moisture content of 5 to 15%. The cohesive value of the soil is low, this shows
low clay content and binding force (Burland, 2005) an indication that the soil is vulnerable to
erosion. Shear strength of the soil is 106.86/m2, while angle of internal friction is 28.4%. The
high angle of internal fraction and the resulting shear strength is an indication that the soil can
withstand stress resulting from heavy structure (Fang and Daniels, 2005). From the compaction
test result, the optimum moisture content (OMC) is 13.5% while the maximum dry density is
(2.06kg/m3), therefore, it should be noted that for any engineering construction within the area,
the soil should be compacted to an OMC of 13.5% and MDD of 2.06kg/m3 as to achieve
maximum strength (Evethand Chengliu, 2007). The permeability value of 3.35×10⁻²cm/sec
shows that the soil is permeable and cannot be used as a site for waste disposal or dam
construction, but it is ideal where the project is of the type that requires good drainage (Uduji et
al 2005). The soil is therefore ideal as an effective site for artificial recharge of the aquifer.
CONCLUSION
The soil derived from Maastrichtian Ajali Formation within Okigwe area of Anambra/Imo
drainage basin of south eastern Nigeria is sandy silt with traces of clay. The soil in ideal for
heavy building foundations, but cannot be used for dam site or waste disposal site. It is also ideal
for projects requiring good drainage system such as regional aquifer recharge. It may not be good
for road construction. However, for any engineering project within the area, the soil has to be
compacted to an optimum moisture content of 13.5% and maximum dry density of 2.06kg/m3%
as this is the range within which the soil has maximum strength.
REFERENCES
ASTM, 1988. Annual book of ASTM standards Philadelphia 1988, copyright. American society
for testing and materials. Race street Philadelphia PA19103 reprinted with permission
pp240-260.
ASTM, D. 4318-98 (2000). ASTM Standard vol. 08. Rock and Soil standard test for liquid limit
and plasticity index of soils, west coshohocken pp 546-558.
Alt well and former BR (1976). Engineering practice and geotechniques M.C Graw Hill Book
Co, USA pp 474-476.
British Journal of Environmental Sciences
Vol.2, No.4, pp.11-28, December 2014
Published by European Centre for Research Training and Development UK (www.eajournals.org)
27
ISSN 2055-0219(Print), ISSN 2055-0227(online)
Arua, I, (1986). Paleocene Microfossils from the Imo shale in Anambra State Nigeria. Journal of
mining and geology 17, 81-84.
Anyanwu, N.P.C, Arua, I (1990). Ichnofossils from the Imo Formation and their
paleoenvironmental significance. Journal of mining and geology 17,81-84.
Anyanwu, N.P.C, Arua (1990). Ichnofossils from the Imo Formation and their paleo-
environmental significane. Journal of mining and geology 26, 1-4.
Barnes G.E(2000) soil mechanics principles and practice 2nded. Palgrave macmillain,hound mills
basina stock hamp shire r.9216x pp130-135.
Budhuc.c.a (2007).highway engineering 5thed, jhon willey and sons new York. Bell, f.a.(1992).
Description and classification of rock massen in bell f9, engineering and rock massesn
butter worth /hecineman ltd, London pp53-77.
Burland .B (2005) soil mechanics emma. Elegant, rigorous and relevant inaugural lecture
honorany fellow, Emmanuel college London, pp23-28
Butter B.E (2004).Soil classification for soil survey. Oxford science publication science 96,pp
23-40.
Creig.R.F.(2004). Soil mechanics 7th ed. Spon press, Philadelphia pp 145-200.
Cedargren, R (1998). Drainage and highway and air field pavement, John Wiley and sons New
York pp 34-65.
Das Braja, B.R (2006). Principles of geotechnique env. Prot. Service, Canada wood academic
publishers, Canada pp85-124.
Evett J and Chengliei (2008). Soils and foundations (7ed), prentice Hall, pp180
Hoque, M and Ezepne, M.c (1977). Petrology and paleogeography of the Ajali sandstone J. Min
geol. V. 14 p16-22.
Ileoeje, N.P (1981). A new geography of Nigeria (A new revised edition), published in Great
Britain by William Clowes (Breccles) Ltd London, pp 85-120.
Joseph, E. B (1985) physical and Getechnical properties of soils. MC Graw Hill book Co
Singapore. Pp 350-420.
Kaneko, E.C, John, B.D, Clever T.C (1993). Report DS0-07-05 Shear key research project
literature Review and Finite Element Analysis pp 547-600.
Krammer, Stephen .L. (2000). Geotechnical earthquake Engineering, Prentice-Hall, Inc. pp 24-
30
Monotgomery C.W (2000). Environmental Geology published by Edward E B.McGraw Hill Co
USA,PP 210-218.
Mananu P.C (1995). Humidity in ofomata G.E.K. Ed. Nigeria in maps Eastern State.Ethiope
publishing, House, Benin-Nigeria pp19-21.
Nwajide C.S (1979). Cretaceons sedimentation and paleogeogrphy of the centra Benue Trough in
Ofoegbu C.O.(Ed), The Benue Trough structure and evolution.Friedr.Vieweg and
Braunchweig/weisbaden,pp.19-38
Ofomata G.EK(1985). Technical report on feasibility study of erosion vulnerability arrears in the
eastern part of Nigeria. Ethiope publishing house Benin pp.35-37

British Journal of Environmental Sciences
Vol.2, No.4, pp.11-28, December 2014
Published by European Centre for Research Training and Development UK (www.eajournals.org)
28
ISSN 2055-0219(Print), ISSN 2055-0227(online)
Ola P.C (1981) Parameters for the rating of the engineering properties of atterberg limits, int.
cont. on technical structures. pp 24-30
Price,D.G. (2008). Engineering geology principles and practices, Springller ISBN,3540292497
pp44-65
Robert, W.D. (2001). High way material Mc.Graw hill book company, New York. Pp 211-22.
Rayment R.A (1965). Aspect of the geology of Nigeria. Ibadan university press pp25-38.
Seed ,H.B Wood W and Lundgren R.J (1962). Prediction of swelling potential for compacted
clays. ASCE.J. Soil mechanics. pp 33-57.
Terzaghi K. and Peck R.B (1995). Soil mechanics in Engineering practice 2nd Ed.John Wiley
and sons publishers , New York. pp 35-50.
Top Related