


Languages
Pages
Legal


Energy, International Trade, SWP-474and Economic Growth
6FLiRARY
World Bank Staff Working Paper No. 474
August 1981
SECTORAL lIBRARYINTERNATIONAL BANK
FORRECONSTRUCTION AND DEVELOPMENT
APR 21 1987
** HD9W102 A2 M36 1981 c.2Energ9, international trade, and economic growth.
IlllllllllllllllllllilIlIll HDIIII I ID ISLC03057 1
-With the assistance of Sehun Kim[ConsultantslDevelopment Policy Staff
fi * Spyright (D 1981D! le World Bank502 18 H Street, N.W.A)2 ashington, D.C. 20433, U.S.A.
2 6981 re views and interpretations in this document are those of the author
2 Id should not be attributed to the World Bank, to its affiliated_ganizatrons, or to any individual acting in their behalf.
Pub
lic D
iscl
osur
e A
utho
rized
Pub
lic D
iscl
osur
e A
utho
rized
Pub
lic D
iscl
osur
e A
utho
rized
Pub
lic D
iscl
osur
e A
utho
rized

N ri-�z -
CN I�A
II

A;a5794C M.3
*Lne views and interpretations in this document are those of the uthor andshould not be attributed to the World Bank, to its affiliated organizations,or to any individual acting on their behalf.
w ,rr s 1-bTY OfWORLD BANK E,.'`RGY
Staff Working Paper No. 474 L,BRARY
August 1981 ! B. ___
ENERGY, INTERNATIONAL TRADE, AND ECONOMIC GROWTH
A Background Study for World Development Report 1981
This paper is designed to complement the work that is now ongoingin connection with the World Bank (IBRD)'s World Development Report 1981(horeafter abbreviated WDR IV). Results will be reported from a small-scalein:ernational trade model that is focused on issues related to energy andeconomic growth. The analysis is intended to provide some broad orders ofmagnitude as a cross-check upon detailed country-by-country projections but isnot to be viewed as a substitute for these "bottom-up" analyses. Our modelis compact enough so that all numerical results (and virtually all inputas:;umptions) can fit onto a single sheet of paper. This also facilitates ara?id turnaround in response to changes in input assumptions. The numericalresults here are based upon the WDR IV guidelines available in November19.30.
In the following pages, we will review the economic assumptionsth.zt underlie the model, and will then present nine alternative cases -varying the assumptions with respect to energy supplies, demands, economicgrDwth, and capital flows. Half of these cases imply much the same pricescenario as specified in the current set of WDR IV guidelines - a 3% annualreal oil price increase between 1980 and 1990. It will be shown, however, thatrelatively small differences in supplies - and relatively small differences inthe ease of demand adjustments to rising prices - can lead to 100% differencesin the energy prices projected for 1990.
Prepared by: Alan S. 9Pne, with the assistance ofSehun Kim(Department of Operations Research,Stanford University)ConsultantsDevelopment Policy Staff
Ccpyright g 1981The World Bank1818 H Street, N.W.Washington, D.C. 20433U.S.A.


Contents
Page
1. Introduction ......................................... 1
2. General Background ........................................... 2
3. The Basic Simplifications .. 3
4. Macroeconomic Assumptions and Energy Supplies ............... 6
5. Energy Demands -- The Adjustment Problem ................... 7
6. International Trade and Capital Flows . . 10
7. Numerical Results .......................................... 12
8. A Postscript on "Low GDP Growth .."........................... 15
Appendix A. Model Formulation . .................................. 17
Appendix B. Nine Alternative Projections .................... ... 20
References ..................................................... 30
Tables and Figures
Tables
1. Alternative energy supply projections forthree-region model, 1990 ............................. 7
2. Alternative projections of oil prices, GDPgrowth rates, and merchandise trade . ....................... 12a
Figures
1. Oil prices and GDP growth rates, region 3 ................. 12b
2. Energy Modeling Forum (EMF) world oilprice projections, reference case ......................... 14a

Acronyms and Abbreviations
CES Constant elasticity of substitution
EIA U.S. Energy Information Administration
EMF Energy Modeling Forum (Stanford University)
EPDCE Economic Analysis and Projections Department(IBRD) Commodities and Exports Projections
IBRD International Bank for Reconstructionand Development (World Bank)
MBD Million barrels daily, oil equivalent
OECD Organisation for Economic Co-operationand Development
OPEC Organization of Oil-Exporting Countries
SITC Standard International Trade Classification
WAES Workshop on Alternative Energy Strategies
WDR IV World Development Report 1981

1. Introduction
Despite the volatility of energy prices, the GDP growth rates of the
industrialized countries do not vary widely. Imported energy still remains a
relatively small fraction of their GDP, and growth appears largely determined
by the underlying assumptions with respect to the productivity of capital and
labor. Even a 100% difference in energy prices leads to a difference of only
0.3% in the annual gross domestic product (GDP) growth rates of these coun-
tries between 1978 and 1990. At first glance, this appears a counter-intuitive
result - and quite different from the conventional wisdom expressed in news-
paper headlines and editorial pages. Our analysis does not, however, refer to
short-term political and military disruptions, but to medium-term economic
trends. With a decade for energy demands and trade flows to adjust to higher
prices, there is room for guarded optimism that energy constraints will not be
the principal determinant of the industrialized countries growth during the
1980s.
For the oil-importing developing countries, the outlook is more
pJroblematic. During the 1970s, they succeeded in financing their oil deficits
tirough an unprecedented inflow of capital. If there are even larger capital
i:flows to compensate for the likely rise in oil prices during the 1980s, the
daveloping countries may be able to achieve the growth targets outlined in
WDrld Bank (1981; World Development Report 1981, hereafter cited as WDR IV).
Without such flows, the outlook is considerably bleaker. A 100% rise in
energy prices would then have a major impact upon their terms of trade, and
it could'reduce their GDP growth rates by as much,as 1.1% per year.

-2-
2. General Background
Although the developing countries now consume a relatively small
fraction of the world's energy, this fraction could grow rapidly over the
coming decades. In comparison with the industrialized nations, the developing
countries have high population growth rates and high income elasticities of
demand for commercial energy. Moreover, if today's North-South income dis-
parities are to be reduced, the developing countries' per capita incomes will
have to grow more rapidly. Taken together, these factors imply a substantial
increase in their demand for energy. For example, the Workshop in Alternative
Energy Strategies (WAES) study (Wilson 1977, p. 269) projected that the
developing countries' share of the world's commercial energy consumption would
grow from 15% in 1972 to 25% in the year 2000. Meanwhile, the principal
consumers of energy are the industrialized countries. Their imports - and
OPEC's readiness to expand production - are the principal determinants of
international oil prices.
In view of the price increases experienced since 1973, it is quite
likely that the oil-exporting developing countries will continue to enjoy a
rapid increase in GDP, and will consume ever-increasing amounts of their own
energy production. The oil-importing developing countries, however, consti-
tute a far more populous group, and their energy demand projections appear
quite uncertain. With sluggish growth in traditional export markets among the
industrialized nations, the oil importers are likely to encounter chronic
balance-of-payments difficulties. Their prospective trade deficits cannot
easily be offset by official development assistance or by private capital
flows.
- 3 -
In qualitative terms, it is easy enough to arrive at these generali-
zaLtions. But what about their quantitative effects? To what extent is energy
l:kely to impose constraints upon economic growth? For this purpose, it
appears essential to construct a computable model of international trade. One
region's export prospects cannot be assessed without an understanding of the
inlports of non-energy products to other nations. The ease or difficulty of
this adjustment process wiLl be governed largely by the elasticities of
substitution in energy and in international trade.
3. The Basic Simplifications
These are the general considerations that have led to the specific
approach taken here - a three-region general equilibrium model. This is not
intended for general-purpose analysis of international trade and macroeconomic
fluctuations. It is not designed to deal with individual commodities outside
the energy sector - hence it is inappropriate for policy issues such as
cDmparative advantage and tariff and non-tariff barriers to trade. For these
purposes, one would need far more disaggregation than that adopted here (see
Ginsburgh and Waelbroeck 1975 and Whalley 1980). As in these more detailed
trade analyses, we shall construct a "snap shot" view (comparative statics)
for a single point of time, 1990. There will be no attempt to analyze the
year-by-year details of the transition from 1978 (the data benchmark year) to
1990. This is a "surprise-free" scenario.
Aggregating the nineteen individual regions distinguished within WDR
IV, we arrived at the following three-region classification of the market
economies:

- 4 -
1. industrialized countries (region 17; the major OECD nations)
2. oil-exporting developing countries (regions 10-16; primarily
OPEC + Mexico)
3. oil-importing developing countries (regions 1-9).
This model is not addressed to East-West trade issues. In effect,
we assume zero net trade in energy with the centrally planned economies
(regions 18, 19). This is closely consistent with other WDR IV projections.
Following in the tradition of Armington (1969), Barten (1971),
Hickman, Kuroda, and Lau (1979), and Hickman and Lau (1973), non-energy
tradeables are aggregated in dollar terms but distinguished by their region
of origin. Energy forms are expressed in terms of their oil equivalents.
Thus, there are only four internationally traded goods whose prices are to
be determined: energy plus one composite non-energy export product for each
of the three regions. All prices are to be viewed as c.i.f.. Because of
base-year data limitations, we shall project merchandise trade flows only.
Both an optimistic and pessimistic view will be explored with
respect to energy supplies. In both cases, these will be taken as exogenous
data for each region in 1990. This "bean counting" approach appears more
practical than attempting to estimate price-responsive supply curves. Over
the next decade, the industrialized nations domestic supplies appear far less
dependent upon future prices than upon institutional and public acceptability
factors; e.g., petroleum leasing policies, environmental constraints upon air
quality, and neclear safety regulations. Institutional and political factors
also have a major impact upon the supplies likely to be available in the
developing nations.

- 5 -
In order to project each region's demand for energy and for non-
energy imports, we employ nested constant-elasticity-of-substitution (CES)
p:roduction functions. With a CES production function, there are diminishing
marginal returns from imports into each region. To this extent, the model
ailtomatically allows for "absorptive capacity" constraints within the rapidly
growing economies of the oil exporters (see Ezzati 1978).
Each region's future endowments of capital and labor enter into its
iadividual production function. These endowments are estimated in accordance
with the region's potential GDP growth rates under constant prices of energy
aad non-energy items. Each region views these international prices as a
datum. To the extent that OPEC exerts monopoly power, this is already incor-
porated in the assumptions with respect to the quantities of energy supplied
by region 2 (OPEC + Mexico).
Prices are projected so as to equilibrate 1990 supplies and demands.
Given the prices of the internationally tradeable goods - and given the pro-
duction functions together with each region's capital, labor, and energy re-
sources - it is supposed that each region will choose a mix of energy and of
non-energy imports so as to maximize its GDP. The maximization is subject to
region-by-region constraints upon the balance of merchandise trade. The
cutcome of this process is termed the realized GDP. This may exceed or fall
below the potential GDP - depending upon whether there is an improvement or
a deterioration in the international terms of trade.
For technical details on the three-region model, see Appendix A and
lhe dissertation of S. Kim (Stanford University, forthcoming).

- 6 -
4. Macroeconomic Assumptions and Energy Supplies
Potential GDP growth rates are a key input to the three-region
model. These growth rates may be interpreted as an index number of capital
and labor inputs - provided that the labor force is expressed in "efficiency
units" to allow for productivity growth. One approximation should be noted.
In effect, we are assuming that the growth of domestic capital stocks will not
be significantly affected by oil price increases or by other changes in the
terms of trade. For 1990, side calculations suggest that this feedback effect
is minor. Over a longer time horizon, however, we would need an intertemporal
model to allow properly for this savings and investment process.
For the "high GDP" cases reported here, the 1978-90 potential growth
rates are identical to those being employed elsewhere in WDR IV: 3.5% for the
industrialized countries, 6.4% for the oil exporters, and 5.3% for the oil-
importing developing countries. In general, the realized growth rates turn
out to be lower for the oil importers and higher for the exporters. This is an
immediate consequence of the rise in energy prices projected between 1978 and
1990.
Two alternatives will be considered with respect to the commercial
energy supplies available to the market economies in 1990: 122 and 114
million barrels daily, oil equivalent (MBD). From Table 1, note that 122 MBD is
broadly consistent with the WDR IV guidelines, but that 114 MBD represents a
more pessimistic asessment of the supply prospects within the developing
countries. With a continuation of military and political disturbances in the
Middle East, it is quite possible that there could be a 5 MBD shortfall in
region 2. Similarly, there could be a 3 MBD shortfall in region 3 if energy
development is not pursued aggressively there. Note that the 122 and 114 MBD

- 7 -
cases bracket the 116 MBD "mid-price" scenario released in October 1980 by
the U.S. Energy Information Administration (EIA; 1980, p. 4). All these
estimates lie well below the earlier ones made by the EIA, IBRD, and other
organizations. The overthrow of the Shah of Iran - and the anti-nuclear
fallout from the reactor accident at Three Mile Island, Pennsylvania - have
led to drastic downward revisions since 1978.
TABLE 1. Alternative energy supply projections for three-region model, 1990(MBD: million barrels daily oil equivalent)
Region 1: Region 2: Region 3: Total,Industrialized Oil-exporting Oil-importing regions
Item countries developing developing 1-3countries countries
IBRD, EPDCE,a!October 29, 1980 64.3 47.0 14.7 126.0
Cases 1, 3, 5, 7, 9 b/ 62.3 45.0 14.7 122.0
Cases 2, 4, 6, 8: 5 MBDshortfall in region 2and 3 MBD shortfall inregion 3 62.3 40.0 11.7 114.0
1978 actual supplies 46.9 35.9 6.8 89.6
a/ Economic Analysis and Projections Department Commodities and Exports Projections.b/ Cases are defined, and more detailed data given, in Appendix B.
5. Energy Demands - The Adjustment Problem
Energy demands depend both upon price and income elasticities.
These runs have been based on the following GDP elasticities of demand for
commercial energy: 1.0 in region 1; 1.3 in regions 2 and 3 for 1978, but
declining thereafter. That is, at constant energy prices and other terms of
trade, each 1.0% increase in GDP will lead to an increase of 1.0% in energy
demands in region 1; and an increase of 1.3% in regions 2 and 3. These GDP
elasticities seem inconsistent with time series and also multi-country econo-
metric estimates made both before and after the oil price increases of 1973
(Blitzer, Choe, and Lambertini 1979, p. 55).
But energy prices have not been constant during the past decade,
and they are likely to rise still further during the l980s. What clues on
price elasticities can we gather from the post-1973 experience with higher
energy prices? At the time this report went to press, satisfactory data were
available only for the industrialized countries. Between 1970 and 1978, c.i.f.
oil prices had tripled (in dollars of constant purchasing power). Over the
same period, real GDP increased by 3.5% per year, and energy consumption
increased at a 2.0% annual rate. To some extent, we have already observed
a decoupling between energy consumption and economic growth.
For the industrialized countries between 1970 and 1978, the conven-
tionally measured "income elasticity of demand for energy" was 2.0/3.5 = 0.57.
But this calculation tells us little or nothing about long-term price elasti-
cities of demand - or about the prospects for further adjustments of energy
demands to higher prices. If we assume that all of the adjustments to the
tripling in oil prices had already occurred by 197B, the implied long-term pride
elasticities are quite low. Conversely, if we assume that only 25% of the
long-term adjustment had occurred by 1978, the implied long-term price elasti-
city of demand for primary coummercial energy is 0.27 (in absolute terms). This
view of adjustment - plus multi-country cross-section econometric studies -
has led the Energy Modeling Forum (EMF) to specify 0.40 as the long-term
price elasticity of demand for primary energy. (This 0.40 value is specified
- 9 -
for the EMF's reference case - and for most of the other scenarios currently
being analyzed in the World Oil Study.) If this view is correct, the after-
effects of the 1970-78 price increase will continue to help decouple energy
consumption from GDP growth during the 1980s. Further assistance will be
piovided by the 1978-80 price shock - and by the cumulative impact of the real
price increases projected post-1980.
For the developing countries, there have been only a handful of
systematic studies of demand growth since the 1973 price rise. Some clues may
be obtained from the following comparison between two time periods: 1960-70
and 1970-78. Dunkerley and Matsuba (1980) have calculated that the conven-
t-onally measured "energy/GNP [gross national product] elasticity" dropped
(f:rom 1.29 to 0.94) for the oil importers, and that it rose (from 1.04 to
1.46) for the oil exporters between the 1960s and the 1970s. The decline for the
importers would be roughly consistent with the price elasticities estimated by
Blitzer, Choe, and Lambertini (1979). The rise for the exporters is counter-
iatuitive, but it may be related to the fact that many of them held their
dDmestic energy prices well below international levels during the 1970s. This
stimulated domestic demands and also helped attract energy-intensive industries
away from traditional locations.
What follows from all this? On the basis of the actual experience
letween 1970 and 1978, we cannot be at all certain whether energy demand
adjustments will be easy or difficult. The key uncertainty appears to be the
civersity in opinions on how long it takes for energy demands to respond to
Irising prices.
With the CES production functions employed in the three-region model,
energy demand adjustments are specified quantitatively through "elasticities of

- 10 -
substitution." These are medium-term elasticities for 1990, and therefore lie
below the long-term price elasticities of demand for primary energy. In order
to achieve comparability with the current set of WDR IV energy demand projec-
tions, we have had to adopt rather low values for the 1990 elasticity of
substitution between energy and other productive inputs. This will be termed a
"difficult" view of the adjustment process. In contrast, when we employ the
elasticities corresponding to an "easy" view, the results for the industri-
alized countries check quite closely with those in the EMF's reference case.
It is assumed that the 1990 energy substitution elasticities will vary by
region as follows:
Difficult Easyadjustment adjustment
Region 1: industrialized countries .15 .20
Region 2: oil-exporting developingcountries .10 .10
Region 3: oil-importing developingcountries .10 .15
The elasticity of substitution refers to each individual region's
production function. It is defined as the optimal reduction in total demand for
energy relative to that of capital and labor in response to a 1% increase in
the relative price of energy, total output remaining constant.
6. International Trade and Capital Flows
For each of the three regions' production functions, there is an
elasticity of substitution between imports and domestic capital and labor. On
the basis of the literature review cited by Whalley (1980, pp. 31-33), we have

- 11 -
adopted import trade elasticities of the order unity: 1.25 for the industri-
alized nations and 0.80 for the developing countries. Since each region's
imports constitute another's exports, there is no need to specify export
elasticities of demand in this model.
Side calculations suggest that the trade elasticities do not have
a major impact upon energy price projections. They do, however, affect the
relative prices of non-energy tradeables. In region 2, for example, case 1
implies an 83% real increase of export prices (e.g., through domestic inflation
or through currency appreciation).l/ With these changes in the terms of
trade, there are strong incentives to import non-energy tradeables. (Between
1978 and 1990, this generates a 14% annual increase in imports from region 3.)
Moreover, these changes in the terms of trade lead to strong disincentives to
export non-energy items from region 2. If the import elasticities were higher,
the non-energy price adjustments might be lower, but trade volumes would still
have to move in much the same direction so as to restore balance-of-payments
equilibrium.
To some extent, international capital flows can cushion the impact
of rising oil prices. In order to span a wide range of views, two polar
extremes will be examined. Neither is designed to be altogether realistic, but
together they cover a realistic range of possibilities. The optimistic view
will be described as that of "compensatory capital flows." In these cases, the
oil exporters (region 2) recycle 10% of their energy revenues, and the net
effect of international capital markets is that this entire amount is available
to finance the merchandise trade deficit of region 3. Thus, the higher oil
prices rise, the greater becomes the value of these compensatory capital
flows.
TT- Cases cited by number here and on following pages are defined in Appendix B.

- 12 -
In contrast, the pessimistic view is described as "zero trade
deficits." In these cases, region 3 succeeds in borrowing just enough new
capital to offset its non-merchandise current account deficit (including
interest payments on past debts). With zero trade deficits, export volumes
must be expanded, and there is a deterioration in ther terms of trade. Region
3's GDP growth is affected by amounts ranging up to 1.2% per year. Under the
conditions associated with cases 2 and 6 (see Table 2) capital flows of $78
billion would permit a GDP gain of $167 billion in 1990.
7. Numerical Results
For "high GDP growth" in region 1, eight alternative scenarios have
been calculated. These differ with respect to energy supplies, demands, and
capital flows. For a summary, see Figure 1 and Table 2. Details on each case
are provided in Appendix B. Merchandise trade flows are expressed in value
terms (adjusted for changes in terms of trade) in Table and in volume terms in
Appendix B.
According to WDR IV guidelines, the international price of oil will
rise at 3% per year, net of inflation, between 1980 and 1990. This implies a
1990 price of about $45 per barrel, expressed in dollars of 1980 purchasing
power. Cases 1, 4, 5 and 8 have been constructed so that they all lead to
this level of oil prices. That is, real prices could increase by 3% annually
during the 1980s - either with the 122 MBD level of supplies and "difficult"
demand adjustments or with 114 MBD and "easy" adjustments. Note, however,
that plausible changes in the input assumptions could lead to energy prices
that are either much higher or lower than $45. If the "difficult" adjustment
view is correct - and if 1990 energy supplies are limited to 114 MBD - there

TABLE 2. Alternative projections of oil prices, GDP growth rates, and merchandise trade
Results for 1990Realized annual GDP growth Value of merchandise trade,rates, 1978-90 (percent) region 3, (billions of 1978
dollars, adjusted for changesAvailable Region i: Region 2: Region 3: in terms of trade)energy Industri- Oil ex- Oilsupplies, alized porting importing Non- ierchan-regions Oil price coun- develop- develop- energy diseCase Capital Adjustment 1-3, (1980 tries ing ing Energy in- tradenumber flows of energy 1990 (MBD) $/barrel) countries countries imports ports Exports deficit
High GDP growth (region 1):
1. Compensatory Difficult 122 45 3.2 7.1 4.5 73 143 156 60
2. Compensatory Difficult 114 67 3.0 7.4 4.0 123 106 151 78
3. Compensatory Easy 122 31 3.3 6.5 4.6 46 150 155 41
4. Compensatory Easy 114 43 3.2 6.8 4.3 79 125 153 51
5. Zero Deficits Difficult 122 44 3.2 7.4 3.6 51 114 165 0
6. Zero Deficits Difficult 114 64 3.1 7.7 2.8 86 77 163 0
7. Zero Deficits Easy 122 31 3.3 6.8 3.9 35 129 164 0
8. Zero Deficits Easy 114 42 3.3 7.0 3.5 60 102 162 0
Potential annual GDP growth at constant energyprices and other terms of trade, 1978-90 3.5 6.4 5.3
Low GDP growth (region 1):
9. Zero Deficits Difficult 116 43 2.8 7.0 3.5 46 107 153 0
1978 trade flows, region 3 16a/! 122 95 43
a/ This $16 billion refers to net merchandise imports recorded in SITC (Standard International Trade Classification) category 3.At energy import rates of 6.3 MBD and a c.i.f. price of $13.70 per barrel, the 1978 energy import bill would have been $31.5billion. Since these two methods of estimation are inconsistent, one must be cautious in making comparisons between our1990 projections based on physical import rates and the 1978 statistics referring to SITC category 3.

- 12b -
Figure 1
Oil Prices and CDP Growth Rates, Region 3(high GDP growth in region 1)
1990 oil price(1980 $/barrel)80'
Key:
62 compensatory capital nows
60 - zero trade deficits
40-
20
L 0030Case number 1 5 2 6 3 7 4 8
1990 Supplies (MBD) 122 114 122 114
-Oemand adjustment Difficult Easy
Annual GDP growthrate, region 3(1978-90o
4-
.3
2 17
1~~~~~~~~~~~~~~~~~~~~~~~-o

- 13 -
could be a sharp run-up. (The price of a barrel of oil rises to about $65 in
cases 2 and 6.) Conversely, with "easy" demand adjustments and 122 MBD of
supplies, prices could remain close to their 1980 level of $33. Note that
the GDP growth rate of the oil exporters is highly correlated with the level of
oil prices.
Oil prices are not significantly affected by the presence of com-
pensatory capital flows (hatched bars in Figure 1) or by their absence (no
hatching). It appears, however, that capital flows have a substantial impact
upon the GDP growth rates of region 3, the oil-importing developing countries.
If these flows are available to cushion the impact, a 100% rise in oil prices
leads to a drop of 0.6% in their GDP growth rates. (Compare cases 2 and 3.)
Without these flows, the drop is projected at 1.1%. (Compare cases 6 and 7.)
In the most pessimistic scenario examined here (case 6), the GDP growth rate
would be only 2.8% - barely enough to keep pace with the growth of population.
Despite the wide range of possible energy prices, the GDP growth
rates of the industrialized countries do not vary widely. Imported energy
still remains a relatively small fraction of the industrialized countries
GDP, and growth appears largely determined by the underlying assumptions with
respect to the productivi:y of capital and labor. Even a 100% difference in
energy prices leads to a difference of at most 0.3% in the annual GDP growth
rates of these countries between 1978 and 1990. At first glance, this appears
a counter-intuitive result - and quite different from the conventional wisdom
expressed in newspaper headlines and editorial pages. Our analysis does not,
however, refer to short-term political and military disruptions, but to
medium-term economic trends. With a decade for energy demands and trade flows
to adjust to higher prices, there is room for guarded optimism that energy
constraints will not be the principal determinant of the industrialized
countries growth during the 1980s.

- 14 -
On the mediumrterm prospects for oil prices, some insights may
be obtained from the EMF's World Oil Study. See Figure 2, and note that the
WDR IV guideline value for 1990 lies in the middle of the range obtained for
the EMF's reference case. There is a wide spread in the price projections
from the ten different models participating in this study - even though it was
intended that all would be run on similar assumptions with respect to GDP
growth rates, price elasticities of demand, OPEC capacity, oil resources,
etc.
ETA-MACRO was one of the models included in the EMF exercise (see
Figure 2). Its 1990 price projection lies in the central cluster and cannot
easily be distinguished from its neighbors. Among these models, ETA-MACRO was
the only one to allow for dynamic energy-economy interactions - via the accumu-
lation of capital and a "putty-clay" model of energy conservation. It is of
particular interest, therefore, that the results of the EMF reference case
check so closely with case 4 of the three-region model. Under this view of
demand adjustments, it is relatively easy to decouple energy consumption from
GDP growth in the industrialized countries:
Three-region model, ETA-MACRO,
case 4 (114 MDB reference for
and "easy" demand EMF World Oil
adjustments Study
Annual growth rates,
industrialized countries,
1978-90:
Primary energy consumption 1.2% 1.29%
GDP 3.2% 3.05%
Ratio ("Energy/GDP 0.38 0.42
elasticity')

- 14a -
Figure 2
Energy Modeling Forum (EMF)world oil price projections, reference case
70
o 60
0'o% 50
u
40'-4
30
20
10
1980 1985 1990 1995 2030

- 15 -
Despite extensive econometric reserch, there is still no general
agreement whether the "easy" or the "difficult" adjustment view is more nearly
correct for the industrialized countries. See the diversity of results
reported in the demand elasticity study by EMF (1980). For the developing
countries, there is an even wider range of debate - and only a handful of
empirical studies. Surely it ought to be a high-priority research topic to
study the post-1973 energy price and consumption trends in these countries and
to draw whatever inferences are possible on the basis of this evidence.
8. A Postscript on "Low GDP Growth"
As of December 1980, WDR IV's "low" case had not been fully defined.
It was generally understood that this would refer to a scenario in which the
industrialized countries' GDP growth rate would be lowered by at least half a
percentage point annually during the 1980s. This decline might be the result
of high energy prices, or it might be attributed to declining growth in the
labor force and productivity or to other factors. In any case, it was speci-
fied that international oil prices would continue to increase by 3% annually
in real terms.
Case 9 represents an initial attempt to describe the WDR IV "low"
case in terms of the three-region model. It is identical to case 5 (zero
trade deficits and difficult demand adjustments) with only two exceptions:
(a) region l's potential GDP growth rate is reduced from 3.5% to 3.0% for the
years 1978-90; and (b) region 2's energy production is cut back by 6 MBD to
avoid the erosion of prices in the face of sluggish demand growth. (See Table 2
and Appendix B.)
Under these conditions, region l's realized GDP growth rate drops
from 3.2% (case 5) to 2.8% (case 9). Perhaps the principal surprise is that

- 16 -
there are no major indirect,effects on region 3. Their export markets grow
mDre slowly, but this leads to a minor decline in their GDP growth rate - from
3.6% (case 5) to 3.5% (case 9). Note however, that the indirect effects upon
region 3 might be far more serious if low domestic growth were to stimulate
political pressures for protectionism in the industrialized countries. This
possibility has been incorporated in our "low GDP growth" case.

-17-
Appendix A. Model Formulation
The following definitions are adopted here:
Input data (excluding production function parameters)
d domestic energy supplies in 1980, region j (adjusted for non-unitary GDP elasticities and capital transfers, if any)
xiia index number of capital and labor inputs in 1990, region i;can also be interpreted as potential GDP at constant 1978prices of energy and non-energy imports
Quantity variables
Yj realized GDP, region i (in 1978 dollars, adjusted for terms oftrade
Xi non-energy products of region i imported into region j;(i # j; i,j, - 1,2,3)
x4Y= energy consumed by region j.
Price variables
It = price of non-energy products, region j (J = 1,2,3)
IT4 = price of energy.
It will be convenient to report all prices as nJP 1" That is, the
numeraire is defined as region 1 products, 1978 dollars. For 1980 dollars,
add 25%.
The nested CES production functions appear within the first three
material balances below. There will be considerable debate about the magnitudes
of the exponents in these CES functions. The ease or difficulty of substituting
between domestic and imported non-energy inputs will be determined by the
parameter a. The "elasticity of trade substitution" is defined as 1/(l - a).
Similarly, the "elasticity of energy substitution" is 1/(1 -
Given the values of the exponents a and 8, we employ 1978 data to
estimate the aij constants that appear in the nested CES functions. (The
1978 benchmark estimates are reproduced in Appendix B.) Assuming that the
inputs were optimally adjusted to the international prices prevailing in 1978,

-18-
it is straightforward to determine the aii coefficients from the first-order
optimality conditions. That is, the marginal productivity of each input must
be equal to its 1978 price. For details, see the dissertation of S. Kim
(Stanford Universy, forthcoming). This will also describe our solution
algorithm - an extension to nonlinear economies of the procedure described by
Marine, Chao,-and Wilson (1980).
In connections with this benchmarking, two observations should be
noled: (1) To allow for the incomplete adjustment (approximately 50%) that
had taken place by 1978 in response to the energy price increases of 1973-74,
we assume that the 1978 "reference price" of oil was only $10 per barrel.
This is the price inserted into the first-order optimality equations - not
the actual 1978 price of $13.70. (2) The production function elasticities
incorporate institutional and behavioral as well as technological constraints.
In effect, our benchmarking procedure ignores the possibility of changes in
tariff and non-tariff barriers to international trade between 1978 and 1990.
Ot'ier approaches are required to investigate these barriers to adjustment.
The model is based upon four material balances for the four
tradeable commodities:
GNP + exports < domestic production, non-energyof non-energy non-energy energyproducts inputs inputs
+ zxi [(< ajx ) $/a + ai4 x64]l/S
(i = 1,2,3)
where subscripts for region i are omitted on exponents a and a.
total totalenergy < energyconsumption supplies
3 3
j-l 4j 1d1

-19-
There is also one balance-of-trade constraint for each region:(value of value of value of energnon-energyf non-energy + importsexports / imports (exports)
gi iJ - j w 1Xji 4 4i - )j4i4j #4
(i = 1,2,3).
As written here, the three balance-of-trade constraints imply that
net capital transfers will be zero in 1990. To allow for such transfers, we
have adjusted the ownership of energy supplies - transferring 10% of region
2½s resources and placing them at the disposal of region 3.
To reflect 1.3 GDP elasticities of energy demand (at constant prices)
in the developing countries, another adjustment is made to the domestic energy
supplies, d.. That is, 30% is added to the base-year energy supplies and
demands. The identical amount is added to the 1990 domestic energy supplies.
In this way, we allow for a gradual long-term decline in the GDP elasticity of
demands. This 30% adjustment can also be interpreted as an allowance for
non-commercial to be replaced by commercial energy.
One piece of algebra is straightforward, but is not shown explicitly:
In cases 1,3,5,7 and 9, region 2½s energy supplies include 3 MBD available at
a domestic cost of $12 per barrel (1978 price level). These supplies are not
available in the shortfall scenarios (cases 2,4,5 and 8).
One final detail: The 1978 base-year energy consumption was adjusted
so that it would be identical to the supplies available within the market
economies. Consumption was increased by 0.6% in each region to account for
the net effect of exports from the centrally planned economies, bunkers, and
other items.

-20-
Appendix B. Nine Alternative Projections
High GDP growth:
1. Compensatory capitai flows; difficult demand adjustments; 122 MBD
2. " ", 114 MBD
3. " "; "; 122 MBD
4. " " 114 MBD
5. Xero trade deficits ; difficult demand adjustments ; 122 MBD
6. " "; "; 114 MBD
7. ; easy demand adjustments ; 122 MBD
8. " " 114 MBD
Low GDP growth:
9. Zero trade deficits ; difficult demand adjustments ; 114 MBD
Note: In the following tabulations, DCS = developing countries.
- 21 -
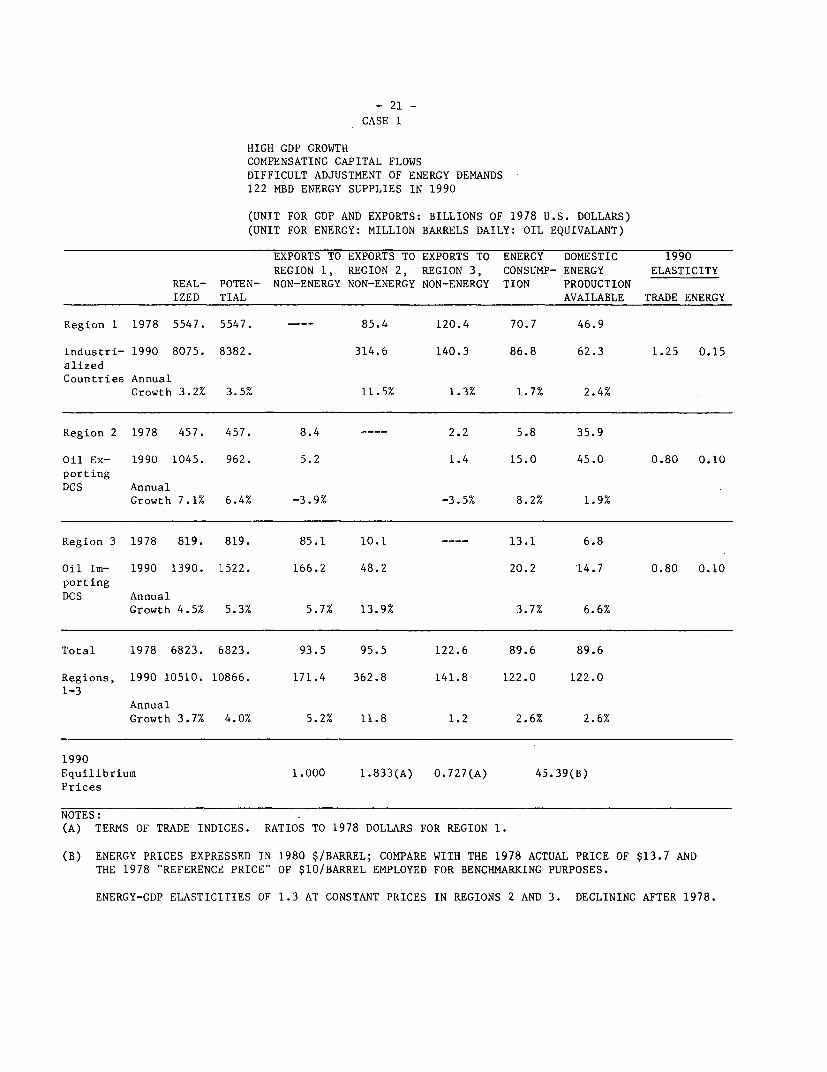
CASE 1
HIGH GDP GROWTHCOMPENSATING CAPITAL FLOWS
DIFFICULT ADJUSTMENT OF ENERGY DEMANDS
122 MED ENERGY SUPPLIES IN 1990
(UNIT FOR GDP AND EXPORTS: BILLIONS OF 1978 U.S. DOLLARS)
(UNIT FOR ENERGY: MILLION BARRELS DAILY: OIL EQUIVALANT)
EXPORTS TO EXPORTS TO EXPORTS TO ENERGY DOMESTIC 1990
REGION 1, REGION 2, REGION 3, CONSUMP- ENERGY ELASTICITY
REAL- POTEN- NON-ENERGY NON-ENERGY NON-ENERGY TION PRODUCTION
IZED TIAL AVAILABLE TRADE ENERGY
Region 1 1978 5547. 5547. --- 85.4 120.4 70.7 46.9
Industri- 1990 8075. 8382. 314.6 140.3 86.8 62.3 1.25 0.15
alizedCountries Annual
Growth 3.2% 3.5% 11.5% 1.3% 1.7% 2.4%
Region 2 1978 457. 457. 8.4 ---- 2.2 5.8 35.9
Oil Ex- 1990 1045. 962. 5.2 1.4 15.0 45.0 0.80 0.10
portingDCS Annual
Growth 7.1% 6.4% -3.9% -3.5% 8.2% 1.9%
Region 3 1978 819. 819. 85.1 10.1 ---- 13.1 6.8
Oil Im- 1990 1390. 1522. 166.2 48.2 20.2 14.7 0.80 0.10
portingDCS Annual
Growth 4.5% 5.3% 5.7% 13.9% 3.7% 6.6%
Total 1978 6823. 6823. 93.5 95.5 122.6 89.6 89.6
Regions, 1990 10510. 10866. 171.4 362.8 141.8 122.0 122.0
1-3Annual
Growth 3.7% 4.0% 5.2% 11.8 1.2 2.6% 2.6%
1990Equilibrium 1.000 1.833(A) 0.727(A) 45.39(B)
Prices
NOTES:(A) TERMS OF TRADE INDICES. RATIOS TO 1978 DOLLARS FOR REGION 1.
(B) ENERGY PRICES EXPRESSED IN 1980 $/BARREL; COMPARE WITH THE 1978 ACTUAL PRICE OF $13.7 AND
THE 1978 "REFERENCE PRICE" OF $10/BARREL EMPLOYED FOR BENCHMARKING PURPOSES.
ENERGY-GDP ELASTICITIES OF 1.3 AT CONSTANT PRICES IN REGIONS 2 AND 3. DECLINING AFTER 1978.

- 22 -
CASE 2
HIGH GDP GROWTHCOMPENSATING CAPITAL FLOWSDIFFICULT ADJUSTMENT OF ENERGY DEMANDS114 MBD ENERGY SUPPLIES IN 1990
(UNIT FOR GDP AND EXPORTS: BILLIONS OF 1978 U.S. DOLLARS)(UNIT FOR ENERGY: MILLION BARRELS DAILY: OIL EQUIVALANT)
EXPORTS TO EXPORTS TO EXPORTS TO ENERGY DOMESTIC 1990REGION 1, REGION 2, REGION 3, CONSUMP- ENERGY ELASTICITY
REAL- POTEN- NON-ENERGY NON-ENERGY NON-ENERGY TION PRODUCTIONIZED TIAL AVAILABLE TRADE ENERGY
RegLon 1 1978 5547. 5547. ---- 85.4 120.4 70.7 46.9
Ind.istri- 1990 7940. 8382. 375.1 103.6 80.7 62.3 1.25 0.15alizedCouatries Annual
Growth 3.0% 3.5% 13.1% -1.2% 1.1% 2.4%
Region 2 1978 457. 457. 8.4 ---- 2.2 5.8 35.9
Oil Ex- 1990 1082. 962. 3.6 1.0 15.2 40.0 0.80 0.10portingDCS Annual
Growth 7.4% 6.4% -6.7% -6.4% 8.4% 0.9%
Region 3 1978 819. 819. 85.1. 10.1 ---- 13.1 6.8
Oil Im- 1990 1310. 1522. 153.3 58.0 18.0 11.7 0.80 0.10
portingDCS Annual
Growth 4.0% 5.3% 5.0% 15.7% 2.7% 4.6%
Total 1978 6823. 6823. 93.5 95.5 122.6 89.6 89.6
Regions, 1990 10332. 10866. 157.0 433.1 104.6 114.0 114.01-3
AnnualGrowth 3.5% 4.0% 4.4% 13.4% -1.3% 2.0% 2.0%
19S'OEquilibrium 1.000 2.238(A) 0.716(A) 67.00(B)
Prices
NOV'ES:(A: TERMS OF TRADE INDICES. RATIOS TO 1978 DOLLARS FOR REGION 1.
(B:' ENERGY PRICES EXPRESSED IN 1980 $/BARREL; COMPARE WITH THE 1978 ACTUAL PRICE OF $13.7 ANDTHE 1978 "REFERENCE PRICE" OF $10/BARREL EMPLOYED FOR BENCHMARKING PURPOSES.
ENERGY-GDP ELASTICITIES OF 1.3 AT CONSTANT PRICES IN REGIONS 2 AND 3. DECLINING AFTER 1978.

- 23 -
CASE 3
HIGH GDP GROWTHCOMPENSATING CAPITAL FLOWS
EASY ADJUSTMENT OF ENERGY DEMANDS
122 MBD ENERGY SUPPLIES IN 1990
(UNIT FOR GDP AND EXPORTS: BILLIONS OF 1978 U.S. DOLLARS)
(UNIT FOR ENERGY: MILLION BARRELS DAILY: OIL EQUIVALANT)
EXPORTS TO EXPORTS TO EXPORTS TO ENERGY DOMESTIC 1990
REGION 1, REGION 2, REGION 3, CONSUMP- ENERGY ELASTICITY
REAL- POTEN- NON-ENERGY NON-ENERGY NON-ENERGY TION PRODUCTION
IZED TIAL AVAILABLE TRADE ENERGY
Region 1 1978 5547. 5547. ---- 85.4 120.4 .70.7 46.9
Industri- 1990 82]1. 8382. 230.2 147.9 88.2 62.3 1.25 0.20
alizedCountries Annual
Growth 3.3% 3.5% 8.6% 1.7% 1.9% 2.4%
Region 2 1978 457. 457. 8.4 ---- 2.2 5.8 35.9
Oil Ex- 1990 976. 962. 8.2 2.0 14.0 45.0 0.80 0.10
portingDCS Annual
Growth 6.5% 6.4% -0.2% -0.9% 7.6% 1.9%
Region 3 1978 819. 819. 85.1 10.1 ---- 13.1 6.8
Oil Im- 1990 1399. 1522. 188.3 36.5 19.7 14.7 0.80 0.15
portingDCS Annual
Growth 4.6% 5.3% 6.8% 11.3% 3.5% 6.6%
Total 1978 6823. 6823. 93.5 95.5 122.6 89.6 89.6
Regions, 1990 10585. 10866. 196.6 266.7 149.9 122.0 122.0
1-3AnnualGrowth 3.7% 4.0% 6.4% 8.9% 1.7% 2.6% 2.6%
1990Equilibrium 1.000 1.337(A) 0.691(A) 31.29(B)
Prices
NOTES:
(A) TERMS OF TRADE INDICES. RATIOS TO 1978 DOLLARS FOR REGION 1.
(B) ENERGY PRICES EXPRESSED IN 1980 $/BARREL; COMPARE WITH THE 1978 ACTUAL PRICE OF $13.7 AND
THE 1978 "REFERENCE PRICE' OF $10/BARREL EMPLOYED FOR BENCHMARKING PURPOSES.
ENERGY-GDP ELASTICITIES OF 1.3 AT CONSTANT PRICES IN REGIONS 2 AND 3. DECLINING AFTER 1978.

- 24 -CASE 4
HIGH GDP GROWTH
COMPENSATING CAPITAL FLOWSEASY ADJUSTMENT OF ENERGY DEMANDS114 MBD ENERGY SUPPLIES IN 1990
(UNIT FOR GDP AND EXPORTS: BILLIONS OF 1978 U.S. DOLLARS)(UNIT FOR ENERGY: MILLION BARRELS DAILY: OIL EQUIVALANT)
EXPORTS TO EXPORTS TO EXPORTS TO ENERGY DOMESTIC 1990REGION 1, REGION 2, REGION 3, CONSUMP- ENERGY ELASTICITY
REAL- POTEN- NON-ENERGY NON-ENERGY NON-ENERGY TION PRODUCTIONIZED TIAL AVAILABLE TRADE ENERGY
Region 1 1978 5547. 5547. ---- 85.4 120.4 70.7 46.9
Industri- 1990 8130. 8382. 260.7 122.7 81.9 62.3 1.25 0.20alized
Countries AnnualGrowth 3.2% 3.5% 9.7% 0.2% 1.2% 2.4
Region 2 1978 457. 457. 8.4 ---- 2.2 5.8 35.9
Oi] Ex- 1990 1002. 962. 6.5 1.6 14.1 40.0 0.80 0.10portingDC' Annual
Growth 6.8% 6.4% -2.2% -2.7% 7.7% 0.9%
Region 3 1978 819. 819. 85.1 10.1 ---- 13.1 6.8
Oil Im- 1990 1354. 1522. 181.2 41.6 17.9 11.7 0.80 0.15portingDC' Annual
Growth 4.3% 5.3% 6.5% 12.5% 2.6% 4.6%
Tol:al 1978 6823. 6823. 93.5 95.5 122.6 89.6 89.6
Regions, 1990 10487. 10866. 187.6 302.3 124.3 114.0 114.01-3
AnnualGrowth 3.6% 4.0% 6.0% 10.1% 0.1% 2.0% 2.0%
91'0Eqriilibrium 1.000 1.547(A) 0.688(A) 43.37(B)Pr Lces
NOTES:(A) TERMS OF TRADE INDICES. RAT,IOS TO 1978 DOLLARS FOR REGION 1.
(B) ENERGY PRICES EXPRESSED IN 1,980 $/BARREL; COMPARE WITH THE 1978 ACTUAL PRICE OF $13.7 ANDTHE 1978 "REFERENCE PRICE" OF $10/BARREL EMPLOYED FOR BENCHMARKING PURPOSES.
ENERGY-GDP ELASTICITIES OF 1.3 AT CONSTANT PRICES IN REGIONS 2 AND 3. DECLINING AFTER 1978.

- 25 -
CASE 5
HIGH GDP GROWTH
ZERO TRADE DEFICITSDIFFICULT ADJUSTMENT OF ENERGY DEMANDS122 MBD ENERGY SUPPLIES IN 1990
(UNIT FOR GDP AND EXPORTS: BILLIONS OF 1978 U.S. DOLLARS)(UNIT FOR ENERGY: MILL1ON BARRELS DAILY: OIL EQUIVALANT)
EXPORTS TO EXPORTS TO EXPORTS TO ENERGY DOMESTIC 1990
REGION 1, REGION 2, REGION 3, CONSUMP- ENERGY ELASTICITY
REAL- POTEN- NON-ENERGY NON-ENERGY NON-ENERGY TION PRODUCTION
IZED TIAL AVAILABLE TRADE ENERGY
Region 1 1978 5547. 5547. ---- 85.4 120.4 70.7 46.9
Industri- 1990 8108. 8382. 351.8 112.0 87.6 62.3 1.25 0.15
alizedCountries Annual
Growth 3.2% 3.5% 12.5% -0.6% 1.8% 2.4
Region 2 1978 457. 457. 8.4 ---- 2.2 5.8 35.9
Oil Ex- --1990 1075. 962. 4.7 2.0 15.7 45.0 0.80 0.10
porting
DCS Annual -
Growth,7.4% 6.4% -4.7% -6.1% 8.6% 1.9%
Region 3 1978 819. 819. 85.1 10.1 ---- 13.1 6.8
Oil Im- 1990 1253. 1522. 214.6 62.4 18.7 14.7 0.80 0.10
portingDCS Annual
Growth 3.6% 5.3% 8.0% 16.4% 3.0% 6.6%
Total 1978 6823. 6823. 93.5 95.5 122.6 89.6 89.6
Regions, 1990 10436. 10866. 219.3 414.2 113.1 122.0 122.0
1-3AnnualGrowth 3.6% 4.0% 7.4% 13.0% -0.7% 2.6% 2.6%
1990Equilibrium 1.000 2.022(A) 0.598(A) 44.10(B)
Prices
NOTES:(A) TERMS OF TRADE INDICES. RATIOS TO 1978 DOLLARS FOR REGION 1.
(B) ENERGY PRICES EXPRESSED IN 1980 $/BARREL; COMPARE WITH THE 1978 ACTUAL PRICE OF $13.7 AND
THE 1978 "REFERENCE PRICE" OF $10/BARREL EMPLOYED FOR BENCHMARKING PURPOSES.
ENERGY-GDP ELASTICITIES OF 1.3 AT CONSTANT PRICES IN REGIONS 2 AND 3. DECLINING AFTER 1978.

- 26 -
CASE 6
HIGH GDP GROWTH
ZERO TRADE DEFICITSDIFFICULT ADJUSTMENT OF ENERGY DEMANDS114 MBD ENERGY SUPPLIES
(UNIT FOR GDP AND EXPORTS: BILLIONS OF 1978 U.S. DOLLARS)(UNIT FOR ENERGY: MILLION BARRELS DAILY: OIL EQUIVALANT)
EXPORTS TO EXPORTS TO EXPORTS TO ENERGY DOMESTIC 1990REGION 1, REGION 2, REGION 3, CONSUMP- ENERGY ELASTICITY
REAL- POTEN- NON-ENERGY NON-ENERGY NON-ENERGY TION PRODUCTIONIZED TIAL AVAILABLE TRADE ENERGY
Region 1 1978 5547. 5547. ---- 85.4 120.4 70.7 46.9
Industri- 1990 7980. 8382. 417.1 75.1 81.8 62.3 1.25 0.15alizedCountries Annual
Growth 3.1% 3.5% 14.1% -3.9% 1.2% 2.4
ReEion 2 1978 457. 457. 8.4 ---- 2.2 5.8 35.9
Oi] Ex- 1990 1111. 962. 3.4 0.7 15.9 40.0 0.80 0.10portingDC' Annual
Growth 7.7% 6.4% -7.4% -9.4% 8.8% 0.9%
Rejion 3 1978 819. 819. 85.1 10.1 ---- 13.1 6.8
Oil. Im- 1990 1143. 1522. 204.2 76.3 16.3 11.7 0.80 0.10portingDC' Annual
Growth 2.8% 5.3% 7.6% 18.4% 1.8% 4.6%
Total 1978 6823. 6823. 93.5 95.5 122.6 89.6 89.6
Regions, 1990 10234. 10866. 207.6 493.4 75.7 114.0 114.01--3
AnnualGrowth 3.4% 4.0% 6.9% 14.7% -3.9% 2.0% 2.0%
1990Eqiilibrium 1.000 2.434(A) 0.580(A) 64.11(B)Pr Lces
NOrES:(A) TERMS OF TRADE INDICES. RATIOS TO 1978 DOLLARS FOR REGION 1.
(B) ENERGY PRICES EXPRESSED IN 1980 $/BARREL; COMPARE WITH THE 1978 ACTUAL PRICE OF $13.7 ANDTHE 1978 "REFERENCE PRICE" OF $10/BARREL EMPLOYED FOR BENCHMARKING PURPOSES.
ENERGY-GDP ELASTICITIES OF 1.3 AT CONSTANT PRICES IN REGIONS 2 AND 3. DECLINING AFTER 1978.

- 27 -
CASE 7
HIGH GDP GROWTHZERO TRADE DEFICITSEASY ADJUSTMENT OF ENERGY DEMANDS122 MBD ENERGY SUPPLIES
(UNIT FOR GDP AND EXPORTS: BILLIONS OF 1978 U.S. DOLLARS)(UNIT FOR ENERGY: MILLION BARRELS DAILY: OIL EQUIVALANT)
EXPORTS TO EXPORTS TO EXPORTS TO ENERGY DOMESTIC 1990
REGION 1, REGION 2, REGION 3, CONSUMP- ENERGY ELASTICITYREAL- POTEN- NON-ENERGY NON-ENERGY NON-ENERGY TION PRODUCTION
IZED TIAL AVAILABLE TRADE ENERGY
Region 1 1978 5547. 5547. --- 85.4 120.4 70.7 46.9
Industri- 1990 8232. 8382. 259.0 126.9 88.8 62.3 1.25 0.15alizedCountries Annual
Growth 3.3% 3.5% 9.7% 0.4% 1.9% 2.4
Region 2 1978 457. 457. 8.4 ---- 2.2 5.8 35.9
Oil Ex- 1990 1006. 962. 7.3 1.5 14.7 45.0 0.80 0.10
portingDCS Annual
Growth 6.8% 6.4% -1.2% -3.0% 8.0% 1.9%
Region 3 1978 819. 819. 85.1 10.1 ---- 13.1 6.8
Oil Im- 1990 1300. 1522. 226.8 46.1 18.5 14.7 0.80 0.15
portingDCS Annual
Growth 3.9% 5.3% 8.5% 13.5% 2.9% 6.6%
Total 1978 6823. 6823. 93.5, 95.5 122.6 89.6 89.6
Regions, 1990 10538. 10866. 234.1 305.1 128.4 122.0 122.0
1-3AnnualGrowth 3.7% 4.0% 7.9% 10.2% 0.4% 2.6% 2.6%
1990Equilibrium 1.000 1.470(A) 0.600(A) 30.90(B)Prices
NOTES:(A) TERMS OF TRADE INDICES. RATIOS TO 1978 DOLLARS FOR REGION 1.
(B) ENERGY PRICES EXPRESSED IN 1980 $/BARREL; COMPARE WITH THE 1978 ACTUAL PRICE OF $13.7 AND
THE 1978 "REFERENCE PRICE" OF $10/BARREL EMPLOYED FOR BENCHMARKING PURPOSES.
ENERGY-GDP ELASTICITIES OF 1.3 AT CONSTANT PRICES IN REGIONS 2 AND 3. DECLINING AFTER 1978.

- 28 -
CASE 8
HIGH GDP GROWTHZERO TRADE DEFICITSEASY ADJUSTMENT OF ENERGY DEMANDS114 MBD ENERGY SUPPLIES
(UNIT FOR GDP AND EXPORTS: BILLIONS OF 1978 U.S. DOLLARS)(UNIT FOR ENERGY: MILLION BARRELS DAILY: OIL EQUIVALANT)
EXPORTS TO EXPORTS TO EXPORTS TO ENERGY DOMESTIC 1990REGION 1, REGION 2, REGION 3, CONSUMP- ENERGY ELASTICITY
REAL- POTEN- NON-ENERGY NON-ENERGY NON-ENERGY TION PRODUCTIONIZED TIAL AVAILABLE TRADE ENERGY
RegLon 1 1978 5547. 5547. - -- 85.4 120.4 70.7 46.9
Indistri- 1990 8156. 8382. 292.9 99.7 88.6 62.3 1.25 0.20alizedCou3tries Annual
Growth 3.3% 3.5% 10.8% -1.6% 1.3% 2.4
Region 2 1978 457. 457. 8.4 ---- 2.2 5.8 35.9
Oil Ex- 1990 1033. 962. 5.8 1.2 14.8 40.0 0.80 0.10portingDCS Annual
Growth 7.0% 6.4% -3.0% -5.0% 8.1% 0.9%
Region 3 1978 819. 819. 85.1 10.1 ---- 13.1 6.8
Oil Im- 1990 1236. 1522. 224.4 53.4 16.6 11.7 0.80 0.15portingDCS Annual
Growth 3.5% 5.3% 8.4% 14.9% 2.0% 4.6%
Total 1978 6823. 6823. 93.5 95.5 122.6 89.6 89.6
Regions, 1990 14248. 10866. 230.2 346.3 100.9 114.0 114.01-3
AnnualGrowth 3.7% 4.0% 7.8% 11.3% -1.6% 2.0% 2.0%
19S'0Equiilibrium 1.000 1.703(A) 0.583(A) 42.42(B)Prices
NOC)ES:(A> TERMS OF TRADE INDICES. RATIOS TO 1978 DOLLARS FOR REGION 1.
(B' ENERGY PRICES EXPRESSED IN 1980 $/BARREL; COMPARE WITH THE 1978 ACTUAL PRICE OF $13.7 ANDTHE 1978 "REFERENCE PRICE" OF $10/BARREL EMPLOYED FOR BENCHMARKING PURPOSES.
ENERGY-GDP ELASTICITIES OF 1.3 AT CONSTANT PRICES IN REGIONS 2 AND 3. DECLINING AFTER 1978.

- 29 -
CASE 9
HIGH GDP GROWTHZERO TRADE DEFICITS
DIFFICULT ADJUSTMENT OF ENERGY DEMANDS
116 MBD ENERGY SUPPLIES
(UNIT FOR GDP AND EXPORTS: BILLIONS OF 1978 U.S. DOLLARS)
(UNIT FOR ENERGY: MILLION BARRELS DAILY: OIL EQUIVALANT)
EXPORTS TO EXPORTS TO EXPORTS TO ENERGY DOMESTIC 1990
REGION 1, REGION 2, REGION 3, CONSUMP- ENERGY ELASTICITY
REAL- POTEN- NON-ENERGY NON-ENERGY NON-ENERGY TION PRODUCTION
IZED TIAL AVAILABLE TRADE ENERGY
Region 1 1978 5547. 5547. --- 85.4 120.4 70.7 46.9
Industri- 1990 7708. 7909. 288.4 105.6 83.0 62.3 1.25 0.15
alized
Countries AnnualGrowth 2.8% 3.0% 10.7% -1.1% 1.3% 2.4
Region 2 1978 457. 457. 8.4 ---- 2.2 5.8 35.9
Oil Ex- 1990 1030. 962. 5.5 1.1 14.7 39.0 0.80 0.10
portingDCS Annual
Growth 7.0% 6.4% -3.5% -5.6% 8.0% 0.7%
Region 3 1978 819. 819. 85.1 10.1 ---- 13.1 6.8
Oil Im- 1990 1241. 1522. 217.1 53.5 18.3 14.7 0.80 0.10
portingDCS Annual
Growth 3.5% 5.3% 8.1% 14.9% 2.8% 6.6%
Total 1978 6823. 6823. 93.5 95.5 122.6 89.6 89.6
Regions, 1990 9979 10393. 222.5 341.9 106.7 116.0 116.0
1-3AnnualGrowth 3.2% 3.6% 7.5% 11.2% -1.1% 2.2% 2.2%
1990Equilibrium 1.000 1.682(A) 0.567(A) 43.30(B)
Prices
NOTES:(A) TERMS OF TRADE INDICES. RATIOS TO 1978 DOLLARS FOR REGION 1.
(B) ENERGY PRICES EXPRESSED IN 1980 $/BARREL; COMPARE WITH THE 1978 ACTUAL PRICE OF $13.7 AND
THE 1978 "REFERENCE PRICE" OF $10/BARREL EMPLOYED FOR BENCHMARKING PURPOSES.
ENERGY-GDP ELASTICITIES OF 1.3 AT CONSTANT PRICES IN REGIONS 2 AND 3. DECLINING AFTER 1978.

- 30 -
References
Armington, P. S. (1969) "A Theory of Demand for Products Distinguished byPlace of Production" and "The Geographic Pattern of Trade and the Effects ofPrice Changes," International Monetary Fund Staff Papers XVI, March and July.
Barten, A. P. (1971) "An Import Allocation Model for the Common Market,"Cahiers Economiques de Bruxelles, Universite Libre de Bruxelles, No. 50, 2e.trimestre.
Blitzer, C. R., B. J. Choe, A. Lambertini (1979) "Energy in the 1980s:Global Supply and Demand Analysis," International Bank for Reconstructionand Development, Washington,: D.C., January.
I
Dunkerley, J., and S. Matsuba (1980) Annual Report to Congress, 1979.Resources for the Future, Washington, D.C., November.
U.S. Energy Information Administration (1980) Annual Report to Congress,1979. Volume Three: Synopsis, U.S. Department of Energy, Washington, D.C.,October.
Erergy Modeling Forum (EMF) (1980) "Energy Modeling Forum 4: AggregateElasticity of Energy Demand," Stanford University, January.
E2zati, A. (1978) World Energy Markets and OPEC Stability, Lexington, Mass.,Lexington Books.
Ginsburgh, V., and J. Waelbroeck (1975) "A General Equilibrium Model of WorldTrade, Part I, Full Format Computation of Economic Equilibria," CowlesFoundation Discussion Paper [No. 412, Yale University.
H:'ckman, B.G., Y. Kuroda, and L.J. Lau (1979) "The Pacific Basin in WorldTrade: An Analysis of Changing Trade Patterns, 1955-1975," Empirical Economics4, Issue I.
H:Lckman, B.G., and L.J. Lau (1973) "Elasticities of Substitution and ExportDemands in a World Trade Model," European Economic Review 4.
Manne, A.S., H. Chao, and R. Wilson (1989) "Consumption of CompetitiveE:quilibria by a Sequence of Linear Programs," Econometrica, November.
WValley, J. (1980) "An Evaluation of the Recent Tokyo Round Table Agreementth1-rough a General Equilibrium Model of World Trade Involving Major TrainingAreas," University of Western Ontario, April.
Wilson, Carroll L., ed. (1977) Energy: Global Prospects 1985-2000, Workshopoa Alternative Energy Strategies (WAES), New York, McGraw-Hill, 1977
WDrld Bank (1981) World Development Report 1981. New York: OxfordlJniversity Press.

COMPANION PAPERS IN THIS SERIES
No. TITLE OF PAPER AUTHOR
449 Policy Experience in Twelve Less Developed Countries B. Balassa
470 Industrial Country Policy and Adjustment to Imports J.M. Finger
from Developing Countries
471 The Political Structure of the New Protectionism D. Nelson (consultant)
472 Adjustment to External Shocks in Developing Countries B. Balassa
473 Food Policy Issues in Low-Income Countries E. Clay (consultant)
474 Energy, International Trade, and Economic Growth A. Manne (consultant)
475 Capital-Importing Oil Exporters: Adjustment Issues A.H. Gelb
and Policy Choices
476 Notes on the Analysis of Capital Flows to Developing R.C. Bryant (consultani
Nations and the 'Recycling' Problem
477 Adjustment Experience and Growth Prospects of the F. Jaspersen
Semi-Industrial Countries
478 Trade Policy Issues for the Developing Countries I. Frank (consultant)in the 1980s
479 Trade among Developing Countries: Theory, Policy 0. HavrylyshynIssues, and Principal Trends (consultant)
M. Wolf
480 Trade in Services: Economic Determinants and A. Sapir (consultant)Development-Related Issues E. Lutz
481 International Migrant Workers' Remittances: Issues G. Swamy
and Prospects
482 Private Bank Lending to Developing Countries R. O'Brien (consultant'
483 Development Prospects of the Capital Surplus R. Hablutzel
Oil-Exporting Countries
484 Private Capital Flows to Developing Countries and A. Fleming
Their Determination
485 International Adjustment in the 1980s V. Joshi (consultant)

No. TITLE OF PAPER AUTHOR
486 Adjustment in Low-Income Africa R. Liebenthal
487 A Comparative Analysis of Developing Country C. WallichAdjustment Experiences in the 1970s: Low-IncomeSouth Asia
488 Developments in and Prospects for the External N. HopeDebt of the Developing Countries: 1970-80 andBeyond
489 Global Energy Prospects B.J. ChoeA. LambertiniP. Pollak


*** HD9502 .A2 M36 1981c.2Manne, Alan Sueamann.Energy, international
trade, and economic. ',growth.