


Languages
Pages
Legal

HAL Id: tel-00008117https://tel.archives-ouvertes.fr/tel-00008117
Submitted on 18 Jan 2005
HAL is a multi-disciplinary open accessarchive for the deposit and dissemination of sci-entific research documents, whether they are pub-lished or not. The documents may come fromteaching and research institutions in France orabroad, or from public or private research centers.
L’archive ouverte pluridisciplinaire HAL, estdestinée au dépôt et à la diffusion de documentsscientifiques de niveau recherche, publiés ou non,émanant des établissements d’enseignement et derecherche français ou étrangers, des laboratoirespublics ou privés.
Emissions de N2O par nitrification et dénitrification àl’échelle de la motte de sol: effet de la structure du sol,
de l’aération et des activités microbiennesKarima Khalil
To cite this version:Karima Khalil. Emissions de N2O par nitrification et dénitrification à l’échelle de la motte de sol:effet de la structure du sol, de l’aération et des activités microbiennes. Sciences de la Terre. UniversitéPierre et Marie Curie - Paris VI, 2003. Français. �tel-00008117�

THESE DE DOCTORAT DE L’UNIVERSITE PARIS 6
Spécialité
Sciences de la Terre
présentée par
Karima KHALIL
Emissions de N2O par nitrification et dénitrification
à l’échelle de la motte de sol: effet de la structure du sol,
de l’aération et des activités microbiennes
soutenue le 31 janvier 2003
devant le jury composé de : M. P. POTIER Professeur Université. C. Bernard, Lyon I Rapporteur
M. A. BRUAND Professeur Université. Orléans, Orléans Rapporteur
M. A. MARIOTTI Professeur UPMC Paris 6, Paris Examinateur
M . G. BILLEN Directeur de Recherche – CNRS, Paris Examinateur
Me. C. CHENU Directeur de Recherche – INRA, Versailles Examinateur
M. B. MARY Directeur de recherche – INRA, Laon Directeur de thèse
1
RESUME
La production de N2O par les sols résulte des transformations microbiennes de l’azote:
dénitrification et nitrification. L'objectif de ce travail était de caractériser les émissions de
N2O par dénitrification et nitrification dans un sol de limon en fonction de la structure du sol,
à l'échelle de la motte. Nous avons étudié la dénitrification en combinant des mesures faites
sur des boues de sol incubées en anaérobiose et un modèle de simulation des populations
microbiennes réductrices de NO3- et N2O. Les simulations démontrent que la capacité
réductrice de N2O est inductible, de sorte que la production nette de N2O diminue fortement
au cours du temps malgré une dénitrification active. Nous avons mis en évidence que la
respiration et l'émission de N2O par dénitrification par des mottes de sol incubées en
aérobiose étaient fortement stimulées par une pré-incubation anaérobie. Ces résultats peuvent
être expliqués à l'aide d'un modèle simplifié prenant en compte la structure des mottes
caractérisée par analyse morphologique. La vitesse de nitrification et sa contribution à la
production de N2O ont été caractérisées sur des agrégats de sol en fonction de la pression
partielle en O2, en utilisant le traçage 15N. Une réduction de la pression O2 diminue la vitesse
de nitrification et augmente fortement la production de N2O par nitrification.
2

AVANT-PROPOS
Ce travail a été réalisé au sein de deux laboratoires, l’Unité de Climat Sol et
Environnement de l’INRA d’Avignon et l’Unité d’Agronomie de Laon, il a été cofinancé par
l’INRA et la région Picardie.
Je remercie, André Chanzy et Sylvie Recous en tant que directeur et directrice
respectifs de ces Unités de Recherche qui m’ont accueilli au sein de leur laboratoire durant
ces trois années.
Je remercie les membres de mon jury de thèse pour l’évaluation de ce travail. J’ai été
honoré qu’André mariotti accepte de présider ce jury et je suis particulièrement
reconnaissante envers Patrick Potier et Ary Bruand qui ont bien voulu accepter d’être
rapporteurs de ce travail malgré leurs nombreuses responsabilités. Enfin je remercie Claire
Chenu et Gilles Billen pour avoir accepté de participer au jury.
Je souhaite également remercier les membres de mon comité de pilotage qui se sont
réunis pour m’aider à orienter mes recherches. Je remercie en particulier, Robert Lensi, Sylvie
Recous, Catherine Hénault et André Mariotti.
Je suis très reconnaissante à Pierre Renault et Bruno Mary qui m’ont bien encadré tout
au long de ma thèse. Je leur serai toujours redevable pour toutes les connaissances qu’ils
m’ont transmises. Je vous remercie tous les deux pour votre patience, votre enthousiasme et
vos encouragements dans les moments difficiles.
Merci à Pierre d’avoir contribué à rendre mon séjour à Avignon aussi efficace
qu’agréable. Merci à Bruno et sa famille d’avoir facilité mon arrivée à Laon.
Grand Merci à tous les deux pour ces souvenirs qui m’ont permis de mener à terme ce
travail dans les meilleures conditions possibles.
J’ai eu l’occasion de connaître de nombreuses équipes de recherche avec de multiples
compétences lors des voyages réalisés dans le cadre de ma thèse.
Je suis particulièrement reconnaissante à Robert Lensi de m’avoir accueilli au
laboratoire d’Ecologie Microbienne, ce séjour qui m’a permis d’acquérir beaucoup de
connaissances sur la microbiologie des sols. Mes remerciements vont également à Nadia Salin
pour sa gentillesse et son encouragement durant les longues journées à séparer les MOP des
mottes de sol. Mes pensées vont aussi à Agnès Richaume que je remercie de ses discussions
intéressantes lors de mon séjour au laboratoire d’Ecologie Microbienne.
3

Je tiens aussi à remercier Christian Lelay qui a eu la tâche délicate de réaliser des
lames minces à partir des mottes de sol.
Ce travail n’aurait pu se faire sans le soutien efficace de toute une équipe technique. Je
remercie tout particulièrement Olivier Delfosse pour sa disponibilité lors des mesures
isotopiques à Laon et sa patience pendant de longues journées de mesure devant le
spectromètre de masse. Je remercie également Gonzague Alavoine, Gaëtan Bentivegna,
Florence barrois et Ghislain sevenier qui m’ont aidé pour les mesures chimiques.
Merci à Hubert Boizard pour son aide sur la parcelle lors du prélèvement du sol à
Mons, merci de m’avoir appris la distinction entre les mottes ∆ et Γ. Je remercie aussi Paul
Régnier et Bertrand Chauchard pour leur bonne humeur ainsi que leur aide au moment de
prélèvement sur la parcelle.
Lors de mes séjours réalisés dans le cadre de ma thèse, j’ai eu l’occasion de connaître
de nombreuses personnes. Je ne peux malheureusement pas citer tout le monde. Que chaque
chercheur, ingénieur, technicien, thésard ou stagiaire qui ont contribué à rendre mes séjours
agréables dans ces laboratoires, trouvent ici le témoignage de ma gratitude.
Mes remerciements s’adressent aussi au personnel administratif, Chantal Gars, Valérie
Dazin et Brigitte Rocourt ainsi que le personnel de la documentation Michèle (s), Martine.
Je vais en terminer pour remercier tous mes amis pour leur soutien moral et les grands
moments de détente tout au long de ces années d’études ...
Grand merci enfin à toute ma famille qui m’a permis d’arriver jusque là, je leur dédie
ce mémoire.
4

TABLE DES MATIERES
INTRODUCTION GENERALE …………………………………………………………..15
CHAPITRE 1 : SYNTHESE BIBLIOGRAPHIQUE …………………………………….18
I. Problématiques environnementales et agronomiques…………………………………..19
I.1. Effet de serre et forçage radiatif …………………………………………………19
I.2. Effets sur l’ozone de la haute troposphère et de la basse stratosphère …………..20
I.3. Pertes de fertilisants azotés en agriculture ……………………………………….21
II. Processus impliqués dans la production et la consommation de N2O dans les sols …21
II.1. La dénitrification ………………………………………………………………..21
II.2. La nitrification ………………………………………………………………….24
III. La régulation des émissions de N2O dans les sols …………………………………….26
III.1. La teneur en eau ………………………………………………………………..30
III.2. L’aération du sol ……………………………………………………………….31
III.3. La disponibilité en azote minéral ………………………………………………32
III.4. La disponibilité en carbone et matière organique ……………………………...34
III.5. La texture et la structure du sol ………………………………………………...34
III.6. La température …………………………………………………………………35
III.7. Le pH …………………………………………………………………………..36
IV. Modélisation des émissions de N2O dans les sols ……………………………………..37
IV.1. Les modèles stochastiques ……………………………………………………..37
IV.2. Les modèles empiriques ……………………………………………………….38
IV.3. Les modèles mécanistes………………………………………………………...39
V- Conclusion ………………………………………………………………………………40
REFERENCES BIBLIOGRAPHIQUES ………………………………………………….42
CHAPITRE 2 : SIMULATION DE LA DENITRIFICATION, DE LA DYNAMIQUE
DES DENITRIFIANTS ET LEUR CAPACITE PROGRESSIVE A REDUIRE N2O :
COMPARAISON MODELE - EXPERIENCE …………………………………………...51
5

Summary …………………………………………………………………………….52
Introduction …………………………………………………………………………53
Materials & Methods ……………………………………………………………….55
Results ……………………………………………………………………………….63
Discussion …………………………………………………………………………....78
References …………………………………………………………………………...90
CHAPITRE 3 : INFLUENCE D’UNE PRE-INCUBATION ANAEROBIE SUR LA
RESPIRATION ET LES EMISSIONS DE N2O PAR DES MOTTES DE
SOL EN INCUBATION AEROBIE ……………………………………….97
Summary …………………………………………………………………………….98
Introduction …………………………………………………………………………99
Materials & Methods ……………………………………………………………...101
Results ……………………………………………………………………………...108
Discussion …………………………………………………………………………..119
References ………………………………………………………………………….124
CHAPITRE 4 : MODELE SIMPLIFIE DES EMISSIONS DE N2O PAR
DENITRIFICATION PRENANT EN COMPTE LA STRUCTURE DES
MOTTES ET LA PREINCUBATION ANAEROBIE …………………..128
Summary …………………………………………………………………………...120
Introduction ………………………………………………………………………..129
Materials & Methods ……………………………………………………………...130
Results & discussion ……………………………………………………………….142
Conclusion ………………………………………………………………………….154
References ………………………………………………………………………….156
CHAPITRE 5 : INFLUENCE DE LA PRESSION EN O2 SUR LA
PRODUCTION DE N2O PAR NITRIFICATION ET
DENITRIFICATION PAR DES AGREGATS DE SOL ………………..160
6

Summary …………………………………………………………………………...161
Introduction ………………………………………………………………………..162
Materials & Methods ……………………………………………………………...164
Results ……………………………………………………………………………...168
Discussion …………………………………………………………………………..186
References ………………………………………………………………………….193
SYNTHESE DES RESULTATS ………………………………………………………….197
I. Synthèse des principaux acquis ………………………………………………………...198
I.1.Fonctionnement dénitrifiant en condition anaérobie ……………………………198
I.2. Anoxie, respiration et dénitrification……………………………………………199
I.3. Emissions de N2O par nitrification ……………………………………………..201
I.4. Données complémentaires ……………………………………………………...201
II. Comparaison avec le comportement du sol in situ …………………………….…….202
III. Perspectives de ce travail ……………………………………………………………..203
III.1.Aspect méthodologique ……………………………………………………….203
III.2.Aspect d’analyse des mécanismes …………………………………………….204
III.3.Extrapolation à des échelles d’espace et de temps plus larges ………………...205
BIBLIOGRAPHIE ………………………………………………………………………...207
7

LISTE DES FIGURES
CHAPITRE 1
Figures 1: : Contribution relative (%) a) à l’effet de serre naturel et b) forçage radiatif
d’après Mac Kay et Khalil (1991)……………………………………………………………20
Figure 2: Les étapes de la dénitrification (Hénault, 1995)…………………………………..22
Figure 3: Schéma conceptuel « hole in the pipe » (Firestone et Davidson, 1989)………….26
Figure 4: Les facteurs de contrôle de la dénitrification dans les sols (Robertson, 1989)…...28
Figure 5: Les facteurs de contrôle de la nitrification dans les sols (Robertson, 1989)……...29
Figure 6: Influence de WFPS sur le devenir de N (Linn et Doran, 1984)…………………...30
Figure 7: Effets de la concentration en O2 sur les étapes de la dénitrification (Tiedje, 1988).
………………………………………………………………………………………………...32
CHAPITRE 2
Figure 1: Comparaison entre les valeurs expérimentales et simulées de [N2O] pour la
condition 1 (i.e. avec C2H2, sans N2O initialement) pour un rendement énergétique de
1.25 mole ATP par mole de N2O produit :
a/ [NO3-]initial = 0.17 mol.m-3 solution;
b/ [NO3-]initial = 0.93 mol.m-3 solution;
c/ [NO3-]initial = 7.90 mol.m-3 solution……………………………………………………...64
Figure 2: Effet des valeurs choisies du rendement énergétique pour la production de N2O et
de l’énergie de maintenance microbienne sur les estimations de la biomasse dénitrifiante
bm et de l’activité spécifique dénitrifiante maximale νDmax:
a/ effet du rendement énergétique YDmax pour un coefficient de maintenance mE = 10-6 s-1;
b/ effet du coefficient de maintenance mE pour un rendement énergétique YDmax de
1.25 mole ATP par mol de N2O produit.…………………………………………………..65
Figure 3: Comparaison entre les valeurs expérimentales et simulées de [N2O] en fonction du
temps nécessaire pour atteindre l’équilibre de N2O, pour 6 flacons avec de faibles
concentrations de NO3-, et la consommation de NO3
- exprimée comme un défaut équivalent
dans la production de N2O pour une sousestimation de fN par 0.04. ……………………..66
Figure 4: Données expérimentales et simulées par le modèle A, en utilisant les paramètres
estimés:
8
a/ condition 2, [NO3
-]initial = 0.23 mol.m-3 solution;
b/ condition 2, [NO3-]initial = 7.90 mol.m-3 solution;
c/ condition 3, [NO3-]initial = 0.23 mol.m-3 solution;
d/ condition 3, [NO3-]initial = 7.90 mol.m-3 solution. …………………………………..68
Figure 5: Données expérimentales et simulées par le modèle B, en utilisant les paramètres
estimés:
a/ condition 2, [NO3-]initial = 0.23 mol.m-3 solution;
b/ condition 2, [NO3-]initial = 7.90 mol.m-3 solution;
c/ condition 3, [NO3-]initial = 0.23 mol.m-3 solution;
d/ condition 3, [NO3-]initial = 7.90 mol.m-3 solution. …………………………………..69
Figure 6: Données expérimentales et simulées par le modèle C, en utilisant les paramètres
estimés (les simulations 1, 2 et 3 correspondent à YRmax égal à 2.5, 3.33 et 4.17
mol ATP.mol N2O, respectivement):
a/ condition 2, [NO3-]initial = 0.23 mol.m-3 solution;
b/ condition 2, [NO3-]initial = 7.90 mol.m-3 solution;
c/ condition 3, [NO3-]initial = 0.23 mol.m-3 solution;
d/ condition 3, [NO3-]initial = 7.90 mol.m-3 solution. …………………………………..72
Figure 7: a/ Biomasse totale dénitrifiante estimée par confrontation des données simulées
aux données expérimentales pour les conditions 1 et 2 en utilisant les modèles A, B et C. Le
modèle C pour, (a) un rendement énergétique YRmax pour la réduction de N2O de 2.5
mol ATP.mol-1 N2O et (b) un rendement énergétique YRmax pour la réduction de N2O de 3.33
mol ATP.mol-1 N2O, respectivement, b/ un zoom dans la représentation de la figure 7a. …...75
Figure 8: a/ Biomasse totale dénitrifiante estimée par confrontation des données simulées
aux
données expérimentales pour les conditions 1 et 3 en utilisant les modèles A, B et C.
Le modèle C pour, (a) un rendement énergétique YRmax pour la réduction de N2O de
2.5 mol ATP.mol-1 N2O et (b) un rendement énergétique YRmax pour la réduction de
N2O de 3.33 mol ATP.mol-1 N2O, respectivement.
b/ un zoom dans la représentation de la figure 8a. …………………………………..76
CHAPITRE 3
Figure 1. Taux de production de CO2 (10-9 mol kg-1 s-1) mesuré et simulé dans des mottes de
sol (type ∆ ou Γ) pendant une incubation aérobie suivie soit de non pré-incubation
ou de 6 jours de pré-incubation anaérobie. Chaque point est la moyenne de 8
9

répétitions réalisées sur 4 mottes de sol. Les barres représentent les écarts types.
……………………………………………………………………………………109
Figure 2. Relation entre le taux de production de CO2 (10-9 mol kg-1 s-1) mesuré pendant
différentes périodes de 24 heures et le C organique soluble (mg C kg-1) mesuré en
même temps, dans les 2 types de mottes. Les périodes sont: après humectation sur
la table de succion (jour –6), après la pré-incubation anaérobie (jour 0) et à la fin
de l’incubation aérobie (jour 4). ………………………………………………...111
Figure 3: Emissions Nettes de N2O (10-12 mol kg-1 s-1) en fonction de la masse des mottes :
a) Dans des mottes de sol humectées avec une solution de nitrate et incubées dans
des conditions aérobies avec C2H2 (∆*, Γ*) ou sans C2H2 (∆, Γ);
b) Dans des mottes de sol humectées avec de l’eau désionisée et incubées dans
des conditions aérobies sans C2H2 soit après une pré-incubation anaérobie (∆+,
Γ+) ou sans pré-incubation (∆, Γ). ……………………………………………...118
CHAPITRE 4
Figure 1: Histogramme de l’intensité lumineuse pour une motte Γ correspondante aux Photos
1a-b. ……………………………………………………………………………………...136
Figure 2: Exemple des opérations morphologiques réalisées pour une caractérisation
d’image d’une motte Γ dans les Photos 1a-b: a/ et b/ binarisation des photos visible et UV,
respectivement; c/ somme logique des sections binaires; d/ simulation de la saturation à
5 cm d’eau de succion. …………………………………………………………………..137
Figure 3: Emissions de N2O en fonction de la masse des mottes pour le traitement A (i.e. avec
pré-incubation anaérobie) et le traitement (B) (i.e. sans pré-incubation anaérobie). Pour le
traitement (B), les émissions sont mesurées sans et avec C2H2. ………………………...143
Figure 4: Caractérisation morphologique des sections centrées des mottes ∆ et Γ après
simulation de leur saturation partielle à 5 cm d’eau de succion: a/ nombre de trous libres
à l’air par motte, en fonction de la masse de motte; b/ distance maximale rm d’un point de
la motte au pore libre à l’air le plus proche dans la section, en fonction de la masse de
motte.
……………………………………………………………………………………………144
Figure 5: Caractérisation morphologique des sections centrées des mottes ∆ et Γ après
simulation de leur saturation partielle à 5 cm d’eau de succion: a/ double du rapport entre
surface et périmètre (ra), en fonction de la masse de motte; b/ comparaison entre ra réels et
10

ar̂ estimés, et le nombre de trous libres à l’air dans une section. ( sont obtenus par
simulation d’une régression cubique aux r
ar̂
a expérimentaux). …………………………...145
Figure 6: Masse de motte estimée en fonction de la masse expérimentale, pour 10 mottes ∆ et
10 mottes Γ utilisées pour les caractérisations morphologiques. La masse de motte estimée
est une fonction du rapport entre surface et périmètre et le nombre de trous libres à l’air
sur une section centrée d’une motte. …………………………………………………….147
Figures 7: Comparaison entre les émissions de N2O simulées et expérimentales sur des
mottes pour les traitements (A) et (B), dans le cas de non ajout de C2H2 a/ simulations pour
des mottes fictives ayant 4.8 trous dans une section centrée; b/ simulations pour seulement
le traitement (A) individuellement pour des mottes utilisées pour les analyses
morphologiques prenant en compte les nombres de trous observés et les rapports entre
surface et périmètre. ……………………………………………………………………..149
Figure 8: Emissions de N2O simulées pour des mottes dans le traitement (A), en utilisant soit
le taux de consommation d’O2 M et le nombre d’agrégats par motte na, soit ces valeurs
diminuent ou augmentent par un 1/3. Quelques simulations sont réalisées avec seulement
modification de M, alors que d’autres simulations sont réalisées avec soit l’augmentation
de M et la réduction de na, soit la réduction de M et l’augmentation de na. Toutes les
simulations sont réalisées pour des mottes fictives ayant 4.8 trous dans une section
centrée. …………………………………………………………………………………..151
CHAPITRE 5
Figure 1. Variation de N minéral (mg N kg-1) avec le temps dans le sol pour différentes
concentrations initiales de NH4+. A0: témoin (sans addition), A80: 80 mg N kg-1, A116:
116 mg N kg-1; A170: 170 mg N kg-1. a) concentration de NH4+; b) concentration de NO3
-;
c) concentration de NO2-. Barres Verticales sont les écarts types des moyennes. ………169
Figure 2. Variation de N minéral (mg N kg-1) avec le temps dans le sol incubé à différentes
concentrations d’O2: 0, 0.3, 0.7, 1.4, 4.0 et 20.5%: a) concentration de NH4+; b)
concentration de NO3-; c) concentration de NO2
-. Barres Verticales sont les écarts types
des moyennes. ……………………………………………………………………………171
Figure 3. Cinétiques des émissions de N2O et N2 (mg N kg-1) à partir du sol incubé à
différentes concentrations d’O2: 0, 0.3, 0.7, 1.4, 4.0 et 20.5%: a) N2O cumulé; b) rapport
cumulé N2O : N2 (égal au rapport 15N2O : 15N2). ……………………………………….175
Figure 4. Emissions de N2O (mg N kg-1 j-1) par nitrification et dénitrification à différents
11

intervalles de temps dans le sol incubé à différentes concentrations d’O2: 0, 0.3, 0.7, 1.4,
4.0 et 20.5%. ……………………………………………………………………………..177
Figure 5. Cinétiques de la nitrification et la consommation d’O2 dans le sol incubé à
différentes concentrations d’O2: 0, 0.3, 0.7, 1.4, 4.0 et 20.5%. a) nitrification cumulée (mg
N kg-1) calculée avec le modèle FLUAZ; b) consommation d’O2 cumulée (mmol O2 kg-1)
mesurée. Le taux de nitrification est défini comme ( )4
3 ai nn + , où ni est le taux d’oxydation
de NH4+ et na est le taux d’oxydation de NO2
-. Les barres verticales sont les écarts types.
……………………………………………………………………………………………178
Figure 6. Relation entre la consommation d’O2 (mmol kg-1 j-1) et la nitrification (mmol kg-1 j-
1) pour différents intervalles de temps et différents traitements d’O2. Le taux de nitrification
est défini comme ( )4
3 ai nn + , où ni est le taux d’oxydation de NH4+ et na est le taux d’oxydation
de NO2-.
……..………………………………………………………………………………………...180
Figure 7. Relations entre émissions de N2O cumulées (mg N kg-1) et la dénitrification
cumulée ou la nitrification cumulée (mg N kg-1) dans le sol incubé à différentes
concentrations d’O2: a) N2O émis par denitrification en fonction de la dénitrification à des
concentrations d’O2 égales à 0 et 0.3%; b) N2O émis par nitrification en fonction de la
nitrification à des concentrations d’O2 égales à 0.7, 1.4, 4.0 et 20.5%. La nitrification est
définie comme la production de NO2-, i.e. oxydation cumulée de NH4
+. Les équations de
régression sont données dans le tableau 3.
……………………………………………………………………………………………181
Figure 8. Relation entre les taux des émissions totales de N2O (mg N kg-1 j-1) et les
concentrations de NO2- (mg N kg-1) mesuré dans le sol à la fin de chaque intervalle de
temps, à différentes concentrations d’O2: 0.3, 0.7, 1.4, 4.0 et 20.5%.
……………………………………………………………………………………………184
Figure 9: pH mesuré au début (t = 0) et à la fin de l’incubation (t = 14 jours) dans des sols
incubés à différentes concentrations d’O2: 0, 0.3, 0.7, 1.4, 4.0 et 20.5%. ………………185
12

LISTE DES TABLEAUX
CHAPITRE 2
Table 1: paramètres estimés par confrontation des données simulées et expérimentales pour
un rendement énergétique YDmax et un coefficient de maintenance mE de
1.25 mol ATP.mol N2O produit et 10-6 s-1, respectivement.
………………………………………………………………………………………………...73
CHAPITRE 3
Table 1. Paramètres obtenus par confrontation du taux de production de CO2 simulé et
mesuré pendant 4 jours d’incubation aérobie avec ou sans incubation préliminaire anaérobie.
……………………………………………………………………………………………….110
Table 2. Taux des émissions nettes de N2O (10-12 mol kg-1 s-1) mesurés sur des mottes de sol
pendant l’incubation aérobie, pour différentes conditions d’humectation et pré-traitements.
Les valeurs entre parenthèses représentent des intervalles de confiance (p <0.05).
……………………………………………………………………………………………….112
Table 3. Concentrations de N minéral (in mol m-3 solution ou mg kg-1 sol) mesurées au début
et à la fin d’une journée d’incubation aérobie suivie soit d’une humectation avec de l’eau et
une pré-incubation anaérobie (6 jours) soit d’une humectation avec du nitrate et sans pré-
incubation. Les valeurs entre parenthèses représentent des écarts types. ………………….114
Table 4: Taux apparent et réel de production de CO2 (10-9 mol CO2 kg-1 s-1) pendant 6 heures
d’incubation aérobie des mottes ∆ et Γ. Taux apparent est le taux d’accumulation
mesuré dans des échantillons; taux réel est calculé en utilisant équation 8 pour 3
valeurs de k3: k3 = 2, 3 et 4%, correspondant à 0.83, 1.25 et 1.66 mol m-3. Les mottes
∆+ et Γ+ ont été incubées avec un pré-traitement (incubation anaérobie pendant 6
jours avec C2H2), alors que les mottes ∆ et Γ sont incubées sans pré-traitement.
Les valeurs entre parenthèses représentent des intervalles de confiance (p <0.05).
………………………………………………………………………………………...115
Table 5 : Taux des émissions de N2O, concentrations de N minéral et compositions
isotopiques de N2O et N minéral mesurées sur des mottes ∆, pendant une période
d’incubation aérobie (7 jours) suivie de 6.6 jours d’incubation anaérobie avec C2H2. Le pool
et la composition isotopique de N minéral sont la moyenne des valeurs mesurées à t = 0 et t =
13

7 heures. Le marquage 15N a été réalisé en utilisant 15NO3
- ou 15N-urée avant la pré-
incubation anaérobie. Les valeurs entre parenthèses sont les écarts types (3 répétitions).
……………………………………………………………………………………………….117
CHAPITRE 4
Table 1: Paramètres retenus dans le modèle d’émission de N2O sur motte par dénitrification.
……………………………………………………………………………………………….139
CHAPITRE 5
Table 1 :Taux d’oxydation de NH4+ (ni, mg N kg-1 j-1) et Taux d’oxydation de NO2
- (na, mg N
kg-1 j-1) dans le sol incubé à la concentration O2 atmosphérique pour différents intervalles de
temps et concentrations initiales d’ammonium (0, 80, 116 et 170 mg N kg-1).
na est calculée comme l’accumulation de NO3- et ni comme la disparition de NH4
+ et la
production de NO2-. …………………………………………………………………………170
Table 2 : Excès atom% de NH4+, NO3
- et N2O (moyennes et écarts types) mesurés dans le sol
à différentes dates d’incubation et différentes concentrations d’O2 (0, 0.3, 0.7, 1.4, 4.0 et
20.5%). ……………………………………………………………………………………...172
Table 3 : Taux de nitrification (taux d’oxydation de NH4+ ni) et taux de dénitrification (d) (mg
kg-1 j1), calculés en utilisant les pools mesurés de N et 15N et le modèle de FLUAZ ; dans des
échantillons de sol incubés sous différentes concentrations d’O2 (0; 0.3; 0.7; 1.4; 4.0 et
20.5%) pendant 14 jours.
……………………………………………………………………………………………….174
Table 4 : Paramètres des régressions linéaires de la production cumulée de N2O (mg N kg-1)
en fonction de la nitrification cumulée (mg N kg-1). N2O total est le N2O mesuré alors que
N2O 'par nitrification' est calculé (en utilisant les coefficients α et β, voir le texte). La
nitrification est définie comme la production de NO2-, i.e. oxydation cumulée de NH4
+.
……………………………………………………………………………………………….183
14

INTRODUCTION GENERALE
15
INTRODUCTION GENERALE
L’oxyde nitreux est un gaz à effet de serre impliqué dans la chimie de l’ozone, dans la
haute troposphère et la basse stratosphère. Les estimations récentes font état d’émissions
annuelles de N2O vers l’atmosphère d’environ 14.7 Tg de N-N2O, dont 9.5 Tg proviendraient
des sols. La contribution des sols agricoles reste encore estimée de manière très imprécise. La
production de N2O dans les sols résulte des transformations microbiennes de l’azote, plus
particulièrement de la dénitrification. La nitrification contribue aussi à ces émissions et
pourrait en être une source importante.
Plusieurs motivations justifient notre travail. Les sources et puits des émissions de ce
gaz sont mal évalués. Chacune des 2 étapes de la dénitrification (production et
consommation) possède sa propre régulation. La production nette de N2O dans les sols
représente une part variable des produits de la dénitrification (N2O et N2) selon les conditions
du milieu. Les émissions de N2O varient donc aussi bien avec la vitesse de dénitrification
qu’avec la vitesse de réduction du N2O en N2. Les facteurs qui contrôlent le ratio
N2O/(N2O+N2) sont mal connus et peuvent différer de ceux qui régulent la dénitrification.
Plusieurs modèles ont été proposés pour décrire la dénitrification. Ils prennent en compte
plusieurs facteurs tels que la respiration, l’anaérobiose, … Néanmoins, les variations
temporelles de ces facteurs ne sont pas considérées dans ces modèles. Par ailleurs, la structure
du sol est un facteur important puisqu'elle conditionne l'anoxie et donc la dénitrification.
Toutefois, ce paramètre n’est pas souvent pris en compte dans les modèles de prévision du
N2O. Enfin, la contribution de la nitrification aux émissions de N2O reste encore mal estimée.
Plusieurs facteurs pouvant influencer ces émissions ont été étudiés; toutefois, peu d’études ont
analysé l’effet direct de la pression partielle en O2 dans les sols.
Il est nécessaire de choisir une échelle expérimentale adéquate et compatible avec nos
motivations environnementale et agronomique. Nous avons choisi une échelle millimétrique:
boues, agrégats (2-3 mm) et mottes (2 à 3 cm de diamètre). Cette échelle d’étude se justifie
par le fait que les conditions physiques (en particulier les teneurs en O2) de la couche labourée
sont en fait très variables à l’intérieur des mottes constituant cette couche, de telle sorte que la
valeur moyenne ne suffit pas à prévoir l’activité des micro-organismes, en particulier la
nitrification et la dénitrification.
16
INTRODUCTION GENERALE
Ce mémoire présente l’ensemble des résultats obtenus lors de cette étude et il est
structuré en 6 parties.
Dans une première partie, nous avons commencé par une synthèse bibliographique
décrivant l’état des connaissances actuelles sur les émissions de N2O ainsi que les
problématiques environnementales et agronomiques qui justifient notre travail (Chapitre 1).
Dans une seconde partie, nous avons décrit le fonctionnement de la production de N2O
en compétition avec sa réduction en N2 sur des boues de sol avec différentes concentrations
initiales en nitrate. A cette occasion, nous avons utilisé des modèles qui prennent en compte la
dynamique microbienne ainsi que l’adaptation des microorganismes à réduire N2O en N2
(Chapitre 2).
Dans une troisième partie, nous avons étudié l’influence d’une pré-incubation
anaérobie sur la respiration aérobie ainsi que sur les émissions de N2O par dénitrification, sur
deux populations de mottes de structure différente (Chapitre 3).
Au cours d’une quatrième partie, nous avons utilisé un modèle qui prend en compte
l’activité dénitrifiante et l’aération en relation avec la structure des mottes décrite par des
descripteurs synthétiques obtenus par analyse morphologique (Chapitre 4).
Dans une cinquième partie, nous avons étudié l’effet de la pression partielle en O2 sur
la nitrification et les émissions de N2O par nitrification après un apport d’ammonium sur des
agrégats de sol (Chapitre 5).
L’ensemble de ce travail de thèse est discuté dans une sixième partie dans laquelle
nous avons positionné nos résultats dans un contexte d’étude plus large. Nous faisons
quelques propositions de recherches ultérieures et d'application de ces résultats à la
problématique environnementale.
17

CHAPITRE 1
SYNTHESE BIBLIOGRAPHIQUE
18

CHAPITRE 1
I. Problématiques environnementales et agronomiques I.1. Effet de serre et forçage radiatif Une part importante du rayonnement infrarouge émis par le sol est absorbée par
certains constituants atmosphériques mineurs (les gaz dits à effet de serre). Le rayonnement
ainsi piégé réchauffe la basse atmosphère qui émet elle-même un rayonnement infrarouge.
Une fraction de ce dernier rayonnement réchauffe la surface de la terre : c’est l’effet de serre.
On parle d'effet de serre "naturel" pour caractériser le réchauffement de la planète dû à la
présence de gaz absorbant dans l'infrarouge aux teneurs qu'ils avaient avant le début de l'ère
industrielle, i.e. avant que l'homme ne commence à modifier significativement la composition
de l'atmosphère. Cet effet de serre naturel a été estimé à 33°C : en absence de nuages et des
gaz traces, la température moyenne de la terre serait ainsi d’environ -18°C, au lieu des 15°C
environ vers 1800-1850. L'essentiel de l'effet de serre naturel est lié à la présence d'eau dans
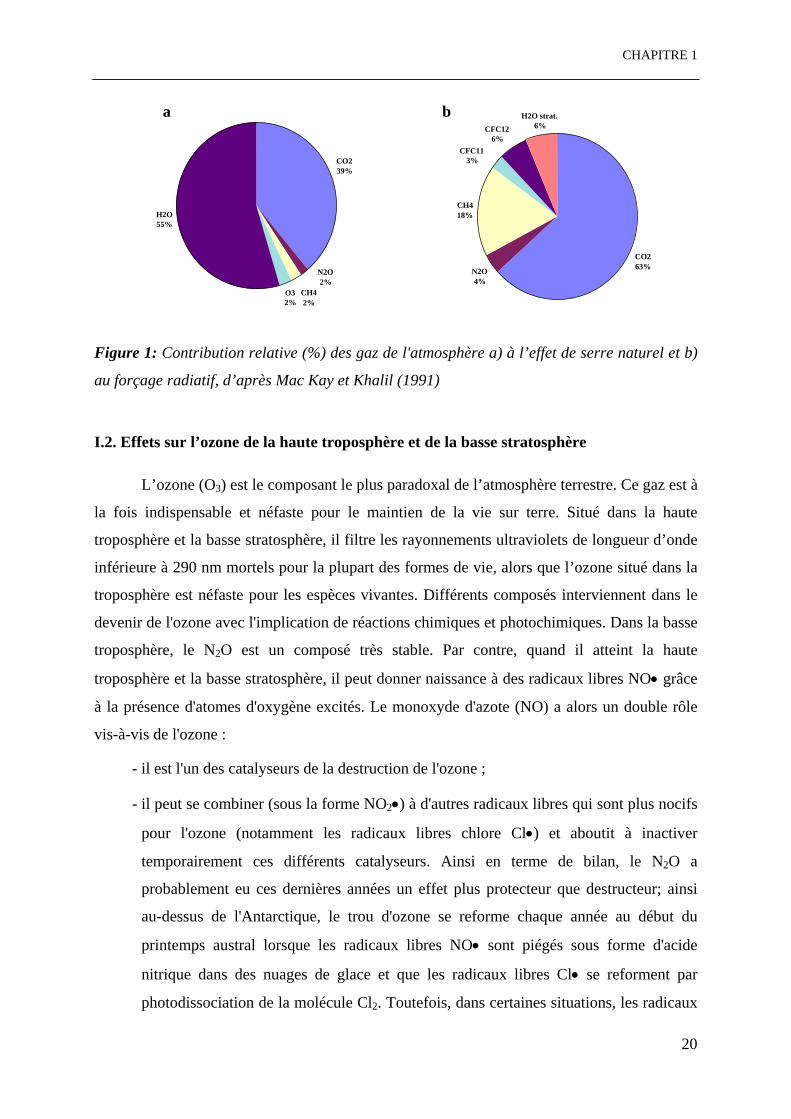
l'atmosphère (vapeur, nuages …) et à la présence de dioxyde de carbone (Figure 1a). Un
changement dans l’intensité du rayonnement du soleil ou des capacités de l’atmosphère à
absorber le rayonnement infrarouge constituent un forçage radiatif. Le forçage radiatif actuel
serait à l'origine d'un accroissement de température d'environ 0.5-0.8°C depuis l'ère
préindustrielle. Selon le rapport de l’IPCC (1996), entre 50 et 60 % du forçage radiatif résulte
de l'accroissement de la concentration atmosphérique en dioxyde de carbone (Figure 1b). Le
reste du forçage radiatif résulte de l'accroissement de concentrations d'autres gaz : méthane,
CFC, ozone, protoxyde d’azote et vapeur d’eau stratosphérique. D’après l’évolution de la
composition atmosphérique, l’accumulation atmosphérique du protoxyde d’azote (N2O)
s’élève à environ 4 Tg N an-1 (IPCC, 1995). Sa durée de vie est estimée entre 110 et 166 ans,
avec un temps de résidence de 25 ans dans la troposphère (Jambert, 1995). Le N2O possède
un effet radiatif 200 à 300 fois supérieur à celui du CO2. Les estimations actuelles indiquent
que près de 65 % des émissions (soit 9.5 Tg N an-1) sont issus du sol, dont 1/3 (3.5 Tg N an-1)
proviendrait des sols cultivés. Environ 20 % (3 Tg N an-1) des émissions totales de N2O
proviennent des océans, 3 % (0.4 Tg N an-1) serait produits par les animaux et l’élevage, 3 %
(0.5 Tg N an-1) seraient émis au cours du brûlage de la biomasse et environ 9 % (1.3 Tg N an-
1) proviendraient des rejets industriels lors de la fabrication de produits chimiques tels que
l’acide nitrique ou les engrais.
19
CHAPITRE 1
a b
CO2 63%
CFC113%
N2O4%
CH418%
CFC126%
H2O strat.6%
O3 2%
CH4 N2O2%
2%
H2O 55%
CO239%
Figure 1: Contribution relative (%) des gaz de l'atmosphère a) à l’effet de serre naturel et b)
au forçage radiatif, d’après Mac Kay et Khalil (1991)
I.2. Effets sur l’ozone de la haute troposphère et de la basse stratosphère
L’ozone (O3) est le composant le plus paradoxal de l’atmosphère terrestre. Ce gaz est à
la fois indispensable et néfaste pour le maintien de la vie sur terre. Situé dans la haute
troposphère et la basse stratosphère, il filtre les rayonnements ultraviolets de longueur d’onde
inférieure à 290 nm mortels pour la plupart des formes de vie, alors que l’ozone situé dans la
troposphère est néfaste pour les espèces vivantes. Différents composés interviennent dans le
devenir de l'ozone avec l'implication de réactions chimiques et photochimiques. Dans la basse
troposphère, le N2O est un composé très stable. Par contre, quand il atteint la haute
troposphère et la basse stratosphère, il peut donner naissance à des radicaux libres NO• grâce
à la présence d'atomes d'oxygène excités. Le monoxyde d'azote (NO) a alors un double rôle
vis-à-vis de l'ozone :
- il est l'un des catalyseurs de la destruction de l'ozone ;
- il peut se combiner (sous la forme NO2•) à d'autres radicaux libres qui sont plus nocifs
pour l'ozone (notamment les radicaux libres chlore Cl•) et aboutit à inactiver
temporairement ces différents catalyseurs. Ainsi en terme de bilan, le N2O a
probablement eu ces dernières années un effet plus protecteur que destructeur; ainsi
au-dessus de l'Antarctique, le trou d'ozone se reforme chaque année au début du
printemps austral lorsque les radicaux libres NO• sont piégés sous forme d'acide
nitrique dans des nuages de glace et que les radicaux libres Cl• se reforment par
photodissociation de la molécule Cl2. Toutefois, dans certaines situations, les radicaux
20
CHAPITRE 1
libres NO• sont plus nocifs pour l'ozone : c'est notamment le cas lorsqu'ils se forment
en très grande quantité suite à des bombardements solaires de protons mais, ils ne
proviennent alors plus de l'oxyde nitreux. (Graedel et Crutzen, 1992). Les autres
sources de NO dans la haute troposphère et la basse stratosphère sont les rejets directs
à partir d'avions, d'explosions nucléaires, …
I.3. Pertes de fertilisants azotés en agriculture
L’augmentation de la teneur de l’atmosphère en protoxyde d’azote (N2O) est à mettre
en relation avec l’intensification de l’agriculture et l’utilisation de fertilisants azotés (Eichner,
1990; Beauchamp, 1997). Le N2O émis par les sols constitue ainsi une perte d’azote pour les
cultures, mais la perte totale d'azote est généralement beaucoup plus conséquente que la seule
perte en N2O. D'une part, le rapport N2O/(N2O+N2) des produits terminaux de la
dénitrification peut prendre des valeurs très variables comprises entre 0 et 1 (Granli et
Bockman, 1994) ; d'autre part, il semble que lorsque N2O est émis par nitrification, du NO•
est émis dans les mêmes proportions, voire en quantité plus importante (Williams et al., 1992
et Garrido, 2001). L'estimation moyenne actuellement retenue des émissions de N2O à partir
des sols est Y = 1 + 0.0125X, où X représente la quantité d'azote apporté par les produits
fertilisants (X et Y en kg N/ha; Bouwman, 1996). La contribution directe ou indirecte des
pratiques agricoles est estimée entre 1.8 et 5.3 Tg N2O an-1, et la production totale à 9.5 Tg
N2O an-1 (IPCC, 1995).
II. Processus impliqués dans la production et la consommation de N2O dans
les sols
Les émissions de N2O sont principalement dues à l’activité des micro-organismes
(dénitrification, nitrification, réduction de NO3- en NH4
+), et parfois à la dénitrification
chimique. Les émissions de N2O par réduction microbienne dissimilative de NO3- en NH4
+
semblent négligeables (Knowles, 1982). La dénitrification et la nitrification sont les
principaux processus biologiques impliqués et sont réalisés chacun par des groupes
fonctionnels spécifiques de la microflore du sol.
II.1. La dénitrification
21

CHAPITRE 1
II.1.1. Le processus
La dénitrification est un processus respiratoire microbien au cours duquel des micro-
organismes sont capables de substituer à l’oxygène des formes oxydées de l’azote comme
accepteur terminal d’électrons dans leur chaîne respiratoire. Les oxydes d’azote solubles,
nitrates (NO3-) ou nitrites (NO2
-), sont transformés en composés gazeux : oxyde nitrique
(NO), protoxyde d’azote (N2O) et/ou diazote (N2) selon la chaîne de réactions suivante:
NO3- NO2
- N2O N2
NONitrate réductase N2O réductase
Nitrite réductase
Figure 2: Les étapes de la dénitrification (Hénault, 1995)
Une chaîne respiratoire est un complexe membranaire associant transporteurs d'électrons,
enzymes et transporteurs de protons. Elle permet notamment l'oxydation de composés réduits
(NADH+H+ en NAD+ par exemple) avec la réduction concomitante d'accepteurs terminaux
d'électrons (NO3- en NO2
- par exemple) en combinant à certaines étapes du transfert des
électrons le transport de protons de l'intérieur vers l'extérieur de la cellule. Le retour des
protons dans la cellule peut être associé à la création d'énergie cellulaire sous forme d'ATP. Il
faut distinguer respiration aérobie et respiration anaérobie. L’accepteur final d’électrons est
l’oxygène pour la respiration aérobie. Différents accepteurs d’électrons peuvent être utilisés
pour la respiration anaérobie, tels que NO3-, Mn, Fe, SO4
2-, CO2 (Paccard, 1995). Dans le cas
des micro-organismes dénitrifiants, ces accepteurs sont : NO3-, NO2
-, NO et N2O.
II.1.2. Les micro-organismes dénitrifiants
Les bactéries dénitrifiantes au sens strict sont des bactéries capables de réduire NO3-
ou NO2- en N2O et/ou N2 et qui peuvent utiliser l’énergie libérée au cours de cette réduction
pour se développer (Mahne et Tiedje, 1995). Parmi les micro-organismes hétérotrophes
22

CHAPITRE 1
présents dans les sols cultivés, 1 à 5 % d'entre eux sont des dénitrifiants (Tiedje et al., 1982).
Selon Lensi (1995), les organismes dénitrifiants représentent 10 % des bactéries totales en sol
cultivé et 5 % en pâturage permanent. D’après une étude de Gamble et al. (1977) réalisée sur
19 sols provenant d’écosystèmes variés, les genres majoritaires sont représentés par
Pseudomonas et Alcaligenes. Les bactéries dénitrifiantes sont en majorité hétérotrophes, elles
tirent leur énergie de l'oxydation des matières organiques (organotrophes). Elles peuvent aussi
être autotrophes et oxyder des composés minéraux comme Fe2+ et HS- (chimiolithotrophes).
Toutes les étapes de la dénitrification sont productrices d’énergie sous forme d’ATP. Toutes
les bactéries dénitrifiantes sont des bactéries aérobies pouvant s’adapter à une respiration sur
NO3-, NO2
- ou sur N2O quand le milieu devient pauvre en O2 (on parle de bactéries aérobies
facultatives). Les 2/3 de la microflore réduisent les NO3- en NO2
-, mais seulement un faible
pourcentage semble capable de réaliser toute la chaîne de réactions (Germon et Hénault,
1994). Si le nombre de bactéries dénitrifiantes ne reflète pas l’activité dénitrifiante (Parson et
al., 1991), la dynamique de ces populations constitue sans doute un élément essentiel pour
expliquer les émissions de N2O par les sols (Granli et Bockman, 1994). Les micro-organismes
du sol s’adaptent aux conditions environnementales et les individus d’une même espèce qui se
développent dans différents environnements peuvent différer en phénotype (ensemble des
caractères morphologiques et physiologiques visibles), dû aux différences génétiques ou aux
effets environnementaux sur les phénotypes (Bergwall, 1999). On parle alors de plasticité
phénotypique, c’est-à-dire de capacité d’un organisme à produire différents phénotypes en
conditions environnementales variables (Pigliucci, 1996). On peut citer l'adaptation à une
concentration variable en NO3- du sol ; pour des concentrations élevées, la plasticité
phénotypique est telle qu’elle élargit la capacité compétitive des dénitrifiants au-delà des
conditions d’habitat rencontrées (Bergwall, 1999). L’adaptation à un milieu plus ou moins
riche en NO3- se fait après un temps de latence plus ou moins long .
II.1.3. Les enzymes de la dénitrification
Chacune des étapes de la chaîne de dénitrification est catalysée par une enzyme
spécifique. Certaines bactéries ne possèdent pas la totalité des enzymes et par conséquent,
elles ne peuvent réaliser qu’une seule partie de la chaîne de dénitrification.
Deux principaux types de nitrate réductase ont été distinguées : la nitrate réductase
assimilatrice et dissimilatrice. Plusieurs nitrate réductases dissimilatrices ont été mises en
évidence: deux sont des enzymes membranaires et sont inhibées par l’oxygène, une autre est
23

CHAPITRE 1
périplasmique et peut fonctionner en présence d’oxygène dès qu'il y a du NO3-. La synthèse
de NO3- réductase est régulée par des protéines qui ont pour rôle de réguler certaines fonctions
bactériennes en fonction de la pression partielle en oxygène. Elles sont responsables en
anaérobiose de répressions et d’inductions selon leur état d’oxydation (Unden et Schirawski,
1997).
La N2O réductase (N2OR) est une enzyme périplasmique soluble; sa complexité peut être due
à la possibilité d’une compétition entre NO3- et N2O comme accepteurs d’électrons (Cho et
Sakdinan, 1978). Le Cu est nécessaire pour la N2O réductase (Zumft, 1997) et le Fe pour les
autres porteurs d’électrons. Les N2OR sont inhibées par le dithionite, le CO et le C2H2
(Paccard, 1995). Otte et al. (1996) ont directement observé une soudaine et considérable
augmentation de la concentration de N2O réductase après environ 25h. Les NO3- et NO2
-
réductases sont synthétisées en conditions aérobies (Patureau et al., 1996), alors que la
synthèse de la N2O réductase commence seulement 16 à 33 h après disparition du O2
(Firestone et Tiedje, 1979; MacConnaughey et al., 1985; Dendooven et Anderson, 1994).
II.2. La nitrification
II.2.1. Le processus
La nitrification est due à des bactéries oxydant NH4+ en NO2
- (nitritation) puis en NO3-
(nitratation) en conditions aérobies. La nitrification peut être autotrophe ou hétérotrophe.
a. La nitrification hétérotrophe est réalisée par une microflore qui se développe sur des
substrats carbonés organiques. Elle se limite principalement aux sols forestiers et aux
milieux à faible pH et à température élevée. Elle est moins active que la nitrification
autotrophe.
b. La nitrification autotrophe est le processus dominant en sol cultivé. En présence d’une
source minérale de carbone, CO2 ou bicarbonate, l’ammonium est oxydé successivement
en hydroxylamine (NH2OH), nitrite et nitrate. Ce processus fait intervenir des
transporteurs d’électrons tels que NAD et FAD. Chaque étape est catalysée par un
système enzymatique différent.
II.1.2. Les micro-organismes nitrifiants
24
CHAPITRE 1
Les nitrifiants hétérotrophes, largement représentés chez les champignons (ex: Aspergillus
flavus, les bactéries et les actinomycètes, sont capables de réaliser la nitrification en culture
pure à partir de sources d’azote organique ou ammoniacal (Killham, 1986). Toutefois,
d’autres travaux sont nécessaires pour estimer l’importance de la nitrification hétérotrophe
dans les sols.
Les nitrifiants autotrophes sont des bactéries nitrifiantes classées dans la famille des
Nitrobacteraceae (Watson, 1971 ; Bock et al., 1986). Les bactéries oxydant l’ammonium en
nitrite s’organisent en 5 genres : Nitrosomonas, Nitrosospira, Nitrosococcus, Nitrosolobus et
Nitrosovibrio. Les bactéries oxydant les nitrites en nitrates s’organisent en 4 genres :
Nitrobacter, Nitrococcus, Nitrospira et Nitrospina.
L’ammoniac mono-oxygénase (AMO) est une enzyme membranaire dont la structure n’est
pas encore clairement identifiée. Des études ont montré une analogie de structure entre
l’AMO de N. europaea et de Paracoccus dénitrificans (nitrifiant hétérotrophe). L’AMO
présente la capacité d’hydroxyler une large gamme de substrats hydrocarbonés; elle est
irréversiblement inhibée par l’acétylène (Hommes et al., 1998).
II.1.5. Les hypothèses de formation de N2O liées à la nitrification
Plusieurs travaux ont mis en évidence la production de N2O par nitrification (Blackmer et al.,
1980 ; Stevens et Laughlin, 1998). Plusieurs hypothèses ont été émises pour expliquer
l’origine de ces émissions :
H1) Une fraction du NH4+ oxydé est déviée vers la production de N2O durant la nitrification,
avec plusieurs réactions intermédiaires. Selon Conrad (1990) cette formation serait la
conséquence de la transformation d’un composé intermédiaire formé au cours de
l’oxydation de l’hydroxylamine en nitrite, identifié comme étant le nitroxyl (HNO). Selon
Parton et al. (1996), l’oxydation du nitroxyl pourrait également conduire à la formation
d’un autre composé inconnu qui serait ensuite oxydé en nitrite. Cette hypothèse est prise
en compte dans le modèle NGAS de Parton et al. (1996) et des autres modèles (Linn et
Doran, 1984; Davidson, 1993).
H2) La présence d’un système enzymatique sur Nitrosomonas europaea réduit NO2- en N2O
durant l’oxydation de carbone en anaérobiose (Ritchie et Nicholas, 1972). L’effet de la
pression partielle de O2 a été mis en évidence soit directement en faisant varier la
25

CHAPITRE 1
pression partielle en O2 (Bollmann et Conrad, 1998), soit indirectement en faisant varier
l’humidité du sol (Zanner et Bloom, 1995); il est pris en compte dans le modèle de Grant
(1995).
H3) L’oxydation partielle de NH4+ en NO2
- en aérobiose est suivie d'une diffusion du NO2-
vers les sites anoxiques, puis d'une réduction en N2O par dénitrification. Poth et Focht
(1985) ont conclu que le processus de réduction de NO2- en N2O par N. europaea
correspond à la définition de la dénitrification. La production de N2O par nitrification est
non corrélée avec l’addition de nitrate mais corrélée avec l’addition d’ammonium, cela
peut s’expliquer par l’utilisation de l’ammonium comme source d’électrons et par
l’absence de l’activité du nitrate réductase dans N. europaea. Cette hypothèse est prise en
compte dans quelques modèles (Poth et Focht, 1985).
N2
NO N2O
DénitrificationNH +4
NO N2O
NO -3Nitrification
Figure 3: Schéma conceptuel « hole in the pipe » (Firestone et Davidson, 1989)
II. La régulation des émissions de N2O dans les sols
La compréhension et la description des émissions de N2O passe par la prise en compte
des facteurs intervenant sur la nitrification et la dénitrification. Deux types de difficultés
doivent être surmontées dans ce cadre :
- la prise en compte des interactions entre facteurs du milieu qui font que l'effet d'un
facteur ne peut pas être décrit indépendamment de l'effet d'autres facteurs: citons les
interactions entre les effets de la teneur en eau et de la température, ou entre la
structure et la teneur en eau (Renault et Sierra, 1994) ;
26

CHAPITRE 1
- la contribution en proportion variable des deux processus et la consommation de N2O
par l'un des processus (dénitrification); celle-ci peut être du même ordre de grandeur
que la production brute de N2O.
L’échelle millimétrique adoptée par certains auteurs pour étudier et décrire les émissions de
N2O peut se justifier par le fait que les conditions expérimentées par les organismes du sol
peuvent être très différentes des mesures globales faites sur des blocs de sol (Parkin, 1987).
Ainsi la concentration en O2 peut passer de la teneur atmosphérique à une valeur nulle sur une
distance de quelques millimètres dans la motte de sol (Sextone et al., 1985; Sierra et al.,
1995), et même sur une distance inférieure à 1 mm au voisinage de la matière organique
particulaire (Parkin, 1987; Parry et al., 2000) ou dans la rhizosphère (Bidel et al., 2000). Ce
type d'échelle peut faciliter la prise en compte explicite des interactions entre facteurs du
milieu.
27

CHAPITRE 1
Figure 4: Les facteurs de contrôle de la dénitrification dans les sols (Robertson, 1989)
28

CHAPITRE 1
Figure 5: Les facteurs de contrôle de la nitrification dans les sols (Robertson, 1989)
29

CHAPITRE 1
III.1. La teneur en eau
La teneur en eau affecte différemment la nitrification et la dénitrification, surtout au
voisinage de la saturation en eau. De fortes corrélations ont été observées entre le taux de
dénitrification et la teneur en eau du sol (Parson, 1991; Mosier et al., 1986; Rolston et al.,
1984; Grundman et Rolston, 1987). Les auteurs qui ont tenté de décrire les effets de
l'humidité indépendamment des effets d’autres facteurs ont établi un seuil minimum de taux
de saturation en eau de la porosité (WFPS = water filled pore space) au delà duquel la
dénitrification peut se produire. Ce seuil est égal à 0.6 selon Grundman et Rolston (1987) et
Terry et al. (1981) ou 0.8 pour Rolston et al. (1984). La dénitrification croît
exponentiellement au delà de ce seuil jusqu’à la saturation du sol (Terry et al., 1981).
D'autres auteurs ayant une approche plus mécaniste des processus montrent que le WFPS
minimum et la relation WFPS - dénitrification varient en fonction de plusieurs facteurs, tels
que la structure du sol (densité apparente et granulométrie de motte) et la température
(Renault et Sierra, 1994). Le rapport N2O/(N2O+N2) des produits terminaux de la
dénitrification diminue avec une augmentation de la teneur en eau du sol (Terry et al, 1981;
Weir et al , 1993). Linn et Doran (1984) supposent que la nitrification est active pour WFPS
compris entre 10 et 80% avec un maximum d’activité à 60%. Ces auteurs représentent leurs
résultats par la figure suivante :
Figure 6 : Effet du taux de saturation sur l'intensité relative des processus (Linn et Doran,
1984)
30

CHAPITRE 1
La teneur en eau du sol influence les émissions de N2O par son action sur l’activité des
microflores impliquées, sur la dissolution des substrats des réactions et sur la diffusion des
gaz dans les sols, en particulier sur la transport d'oxygène. Les événements pluvieux
importants ou l'irrigation peuvent induire des pics de N2O très importants (Sextone et al.,
1985).
III.2. L’aération du sol
Le sol est un milieu hétérogène où peuvent exister des zones aérobies et anaérobies. La
dénitrification apparaît à de faibles teneurs en O2 (Jambert, 1995; Granli et Bockman, 1994).
Le rapport N2O/(N2O+N2) tend à augmenter lorsque la concentration en O2 diminue. La N2O-
réductase semble plus sensible à la teneur en O2 que d’autres enzymes de la dénitrification
(Betlach et Tiedje, 1981). Des sites anoxiques peuvent exister dans un sol présentant de
bonnes conditions d’aération. Ils apparaissent au cœur des agrégats (Sextone et al, 1985,
Sierra et al., 1995), au voisinage des matières organiques particulaires en décomposition
(Parkin, 1987 ; Parry et al., 2000) et dans la rhizosphère (Bidel et al., 2000). La taille de ces
sites joue sur l’importance de la dénitrification et sur le rapport N2O/(N2O+N2) : plus le site
est petit, plus le N2O pourra atteindre rapidement les zones aérées sans être réduit (Lafolie et
al., 2001).
La dénitrification a longtemps été considérée comme exclusivement anaérobie, en supposant
que les enzymes de la dénitrification sont inhibées par les environnements oxiques. Il semble
maintenant qu'elle puisse apparaître aussi en aérobiose. Cette activité est attribuée à
l’existence d’une NO3- réductase distincte (appelée Nap), localisée dans l’espace
périplasmique des dénitrifiants gram -, alors que le site actif de la membrane liée à la NO3-
réductase (Nar) est située dans le cytoplasme (Bell, 1990).
Tiedje (1988) a établi un schéma représentant les effets de la concentration en O2 sur les
étapes de la dénitrification:
31

CHAPITRE 1
Figure 7 : Effets de la concentration en O2 sur les étapes de la dénitrification (Tiedje, 1988)
Contrairement à la dénitrification, la nitrification est un processus aérobie qui requiert de
l'oxygène pour l’activation de l'ammonium oxygénase (Wood, 1987). La vitesse de
nitrification dépend de la pression partielle en O2 (Bollmann et Conrad, 1998). Une
diminution de l’aération du sol s'accompagne d'une augmentation de la pression partielle de
CO2, ce qui affecte directement ou indirectement (via les variations de pH) les nitrifiants
autotrophes (Grant, 1993; Pennington et Ellis, 1993). Les émissions de N2O par nitrification
augmentent lorsque la pression partielle en O2 diminue (Goreau et al., 1980). Le rendement de
production en N2O (rapport entre la production de N2O et la quantité de N nitrifié) varie
beaucoup selon les auteurs: 0.09 à 0.28% (Breitenbeck et al., 1980), 0.5 à 2% (Bolle, 1986),
0.02% (Tortoso et Hutchinson, 1990), 0.03 à 1% (Garrido, 2001).
III.3. La disponibilité en azote minéral
La teneur et la forme de l’azote minéral contenu dans le sol exercent un effet important sur
la nature et l’intensité des émissions de N2O. Les bactéries dénitrifiantes ont la capacité
d’utiliser NO3-, NO2
- et/ou N2O comme accepteurs d’électrons en absence de O2. La
dénitrification est généralement décrite par une cinétique de Michaelis-Menten, qui se
caractérise par une dépendance de la vitesse aux faibles concentrations en NO3- et une
indépendance aux plus fortes teneurs (Betlach et Tiedje, 1981; Myrold et Tiedje, 1985 ; Maag
et al., 1997). Des constantes de Michaelis de dénitrification ont ainsi été déterminées sur
32

CHAPITRE 1
différents sols. Les principales incertitudes qui restent sur le processus de réduction du NO3
-
en N2O sont les suivantes:
i) l’existence ou non d’un effet inhibiteur par les fortes concentrations en NO3-
(Blackmer et Bremner 1978, Nakajima et al., 1984; Lalisse-Grundmann et al., 1988),
ii) la valeur de la constante de Michaelis décrivant l’affinité microbienne pour NO3-,
iii) l'existence ou non d'une compétition entre NO3- and N2O pour les dénitrifiants
pouvant réduire ces 2 formes.
Blackmer et Bremner (1979) considèrent que les faibles concentrations en NO3- augmentent la
réduction de N2O. Les fortes concentrations en NO3- ou NO2
- diminuent généralement la
réduction de N2O et augmentent le rapport N2O/(N2O+N2) (Guthrie et Duxbury, 1978;
Firestone et al., 1979; Terry et Tate, 1980; Letey et al., 1980; Gaskell et al., 1981; Nömmik et
al., 1984; Weir et al., 1993; Luo et al., 1996). Plusieurs hypothèses sont proposées pour
expliquer ces observations:
i) l'induction de la N2O-réductase par le NO3- à faible concentration (Soohoo et
Hollocher, 1990),
ii) l'inhibition par NO2- qui s’accumule durant la réduction de NO3
- (Shimuzu et al.,
1978; Firestone et al., 1979; McKenney et al., 1982),
iii) l'inhibition directe par NO3- (Gaskell et al., 1981),
iv) la compétition entre NO3- et N2O comme accepteurs d’électrons (Cho et Sakdinan,
1978).
La compétition entre NO3- et N2O comme accepteurs d’électrons pourrait varier dans le temps
si les N2O réducteurs s'adaptent aux fortes concentrations en NO3- (hypothèse suggérée par
Terry et Tate, 1980; Guthrie et Duxbury, 1978). Il est donc important de prendre en compte la
variation temporelle de la concentration en oxyde d'azote réductase et les dynamiques
microbiennes, en particulier les populations dénitrifiantes et N2O réductrices (Baumann et al.,
1996; Otte et al., 1996).
L’apport d’engrais ammoniacaux peut induire une production de N2O par nitrification.
Peu d’études ont été publiées sur l’effet de la concentration en NH4+ sur la nitrification et sur
les émissions associées de N2O. Aux faibles concentrations, le taux de nitrification est
proportionnel au taux de minéralisation (Bremner et Blackmer, 1981 ; Lensi et al., 1992),
alors qu’il dépend de NH4+ aux fortes concentrations (Stevens et al., 1997). Aulakh et al.
(1984) ont estimé que les pertes de fertilisants sous forme N2O représentaient 0.1 à 0.5 % de
l’apport de N-NH4+. Les émissions de N2O par nitrification représentent souvent moins de 1%
33
CHAPITRE 1
du NH4
+ nitrifié dans les sols (Bremner et Blackmer, 1978, Aulakh et al.,1984; Klemedtsson
et al., 1988). Parton et al. (1996) ont suggéré que ces émissions ne sont influencées que par
des fortes concentrations en NH4+, supérieures à 3 µg N g-1.
III.4. La disponibilité en carbone et matière organique
Le métabolisme des bactéries hétérotrophes du sol est souvent limité par le carbone
biodisponible dans le sol (Starr, 1993). La disponibilité en carbone dans le sol agit très
différemment sur la dénitrification et la nitrification.
En ce qui concerne la dénitrification, le carbone organique joue un double rôle: un rôle
indirect en stimulant la dégradation de la matière organique, donc la respiration microbienne
et la création de sites anaérobies (Parkin, 1987); un rôle direct, en tant que donneur
d’électrons pour les bactéries dénitrifiantes. La dénitrification peut être fortement corrélée à la
quantité de carbone organique total ou soluble et surtout au carbone facilement minéralisable
(Burford et Bremner, 1975; DeCatanzaro, 1985; Weier et al., 1993). Le rapport
N2O/(N2O+N2) diminue avec l’accroissement de la source carbonée. Dans les sols, Parkin
(1987) décrit la présence de sites à fort potentiel de dénitrification, qui correspondent à des
zones de forte décomposition de la matière organique (hot spots). La matière organique
rapidement décomposable présente sans doute une distribution spatiale très hétérogène; ceci
expliquerait la variabilité spatiale de la dénitrification.
En ce qui concerne la nitrification, le carbone assimilable exerce un effet indirect en
jouant sur la consommation en O2 et sur la concentration en NH4+ du sol par le biais des
processus d’organisation ou de minéralisation d’azote. En effet, un apport de matière
organique avec un rapport C/N élevé (type pailles de céréales) stimule l’organisation des ions
NH4+ ce qui réduit la vitesse de nitrification, par compétition pour le substrat. Inversement, la
minéralisation de la matière organique humifiée, à C/N faible, libère de l’ammonium et
stimule la nitrification. Bremner et Blackmer (1981) ont montré, dans le cas d’un sol "aéré",
que la vitesse de nitrification, le ratio N2O/NO3- et l’intensité des émissions de N2O
augmentent lorsque le ratio C/N de la matière organique du sol diminue.
III.5. La texture et la structure du sol
34

CHAPITRE 1
La texture du sol influence aussi les activités microbiennes régulant le devenir de C et
N dans le sol. La consommation de C et N par la biomasse microbienne est plus rapide dans
les sols à texture grossière dont la capacité de protection physique de la matière organique est
faible (Hassink, 1994; Sørensen, 1995). Les sols de texture grossière montrent des émissions
de N2O plus importantes que les sols à texture fine (Bouwman , 1996). En fait, il existe des
différences de configuration enzymatique ou d’accessibilité du substrat sur les sites actifs
entre les fractions du sol (Rojo, 1990). Si la biomasse microbienne globale est influencée par
la texture du sol, il est probable que les micro-organismes dénitrifiants le soient également.
C’est ce qu’a montré Lensi (1995) en caractérisant l'activité de différentes fractions
granulométriques du sol: la capacité dénitrifiante varie selon la fraction granulométrique.
La structure du sol est également un facteur très important, et elle est fortement
modifiée par le travail du sol. Le travail du sol agit sur la structure qui régule le
fonctionnement hydrique et le degré d’aération du sol et affecte la vitesse de dégradation de la
matière organique (Aulakh et al., 1992). En modifiant la taille des agrégats et des mottes
(Cambardella, 1993; Alvarez, 1998a), il modifie les conditions de transfert de l’oxygène. Le
volume anoxique augmente avec la taille des mottes car l’oxygène a plus de difficulté à
diffuser et donc à répondre à une demande respiratoire au sein d’un agrégat volumineux. Un
gros agrégat a plus de chance d'avoir un centre anoxique important qu’un petit agrégat. Pour
les mêmes raisons, le N2O produit dans le cœur anoxique aura quant à lui, plus de probabilité
d’être réduit en N2 avant d’atteindre les régions oxygénées de l’agrégat. Plus le sol est
compacté, plus la taille de ses agrégats augmente, plus sa porosité est faible, ce qui favorise la
dénitrification (Bakken et al., 1987).
III.5. La température
Lorsque la température augmente, les émissions globales de N2O augmentent (Smith et
Arah, 1990), tandis que le rapport N2O/(N2O+N2) tend à diminuer (Granli et Bockman, 1994).
L'augmentation de température stimule la croissance bactérienne et son activité (Smith et
Arah, 1990), d’où une respiration accrue pouvant entraîner la formation de zones anoxiques.
Elle provoque aussi un accroissement de la diffusion et une diminution de la solubilité des
gaz. La dénitrification se produit dans une gamme de température allant de 10 à 75-85°C,
35

CHAPITRE 1
avec un optimum situé entre 30 et 67°C (Smith et Arah, 1990; Granli et Bockman, 1994). Les
températures optimales pour la nitrification se situent entre 25 et 35°C (Haynes, 1986). Le
N2O produit par nitrification augmente avec la température (Yoshida et Alexander, 1970 ;
Bremner et Blackmer, 1981).
III.6. Le pH
Le pH du sol varie sous l'effet de plusieurs processus. La baisse de pH est en partie
due à la production de CO2 et d’acides gras volatils (Stumm et Morgan, 1996, Dassonville et
Renault, 2002). Le pH peut augmenter sous l'effet de certains processus biologiques
consommateurs de H+ tels que la dénitrification (Mc Inerney, 1988). L’accroissement de pH
observé ultérieurement résulte partiellement de la consommation des acides gras volatils et de
la disparition du CO2 avec la méthanogénèse (Stams, 1994). L’acidification du milieu peut
modifier les équilibres chimiques en solution concernant les hydroxydes, les carbonates, les
sulfures, les phosphates et les silicates et ainsi aboutir à la dissolution ou la précipitation des
espèces solides et à la sorption ou la désorption des composés comme l’aluminium, le fer, le
manganèse, et la calcite (Stumm et Morgan, 1996). Ces mêmes phénomènes sont impliqués
dans le pouvoir tampon du sol concernant les variations de pH. Dans le cas des milieux
calcaires, l’accroissement de la concentration en CO2 aboutit à la solubilisation de calcite avec
la formation de bicarbonate (Stumm et Morgan, 1996).
Les apports d'engrais peuvent modifier le pH; ainsi les fertilisants à base de NH4+ acidifient le
sol. Le pH du sol peut s’acidifier sous l’effet des eaux de pluie qui se chargent sur leur trajet
en divers gaz de l’atmosphère (CO2, acide sulfurique, acide nitrique et acides organiques,
notamment acide formique et acide acétique).
Un pH neutre ou supérieur à 7 semble favorable aux activités microbiennes nitrifiantes
et dénitrifiantes. Le pH optimal d’une culture bactérienne dénitrifiante se situe à la neutralité.
La N2O réductase semble particulièrement sensible aux faibles pH. Elle est inhibée pour un
pH inférieur à 5 (Knowles, 1982). Cela conduit à une augmentation des émissions de N2O par
dénitrification aux faibles pH, même si l’activité dénitrifiante est ralentie. En règle générale,
les vitesses de dénitrification diminuent dans les sols acides et le rapport N2O/(N2O+N2)
augmente simultanément avec la diminution du pH (Koskinen et Keeney, 1982).
36

CHAPITRE 1
La vitesse de nitrification est optimale à un pH de 7.5 à 8 (Bock et al., 1986).
Toutefois, la nitrification peut se produire dans les milieux plus acides. Les émissions de N2O
par les sols en conditions aérées augmentent lorsque le pH passe de 5.9 à 8.3 (Bremner et
Blackmer, 1981).
Peu d’études ont été réalisées expliquant le mécanisme d’action du pH sur les
émissions de N2O mais beaucoup d’hypothèses ont été émises. La diminution de l’activité
dénitrifiante serait due à un effet direct des ions H+ ou à un effet indirect de l’acidité
provoquant des carences en nutriments (Koskinen et Keeney, 1982; Aulakh et al, 1992) ou
des toxicités Al, Mn, NO2- (Firestone et al., 1982).
III. Modélisation des émissions de N2O dans les sols
Différents modèles de simulation des émissions de N2O ont été proposés. Ces modèles
permettent notamment :
- de tester des hypothèses sur les processus, en analysant les écarts entre données
expérimentales et données simulées ;
- de disposer d'outils d'interpolation plus élaborés que des outils purement statistiques
pour passer de données acquises ponctuellement à des données distribuées dans l'espace
et le temps;
- de réaliser des études de scénarios pour évaluer le poids de variables ou de leurs
interactions dans les émissions de N2O.
Les modèles de simulation de la dénitrification et des émissions de N2O peuvent se classer en
différents types : stochastiques, empiriques et mécanistes.
IV.1. Les modèles stochastiques
Un modèle stochastique tient compte de la variabilité spatiale des processus étudiés.
Ainsi Parkin (1987) considère l'hétérogénéité spatiale de la matière organique pour simuler la
variabilité spatiale de la dénitrification et notamment le phénomène de "hot spots". Son
modèle suppose une loi de distribution log-normale pour l'activité dénitrifiante. Il obtient une
bonne corrélation entre expérience et modèle. Par ailleurs, Parkin et al. (1987) ont étudié
l'influence de la taille de l'échantillon sur la variabilité du taux de dénitrification. Récemment,
37

CHAPITRE 1
Parry et al. (2000) ont utilisé un modèle stochastique pour simuler la variabilité de la
contribution des MOP au taux de dénitrification; cette contribution dépend en effet des
activités dénitrifiantes et respiratoires et de la structure des mottes.
IV.2. Les modèles empiriques
Ces modèles utilisent des fonctions empiriques établies à de grandes échelles d'espace
et de temps (parcelle agricole, année culturale), dans des conditions d'expérimentation
forcément restreintes (compte tenu de la lourdeur des expérimentations au champ). Ces
modèles ne cherchent pas à décrire les processus élémentaires de la dénitrification mais à
rendre compte de cette dernière en considérant les principaux facteurs (directs ou indirects)
qui l'affectent. La dénitrification effective est supposée être le produit de n fonctions décrivant
l'effet individuel de chacun des n facteurs (teneur en eau, NO3-, matière organique,
température, pH, ...). Ces modèles prennent en compte les effets moyens de ces paramètres
mais négligent de ce fait leurs distributions spatiales. Ils peuvent être appliqués à de grandes
échelles d'espace et de temps (parcelle agricole, année culturale), mais risquent de ne pas être
généralisables à d’autres situations que celles sur lesquelles ils ont été calibrés. Le modèle de
Rolston et al. (1984) décrit le taux de dénitrification comme une multiplication d'une fonction
teneur en eau, d'une fonction température et d'une fonction concentration en NO3-. Cette
dernière est représentée par une cinétique d'ordre 0 ou 1. Hénault et Germon (2000) ont
amélioré ce modèle en y ajoutant une fonction liée à la vitesse de dénitrification décrite par
une cinétique de Michaelis-Menten. Cette fonction prend en compte la disponibilité du
carbone. Parton et al. (1988, 1996) ont développé un modèle prédictif des émissions de N2O
par les sols (NGAS). Ce modèle tient compte de la texture du sol, de la température, de la
teneur en eau du sol, de la disponibilité en azote et de la respiration du sol. Un autre modèle
(CASA) a été conçu pour simuler la distribution mondiale des émissions de N2O (Potter et al.,
1996). Il associe un modèle de production végétale à un modèle de fonctionnement du sol
(physique et biologique) et tient compte des conditions climatiques. Concernant les émissions
de N2O, le modèle ne fait pas la distinction entre nitrification et dénitrification. Il suppose que
la somme des composés azotés gazeux produits (N2+N2O+NO) correspond à 2 % de l’azote
minéralisé, quelles que soient les conditions du milieu. Le modèle NLEAP-N2O (Xu et al.,
1998) a été conçu pour étudier l’effet des pratiques agricoles (travail du sol, irrigation et
fertilisation) sur les émissions de N2O. Il est basé sur une description empirique des effets des
38

CHAPITRE 1
facteurs du milieu. Les émissions sont la somme des émissions associées à la nitrification et
des émissions associées à la dénitrification. Les émissions de N2O par nitrification sont
supposées dépendre de l’importance de la nitrification et des conditions du milieu incluant les
effets de la température et la teneur en eau.
IV.3. Les modèles mécanistes
Les modèles mécanistes reposent sur une description fine dans l'espace et le temps de
tous les phénomènes impliqués directement ou indirectement dans les émissions de N2O. Un
modèle ne pouvant être qu'une représentation simplifiée de la réalité, plusieurs hypothèses
caractérisant le milieu et les mécanismes physiques, chimiques et biologiques sont posées.
Ces modèles mécanistes donnent des résultats pertinents sur des échantillons de sol de faible
taille mais nécessitent un travail très important d'acquisition des paramètres. Plusieurs
hypothèses caractérisant le milieu physique du sol ont été proposées. Les premiers modèles
supposaient le sol comme un milieu homogène pour les transferts. Le transport de gaz était
simulé sur la seule dimension verticale (Van Bavel, 1951). Plus récemment, le milieu a été
considéré comme agrégé et hétérogène pour les transferts de O2 (Currie, 1961; Leffelaar,
1979; Arah et Smith, 1989; Renault et Sierra, 1994; Renault et Stengel, 1994). Ce type de
milieu permet de décrire 2 modes de transferts : un transfert rapide dans la porosité inter-
agrégats et un transfert lent au sein des agrégats. Dans l’espace poral inter-agrégats, l’eau
apparaît d’abord en ménisques autour des agrégats, ce qui réduit la surface où les transferts de
O2 sont possibles. Les autres modèles se différencient par des hypothèses sur la forme des
agrégats: type parallélépipède (Mc Connaughey et Bouldin, 1985) ou cylindrique (Leffelaar et
Wessel, 1988). Il existe un effet de la structure du sol qui s’exerce principalement par
l’intermédiaire de la distribution granulométrique des agrégats (Renault et Stengel, 1994). Un
milieu agrégé pose des problèmes pour expliquer l'anoxie en raison de la distribution des
pores. C'est pourquoi quelques modèles considèrent le sol comme un milieu mal structuré et
hétérogène pour les transferts de O2 à l'aide d'une distribution aléatoire de pores (Arah, 1988).
La loi de Fick est généralement utilisée pour caractériser les transferts par diffusion, la
convection n'étant généralement pas prise en compte. La respiration est décrite par une
cinétique de Michaelis Menten (Greenwood et Berry, 1962; Leffelaar et Wessel, 1988; Grant,
1991). Sierra et Renault (1995) a essayé de caractériser l'effet inhibiteur de CO2 sur la
respiration. Il trouve une inhibition de type compétitive sur des agrégats de sol remaniés. Sur
39

CHAPITRE 1
le même sol non remanié, il trouve une activation aux faibles teneurs en CO2 et une inhibition
aux fortes teneurs. La dénitrification peut également être décrite par une loi de Michaelis
Menten faisant intervenir une constante traduisant l’affinité du milieu pour NO3- (Maag et al.,
1997). Cette constante tend à croître avec l’échelle d’observation, ce qui indique qu’on passe
d’une concentration réelle au niveau des micro-organismes dénitrifiants à une concentration
moyenne généralement supérieure au niveau d’un volume de sol (Murray et al., 1989).
Leffelaar et Wessel (1988) prennent en considération la croissance bactérienne et la
dépendance à la concentration en substrat disponible. Arah et Smith (1989) ont utilisé une
fonction log-normale pour décrire la respiration maximale des agrégats pour tenir compte de
la variabilité de la respiration entre agrégats. Li et al. (1996) ont proposé le modèle DNDC
pour simuler la distribution régionale des émissions de N2O et pour étudier les rôles respectifs
de différents facteurs du milieu sur ces émissions. Dans ce modèle, un module d’estimation
des émissions de N2O par nitrification est couplé à la fois à un module prédictif de la
décomposition de la matière organique du sol et à un module d’estimation des émissions de
N2O par dénitrification. Le modèle DNDC et le modèle ECOSYS (Grant, 1991, 1993a, 1995),
décrivent très finement les processus microbiens du sol. Chaque transformation associée à la
dénitrification dépend (i) des disponibilités en accepteurs et en donneurs d’électrons, (ii) de la
taille des communautés microbiennes réalisant les différentes transformations et (iii) des
conditions du milieu (température, pH, …). La taille des communautés microbiennes (NO3-
réducteurs, NO2- réducteurs et N2O réducteurs) résulte des processus simultanés de
croissance, de maintenance et de mortalité. La mortalité est supposée proportionnelle à la
taille de la population. La croissance microbienne tient compte de la disponibilité en NO3- ,
NO2- ou N2O, et de la matière organique soluble.
V- Conclusion
Au travers de cette synthèse bibliographique, nous avons rappelé les enjeux
agronomiques et environnementaux associés aux émissions de N2O. Jusqu’à présent, les
études sur les émissions de N2O se sont surtout concentré sur le processus de dénitrification
considéré comme le principal responsable de ces émissions. Nous avons vu que peu de
travaux relatifs à la dénitrification décrivaient simultanément les processus de production et
de réduction de N2O, alors que ces processus risquent de répondre différemment aux
conditions du milieu. L’objectif de la première partie de notre travail sera de caractériser et de
40

CHAPITRE 1
modéliser la production de N2O, sa consommation et leurs interactions. D’autre part, plusieurs
modèles ont été proposés pour décrire la respiration, l’anaérobiose et la dénitrification.
Toutefois, aucun de ces modèles ne prend en compte les variations des activités respiratoire et
dénitrifiante, alors que l'on sait que ces activités puissent varier au cours du temps, en
conséquence des dynamiques microbiennes, des inductions et activations des enzymes. La
prise en compte de ces variations sera au cœur de la deuxième et la troisième parties de notre
travail. Enfin des travaux récents ont montré que la nitrification peut être une source
importante des émissions de N2O. Plusieurs facteurs pouvant influencer ces émissions ont été
étudiés, mais peu d’études ont caractérisé l’effet direct de l’oxygène. Ceci a motivé le travail
de la quatrième partie qui traite de l’effet de la pression partielle en O2 sur la nitrification et
les émissions de N2O associées.
41

CHAPITRE 1
Références bibliographiques
Alvarez C. R., Alvarez R., Grigera M. S., Lavado R. S., 1998a. Associations between
organic matter fractions and the active soil biomass. Soil Biol. & Biochem. 30, 767-773.
Arah J. M., 1988. Modelling denitrification in aggregated and structureless soils. In Nitrogen
efficiency in agricultural soils. (D. S. Jenkinson and K. A. Smith, ed.) Elsevier Applied
Science, London, 433-444.
Arah J. M., Smith K. A., 1989. Steady-state denitrification in aggregated soils: A
mathematical model. Journal of Soil Science 40, 139-149.
Aulakh M. S., Rennie D. A., Paul E. A., 1984. The influence of plant residues on
denitrification rates in conventional and zero tilled soils. Soil Science Society of America
Journal 48, 790-794.
Aulakh M. S., Doran, J. W., Mosier A. R., 1992. Soil denitrification significance,
measurement and effects of management. Adv. Soil Sci. 18, 1-57.
Bakken L. R., Boressen T., Njos A., 1987. Effect of soil compaction by tractor traffic on soil
structure, denitrification and yield of wheat. J. Soil. Sci. 38, 541-552.
Baumann Barbara, Snozzi Mario, Zehnder Alexander J.B., Jan Roelof Van Der Meer,
1996. Dynamics of denitrification activity of Paracoccus denitrificans in continuous culture
during aerobic-anaerobic changes. Journal of Bacteriology, 4367-4374.
Beauchamp E. G., 1997. Nitrous oxide emission from agricultural soils. Can. J. Soil Sci. 77,
113-123.
Bell L. C., Richardson D. J., Ferguson S. J.,1990. Periplasmic and membrane bound
respiratory nitrate reductases in Thiosphaera pantotropha. FEBS Lett. 265, 85-87.
Bergwall C., Bengtsson G., 1999. Phenotypic plasticity in groundwater denitrifiers. Oikos
87, 123-128.
Betlach M. R., Tiedje J. M., 1981. Kinetic explanation for accumulation of nitrite, nitric
oxide, and nitrous oxide during bacterial denitrification. Appl. Environ. Microbiol 42, 1074-
1084.
Bidel L., Renault P., Pages L., Riviere L.M., 2000. Mapping meristem respiration of
Prunus persica (L.) Batsch seedlings: potential respiration of the meristems, O2 diffusional
42
CHAPITRE 1
constraints and combined effects on root growth. Journal of Experimental Botany. 51(345),
755-768.
Blackmer A. M., Bremner J. M., 1978. Inhibitory effect of nitrate on reduction of N2O to N2
by soil micro-organisms. Soil Biol. Biochem. 10, 187-191.
Blackmer A. M., Bremner J. M., 1979. Stimulatory effect of nitrate on reduction of N2O to
N2 by soil micro-organisms. Soil Biol. Biochem. 11, 313-315.
Blackmer A. M., Bremner J. M., Schmidt E. L., 1980. Production of nitrous oxide by
ammonia oxidizing chemoautotrophic micro-organisms in soil. Appl. Environ. Microbiol. 40,
1060-1066.
Bock E., Koops H. P., Harms H., 1986. Cell Biology of nitrifying bacteria. In: Prosser, J. J.
(Ed.), Nitrification IRL Press, Oxford, pp. 17-38.
Bolle H. J., Seiler W., Bolin B., 1986. Other greenhouse gases and aerosols. In: Bolin B.,
Jager J., Warrick R. A., Doos B.R. (Eds). The greenhouse effect, climatic change and
ecosystems, Wiley and Sons, New York, pp. 157-203.
Bollmann Annette, Ralf Conrad, 1998. Influence of O2 availability on NO and N2O release
by nitrification and denitrification in soils. Global Change Biology 4, 387-396.
Bouwman A. F., 1996. Direct emission of nitrous oxide from agricultural soils. Nutrient
Cycling in Agrosystems 46, 53-70.
Breitenbeck G. A., Blackmer A. M., Bremner J. M., 1980. Effects of different nitrogen
fertilizers on emission of nitrous oxide from soil. Geophys. Res. Lett. 7, 85-88.
Bremner J. M., Blackmer A. M., 1978. Nitrous oxide: Emission from soils during
nitrification of fertilizer nitrogen. Science 199, 295-296.
Bremner J. M., Blackmer A. M., 1981. Terrestrial nitrification as a source of atmospheric
nitrous oxide. In Denitrification, nitrification and atmospheric nitrous oxide (C. C. Delwiche,
ed.), pp. 151-170. John Wiley & Sons Inc., New York.
Burford J., Bremner J. M., 1975. Relationships between the denitrification capacities of
soils and total water soluble and readily decomposable soil organic matter. Soil Biology and
Biochemistry 11, 261-267.
Cambardella C. A., Elliot E. T., 1992. Particulate organic matter accross a grassland
cultivation sequence. Soil Science Society of America Journal 56, 777-783.
Cho C. M., Sakdinan L., 1978. Mass spectrometric investigation on denitrification. Can. J.
Soil Sci. 58, 443-457.
43

CHAPITRE 1
Conrad R., 1990. Flux of NOx between soil and atmosphere: importance and soil
metabolism. In: Revsbech N.P., Sorensen J., (Ed.). Denitrification in soil and sedimentol.
Plenum Press, New York 1, 105-127.
Currie J. A., 1961. Gaseous diffusion in the aeration of aggregated soils. Soil Science 92,
40-45.
Dassonville F., Renault P., 2002. Interactions between microbial processes and geochemical
transformations under anaerobic conditions: a review. Agronomie 22, 51-68.
Davidson E. A., 1993. Soil water content and the ratio of nitrous oxide to nitric oxide emitted
from soil Biogeochemistry of global change, edited by R. S. Uremland, pp: 369-386,
Chapman and Hall, New York.
DeCatanzaro J. B., Beauchamp E. G., 1985. The effect some carbon substrates on
denitrification rates and carbon utilization in soil. Biol. Fert. Soils 1, 183-187.
Dendooven L., Anderson J. M., 1994. Dynamics of reduction enzymes involved in the
denitrification process in pasture soil. Soil. Biol. Biochem. 26(11), 1501-1506.
Eichner M. J., 1990. Nitrous oxide emissions from fertilized soil. J. Environ. Qual. 19, 272-
280.
Firestone M. K., Tiedje J. M., 1979. Temporal change in nitrous oxide and dinitrogen from
denitrification following onset of anaerobiosis. Applied and Environmental Microbiology, 38,
673-679.
Firestone M. K., 1982. Biological denitrification. In Nitrogen in agricultural soils (F.J.
Stevensen, Ed.), pp. 289-326. Agronomy Monograph, 22, American Society of Agronomy,
Madison, Wisconsin, Wiley, New York.
Firestone M. K., Davidson E. A., 1989. Microbiological basis of NO and N2O production
and consumption in soil. In: Andrea M. O., Schimel D.S., (Ed.), Exchange of trace gases
between terrestrial ecosystems and the atmosphere, J. Wiley and L. Sons, Chichetser, United
Kingdom, pp. 7-21.
Gamble T. N., Betlach H. R., Tiedje J. M., 1977. Numerically dominant denitrifying
bacteria from world soils. Appl. Environ. Microbiol. 33(4), 926-939.
Garrido F., 2001. Les mécanismes de production de d’oxydes d’azote gazeux (N2O et NO)
par les sols en conditions aérées. Thesis, Université Bourgogne, France, 144 p.
Gaskell J. F., Blackmer A. M., Bremner J. M., 1981. Comparison of effects of nitrate,
nitrite and nitric oxide on reduction of nitrous oxide to dinitrogen by soil microorganisms.
Soil Sci. Soc. Am. J. 45, 1124-1127.
44
CHAPITRE 1
Goreau T. J., Kaplan W. A., Wofsy S. C., McElroy M. B., Valois F. W., Watson S. W.,
1980. Production of NO2- and N2O by nitrifying bacteria at reduced concentrations of oxygen.
Appl. Environ. Microbiol. 40, 526-532.
Graedel T. E., Crutzen P. J., 1992. Atmospheric change. An earth system perspective. W.H.
Freeman and Company, New York.
Granli T., Bockman, O. C., 1994. Nitrous oxide from agriculture. Norv. J. Agri. Sci. 12
(supplement),1-125.
Grant R.F., 1991. A technique for estimating denitrification rates at different soil
temperatures, water contents and nitrate concentrations. Soil Science 152, 41-52.
Grant R. F., 1993a. Evolution of nitrous oxide from soil: I. model development. Soil Science
156, 259-265.
Grant R. F., 1995. Mathematical modelling of nitrous oxide evolution during nitrification.
Soil Biology and Biochemistry. 27(9), 1117-1125.
Greenwood D. J., Berry G, 1962. Aerobic respiration in soil crumbs. Nature 195, 161-163.
Grundman G. L., Rolston D. E., 1987. A water function approximation to degree of a
anaerobiosis associated with denitrification. Soil Sci. 144, 437-441.
Guthrie J. M., Duxburry J. M., 1978. Nitrogen mineralization and denitrification in organic
soils. Soil Sci. Soc. Am. J. 42, 908-912.
Hassink J., 1994. Active organic matter fractions and microbial biomass as predictors of N
mineralization. Eur. J. Agron. 3(4), 257-265.
Hénault C., Germon J. C., 1995. Quantification de la dénitrification et des émissions de
protoxyde d'azote (N2O) par les sols. Agronomie 15, 321-355.
Hénault C., Germon J. C., 2000. NEMIS, a predictive model of denitrification on the field
scale. Eur. J. Soil Sci. 51, 257-270.
Hommes N. G., Russel S. A., Bottomley P. J., Arp D. J., 1998. Effects of soil on ammonia,
ethylene, chloroethane and 1,11-trichloroethane oxidation by Nitrosomonas europaea. Appl.
Environ. Microbiol. 64(4), 1372-1378.
IPCC, 1995. Climate change 1994. Report of working groups I and III of the
intergovernmental panel on climate change, Cambridge University Press, UK, 339 p.
IPCC, 1996. Climate change 1995. The science of climate change, contribution of working
group to the second assessment report of the intergovernmental panel on climate change,
Cambridge University Press, UK, 572 p.
45

CHAPITRE 1
Jambert C., 1995. Emissions de composés azotés dans l’atmosphère par des agrosystèmes
fertilisés : Maïsculture dans les landes de Gascogne. Thesis, Université Paul Sabatier,
Toulouse, 111 pp.
Killham K., 1986. Heterotrophic nitrification. In: Prosser, J.I. (Ed.), Nitrification, IRL Press,
pp. 1-16.
Klemedtsson L., Svensson B. H., Rosswall T. , 1988. A method of selective inhibition to
distinguish between nitrification and denitrification as sources of nitrous oxide in soil.
Biology and Fertility of Soils 6, 112-119.
Knowles R., 1982. Denitrification. Microbiol. Rev. 46, 43-70.
Koskinen W. C., Keeney D. R., 1982. Effect of pH on the rate of gaseous products of
denitrification in a silt loam soil. Soil Science Society of America Journal
46(6), 1165-1167.
Kowalchuk George A., John R. Stephen, 2001. Ammonia-Oxidizing bacteria : a model for
molecular microbial ecology. Annu. Rev. Microbiol. 55, 485-529.
Krom M. D., 1980. Spectrometric determination of ammonia: a study of a modified Berthelot
reaction using salicylate and dichloroisocyanurate. The Analyst 105, 305-316.
Lafolie F., Renault P., Hénault C., Sévenier G., 2001. Nitrous oxide emission: A
comparison of field measurements and model predictions. 11th Nitrogen Workshop, Reims,
France.
Lalisse-Grundmann G., Brunel B., Chalamet A., 1988. Denitrification in a cultivated soil:
optimal glucose and nitrate concentrations. Soil Biol. Biochem. 20, 839-844.
Leffelaar P. A., 1979. Simulation of partial anaerobiosis in a model soil in respect to
denitrification. Soil Science 128 (2).
Leffelaar P.A., Wessel W., 1988. Denitrification in a homogeneous closed system:
experiment and simulation. Soil Sci. 146, 335-349.
Lensi R., Domenach A. M., Abbadie L., 1992. Field study of nitrification and denitrification
in a wet Savanna of West Africa (Lamto, Côte d’Ivoire). Plant and Soil 147, 107-113.
Lensi R., Clays-Josserand A., Jocteur Monrozier L., 1995. Denitrifiers and denitrifying
activity in size fractions of a mollisol under permanent pasture and continuous cultivation.
Soil. Biol. Biochem. 27(1), 61-69.
Letey J., Valoras N., Hadas A., Focht D.D., 1980. Effect of air-filled porosity, nitrate
concentration and time on the ratio of N2O/N2 evolution during denitrification. J. Environ.
Qual. 9, 227-231.
46
CHAPITRE 1
Li, C., Narayanan V. R., Harriss C., 1996. Model estimates of nitrous oxide emissions from
agricultural lands in the United States. Global Biogeochemical Cycles 10(2), 297-306.
Linn D. M., Doran J. W., 1984. Effect of water filled pore space on carbon dioxide and
nitrous oxide production in tilled and non tilled soils. Soil Sci. Soc. Am. J. 48, 1267-1272.
Luo J., White R.E, Ball P.R., Tillman R.W., 1996. Measuring denitrification activity in
soils under pasture: optimizing conditions for the short-term denitrification enzymes assay
and effects of soil storage on denitrification activity. Soil Biol. Biochem. 23(3), 409-417.
Maag M., Malionovsky M., Nielsen, S. M., 1997. Kinetics and temperature dependence of
potential denitrification in riparian soils. J. Environ. Qual. 26, 215-223.
MacKay R., Khalil M. A. K., 1991. Theory and Development of a one dimensional time
dependant radiative convective climate model. Chemosphere 22, 383-417.
Mahne I., Tiedje J. M., 1995. Criteria and methodology for identifying respiratory
denitrifiers. Appl. Environ. Microbiol. 61, 1110-1115.
McConnaughey P. K., Bouldin D. R., 1985a. Transient microsite models of denitrification:
I. Model development. Soil Sci. Soc. Am. J. 49, 886-901.
McInerney M. J., 1988. Biology of anaerobic microorganisms. United States of America :
John Wiley & Sons. Anaerobic hydrolysis and fermentation of fats and Proteins, 373-417.
McKenney D. J., Shuttleworth K. F., Vriesacker J. R., Findlay W. I., 1982. Production
and loss of Nitric oxide from denitrification in anaerobic Brookston clay. Appl. Environ.
Microbiol. 43(3), 534-541.
Mosier A. R., 1980. Acetylene inhibition of ammonium oxidation in soil. Soil Biol.&
Biochem. 12, 443-444.
Murray R. E., Parsons L. L., Smith M. S., 1989. Kinetics of nitrate utilization by mixed
populations of denitrifying bacteria. Applied and Environmental Microbiology 55, 717-721.
Myrold D. D., Tiedje, J. M., 1985. Diffusional constraints on denitrification in soil. Soil. Sci.
Soc. Am. J. 49, 651-657.
Nakajima M., Hayamizu T., Nishimufa H., 1984. Effect of oxygen concentration on the
rate of denitrification and denitrification in the sediments of an eutrophic lake. Water Res. 18,
335-338.
Nömmik H., Pluth D.J., Melin J., 1984. Dissimilatory reduction of 15N-labeled nitrate in the
presence of non-labeled nitric oxide or nitrous oxide. Can. J. Soil Sci. 64, 21-29.
Paccard E., 1995. Dénitrification biologique d’effluents industriels à fortes concentrations en
nitrates. Thesis, Université Provence Aix-Marseille I, 45 pp.
47

CHAPITRE 1
Parkin T. B., 1987. Soil microsites as a source of denitrification variability. Soil Sci. Am. J.
51, 1194-1199.
Parry S, Renault P., Chadoeuf J., Chenu C., Lensi. R., 2000. Particulate organic matter as
a source of variation in denitrification in clods of soil. European Journal of Soil Science, 51,
271-281.
Parsons L. L., Murray R. E., Scott Smith M., 1991. Soil denitrification dynamics : Spatial
and temporal variations of enzyme activity, populations and nitrogen gas loss. Soil Sci. Soc.
Am. J. 55, 90-95.
Parton W. J., Mosier A. R, Schimel D. S., 1988. Rates and Pathways of nitrous oxide
production in a shortgrass steppe. Biochemistry 6, 45-58.
Parton W. J., Mosier A. R., Ojima, D. S., Valentine D. W., Schimel D. S., Weier K.,
Kulmala A. E., 1996. Generalized model for N2 and N2O production from nitrification and
denitrification. Global Biogeochemical Cycles 10(3), 401-412.
Patureau D., Bernet N., Moletta R., 1996. Study of the denitrifying enzymatic system of
Comamonas sp. Strain SGLY2 under various aeration conditions with a particular view on
nitrate and nitrite reductases. Current Microbiology 32, 25-32.
Pennington P. I., Ellis R. C., 1993. Autotrophic and heterotrophic nitrification in acidic
forest and native grassland soils. Soil Biol. Biochem. 25(10), 1399-1408.
Pigliucci M., 1996. How organisms respond to environmental changes : from phenotypes to
molecules (and vice versa). Trends Ecol. Evol. 11, 168-173.
Poth Mark, Focht, Dennis D., 1985. 15N kinetic analysis of N2O production by
Nitrosomonas europaea: an examination of nitrifier denitrification. Applied and
Environmental Microbiology, 1134-1141.
Potter C. S., Matson, P. A. Vitousek, P. M., Davidson, E. A., 1996. Process modeling of
controls on nitrogen trace gas emissions from soil world-wide. Journal of Geophysical
Research 101(D1), 1361-1377.
Prosser J. I., 1986. Nitrification, IRL Press, Oxford.
Renault P., Sierra J., 1994. Modeling oxygen diffusion in aggregated soils II. Anaerobiosis
in topsoil layers. Soil Science Society of America Journal 58, 1023-1030.
Renault P., Stengel P., 1994. Modeling oxygen diffusion in aggregated soils: I. Anaerobiosis
inside the aggregates. Soil Sci. Soc. Am. J. 58, 1017-1023.
48

CHAPITRE 1
Ritchie G. A. F., Nicholas D. J. D., 1972. Identification of the sources of nitrous oxide
produced by oxidative and reductive processes in Nitrosomonas europaea. Biochem. J. 126;
1181-1191.
Robertson G. P., 1989. Nitrification and denitrification in humid tropical ecosystems:
Potential controls on nitrogen retention, in mineral nutrient. In: Procter, J. (Ed.), Tropical
Forest and Savanna Ecosystems, Blackwell Scientific, Boston, Mass., pp. 55-69.
Rojo M. J., Carcedo S. G., Mateos M. P., 1990. Distribution and characterization of
phosphatase and organic phosphorus in soil fractions. Soil Biol. & Biochem. 22, 169-174.
Rolston D.E., Rao P.S.C., Davidson J.M., Jessup R.E.,1984. Simulation of denitrification
losses on nitrate fertilizer applied to uncropped, cropped and manure-amended field plots.
Soil Science 137(4), 270-279.
Sextone A. J., Revsbech N. P., Timothy B.P., Tiedje, J. M., 1985. Direct measurement of
oxygen profiles and denitrification rates in soil aggregates. Soil Sci. Soc. Am. J. 49, 645-651.
Shimuzu T., Furukitwaki T., Tchikawak K., 1978. Metabolic characteristics of
denitrification by Paracoccus denitrificans. J. Fermentation Technol. 56, 207-213.
Sierra J., Renault P., 1995. Oxygen consumption by soil microorganisms as affected by
oxygen and carbon dioxide. Applied Soil Ecology 2, 175-184
Sierra J., Renault P., Vallès V., 1995. Anaerobiosis in saturated soil aggregates : modelling
and experiment. European Journal of Soil Science. 46, 519-531.
Soohoo C., Hollocher, T. C., 1990. Loss of nitrous oxide reductase in Pseudomonas
aeruginosa cultured under N2O as determined by rocket immunoelectrophoresis. Appl.
Environ. Microbiol. 56, 3591-3592.
Sorensen P., Jensen E. S., 1995. Mineralization of carbon and nitrogen from fresh and
anaerobically stored sheep manure in soils of different texture. Biol. Fertil. Soils 19, 29-35.
Stams J. M., 1994. Metabolic interactions between anaerobic bacteria in methanogenic
environments. Ant. Van Leeuw 66, 271-294.
Starr R. C., Gillham R. W., 1993. Denitrification and organic carbon availability in two
aquifers Ground Water 31, 934-947.
Stevens R. J., Laughlin R. J., Burns L. C., Arah J. R. M., Hood R. C., 1997. Measuring
the contributions of nitrification and denitrification to the flux of nitrous oxide from soil. Soil
Biol. Biochem. 29 , 139-151.
Stevens R. J., Laughlin R. J., 1998. Measurement of nitrous oxide and di-nitrogen emissions
from agricultural soils. Nutrient Cycling in Agroecosystems 52 , 131-139.
49

CHAPITRE 1
Stumm W., Morgan J. J., 1996. Aquatic chemistry. Chemical equilibra and rates in natural
waters. Oxidation and reduction. Equilibria and microbial mediation. John Wiley & Sons,
New York, pp. 425-513.
Terry R. E., Tate R. L., 1980. The effect of nitrate and nitrous oxide reduction in organic
soils and sediments. Soil Sci. Soc. Am. J. 44, 744-746.
Terry K. T., Hooper A. B., 1981. Hydroxylamine oxidoreductase: a 20-heme; 200000
molecular weight cytochrome c with unusual denaturation properties which forms a 63000
molecular weight monomer after heme removal. Biochemistry 20, 7032-7076.
Tiedje J. M., Sexstone A. J., Myrold D. D.,. Robinson J. A., 1982. Denitrification:
ecological niches, competition and survival. Anton Leeuwen 48, 569-583.
Tortoso A. C., Hutchinson G. L., 1990. Contributions of autotrophic and heterotrophic
nitrifiers to soil NO and N2O emissions. Applied & Environmental
Microbiology 56(6), 1799-1805.
Unden G., Schirawski S., 1997. The oxygen responsive transcriptional regulator FNR of
Escherichia coli : the search for signals and reactions. Mol. Microbiol. 25(2), 205-210.
Watson S. W., 1971. Reisolation of Nitrosospira briensis S. Winogradsky and H.
Winogradsky 1933. Arch. Microbiol. 75, 179-188.
Weier K. L., Doran J. W., Power, J. F., Walters D. T. 1993. Denitrification and the
dinitrogen/nitrous oxide ratio as affected by soil water, available carbon and nitrate. Soil Sci.
Soc. Am. J., 57, 66-72.
Williams E. J., Hutchinson G. L., Fehsenfeld F. C., 1992. NOx and N2O emissions from
soil. Global Biogeochem. Cy. 6(4), 351-388.
Wood P. M., 1986. Nitrification as a bacterial energy source. In: Prosser, J. I., (Ed.),
Nitrification, IRL, Press, Oxford, pp. 39-62.
Xu C., Shaffer M. J., Al-Kaisi, M., 1998. Simulating the impact of management practices on
nitrous oxide emissions. Soil Science Society of America Journal 62, 736-742.
Zanner C. W., Bloom P. R., 1995. Mineralization, nitrification and denitrification in
histosols of Northern Minnesota. Soil. Sci. Soc. Am. J. 59, 1505-1511.
Zumft W. G., 1997. Cell biology and molecular basis of denitrification. Microbiology and
Molecular biology reviews 61 (4), 533-616.
50

CHAPITRE 2
SIMULATION DE LA DENITRIFICATION, DE LA
DYNAMIQUE DES DENITRIFIANTS ET LEUR
CAPACITE PROGRESSIVE A REDUIRE N2O :
COMPARAISON MODELE - EXPERIENCE
Ce chapitre 2 correspond à un article « soumis » pour la revue European
Journal of Soil Science : K. Khalil, P. Renault, B. Mary, N. Guérin (2002)
Modelling Denitrification including the Dynamics of Denitrifiers and
their Progressing Ability to Reduce Nitrous Oxide: Comparison with
Batch Experiments.
51

CHAPITRE 2
SUMMARY
Nitrous oxide is involved in the global greenhouse effect and the chemistry of O3 in
the upper troposphere and lower stratosphere. In order to define a relevant model for
microbial NO3- and N2O reductions in the soil and estimate the involved parameters, we
propose a method combining measurements of anaerobic soil slurry and simulations
performed for Michaelis Menten kinetics of NO3- and N2O reductions, including non
enzymatic competition between NO3- and N2O as electron acceptors and the microbial
dynamics of two denitrifier groups that are able and unable to reduce N2O, respectively. Three
models, varying in terms of their ability to reduce N2O through denitrification, were
alternately assessed. The procedure was applied on an arable soil known for its low N2O
emissions in situ during wet events. The first model, i.e. accounting for microbial growth
without any increase in N2O reduction ability, was not able to reproduce experimental data. It
was necessary to consider that some denitrifiers initially unable to reduce N2O into N2 became
able to undertake this process. Models 2 and 3 account for the induction of N2O reductase,
with either the progressive synthesis of this reductase simultaneously for all N2O reducers or
the sudden synthesis of this reductase distributed over a range of times for N2O reducers.
These models were able to approximately describe experimental kinetics, although some
biases remained. In addition, denitrifier biomass estimated by fitting simulated data to
experimental data was consistent with biomass estimated from fumigation extraction and
microbial enumeration.
52
CHAPITRE 2
INTRODUCTION
Nitrous oxide is involved in the global greenhouse effect (Smith, 1990; IPCC, 1996) and
affects the chemistry of O3 in the upper troposphere and lower stratosphere (Graedel and
Crutzen, 1992). Its emission from soils results from nitrification (Groffman, 1991) and
denitrification (Hénault and Germon, 1995; Conrad, 1996). The N2O/(N2O+N2) ratio of the
terminal denitrification products varies greatly (Granli and Bockman, 1994): low values
correspond to situations in which N2O consumption nearly equals N2O production. A small
bias in the estimate of one of these two terms can therefore result in large errors in N2O
emission calculations.
It is generally admitted that the reduction of NO3- and NO2
- into N2O may be described by
Michaelis Menten equations (Betlach and Tiedje, 1981; Myrold and Tiedje, 1985; Maag et al.,
1997), leading to simplified descriptions, via either zero-order reactions at high NO3- contents
(Broadbent, 1951; Wijler and Delwiche, 1954; Nömmik, 1956; Bremner and Shaw, 1958;
Cooper and Smith, 1963; Kaspar, 1985) or first-order reactions at low NO3- contents
(Bowman and Focht, 1974; Standford et al., 1975; Reddy et al., 1982). Uncertainties
concerning the description of the microbial reduction of NO3- into N2O include (i) the
existence of an inhibitory effect of high NO3- levels (Renner and Becker, 1970; Avnimelech,
1971; Blackmer and Bremner 1978, Nakajima et al., 1984; Lalisse-Grundmann et al., 1988),
(ii) the value of the Michaelis constant describing the microbial affinity for NO3- for which
varied estimates have been reported (in mol m-3): 6 for intact cores (Hénault, 1993), 11.4-
31.4 (Malhi et al., 1990), approximately 0.22 (Klemedtsson et al., 1977) or 0.0018–0.0166
for soil and sediment slurries (Murray et al., 1989), 0.016 (Fewson et al. 1961) or 0.3-3.8
(Zumft, 1997) for purified NO3- reductase, and (iii) competition between NO3
- and N2O for
the denitrifiers that can perform NO3- and N2O reductions.
On the one hand, Blackmer and Bremner (1979) considered that low NO3- concentrations
increased N2O reduction (i.e. < 5mg N-NO3-.kg-1 DW soil). On the other hand, it is generally
accepted that high NO3- concentrations and/or high NO2
- concentrations decrease N2O
reduction and lead to an increase in the N2O/(N2O+N2) ratio of the final denitrification
products (Blackmer and Bremner, 1979; Guthrie and Duxbury, 1978; Firestone et al., 1979;
Terry and Tate, 1980; Letey et al., 1980; Gaskell et al., 1981; Nömmik et al., 1984; Weir et
al., 1993; Luo et al., 1996). Several hypotheses have been proposed to explain these
observations, including (i) the induction of N2O reductase by low NO3- concentrations rather
53

CHAPITRE 2
than by N2O itself (Soohoo and Hollocher, 1990), (ii) inhibition by NO2- which could
accumulate during the preliminary reduction of NO3- (Renner and Becker, 1970; Shimuzu et
al., 1978; Firestone et al., 1979; McKenney et al., 1982), (iii) direct inhibition by NO3-
(Gaskell et al., 1981), and (iv) competition between NO3- and N2O as electron acceptors (Cho
and Sakdinan, 1978). In contrast to NO3- reduction, estimates of the Michaelis constant for
N2O reduction were higher for purified N2O reductase (i.e. about 2-26 mmol m-3; Zumft,
1997) than for soil slurries (e.g. 0.1-0.4 mmol m-3; Holtan-Hartwig et al., 2000). It is often
assumed that limited transfer reduces [NO3-] at the microorganism level, and explains the
increase in the apparent Michaelis constant for NO3- reduction (Reddy et al., 1978; Myrold
and Tiedje, 1985); in the case of N2O reduction, the trend probably differs, because this gas is
currently produced and reduced at the same sites. Moreover, N2O reduction is not a simple
enzymatic reaction: it depends both on the affinity of the enzyme for N2O and on the rate of
electron exchange between periplasmic N2O reductase and the membrane respiratory chain
(Spanning et al., 1995; Zumft, 1997).
Competition between NO3- and N2O as electron acceptors seems to vary with time,
suggesting soil N2O reducers adapt to high levels of NO3- (Terry and Tate, 1980; Guthrie and
Duxbury, 1978). It may then be necessary to account for temporal variations in the
concentration of N oxide reductases (Baumann et al., 1996; Otte et al., 1996) and microbial
dynamics (especially the denitrifier – to – N2O reducer ratio). To our knowledge, no
publication deals with any advantage conferred to denitrifiers by the ability to reduce N2O
when NO3- is not limiting. The energy yield of each denitrification step varies with the
electron donor and other media characteristics (Stouthamer, 1988), but the translocated 'H+
: transferred e-' ratio appears to be similar or equal during the respiratory reduction of NO3-
into N2O and the reduction of N2O into N2, respectively (Van Spanning et al., 1995). Genes
involved in N2O reduction are sometimes located on megaplasmids (Dröge et al., 1999). The
transfer of self-transmissible plasmids over 1-3 day periods has already been observed for
other functional properties (Richaume et al., 1992; Sudarshana and Knudsen, 1995); however,
recipient cells generally represent only a small proportion of all present micro-organisms
(Dröge et al., 1999).
The aims of this work were to (i) propose a new denitrification model that accounts for
microbial activities and microbial dynamics, including the progressing ability of denitrifiers to
reduce N2O, (ii) propose a method to estimate the parameters of the model, and (iii) check the
model and the method with a set of experimental data obtained from an arable soil known for
its low N2O emissions during wet events.
54

CHAPITRE 2
MATERIALS AND METHODS
SOIL AND EXPERIMENTAL PROCEDURES
Soil Sampling and Treatments
Experiments were performed on an Orthic Luvisol (FAO classification) sampled in
Picardie (France), 15 km from Péronne, 49°80' N and 3°60' E. The soil had been cultivated
with corn in 2000. The properties of the soil were as follows: clay, 194 g.kg-1; silt, 706 g.kg-1;
sand, 68 g.kg-1; pHwater, 8.2; total CaCO3, 32 g.kg-1; organic C, 8.52 g.kg-1; total N 1.00 g.kg-1;
and NO3--N, 4.70 mg.kg-1. Clods were sampled between 10 and 30 cm on the 12th September
2000 and sieved between 2.5 and 3 cm at field moisture (18.35% dry weight basis). They
were then gently dried in air for 3 days to obtain residual moisture of around 10%, sieved
again at 2mm and stored at 4°C in plastic bags until the beginning of the experiments. Before
experiments began, soil aggregates were placed on a suction table. They were first
equilibrated at 1 m water suction for 1 day, then at 0.5 m for 1 day, then at 0.1 m for 1 day,
and finally at 0.05 m for 4 days.
Batch Incubations
In order to assess the influence of [NO3-] and [N2O] on NO3
- and N2O reductions, 25g fw
(fresh weight) of soil preliminarily equilibrated at 0.05 m water suction were placed in closed
250 ml flasks and maintained at 20°C for 14 hours. Then 25 ml of KNO3 solution were added
and slurries were then incubated under anaerobic conditions at 20°C. Nitrate concentrations of
the added solutions were 0, 0.02, 0.04, 0.1 0.2, 0.4, 0.6, 1, 2, 3, 5, 7 and 10 mol NO3-.m-
3 solution. Because of the initial [NO3-] in the soil, these applications corresponded to initial
NO3- concentrations in the slurry solutions of 0.151, 0.166, 0.182, 0.229, 0.306, 0.462, 0.617,
0.928, 1.66, 2.44, 3.99, 5.59 and 7.92 mol NO3-.m-3. The slurries were placed under anaerobic
conditions by alternating 3 successive cycles of 10 min vacuum and 10 min N2 filling of the
flasks.
After the final equilibration at atmospheric pressure, three types of initial conditions were
obtained:
55
CHAPITRE 2
- condition 1: 31.5 ml of N2 were replaced with 38.6 ml of C2H2 (i.e. approximately
28.4 ml in air and 10.2 ml in solution) and 2.9 ml of Kr in order to characterise total
denitrification and check for the existence of gas leakage, respectively;
- condition 2: 2.9 ml of N2 were replaced with 2.9 ml of Kr in order to characterise the net
production of N2O under low N2O conditions, i.e. under conditions where N2O
production and consumption are a priori of the same order of magnitude;
- condition 3: 3.6 ml of N2 were replaced with 0.7 ml of N2O and 2.9 ml of Kr in order to
characterise the net production of N2O under N2O enriched conditions.
One replicate was incubated at 20°C for each initial NO3- concentrations and initial
gaseous condition (i.e. conditions 1, 2 and 3). Stirring the suspensions at 150 rpm prevented
the occurrence of micro-gradients of [NO3-], [NO2
-], [N2O] within the soil slurries.
The initial and final '[NO3-]+[NO2
-]' and [NH4+] concentrations in the slurries were
extracted with a molar KCl solution (soil / solution ratio of 1/5). Measurements were made
with a colorimeter analyzer enabling continuous flux measurements (Sampler 1000, Skalar).
Nitrous oxide concentrations were measured at the beginning of incubation and (i) after 5, 12,
24, 36, 48, 60, 72, 96 and 120 hours for condition 1, and (ii) after 12, 24, 48, 72, 96, 120, 168,
240, and 312 hours for conditions 2 and 3. In practice, 3.5 ml of gas were sampled from the
flasks with Venoject® vacuum tubes and replaced by 3.5 ml N2. Venoject® air was vacuum
analysed by EC gas chromatography with a HP5890 Series II fitted with a Porapak Q column
(80-100 mesh, 2 m) coupled to an automatic sampler (HSS 1000, SRA-Instruments) and to
integration software on a PC Workstation. Measured [N2O] values were corrected to account
for progressive dilution resulting from the periodic substitution of 3.5 ml of gas mixture with
the same volume of N2. Nitrogen, CO2, O2, Kr, C2H2, and high N2O concentrations were
measured 3 and 4 times for condition 1 and for conditions 2 and 3, respectively, with a TCD
gas chromatograph HP5890 Series II fitted with Porapak Q (80-100mesh, 1.8 m) and sieve
molecular (1-5 Å, 1.8 m) columns coupled to the same integration software. Measurements
were made after 0, 72, 120 and 312 hours. In practice, 0.3 ml of gas was sampled with a
syringe and injected into the gas chromatograph. The carrier gas was Ar-CH4 (95/5) for EC-
GC and He for TCD-GC. Relative uncertainties in the gas measurements were about 1%.
Microbial Biomass Measurement; Enumeration of Heterotrophs and Denitrifiers
56

CHAPITRE 2
Three replicates of microbial biomass measurements were performed by fumigation-
extraction (Chaussod et al., 1988). Portions of 25 g of soil were placed into 250 ml vials and
fumigated for 16 h with chloroform vapors. The fumigated samples and corresponding
unfumigated samples were extracted by 100 ml of K2SO4 (soil/solution: 1/5). Soil suspensions
were then pelleted by centrifugation in disposable plastic vials and soluble organic C was
measured in the supernatant by persulfate-UV oxidation (Wu et al., 1990). The microbial
extractable carbon (EC) is given by the difference between fumigated and unfumigated
samples. Microbial C biomass C-BM can be calculated using a microbial organic C biomass
to microbial extractable organic C ratio of 1/0.38.
Triplicate microbial enumeration was performed. Ten grams of soil (equivalent dry weight)
were homogenised in 50 ml of NaCl (0.8%) for 1.5 min with a Waring blender. Soil
suspension (10 g dw were homogenised in 50 ml of NaCl (8 mg.l-1 solution)) was serially
diluted 5-fold. One Hundred microliters of dilutions were aliquoted in 8×12 wells of
microliter plates containing 100 µl of Nutrient Broth (NB, Difco, Detroit, USA) concentrated
twice. For denitrifier enumeration, the medium was amended with KNO3 (10 mM). The plates
were incubated at 28°C for 5 days and 10 days for heterotroph and denitrifier enumerations,
respectively. For denitrifier enumeration, anaerobic conditions were obtained using the BBL
GasPack Pouch System (Becton Dickinson, Sparks, USA). The presence of heterotrophs was
revealed by turbidity in positive wells. The presence of denitrifiers was considered positive if
neither NO2- nor NO3
- was detected using Griess-Ilosway’s reagent and Morgan’s reagent,
respectively. The most probable number of heterotrophic or denitrifying micro-organisms was
estimated by Cochran’s method (Cochran, 1950).
The denitrifier biomass bm was then estimated using the following equation:
⎟⎟
⎠
⎞
⎜⎜
⎝
⎛××=
H
D
MPN
MPNrBMbm (1)
where BM is total microbial biomass (g.kg-1 soil), r the microbial organic C biomass – to –
microbial extractable organic C ratio, MPND and MPNH the number of denitrifiers and
heterotrophs, respectively (cfu.g-1 soil).
THEORY
Microbial Processes
57
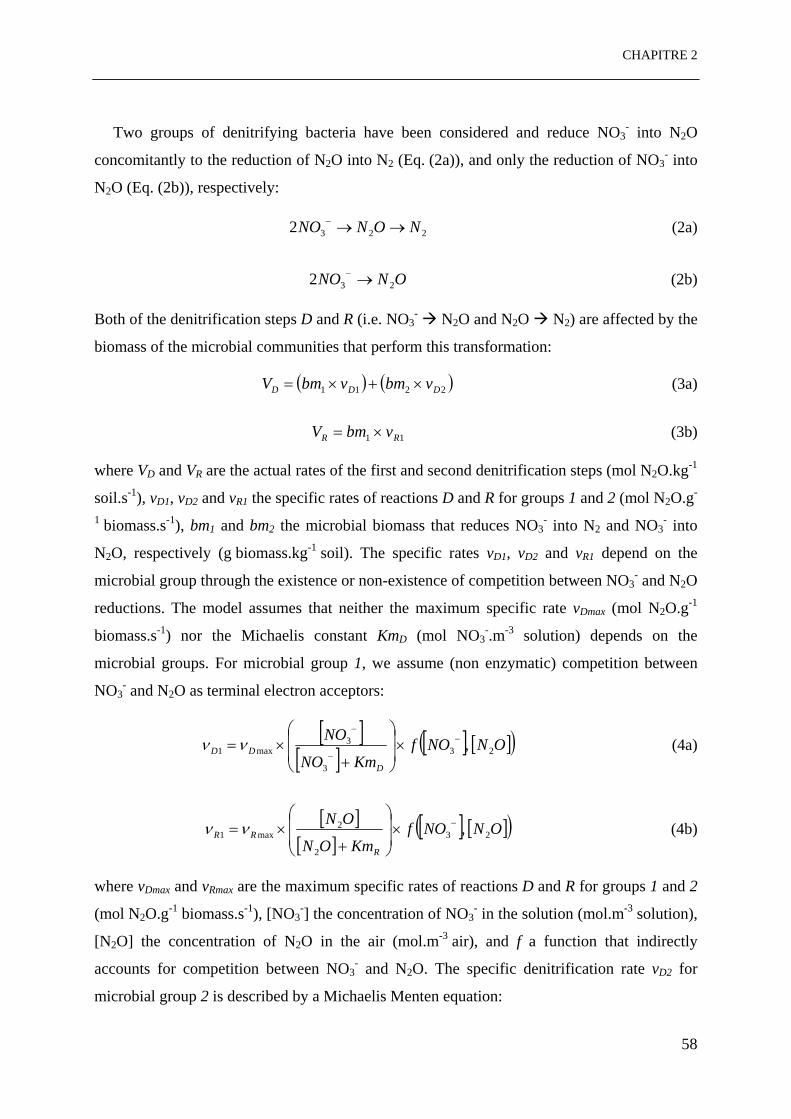
CHAPITRE 2
Two groups of denitrifying bacteria have been considered and reduce NO3- into N2O
concomitantly to the reduction of N2O into N2 (Eq. (2a)), and only the reduction of NO3- into
N2O (Eq. (2b)), respectively:
(2a) 2232 NONNO →→−
(2b) ONNO 232 →−
Both of the denitrification steps D and R (i.e. NO3- N2O and N2O N2) are affected by the
biomass of the microbial communities that perform this transformation:
( ) ( )2211 DDD vbmvbmV ×+×= (3a)
11 RR vbmV ×= (3b)
where VD and VR are the actual rates of the first and second denitrification steps (mol N2O.kg-1
soil.s-1), vD1, vD2 and vR1 the specific rates of reactions D and R for groups 1 and 2 (mol N2O.g-
1 biomass.s-1), bm1 and bm2 the microbial biomass that reduces NO3- into N2 and NO3
- into
N2O, respectively (g biomass.kg-1 soil). The specific rates vD1, vD2 and vR1 depend on the
microbial group through the existence or non-existence of competition between NO3- and N2O
reductions. The model assumes that neither the maximum specific rate vDmax (mol N2O.g-1
biomass.s-1) nor the Michaelis constant KmD (mol NO3-.m-3 solution) depends on the
microbial groups. For microbial group 1, we assume (non enzymatic) competition between
NO3- and N2O as terminal electron acceptors:
[ ][ ] [ ] [( ONNOf
KmNO
NO
D
DD 23
3
3max1 ,−
−
−
×⎟⎟
⎠
⎞
⎜⎜
⎝
⎛
+×=νν ]) (4a)
[ ][ ]
[ ] [( ONNOfKmON
ON
R
RR 23
2
2max1 ,−×
⎟⎟
⎠
⎞
⎜⎜
⎝
⎛
+×=νν ]) (4b)
where vDmax and vRmax are the maximum specific rates of reactions D and R for groups 1 and 2
(mol N2O.g-1 biomass.s-1), [NO3-] the concentration of NO3
- in the solution (mol.m-3 solution),
[N2O] the concentration of N2O in the air (mol.m-3 air), and f a function that indirectly
accounts for competition between NO3- and N2O. The specific denitrification rate vD2 for
microbial group 2 is described by a Michaelis Menten equation:
58

CHAPITRE 2
[ ][ ] ⎟
⎟
⎠
⎞
⎜⎜
⎝
⎛
+×=
−
−
D
DDKmNO
NO
3
3max2 νν (5)
Assuming that the flux of electrons is below a maximum value Fe (mol e-.g-1 biomass. s-1)
depending on the consumable organic matter, we then have:
[ ] [ ]( )( ) ( )( )⎟
⎟
⎠
⎞
⎜⎜
⎝
⎛
×+×=−
11
2328
;.1,RD
eFMinONNOfνν
(6)
Where Min is for the lower value, 8 and 2 the numbers of electrons transferred through the
respiratory chain during the reduction of 2 NO3- into N2O, and N2O into N2, respectively. As
soon as there are sufficient N oxide reductases, vDmax and vRmax can be related to Fe:
maxmax 28 RDeF νν ×=×= (7)
We assume that vDmax and KmD do not vary with time, or that variations occur initially over a
period short enough to neglect transient changes at the enzyme level and related respiratory
chain level (Otte et al., 1996; Baumann et al., 1996). In contrast, three models were
alternately used to account for an increase in the ability to reduce N2O with time:
Model A: there is no induction of N2O reductase already present, i.e. there is no change
in vRmax and KmR constants. Changes in bacteria groups 1 and 2 result only
from the respective growth of these groups;
Model B: N2O reductase that was initially absent is induced for each bacteria over a
period short enough to consider that the relevant bacteria move suddenly from
group 2 to group 1, this last group being characterised by one vRmax value and
one KmR value only. The flux rate of bacteria from group 2 to group 1 is
described by the derivation of a rational empirical function:
( ) ( )( )( )
( 212
12
1bm
t
te
t
bme
e
m
×+
×−=⎟⎟
⎠
⎞⎜⎜⎝
⎛
∂
∂ −
α
αα ) (8a)
mm t
bm
t
bm⎟⎟⎠
⎞⎜⎜⎝
⎛
∂
∂−=⎟⎟
⎠
⎞⎜⎜⎝
⎛
∂
∂ 21 (8b)
where m index is for movement, t is time (s), bm21 the biomass of bacteria
initially belonging to group 2 that progressively move to group 1
(g biomass.kg-1 soil), α the time at which 50% of these bacteria reduce N2O (s),
59

CHAPITRE 2
e an exponent of which the value is as much as high as the transition is sudden
at time α;
Model C: changes in the N2O reductase concentration and other components in the
respiratory chain are progressive and identical for all bacteria belonging to
group 1. Some calculations show that an increase in the N2O reductase
concentration may induce a decrease in KmR concomitantly to an increase in
vRmax at low reductase concentrations, or only a decrease in the apparent KmR
value at higher concentrations (see Appendix 1). We consider here only a
decrease in KmR described empirically by a rational function:
( ) ( )( ) ⎪⎭
⎪⎬⎫
⎪⎩
⎪⎨⎧
⎟⎟⎠
⎞⎜⎜⎝
⎛
+×−+= ∞ e
e
RRRR ttKmKmKmKm
αα
100 (9)
where KmR0 and KmR∞ are the initial and final Michaelis constants for N2O reduction
(mol N2O.m-3 air).
Microbial growth first results from the balance between the energy supplied by catabolic
activities and the energy required for microbial maintenance (Decker et al., 1970; Stouthamer,
1973). Assuming that the N supply does not limit microbial growth as long as the N2O
concentration evolves, and ignoring variations in organic-C really available for micro-
organisms, this balance is written as so:
( ) ( ){( ERRDD
g
mYvYvbmt
bm−×+××=⎟⎟
⎠
⎞⎜⎜⎝
⎛
∂
∂ max1
max11
1 } ) (10a)
{ }( EDD
g
mYvbmt
bm−××=⎟⎟
⎠
⎞⎜⎜⎝
⎛
∂
∂ max22
2 ) (10b)
where t is the time (s), g index is for "growth", YDmax and YR
max are the maximum yields of
NO3- and N2O reductions (g biomass produced per mol of N2O produced and reduced,
respectively), and mE is the energy required for microbial maintenance expressed as an
equivalent default in the biomass built per unit of biomass (s-1). Denitrifiers initially unable to
reduce N2O into N2 can progressively acquire this ability (MacConnaughey et al., 1985;
Holtan-Hartwig et al., 2000). The actual evolution of microbial groups 1 and 2 combines
growth and fluxes between groups 1 and 2 for Model B:
60
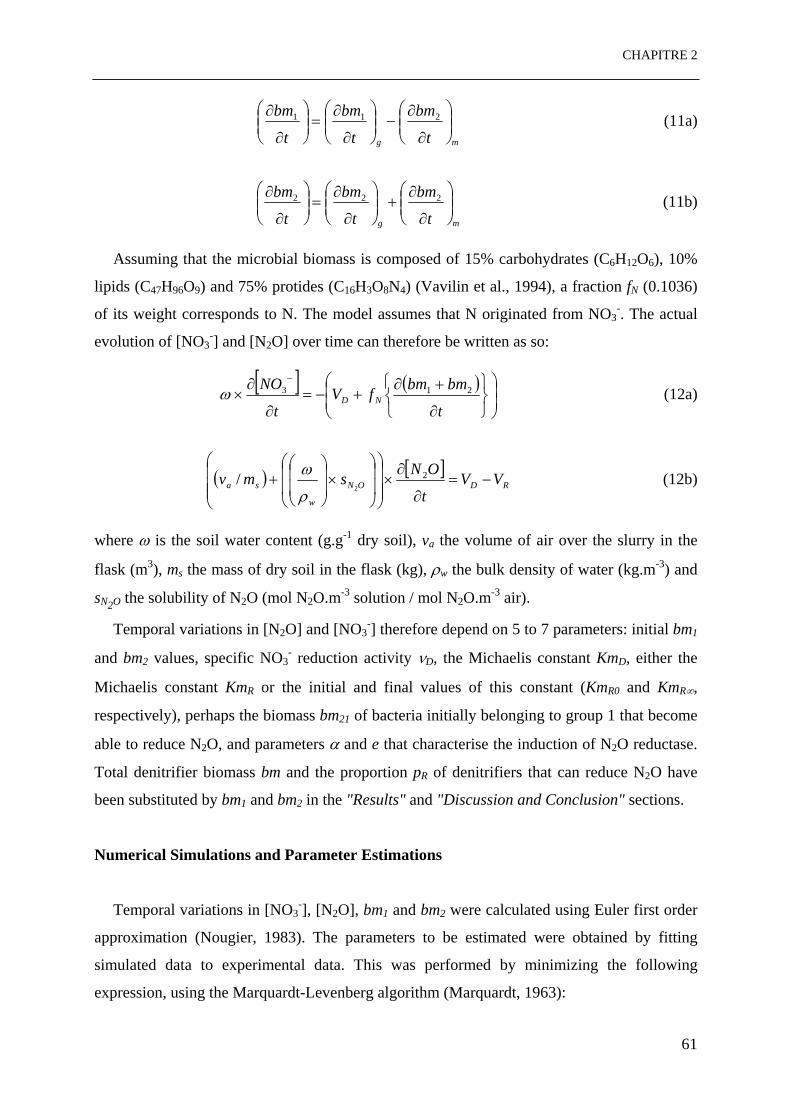
CHAPITRE 2
mg t
bm
t
bm
t
bm⎟⎟⎠
⎞⎜⎜⎝
⎛
∂
∂−⎟⎟
⎠
⎞⎜⎜⎝
⎛
∂
∂=⎟⎟
⎠
⎞⎜⎜⎝
⎛
∂
∂ 211 (11a)
mg t
bm
t
bm
t
bm⎟⎟⎠
⎞⎜⎜⎝
⎛
∂
∂+⎟⎟
⎠
⎞⎜⎜⎝
⎛
∂
∂=⎟⎟
⎠
⎞⎜⎜⎝
⎛
∂
∂ 222 (11b)
Assuming that the microbial biomass is composed of 15% carbohydrates (C6H12O6), 10%
lipids (C47H96O9) and 75% protides (C16H3O8N4) (Vavilin et al., 1994), a fraction fN (0.1036)
of its weight corresponds to N. The model assumes that N originated from NO3-. The actual
evolution of [NO3-] and [N2O] over time can therefore be written as so:
[ ] ( )⎟⎟⎠
⎞⎜⎜⎝
⎛
⎭⎬⎫
⎩⎨⎧
∂
+∂+−=
∂
∂×
−
t
bmbmfVt
NOND
213ω (12a)
( ) [ ]RDON
w
sa VVt
ONsmv −=∂
∂×
⎟⎟⎟
⎠
⎞
⎜⎜⎜
⎝
⎛
⎟⎟
⎠
⎞
⎜⎜
⎝
⎛×
⎟⎟
⎠
⎞
⎜⎜
⎝
⎛+ 2
2/
ρ
ω (12b)
where ω is the soil water content (g.g-1 dry soil), va the volume of air over the slurry in the
flask (m3), ms the mass of dry soil in the flask (kg), ρw the bulk density of water (kg.m-3) and
sN2O the solubility of N2O (mol N2O.m-3 solution / mol N2O.m-3 air).
Temporal variations in [N2O] and [NO3-] therefore depend on 5 to 7 parameters: initial bm1
and bm2 values, specific NO3- reduction activity νD, the Michaelis constant KmD, either the
Michaelis constant KmR or the initial and final values of this constant (KmR0 and KmR∞,
respectively), perhaps the biomass bm21 of bacteria initially belonging to group 1 that become
able to reduce N2O, and parameters α and e that characterise the induction of N2O reductase.
Total denitrifier biomass bm and the proportion pR of denitrifiers that can reduce N2O have
been substituted by bm1 and bm2 in the "Results" and "Discussion and Conclusion" sections.
Numerical Simulations and Parameter Estimations
Temporal variations in [NO3-], [N2O], bm1 and bm2 were calculated using Euler first order
approximation (Nougier, 1983). The parameters to be estimated were obtained by fitting
simulated data to experimental data. This was performed by minimizing the following
expression, using the Marquardt-Levenberg algorithm (Marquardt, 1963):
61

CHAPITRE 2
) (15) [ ] [ ](∑∑= =
−=n
i
n
jjisimji
1
2
1,,2,exp,2
2 ONONχ
where [ ] and ji ,exp,2ON [ ] jisim ,,2ON were the experimental and simulated N2O concentrations at
time i for flask j, and n the total number of experimental time measurements. The following
steps were performed successively:
- step 1: from the kinetics of total denitrification (condition 1), we estimated only one
total denitrifier biomass value bm, one specific denitrifying activity value νDmax and
one Michaelis constant KmD for NO3- reduction (mol NO3
-.m-3 solution) for all the
flasks; this operation was repeated for several energy yields and maintenance
coefficients. In addition and for the energy yield and maintenance coefficients
(arbitrarily) used for the following steps, we estimated denitrifier biomasses in each
flask using νD and KmD estimated previously;
- step 2: from the kinetics of N2O net production with no initial N2O in the flask
(condition 2), we estimated only one initial proportion pR of denitrifiers that reduce
N2O and perhaps the proportion of denitrifiers initially belonging to group 2 that
become able to undertake this reduction (Model B), either one Michaelis constant for
N2O reduction KmR or its initial and final values (KmR0 and KmR∞ in Model C), and
either parameter α or parameter e describing the progressing ability to reduce N2O in
Models B and C for specific denitrifying activity νDmax, the Michaelis constant KmD
and the total denitrifier biomass bm estimated during step 1. Using all these estimates
except mean microbial biomass bm, we then obtained a second estimate of this
biomass specific to each flask;
- step 3: for the kinetics of N2O net production with N2O initially in the flasks
(condition 3), we only compared experimental data with simulated data, using the
parameter estimated during steps 1 and 2. Due to some systematic bias between
experiments and simulations for this condition, additional tests were performed for
higher energy yields for N2O reduction (by doing step 2 once more). Additional
simulations were obtained by estimating the denitrifier biomass specific to each flask
using all the other parameters estimated previously.
62

CHAPITRE 2
RESULTS
Condition 1
Nitrous oxide concentration increases nearly linearly with time at the beginning of
incubation with a slope similar for all samples (Fig. 1a-c), except for those supplemented with
a 0.153 mol NO3-.m-3 solution. For the 6 flasks supplemented with solutions of low NO3
-
concentrations, [N2O] stabilises thereafter (Fig. 1a). For these samples, at the end of
incubation, NO3- and extractable NH4
+ concentrations were about 0.024 and 0.196 mol N.m-
3 solution, respectively. No trend was observed between these concentrations and the initial
NO3- concentration. The sum of final N2O and NO3
- concentrations – expressed as equivalent
[NO3-] in the soil solution – is approximately 90% of the initial NO3
- concentration, the
deviation between the sum of final N2O and NO3- concentrations and the initial NO3
-
concentration increasing from 0.005 to 0.6 mol.m-3 with the initial NO3- concentrations of the
soil solution. For samples supplemented with solutions of high NO3- concentrations, [N2O]
increases all the time (Fig. 1b-c). For all samples, the rate of N2O emission seems to increase
with time, although inflexion points could sometimes be detected.
63

CHAPITRE 2
A
0
50
100
150
200
0 30 60 90 120
TIME (hours)
EXPERIMENT
SIMULATION
0
200
400
600
800
0
N2O
(ppm
v)
0
200
400
600
800
0
A
B
Figure 1: comparison between
C2H2, no N2O initially) for
a
b
c
B
30 60 90 120
TIME (hours)
30 60 90 120
TIME (hours)
C
experimental and simulated [N2O] values for condition 1 (i.e.
an energy yield of 1.25 mol ATP per mol of N2O produced:
/ initial [NO3-] = 0.17 mol.m-3 solution;
/ initial [NO3-] = 0.93 mol.m-3 solution;
/ initial [NO3-] = 7.90 mol.m-3 solution.
64
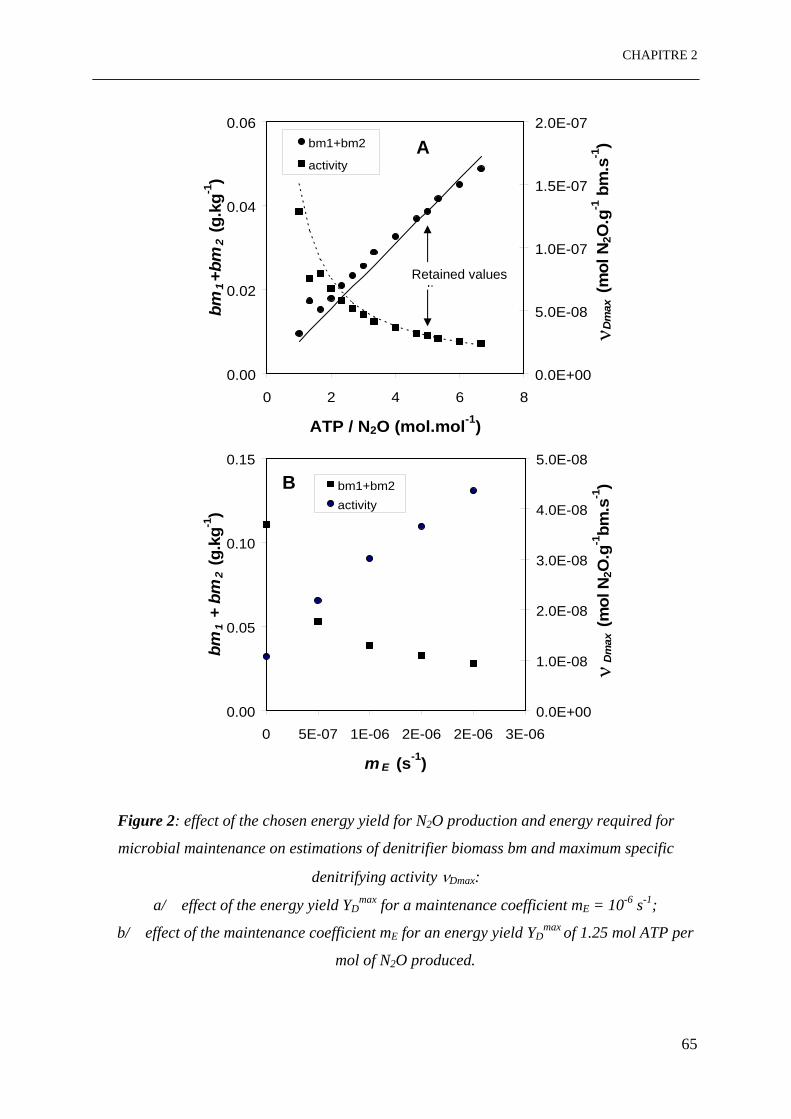
CHAPITRE 2
0.00
0.02
0.04
0.06
0 2 4 6 8
ATP / N2O (mol.mol-1)
bm1+b
m2 (g
.kg-1
)
0.0E+00
5.0E-08
1.0E-07
1.5E-07
2.0E-07
0.00
0.05
0.10
0.15
0 5E-07 1E-06 2E-06 2E-06 3E-06
m E (s-1)
bm1 +
bm
2 (g
.kg-1
)
0.0E+00
1.0E-08
2.0E-08
3.0E-08
4.0E-08
5.0E-08
D
max
(mol
N2O
.g-1
bm.s
-1) B bm1+bm2
activity
aa ν
aaD
max
(mol
N2O
.g-1
bm
.s-1
)bm1+bm2
activityA
ν
...Retained values
Figure 2: effect of the chosen energy yield for N2O production and energy required for
microbial maintenance on estimations of denitrifier biomass bm and maximum specific
denitrifying activity νDmax:
a/ effect of the energy yield YDmax for a maintenance coefficient mE = 10-6 s-1;
b/ effect of the maintenance coefficient mE for an energy yield YDmax of 1.25 mol ATP per
mol of N2O produced.
65

CHAPITRE 2
0
10
20
30
40
50
60
70
80
0 20 40 60 80 100 120
DURATION OF DENITRIFICATION (hours)
DEV
IATI
ON
IN F
INA
L [N
2O] (
ppm
v)
SIM-EXP
fN=0.04
Figure 3: Deviations between the simulated and experimental [N2O] values as a function of
the time required to reach equilibrium for [N2O], for the 6 flasks with the lowest initial
NO3- concentrations, and additional NO3
- consumption expressed in equivalent defaults in
N2O production for an fN underestimated by 0.04.
66

CHAPITRE 2
When fitting experimental data to simulated data, for the 13 incubation flasks in condition
1 for several maximum energy yield values YDmax and maintenance coefficient values mE, the
energy yield was, as a first approximation, proportional and inversely proportional to the
estimates of microbial denitrifying biomass bm and specific denitrifying activity νDmax,
respectively (Fig. 2a). Denitrifier biomass estimates ranged between 9.57 10-3 and 4.87 10-
2 g.kg-1 soil, for the considered energy yields. Moreover, a variation in the maintenance
coefficient mE induced additional variations in the estimates of biomass bm and specific
denitrifying activity νDmax, as illustrated in Figure 2b. For the energy yield value used in this
study (i.e. 5 mol ATP produced per mol of N2O produced), simulated [N2O] data agreed
approximately with experimental data (Fig. 1a-c). Nevertheless, two types of bias were
observed between experiments and simulations. On the one hand, when [N2O] stabilized
before the end of the experiment, final simulated [N2O] values were higher than experimental
values (see for example Fig. 1a). The deviation between final experimental and simulated
[N2O] was linearly correlated with the time required to reach [N2O] stabilisation (results not
shown), with an increase of approximately 0.30 ppmv N2O per additional hour (Fig. 3). On
the other hand, additional deviations in the rate of N2O production between experiments and
simulations suggest variations in microbial characteristics between flasks. Using the
previously estimated specific denitrifying activity value νDmax and Michaelis constant KmD for
the energy yield value used in this study, we estimated the microbial biomass bm separately
for each flask: its average and standard deviation values were 4.56 10-2 and 2.23 10-2 g.kg-
1 soil, respectively; no correlation was detected between the biomass estimate and the initial
[NO3-] of the flask (Fig. 7a). Nevertheless, one flask had a biomass estimate of 11.9 10-2 g.kg-
1 soil; ignoring this value would have led to average and standard deviation values of 3.95 10-
2 and 0.32 10-2 g.kg-1 soil, respectively. Considering the energy yield YDmax, the specific
denitrifying activity νDmax and the Michaelis constant KmD for NO3- reduction used for this
study, we calculated the uncertainty in NO3- incorporated into the microbial biomass
(expressed as an equivalent default in N2O production) as a function of time for an increase of
0.04 in fN: the deviation between final experimental and simulated N2O concentrations for the
6 flasks with the lowest initial NO3- concentrations increases during the time required to reach
equilibrium (Fig. 3) at a rate of 0.21 ppmv N2O.h-1; it is approximately 20 ppmv lower than
the deviation between experimental and simulated N2O concentrations after equilibrium has
been reached. This last deviation corresponds approximately to 0.016 mol NO3-.m-3 solution.
67
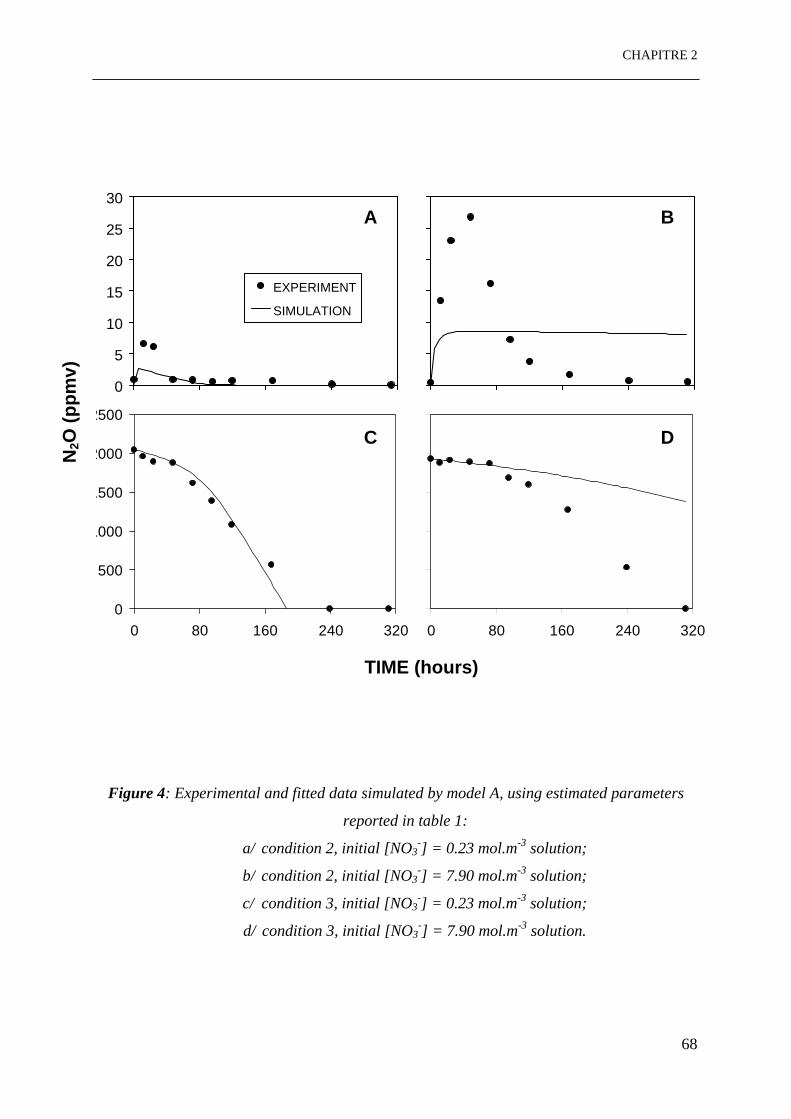
CHAPITRE 2
0
5
10
15
20
25
30
0 80 160 240 320
TIME (hours)
N2O
(ppm
v)
0
500
1000
1500
2000
2500
0 80 160 240 320
TIME (hours)
N2O
(ppm
v)0
5
10
15
20
25
30
0 80 160 240 320
TIME (hours)
N2O
(ppm
v)
EXPERIMENT
SIMULATION
0
Figure 4: Experimental and fitted data simulated by model A, using estimated parameters
reported in table 1:
a/ condition 2, initial [NO3-] = 0.23 mol.m-3 solution;
b/ condition 2, initial [NO3-] = 7.90 mol.m-3 solution;
c/ condition 3, initial [NO3-] = 0.23 mol.m-3 solution;
d/ condition 3, initial [NO3-] = 7.90 mol.m-3 solution.
500
1000
1500
2000
2500
0 80 160 240 320
TIME (hours)
N2O
(ppm
v
C
TIME (hours)
)N2O
(ppm
v)
A B
D
68
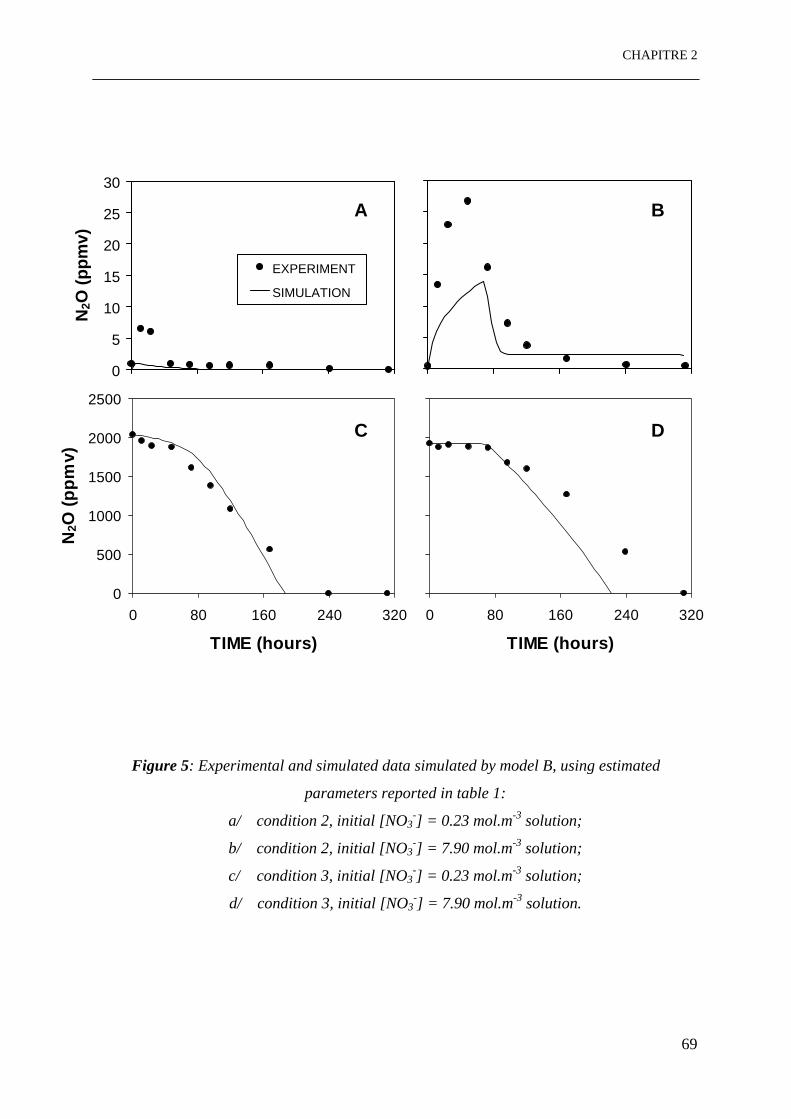
CHAPITRE 2
0
5
10
15
20
25
30
0 80 160 240 320
TIME (hours)
N2O
(ppm
v)
0
500
1000
1500
2000
2500
0 80 160 240 320
TIME (hours)
N2O
(ppm
v)0
5
10
15
20
25
30
0 80 160 240 320
TIME (hours)
N2O
(ppm
v)
EXPERIMENT
SIMULATION
0
500
1000
1500
2000
2500
0 80 160 240 320
TIME (hours)
N2O
(ppm
v)
DC
A B
Figure 5: Experimental and simulated data simulated by model B, using estimated
parameters reported in table 1:
a/ condition 2, initial [NO3-] = 0.23 mol.m-3 solution;
b/ condition 2, initial [NO3-] = 7.90 mol.m-3 solution;
c/ condition 3, initial [NO3-] = 0.23 mol.m-3 solution;
d/ condition 3, initial [NO3-] = 7.90 mol.m-3 solution.
69
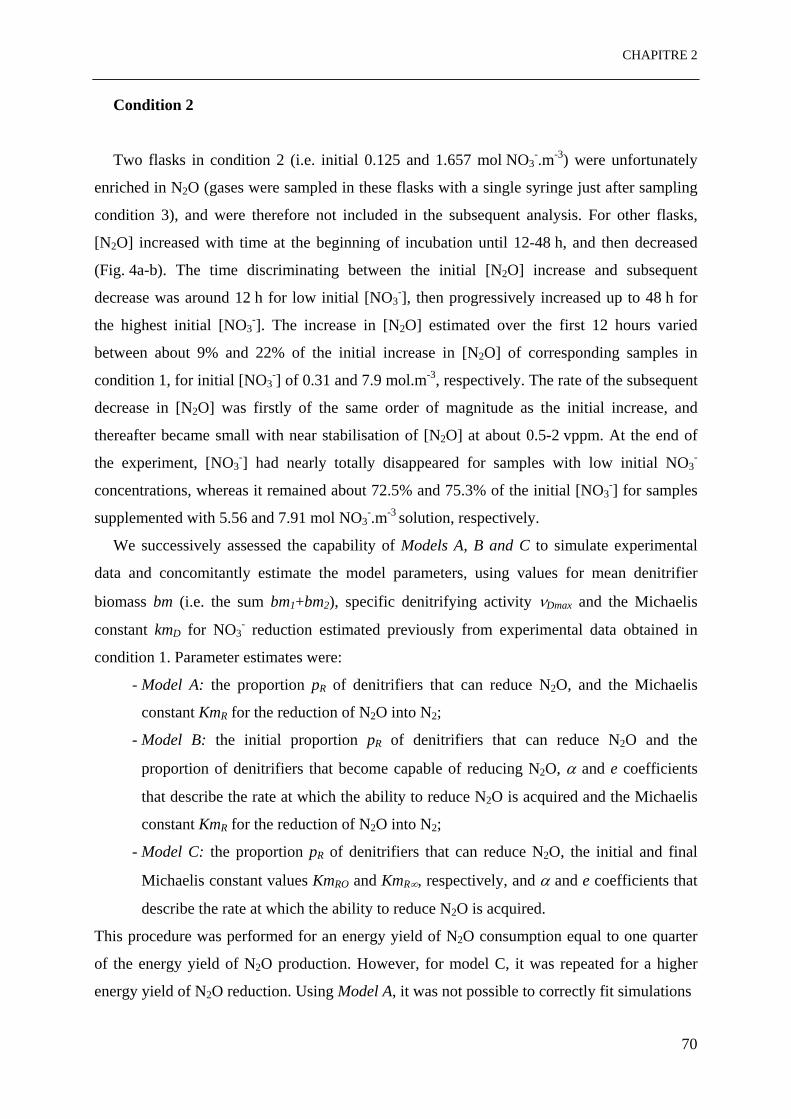
CHAPITRE 2
Condition 2
Two flasks in condition 2 (i.e. initial 0.125 and 1.657 mol NO3-.m-3) were unfortunately
enriched in N2O (gases were sampled in these flasks with a single syringe just after sampling
condition 3), and were therefore not included in the subsequent analysis. For other flasks,
[N2O] increased with time at the beginning of incubation until 12-48 h, and then decreased
(Fig. 4a-b). The time discriminating between the initial [N2O] increase and subsequent
decrease was around 12 h for low initial [NO3-], then progressively increased up to 48 h for
the highest initial [NO3-]. The increase in [N2O] estimated over the first 12 hours varied
between about 9% and 22% of the initial increase in [N2O] of corresponding samples in
condition 1, for initial [NO3-] of 0.31 and 7.9 mol.m-3, respectively. The rate of the subsequent
decrease in [N2O] was firstly of the same order of magnitude as the initial increase, and
thereafter became small with near stabilisation of [N2O] at about 0.5-2 vppm. At the end of
the experiment, [NO3-] had nearly totally disappeared for samples with low initial NO3
-
concentrations, whereas it remained about 72.5% and 75.3% of the initial [NO3-] for samples
supplemented with 5.56 and 7.91 mol NO3-.m-3 solution, respectively.
We successively assessed the capability of Models A, B and C to simulate experimental
data and concomitantly estimate the model parameters, using values for mean denitrifier
biomass bm (i.e. the sum bm1+bm2), specific denitrifying activity νDmax and the Michaelis
constant kmD for NO3- reduction estimated previously from experimental data obtained in
condition 1. Parameter estimates were:
- Model A: the proportion pR of denitrifiers that can reduce N2O, and the Michaelis
constant KmR for the reduction of N2O into N2;
- Model B: the initial proportion pR of denitrifiers that can reduce N2O and the
proportion of denitrifiers that become capable of reducing N2O, α and e coefficients
that describe the rate at which the ability to reduce N2O is acquired and the Michaelis
constant KmR for the reduction of N2O into N2;
- Model C: the proportion pR of denitrifiers that can reduce N2O, the initial and final
Michaelis constant values KmRO and KmR∞, respectively, and α and e coefficients that
describe the rate at which the ability to reduce N2O is acquired.
This procedure was performed for an energy yield of N2O consumption equal to one quarter
of the energy yield of N2O production. However, for model C, it was repeated for a higher
energy yield of N2O reduction. Using Model A, it was not possible to correctly fit simulations
70

CHAPITRE 2
to experimental data: at low initial [NO3-], the simulated maximum N2O concentrations
remained lower than experimental values (Fig. 4a) and its subsequent decrease resulted from
NO3- disappearance, whereas [N2O] remained high (Fig. 4b) as long as [NO3
-] was high
enough for soils with high initial NO3- concentrations. Using all the previously estimated
parameters, except "mean" denitrifier biomass bm, we estimated the bm value individually for
each flask: its average and standard deviation were 0.155 and 0.197 g.kg-1 soil, respectively.
The average was thus significantly higher than the previously estimated biomass; moreover,
there was a significant increase in the bm estimate with the initial [NO3-] of the flasks
(Fig 7a). Model B fitted simulations to experimental data better than model A (Fig. 5a-b):
especially at high initial NO3- concentrations, it simulated a decrease in [N2O] although NO3
-
did not disappear (Fig. 5b). However, simulated [N2O] remained lower than experimental
values. Using all the previously estimated parameters, except "mean" denitrifier biomass bm,
we estimated this last value individually for each flask: its average and standard deviation
were equal to 0.088 and 0.108 g.kg-1 soil, respectively. As for model A, the average was thus
significantly higher than the previously estimated biomass, and there was a significant
increase in the bm estimate with the initial [NO3-] of the flasks (Fig. 7a). In contrast to models
A and B, model C made it possible to approximately simulate [N2O] evolution over time for
all the range of initial [NO3-] values, although simulated [N2O] remained generally lower than
experimental values (Fig. 6a-b). Increasing the energy yield of N2O reduction induced little
change in simulated [N2O] as well as parameter estimates (Table 1), except for the exponent e
for which large variations in this range of values only slightly affected [N2O] evolution over
time. Using all the previously estimated parameters, except "mean" denitrifier biomass bm,
we estimated this last value individually for each flask: its average and standard deviation
were 2.31 10-2 and 0.019 g.kg-1 soil, respectively. In addition, trends in individual biomass
estimates were noted only for low initial N concentrations (Fig. 7b); in this range of initial
[NO3-] values, large variations in bm did not greatly affect simulated [N2O] (results not
shown).
71

CHAPITRE 2
0
5
10
15
20
25
30
0 80 160 240 320
TIME (hours)N 2
O (p
pmv)
0
5
10
15
20
25
30
0 80 160 240 320
TIME (hours)
N 2O
(ppm
v)
EXPERIMENTSIMULATION-1SIMULATION-2SIMULATION-3
0
500
1000
1500
2000
2500
0 80 160 240 320
TIME (hours)
N 2O
(ppm
v)
0
500
1000
1500
2000
2500
0 80 160 240 320
TIME (hours)
N 2O
(ppm
v)N
2O (p
pmv)
TIME (hours)
DC
BA
Figure 6: Experimental and simulated data simulated by model C, using estimated
parameters reported in table 1 (simulations 1, 2 and 3 are for YRmax equal to 2.5, 3.33 and
4.17 mol ATP.mol N2O, respectively):
a/ condition 2, initial [NO3-] = 0.23 mol.m-3 solution;
b/ condition 2, initial [NO3-] = 7.90 mol.m-3 solution;
c/ condition 3, initial [NO3-] = 0.23 mol.m-3 solution;
d/ condition 3, initial [NO3-] = 7.90 mol.m-3 solution.
72

CHAPITRE 2
Condition Model νDmax KmD bm PR Initial pR
Final pR
KmR Initial KmR Final KmR α e
- -°mol N2O.g-1.s-1 - - mol.m-3 - - g.kg-1 - mol.m-3 - - mol.m-3 - - mol.m-3 - -- s --
1
- 3.01 10-8 5.82 10-2 3.87 10-2 - - - - - - - -
2 A - - - 0.468 1.29 10-4 - - - -
C
C
B - - - - 0.401 0.626 2.99 10-5 - - 2.50 10+5 58.10
† - - - 0.415 - 1.46 10 1.12 10-4 -5 1.36 10+5 9.29
‡ - - 0.404 1.27 10 2.59 10-4 -5 1.35 10+5 40.24
3 A - - - - - - - - -
C
C
B - - - - - - - - -
† - - - - - - - - -
‡ - -
Table 1: parameters estimated by fitting simulations to experimental data for an energy yield YDmax and a maintenance coefficient mE of
1.25 mol ATP.mol N2O produced and 10-6 s-1, respectively. †: YR
max for N2O reduction of 2.5 mol ATP.mol-1 N2O ‡: YR
max for N2O reduction of 3.33 mol ATP.mol-1 N2O
73
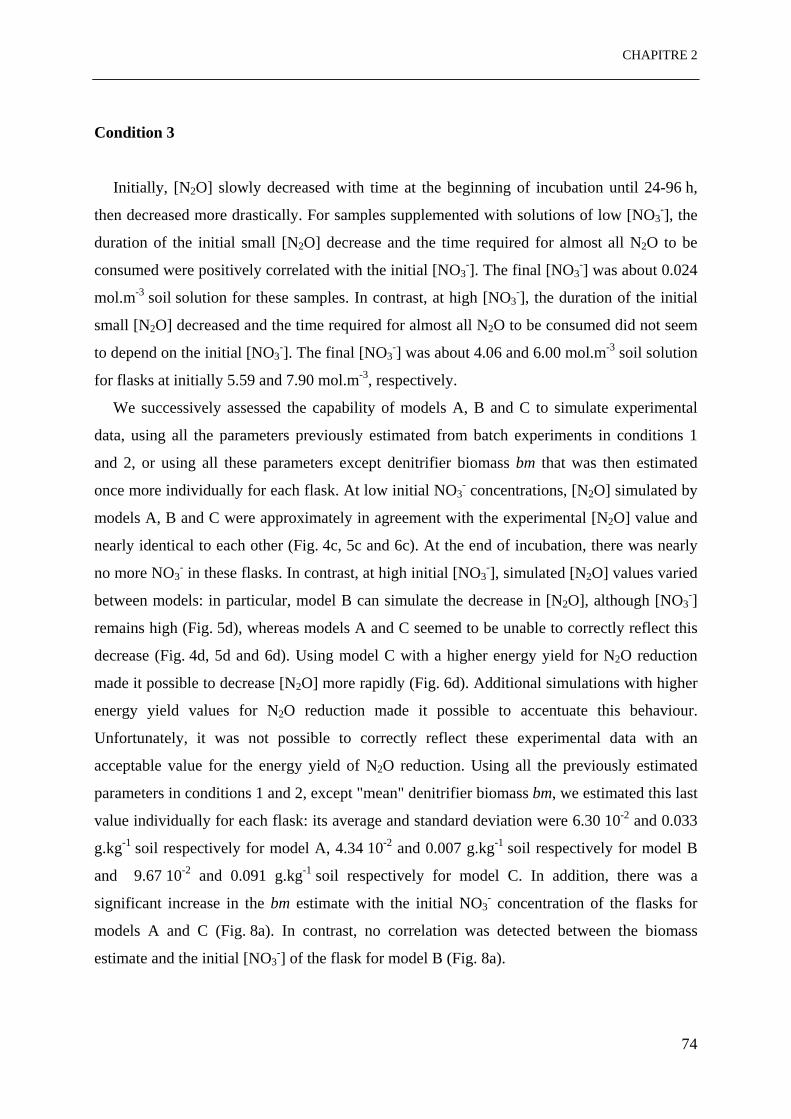
CHAPITRE 2
Condition 3
Initially, [N2O] slowly decreased with time at the beginning of incubation until 24-96 h,
then decreased more drastically. For samples supplemented with solutions of low [NO3-], the
duration of the initial small [N2O] decrease and the time required for almost all N2O to be
consumed were positively correlated with the initial [NO3-]. The final [NO3
-] was about 0.024
mol.m-3 soil solution for these samples. In contrast, at high [NO3-], the duration of the initial
small [N2O] decreased and the time required for almost all N2O to be consumed did not seem
to depend on the initial [NO3-]. The final [NO3
-] was about 4.06 and 6.00 mol.m-3 soil solution
for flasks at initially 5.59 and 7.90 mol.m-3, respectively.
We successively assessed the capability of models A, B and C to simulate experimental
data, using all the parameters previously estimated from batch experiments in conditions 1
and 2, or using all these parameters except denitrifier biomass bm that was then estimated
once more individually for each flask. At low initial NO3- concentrations, [N2O] simulated by
models A, B and C were approximately in agreement with the experimental [N2O] value and
nearly identical to each other (Fig. 4c, 5c and 6c). At the end of incubation, there was nearly
no more NO3- in these flasks. In contrast, at high initial [NO3
-], simulated [N2O] values varied
between models: in particular, model B can simulate the decrease in [N2O], although [NO3-]
remains high (Fig. 5d), whereas models A and C seemed to be unable to correctly reflect this
decrease (Fig. 4d, 5d and 6d). Using model C with a higher energy yield for N2O reduction
made it possible to decrease [N2O] more rapidly (Fig. 6d). Additional simulations with higher
energy yield values for N2O reduction made it possible to accentuate this behaviour.
Unfortunately, it was not possible to correctly reflect these experimental data with an
acceptable value for the energy yield of N2O reduction. Using all the previously estimated
parameters in conditions 1 and 2, except "mean" denitrifier biomass bm, we estimated this last
value individually for each flask: its average and standard deviation were 6.30 10-2 and 0.033
g.kg-1 soil respectively for model A, 4.34 10-2 and 0.007 g.kg-1 soil respectively for model B
and 9.67 10-2 and 0.091 g.kg-1 soil respectively for model C. In addition, there was a
significant increase in the bm estimate with the initial NO3- concentration of the flasks for
models A and C (Fig. 8a). In contrast, no correlation was detected between the biomass
estimate and the initial [NO3-] of the flask for model B (Fig. 8a).
74
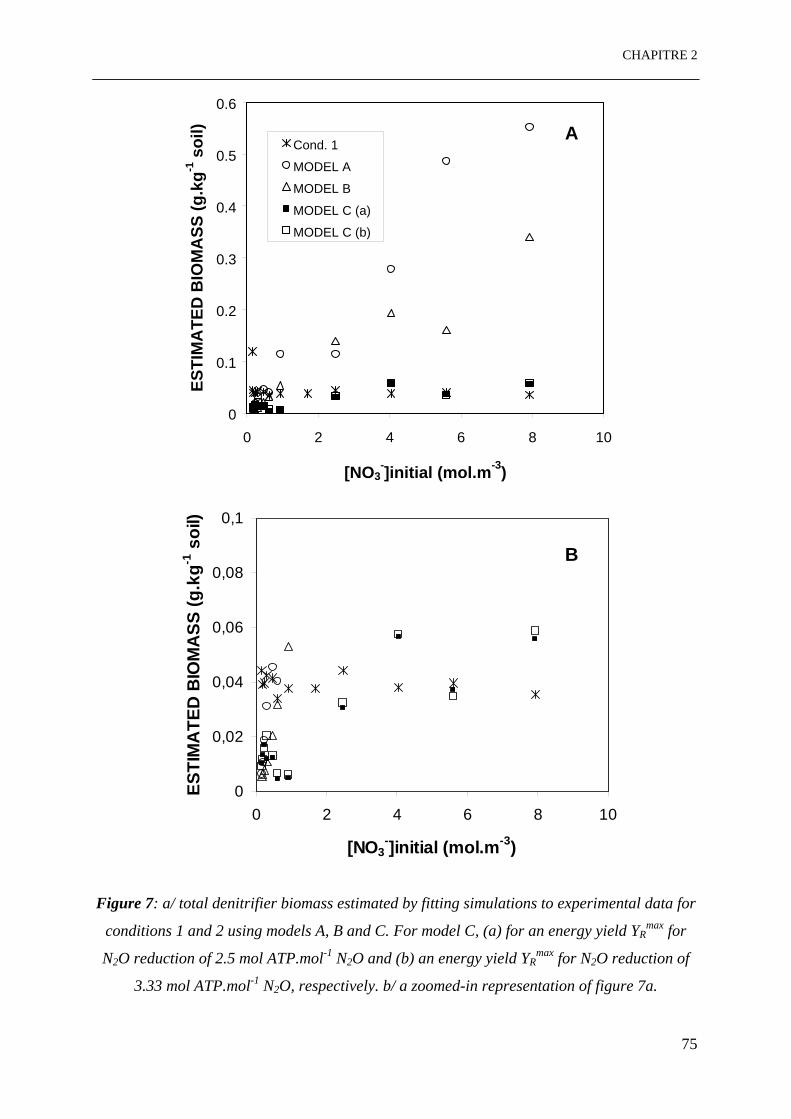
CHAPITRE 2
0
0.1
0.2
0.3
0.4
0.5
0.6
0 2 4 6 8 10
[NO3-]initial (mol.m-3)
ESTI
MA
TED
BIO
MA
SS (g
.kg-1
soi
l)
Cond. 1
MODEL A
MODEL B
MODEL C (a)
MODEL C (b)
A
B
0
0,02
0,04
0,06
0,08
0,1
0 2 4 6 8 1
[NO3-]initial (mol.m-3)
ESTI
MA
TED
BIO
MA
SS (g
.kg-1
soi
l)
B
0
Figure 7: a/ total denitrifier biomass estimated by fitting simulations to experimental data for
conditions 1 and 2 using models A, B and C. For model C, (a) for an energy yield YRmax for
N2O reduction of 2.5 mol ATP.mol-1 N2O and (b) an energy yield YRmax for N2O reduction of
3.33 mol ATP.mol-1 N2O, respectively. b/ a zoomed-in representation of figure 7a.
75

CHAPITRE 2
0
0,1
0,2
0,3
0,4
0 2 4 6 8 1
[NO3-]initial (mol.m-3)
ESTI
MA
TED
BIO
MA
SS (g
.kg-1
soi
l) A
0
Cond. 1MODEL AMODEL BMODEL C (a)MODEL C (b)
0
0,02
0,04
0,06
0,08
0,1
0 2 4 6 8 1
[NO3-]initial (mol.m-3)
ESTI
MA
TED
BIO
MA
SS (g
.kg-1
soi
l) B
0
Figure 8: a/ total denitrifier biomass estimated by fitting simulations to experimental data for
conditions 1 and 3 using models A, B and C. For model C, (a) for an energy yield YRmax for
N2O reduction of 2.5 mol ATP.mol-1 N2O and (b) an energy yield YRmax for N2O reduction of
3.33 mol ATP.mol-1 N2O, respectively. b/ a zoomed-in representation of figure 8a
76
CHAPITRE 2
Direct Estimate of Denitrifier Biomass
The measured organic-C in the microbial biomass was 154 (±6) mg C. kg-1 soil,
corresponding approximately to 300 mg total biomass per kg of dry soil. Microbial
enumeration gave an indirect estimate of 4.32% of denitrifiers; this is the ratio of 6.56 106
denitrifier cfu.g-1 soil (standard deviation: 2.78 106) to 1.52 108 heterotroph cfu.g-1 soil
(standard deviation: 3.08 107). Combining total microbial biomass with the number fraction of
denitrifier in this biomass gave a denitrifier biomass value of about 13.7 mg.kg-1 soil.
77

CHAPITRE 2
DISCUSSION
The aims of this study were to (i) propose a denitrification model that accounts for
microbial activities and microbial dynamics, including the progressing ability of denitrifiers to
reduce N2O, (ii) propose a method to estimate its parameters, and (iii) check the model and
the method with a set of experimental data. Several conclusions from this study result from
experimental data, whereas others result from the assessment of model relevancy.
Experimental Data
Although only 25 g fw soil were placed in each flask, we did not observe any irregular
trends of N2O emissions with initial [NO3-], except for a small number of flasks, suggesting
that the experimental procedure made it possible to minimize variability between flasks.
During batch incubation, denitrification explained all evolved NO3-, since no trend was
observed between final extractable [NH4+] and initial slurry [NO3
-]. Therefore, NH4+
production resulted probably only from mineralization, and [NH4+] had not to be accounted
for in order to balance evolved NO3-. Due to the imperfect characterisation of final [NO3
-] and
[NH4+] for conditions 2 and 3, the balance was calculated only for condition 1: the deviation
between the sum of final N2O and NO3- concentrations and the initial NO3
- concentration
increased from 0.005 to 0.6 mol.m-3 with the initial NO3- concentration of the soil solution.
This probably resulted from N-immobilisation due to the increase in denitrifier biomass.
Assuming 10% N within the dry biomass, it would correspond to a biomass increase of
between 1.2 and 149 mg biomass.kg-1 soil during batch incubation. This could explain an
increase in the rate of N2O emission with time, and suggests that microbial dynamics should
be accounted for in models over periods greater than about 100 h. It seems that soil can
reduce N2O from the beginning, since the increase in [N2O] estimated from the first 2
measurements in condition 2 was approximately only 9-22% of the initial increase in [N2O]
for corresponding dates and samples in condition 1. For incubation in condition 2 with the
two highest initial NO3- concentrations, the final NO3
- concentrations were approximately
72.5% and 75.3% of initial [NO3-], respectively: assuming that these final NO3
- concentrations
did not limit the first denitrification step (i.e. NO3- N2O) due to their high values with
regard to literature estimates of KmD (Malhi et al., 1990, Zumft et al., 1997) and did not
78
CHAPITRE 2
significantly affect possible competition between NO3- and N2O as terminal electron acceptors
for respiratory chains. It is not possible to explain why [N2O] suddenly fell after
approximately 12 to 48 h, without accounting for induced additional N2O reductase synthesis,
as has already been evidenced by direct measurements (Otte et al., 1996). Such an
interpretation seemed to be confirmed by similar observations in condition 3 for the two
highest initial NO3- concentrations: after approximately 72 h, there was a great increase in
N2O net consumption, although [NO3-] remained high at the end of incubation for the two
highest initial [NO3-] values. Although an increase in enzyme concentration is often accounted
for by an increasing maximum rate of reaction, the actual situation for N2O reductase may be
more complex due to (i) possible competition between NO3- and N2O as terminal electron
acceptors for respiratory chains (Cho and Sakdinan, 1978), and (ii) N2O reduction that not
only involves periplasmic N2O reductase but also membrane-bound electron carriers that
reduce the enzyme. As an indication of the complex reality, Michaelis constant values KmR
estimated experimentally from soil slurries (Holtan-Hartwig et al., 2000) were lower than
KmR values estimated from purified enzymes (Zumft, 1997).
Modeling Denitrification Processes
Model Hypotheses
Some model assumptions were made in order to describe the effect of NO3- on N2O
reduction (Blackmer and Bremner, 1979; Terry and Tate, 1980; Gaskell et al., 1981; Nömmik
et al., 1984; Weir et al., 1993; Luo et al., 1996) and the possible effect of N2O on NO3-
reduction (Guérin, 1999): (i) respiration through denitrification is bound by a maximum flux
of e- through the respiratory chain, which is distributed to all e- acceptors, and (ii) competition
between NO3- and N2O reductions exists when the e- flux calculated without accounting for
this competition exceeds its maximum value. In this situation, both NO3- reduction and N2O
reduction is proportionally reduced. In addition, the model was simplified with regard to
actual processes in order to facilitate parameter estimation. Nitrite was ignored as the
intermediate product in the reduction of NO3- into N2O; NO3
- reducers that only undertake
NO3- reduction were therefore ignored. Nitrate reducers are often more abundant than
denitrifiers (Vinther et al., 1999). We can assume that NO3- reducer activity can increase the
NO2- reduction activity of actual denitrifiers and thus lead to biased estimates in bm and/or
νDmax, see to have νDmax values specific to groups 1 and 2. It is possible to ignore NO2- as the
79
CHAPITRE 2
intermediary product if either [NO2-] is negligible (i.e. NO3
- reduction into NO2- limits NO3
-
reduction into N2O) (Mariotti et al., 1981; Dendooven and Anderson, 1994) or NO3- reduction
into NO2- is fast enough to consider equilibrium between [NO3
-] and [NO2-] (Stevens et al,
1998). However, it has been observed that NO2- temporarily accumulates in soils, particularly
at high levels of ammonium and high pH (Burns et al., 1996; Van Cleemput and Samater,
1996; Smith et al., 1997 and Ellis et al, 1998); Nakajima et al. (1984) and Almeida et al.
(1995) observed, both in pure and in mixed culture, that the NO3- reduction rate was twice as
fast to the NO2- reduction rate independently of NO3
- or NO2- concentration. In addition, we
simultaneously neglected micro-organisms that only reduce N2O, as they seem to be really
insignificant (Firestone and Tiedje, 1979). We ignored the induction time required for NO3-
and NO2- reductions, see the lag phase for NO3
- reduction into N2O, whereas we explicitly
described this process for N2O reduction. Indeed, NO3- and NO2
- reductases are synthesized
under aerobic conditions (Patureau et al, 1996); in contrast, de novo synthesis of N2O
reductase only starts 16-33 h after depletion of O2 (Firestone and Tiedje, 1979;
MacConnaughey et al., 1985; Dendooven and Anderson, 1994). In addition, it has often been
observed that initial N2O production is minor in the first 2-5 h, whereas the N2O production
rate stabilises thereafter at a higher rate (Dendooven and Anderson, 1994). The duration of
this pseudo lag phase was short with regard to the total duration of our batch incubation and
can a priori be neglected as a first approximation. As already discussed in the "Conclusions
from Experimental Data" section and in Appendix 1, we assume that the effective Michaelis
constant KmR decreases with an increasing N2O reductase concentration, whereas we neglect
effects on the maximum N2O reduction rate νRmax.
Impacts of Preliminarily Fixed Parameters
Values of some of the model parameters were preliminarily fixed, including energy yield
values YDmax and YR
max (i.e. 5 and 1.25 mol ATP.mol-1 N2O, respectively) and the maintenance
coefficient mE (10-6 s-1). The maximum energy yield YDmax varied with the type of C substrate
(among other factors): the lowest values (about 2.7 mol ATP.mol-1 N2O) corresponded to the
use of substrates such as succinate, whereas the highest ones (about 5.3-6.7 mol ATP.mol-
1 N2O) corresponded to substrates such as glucose or malate (Stouthamer, 1988). With regard
to the present knowledge on respiratory chains involved in denitrification (Stouthamer, 1888),
there is no justification for the YDmax – to – YR
max ratio to differ from 4 (i.e. the ratio of the
numbers of e- transferred during the two denitrification steps): only the location of physical
80
CHAPITRE 2
binding with the respiratory chain differing between e- donors (e.g. NADH+H+, H2, succinate,
etc.) can affect this ratio, and it remains unproved that the reduction of NO into N2O is linked
to ATP production (Stouthamer, 1988 ; Van spanning et al., 1995, Zumft, 1997 and
Richardson, 2000). The range of maintenance coefficient values (i.e. between 4.72 and 5 of
10-6 g-moles ATP/g dry weight of organisms/s) has often been suggested for heterotrophs
(Stouthamer, 1973). This is why additional bm and νDmax estimates were made for various
YDmax values between 0.25 and 1.67 mol ATP.mol-1 N2O. As a first approximation, it was
proportional and inversely proportional to bm and νDmax estimates, respectively (Fig. 2a). This
can be easily understood considering that each time, (i) on the one hand, the increase in [N2O]
directly depends on the bm × νD product, (ii) on the other hand, the relative increase in bm
(i.e. ∂bm/bm∂t) is a function of the YDmax × νD product (see Eq. 10b). Therefore, from a
theoretical point of view, it is possible to simulate nearly the same [N2O] evolution over time
by multiplying YDmax and bm by a single constant, and concomitantly dividing νDmax by the
same constant. The effect of the maintenance coefficient mE first results from the need for the
model to correctly reflect the relative increase in microbial biomass bm (i.e. ∂bm/bm∂t),
which explains the non linear increase in [N2O], as long as [NO3-] is not a limiting factor: an
increase in this maintenance coefficient thus induces an increase in maximum specific
denitrifying activity νDmax and, as a consequence, a decrease in the denitrifier biomass
estimate. It was not possible to sufficiently increase N2O reduction with regard to NO3-
reduction by decreasing the YDmax – to – YR
max ratio in Model C to correctly simulate
experimental data for condition 3 and high initial NO3- concentrations. Changes in YD
max,
YRmax or mE did not improve the fit of simulated data to experimental ones. However, the
energy yield of N2O reduction slightly affected parameter estimates (Table 1) and simulations
(Fig. 6a-d).
Ability of the Models to simulate Experimental Data
The capability of Models A, B and C to reflect experimental data were assessed for each
condition. With respect to condition 1, the model is unique. We noted two types of bias
between experiments and simulations. On the one hand, the simulated [N2O] equilibriums
were higher than the actual ones. This could probably not be explained by the dissimilatory
reduction of NO3- into NH4
+, since there was no correlation between final [NH4+] and initial
[NO3-]: thus, [NH4
+] probably results from the anaerobic mineralization of organic-N. In
81

CHAPITRE 2
contrast, the increase in the deviation between measured and simulated final N2O
concentrations was directly related to the time required to reach equilibrium, and such an
increase could be explained if the weight proportion fN of N in microbial biomass was
underestimated by approximately 0.04 for the energy yield YDmax used (see Fig. 3). Such an
underestimation of fN is possible: in this study, we used 0.1036 of fN as suggested by Vavilin
et al. (1994), whereas estimates of around 0.14 have been proposed in other studies
(Stouthamer, 1988). Nevertheless, a deviation of approximately 20 ppmv between measured
and simulated [N2O] equilibrium values remain unexplained by accounting for a bias in fN
estimation. This value may result from the [NO3-] not consumed during batch incubation,
which cannot be simulated by Michaelis approximation of real microbial activities. On the
other hand, simulations reflected experimental data imperfectly, due to the probable
variability in microbial characteristics between flasks. With respect to condition 2, Model A
would have been the natural candidate to easily describe N2O emissions if there was no
increase in the ability to reduce N2O, whereas such an increase was noted from experimental
data. This increase was confirmed by the incapability of Model A to simulate the rapid drop in
[N2O] falling down after an initial increase for all samples, including those in which [NO3-]
remained much higher than the Michaelis constant KmD (e.g. in Fig. 5b). Models B and C are
2 different alternatives with which to account for this increase that could result from N2O
reductase induction. The comparison between these 2 models (Fig. 6a-b, 7a-b, and 8a-b)
clearly indicated that Model C was more appropriate for reflecting experimental data. Firstly,
it better simulates [N2O] evolution over time. Secondly, biomass values estimated separately
for each flask using this model were less variable and exhibited a less pronounced trend with
initial [NO3-]. However, we still noted an increase in these estimates with the low initial [NO3
-
]. These low estimates at low initial [NO3-] have to be considered carefully: in this range of
initial [NO3-] values, simulated [N2O] evolution over time varied only slightly with initial
denitrifier biomass (results not shown). With respect to condition 3, Models A, B and C can
approximately reflect experimental [N2O] at low initial [NO3-]: the decrease in [N2O] with
time results from the disappearance of NO3- (Fig. 5c, 6c and 7c). In contrast, at high initial
NO3- concentrations, Model B was more appropriate for reflecting experimental data. Firstly,
it better simulates [N2O] evolution over time (Fig. 5d, 6d, and 7d); secondly, biomass values
estimated separately for each flask using this model were less variable and exhibited a less
pronounced trend with initial [NO3-] (Fig. 8a-b). Using model C with a higher energy yield
made it possible to decrease [N2O] more rapidly (Fig. 7d).
Estimation of each parameter by fitting simulations to experimental data was compared to
82
CHAPITRE 2
other estimations taken from this work or from the literature. The range of bm values obtained
(9.57-48.7 mg.kg-1soil) for various energy yields YDmax was in agreement with its estimate
resulting from fumigation-extraction and enumeration (13.7 mg.kg-1soil), in the knowledge
that there were considerable uncertainties for this last estimate (Cochran, 1949; Wu et al.,
1990). Numerous authors have measured total biomass for soils, including Lensi et al. (1995)
in continuous cultivation (0.885 g.kg-1) and in permanent pasture (2.24 g.kg-1), Kieft et al.
(1987) in grassland soil (2.07 g.kg-1), Ross et al. (1992) in forest soil (1.03 g.kg-1), and Lovel
et al. (1998) in permanent pasture (1.72 g.kg-1). Some have also proposed estimates of the
proportion of denitrifiers among heterotrophs of about some percent. Denitrifying activity has
been preferentially referred to soil amounts rather than denitrifier amounts. It then
corresponds to the product νD × bm, for which the estimate of the maximum νDmax × bm was
11.7 10-10 mol N2O.kg-1.s-1 in this work. This value was lower than values obtained in the
literature: 4.56 10-8 (Klemedtsson et al., 1977), 1.52 10-8 - 2.99 10-8 mol.N2O kg-1.s-1 (Malhi
et al., 1990), 1.39 10-8 - 8.23 10-8 (Holtan-Hartwig et al., 2000) and 42.5 10-10 – 8.17 10-8
(Murray et al., 1989). The Michaelis constant KmD (0.058 mM) was (i) lower than several
estimates, including some obtained with purified enzymes (e.g. 0.016 mM from Fewson et al.
(1961), and 0.3-3.8 mM from Zumft (1997)), and soil slurries (about 0.22 mM from
Klemedtsson et al. (1977), and between 11.4-31.4 mM from Malhi et al. (1990)), and (ii)
higher than other estimates, including those of Murray et al. (1989) for soil and sediment
slurries (0.0018-0.0166 mM). The estimates of the Michaelis constant KmR obtained from
Model A (0.129 µM) and model B (0.03 µM), as well as the range of KmR values for Model C
(0.146 and 0.0112 µM for the initial and final values, respectively), were much lower than
values for the purified enzyme (2-26 µM after Zumft (1997)), but closest to values obtained
by Holtan-Hartwig et al. (2000) for soil slurries (0.1-0.4 µM). This suggests that the induction
of the N2O reductase decreases its Michaelis constant as a consequence of either limitation in
the e- flux through respiratory chains or actual mechanisms that cannot be modelled by a
simple enzymatic scheme (see for example the 3 schemes proposed in Appendix 1). In Models
B and C, the estimated e exponent takes a high value (Table 1), indicating that the capability
to reduce N2O suddenly increases at time α. The α values (i.e. approximately 70 h and 37 h
after the beginning of incubation for Model B and Model C, respectively) were respectively
higher and lower than the 50 h corresponding to the highest N2O concentration for condition
2. With regard to the literature, Otte et al. (1996) directly observed a considerable and sudden
increase in the N2O reductase concentration after about 25h. In their work, they did not
83
CHAPITRE 2
initially detect N2O reductase, whereas Holtan-Hartwig et al. (2000) noted that there was
already a low concentration of N2O reductase initially. Around time α for Model B, KmR
decreased by about one order of magnitude (Table 1). The initial KmR values (1.46.10-4
mol.m-3) were slightly lower than values obtained with purified enzymes (i.e. from 0.002 to
0.026 mol.m-3, after Zumft (1997)).
Some information on the actual microbial processes can be deduced from a comparison
between experimental and simulated data. With respect to the first denitrification step (i.e.
NO3- N2O), the modelling approach that has already been used by several other authors
seems to be acceptable, since it enables us to reflect experimental trends as well as obtain
relevant parameters. With respect to the second denitrification step, we noted an increase in
the ability to reduce N2O, which probably results from the induction of N2O reductase
(Firestone and Tiedje, 1979). In addition, accounting for this induction through a decrease in
the Michaelis constant KmR with respect to its actual value seems relevant, although we
cannot simultaneously exclude an effect on the maximum N2O reduction rate νRmax. Lastly,
competition between NO3- and N2O as terminal electron acceptors in the respiratory chain was
used as a basic hypothesis for the model using previous results; neither the competition itself
nor its mathematical description have been proved by this study. None of the three models
used in this study were capable of perfectly reflecting all the experimental trends. Deviations
remaining between experimental and simulated data may be due to reasons already stated, as
well as the fact that other microbial and physicochemical processes were neglected, including
for example (i) horizontal gene transfer that proceeds either through conjugation (Dröge et al.,
1999), since nos genes – i.e. genes involved in N2O reduction – are sometimes located on
conjugative megaplasmids, e.g. pHG1 in Alcaligenes Eutrophus (Siedow et al., 1999), and (ii)
geochemical changes that can affect the expression of the ability to reduce N2O into N2,
including the bioavailability of Cu necessary for N2O reductase to run (Zumft, 1997) and of
Fe for other electron carriers such as cytochrome synthesised de novo upon the shift to
anaerobiosis and expression of the denitrification system (Zumft, 1997).
84

CHAPITRE 2
Appendix 1: hypothetical kinetic schemes for N2O reduction
Scheme 1
In this scheme, N2O combines reversibly with N2O reductase E, and the resulting complex
E(N2O) can then dissociate and produce N2 and H2O with the concomitant consumption of
2 H+ and 2 e-.
(A.1a) ( )ONE
k
kONE 2
2
1
2 ⎯→←+
(A.1b) ( ) 2
3
2 NEk
ONE +⎯→⎯
Results are well known. Ignoring that the maximum flux of e- can limit the N2O reduction
rate, we have:
[ ] [ ][ ]ONKm
ONEkR
TR
2
23
+××=ν (A.1c)
where KmR is the actual Michaelis constant for N2O reductase (mol.m-3) that equals the k2/k1
ratio. As long as k3×[ET] is lower than Fe/2, the e- flux through the respiratory chain does not
limit νR, and an increase in [ET] then only affects νRmax that equals k3×[ET]; the actual
Michaelis constant is also the effective one. In contrast, for [ET] higher than Fe/(2×k3), the e-
flux through the respiratory chain Fe can limit νR at high N2O concentrations. νR then cannot
strictly be described with the Michaelis Menten equation; an approximation of the effective
Michaelis constant KmR-e is the [N2O] value at which νR equals Fe/4, i.e. half the maximum
νR:
( ) ( )⎟
⎟
⎠
⎞
⎜⎜
⎝
⎛
−××=−
4
4
3 eT
eReR
FEk
FKmKm (A.1d)
In this range of [ET] values, the maximum N2O reduction rate νRmax does not vary with [ET].
85
CHAPITRE 2
)
Scheme 2
In this scheme, N2O first combines reversibly with N2O reductase E, and the resulting
complex E(N2O) then also reversibly combines with a terminal electron carrier bound to the
microbial membrane (Tc). The resulting complex E(N2O)Tc can then dissociate and produce
N2 and H2O with the concomitant consumption of 2 H+ and 2 e-.
(A.1e) ( ONEk
kONE 2
2
1
2 ⎯→←+
(A.1f) ( ) ( ) CC TONEK
KTONE 2
2
1
2 ⎯→←+
(A.1g) ( ) CC TNEK
TONE ++⎯→⎯ 2
3
2
Assuming that nearly equals the total N[ ] [ ])( 2ONEE + 2O reductase concentration , it is
possible to estimate [ ] : [ ]TE
)( 2ONE
( )[ ] [ ] [ ][ ]ONK
ONEONEm
T
2
22
+×= (A.1h)
Similarly, it is possible to estimate : [ ]cTONE )( 2
( )[ ] [ ] ( )[ ]( )[ ]ONEKK
ONETTONE cTC
212
22
+×= (A.1i)
where [TcT] is the total concentration of terminal membrane-bounded electron carriers.
Replacing in Eq. (A.1i) by its value in Eq. (A.1h) gives the final equation for N[ )( 2ONE ] 2O
reduction in Eq. (A.1c), as long as the e- flux through the respiratory chain does not limit νR:
86

CHAPITRE 2
[ ] [ ][ ] ( )
[ ]
[ ] ( )[ ] ( ) ⎪
⎪⎪
⎭
⎪⎪⎪
⎬
⎫
⎪⎪⎪
⎩
⎪⎪⎪
⎨
⎧
⎟⎟
⎠
⎞
⎜⎜
⎝
⎛
⎟⎟
⎠
⎞
⎜⎜
⎝
⎛
+×+
×⎟⎟
⎠
⎞
⎜⎜
⎝
⎛
+××=
12
122
2
12
3
KKE
KKKmON
ON
KKE
ETK
T
RT
TcTRν (A.1j)
As long as [ET] and/or [TcT] are low enough to prevent the e- flux through the respiratory
chain from limiting νR, an increase in [ET] simultaneously increases and decreases νRmax and
KmR-e, respectively. In addition, KmR-e is always lower than the actual Michaelis constant
KmR. On the one hand, at low [ET] values, νRmax greatly depends on [ET], whereas KmR-e
nearly equals KmR. On the other hand, at high [ET] values, νRmax does not vary greatly with
[ET], whereas KmR-e significantly decreases with an increase in [ET]. When the e- flux through
the respiratory chain limits νR at high [N2O] values, νRmax cannot vary with [ET] and equals
Fe/2, whereas the effective Michaelis constant KmR-e is reduced with respect to Eq. (A.1j), for
the same reason as in scheme 1.
Scheme 3
This last scheme is probably the nearest to the actual mechanisms (Zumft, 1997).
Unfortunately, it was difficult to obtain simple results as before. We present this scheme to
show that it may lead to various trends that can be similar or different to those for the two
schemes described previously. In the latter, N2O reductase E is first reduced by contact with a
terminal electron carrier of the respiratory chain bound to the microbial membrane. The
reduced enzyme then combines with N2O, and the resulting complex E(N2O) can then
dissociate and produce N2 and H2O, with the concomitant consumption of 2 H+ and enzyme
oxidation.
(A.1k) CC ETK
KTE
2
1
⎯→←++
(A.1l) CC TEK
ET +⎯→⎯−
3
87

CHAPITRE 2
)
)
(A.1m) ( ONEk
kONE 2
2
1
2 ⎯→←+−
(A.1n) ( ) 2
3
2 NEk
ONE +⎯→⎯ +
As long as the e- flux through the respiratory chain does not limit νR, the N2O reduction rate is
limited by the rates of reactions in Equations (A.1m) and (A.1n) when
, whereas this rate can be limited by the rates of reactions in
Equations (A.1k) and (A.1l), when
( ONEEETE c 2+<<+ −+
( )ONEEETE c 2+>>+ −+ . The first condition is fulfilled
when:
( )[ ]
( )[ ]ON
kk
T
KK
K
k
c 2
1212
3
3 11 <<−⎟⎟
⎠
⎞
⎜⎜
⎝
⎛+ (A.1o)
When the left term is negative this condition is always verified whereas, in other situations, it
is verified only at low N2O concentrations. The Nitrous oxide reduction rate can then be
described with a standard Michaelis Menten equation, using the actual KmR and νRmax values.
When the left term is positive and at high N2O concentrations, it can be demonstrated that the
N2O reduction rate does not depend on N2O but only on the total Tc and E contents. A priori,
the resulting effective Michaelis constant may be higher or lower than the actual KmR [N2O],
depending on the extent of the [N2O] domain where the inequality (A.1o) is valid.
If the e- flux through the respiratory chain limits νR, at high [N2O] values, it will indirectly
induce a decrease in the effective Michaelis constant, as noted for scheme 1.
88

CHAPITRE 2
ACKNOWLEDGEMENTS
This work was supported by the French programs PNSE and GESSOL, the Région
Picardie and the Institut National de la Recherche Agronomique. It was carried out at the
Unité "Climat, Sol et Environnement", INRA, Avignon (France); microbial biomass
measurements and enumerations were performed at the CMSE (INRA, Dijon, France) and the
LEM (Université Claude Bernard, Lyon, France), respectively. We thank G. Sévenier and
G. Bentivegna, for their technical support. We would like to acknowledge R. Lensi
(Université Claude Bernard) for helpful discussions. We are grateful to Miss A.M. Wall of the
Translation Unit, INRA, for reviewing the English version of the manuscript.
89

CHAPITRE 2
REFERENCES
1. Avinimelech, Y. 1971. Nitrate transformation in peat. Soil Sci., 111, 113-118.
2. Almeida, J.S., Julio, S.M., Reis, M.A.M. & Carrondo, M.J.T. 1995. Nitrite inhibition of
denitrification by Pseudomonas Fluorescens. Biotechnology and Bioengineering, 46, 194-
201.
3. Baumann, Barbara, Snozzi, Mario, Zehnder, Alexander J.B. & Jan Roelof Van Der Meer.
1996. Dynamics of denitrification activity of Paracoccus denitrificans in continuous
culture during aerobic-anaerobic changes. Journal of Bacteriology, 4367-4374.
4. Betlach, M.R. & Tiedje, J.M. 1981. Kinetic explanation for accumulation of nitrite, nitric
oxide, and nitrous oxide during bacterial denitrification. Appl. Environ. Microbiol, 42,
1074-1084.
5. Blackmer, A.M. & Bremner, J.M. 1978. Inhibitory effect of nitrate on reduction of N2O to
N2 by soil microorganisms. Soil Biol. Biochem, 10, 187-191.
6. Blackmer, A. M. & Bremner, J.M. 1979. Stimulatory effect of nitrate on reduction of N2O
to N2 by soil microorganisms. Soil Biol. Biochem., 11, 313-315.
7. Bowman, R.A. & Focht, D.D. 1974. The influence of glucose and nitrate concentrations
upon denitrification rates in sandy soils. Soil Biol. Biochem., 6, 297-301.
8. Bremner, J.M. & Shaw, K. 1958. Denitrification in soils. II. Factors affecting
denitrification. J. Agric. Sci., 51, 40-52.
9. Broadbent, F.E. 1951. Denitrification in some California soils. Soil Sci., 72, 129-137.
10. Burford, J. & Bremner, J.M. 1975. Relationships between the denitrification capacities of
soils and total water soluble and readily decomposable soil organic matter. Soil Biol.
Biochem., 11, 261-267.
11. Burns, L.C., Stevens, R.J. & Laughlin, R.J. 1996. Production of nitrite in soil by
simultaneous nitrification and denitrification. Soil. Biol. Biochem., 28, 609-616.
12. Chaussod, R., Houot, S., Guiraud, G. & Hetier, J.M. 1988. Size and turnover of the
microbial biomass in agricultural soils: laboratory and field measurements. In: Nitrogen
efficiency in agricultural soils and the efficient use of fertilizer nitrogen (Jenkinson, D.S.,
and K.A. Smith Eds.) pp. 312-326. Elsevier Science, London.
90

CHAPITRE 2
13. Cho, C.M., & Sakdinan, L. 1978. Mass spectrometric investigation on denitrification.
Can. J. Soil Sci., 58, 443-457.
14. Cochran, W.G. 1950. Estimation of bacterial densities by means of the « most probable
number ». Biometrics, 6, 105-116.
15. Conrad, R. 1996. Soil microorganisms as controllers of atmospheric trace gases (H2, CO,
CH4, OCS, N2O and NO). Microbiol. Rev., 60, 609-640.
16. Cooper, G.S. & Smith, R.L. 1963. Sequence of products formed during denitrification in
some diverse western soils. Soil Sci. Soc. Am. Proc., 27, 659-662.
17. Decker, K., Jungermann, K. & Thauer, R. K. 1970. Energy production in anaerobic
organisms. Angew. Chem. Internat. Edit., 9(2).
18. Dendooven, L. & Anderson, J.M. 1994. Dynamics of reduction enzymes involved in the
denitrification process in pasture soil. Soil. Biol. Biochem., 26(11), 1501-1506.
19. Dröge, M., Pühler, A. & Selbitschka, W. 1999. Horizontal gene transfer among bacteria in
terrestrial and aquatic habitats as assessed by microcosm and field studies. Biol. Fertil.
Soils, 29, 221-245
20. Edwards, R.M. & Tiedje, J.M. 1981. Determination of Km for dissimilatory nitrate
reduction by cells of Pseudomonas fluorescens. Abst. Ann. Meet. Am. Soc. Microbiol., 48,
181.
21. Ellis, S., Howe, M.T., Goulding, K.W.T., Mugglestone, M.A. & Dendooven, L. 1998.
Carbon and nitrogen dynamics in a grassland soil with varying pH: effect of pH on the
denitrification potential and dynamics of the reduction enzymes. Soil. Biol. Biochem.,
30(3), 359-367.
22. Fewson, C.A. & Nicholas, J.D. 1961. Nitrate reductase from Pseudomonas aeruginosa.
Biochim. Biophys. Acta., 49, 335- 349.
23. Firestone, M.K., Smith, M.B., Firestone, R.B. & Tiedje, J.M. 1979. The influence of
nitrate, nitrite and oxygen on the composition of the gaseous products of denitrification in
soil. Soil Sci. Soc. Am. J., 43, 1140-1144.
24. Firestone, M.K. & Tiedje, J.M. 1979. Temporal change in nitrous oxide and dinitrogen
from denitrification following onset of anaerobiosis. Applied and Environmental
Microbiology, 38, 673-679.
91

CHAPITRE 2
25. Gaskell, J.F., Blackmer, A.M. & Bremner, J.M. 1981. Comparison of effects of nitrate,
nitrite and nitric oxide on reduction of nitrous oxide to dinitrogen by soil microorganisms.
Soil Sci. Soc. Am. J., 45, 1124-1127.
26. Graedel, T.E. & Crutzen, P.J. 1992. Atmospheric change. An earth system perspective.
W.H. Freeman and Company, New York.
27. Granli, T. & Bockman, O.C. 1994. Nitrous oxide from agriculture. Norv. J. Agri. Sci., 12,
1-125.
28. Grant, R.F. 1991. A technique for estimating denitrification rates at different soil
temperatures, water contents and nitrate concentrations. Soil Science, 152, 41-52.
29. Grant, R.F. 1993a. Evolution of nitrous oxide from soil: I. model development. Soil
Science, 156, 259-265.
30. Grant, R. F. 1995. Mathematical modelling of nitrous oxide evolution during nitrification.
Soil Biology and Biochemistry, 27(9), 1117-1125.
31. Groffman, P.M. 1991. Ecology of nitrification and denitrification in soil evaluated at
scales relevant to atmospheric chemistry. pp. 201-217 in J.E. Rogers & W.B. Whitman
(eds.). Microbial production and consumption of greenhouse gases: methane, nitrogen
oxides and halomethanes. American Society for Microbiology, Washington, D.C.
32. Guérin-Dachkevitch, N. 1999. Emissions de N2O par les sols cultivés, effet de la teneur en
NO3- et de la température. PhD, Burgundy University, France.
33. Guthrie, J.M. & Duxburry, J.M. 1978. Nitrogen mineralization and denitrification in
organic soils. Soil Sci. Soc. Am. J., 42, 908-912.
34. Hénault, C. 1993. Quantification de la dénitrification dans les sols à l’échelle de la
parcelle cultivée, à l’aide d’un modèle prévisionnel. Thesis, E.N.S.A., Montpellier. 108 p.
35. Hénault, C. & Germon, J.C. 1995. Quantification de la dénitrification et des émissions de
protoxyde d'azote (N2O) par les sols. Agronomie, 15, 321-355.
36. Holtan-Hartwig, Liv, Dörsch, Peter & Bakken, Lars Reier. 2000. Comparison of
denitrifying communities in organic soils: kinetics of NO3- and N2O reduction. Soil
Biology and Biochemistry, 32, 833-843.
37. I.P.C.C., 1996. Climate change 1995: the science of climate change: contribution of
working group I to the second assessment report of the intergovernmental panel on
climate change. (eds J.T Houghton, L.G. Meira Filho, B.A. Callander, N. Harris, A.
Kattenberg & K. Maskell). Cambridge University Press, Cambridge.
38. Kaspar, H.F. 1985. The denitrification capacity of sediment from a hypereutrophic lake.
Freshwater Biol., 15, 449-453.
92

CHAPITRE 2
39. Kieft Thomas, L., Soroker, Edith & Firestone, Mary K. 1987. Microbial biomass response
to a rapid increase in water potential when dry soil is wetted. Soil. Biol. Biochem., 19(2),
119-126.
40. Klemedtsson, L., Svensson, B.H., Lindberg, T. & Rosswall, T. 1977. The use of acetylene
inhibition of nitrous oxide reductase in quantifying denitrification in soils. Swedish. J.
agric. Res., 7, 179-185.
41. Knowles, R. 1982. Denitrification. Microbiol. Rev., 46, 43-70.
42. Lalisse-Grundmann, G., Brunel, B. & Chalamet, A. 1988. Denitrification in a cultivated
soil: optimal glucose and nitrate concentrations. Soil Biol. Biochem., 20, 839-844.
43. Leffelaar, P.A., & Wessel, W. 1988. Denitrification in a homogeneous closed system:
experiment and simulation. Soil Sci., 146, 335-349.
44. Lensi, R., Clays-Josserand, A. & Jocteur Monrozier, L. 1995. Denitrifiers and denitrifying
activity in size fractions of a mollisol under permanent pasture and continuous cultivation.
Soil. Biol. Biochem., 27(1), 61-69.
45. Letey, J., Valoras, N., Hadas, A. & Focht, D.D. 1980. Effect of air-filled porosity, nitrate
concentration and time on the ratio of N2O/N2 evolution during denitrification. J. Environ.
Qual., 9, 227-231.
46. Li, C., Frolking, S. & Frolking, T.A. 1992. A model of nitrous oxide evolution of soil
driven by rainfall events: 1- Model structure and sensitivity. Journal of Geophysical
Research, 97(D9), 9758-9776.
47.Li, C., Frolking, S. & Frolking, T.A. 1992. A model of nitrous oxide evolution of soil
driven by rainfall events: 2- Model applications. Journal of Geophysical Research,
97(D9), 9777-9783.
48. Lovel, R.D. & Jarvis, S.C. 1998. Soil Microbial Biomass and activity in soil from
different grassland management treatments stored under controlled conditions. Soil. Biol.
Biochem. 30(14), 2077-2085.
49. Luo, J., White, R.E, Ball, P.R. & Tillman, R.W. 1996. Measuring denitrification activity
in soils under pasture: optimizing conditions for the short-term denitrification enzymes
assay and effects of soil storage on denitrification activity. Soil Biol. Biochem., 23(3),
409-417.
50. Maag, M., Malionovsky, M. & Nielsen, S.M. 1997. Kinetics and temperature dependence
of potential denitrification in riparian soils. J. Environ. Qual., 26, 215-223.
51. Malhi, S.S., McGill, W.B. & Nyborg, M. 1990. Nitrate losses in soils: effect of
temperature, moisture and substrate concentration. Soil Biol. Biochem., 22(6), 733-737.
93

CHAPITRE 2
52. Mariotti, A., Germon, J.C., Hubert, P., Kaiser, P., Letolle, R., Tardieux, J. & Tardieux, P.
1981. Experimental determination of nitrogen kinetic isotope fractionation: Some
principles; illustration for the denitrification and nitrification processes. Plant and Soil,
62, 413-430.
53. Marquardt, D. 1963. An algorithm for least-squares estimation of non linear parameters.
SIAM J. Appl. Math., 11, 431-441.
54. McConnaughey, P.K. & Bouldin, D.R. 1985a. Transient microsite models of
denitrification: I. Model development. Soil Sci. Soc. Am. J., 49, 886-891.
55. McConnaughey, P.K. & Bouldin, D.R. 1985b. Transient microsite models of
denitrification: II. Model results. Soil Sci. Soc. Am. J., 49, 891-895.
56. McConnaughey, P.K. & Bouldin, D.R. 1985c. Transient microsite models of
denitrification: III. Comparison of experimental and model results. Soil Sci. Soc. Am. J.,
49, 896-901.
57. McKenney, D.J., Shuttleworth, K.F., Vriesacker, J.R. & Findlay, W.I. 1982. Production
and loss of Nitric oxide from denitrification in anaerobic Brookston clay. Appl. Environ.
Microbiol., 43(3), 534-541.
58. Murray, R.E., Parsons, L.L. & Smith, M.S. 1989. Kinetics of nitrate utilization by mixed
populations of denitrifying bacteria. Appl. Environ. Microbiol., 55, 717-721.
59. Myrold, D.D. & Tiedje, J.M. 1985. Diffusional constraints on denitrification in soil. Soil.
Sci. Soc. Am. J., 49, 651-657.
60. Nakajima, M., Hayamizu, T. & Nishimufa, H. 1984. Effect of oxygen concentration on
the rate of denitrification and denitrification in the sediments of an eutrophic lake. Water
Res., 18, 335-338.
61. Nömmik, H. 1956. Investigations on denitrification in soil. Acta Agric. Scand., 6, 195-
228.
62. Nömmik, H., Pluth, D.J. & Melin, J. 1984. Dissimilatory reduction of 15N-labeled nitrate
in the presence of non-labeled nitric oxide or nitrous oxide. Can. J. Soil Sci., 64, 21-29.
63. Nougier, J.P. 1983. Méthodes de calcul numérique. Masson, Paris, 317 p.
64. Otte, Sandra, Grobben, Nicole G., Robertson, Lesley A., Jetten, Mike S.M. & Kuenen,. J.
Gijs 1996. Nitrous oxide Production by Alcaligenes faecalis under transient and dynamic
aerobic and anaerobic conditions. Applied and Environmental Microbiology, 2421-2426.
65. Patureau, D., Bernet, N. & Moletta, R. 1996. Study of the denitrifying enzymatic system
of Comamonas sp. Strain SGLY2 under various aeration conditions with a particular view
on nitrate and nitrite reductases. Current Microbiology, 32, 25-32.
94

CHAPITRE 2
66. Reddy, K. R., Patrick, W.H. & Phillips, R. E. 1978. The role of nitrate diffusion in
determining the order and rate of denitrification in flooded soil: I Experimental results.
Soil Sci. Soc. Am. J., 42, 268-272.
67. Reddy, K. R., Rao, P.S.C. & Jessup, R. E. 1982. The effect of carbon mineralization on
denitrification kinetics in mineral and organic soils. Soil Sci. Soc. Am. J., 46, 62-68.
68. Renner, E. D. & Becker, G.E. 1970. Production of nitric oxide and Nitrous oxide during
denitrification by Corynebacterium nephredii. J. Bacteriology., 101(3), 821-826.
69. Richardson, David J. 2000. Bacterial respiration: a flexible process for a changing
environment. Microbiology, 146, 551-571.
70. Richaume A., Bernillon, D. & Faurie, G. 1992. Role of the intraspecific competition in the
regulation of agrobacterium tumefaciens transconjugant population level in soil
experiments. FEMS Microbiology Ecology, 86, 321-330.
71. Ross, D. J. & Tate, K. R. 1993. Microbial C and N, and respiratory activity, in litter and
soil of a southern beech (Nothofagus) forest: distribution and properties. Soil. Biol.
Biochem., 25(4), 477-483.
72. Shimuzu, T., Furukitwaki, T. & Tchikawak, K. 1978. Metabolic characteristics of
denitrification by Paracoccus denitrificans. J. Fermentation Technol., 56, 207-213.
73. Siedow, A., Cramm, R., Siddiqui, R.A. & Friedrich., B. 1999. A megaplasmid-borne
anaerobic ribonucleotide reductase in Alacaligenes eutrophus H16. J. Bacteriol., 181,
4919-4928.
74. Smith, K.A. 1990. Greenhouse gas fluxes between land surfaces and the atmosphere.
Prog. Phys. Geograph., 14, 349-372.
75. Smith, R.V., Doyle, R.M., Burns, L.C. & Stevens, R.J. 1997. A model for nitrite
accumulation in soils. Soil. Biol. Biochem., 29(8), 1241-1247.
76. Soohoo, C. & Hollocher, T.C. 1990. Loss of nitrous oxide reductase in Pseudomonas
aeruginosa cultured under N2O as determined by rocket immunoelectrophoresis. Appl.
Environ. Microbiol. 56, 3591-3592.
77. Standford, G., Vander Pol, R.A. & Dzienia, S. 1975. Denitrification rates in relation to
total and extractable soil carbon. Soil Sci. Soc. Am. Proc., 39, 284-289.
78. Stouthamer, A.H. 1973. A theoretical study on the amount of ATP required for synthesis
of microbial cell material. Antonie van Leeuwenhoek, 39, 545-565.
79. Stouthamer, A.H. 1988. Dissimilatory reduction of oxidized nitrogen compounds.
Biological Laboratory, Vrije Universiteit, Amsterdam, The Netherlands, 245-286.
95

CHAPITRE 2
80. Sudarshana, Padma & Knudsen, Guy R. 1995. Effect of parental growth on dynamics of
conjugative plasmid transfer in the pea spermosphere. Applied and Environmental
Microbiology, 3136-3141.
81. Terry, R.E. & Tate, R.L. 1980. The effect of nitrate and nitrous oxide reduction in organic
soils and sediments. Soil Sci. Soc. Am. J., 44, 744-746.
82. Van Cleemput, Oswald & Samater, Abdullahi H. 1996. Nitrite in soils: accumulation and
role in the formation of gaseous N compounds. Fertilizer Research, 45, 81-89.
83. Van Spanning, Rob J.M., De Boer, Anthonius P.N., Reijnders, Willem N.M., De Gier,
Jan-Willem L., Delorme, Cécile O., Stouthamer, Adriaan H., Westerhoff, Hans V., Harms,
Nellie & Van der Oost, John. 1995. Regulation of oxidative phosphorylation: the flexible
respiratory network of Paracoccus denitrificans. Journal of Bioenergetics and
biomembranes, 27(5).
84. Vavilin, V.A., Vasiliev, V.B., Ponomarev, A.V. & Rytow, S.V. 1994. Simulation model
“methane” as a tool for effective biogas production during anaerobic conversion of
complex organic matter. Biores. Tech., 48, 1-8.
85. Vinther, F.P., Eiland, F., Lind, A.M. & Elsgaard, L. 1999. Microbial biomass and
numbers of denitrifiers related to macropore channels in agricultural and forest soils. Soil
Biology and Biochemistry, 31, 603-611.
86. Weier, K.L., Doran, J.W., Power, J.F. & Walters, D.T. 1993. Denitrification and the
dinitrogen/nitrous oxide ratio as affected by soil water, available carbon and nitrate. Soil
Sci. Soc. Am. J., 57, 66-72.
87. Wijler, J. & Delwiche, C.C. 1954. Investigations on the denitrifying process in soil. Plant
Soil, 5, 155-169.
88. Wu, J., Jørgensen, R.G., B. Pommerening, Chaussod, R. & Brookes, P.C. 1990.
Measurement of soil microbial biomass C by fumigation-extraction – an automated
procedure. Soil Biol. Biochem., 22, 1167-1169.
89. Zumft, G. 1997. Cell biology and molecular basis of denitrification. Microbiology and
Molecular biology reviews, 533-616.
96

CHAPITRE 3
INFLUENCE D’UNE PRE-INCUBATION ANAEROBIE
SUR LA RESPIRATION ET LES EMISSIONS DE N2O
PAR DES MOTTES DE SOL EN INCUBATION
AEROBIE
Ce chapitre 3 correspond à un article « en cours de soumission » pour la
revue Soil Biology and Biochemistry : K. Khalil, P. Renault, B. Mary (2003)
Effect of transient anaerobic conditions on subsequent aerobic respiration
and N2O emission by soil clods
97

CHAPITRE 3
SUMMARY
The objective of this study was to assess the effect of an anaerobic pre-incubation on
subsequent aerobic respiration and N2O emission at the scale of soil clods. Nitrous oxide
production was measured in intact soil clods ∆ (compacted clods without visible porosity) and
Γ (clods with visible porosity) incubated under oxic conditions, with or without a 6 day
anaerobic pre-incubation. N2O emissions were much higher in clods that had been submitted
to anaerobic pre-incubation than in clods that did not experience this pre-incubation, although
very little nitrate remained in soil after the anaerobic period. 15N isotope tracing technique
was used to check whether N2O came from nitrification or denitrification. The results showed
that denitrification was the major process responsible for N2O emissions. The aerobic CO2
production rate was also measured in intact soil clods. It was greater in clods submitted to
anaerobic pre-incubation than in clods that did not undergo pre-incubation, suggesting that the
anaerobic pre-incubation lead to an accumulation of small compounds including fatty acids
which are readily available for microbial decomposition in aerobic conditions. This process
increases the aerobic CO2 production and favours the N2O emissions through denitrification.
Key-words: denitrification, anaerobiosis, nitrous oxide, aerobic respiration, soil clod.
98
CHAPITRE 3
INTRODUCTION
Nitrous oxide is trace gas involved in atmospheric pollution, it contributes to the
greenhouse effect (Smith, 1990; IPCC, 1996), and affects the chemistry of O3 in the upper
troposphere and lower stratosphere (Graedel and Crutzen, 1992). N2O is mainly produced in
soils during biological denitrification and nitrification (Groffman, 1991; Tortoso et al., 1990;
Conrad, 1996).
Various models, more or less complex, have been proposed to estimate N2O emissions
through nitrification and denitrification. Most of them account for the variations with time in
environmental variables such as soil water, temperature and NO3- content. Simplified models
(e.g. Parton et al., 1988; Hénault and Germon, 1995; Parton et al., 1996) represent N cycling
without simulating microbial dynamics and assume that the different N processes can be
represented as a function of the soil water, temperature and pH controls on microbial activity
without representing the microbial dynamics. The more complex models (e.g. Grant, 1995;
Khalil et al., 2003a) explicitly consider microbial dynamics but do not consider variations in
potential microbial activities, particularly the variations in respiration, denitrification and N2O
reduction activities. The importance of these variations is questionable.
It has been shown that potential denitrification may be correlated with soluble organic
matter and easily mineralisable carbon (Burford and Bremner, 1975). Anaerobic conditions
may lead to the accumulation of organic compounds that may be thereafter easily consumed
in aerobic conditions and that temporarily decrease the pH of the soil solution (Förstner,
1987). Acetate is the main volatile fatty acid produced by anaerobic metabolism (Tsusuki et
al., 1987). It may be consumed under conditions that enhance H2 consumption, i.e. conditions
promoting sulphate reduction (Pelmont, 1993), homoacetogenesis (Chin and Conrad, 1995)
and methanogenesis (Conrad, 1999). An initial pH decrease has been observed in alcaline
soils, which results from an increase in CO2 concentration and a transient production of
volatile fatty acids (Tsusuki et al., 1987). This pH decrease may be minimized by the
consumption of protons during the reduction of NO2- into N2O (Stams, 1994). The
consumption of volatile fatty acids, the dissolution of metal oxides and oxyhydroxides and the
partial consumption of CO2 during homoacetogenesis and methanogenesis tend to lead to a
late increase in soil pH.
Such changes in pH and in easily mineralisable C compounds, which could occur during
99

CHAPITRE 3
the transition of anaerobic to aerobic conditions, might lead to important changes in potential
respiration or denitrification activities.
The micro-scale approach to study denitrification is motivated by the fact that, in many
cases, the conditions experienced by soil organisms at the microscale are not reflected by
measurements on bulk soil samples (Parkin, 1987). For example, O2 concentrations may
decrease from values nearly equal to the atmospheric concentration to zero values within a
few millimeters in soil clods (Sextone et al., 1985; Sierra et al., 1995). Other examples of
anoxic sites close to air-filled pores when organic residues were present (Rappoldt, 1992)
with a thin layer of covering water (i.e. thickness of about 160 µm) are sufficient for
anaerobiosis to occur (Parkin, 1987).
The aim of this work was to assess the consequence of a prolonged anaerobic period (6
days) on subsequent aerobic respiration and net N2O emission through denitrification.
Experiments were performed at the soil clod level. We used C2H2 to inhibit N2O reduction
and 15N tracing technique to assess the origin of N2O emission.
100

CHAPITRE 3
MATERIALS AND METHODS Soil clod sampling and conservation
Experiments were performed on an Orthic Luvisol (FAO classification) sampled in Mons-
en-Chaussée in Northern France (49°80' N, 3°60' E). The soil was cultivated with maize in
2000. The properties of the soil were as follows: clay, 194 g kg-1; silt, 706 g kg-1; sand, 68 g
kg-1; pH (water), 8.2; total CaCO3, 32 g kg-1; organic C, 8.52 g kg-1; total N 1.00 g kg-1. At
sampling time, it contained 4.70 mg NO3-N kg-1. Clods were sampled in the ploughed layer
(10-30 cm depth) on September 12, 2000. Two sets of clods were separated: clods ∆, with a
massive structure and no visible porosity (resulting from compaction due to traffic) and clods
Γ, with a fragmentary structure and visible porosity (Richard et al., 1999). The larger clods
were gently broken down immediately after sampling and then calibrated : we kept clods
between 2.5 and 3 cm size. In order to reduce microbial activity during storage, the clods were
air-dried during 3 days to obtain a residual moisture close to 0.10 g g-1 soil. They were stored
at 2°C until the beginning of the experiments, i.e. until November 2000, January 2002 and
May 2002, for experiments 2, 3 and 1, respectively. Water evaporation occurred during
storage, so that the soil moisture content at the beginning of experiments was 0.11, 0.07 and
0.06 g.g-1, for experiments 2, 3 and 1, respectively.
Batch incubations and measurements
Experiment 1
In order to check the effect of anaerobic condition of the subsequent aerobic respiration,
we measured CO2 production for clods ∆ and Γ that had either experimented or not a 6.6 day
period of preliminary anaerobic incubation.
Aerobic CO2 production was measured using the following procedure. ∆ and Γ clods were
first rewetted with water at 20°C on suction tables successively at –10 kPa suction during
1 day, -5 kPa during 1 day, -1 kPa during 1 day, and –0.5 kPa during 4 days. This procedure
ensured a slow rewetting process which prevented crack formation. The soil moisture content
thus obtained was 0.20 g.g-1 and 0.23 g.g-1 for ∆ and Γ clods, respectively. A set of 32 clods
101

CHAPITRE 3
of each type was then incubated in anaerobic conditions using 500 mL flasks: each flask
containing 4 clods received 3 successive cycles of 3 minutes vacuum and 3 minutes of pure
N2 gas addition. A 10 mL volume of N2 was removed and replaced by the same volume of
C2H2 in order to create the same conditions as in experiments 2 and 3. All the flasks were
incubated at 20°C in the dark during 6.6 days. After this anaerobic period, the flasks were
flushed with air; the clods were transferred 3 hours later in a 1 L airtight jar with a beaker
containing 10 mL NaOH 0.1 N in order to trap CO2. Eight replicate jars (each containing 4
clods that had followed the anaerobic pre-incubation) were thus incubated at 20°C in aerobic
condition during 4 days. The same procedure was applied to a similar number of clods that
did not experience the anaerobic preincubation, i.e. that were transferred directly from the
suction table to the 1 L jars. The jars were opened every 24 h during 4 days, aerated for 5
minutes and the NaOH beaker was replaced. Trapped CO2 was precipitated as barium
carbonate by adding excess of BaCl2 solution. The remaining NaOH was then titrated with
HCl 0.1 N at pH 8.62.
Soluble organic C was measured in the clods at the end of the aerobic incubation. It was also
measured in additional clods that experienced anaerobic conditions, at the end of the
rewetting phase, and at the end of the anaerobic pre-incubation, always with 8 replicates.
Organic C was extracted with a solution of K2SO4 0.03 M and measured with a 1010 organic
carbon analyzer (O.I. Analytical, College Station, Texas, USA) using the method of persulfate
oxidation at 100 °C (Barcelona, 1984). At the end of incubation, one third of the 4 clods
contained in each jar was air-dried and finely ground; the total C and N were measured with
an automatic CHN analyzer (Carlo Erba, NA1500, Milan, Italy). The last third of the 4 clods
contained in each jar was used to measure the pH of the soil solution for both clods that
experimented or not experimented anaerobic conditions. pH was also measured after the
rewetting phase for clods that didn't experiment anaerobic conditions, and after the anaerobic
pre-incubation for clods that experimented anaerobic conditions. For each flask sample, we
added a mass of ultra pure water equal to the double of soil mass. The flask was closed and
shaken for 10 minutes, then transferred to a beaker and left for 2 minutes. The electrode
(Calomel electrode K401, Glass electrode G202B, Copenhagen, Denmark) was plunged into
the beaker and the pH was recorded every minute during 5 minutes.
102

CHAPITRE 3
Experiment 2
In order to check the effect of anaerobic condition of the subsequent N2O emissions, we
measured N2O net emissions from clods ∆ and Γ in air that had either or not experienced a 6.6
day period of anaerobic pre-incubation. Net N2O emissions were measured using the
following procedure.
∆ and Γ clods were first rewetted with either deionized water or a KNO3 solution (4 g L-1) at
20°C on suction tables during 7 days as previously described. The final moisture obtained was
0.22 and 0.24 g g-1 for ∆ and Γ clods, respectively. Clods rewetted with deionized water were
then pre-incubated in anaerobic conditions at 20°C during 6.6 days, whereas clods rewetted
with KNO3 were not pre-incubated. The pre-incubation of water rewetted clods concerned 16
∆ and 16 Γ clods, each of them being inserted in a 150 mL flask. Anaerobiosis was realised
by injecting N2 as described before; a volume of 8 mL of N2 was removed and replaced by 7
mL of C2H2 and 1 mL of krypton. During the pre-incubation, gas samples were withdrawn at
1, 2, 3, 4, 5 and 6 days and analysed for N2O, N2, CO2, O2, Kr and C2H2 concentrations. The
mineral N (NH4+, NO2
- and NO3-) content of the soil was measured at day 0 and 6, with 6
replicates. At day 6.6, the atmosphere of the flasks was replaced with air as indicated before;
the procedure was repeated 1 hour later in order to ensure that C2H2 has been totally removed.
Water or KNO3 rewetted clods were then incubated aerobically for 7 hours, in airtight 150 mL
flasks filled with air at 20°C, 1 mL of air being replaced with Kr at the beginning of the
incubation, with 10 replicates. Gas samples were taken with a syringe 14, 16, 18 and 20 hours
after the addition of Kr for clods rewetted with KNO3 solution; 1, 3, 5 and 7 hours after the
addition of Kr for clods rewetted with water. The samples were analysed for N2O, N2, CO2,
O2 and Kr concentrations. The final mineral N (NH4+, NO2
- and NO3-) content of the soil was
determined on each of the 10 replicates.
The flasks samples, rewetted with KNO3 solution, were thereafter opened for a few
minutes in order to release the trapped gases. After closing the flasks, 7 and 1 ml of gas were
replaced by C2H2 and Kr, respectively. The 10 ∆ and 10 Γ replicates were incubated at 20°C
one time more. Gas samples were withdrawn with a syringe 14, 16, 18 and 20 h after the
addition of C2H2 and analysed for N2O, N2, CO2, O2, Kr and C2H2 concentrations. The final
'[NO3-]+[NO2
-]' and [NH4+] were measured on all the ∆ and Γ replicates.
Nitrous oxide concentration was determined by gas chromatography equipped with an
electron capture detector (HP 5890 Series II, USA) fitted with a Porapak Q column (80-100
103

CHAPITRE 3
mesh, 2 m) coupled to an integration software on a PC Workstation. The carrier gas was Ar-
CH4 (95/5); the oven and detector temperatures were set at 50 and 300°C, respectively. N2,
CO2, O2, Kr and C2H2 concentrations were measured on a TCD gas chromatograph (HP 5890
Series II, USA) fitted with Porapak Q (80-100mesh, 1.8 m) and molecular sieve (1-5 Å,
1.8 m) columns coupled to the same integration software. The carrier gas was He; the oven
and detector temperatures were fixed at 50 and 120 °C, respectively. The relative precision of
each chromatograph was 0.5-1%. The mineral N content of clods were extracted with a 1 M
KCl solution (soil:solution ratio = 1:5). Measurements were performed with a continuous
flow colorimeter (Skalar Analytical, Breda, The Netherlands) using the method proposed by
Henriksen and Selmer-Olsen (1970).
Experiment 3
This experiment aimed at determining the origin of N2O emissions, from nitrification or
denitrification, using 15N isotope tracing technique. 15N isotope was applied either as KNO3 or
urea, both having a 50% atom enrichment. Urea was chosen instead of NH4+ due to its higher
diffusion rate in soil and its rapid hydrolysis into NH4+ already observed in this soil (Recous
et al., 1988). Small amounts of N were applied in order to change little the amounts of
mineral N in soil: i. e. 0.5 mg N kg-1 soil as urea-N and 2.0 mg N kg-1 soil as NO3-N.
Clods were first rewetted with water using the procedure for Experiment 2. We then added
0.3 mL of labelled urea or KNO3 solution to each clod, and submitted them to anaerobiosis in
presence of C2H2 as described for Experiment 2. For each of the two added solutions, 6 clods
were thus pre-incubated at 20°C during 144 h. At the end of this pre-incubation period, 3
clods were used to measure the initial concentrations of NO3-, NO2
-, NH4+, and the 15N atom%
excess of NH4+ and (NO2
-+NO3-).The N2 atmosphere of the flasks containing the 3 other clods
was replaced with air after 14 additional hours by alternating 3 successive cycles of 3 minutes
vacuum and 3 minutes air filling, this procedure being repeated 1 hour later. The clods were
then incubated in aerobic condition at 20°C. Gas of the flasks was sampled after 8 h with
10 mL Venoject® vacuum tubes and dual-ended sampling flasks of 250 mL. 0.2 mL of the
Venoject® tubes was later withdrawn with a syringe and analysed for N-(N2+N2O)
measurement and 15N isotopic composition. The 250 mL sampling was used for N2O and 15N2O measurement. 3 clods were used to extract and measure the final soil mineral N content
and 15N enrichment.
104

CHAPITRE 3
N-(N2+N2O) concentrations and their 15N composition were determined by an automatic CHN
analyzer (Carlo Erba, NA 1500, Milan, Italy) coupled to a mass spectrometer (Fisons,
Isochrom, Manchester, England). N2O and 15N2O were analysed after automatic pre-
concentration on a trace gas - mass spectrometer equipment (Micromass, Manchester,
England). The soil mineral N of the clods was extracted with a 1 M KCl solution
(soil:solution ratio = 1:5). Measurements of ammonium, nitrite and nitrate concentrations
were performed with a TRAACS 2000 analyzer (Bran & Luebbe, Norderstedt, Germany)
using the methods proposed by Kamphake et al. (1970) for NO3- and NO2
- analysis and Krom
(1980) for NH4+ analysis. The 15N enrichments of NH4
+ and (NO2-+NO3
-) were obtained after
separation by micro-diffusion towards a solid support (Brooks et al., 1989) which was
thereafter dried and placed in a tin capsule for combustion in the CHN analyzer coupled to the
mass spectrometer.
Data treatment
Model of aerobic CO2 production with time
We assume that C decomposition rate by microbes during the aerobic condition was
proportional to the amount of substrates, i.e. decomposable organic pools. For clods without
anaerobic pre-incubation, only one substrate pool S1 (mol C kg-1 soil) was taken into account.
It disappears at the following rate:
111 Sk
dtdS
−= (1)
where k1 (h-1) is a rate constant, and t the time (h). Variation of this pool with time is then:
(2) ( tkSS 1101 exp −= )
The rate of CO2 production can be written:
( ) ( ) ( tkSYkdt
dSYv 11011
111 exp11 −−=−−= ) (3)
where Y1 is the assimilation yield of substrate 1 by microbes.
In the case of clods previously submitted to anaerobic conditions, our results suggest that this
pretreatment lead to the creation of an additional decomposable pool S2 (mol C kg-1 soil)
decomposing with a rate constant k2 (h-1):The CO2 production rate in this treatment is then:
105

CHAPITRE 3
( ) ( ) ( ) ( ) ( ) ( tkYktkYkdt
dSY
dtdS
Yv 2221112
21
12 exp1exp111 −−+−−=−−−−= ) (4)
where Y2 is the assimilation yield of substrate 2 by microbes.
We first estimated the parameters k1 and the product (1-Y1) S10 by fitting simulated CO2
production rates (Eq. 3) to values measured in clods ∆ and Γ which had not been submitted to
anaerobic pre-incubation. The optimisation was run simultaneously in the two types of clods,
assuming that the decomposition rate k1 was the same in both soils. The procedure was
applied to the mean of the 8 replicates. Using these last values, we then estimated the other
two parameters (k2 and (1-Y2) S20) by fitting simulated CO2 production rates (Eq. 4) to values
measured in clods ∆ and Γ which had been submitted to anaerobic pre-incubation. Again we
assumed that the decomposition rate k2 was the same in both types of clods.
Relationship between aerobic CO2 production and soluble organic C
In order to check whether there was a relationship between the aerobic CO2 production and
the soluble organic C, we presented variation of the mean aerobic CO2 production rate (mol
kg-1 s-1) with soluble organic C (mg kg-1). Soluble organic C was measured in clods submitted
to anaerobic pre-incubation: (i) after rewetting on suction table; (ii) after anaerobic pre-
incubation; and (iii) at the end of the measurement periods. Soluble organic C was measured
only at the last date in clods which had not been submitted to anaerobiosis. They were linked
with aerobic CO2 production rates during 24 h (i) just after rewetting, (ii) just after anaerobic
pre-incubation, and (iii) corresponding to the last periods of measurements, respectively. The
linear regression was applied to aerobic CO2 production rate for clods ∆ and Γ.
Estimating actual CO2 production from its accumulation in Experiment 2
Since CO2 is soluble and dissociated in water, gaseous CO2 is only a part of total CO2
present in the flask when the gas is not trapped as in Experiment 2. In this case, we have to
account for its solubilisation in water, and its first dissociation (Stumm and Morgan, 1996):
(5) ( ) *322 COHCO g ←
→
with a solubility ratio S = H2CO3*/CO2 equal to 0.87 at 20°C.
106

CHAPITRE 3
(6) +− +←→+ OHHCOOHCOH 332
*32
with a pKa equal to 6.35 at 20°C.
At the end of the experiment, the total amount of CO2 (mol) in the flask is equal to:
( )( )af pKpHwgf SVVCQ −++= 101 (7)
where Cf is the CO2 concentration in the flask atmosphere (mol m-3), Vg and Vw are the gas
and soil solution volumes (m3), respectively; the subscript f refers to final values.
If we neglect the contribution of calcite in the production of HCO3- anions, it is possible to
estimate the actual CO2 production rate Pa (mol kg-1 s-1) as a function of the apparent
production P)
(mol kg-1 s-1):
( aiaf pKpHi
pKpHf
w
g
wa CC
tm
SVSV
VPP −− ⋅−⋅∆
+⎟⎟
⎠
⎞
⎜⎜
⎝
⎛+= 10101
) ) (8)
where m is the clod mass (kg), ∆t the incubation time (s), and pHi the initial pH.
In addition, we assume the following dependence of the pH to CO2 concentration in the gas
phase:
( ) ⎟⎟⎠
⎞⎜⎜⎝
⎛−−+=
3minmaxmin exp
kCpHpHpHpH (9)
where pHmax is the maximum pH value in absence of CO2, pHmin its minimum value at high
CO2 partial pressure, and k3 a constant (mol m-3) which characterises the dependence to CO2
concentration (C). For the calculations, we put pHmax = 8.20, pHmin = 5.75 and we successively
estimated the actual aerobic CO2 production rate for k3 equal to 0.83, 1.25 or 1.66 mol m-3,
corresponding to 2 %, 3% or 4% CO2, respectively. These values were obtained by fitting
simulations of more complete geochemical models to this simple relationship for soils with
traces of calcite.
107
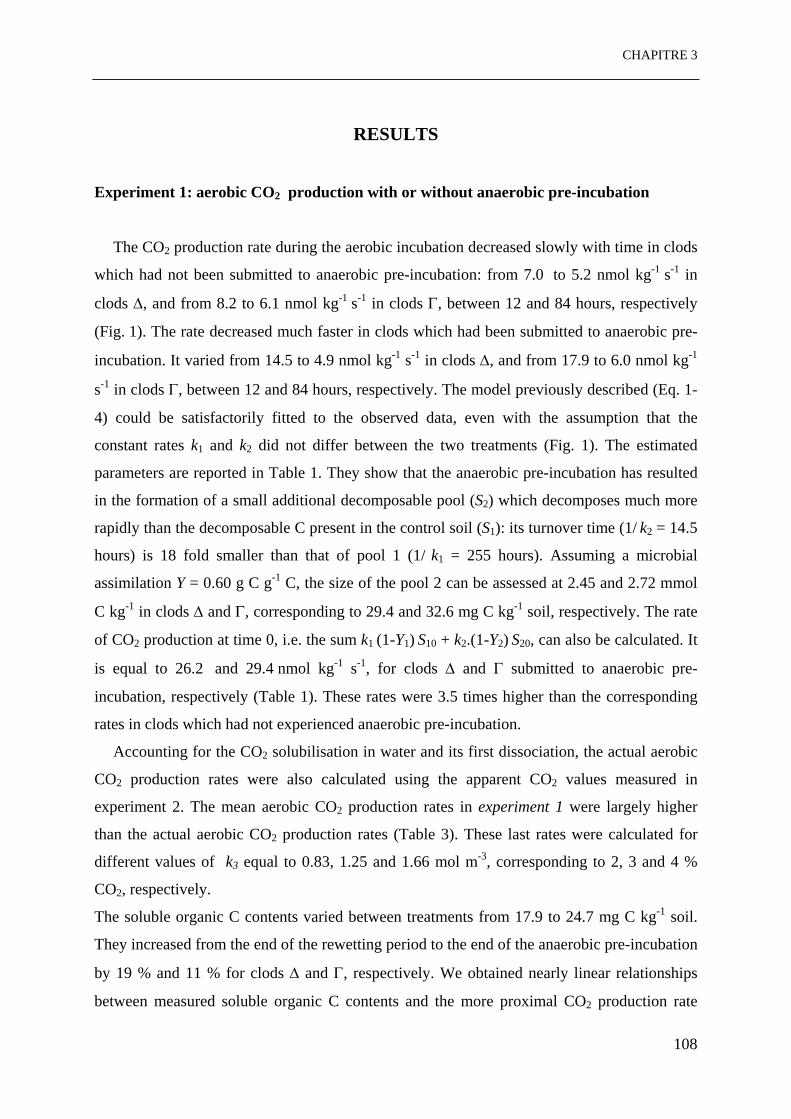
CHAPITRE 3
RESULTS
Experiment 1: aerobic CO2 production with or without anaerobic pre-incubation
The CO2 production rate during the aerobic incubation decreased slowly with time in clods
which had not been submitted to anaerobic pre-incubation: from 7.0 to 5.2 nmol kg-1 s-1 in
clods ∆, and from 8.2 to 6.1 nmol kg-1 s-1 in clods Γ, between 12 and 84 hours, respectively
(Fig. 1). The rate decreased much faster in clods which had been submitted to anaerobic pre-
incubation. It varied from 14.5 to 4.9 nmol kg-1 s-1 in clods ∆, and from 17.9 to 6.0 nmol kg-1
s-1 in clods Γ, between 12 and 84 hours, respectively. The model previously described (Eq. 1-
4) could be satisfactorily fitted to the observed data, even with the assumption that the
constant rates k1 and k2 did not differ between the two treatments (Fig. 1). The estimated
parameters are reported in Table 1. They show that the anaerobic pre-incubation has resulted
in the formation of a small additional decomposable pool (S2) which decomposes much more
rapidly than the decomposable C present in the control soil (S1): its turnover time (1/ k2 = 14.5
hours) is 18 fold smaller than that of pool 1 (1/ k1 = 255 hours). Assuming a microbial
assimilation Y = 0.60 g C g-1 C, the size of the pool 2 can be assessed at 2.45 and 2.72 mmol
C kg-1 in clods ∆ and Γ, corresponding to 29.4 and 32.6 mg C kg-1 soil, respectively. The rate
of CO2 production at time 0, i.e. the sum k1 (1-Y1) S10 + k2.(1-Y2) S20, can also be calculated. It
is equal to 26.2 and 29.4 nmol kg-1 s-1, for clods ∆ and Γ submitted to anaerobic pre-
incubation, respectively (Table 1). These rates were 3.5 times higher than the corresponding
rates in clods which had not experienced anaerobic pre-incubation.
Accounting for the CO2 solubilisation in water and its first dissociation, the actual aerobic
CO2 production rates were also calculated using the apparent CO2 values measured in
experiment 2. The mean aerobic CO2 production rates in experiment 1 were largely higher
than the actual aerobic CO2 production rates (Table 3). These last rates were calculated for
different values of k3 equal to 0.83, 1.25 and 1.66 mol m-3, corresponding to 2, 3 and 4 %
CO2, respectively.
The soluble organic C contents varied between treatments from 17.9 to 24.7 mg C kg-1 soil.
They increased from the end of the rewetting period to the end of the anaerobic pre-incubation
by 19 % and 11 % for clods ∆ and Γ, respectively. We obtained nearly linear relationships
between measured soluble organic C contents and the more proximal CO2 production rate
108

CHAPITRE 3
0
10
20
30
0 24 48 72 96Time (hours)
CO
2 (n
mol
kg-
1 s-
1)With anaerobiosis
Without anaerobiosis
Clods ∆
0
10
20
30
0 24 48 72 96Time (hours)
CO
2 (n
mol
kg-1
s-1
)
Clods Γ
0
10
20
30
0 24 48 72 96Time (hours)
CO
2 (n
mol
kg-1
s-1
)
Clods Γ
Figure 1. Rate of CO2 production measured (symbols) and simulated (continuous lines)
during aerobic incubation following either a 6.6 day anaerobic preincubation
(closed symbols), or no preincubation (open symbols), in clods ∆ or Γ. Each point
is the mean of 8 replicates made of 4 soil clods. The bars represent the standard
errors.
109

CHAPITRE 3
Clods ∆ Clods Γ
(1-Y1) S10 mol kg-1 6.82 10-3 7.81 10-3
1/ k1 h 254 254
(1-Y2) S20 mol kg-1 0.98 10-3 1.09 10-3
1/ k2 h 14.5 14.5
Table 1. Parameters obtained by fitting the CO2 production rate model (Equations 3-4) to the
CO2 rates measured during a 4 day aerobic incubation with or without preliminary anaerobic
incubation.
110
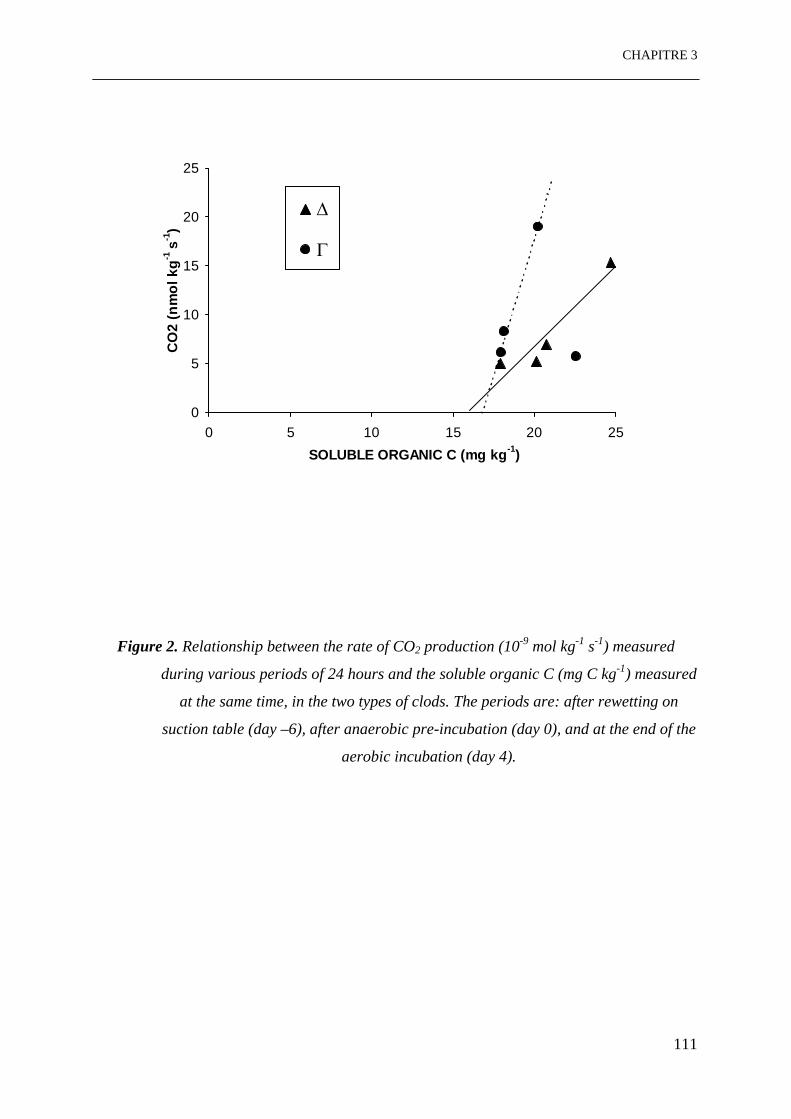
CHAPITRE 3
0
5
10
15
20
25
0 5 10 15 20 25SOLUBLE ORGANIC C (mg kg-1)
CO
2 (n
mol
kg-1
s-1)
∆
Γ
Figure 2. Relationship between the rate of CO2 production (10-9 mol kg-1 s-1) measured
during various periods of 24 hours and the soluble organic C (mg C kg-1) measured
at the same time, in the two types of clods. The periods are: after rewetting on
suction table (day –6), after anaerobic pre-incubation (day 0), and at the end of the
aerobic incubation (day 4).
111
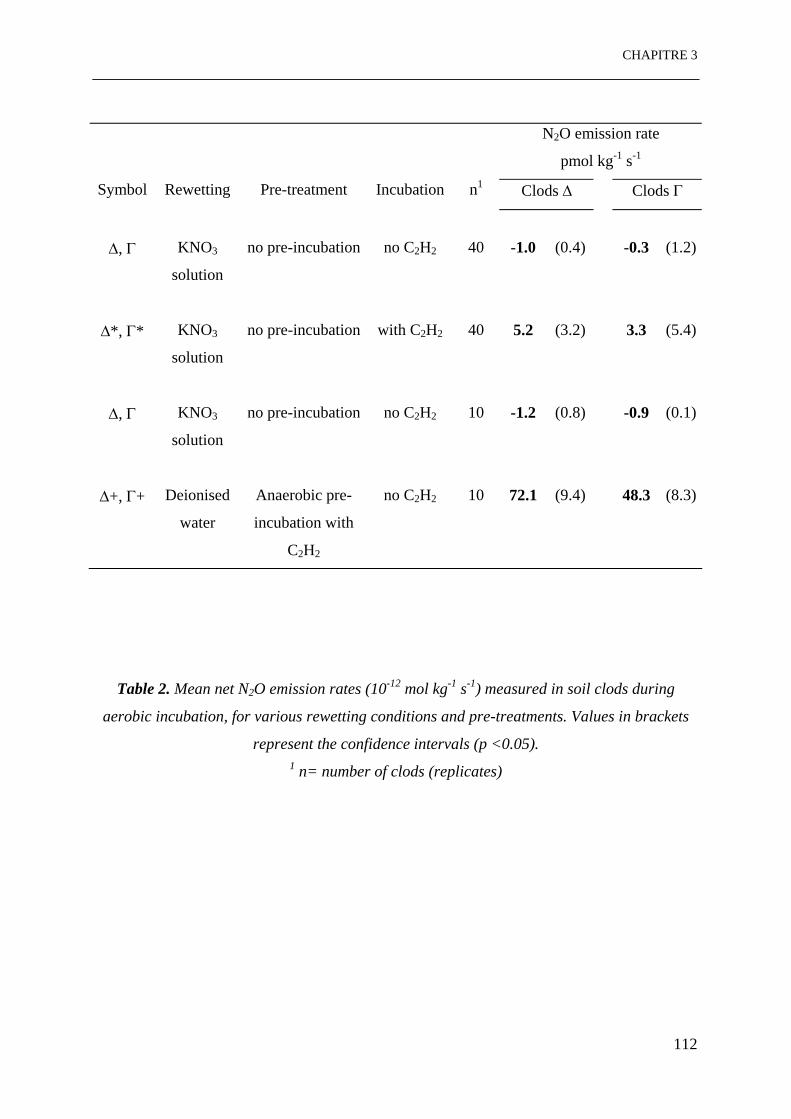
CHAPITRE 3
N2O emission rate
pmol kg-1 s-1
Symbol Rewetting Pre-treatment Incubation n1 Clods ∆ Clods Γ
∆, Γ KNO3
solution
no pre-incubation no C2H2 40 -1.0 (0.4) -0.3 (1.2)
∆*, Γ* KNO3
solution
no pre-incubation with C2H2 40 5.2 (3.2) 3.3 (5.4)
∆, Γ KNO3
solution
no pre-incubation no C2H2 10 -1.2 (0.8) -0.9 (0.1)
∆+, Γ+ Deionised
water
Anaerobic pre-
incubation with
C2H2
no C2H2 10 72.1 (9.4) 48.3 (8.3)
Table 2. Mean net N2O emission rates (10-12 mol kg-1 s-1) measured in soil clods during
aerobic incubation, for various rewetting conditions and pre-treatments. Values in brackets
represent the confidence intervals (p <0.05). 1 n= number of clods (replicates)
112

CHAPITRE 3
measured at the same date (Fig. 2), except for one value that seemed unrealistic (the
correlation coefficients were 95.4% and 97.9% for ∆ and Γ clods, respectively). The linear
regressions obtained suggest that there is a threshold for soluble organic C under which there
is no more aerobic respiration: the difference between the initial soluble organic C and this
estimation represented approximately 23 % and 9 % of the initial soluble organic C for clods
∆ and Γ, respectively.
For clods that did not experiment anaerobic conditions, the mean value of pH
measurements, after the rewetting phase, was 8.31 (± 0.08) and 8.24 (± 0.03), for ∆ and Γ
clods, respectively. After the aerobic incubation, the mean value of pH was 8.38 (± 0.12) and
8.29 (± 0.04), respectively. For clods that experimented anaerobic conditions, the mean value
of pH, after the anaerobic pre-incubation, was 8.34 (± 0.02) and 8.37 (± 0.05), for ∆ and Γ
clods, respectively. After the subsequent aerobic incubation, the mean value of pH was 8.74
(± 0.01) and 8.47 (± 0.03), for ∆ and Γ clods, respectively. The results indicated variation
neither with time nor with the clod type (∆ and Γ).
Experiment 2: N2O production with or without anaerobic pre-incubation
The net N2O emission rates measured in experiment 2 were very small and even slightly
negative in clods that did not experience anaerobic pre-incubation: –1.2 and –0.9 pmol N2O
kg-1 s-1 in clods ∆ and Γ, respectively (Table 2). They were negligible in comparison to clods
that had been previously submitted to anaerobic conditions: 72.1 and 48.3 pmol N2O kg-1 s-1
in clods ∆ and Γ, respectively. These values were also much higher than those measured in
experiment 2 (5.2 and 3.3 pmol N2O kg-1 s-1 in clods ∆ and Γ, respectively), although these
rates were measured in favourable conditions: nitrate was supplied in large amount to promote
denitrification and acetylene was added to prevent N2O reduction.
The mean N2O emission rate following anaerobic incubation was significantly higher
(P<0.05) for clods ∆ (72.1 pmol kg-1 s-1) than for clods Γ (48.3 pmol kg-1 s-1). The mean clod
weight was also significantly higher for ∆ clods (25.8 g) than for Γ clods (20.2 g). Figure 3
suggests that N2O emission rate does not depend directly on clod type (∆ and Γ), but would
rather depend on clod mass: this relationship could be due to a larger anoxic volume in the
larger clods (Renault and Stengel, 1994; Sierra et al., 1995) Measurements of mineral N
content showed that the NH4+ and NO3
- contents of clods that had been rewetted with water
and submitted to anaerobic pre-incubation were low and not
113

CHAPITRE 3
Mineral N (mol N m-3) Mineral N (mg N kg-1)
t = 0 t = 24 hours t = 0 t = 24 hours
Clods Rewetting Pre-treatment NH4+ NO3
- NH4+ NO3
- NH4+ NO3
- NH4+ NO3
-
∆ KNO3 solution No pre-incubation 0.44 32.9 0.97 26.5 1.4 106.2 3.1 85.5
(.06) (3.1) (.14) (4.3) (.2) (10.1) (.5) (13.9)
Γ KNO3 solution No pre-incubation 0.43 29.1 0.81 27.8 1.5 99.2 2.7 92.8
(.03) (1.8) (.12) (4.2) (.1) (6.1) (.4) (15.2)
∆+ Deionised water Anaerobic pre-incubation 0.57 0.38 0.74 0.35 1.8 1.2 2.3 1.1
with C2H2 (.03) (.18) (.05) (.03) (.1) (.6) (.2) (.1)
Γ+ Deionised water Anaerobic pre-incubation 0.71 0.28 0.73 0.85 2.3 0.9 2.4 2.8
with C2H2 (.09) (.03) (.05) (.4) (.3) (.1) (.2) (1.3)
Table 3. Amounts of mineral N (in mol m-3 solution or mg kg-1 soil) measured at the beginning and the end of 1 day aerobic incubation following
either soil water rewetting and anaerobic pre-incubation (6 days) or nitrate rewetting alone (experiment 2). Values in brackets represent the
standard errors.
114

Chapitre 3
Actual CO2 production
Clod type
Apparent CO2
production k3 = 0.83 k3 = 1.25 k3 = 1.66
nmol CO2 kg-1 s-1
∆+ 5.42 (1.14) 12.5 14.3 15.3
Γ+ 4.23 (0.70 ) 8.99 10.1 10.8
∆ 1.41 (0.31 ) 2.72 3.12 3.36
Γ 1.63 (0.99 ) 2.86 3.30 3.56
Table 4. Apparent and actual CO2 production rates (10-9 mol CO2 kg-1 s-1) during 6 hours of
aerobic incubation of clods ∆ and Γ. Apparent rate is the accumulation rate measured
in flasks of experiment 2; actual rate is calculated using equation 8 for three values of
k3: k3 = 2, 3 and 4%, corresponding to 0.83, 1.25 and 1.66 mol m-3. Clods ∆+ and Γ+
have been submitted to pre-treatment (anaerobiosis incubation during 6 days with
C2H2), whereas clods ∆ and Γ have not.
Values in brackets are the confidence intervals.
115

Chapitre 3
different between clods or dates: the average was 2.2 ± 0.3 mg NH4+-N kg-1 soil and 1.5 ± 0.9
mg NO3--N kg-1 soil (Table 3). In clods which had been rewetted with KNO3 solution and
which did not experience anaerobic pre-incubation, the NH4+ concentration was similar (2.2 ±
0.3 mg N kg-1 soil), but the NO3- concentration was much higher as expected: 96.0 ± 8.9 mg
N kg-1 soil, without significant change between the initial and final measurement (P<0.05).
N2O emissions were low in these clods in spite of their high NO3- concentration.
The apparent CO2 production rate (i.e. without accounting for CO2 and carbonates in soil
solution) was also much higher in clods that had been submitted to anaerobic pre-incubation
than in the other: 3.8 and 2.6 times higher in clods ∆ and Γ, respectively (Table 4). The
apparent rates were not statistically different between clods ∆ and Γ not submitted to
anaerobic conditions, but could be distinguished in clods submitted to anaerobic pre-
incubation (significant at P<0.10). The calculated actual CO2 production rates, corrected for
carbonates present in soil solution, were 1.76 to 2.83 times greater. The factor depends both
on the clod type and its pre-treatment and on the constant k3 that characterises the relationship
between soil pH and partial pressure of CO2. These values remain lower than the values
obtained for the same clods in experiment 1.
Experiment 3: origin of the N2O emissions following anaerobic preincubation
Mean N2O emission of clods supplied with 15NH4+ was about twice the corresponding
value for clods supplied with 15NO3-, although the difference between these 2 values was not
statistically significant (P<0.05).
For ∆ clods submitted to anaerobic pre-incubation and thereafter enriched either in 15NO3-
or 15NH4+, the isotopic excess in 15N of produced N2O was similar to the mean excess of NO3
-
defined as the average between the initial and final excess of NO3- (Table 5). Unfortunately, it
was not possible to estimate the N2O/(N2O+N2) ratio from 15N data, since, the isotopic excess
of 15N2 did not significantly differ from that of air (results not shown). Mean N2O emission of
clods supplied with 15NH4+ was about twice the corresponding value for clods supplied with
15NO3-, although the difference between these 2 values was not statistically significant
(P<0.05).
Nitrate and NH4+ contents were about 9 10-6 and 2 10-4, respectively before supplying the
clods with either 15NO3- or 15NH4
+. This supply lead to slightly increase NH4+; in contrast it
lead to multiply 5 times the NO3- content.
116
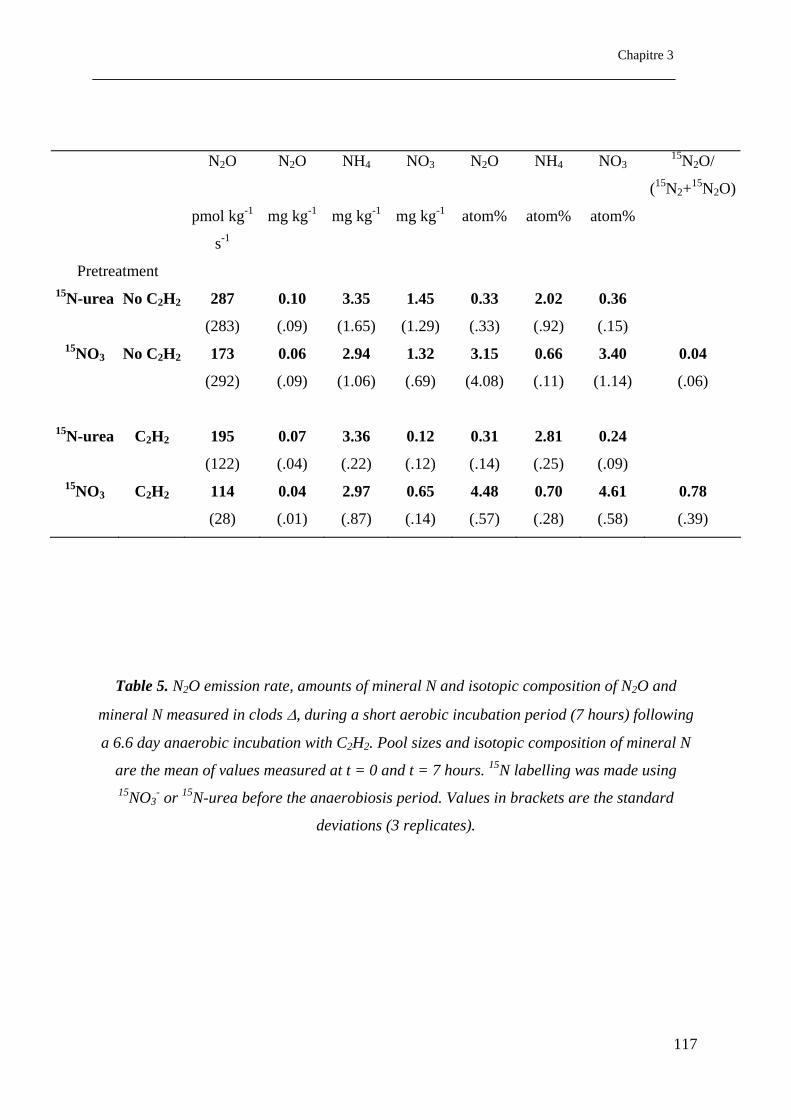
Chapitre 3
N2O N2O NH4 NO3 N2O NH4 NO315N2O/
(15N2+15N2O)
pmol kg-1
s-1
mg kg-1 mg kg-1 mg kg-1 atom% atom% atom%
Pretreatment 15N-urea No C2H2 287 0.10 3.35 1.45 0.33 2.02 0.36
(283) (.09) (1.65) (1.29) (.33) (.92) (.15) 15NO3 No C2H2 173 0.06 2.94 1.32 3.15 0.66 3.40 0.04
(292) (.09) (1.06) (.69) (4.08) (.11) (1.14) (.06)
15N-urea C2H2 195 0.07 3.36 0.12 0.31 2.81 0.24
(122) (.04) (.22) (.12) (.14) (.25) (.09) 15NO3 C2H2 114 0.04 2.97 0.65 4.48 0.70 4.61 0.78
(28) (.01) (.87) (.14) (.57) (.28) (.58) (.39)
Table 5. N2O emission rate, amounts of mineral N and isotopic composition of N2O and
mineral N measured in clods ∆, during a short aerobic incubation period (7 hours) following
a 6.6 day anaerobic incubation with C2H2. Pool sizes and isotopic composition of mineral N
are the mean of values measured at t = 0 and t = 7 hours. 15N labelling was made using 15NO3
- or 15N-urea before the anaerobiosis period. Values in brackets are the standard
deviations (3 replicates).
117

Chapitre 3
-20
0
20
40
60
80
100
0 10 20 30 40 50Clod mass (g)
N2O
(pm
ol k
g-1 s-1
)
∆Γ∆+Γ+
b
-20
0
20
40
60
80
100
0 10 20 30 40 50
N2O
(pm
ol k
g-1 s-1
)∆Γ∆∗Γ∗
a
Figure 3: Net N2O emission rates (10-12 mol kg-1 s-1) as a function of clod mass, measured:
c) in soil clods rewetted with nitrate solution and incubated aerobically with
C2H2 (∆*, Γ*) or without C2H2 (∆, Γ);
in soil clods rewetted with deionised water and incubated aerobically without C2H2 either
after anaerobic pre-incubation and C2H2 (∆+, Γ+) or without pre-incubation (∆, Γ).
118

Chapitre 3
DISCUSSION
N2O production with or without anaerobic pre-incubation
During the aerobic incubation of soil clods, N2O emission rates were much higher in clods
submitted to anaerobic pre-incubation than in clods that did not experience this anoxic period
(Fig. 3). The mean N2O production rate through denitrification (using C2H2 inhibition of N2O
reduction and nitrification) was 60.2 pmol N2O kg-1 s-1 in the former and only 2.87 pmol N2O
kg-1 s-1 in the latter case (no pre-incubation). Isotope measurements clearly demonstrated that
most of these emissions resulted from denitrification; furthermore, we found that these
emissions increased with the clod size, suggesting a dependence on aeration within the clod.
Surprisingly, we found that denitrification was high in clods submitted to anaerobic pre-
incubation and having a small NO3- content (0.46 mol m-3 solution) and low in clods that did
not experiment anaerobic pre-incubation but which had a high NO3- concentration (29.1 mol
m-3 solution). The lower NO3- concentration is comparable or smaller than Michaelis constant
values reported in the literature: 6 mol m-3 for intact cores (Hénault, 1993), 11.4-31.4 mol m-3
(Malhi et al., 1990), approximately 0.22 mol m-3 (Klemedtsson et al., 1977), 0.0018–
0.0166 mol m-3 for soil and sediment slurries (Murray et al., 1989) and 0.3-3.8 mol m-3 for
purified NO3- reductase (Zumft, 1997). Although NO3
- concentration was likely to be a
limiting factor of N2O emissions in clods pre-incubated anaerobically, there was no
correlation between individual clod emission and its final NO3- concentration (results not
shown). Then the other factors affecting denitrification, particularly the aeration status of the
clod and its content of microbial available carbon, were most important.
Why N2O emission through nitrification should be neglected ?
Clods that experimented anaerobic pre-incubation were simultaneously submitted to C2H2
(approximately 5 % of flask air), in order to check whether denitrification stopped or not at
the end of this pre-incubation period. It has been recognised that both NH4+ oxidation and
N2O production through nitrification is inhibited by C2H2 until the partial pressure of this gas
is higher than about 1-10 kPa (Mosier, 1980). Moreover, removing C2H2 is not sufficient to
stop its inhibitory effect: Berg et al. (1982) noted that C2H2 effect did not cease until 7 days
119

Chapitre 3
after removal of initially only 10 Pa C2H2 applied. In order to be sure that anaerobic pre-
incubation with C2H2 inhibited nitrification in experiments 2 and 3, additional 15N
measurements were realised on clods submitted to anaerobic pre-incubation without C2H2.
Nitrification rates in clods submitted or not submitted to C2H2 were 0.54 pmol kg-1 s-1 and 5.6
pmol kg-1 s-1, respectively (results not shown), and confirm the effect of C2H2 on nitrification.
Nitrification rates without C2H2 would have been equal to 5.6 nmol kg-1 s-1, and gross N
mineralisation to 0.75 nmol kg-1 s-1 in the same conditions (results not shown). This low
nitrification flux can be related to the low exchangeable [NH4+] (i.e. 0.21 and 0.24 mmol N
kg-1 for treatments with 15NO3- and 15NH4
+ respectively) with regard to nitrification (Bremner
and Blackmer, 1981; Lensi et al., 1992). Nitrogen mineralisation was not significantly
affected by C2H2, since it was estimated at 0.37 and 0.35 nmol kg-1 s-1 in clods submitted or
not to C2H2 during anaerobic pre-incubation, respectively. Other studies reported that the
proportion of NH4+ transformed into N2O was about 0.1-0.5 % (Aulakh et al., 1984) or less
than 1% (Bremner and Blackmer, 1978, Klemedtsson et al., 1988), the remainder being
transformed into NO2- and NO3
-. Considering its maximum value in our situation and the
actual nitrification flux in absence of C2H2 would have led to N2O production rate about 0.12
nmol kg-1 s-1. This value is small with regard to the actual value for N2O emission through
denitrification in the same conditions equal to 2.43 nmol kg-1 s-1 (results not shown).
Required conditions to increase N2O emissions through denitrification
Since total denitrification rate of clods that did not experiment anaerobic pre-incubation
was negligible compared to the N2O production rate by clods submitted to anaerobic pre-
incubation, it appears necessary that the aeration status of clods placed in air-filled flasks is
affected by the anaerobic pre-incubation. Indeed, experimental measurements of aerobic CO2
production showed that submitting clods to anaerobic pre-incubation lead to multiply this
production by a factor of 2.2 and 1.9 (experiment 1), and 3.8 and 2.6 (experiment 2) in clods
∆ and Γ, respectively. However, these 2 methods lead to different rates of aerobic CO2
production. As shown in Table 3, the main difference between these two experiments lies in
the method (trapping CO2 in NaOH solution or accumulation in the gas phase), since when
CO2 accumulates in the gas phase, it also partly accumulates in the solution mainly as
hydrated H2CO3 and HCO3- (Stumm and Morgan, 1996). The calculation of the actual rate of
CO2 production from its apparent value measured in experiment 2 was performed using
unproved hypotheses on (i) the relationship between pH and air CO2 concentration that was
120

Chapitre 3
proposed from geo-chemical simulations for hypothetical calcareous and non calcareous soil
using the AQUA model (Vallès and Bourgeat, 1988), and (ii) the dissolution of calcite was
neglected assuming that its kinetics behaviour limits its importance for only 6 h CO2
accumulation (Stumm and Morgan, 1996). Moreover, since aerobic CO2 production for clods
∆ was lower (versus higher) than that of clods Γ in experiment 1 (versus experiment 2), other
causes are surely to be invoked, including the conservation duration of clods before
measurements, and their water content during storage which differed between experiment 1
(0.06 g g-1) and experiment 2 (0.11 g g-1). In our calculations, the retained actual aerobic CO2
production rates were those corresponding to k3 equal to 1.25 mol m-3. These values were the
same as O2 consumption rates measured in soil aggregates samples with 0% of CO2 and at
different O2 concentrations (1, 2, 5, 10 and 20% of O2) (results not shown).
In addition to an increase in aerobic respiration, it is possible to invoke an increase in the
N2O/(N2O+N2) ratio; however such possible (but unproved) increase could not have been
sufficient alone to explain the difference between clods submitted or not to anaerobic pre-
incubation, since total denitrification of clods that did not experiment anaerobic conditions
was greatly lower to the N2O emissions of other clods. An increase in N2O/(N2O+N2) ratio
could a priori result from a decrease in the pH of the soil solution (Knowles, 1982), an
increase in [NO3-] (Blackmer and Bremner, 1979), and/or a decrease in aerobic respiration
(Parkin, 1987). In our context, the last 2 hypotheses can not be retained, since [NO3-] and
aerobic respiration were lower and greater, respectively, for clods submitted to anaerobic pre-
incubation. Therefore, only pH decrease can be evoked and could have resulted
simultaneously from the accumulation of fatty acids during anaerobic pre-incubation
(Dassonville and Renault, 2002) and from an increase of CO2 (in experiment 2) that can affect
the pH (Tsusuki et al., 1987; Stumm and Morgan, 1996). However, it is not certain that pH
has significantly decreased since (i) measurements (after re-equilibration of soil solution CO2
with atmospheric ones) did not change with the anaerobic pre-incubation, in agreement with
unpublished simulations that show that fatty acids can decrease soil pH of only about 0.4 unit
for high concentrations of acetate and butyrate (40 mol m-3 solution for a calcareous soil), and
(ii) maximum values of CO2 at the end of the measurement period was 1.65 10-3 mol m-3 air,
that can decrease the pH of the soil solution of less than about 0.6 unit. In addition, the
presence of C2H2 during anaerobic pre-incubation not only inhibit N2O reduction, but also the
synthesis of N2O reductase (Klemedtsson et al., 1977): this compound can have maintained
the N2O/(N2O+N2) ratio at a high value, even have lead to an increase of this ratio if
denitrifiers have significantly developed during the anaerobic pre-incubation.
121

Chapitre 3
Biogeochemical changes that could appear during the prolonged anaerobic period
Anaerobic condition often lead to the incomplete degradation of organic matter and the
accumulation of small compounds, including fatty acids (Tsusuki et al., 1987) that can
thereafter be easily mineralised in aerobic conditions (Burford and Bremner, 1975; Förstner,
1987). This accumulation of small organic compound results from the concomitant realization
of the following conditions:
- the lack of electron donors such as N and metal oxides that can enable complete
microbial oxidation of organic compounds (Pelmont, 1993). This was the case for N
oxides in our experiment;
- the possibility of fermentative bacterial population to develop in anaerobic conditions,
even if it is initially poorly represented (Dassonville and Renault, 2002);
- the lack of SO42- reducing bacteria and methanogene archaea – especially in soils not
subjected to frequent anaerobic conditions - that can consume volatile fatty acids, but
develop slowly with regard to fermentative populations (Tsusuki et al., 1987; Conrad,
1999).
This accumulation of small organic compounds may be indirectly reflected by the increase
of soluble organic C during the anaerobic pre-incubation. It justified our choice to consider 2
organic pools in equation (4) to explain aerobic CO2 production: the first pool being for native
organic C, and the second one for these small organic compounds. In agreement with this
interpretation, the period constant 1/k1 for mineralisation of the first pool was about 200-
260 h; in contrast, the corresponding value 1/k2 was only about 4-20 h, indicating that some
organic compound can easily be mineralised in aerobic conditions after the anaerobic pre-
incubation. Dealing with the nature of organic C, it is generally accepted that soluble
compounds are better used than non-soluble ones (Moore, 1998; Kalbitz et al., 2000).
Although, the most abundant dissolved organic compounds (DOC) are poorly consumed
(Gaffney et al., 1996), whereas hydrophilic acids and simple compounds are better used:
consequently, only a small fraction of DOC is really mineralised (Thurman, 1985).
122

Chapitre 3
ACKNOWLEDGEMENTS
This work was supported by INRA and Région Picardie, and the programs PNSE and
GESSOL. We thank O. Delfosse and G. Alavoine for their technical assistance. We would
like to acknowledge J. Chadoeuf for helpful discussions. We are grateful to A.M. Wall for
reviewing the English version of the manuscript.
123

Chapitre 3
REFERENCES
1. Aulakh M. S., Rennie D. A., Paul E. A., 1984. The influence of plant residues on
denitrification rates in conventional and zero tilled soils. Soil Science Society of America
Journal 48, 790-794.
2. Barcelona M. J., 1984. TOC determinations in ground water. Groundwater 22, 18-24.
3. Berg P., Klemedtsson L., Rosswall T., 1982. Inhibitory effect of low partial pressures of
acetylene on nitrification. Soil Biology and Biochemistry 14, 301-303.
4. Blackmer A. M., Bremner J. M., 1979. Stimulatory effect of nitrate on reduction of N2O
to N2 by soil microorganisms. Soil Biology and Biochemistry 11, 313-315.
5. Bremner J. M., Blackmer A. M., 1978. Nitrous oxide: emission from soils during
nitrification of fertilizer nitrogen. Science 199, 295-296.
6. Bremner J. M., Blackmer A. M., 1981. Terrestrial nitrification as a source of atmospheric
nitrous oxide. In: Delwiche C. C. (ed.). Denitrification, nitrification and atmospheric
nitrous oxide. John Wiley & Sons Inc., New York, pp. 151-170.
7. Brooks P. D., Stark J. M., McInteer B. B., Preston T., 1989. Diffusion method to prepare
soil extracts for automated nitrogen-15 analysis. Soil Science Society of America Journal
53, 1707-1711.
8. Burford J., Bremner J.M., 1975. Relationships between the denitrification capacities of
soils and total water soluble and readily decomposable soil organic matter. Soil Biology
and Biochemistry 11, 261-267.
9. Chin K. J., Conrad R., 1995. Intermediary metabolism in methanogenic paddy soil and the
influence of temperature. FEMS Microbiology Ecology 18, 85-102.
10. Conrad R., 1996. Soil micro-organisms as controllers of atmospheric trace gases (H2, CO,
CH4, OCS, N2O and NO). Microbiology Review 60, 609-640.
11. Conrad R., 1999. Contribution of hydrogen to methane production and control of
hydrogen concentrations in methanogenic soils and sediments. FEMS Microbiology
Ecology 28, 193-202.
12. Dassonville F., Renault P., 2002. Interactions between microbial processes and
geochemical transformations under anaerobic conditions: a review. Agronomie 22, 51-68.
13. Förstner U., 1987. Metals speciation, separation and recovery. Lewis Publishers, Chelsea.
124

Chapitre 3
14. Gaffney J. S., Marley N. A., Clark S. B., 1996. Humic and fulvic acids: isolation, structure
and environmental role. American Chemistry Society (Chap. 1), 2-16.
15. Graedel, T.E. and P.J. Crutzen. 1992. Atmospheric change. An earth system perspective.
W.H. Freeman and Company, New York.
16. Grant R.F., 1995. Mathematical modelling of nitrous oxide evolution during nitrification.
Soil Biology and Biochemistry 27, 1117-1125.
17. Groffman, P.M. 1991. Ecology of nitrification and denitrification in soil evaluated at
scales relevant to atmospheric chemistry. pp. 201-217 in J.E. Rogers & W.B. Whitman
(eds.). Microbial production and consumption of greenhouse gases: methane, nitrogen
oxides and halomethanes. American Society for Microbiology, Washington, D.C.
18. Hénault C., 1993. Quantification de la dénitrification dans les sols à l’échelle de la
parcelle cultivée, à l’aide d’un modèle prévisionnel. Ph.D. thesis, ENSA Montpellier, 108
pp.
19. Hénault C., Germon J. C., 1995. Quantification de la dénitrification et des émissions de
protoxyde d'azote (N2O) par les sols. Agronomie 15, 321-355.
20. Henriksen, Selmer-Olsen 1970. Automatic methods for determining nitrate and nitrite in
water and soil extracts. The Analyst 955, 514-518.
21. IPCC, 1996. In: Houghton J.T., Meira Filho L.G., Callander B.A., Harris N., Kattenberg
A., Maskell K. (eds.). Climate change 1995: the science of climate change. Cambridge
University Press, Cambridge.
22. Kalbitz K., Solinger S., Park J.H., Michalzic B., Matzner E., 2000. Controls on the
dynamics of dissolved organic matter in soils: a review. Soil Science 165, 277-304.
23. Kamphake L. J., Hannah S. A., Cohen J. M., 1967. Automated analysis for nitrate by
hydrazine reduction. Water Research 1, 205-216.
24. Khalil K., Renault P.,Mary B., Guérin N, 2003a. Modeling Denitrification including the
Dynamics of Denitrifiers and their Progressing Ability to Reduce Nitrous Oxide:
Comparison with Batch Experiments. Submitted in European Journal of Soil Science.
25. Klemedtsson L., Svensson B. H., Lindberg T., Rosswall T., 1977. The use of acetylene
inhibition of nitrous oxide reductase in quantifying denitrification in soils. Swedish
Journal of Agricultural Research 7, 179-185.
26. Klemedtsson L., Svensson B. H., Rosswall T., 1988. A method of selective inhibition to
distinguish between nitrification and denitrification as sources of nitrous oxide in soil.
Biology and Fertility of Soils 6, 112-119.
125

Chapitre 3
27. Knowles R., 1982. Denitrification. Microbiology Review 46, 43-70.
28. Krom M. D., 1980. Spectrometric determination of ammonia: a study of a modified
Berthelot reaction using salicylate and dichloroisocyanurate. The Analyst 105, 305-316.
29. Lensi R., Domenach A. M., Abbadie L., 1992. Field study of nitrification and
denitrification in a wet savanna of West Africa (Lamto, Côte d’Ivoire). Plant and Soil
147, 107-113.
30. Malhi S. S., McGill W. B., Nyborg M., 1990. Nitrate losses in soils: effect of temperature,
moisture and substrate concentration. Soil Biol. Biochem. 22(6), 733-737.
31. Moore T.R., 1998. Dissolved organic carbon: sources, sinks and fluxes and role in the soil
carbon cycle. In: Lal R., Kimble J. M., Follett R. F. (eds.). Soils processes and the carbon
cycle. CRC Press Inc., Boca Raton, USA, pp. 281-292.
32. Mosier A. R., 1980. Acetylene inhibition of ammonium oxidation in soil. Soil Biology and
Biochemistry 12, 443-444.
33. Murray R. E., Parsons L. L., Smith M. S., 1989. Kinetics of nitrate utilization by mixed
populations of denitrifying bacteria. Applied and Environmental Microbiology 55, 717-
721.
34. Parkin T. B., 1987. Soil microsites as a source of denitrification variability. Soil Science
Society of America Journal 51, 1194-1199.
35. Parton W. J., Mosier A. R., Schimel D. S., 1988. Rates and pathways of nitrous oxide
production in a shortgrass steppe. Biogeochemistry 6(3), 45-58.
36. Parton W. J., Mosier A. R., Ojima D. S., Valentine D. W., Schimel D. S., Weier K,
Kulmala A.E, . 1996. Generalized model for N2 and N2O production from nitrification and
denitrification. Global Biogeochemical Cycles. 10(3), 401-412.
37. Pelmont J., 1993. Soufre et hydrogène. In: Bactéries et environnement: adaptations
physiologiques. Presses Universitaires de France, Grenoble, pp. 633-660.
38. Rappoldt C., 1992. Diffusion in aggregated soil. Doctoral Thesis, Wageningen
Agricultural University, Wageningen, The Netherlands.
39. Recous S., Fresneau C., Faurie G., Mary B., 1988. The fate of labelled 15N urea and
ammonium nitrate applied to a winter wheat crop. Plant and Soil 112, 205-214.
40. Renault P. and P. Stengel. 1994. Modeling oxygen diffusion in aggregated soils: I.
Anaerobiosis inside the aggregates. Soil Sci. Soc. Am. J. 58: 1017-1023.
41. Richard G., Boizard H., Roger-Estrade J., Boiffin J., Guérif J., 1999. Study of soil
compaction due to traffic in field conditions: pore space and morphological analysis. Soil
and Tillage Research 51, 151-160.
126

Chapitre 3
42. Sextone A. J., N. P. Revsbech, T. B. Parkin and J.M. Tiedje. 1985. Direct measurement of
oxygen profiles and denitrification rates in soil aggregates. Soil Sci. Am. J. 46:68-74.
43. Sierra J., Renault P., Vallès V., 1995. Anaerobiosis in saturated soil aggregates: modelling
and experiment. European Journal of Soil Science. 46:519-531.
44. Smith K. A., 1990. Greenhouse gas fluxes between land surfaces and the atmosphere.
Prog. Physical Geography 14, 349-372.
45. Stams J. M., 1994. Metabolic interactions between anaerobic bacteria in methanogenic
environments. Ant. Van Leeuw 66, 271-294.
46. Stumm W., Morgan J. J., 1996. Aquatic chemistry. Chemical equilibra and rates in natural
waters. Oxidation and reduction. Equilibria and microbial mediation. John Wiley & Sons,
New York, pp. 425-513.
47. Thurman E. M., 1985. Organic geochemistry of natural waters. Martinus Nijhoff and W.
Junk Publishers, Dordrecht.
48. Tortoso A.C., Hutchinson G. L., 1990. Contributions of autotrophic and heterotrophic
nitrifiers to soil NO and N2O emissions. Applied and Environmental Microbiology 56,
1799-1805.
49. Tsusuki K., Ponnamperuma F. N., 1987. Behavior of anaerobic decomposition products in
submerged soils. Effects of organic material amendment, soil properties and temperature.
Soil Science and Plant Nutrition 33, 13-33.
50. Vallès V., Bourgeat F., 1988. Geochemical determination of gypsum requirements of
cultivated sodic soil. In: Chemical interactions, Arid Soil Res. Rehabil., pp. 165-177.
51. Zumft G., 1997. Cell biology and molecular basis of denitrification. In: Microbiology and
Molecular Biology reviews, pp. 533-616.
127
CHAPITRE 4
MODELE SIMPLIFIE DES EMISSIONS DE N2O
PAR DENITRIFICATION PRENANT EN
COMPTE LA STRUCTURE DES MOTTES DE
SOL ET LA PREINCUBATION ANAEROBIE
Ce chapitre 4 correspond à un article « en cours de soumission » pour la
revue Soil Science Society of America Journal : K. Khalil, P. Renault, B.
Mary (2003)
A simplified model of N2O emission by denitrification that accounts for soil
clod structure and anaerobic pre-incubation
128

CHAPITRE 4
SUMMARY
Nitrous oxide emissions by soils through denitrification depend on denitrifying
activity, soil respiration and the anaerobic fraction of soil. We have previously found that
anaerobic pre-incubation of soil clods stimulates both microbial respiration and N2O
emissions through denitrification during a subsequent aerobic incubation of these clods. In
this work, we have checked whether the observed increases in aerobic respiration and
denitrification activities could explain the extra N2O production by taking into account the
biological activities and the actual structure of soil clods. Soil structure was characterized
in 10 intact clods '∆' (with a massive structure) and 'Γ' (with visible porosity) by image
analysis of thin sections. Three descriptors were calculated for each thin section: the
number of air-filled holes (nh), the maximal distance between any point and the nearest air-
filled pore and the mean radius of the clod (ra). Only the last descriptor was significantly
correlated with the clod mass (p<0.05). The consistency of the estimates of nh and ra was
checked by comparing the observed and predicted clod mass, the latter being dependent on
these parameters. There was a good agreement between the simulated and experimental
clod weights. We propose a simple model which accounts for clod structure and microbial
activities to predict the anoxic soil volume and denitrification rate. The model was able to
predict both the marked effect of anaerobic pre-incubation and the effect of clod mass on
N2O emissions. The variations in aerobic respiration and maximum denitrification
activities that result from an anaerobic pre-incubation could explain the stimulation in N2O
emissions, accounting for the actual structure of soil clods.
Key-words: denitrification, structure, anaerobiosis, nitrous oxide, respiration, clod, aggregate.
129
CHAPITRE 4
INTRODUCTION
Nitrous oxide is trace gas which play a central role in atmospheric chemistry, it is involved
in ozone decomposition in the stratosphere and exerts a significant greenhouse effect (Graedel
and Crutzen, 1992; Smith, 1990; IPCC, 1996). Its emission from soils results from
nitrification (Groffman, 1991) and denitrification (Hénault and Germon, 1995; Conrad, 1996).
Numerous studies have been devoted to the production of N2O by either denitrification
(Firestone et al. 1979; Maag et al., 1997, Ambus, 1998) or nitrification (Li et al., 1992;
Zanner and Bloom, 1995; Stevens et al., 1997, Arah, 1997). The micro-scale approach to
study and describe denitrification is motivated by the fact that, in many cases, the conditions
experienced by soil organisms in micro-sites are not reflected by measurements on bulk soil
samples (Parkin 1987). Oxygen concentrations may decrease from atmospheric concentration
to zero values within a few millimeters in soil clods (Sextone et al. 1985, Sierra et al. 1995),
and less than 1 mm in the vicinity of particulate organic matter (Parkin, 1987; Parry et al.,
2000) and active root tips in locally saturated conditions (Bidel et al., 2000).
Several models have been proposed to describe respiration, anaerobiosis, total
denitrification and/or N2O emissions through denitrification at this scale (Rappoldt, 1992;
Renault and Stengel, 1994; Parry et al., 1999). However, none of these model accounts for
variations with time in respiration, denitrification and N2O reduction, although it is well
recognized that these activities vary, as the consequence of microbial dynamics and/or
enzyme inductions and activations (MacConnaughey et al., 1985; Holtan-Hartwig et al.,
2000). Recently, it has been shown that N2O emissions by clods placed in aerobic atmosphere
were markedly stimulated when these clods had been previously submitted to anaerobic
conditions (Khalil et al., 2003b). These authors showed that these emissions resulted from
denitrification and that O2 consumption rate was also stimulated by the anaerobic pre-
incubation. Such an increase may be explained by the accumulation of intermediate organic
compounds which are not completely mineralized in anaerobic conditions and possibly by the
death of strictly aerobic bacteria and fungi that cannot survive in such conditions (Förstner,
1987; Tsusuki and Ponnamperuma, 1987; Chin and Conrad, 1995; Conrad, 1999).
The aim of this work was to check whether variations in aerobic respiration and maximum
denitrification activities (i.e. N2O production and consumption) that result from an anaerobic
pre-incubation are sufficient to explain the variations in N2O emissions, accounting for the
130

CHAPITRE 4
actual structure of soil clods. The use of model is a tool to fulfill this objective. It requires an
adequate description of the clods structure with regard to their aeration and denitrification
behavior.
131

CHAPITRE 4
MATERIALS AND METHODS
Soil Clod Sampling
Experiments were performed in an Orthic Luvisol (FAO classification) sampled in Mons-
en-Chaussée, in Northern France (49°80' N; 3°60' E). This arable soil has been following a
wheat-maize-wheat-sugarbeet rotation for 12 years and was cropped in maize in 2000. The
properties of the soil were as follows: clay, 194 g.kg-1; silt, 706 g.kg-1; sand, 68 g.kg-1; pH
(water), 8.2; total CaCO3, 32 g.kg-1; organic C, 8.52 g.kg-1; total N 1.00 g.kg-1; and NO3--N,
4.70 mg.kg-1. Clods were sampled in the ploughed layer (10-30 cm depth) on September 12,
2000. Two sets of clods were separated: clods ∆, with a massive structure and no visible
porosity (resulting from compaction due to traffic) and clods Γ, with a fragmentary structure
and visible porosity (Richard et al., 1999). The larger clods were gently broken down
immediately after sampling and then calibrated : we kept clods between 2.5 and 3 cm size. In
order to reduce microbial activity during storage, the clods were air-dried during 3 days to
obtain a residual moisture close to 0.10 g g-1 soil. They were stored at 2°C until the beginning
of the experiments, i.e. until November 2000. At this time, the soil moisture was about 0.11
g.g-1.
Measurements of N2O Emissions
After storage, the soil clods ∆ and Γ were rewetted with either water (treatment A) or
KNO3 solution at 4g.L-1 (treatment B). Rewetting was realized at 20°C on suction tables at -
10 kPa suction during 1 day, then –5 kPa during 1 day, -1 kPa during 1 day, and finally –0.5
kPa during 4 days. This procedure ensured a slow rewetting process that prevented the
occurrence of additional clod cracks. The water content thus obtained was 0.22 and 0.24 g.g-1
soil for clods ∆ and Γ, respectively. The mineral N content (NH4+, NO2
- and NO3-) of the
clods was measured at the end of the wetting period on 6 replicates for each clod type and
each treatment.
Clods rewetted with water (treatment A) were then submitted to generalized anaerobiosis:
they were placed in closed 150 mL flasks under anaerobic conditions by alternating 3
successive cycles of 3 minutes vacuum and 3 minutes N2 filling in the flasks. Seven mL of
132

CHAPITRE 4
gas were removed and replaced by the same volume of C2H2 and 1 mL of gas was replaced by
Kr. Thirty two flasks containing either ∆ or Γ clods were incubated at 20°C in order to follow
denitrification during this first incubation period. The final mineral N content (NH4+, NO2
-
and NO3-) was measured on 6 replicates of clods ∆ and Γ. After 6 days and 14 h (day 6.6),
clods were placed in aerobic condition by alternating 3 successive cycles of 3 minutes
vacuum and 3 minutes of air filling in the flasks. In order to ensure that all C2H2 has been
removed, the flasks were subjected to the same procedure after 1 additional hour. 1 mL of air
was then replaced by Kr. For treatment B, 10 clods ∆ and 10 clods Γ were placed in closed
150 mL flasks under aerobic conditions just after the wetting period on suction tables; 1 mL
of air was replaced by Kr, and the clods were pre-incubated during 15 h.
Gas samples of treatments A and B were then withdrawn after 1, 3, 5 and 7 hours and
analyzed for N2O, N2, CO2, O2, Kr and C2H2 concentrations. Mineral N was extracted in
treatment A at 7 hours and analyzed for NH4+, NO2
- and NO3-.
The flasks used in treatment B were thereafter opened for a few minutes in order to release
the trapped gases. After closing the flasks, 7 mL and 1 mL of gas were replaced by C2H2 and
Kr, respectively. Clods ∆ and Γ (10 replicates) were incubated at 20°C for another 6 hours.
Gas samples were withdrawn 14, 16, 18 and 20 hours after the addition of C2H2 and analyzed
for N2O, N2, CO2, O2, Kr and C2H2 concentrations. Mineral N was extracted in treatment B at
20 hours and analyzed for NH4+, NO2
- and NO3-.
Nitrous oxide concentration was analyzed by gas chromatography equipped with an electron
capture detector (HP 5890 Series II) fitted with a Porapak Q column (80-100 mesh, 2 m)
coupled to an integration software on a PC Workstation. Nitrogen, CO2, O2, Kr and C2H2
concentrations were measured on another gas chromatograph with TCD (HP5890 Series II)
and columns filled with Porapak Q (80-100mesh, 1.8 m) and molecular sieve (0.1-0.5 nm,
1.8 m) coupled to the same integration software. The mineral N content of clods was extracted
with a 1M KCl solution (soil:solution = 1:5). Measurements were performed with a
continuous flow analyzer (Skalar, Breda, The Netherlands) using the method proposed by
Henriksen and Selmer-Olsen (1970).
Model of N2O Emission by Soil Clods
Actual clods are assimilated to a set of na independent spherical aggregates having a
133

CHAPITRE 4
unique radius ra (m). Similar hypothesis was made earlier by Rappoldt (1990) to estimate the
soil anaerobic fraction, and by Parry et al. (2000) to estimate total denitrification within soil
clods. The anaerobic fraction (v/v) of an aggregate may then be estimated, considering the
diffusion of O2 and its consumption which is assumed to be constant as long as O2 is available
(Renault and Stengel, 1994). A spherical aggregate has an anaerobic center when its radius ra
is greater than the critical radius rc (m) given by the formula:
[ ]
MOsD
r eOOc
2226
= (1)
where is the O2OD 2 diffusion coefficient in soil aggregates (m2.s-1), is the O
2Os 2 solubility
(mol O2.m-3 water/mol O2.m-3 air), [ is the external O]eO2 2 concentration (mol O2.m-3 air) and
M is the microbial respiration rate (mol O2.m-3 soil.s-1). The larger aggregates have a spherical
anaerobic center whose radius r0 is:
( )( )3cos2
cos0
θ
θarr −= (2a)
with ⎟⎟
⎠
⎞
⎜⎜
⎝
⎛−=
a
c
r
rarcsinπθ (2b)
The anaerobic fraction f0 of an aggregate is then:
3
00 ⎟
⎟
⎠
⎞
⎜⎜
⎝
⎛=
ar
rf (3)
Assuming that total denitrification rate is affected neither by NO3- concentration nor by
competition with N2O as alternate electron acceptor in respiratory chain, total denitrification
rate is then proportional to f0:
022fAE dONN =+ (4)
where is the emission rate of all denitrification products (mol NONNE22+ 2+N2O.kg-1 soil.s-1),
and Ad the denitrifying rate (mol.kg-1 soil.s-1) in anaerobic conditions.
Assuming that the N2O/(N2O+N2) ratio of denitrification products (rN) does not vary, the N2O
emission rate (mol NONE2
2O.kg-1 soil.s-1) can then be written:
02frAE NdON = (5)
134

CHAPITRE 4
a
dc
b
Photo 1. Clod sections photographs: a/ and c/ under transmitted visible light of clods ∆ and Γ, respectively; b/ and d/ under reflected UV light
of clods ∆ and Γ, respectively.
135

CHAPITRE 4
0.E+00
2.E+04
4.E+04
6.E+04
8.E+04
1.E+05
0 50 100 150 200 250
LIGHT INTENSITY
PIX
EL N
UM
BER UV LIGHT
VISIBLE LIGHT
UV threshold for binarization
Visible threshold for binarization
Figure 1: Histogram of light intensity for a Γ clod corresponding to Photos 1a-b.
136

CHAPITRE 4
ba
c d
Figures 2a-d: Example of morphological operations performed prior image characterization for a Γ clod corresponding to Photos 1a-b: a/ and
b/ binarization of visible and UV photos, respectively; c/ logical sum of binarized sections; d/ simulation of saturation at 5 cm water suction.
137

CHAPITRE 4
For a clod composed of na aggregates having the same diameter, N2O emission rate,
expressed per unit of clod mass, is also equal to . ONE2
The model includes 7 parameters: (i) physical and chemical parameters ( and ), (ii)
microbial parameters (M, A
2OD2Os
d, and rN), and (iii) structural parameters (na and ra).
Estimating Parameters
Clod Structure
Morphological characterization of clods ∆ and Γ clods was realized on 10 replicates in
order to (i) obtain the effective radius ra for gas diffusion and the number na of spherical
aggregates that constitute the virtual clods assumed to be equivalent to actual ones, and (ii)
assess the variations of these parameters with clod weight and morphological type.
The clods were dried, weighted and included in resin with a fluorescent dye (Bruand et al.,
1996). A thin section was made on each clod, care being taken to realize the section at the
center of the clod. Photographs taken under transmitted-visible and reflected-UV light were
scanned (1 pixel = 29 µm × 29 µm) and analyzed with VISILOG software (Noesis, Paris,
France). Both visible and UV pictures highlight macropores; furthermore, quartz particles
appear with visible radiations and large particulate organic matter are revealed by UV
radiations (Photos 1a-d). The scanned sections were transformed into binary ones, using
minima of light intensity between peaks as thresholds to distinguish voids and solid phase
(see example in Fig. 1). For each clod, the binary data resulting from UV and visible
acquisitions were summed up, considering that actual voids were those which were
recognized as voids in UV light and voids in visible light. At the -0.5 kPa water potential, the
pores having diameters lower than 500 µm were water saturated. These pores were 'closed' in
the image analysis in order to simulate their saturation with water (Serra, 1982). An example
of binarization of visible and UV images, subsequent summing up of these images, and water
saturation is reported in Figure 2, for the clod Γ which is presented in Photo 1. The image thus
obtained enables to calculate three variables characterizing clod structure:
- the number of air-filled holes (nh). We checked whether this number is proportional to
clod mass, and the structure is independent from this weight;
- the maximal distance (rm) between any point of the clod section and the nearest air-filled
pore. It is computed using successive morphological 'erosion' operations up to
138

CHAPITRE 4
Parameter Unit Treatment * Value Origin of the estimate
2OD m2.s-1 A and B 3.00 10-10 Renault and Stengel (1994)
2Os - A and B 3.40 10-2 Renault and Stengel (1994)
M nmol.kg-1.s-1 B 3.18 Khalil et al. (2003b) 1
A 12.2
(8.2-16.5)†
Khalil et al. (2003b) 1
Ad nmol.kg-1.s-1 B 1.00 Measured in this work
A 1.60 Estimated in this work 2
rN - A and B 0.13 Khalil et al. (2003a)
an clod-1 A and B 4.65
(3.10-6.20)†
Estimated in this work
hn Clod-1 A and B 4.80 Measured in this work
α mm.g-1/3 A and B 3.0 Estimated in this work
β mm.hole-1 A and B -0.29 Estimated in this work
ρb kg.m-3 A and B 1700 Fies and Stengel (1981) 3
Table 1: Parameters of the N2O emission model by soil clods through denitrification.
* Treatments A and B are with and without anaerobic pre-incubation, respectively; † minimum and maximum values used corresponding to mean values reduced or increased by
33%, respectively. 2: calculated from Ad value measured in treatment B and accounting for the growth of
denitrifier biomass as estimated by Khalil et al. (2003a). 3: using the linear correlation between textural bulk density and clay content of natural soils.
139

CHAPITRE 4
the disappearance of the image (Serra, 1982). rm may be regarded as a first estimate of
the equivalent radius of an aggregate constitutive of virtual clods in the model;
- the actual radius of the clod ra (m). It is calculated using the perimeter P (m) and the
area A (m2) of the clod section given by the image analysis, as follows:
PAra
2= (6)
Microbial Respiration, Denitrification and N2O/(N2O+N2) ratio of Denitrification Products
In order to simulate N2O emission rates, we first estimated microbial parameters of clods,
i.e. O2 consumption rate (M), denitrifying activity (Ad) and N2O/(N2O+N2) ratio of
denitrification products (rN) (Table 1). The microbial respiration rate was deduced from
measurements of CO2 production corrected to account for CO2 solubilisation and dissociation,
as explained by Khalil et al. (2003b), using the intermediate case of pH dependence to CO2
partial pressure.
The denitrifying activity Ad (i.e. the activity in anaerobic condition without NO3-
limitation) was estimated from measurements made with another set of 10 clods ∆ and Γ
submitted to exactly the same history than in treatment B. Each clod was placed into 150 mL
flasks, and supplemented with the same weight of KNO3 solution (4 g.L-1). The obtained
slurries were put under anaerobic conditions by alternating 3 successive cycles of 3 minutes
vacuum and 3 minutes N2 filling. 7 and 1 mL of gas were then replaced by C2H2 and Kr,
respectively. Closed flasks were incubated at 20°C for 6 hours. Gas samples were withdrawn
3, 4, 5 and 6 hours after the addition of C2H2 and analyzed for N2O, N2, Kr and C2H2
concentrations. These measurements were used to characterize the denitrifying activity of
clods ∆ and Γ in treatment B. The denitrifying activity in treatment A was obtained by
multiplying this value by 1.6 in order to take into account the increase in denitrifier biomass
during the 6 day anaerobic pre-incubation, as was estimated previously for this soil by Khalil
et al. (2003a).
The N2O/(N2O+N2) ratio rN. was estimated from measurements performed by Khalil et al.
(2003a) on slurries of the same soil with and without C2H2 (Table 1).
Oxygen Diffusion Coefficient and Solubility in Water
140

CHAPITRE 4
In order to simulate N2O emission rate on ∆ and Γ clods, we need to have an estimate of
the O2 diffusion coefficient in saturated aggregates, and the O2OD 2 solubility . These
parameters were deduced from Renault and Stengel (1994) (Table 1).
2Os
141
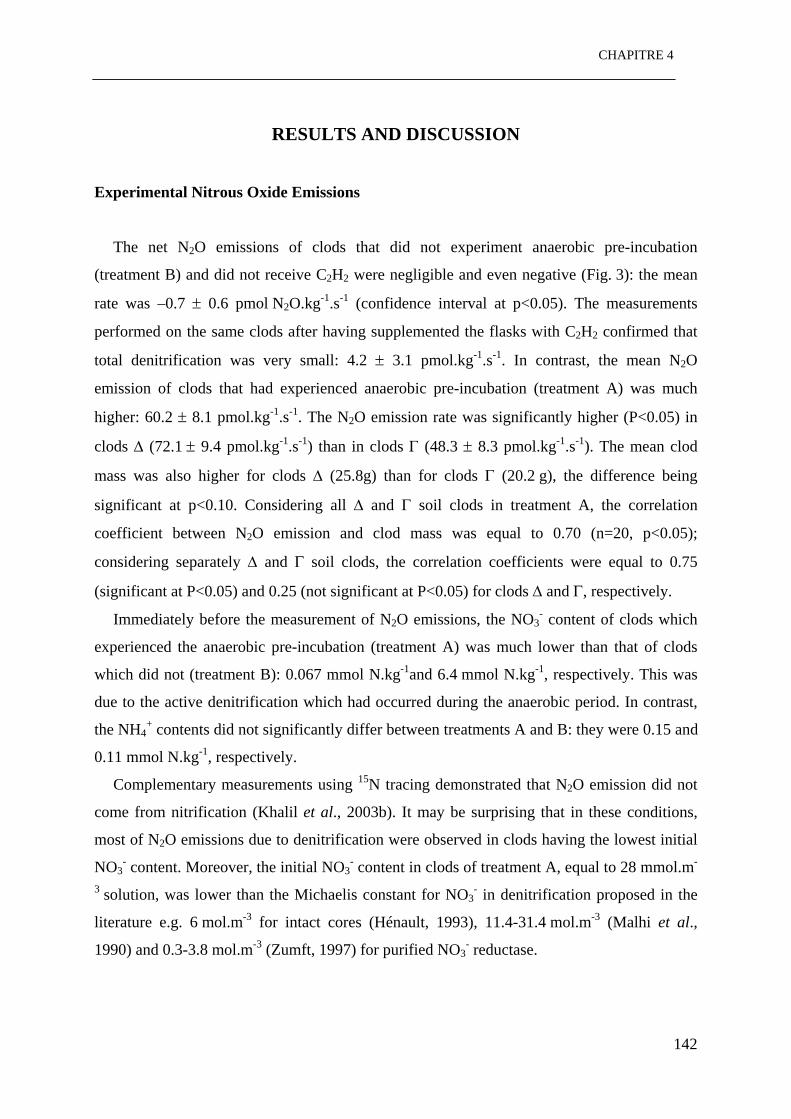
CHAPITRE 4
RESULTS AND DISCUSSION
Experimental Nitrous Oxide Emissions
The net N2O emissions of clods that did not experiment anaerobic pre-incubation
(treatment B) and did not receive C2H2 were negligible and even negative (Fig. 3): the mean
rate was –0.7 ± 0.6 pmol N2O.kg-1.s-1 (confidence interval at p<0.05). The measurements
performed on the same clods after having supplemented the flasks with C2H2 confirmed that
total denitrification was very small: 4.2 ± 3.1 pmol.kg-1.s-1. In contrast, the mean N2O
emission of clods that had experienced anaerobic pre-incubation (treatment A) was much
higher: 60.2 ± 8.1 pmol.kg-1.s-1. The N2O emission rate was significantly higher (P<0.05) in
clods ∆ (72.1 ± 9.4 pmol.kg-1.s-1) than in clods Γ (48.3 ± 8.3 pmol.kg-1.s-1). The mean clod
mass was also higher for clods ∆ (25.8g) than for clods Γ (20.2 g), the difference being
significant at p<0.10. Considering all ∆ and Γ soil clods in treatment A, the correlation
coefficient between N2O emission and clod mass was equal to 0.70 (n=20, p<0.05);
considering separately ∆ and Γ soil clods, the correlation coefficients were equal to 0.75
(significant at P<0.05) and 0.25 (not significant at P<0.05) for clods ∆ and Γ, respectively.
Immediately before the measurement of N2O emissions, the NO3- content of clods which
experienced the anaerobic pre-incubation (treatment A) was much lower than that of clods
which did not (treatment B): 0.067 mmol N.kg-1and 6.4 mmol N.kg-1, respectively. This was
due to the active denitrification which had occurred during the anaerobic period. In contrast,
the NH4+ contents did not significantly differ between treatments A and B: they were 0.15 and
0.11 mmol N.kg-1, respectively.
Complementary measurements using 15N tracing demonstrated that N2O emission did not
come from nitrification (Khalil et al., 2003b). It may be surprising that in these conditions,
most of N2O emissions due to denitrification were observed in clods having the lowest initial
NO3- content. Moreover, the initial NO3
- content in clods of treatment A, equal to 28 mmol.m-
3 solution, was lower than the Michaelis constant for NO3- in denitrification proposed in the
literature e.g. 6 mol.m-3 for intact cores (Hénault, 1993), 11.4-31.4 mol.m-3 (Malhi et al.,
1990) and 0.3-3.8 mol.m-3 (Zumft, 1997) for purified NO3- reductase.
142

CHAPITRE 4
-2.E-11
0.E+00
2.E-11
4.E-11
6.E-11
8.E-11
1.E-10
0 10 20 30 40 5CLOD WEIGHT (g)
N2O
(mol
.kg-1
.s-1
)
(A) (A) (B - C ∆
∆ Γ
(B + CΓ H2 )2
(B + C H )2 2 ∆ (B - C Γ H2 )2
H2 )2
0
Figure 3: Nitrous oxide emission as a function of clod weight for treatment A (i.e. with
anaerobic pre-incubation) and treatment (B) (i.e. without anaerobic pre-incubation). For
treatment (B), emissions were measured without and with C2H2 in the atmosphere.
143

CHAPITRE 4
0
2
4
6
8
10
12
0 10 20 30
CLOD DRY WEIGHT (g)
nh
∆ Γ
40
0.000
0.002
0.004
0.006
0.008
0.010
0 10 20 30
CLOD DRY WEIGHT (g)
r max
(m)
POWER REG.
EXP. Γ
EXP. ∆
40
Figure 4. Morphological characterization of centered ∆ and Γ clod sections after simulating
their partial saturation at 5 cm water suction: a/ number of air-filled holes per clod, as a
function of clod weight; b/ maximum distance of a clod point to the nearest air-filled pore in
the section, as a function of clod weight.
144
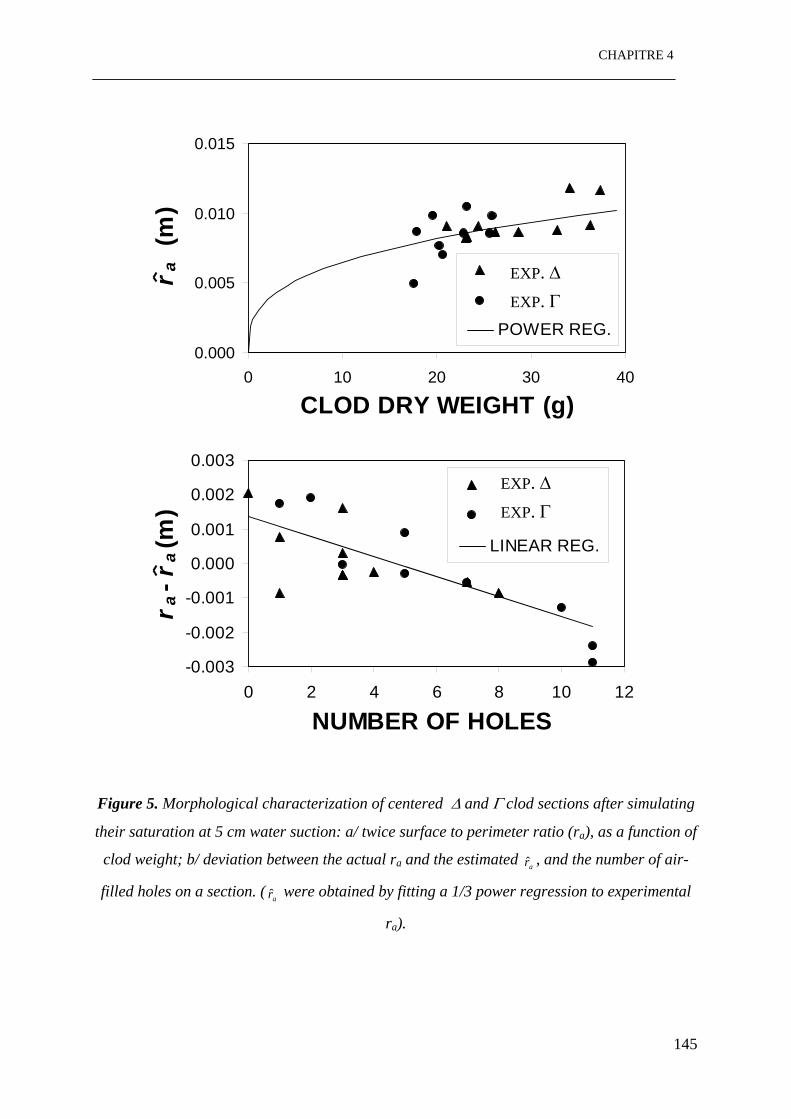
CHAPITRE 4
0.000
0.005
0.010
0.015
0 10 20 30 4
CLOD DRY WEIGHT (g)
r a (
m)
POWER REG.EXP. Γ EXP. ∆
0
-0.003
-0.002
-0.001
0.000
0.001
0.002
0.003
0 2 4 6 8 10
NUMBER OF HOLES
r a- r
a(m
)
LINEAR REG.
EXP. Γ EXP. ∆
12
Figure 5. Morphological characterization of centered ∆ and Γ clod sections after simulating
their saturation at 5 cm water suction: a/ twice surface to perimeter ratio (ra), as a function of
clod weight; b/ deviation between the actual ra and the estimated , and the number of air-
filled holes on a section. ( were obtained by fitting a 1/3 power regression to experimental
r
ar̂
ar̂
a).
145

CHAPITRE 4
Parameter Estimation
Relation between Clod Structure and Weight
The mean dry weight of the clods devoted to morphological characterization were 28.7 ±
3.7 and 22.0 ± 2.0 g for clods ∆ and Γ, respectively (confidence interval at p<0.05). The
number of air-filled holes did not significantly differ between the two types of clods: 4.8 ±
1.5, as well as the maximal distance to the nearest air-filled pore which was 8.0 ± 0.6 mm.
There was no significant correlation (p<0.05) between the number of air-filled holes and the
dry weight of clods (Fig. 4a). Similarly, the correlation between the maximal distance to the
nearest air-filled pore and the clod weight was not significant, although it was possible to fit a
cubic power regression to morphological measurements without bias (Fig. 4b). In contrast, the
linear correlation coefficient between the clod mass m (g) and the estimated aggregate radius
was significant (p<0.05) (Fig. 5a). ar̂
A relationship with a similar coefficient of correlation was found between with the
following power function (Fig. 5a):
( ) 31ˆ mra α= (7)
The optimized value of α was 3.0 mm g-1/3.
Assuming that each clod is a set of na aggregates, its weight is then equal to:
3
34
aab rnm πρ= (8)
where ρb is the bulk textural density (g.cm-3). Equations 7 and 8 enable to calculate the
number of aggregates:
343απρb
an = (9)
Assuming a bulk textural density of 1700 kg.m-3, we can calculate that the mean
number of aggregates is na = 5.15 per clod.
Pursuing the regression analysis, we found that the residuals (differences - ) were
linearly related to the number of air-filled holes per clod (Fig. 5b). The relationship can be
written:
ar ar̂
( )hhaa nnrr −=− βˆ (10)
146
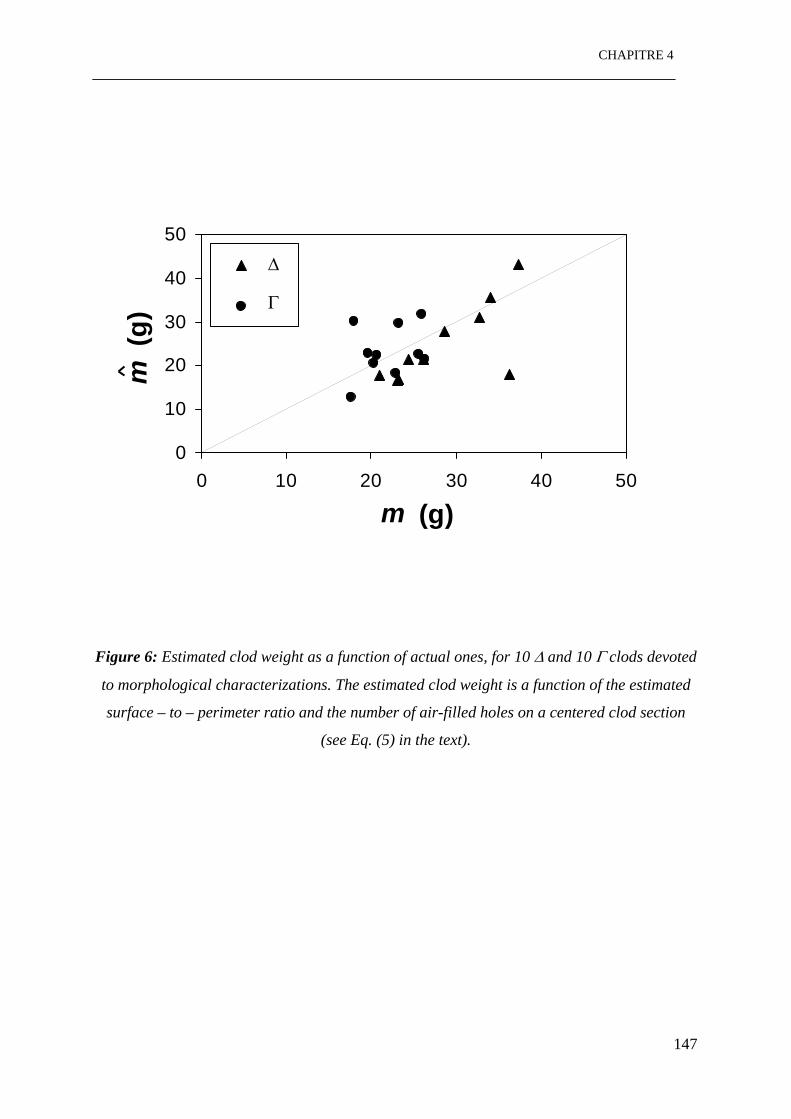
CHAPITRE 4
0
10
20
30
40
50
0 10 20 30 40 50
m (g)
m (g
) Γ
∆
Figure 6: Estimated clod weight as a function of actual ones, for 10 ∆ and 10 Γ clods devoted
to morphological characterizations. The estimated clod weight is a function of the estimated
surface – to – perimeter ratio and the number of air-filled holes on a centered clod section
(see Eq. (5) in the text).
147
CHAPITRE 4
where hn is the actual number of holes in the 2D clod section and hn is the mean number of
holes of the set of clods. The slope of the regression line is β = -0.29 mm.hole-1. The mean
number of holes was 4.80.The holes diameters measured by image analysis varied from 0.6 to
1.4 mm. The theoretical values of β which can be calculated using the changes in area and
perimeter due to the presence of holes, were close to the measured slope since they varied
from –0.11 to –0.29 mm.hole-1 for the 0.6 and 1.4 mm diameters, respectively. Therefore,
deviations between ra and mainly result from the presence of holes, and variations in
roughness of external perimeter versus clod weight have not to be invoked.
ar̂
To check the consistency of the previous results, we have calculated a theoretical clod
mass (g) as a function of the theoretical radius and compared it with the experimental
value. The theoretical mass is:
m̂ ar̂
3ˆ34ˆ aba rnm ρπ= (11)
where na is the number of equivalent aggregates within a clod. We assume that the theoretical
radius is the actual radius rar̂ a minored or majored by the effect of holes, as indicated by
equation (10). Combining equations (10) and (11) yields:
( ) 3
134ˆ ⎟
⎟⎠
⎞⎜⎜⎝
⎛⎟⎟⎠
⎞⎜⎜⎝
⎛ −−=
a
hhaba r
nnrnm
βρπ (12)
When comparing observed and simulated values of clod mass, we fixed the parameters β and
hn to the values previously found and we optimized the parameter na. We found a good
agreement between m and m (Fig. 6). The estimated value of the number of aggregates
constitutive of a clod (n
ˆ
a) was 4.65. It was close to the previous estimate (5.15) made using
equation (9). Then we used β and hn estimates and equation (12) in order to propose two
estimates of the effective radius of an aggregate constitutive of a clod, using either the
individual hole number measured on the clod (Eq. 13a) or the mean number of holes
measured on the set of clods (Eq. 13b):
148
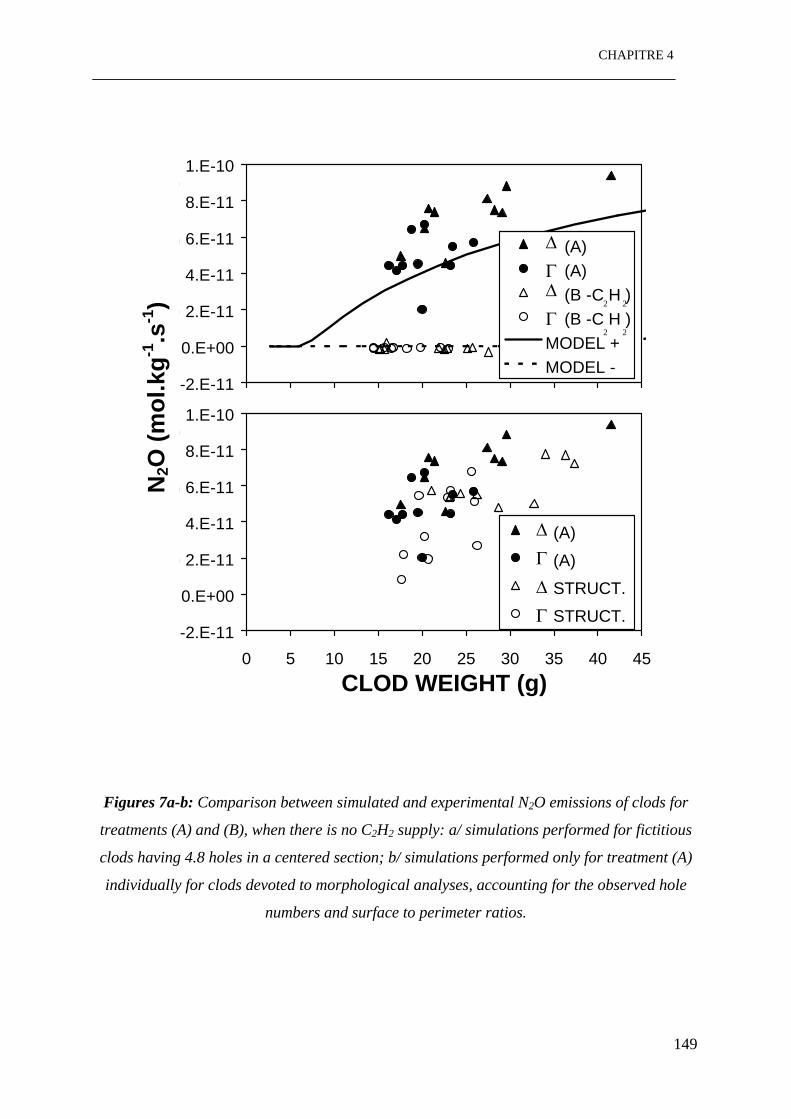
CHAPITRE 4
-2.E-11
0.E+00
2.E-11
4.E-11
6.E-11
8.E-11
1.E-10
0 5 10 15 20 25 30 35 40 45CLOD WEIGHT (g)
NO
(m2
ol.k
g-1.s
-1)
(A) (A) (B -C ) H (B -C H )MODEL +MODEL -
-2.E-11
0.E+00
2.E-11
4.E-11
6.E-11
8.E-11
1.E-10
0 5 10 15 20 25 30 35 40 45CLOD WEIGHT (g)
N2O
(mol
.kg-1
.s-1
)
(A) (A) STRUCT. STRUCT.
2
2 2
Γ
Γ
Γ
∆
∆
Γ ∆
∆
2
N2O
(mol
.kg-1
.s-1
)
Figures 7a-b: Comparison between simulated and experimental N2O emissions of clods for
treatments (A) and (B), when there is no C2H2 supply: a/ simulations performed for fictitious
clods having 4.8 holes in a centered section; b/ simulations performed only for treatment (A)
individually for clods devoted to morphological analyses, accounting for the observed hole
numbers and surface to perimeter ratios.
149
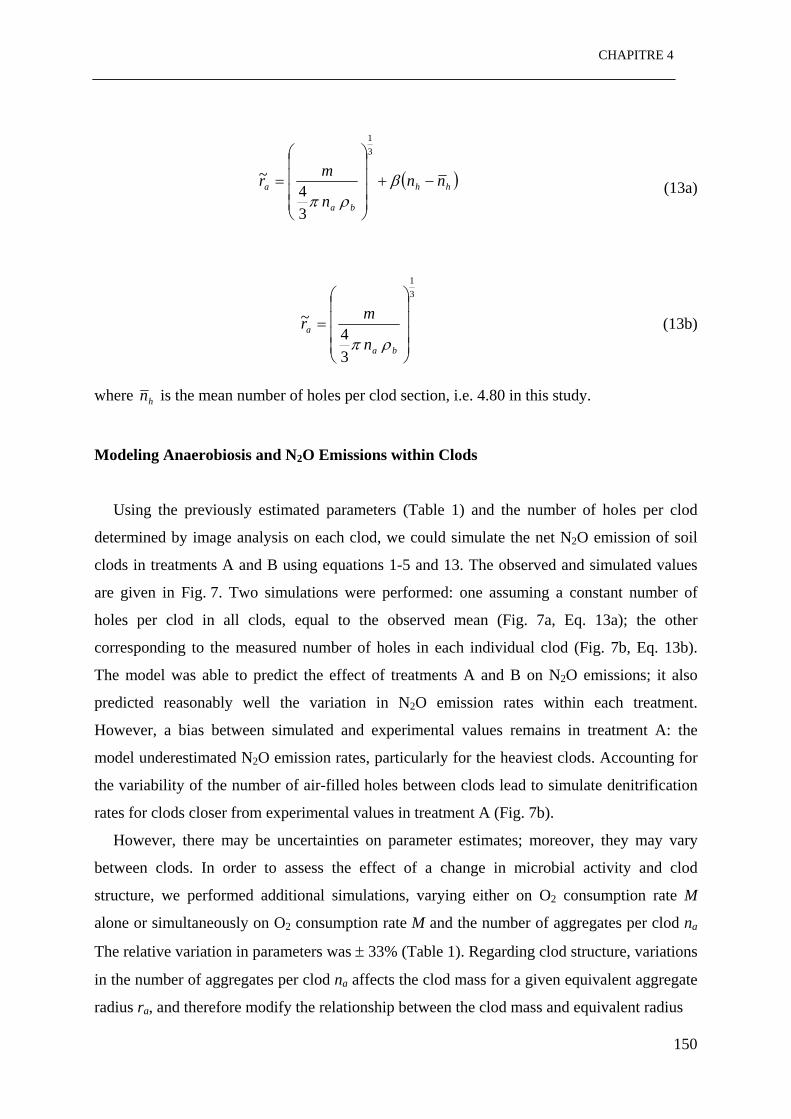
CHAPITRE 4
( hh
ba
a nnn
mr −+⎟⎟⎟⎟
⎠
⎞
⎜⎜⎜⎜
⎝
⎛
= βρπ
31
34
~ ) (13a)
31
34
~
⎟⎟⎟⎟
⎠
⎞
⎜⎜⎜⎜
⎝
⎛
=
ba
a
n
mrρπ
(13b)
where hn is the mean number of holes per clod section, i.e. 4.80 in this study.
Modeling Anaerobiosis and N2O Emissions within Clods
Using the previously estimated parameters (Table 1) and the number of holes per clod
determined by image analysis on each clod, we could simulate the net N2O emission of soil
clods in treatments A and B using equations 1-5 and 13. The observed and simulated values
are given in Fig. 7. Two simulations were performed: one assuming a constant number of
holes per clod in all clods, equal to the observed mean (Fig. 7a, Eq. 13a); the other
corresponding to the measured number of holes in each individual clod (Fig. 7b, Eq. 13b).
The model was able to predict the effect of treatments A and B on N2O emissions; it also
predicted reasonably well the variation in N2O emission rates within each treatment.
However, a bias between simulated and experimental values remains in treatment A: the
model underestimated N2O emission rates, particularly for the heaviest clods. Accounting for
the variability of the number of air-filled holes between clods lead to simulate denitrification
rates for clods closer from experimental values in treatment A (Fig. 7b).
However, there may be uncertainties on parameter estimates; moreover, they may vary
between clods. In order to assess the effect of a change in microbial activity and clod
structure, we performed additional simulations, varying either on O2 consumption rate M
alone or simultaneously on O2 consumption rate M and the number of aggregates per clod na
The relative variation in parameters was ± 33% (Table 1). Regarding clod structure, variations
in the number of aggregates per clod na affects the clod mass for a given equivalent aggregate
radius ra, and therefore modify the relationship between the clod mass and equivalent radius
150

CHAPITRE 4
151

CHAPITRE 4
0
20
40
60
80
100
120
0 10 20 30 40
Clod mass (g)
N2 O
(pm
ol.k
g-1.s
-1)
M, naM-, naM+, naM-, na- M-, na+
50
Figure 8. Simulated N2O emissions of clods submitted to treatment A, using either the mean
values of O2 consumption rate (M) and the mean number of aggregates per clod (na) or
these values decreased or increased by 33%. Simulations M+ and M- were performed with
M modified only; simulations (M+, na-) and (M-, na+) were performed with either M
increased and na reduced, or M reduced and na increased. All clods are assumed to have
4.80 holes in a centered section.
152

CHAPITRE 4
for clod aeration. The variations in M appear to greatly affect N2O emission rate by clods
(Fig. 8): for a mean clod of 25 g dry weight, the minimum and maximum N2O emission rates
correspond to a 42% reduction and a 32% increase of the mean emission rate, respectively.
If we add to this variation a variation in clod structure (i.e. either the minimum M with the
maximum na, or the maximum M with the minimum na), the range of N2O emission rates was
larger (Fig. 8): for a mean clod of 25 g dry weight, the minimum and maximum N2O emission
rates correspond to a 73% reduction and a 65% increase of the mean emission rate,
respectively.
Dealing with clods used in this study, its was previously shown that O2 consumption rate
was higher for clods ∆ than for clods Γ (14.3 nmol.kg-1.s-1 and 10.1 nmol.kg-1.s-1,
respectively): the O2 consumption rate of clods ∆ was 17% higher than the retained mean
value and 17% lower in clods Γ. These differences have increased the dependency of N2O
emission rate to clod mass (see Fig. 7a), since the mean mass of clods Γ was lower than that
of clods ∆. In addition, CO2 production rates (and therefore O2 consumption rates) varied
between clods: the measured coefficients of variation were 17 % and 14 % for clods ∆ and Γ,
respectively. These variations lead to a variability in clod N2O emission rates, as well as the
variability in clod structure as it has already been shown, simulating the N2O emission rates of
clods that have been devoted to soil structure characterization.
The model supposed that N2O emission through nitrification was negligible. In order to
check this assumption, 15N tracing technique was used for clods ∆ submitted to anaerobic pre-
incubation (Khalil et al., 2003b). Clods that experimented such conditions anaerobic pre-
incubation were simultaneously submitted C2H2 in order to check whether denitrification
stopped or not at the end of this pre-incubation period. Previous studies have shown that both
NH4+ oxidation and N2O production through nitrification are inhibited by C2H2 if its partial
pressure is higher than 1-10 kPa (Mosier, 1980). Moreover, removing C2H2 is not sufficient to
stop its inhibitory effect: Berg et al. (1982) noted that C2H2 effect had not ceased 7 days after
removal of C2H2, even with a partial pressure of 10 Pa.
Many studies indicated that the N2O/(N2O+N2) ratio could vary with various factors
(Granli and Bockman, 1994) such as organic matter, NO3- content (Blackmer and Bremner,
1979) and competition between NO3- and N2O (Baumann et al., 1996; Otte et al., 1996;
Khalil et al., 2003a). Although the model supposed that N2O/(N2O+N2) ratio was constant,
the presence of C2H2 during anaerobic pre-incubation does not only inhibit N2O reduction, but
also the synthesis of N2O reductase (Klemedtsson et al., 1977): this inhibitor can have
153
CHAPITRE 4
maintained the N2O/(N2O+N2) ratio at a high value, even have lead to increase this ratio if
denitrifiers have grown significantly during the anaerobic pre-incubation.
In addition, particulate organic matter was neglected in our model, although Parkin (1987)
found that a small piece of organic matter constituting 1% of the total core weight could be
responsible for 85% of the denitrification rate. Recently, Parry et al. (2000) suggested that the
relative contribution of POM-C to clod denitrification rates depends on their specific
respiratory and denitrifying activities and on the structure of the clod, which could favor or
inhibit denitrification activity at POM level, as a consequence of their aeration status.
Although we found POM contents and respiratory and denitrifying activities comparable to
those of Parry et al. (2000), we could not find any significant correlation between POM
content and denitrification rates (results not shown). The absence of correlation could result
from the small POM dimension in our clods, but this hypothesis remains to be proven.
154

CHAPITRE 4
CONCLUSION
Khalil et al. (2003b) have shown that a generalized anaerobic pre-incubation period
markedly stimulates the microbial respiration and the net N2O emission of soil clods during a
subsequent aerobic incubation, and that N2O emission is due to denitrification. The objective
of the present work was to check whether the increase in aerobic respiration and maximum
denitrification activities could explain the stimulation of N2O emissions, accounting for the
actual structure of soil clods. This objective was fulfilled using a model that takes into
account clod structure and calculates the anaerobic volume of the clod and its denitrification
behavior. The model was able to simulate experimental data, although some bias remained. It
showed the importance of taking into accounting clod structure. Changing model hypotheses,
for example the temporal variation of N2O/(N2O+N2) ratio of denitrification products, could
modify the model outputs. The results of this work should to explain the variability of N2O
emissions in situ. Nevertheless, some characteristic features retained in our experimental
procedure have surely distinguished clod behavior from their behavior in situ. Firstly, the
presence of C2H2 during the anaerobic pre-incubation of this study inhibited the synthesis and
activation of N2O reductase during this period, whereas an actual phase of anaerobiosis in situ
would probably favor N2O reductase and therefore decrease the N2O/(N2O+N2) ratio of
denitrification products. Secondly, the extent of an anaerobic event may vary with time and
space, and therefore affect the microbial behavior after such periods. After an anaerobic
period, microbial aerobic respiration decreases in a few days from a high value to a value
nearly equal to the respiration before anaerobic pre-incubation. The results obtained in this
study have to be extended to various dates after generalized anaerobic periods. In order to
predict these parameter variations, it is required to know the soil history and particularly the
alternations of anaerobic and aerobic periods.
155

CHAPITRE 4
ACKNOWLEDGEMENTS
This work was supported by the research programs PNSE and GESSOL, the Region
Picardie and INRA. We thank O. Delfosse and G. Alavoine, for their help in measurements.
We would like to acknowledge helpful discussions with J. Chadoeuf (INRA, Avignon). We
are grateful to Miss A.M. Wall of the Translation Unit, INRA, for reviewing the English
version of the manuscript.
156
CHAPITRE 4
REFERENCES
1. Ambus P. 1998. Nitrous oxide production by denitrification and nitrification in temperate
forest, grassland and agricultural soils. European Journal of Soil Science. 49: 495-502.
2. Arah J. R. M. 1997. Apportioning nitrous oxide fluxes between nitrification and
denitrification using gas-phase mass spectrometry. Soil Biol. Biochem. 29: 1295-1299.
3. Baumann B., M. Snozzi, A. J.B. Zehnder and J. R. Van Der Meer. 1996. Dynamics of
denitrification activity of Paracoccus denitrificans in continuous culture during aerobic-
anaerobic changes. Journal of Bacteriology: 4367-4374.
4. Berg P., L. Klemedtsson and T. Rosswall. 1982. Inhibitory effect of low partial pressures
of acetylene on nitrification. Soil Biol. Biochem. 14: 301-303.
5. Bidel L., P. Renault, L. Pages and L.M. Riviere. 2000. Mapping meristem respiration of
Prunus persica (L.) Batsch seedlings: potential respiration of the meristems, O2
diffusional constraints and combined effects on root growth. Journal of Experimental
Botany. 51: 755-768.
6. Blackmer A.M.., J.M. Bremner. 1979. Stimulatory effect of nitrate on reduction of N2O to
N2 by soil microorganisms. Soil Biol. Biochem. 11: 313-315.
7. Bruand A., I. Cousin, B. Nicoullaud, O. Duval and J.C. Begon.1996. Backscattered
electron scanning images of soil porosity for analyzing soil compaction around roots. Soil
Science Society of America Journal. 60: 895-901.
8. Chin K.J., R. Conrad. 1995. Intermediary metabolism in methanogenic paddy soil and the
influence of temperature. FEMS Microbiol. Ecol. 18: 85-102.
9. Conrad R. 1996. Soil microorganisms as controllers of atmospheric trace gases (H2, CO,
CH4, OCS, N2O and NO). Microbiol. Rev. 60: 609-640.
10. Conrad R. 1999. Contribution of hydrogen to methane production and control of hydrogen
concentrations in methanogenic soils and sediments. FEMS Microbiol. Ecol. 28: 193-202.
11. Fiès J.C. and P. Stengel. 1981. Densité texturale de sols naturels. II. Eléments
d'interprétation. Agronomie. 1: 659-666.
157

CHAPITRE 4
12. Firestone M.K., M.B. Smith, R.B. Firestone, and J.M. Tiedje. 1979. The influence of
nitrate, nitrite and oxygen on the composition of the gaseous products of denitrification in
soil. Soil Sci. Soc. Am. J. 43: 1140-1144.
13. Förstner U. 1987. Metals speciation, separation and recovery. Lewis Publishers, Chelsea.
14. Graedel, T.E. and P.J. Crutzen. 1992. Atmospheric change. An earth system perspective.
W.H. Freeman and Company, New York.
15. Granli T. and O.C. Bockman. 1994. Nitrous oxide from agriculture. Norv. J. Agri. Sci. 12
(supplement): 1-125.
16. Groffman P.M., 1991. Ecology of nitrification and denitrification in soil evaluated at
scales relevant to atmospheric chemistry. In: Rogers J.E., Whitman W.B. (eds.). Microbial
production and consumption of greenhouse gases: methane, nitrogen oxides and
halomethanes. American Society for Microbiology, Washington D.C, pp. 201-217.
17. Hénault C. 1993. Quantification de la dénitrification dans les sols à l’échelle de la parcelle
cultivée à l’aide d’un modèle prévisionnel. Thesis, E.N.S.A., Montpellier, 108 pp.
18. Hénault C. and J.C. Germon. 1995. Quantification de la dénitrification et des émissions de
protoxyde d'azote (N2O) par les sols. Agronomie 15: 321-355.
19. Henriksen Selmer-Olsen 1970. Automatic methods for determining nitrate and nitrite in
water and soil extracts. The Analyst 955, 514-518.
20. Holtan-Hartwig L., P. Dörsch, L. R. Bakken. 2000. Comparison of denitrifying
communities in organic soils: kinetics of NO3- and N2O reduction. Soil Biology and
Biochemistry 32: 833-843.
21. IPCC 1996. Climate change 1995: the science of climate change. Contribution of working
group I to the second assessment report of the intergovernmental panel on climate change.
(eds Houghton, J.T., Meira Filho, L.G., Callander, B.A., Harris, N., Kattenberg, A.,
Maskell K.). Cambridge University Press, Cambridge.
22. Khalil K., P. Renault, B Mary and N. Guérin 2003a. Modeling Denitrification including
the Dynamics of Denitrifiers and their Progressing Ability to Reduce Nitrous Oxide:
Comparison with Batch Experiments. Submitted to European Journal of Soil Science.
23. Khalil K., P. Renault and B. Mary 2003b. The effect of transient anaerobic pre-incubation
on subsequent aerobic respiration and N2O emission of clods in atmospheric conditions.
Submitted to Soil Biology and Biochemistry.
24. Klemedtsson L., B.H. Svensson, T. Lindberg and T. Rosswall. 1977. The use of acetylene
inhibition of nitrous oxide reductase in quantifying denitrification in soils. Swedish. J.
agric. Res. 7: 179-185.
158

CHAPITRE 4
25. Li C., S. Frolking and T.A. Frolking. 1992. A model of nitrous oxide evolution of soil
driven by rainfall events: 1- Model structure and sensitivity. Journal of Geophysical
Research. 97: 9758-9776.
26. Maag M., Malionovsky M., Nielsen S.M., 1997. Kinetics and temperature dependence of
potential denitrification in riparian soils. Journal of Environmental Quality 26, 215-223.
27. Malhi S. S., W. B. McGill and M. Nyborg. 1990. Nitrate losses in soils: effect of
temperature, moisture and substrate concentration. Soil Biol. Biochem. 22: 733-737.
28. McConnaughey P.K. and D.R. Bouldin. 1985a. Transient microsite models of
denitrification: I. Model development. Soil Sci. Soc. Am. J. 49: 886-901.
29. Mosier A.R. 1980. Acetylene inhibition of ammonium oxidation in soil. Soil Biol. and
Biochem. 12: 443-444.
30. Otte S., N. G. Grobben, L. A. Robertson, M. S. M. Jetten and J. G. Kuenen. 1996. Nitrous
oxide production by Alcaligenes faecalis under transient and dynamic aerobic and
anaerobic conditions. Applied and Environmental Microbiology: 2421-2426.
31. Parkin T. B. 1987. Soil microsites as a source of denitrification variability. Soil Sci. Am.
J. 51: 1194-1199.
32. Parry S., P. Renault, C. Chenu, and R. Lensi. 1999. Denitrification in pasture and cropped
soil clods as affected by the pore space structure. Soil Biol. Biochem. 31: 493-501.
33. Parry S, P. Renault, J. Chadoeuf, C. Chenu and R. Lensi, 2000. Particulate organic matter
as a source of variation in denitrification in clods of soil. European Journal of Soil
Science. 51: 271-281.
34. Rappoldt C. 1992. Diffusion in aggregated soil. Doctoral Thesis, Wageningen
Agricultural University, Wageningen, The Netherlands.
35. Renault P. and P. Stengel. 1994. Modeling oxygen diffusion in aggregated soils: I.
Anaerobiosis inside the aggregates. Soil Sci. Soc. Am. J. 58: 1017-1023.
36. Richard G., Boizard H., Roger-Estrade J., Boiffin J., Guérif J., 1999. Study of soil
compaction due to traffic in field conditions: pore space and morphological analysis. Soil
and Tillage Research 51, 151-160.
37. Serra J. 1982. Image analysis and mathematical morphology. Academic press, London.
38. Sextone A. J., N. P. Revsbech, T. B. Parkin and J.M. Tiedje. 1985. Direct measurement of
oxygen profiles and denitrification rates in soil aggregates. Soil Sci. Am. J. 46:68-74.
39. Sierra J., P. Renault and V. Vallès. 1995. Anaerobiosis in saturated soil aggregates:
modelling and experiment. European Journal of Soil Science. 46: 519-531.
159
CHAPITRE 4
40. Smith K A. 1990. Anaerobic zones and denitrification in soil: modelling and
measurement. In: Denitrification in soil and sediment, (eds. N.P. Revsbech and J.
Sorensen), pp. 229-244, Plenum, New York.
41. Stevens R. J., R. J. Laughlin, L. C. Burns, J. R. M. and R. C. Hood. 1997. Measuring the
contributions of nitrification and denitrification to the flux of nitrous oxide from soil. Soil
Biol. Biochem. 29: 139-151.
42. Tsusuki K. and F. N. Ponnamperuma 1987. Behavior of anaerobic decomposition
products in submerged soils. Effects of organic material amendment, soil properties and
temperature. Soil. Sci. Plant Nutr. 33: 13-33.
43. Zanner C. W. and P. R. Bloom. 1995. Mineralization, nitrification and denitrification in
histosols of Northern Minnesota. Soil. Sci. Soc. Am. J. 59: 1505-1511.
44. Zumft G. 1997. Cell biology and molecular basis of denitrification. In: Microbiology and
Molecular biology reviews, pp. 533-616.
160

CHAPITRE 5
INFLUENCE DE LA PRESSION EN O2 SUR LA
PRODUCTION DE N2O PAR NITRIFICATION ET
DENITRIFICATION PAR DES AGREGATS DE SOL
Ce chapitre 5 correspond à un article « en cours de soumission » pour la
revue Soil Biology and Biochemistry : K. Khalil, B. Mary, P. Renault (2003)
Nitrous oxide production by nitrification and denitrification in
soil aggregates as affected by O2 concentration
161

Chapitre 5
SUMMARY
Nitrous oxide emitted by soils can be produced either by denitrification in anoxic
conditions or by nitrification in presence of oxygen. The relative importance of the two
processes, particularly under varied partial pressures of O2, is not always known. This paper
focuses on the influence of O2 availability on N2O production by nitrification and
denitrification in an arable Orthic Luvisol.
Soil aggregates (2-3 mm size), water unsaturated, received 116 mg N kg-1 as ammonium
sulphate labelled with 15N and were incubated during 2 weeks at different O2 partial pressures:
0, 0.3, 0.7, 1.4, 4 and 20.5 kPa. A 15N tracing technique was used to quantify nitrification and
denitrification rates. 15N2O and 15N2 were measured.
O2 availability appeared to strongly influence both nitrification and denitrification rates and
also the release of N2O. Nitrification rates were reduced by a factor of 6-9 when O2 decreased
from 20.5 to 0.3 kPa. They were highly correlated with O2 consumption rates. Denitrification
mainly occurred in complete anoxic conditions. The proportion of N2O emitted by
denitrification was estimated by two independent methods: one based on 15N tracing using
isotope composition of NH4, NO3 and N2O, the other based on the measurement of the 15N2O:15N2 ratio. The two methods gave similar results. The highest N2O emissions were
obtained under complete anoxic conditions and were due to denitrification. However
emissions almost as important were obtained at day 14 with 1.4 kPa O2 pressure, and they
were due to nitrification. Nitrification was the main source of N2O at O2 concentrations
greater than 0.3 kPa. The N2O emissions due to nitrification were linearly related with the
amounts of N nitrified, but the slope of the regression was highly dependent on O2
concentration: it varied from 0.16% to 1.48% when O2 concentration was reduced from 20.5
to 0.7 kPa. Emissions of N2O by nitrification may then be quite significant if nitrification
occurs at a reduced O2 concentration.
Key-words: denitrification, nitrification, nitrous oxide, oxygen, 15N.
163
Chapitre 5
INTRODUCTION
Nitrous oxide is involved in the global greenhouse effect (Smith, 1990; IPCC, 1996). Its
emission from soils results mainly from biological denitrification and nitrification (Groffman,
1991; Hénault and Germon, 1995; Conrad, 1996). A better knowledge of the contribution of
each process could help to predict and mitigate N2O emissions by cultivated soils.
Nitrification and denitrification in soil often occur in close vicinity so that a substantial part
of the NO3- formed by nitrification diffuses to the anaerobic denitrification zone where it is
reduced to N2 (Nielsen et al., 1996). The simultaneous occurrence of nitrification and
denitrification in soil associated with N fertilisation has been suggested recently (Zanner and
Bloom, 1995; Nielsen et al., 1996; Abbasi et al., 1997). Bremner and Blackmer (1981)
observed nitrous oxide emissions from “well-aerated soils” which were not correlated with
NO3- but were significantly correlated with NH4
+ concentrations. Parton et al. (1996) found
that N2O fluxes through nitrification could be proportional to soil N turnover and that only
high levels of soil NH4 (>3 mg N kg-1soil) affected N2O emissions.
The sources of N2O can be identified by using selective inhibitors, sterilisation or by
adding substrates. The disadvantage of nitrification inhibitors is that prevention of NO3-
production may affect the rate of denitrification. Sterilisation can be used to separate abiotic
from biotic sources. Adding NH4+ or NO3
- as substrates cannot provide definitive
identification of the sources of N2O unless the substrates are 15N labelled. The relative
importance of nitrification and denitrification can be assessed by measuring and comparing
the isotope enrichments of the N2O, NH4+ and NO3
- pools (Stevens et al., 1997).
The availability of O2 in soil is one of the main factors regulating nitrification,
denitrification and the release of N2O. Oxygen pressure is the main factor controlling
denitrification through the activity and synthesis of denitrifying enzymes in soil (Tiedje,
1988). Denitrification has been considered as a strictly anaerobic process, but it is now well
established that it can also occur in apparently aerobic environments. Many soil denitrifying
micro-organisms have been found to be able to produce N2O over a wide range of oxygen
pressures.
Conversely, nitrification is a strictly aerobic process since the NH4+ oxidation enzyme of
nitrifying organisms requires O2 for activation (Wood, 1987). The effect of O2 on nitrification
and associated N2O emissions has been studied more in continuous cultures than in soils.
164

Chapitre 5
Bollmann and Conrad (1998) showed that N2O emitted by nitrification in soils was important
at partial pressures higher than 0.1-0.5 kPa O2. Goreau et al. (1980), using sediment slurries,
demonstrated that production of N2O by nitrification reached its maximum at 0.2 kPa O2
pressure.
The mechanism of N2O production by nitrification is not completely elucidated (Blackmer
et al., 1980; Stevens and Laughlin, 1998). Three main hypotheses have been proposed:
1) a constant proportion of NH4+ can be converted to N2O during nitrification, resulting from
various reactions of intermediates. Conrad (1990) proposed that N2O production could be the
consequence of intermediate (HNO) formation during oxidation of NH2OH to NO2-. HNO
oxidation could also lead to the formation of another unknown compound which would be
then oxidised to NO2-. This hypothesis was retained in several models (Linn and Doran, 1984;
Davidson, 1993; Parton et al, 1996).
2) the use of NO2- as an alternative electron acceptor during NH4
+ oxidation for growth of
nitrifiers when O2 pressure is not high enough to supply these microbes all the required O2
(Ritchie and Nicholas, 1972; Goreau et al., 1980). The effect of O2 pressure has been shown
experimentally either directly by varying O2 partial pressure (Bollmann and Conrad, 1998) or
indirectly by varying soil moisture (Zanner and Bloom, 1995) and is accounted for in some
models (Grant, 1995);
3) the partial oxidation of NH4+ into NO2
- in aerobic conditions, followed by NO2- diffusion to
anaerobic regions and its subsequent reduction into N2O by denitrification. Poth and Focht
(1985) concluded that nitrite reduction to nitrous oxide by N. europaea is in accordance with
the definition of denitrification: nitrous oxide production by nitrifiers is not correlated with
nitrate additions but is correlated with ammonium additions, which can be explained by the
requirement for ammonium as an electron source for nitrifier denitrification and by the lack of
nitrate reductase activity in N. europaea.
The aim of this work was to quantify nitrification and denitrification and their specific
contribution to N2O emissions in response to the O2 concentration above the soil. The study
was then conducted on small soil aggregates, water unsaturated, using 15N isotope technique
to quantify nitrification and denitrification rates and N2 production.
165

Chapitre 5
MATERIALS AND METHODS
Soil sampling and conservation until measurements
Experiments were performed on an Orthic Luvisol (FAO classification) sampled at Mons-
en-Chaussée in Northern France (49°80' N; 3°60' E). The soil was cultivated with maize in
2000. Its properties were as follows: clay, 194 g kg-1; silt, 706 g kg-1; sand, 68 g kg-1; pHwater,
8.20; total CaCO3, 32 g kg-1; organic C, 8.52 g kg-1; total N 1.00 g kg-1. Soil clods were
sampled in the ploughed layer (10-30 cm depth) after digging a trench, on September 2000.
Two sets of clods were separated: clods ∆, with a massive structure and no visible porosity
(resulting from compaction due to traffic) and clods Γ, with a fragmentary structure and
visible porosity (Richard et al., 1999). The clods were gently broken down immediately after
sampling and then calibrated at field moisture condition (0.184 g water g-1 dry soil): we kept
clods between 2.5 and 3 cm size. In order to reduce microbial activity during storage, the
clods were air-dried during 3 days to obtain a residual moisture close to 0.10 g g-1 soil
(corresponding to a water suction of –2 MPa). At the beginning of the present experiment
(June 2002), the clods were sieved to obtain aggregates between 2 and 3.15 mm. The soil then
still contained 0.07 g water g-1 soil; its NO3- content was 10.7 mgN kg-1 and its NH4
+ content
was 0.1 mgN kg-1.The aggregates were rewetted by spraying deionised water to obtain a
residual moisture close to 0.18 g g-1, and were pre-incubated at 20°C in airtight jars during 7
days.
Experiment 1
The objective was to assess the influence of NH4+ concentration on N2O production.
Twenty five g fw (fresh weight) of soil aggregates were put into 125 mL flasks, and various
amounts of NH4+ were added as (NH4)2SO4 solution to obtain 0, 80, 116 or 170 mg NH4
+-N
kg-1 soil. The addition of this solution rose the soil water content at 0.19 g g-1. Eighteen flasks
were closed and incubated at 20°C for 14 days: 6 flasks were used for gas measurements
(including 3 flasks without soil used as blanks), 3 flasks were used for final soil pH
measurement and 12 flasks for mineral nitrogen measurements. N2O and mineral N were
166

Chapitre 5
analysed at day 2, 4, 7, 10 and 14 (3 replicates at each date). Initial soil pH and mineral N
were also measured at day 0 on additional samples. At each date, the atmosphere of flasks
was renewed by opening the flasks for a few minutes. The same procedure and measurements
were applied for each NH4+ concentration.
Experiment 2
Its objective was to assess the influence of O2 concentration on N2O production, at a given
soil NH4+ concentration (chosen as 116 mg N kg-1 soil according to results of experiment 1).
Twenty five g f.w. (fresh weight) of soil aggregates were put in 125 mL flasks. A 15N labelled
(NH4)2SO4 solution (50% atom enrichment) was added to each soil sample to obtain the 116
mg NH4+-N kg-1 concentration and a residual moisture of 0.21 g water g-1 soil. The flasks
were closed and placed under 6 different O2 concentrations (nominally 0, 0.5, 1, 2, 4.8 and
21% O2 mixed with N2). Each flask received 3 successive cycles of 3 minutes vacuum and 3
minutes filling with a given mixture of O2/N2 at atmospheric pressure. 18 flasks were
incubated at 20°C for 14 days. The procedure was the same than in experiment 1, except that
at each measurement date the atmosphere of flask was renewed with the corresponding O2/N2
gas mixture by the same procedure (3 minutes vacuum and 3 minutes gas filling, repeated
three times). The same measurements were performed as in experiment 1. Additional
measurements consisted in O2 concentration, 15N2, 15N2O in atmosphere and 15N mineral in
soil. Oxygen consumption occurred during each measurement interval, so that the mean O2
pressure in each treatment was in fact: 0, 0.3, 0.7, 1.4, 4.0 and 20.5 kPa. These values will be
used as effective O2 concentrations in the following.
Gas measurements
For both experiments, gas samples were sampled at each date from the flasks: 1 mL of gas
was sampled with a syringe for O2 and injected into an automatic CN analyzer (Carlo Erba,
ANA 1500, Milan, Italy) that was adapted to measure O2 concentrations after replacing the
previous Porapak QS column by a molecular sieve column (60-80 mesh, 1.8 m, 50°C), which
separates O2 and N2 gas. The CN analyzer was coupled to an integrator (Shimadzu, C-R6A,
Chromatopac). 0.2 mL of gas was sampled with a syringe for 15N2 analysis, using a modified
167

Chapitre 5
CN analyzer. Prior to the separation of N2 and O2, the gas sample successively passed
through a water absorbent, a CO2 trap and a N2O cryogenic trap and finally an oven filled
with reduced copper before entering an isotope ratio mass spectrometer (Fisons, Isochrom-
EA, Manchester, England).
Two hundred fifty mL gas was sampled with dual-ended flasks previously vacuumed, for
N2O and 15N2O analysis. The analysis was made with the mass spectrometer after pre-
concentration using the 'trace gas' system (Micromass, Trace gas, Manchester, England).
Mineral N measurements
The mineral N content of clods was extracted with a KCl M solution (soil:solution ratio =
1:5). Measurements were performed with a TRAACS 2000 analyzer (Bran & Luebbe,
Germany) using the methods proposed by Kamphake et al. (1970) for NO3- and NO2
- analysis
and Krom (1980) for NH4+ analysis. The 15N-NH4
+ and 15N-(NO3-+NO2
-) were separated
successively by micro-diffusion and collected on a glass fibre disc (6 mm diameter)
impregnated with 10 µL of 1M H2SO4 solution (Brooks et al., 1989). The discs are then
placed in tin capsules and analysed in the elementary analyzer - mass spectrometer
equipment.
pH measurement
For pH measurement, we added a mass of ultra pure water equal to the double of soil mass
in each flask. The flask was closed and shaken for 10 minutes. The mixture was poured in a
beaker and left for 2 minutes. The pH was then recorded each minute during 5 minutes using
calomel/glass and pH-meter. Measurements were done at the beginning of incubation on 10
replicates and at the end of incubation in each treatment on 3 replicates.
Nitrogen rates calculations
N rates were calculated using measurements of mineral -N and –15N and FLUAZ model
(Mary et al., 1998). This model combines a numerical method for solving the differential
system given by the N and 15N mass equations and a non linear fitting program for optimising
168

Chapitre 5
the N rates parameters by minimizing the difference between observed and simulated N and 15N data (amounts and isotopic excess of NH4
+ and NO3-). Nitrification rate could be
estimated from NO3- experimental accumulation, but this estimate would not be as accurate as
using the model. The model was used in experiment 2 to calculate mineralisation (m),
nitrification (n) and denitrification (d) for the different O2 concentrations. We assumed that
immobilisation was negligible, since no readily decomposable organic nitrogen was added.
NH3 volatilisation was also neglected, on the basis of previous measurements (results not
shown). These assumptions were confirmed by the measured 15N balance (15NH4+ + 15NO2
- + 15NO3
- + 15N2O + 15N2) that did not differ significantly from 100% in any of the treatments.
We also assumed that mineralisation rate was the same in all treatments at a given time
interval. This assumption allowed to calculate more precisely nitrification and denitrification
rates. Nitrification rates were supposed to follow first order kinetics, whereas mineralisation
and denitrification zero order kinetics during each time interval . The two stages of
nitrification are the following:
OHHNOONH 2224 223
++→+ +−+ (1)
−− →+ 322 21 NOONO (2)
FLUAZ model does not directly accounts for NO2- compartment. It considers the sum (NO2
-
+NO3-) and therefore calculates the ammonium oxidation rate (rate ni), i.e. oxidation into
NO2-. The oxidation rate into NO3
- (rate na) was calculated afterwards using measurements of
NO2- pool (Ni), as follows:
t
Nnn i
ia ∆∆
−= (3)
Furthermore, we have compared O2 consumption rate with nitrification rate. Regarding the
stochiometry of the previous equations relative to O2 consumption, we calculated the
following nitrification rate:
4
3 ai nnn
+= (4)
169

Chapitre 5
RESULTS
Effect of NH4+ concentration
The evolution of soil mineral N pools during the 14 days incubation at atmospheric O2
concentration (experiment 1) is given in Figure 1. Ammonium and NO3- concentrations
remained almost stable in the control (i.e. without addition of NH4+), whereas they decreased
and increased, respectively, for the 3 NH4+ treatments (addition of 80, 116 and 170 mg N kg-1,
Fig. 1a,b). Nitrite concentration increased then decreased with time, except for the control.
The higher the initial concentration of NH4+, the higher was the peak of NO2
-. The maximal
value was 22.7 mg N kg-1 for the addition of 170 mg N kg-1 (Fig. 1c).
The nitrification kinetics were calculated using changes in mineral N contents (Table 1). They
appear to depend on the initial NH4+ concentrations. Without NH4
+ addition, the nitrification
was low, in average 0.27 mg N kg-1 day-1 (and equal to net mineralisation). The highest NH4+
and NO2-oxidation rates were observed with the highest NH4
+ concentration (A170): 19.1 and
23.7 mg N kg-1 day-1, respectively. The initial rates of NH4+ oxidation were greater than the
initial rates of NO2-oxidation. Then the NO2
-oxidation rates (na) increased more with time
than the NH4+ oxidation rates (ni).
Effect of O2 concentration
Mineral N and 15N
The evolution of soil mineral N pools during the 14 days of incubation at various O2
concentrations (experiment 2) is given in Figure 2, for a fixed initial NH4+ concentration (116
mg N kg-1). Ammonium concentration decreased and NO3- concentration increased in all
treatments, except at 0 % O2 concentration: in this case, NH4+ concentration remained more or
less constant and NO3- concentration fell from 10.7 to 0.1 mg N kg-1 within 7 days. NO2
-
concentration increased then decreased with time, except for the lowest O2 concentrations (0
and 0.3 kPa); in these treatments, nitrite concentration remained negligible during the whole
incubation period. The mineral N content responded markedly to O2 concentration. The
higher the O2 concentration, the faster was the disappearance of NH4+ and the increase of
170

Chapitre 5
0
50
100
150
200
0 2 4 6 8 10 12 14
NH4+ - N
(mg
kg-1
)
a
0
50
100
150
200
0 2 4 6 8 10 12 14
NO3- - N
(mg
kg-1
) A0A80A116A170
b
0
10
20
30
40
0 2 4 6 8 10 12 14
Time (days)
NO
2- - N (m
g kg
-1)
c
Figure 1. Variation of mineral N (mg N kg-1) with time in soil with various amounts of NH4+
added at time 0. A0: control (no addition), A80: 80 mg N kg-1, A116: 116 mg N kg-1; A170:
170 mg N kg-1. a) NH4+ concentration; b) NO3
- concentration; c) NO2- concentration. Vertical
bars are the standard deviations of means
171

CHAPITRE 5
A0 A80 A116 A170 Period (days)
ni na ni na ni na ni na
0-2 0.0 0.0 15.1 10.6 9.4 5.9 17.8 12.4
2-4 0.6 0.6 12.2 10.5 15.3 11.2 14.8 8.8
4-7 0.2 0.2 8.0 12.2 12.3 13.7 19.1 19.8
7-10 0.5 0.5 0.0 0.0 8.5 12.1 18.1 23.7
10-14 0.1 0.1 0.1 0.1 1.2 1.2 0.5 1.4
Table 1. NH4+ oxidation rates (ni, mg N kg-1 d-1) and NO2
- oxidation rates (na, mg N kg-1 d-1)
in soil incubated at atmospheric O2 concentration, for different time intervals and initial
ammonium concentrations (0, 80, 116 and 170 mg N kg-1).
na was calculated on the basis of NO3- accumulation and ni on the basis of NH4
+
disappearance and NO2- variation.
172

CHAPITRE 5
0
40
80
120
160
0 2 4 6 8 10 12 1
NH4+ -N
(mg
kg-1
)
a
0
40
80
120
160
0 2 4 6 8 10 12 14
NO3- -N
(mg
kg-1
)
0%0.3%0.7%1.4%4.0%20.5%
b
0
5
10
15
20
0 2 4 6 8 10 12 14
Time (days)
NO
2- -N (m
g kg
-1)
c
4
Figure 2. Variation of mineral N (mg N kg-1) with time in soil incubated at different O2
concentrations: 0, 0.3, 0.7, 1.4, 4.0 and 20.5%: a) NH4+ concentration; b) NO3
-
concentration; c) NO2- concentration. Vertical bars are the standard deviations of means
173

CHAPITRE 5
0%
0.3% 0.7% 1.4% 4.0% 20.5% Period (days)
NH4+ NO3
- N2O NH4+ NO3
- N2O NH4+ NO3
- N2O NH4+ NO3
- N2O NH4+ NO3
- N2O NH4+ NO3
- N2O
0 - 2 41.24 0.00 0.31 40.69 4.85
4.07 41.25 7.08 17.58 40.65 8.01 20.70 39.73 9.97
11.64 41.22 9.94 4.07 (1.5) (.01) (.05) (2.07)
(.5) (3.43) (1.26)
(3.24) (2.02) (1.97)
(.78) (2.12) (2.72) (.4) (2.92) (1.29) (.01) (3.49)
2 - 4
41.43 0.00 0.87 39.82 12.66 10.14 41.66 17.21 27.64 38.65 20.83 37.30 38.43 24.34 30.98 40.75 28.91 24.56 (.69) (.01) (.42) (2.86)
(.44) (3.8) (.57) (1.76) (.4) (2.07)
(.66) (6.83) (1.8) (1.43) (2.02) (.84) (4.29)
(4.84)
4 - 7 38.45 0.01 0.01 38.81 18.04 3.70 40.28 23.55 24.80 38.12 28.35 26.08 38.60 32.34 32.92 39.66 37.62 31.91
(1.02)
(.01) (.01) (3.27)
(.3) (2.1) (1.6) (.25) (.55) (2.29)
(1.37) (2.41) (1.22) (1.53) (4.56) (1.03) (4.46)
(3.13)
7 - 10
38.51 0.01 0.18 38.76 23.20 2.00 40.15 28.49 31.56 40.19 32.95 29.53 38.25 36.84 19.55 26.75 37.61 8.39 (.72) (.01) (.04) (2.27)
(.6) (1.45) (1.26)
(.15) (1.36) (1.09)
(1.17) (5.14) (2.82) (.47) (6.52) (.26) (.31) (5.67)
10 - 14
39.65 0.01 0.03 40.09 27.05 26.18 40.80 33.69 33.25 39.94
35.76 35.87 18.63 37.82 11.77 7.06 38.03
2.57
(.61) (.01) (.04) (1.37) (.69) (4.75) (.38) (.11) (1.05) (.26) (.15) (1.06) (1.85) (.24) (2.5) (.01) (.24) (.71)
Table 2. Atom% excess of NH4+, NO3
- and N2O (mean and standard deviations values) measured in soil or gas samples at different incubation
dates and different O2 concentrations (0, 0.3; 0.7, 1.4, 4.0 and 20.5%)
174
CHAPITRE 5
NO3-, and the greater was the NO2
- accumulation. The maximal NO2- concentration at
atmospheric pressure was 15.3 mg N kg-1 (Fig. 2c).
The nitrification and denitrification rates, calculated using measurements of mineral N and 15N (Table 2) and FLUAZ model, are given at Table 3. Significant denitrification rates (i.e.
greater than 0.2 mg N kg-1 d-1 corresponding to the accuracy of FLUAZ calculations) were
only observed in the 0 and 0.3 kPa O2 pressure treatments. Nitrification rates (both NH4+ and
NO2-oxidation rates) were markedly reduced when O2 concentration decreased: they
decreased by a factor of 4-10 when O2 pressure fell from 20.5 to 0.3 kPa. Nitrification rates
increased versus time in all treatments, except for the 20.5 kPa pressure in which it reached a
maximum at day 4 and then decreased although the soil still contained exchangeable NH4+.
For the highest values of O2 concentration, i.e. 4.0 and 20.5 kPa, the first step of nitrification
(NO2-oxidation) was slightly slower at the beginning but increased faster than the first step
(NH4+ oxidation), as shown previously (experiment 1). For the lowest O2 pressures, 0.3 and
0.7 kPa, the two steps proceeded at the same rat, so that there was no NO2- accumulation. The
reduction in O2 concentration then affected primarily the NH4+ oxidation step.
N2O and 15N2 gas
The cumulative N2O emissions by the soil submitted to different O2 concentrations are
presented in Figure 3a. Nitrous oxide emissions increased with time during incubation and
were highly dependent on O2 concentration in the flask atmosphere. The anaerobic situation
(0% O2) resulted in the highest production of N2O. The emission took place rapidly, since the
amount of N2O produced at day 2 was 0.73 mg N kg-1, corresponding to a rate of 30 nmol
N2O kg-1 s-1. It levelled off after day 7, when NO3- concentration was very small. At day 14,
the amount of N2O evolved was 1.16 mg N kg-1. The emission rate also decreased with time
with the 0.3 kPa O2 pressure but the intensity was much smaller than in the anaerobic
treatment. The kinetics of emission were very different in the treatments with 0.7 and 1.4 kPa
O2 pressure: the emission rate increased with time. The amount of N2O produced at day 14 at
1.4 kPa O2 pressure was almost equivalent at the amount produced in anaerobic conditions:
1.09 mg N kg-1. The productions of N2O in treatments with 4.0 and 20.5 kPa O2 were
intermediate. It levelled off towards the end of the incubation, simultaneously to the
nitrification process.
The corresponding measurements of the ratio 15N2O:15N2 are given in Figure 3b. Knowing
that N2 emitted by the soil is exclusively derived from N2O, we can assume that both gas have
175

CHAPITRE 5
0% 0.3% 0.7% 1.4% 4.0% 20.5% Period ni na d ni na d ni na d ni na d ni na d ni na d (days)
0 - 2 0.0 0.0 3.2 1.7 1.7 0.2 2.8 2.7 0.0 4.1 3.6 0.0 7.3 5.5 0.0 10.2 6.7 0.0
2 - 4 0.0 0.0 1.4 1.7 1.7 0.0 3.2 3.1 0.0 6.1 5.5 0.0 9.8 7.0 0.0 16.0 11.9 0.0
4 - 7 0.0 0.0 0.5 1.5 1.5 0.0 3.5 3.5 0.0 6.2 6.0 0.0 11.0 11.8 0.0 13.8 15.2 0.0
7 - 10 0.0 0.0 0.0 1.6 1.6 0.4 3.3 3.2 0.0 6.5 7.0 0.0 13.3 15.4 0.0 9.2 12.8 0.0
10 - 14 0.0 0.0 0.0 1.3 1.2 0.0 4.2 4.2 0.0 8.2 8.4 0.0 4.2 4.3 0.0 0.6 0.7 0.0
Table 3. Nitrification rate (NH4+ oxidation rate ni) and denitrification rate (d) (mg kg-1 d-1), calculated using measured N and 15N pools and
FLUAZ model in soil samples incubated under various O2 concentrations (0; 0.3; 0.7; 1.4; 4.0 and 20.5%) during 14 days.
176

CHAPITRE 5
0.0
0.3
0.6
0.9
1.2
0 2 4 6 8 10 12 1
N 2O
(mg
kg-1
)a
4
0
1
2
3
4
0 2 4 6 8 10 12 1Time (days)
15N 2
O /
15N 2
0%0.3%0.7%1.4%4%20%
b
4
Figure 3. Kinetics of N2O and N2 emissions (mg N kg-1) from soil incubated at different O2
concentrations: 0, 0.3, 0.7, 1.4, 4.0 and 20.5%: a) cumulative N2O; b cumulative N2
(calculated using 15N2 measurements); c) cumulative N2O : N2 ratio (equal to the 15N2O : 15N2
ratio).
177
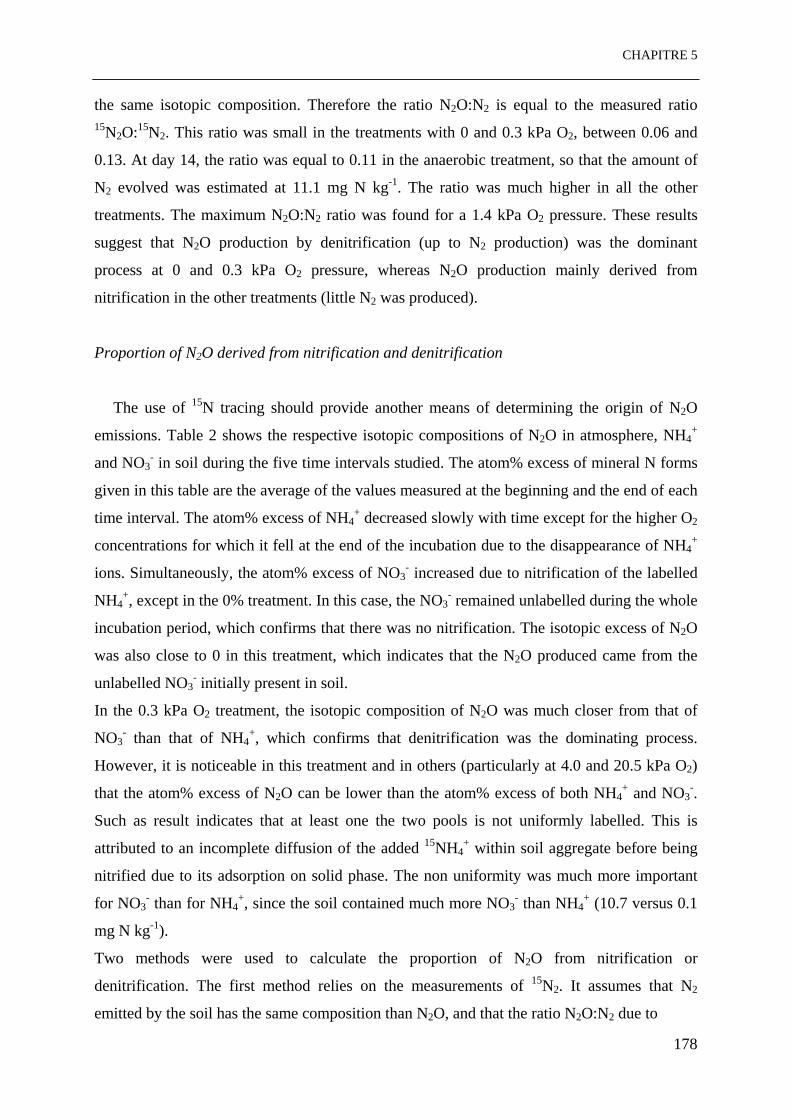
CHAPITRE 5
the same isotopic composition. Therefore the ratio N2O:N2 is equal to the measured ratio 15N2O:15N2. This ratio was small in the treatments with 0 and 0.3 kPa O2, between 0.06 and
0.13. At day 14, the ratio was equal to 0.11 in the anaerobic treatment, so that the amount of
N2 evolved was estimated at 11.1 mg N kg-1. The ratio was much higher in all the other
treatments. The maximum N2O:N2 ratio was found for a 1.4 kPa O2 pressure. These results
suggest that N2O production by denitrification (up to N2 production) was the dominant
process at 0 and 0.3 kPa O2 pressure, whereas N2O production mainly derived from
nitrification in the other treatments (little N2 was produced).
Proportion of N2O derived from nitrification and denitrification
The use of 15N tracing should provide another means of determining the origin of N2O
emissions. Table 2 shows the respective isotopic compositions of N2O in atmosphere, NH4+
and NO3- in soil during the five time intervals studied. The atom% excess of mineral N forms
given in this table are the average of the values measured at the beginning and the end of each
time interval. The atom% excess of NH4+ decreased slowly with time except for the higher O2
concentrations for which it fell at the end of the incubation due to the disappearance of NH4+
ions. Simultaneously, the atom% excess of NO3- increased due to nitrification of the labelled
NH4+, except in the 0% treatment. In this case, the NO3
- remained unlabelled during the whole
incubation period, which confirms that there was no nitrification. The isotopic excess of N2O
was also close to 0 in this treatment, which indicates that the N2O produced came from the
unlabelled NO3- initially present in soil.
In the 0.3 kPa O2 treatment, the isotopic composition of N2O was much closer from that of
NO3- than that of NH4
+, which confirms that denitrification was the dominating process.
However, it is noticeable in this treatment and in others (particularly at 4.0 and 20.5 kPa O2)
that the atom% excess of N2O can be lower than the atom% excess of both NH4+ and NO3
-.
Such as result indicates that at least one the two pools is not uniformly labelled. This is
attributed to an incomplete diffusion of the added 15NH4+ within soil aggregate before being
nitrified due to its adsorption on solid phase. The non uniformity was much more important
for NO3- than for NH4
+, since the soil contained much more NO3- than NH4
+ (10.7 versus 0.1
mg N kg-1).
Two methods were used to calculate the proportion of N2O from nitrification or
denitrification. The first method relies on the measurements of 15N2. It assumes that N2
emitted by the soil has the same composition than N2O, and that the ratio N2O:N2 due to
178
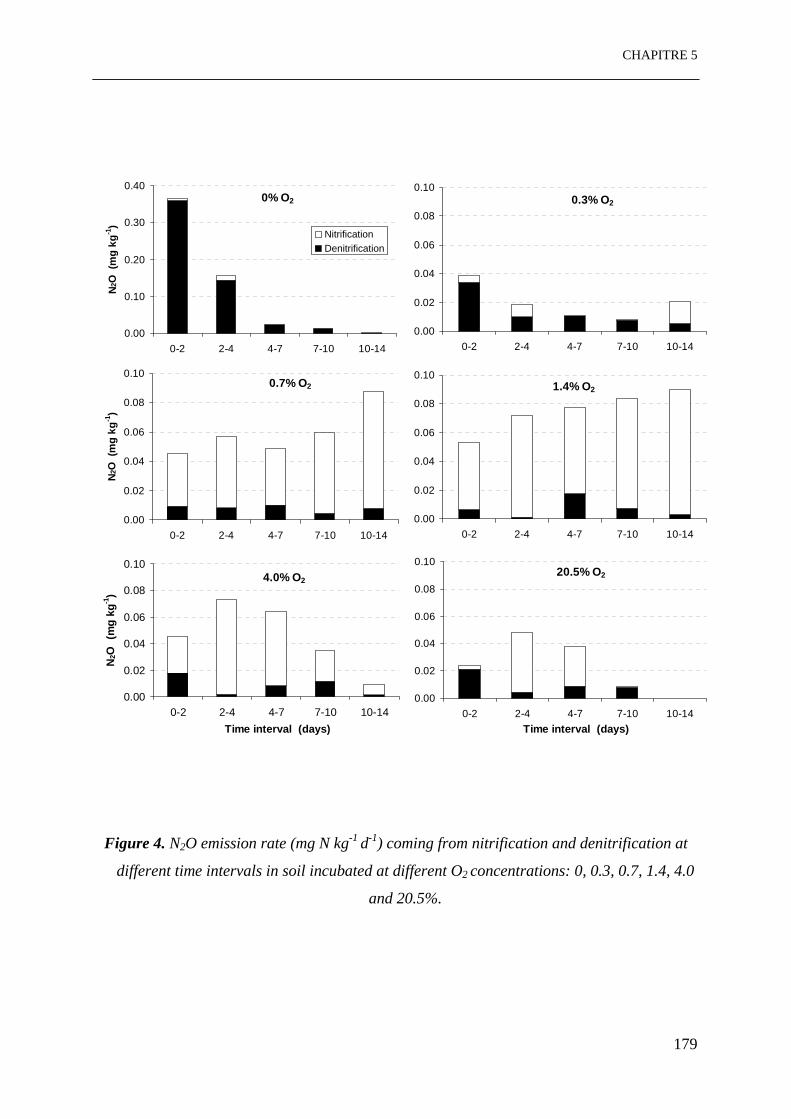
CHAPITRE 5
0.00
0.10
0.20
0.30
0.40
0-2 2-4 4-7 7-10 10-14
N 2O
(m
g kg
-1)
NitrificationDenitrification
0% O2
0.00
0.02
0.04
0.06
0.08
0.10
0-2 2-4 4-7 7-10 10-14
0.3% O2
0.00
0.02
0.04
0.06
0.08
0.10
0-2 2-4 4-7 7-10 10-14
N 2O
(m
g kg
-1)
0.7% O2
0.00
0.02
0.04
0.06
0.08
0.10
0-2 2-4 4-7 7-10 10-14
1.4% O2
0.00
0.02
0.04
0.06
0.08
0.10
0-2 2-4 4-7 7-10 10-14Time interval (days)
N2O
(m
g kg
-1)
4.0% O2
0.00
0.02
0.04
0.06
0.08
0.10
0-2 2-4 4-7 7-10 10-14Time interval (days)
20.5% O2
Figure 4. N2O emission rate (mg N kg-1 d-1) coming from nitrification and denitrification at
different time intervals in soil incubated at different O2 concentrations: 0, 0.3, 0.7, 1.4, 4.0
and 20.5%.
179

CHAPITRE 5
0
30
60
90
120
0 2 4 6 8 10 12 1
N ni
trifi
ed (m
g kg
-1)
0%0.3%0.7%1.4%4%20%
a
4
0
5
10
15
20
25
0 2 4 6 8 10 12 1
Time (days)
O2 c
onsu
mpt
ion
(mm
ol k
g-1) b
4
Figure 5. Kinetics of nitrification and O2 consumption in soil incubated at different O2
concentrations: 0, 0.3, 0.7, 1.4, 4.0 and 20.5%. a) cumulative nitrification (mg N kg-1)
calculated with FLUAZ model; b) cumulative O2 consumption (mmol O2 kg-1) measured.
Nitrification rate is defined as ( )4
3 ai nn + , where ni is the NH4+ oxidation rate and na is the
NO2- oxidation rate (see text). Vertical bars are the standard deviations.
180

CHAPITRE 5
denitrification is constant. We estimated its value in the treatment 0% O2 at 0.12 (see Fig. 7a).
The second method relies on measurements of isotopic excess of N2O, NH4+ and NO3
-. It
assumes that N2O is derived from 2 pools, one being labelled (with the composition of NH4+),
the other pool being unlabelled. It calculates the N2O isotopic abundance versus the
abundance of each pool and their respective contribution to N2O production. The comparison
between this calculated value and the measured N2O isotopic excess enables to estimate the
proportion of N2O emitted from the labelled pool, i.e. by nitrification. The detail of both
methods is given in the appendix.
Although method 1 was based on more questionable assumptions than method 2, the two
methods gave similar estimates of the proportion of N2O emitted from nitrification, since the
regression equation between the two estimates was y = 0.99x and the coefficient of
determination was r2 = 0.85 (n=30). We then took the average of the two estimates. Using
these values, the amounts of N2O emitted by nitrification and denitrification were calculated
for each treatment (Fig.4). As expected, denitrification was the unique process responsible for
N2O production in anoxic conditions (0% O2), it ceased towards the end of the incubation due
to the absence of NO3-. At 0.3 kPa O2, denitrification remained the major process producing
N2O, except at the end of experiment when emissions by nitrification increased. For samples
with 0.7 and 1.4 kPa O2, the proportion of N2O by nitrification was more important than
denitrification at all measurement intervals. Maximum N2O production by nitrification was
obtained for the 1.4 kPa O2 pressure. The emissions by nitrification decreased when O2
concentration increased from 4.0 to 20.5 kPa O2, particularly after day 7, corresponding to the
end of the nitrification process. However, emissions by denitrification took place during the
first two days, even with the higher O2 concentrations (4.0 and 20.5 kPa).
Relationship between O2 consumption and nitrification rate
The cumulative nitrification and O2 consumption rates are shown in Fig. 5. The oxygen
consumption and nitrification rates were favoured by O2 availability during the whole
incubation period; the pattern of curves for both variables was very similar. Indeed we found
a very good correlation between O2 consumption rates and nitrification rates in the 5
treatments with oxygen (0.3, 0.7, 1.4, 4.0 and 20.5 kPa O2): r2 = 0.94, n = 25 (Fig. 6). The
slope of the regression is 1.95 ± 0.11. It is not significantly different from 2, which is the
theoretical value for O2 consumption due to nitrification (see eq. 1-2), nitrification being
calculated according to eq. (4). The O2 consumption was the sum of the O2 consumption by
181

CHAPITRE 5
y = 1.95x + 0.19R2 = 0.94
0.0
0.5
1.0
1.5
2.0
2.5
0.0 0.2 0.4 0.6 0.8 1.0 1.2Nitrification rate (mmol kg-1 d-1)
O2 c
onsu
mpt
ion
rate
(mm
ol k
g-1 d-1
)
Figure 6. Relationship between O2 consumption rates (mmol kg-1 d-1) and nitrification rates
(mmol kg-1 d-1) measured for the different time intervals and different O2 treatments.
Nitrification rate is defined as ( )4
3 ai nn + , where ni is the NH4+ oxidation rate and na is the
NO2- oxidation rate (see text).
182
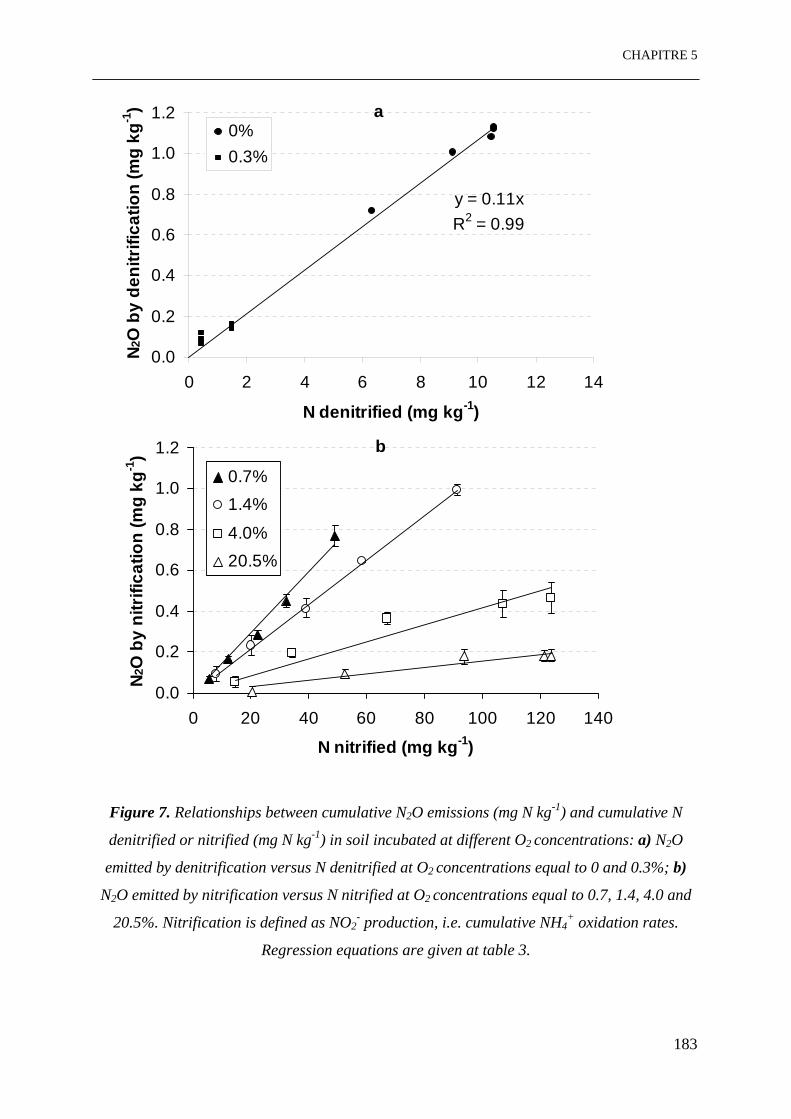
CHAPITRE 5
y = 0.11xR2 = 0.99
0.0
0.2
0.4
0.6
0.8
1.0
1.2
0 2 4 6 8 10 12 1
N denitrified (mg kg-1)
N 2O
by
deni
trifi
catio
n (m
g kg
-1)
0%0.3%
a
4
0.0
0.2
0.4
0.6
0.8
1.0
1.2
0 20 40 60 80 100 120 140
N nitrified (mg kg-1)
N 2O
by
nitr
ifica
tion
(mg
kg-1
)
0.7%1.4%
4.0%20.5%
b
Figure 7. Relationships between cumulative N2O emissions (mg N kg-1) and cumulative N
denitrified or nitrified (mg N kg-1) in soil incubated at different O2 concentrations: a) N2O
emitted by denitrification versus N denitrified at O2 concentrations equal to 0 and 0.3%; b)
N2O emitted by nitrification versus N nitrified at O2 concentrations equal to 0.7, 1.4, 4.0 and
20.5%. Nitrification is defined as NO2- production, i.e. cumulative NH4
+ oxidation rates.
Regression equations are given at table 3.
183

CHAPITRE 5
nitrification and respiration. The intercept of the regression line was 0.19 ± 0.06 mmol kg-1 d-
1. This value represents the O2 consumption in absence of nitrification, due to respiration. We
can assume that the respiration of treatments with nitrification is the same. The consumption
of oxygen was then mainly due to nitrification, even in the 0.3 kPa O2 treatment with a low
nitrification rate.
Relationship between N2O emissions and nitrification/denitrification rates
The amounts of N2O produced were then compared to the amounts of N nitrified or
denitrified, previously calculated with FLUAZ (Table 3). In the 0 and 0.3 kPa O2 treatments,
the amounts of N2O emitted by denitrification were highly correlated with N denitrified (Fig.
7a). The coefficient of determination was equal to 0.99 and the slope equal to 0.11. This
slope, which represents the ratio N2O:(N2O+N2), was in good agreement both with the
estimate previously made with 15N2 measurements (N2O:N2 = 0.11) and with other estimates
made with C2H2 inhibition in the same soil: N2O:(N2O+N2) = 0.13 (Khalil et al., 2003a).
In the 0.7, 1.4, 4.0 and 20.5 kPa O2 treatments, the amounts of N2O emitted by nitrification
were highly correlated with N nitrified (Fig. 7b). We obtained specific regression lines for
each O2 concentration. The slopes, intercepts and correlation coefficients are given at Table 4.
Results show that the intercept was not significantly different from 0, when we consider the
N2O emitted by nitrification alone. The slope markedly increased when O2 availability
decreased: the proportion of nitrified N evolved as N2O varied from 0.16% to 1.48% when O2
pressure fell from 20.5 to 0.7 kPa. If we consider the total N2O emission, the proportion
varied from 0.24% to 1.80%.
The total N2O emissions measured during each time interval were also compared with the
NO2- concentrations found in soil at the end of each interval. The relationship was highly
dependent on O2 concentration (Fig.8). Linear relationships were found at 20.5 and 4.0 kPa
O2 pressure, but not at lower O2 pressures. No significant correlation was found when we
considered NO2- concentrations present in soil at the beginning of each time interval. This
indicates that NO2- was not a single determinant of N2O emissions by nitrification.
184

CHAPITRE 5
Total N2O N2O by nitrification O2 concentration Slope Intercept r2 Slope Intercept r2
% mg kg-1 % mg kg-1
0.7% 1.80 -0.02 0.994 1.48 0.00 0.983
1.4% 1.20 0.01 0.999 1.09 0.00 0.999
4.0% 0.43 0.07 0.951 0.42 0.00 0.892
20.5% 0.24 0.01 0.979 0.16 0.00 0.915
Table 4. Linear regression parameters of cumulative N2O production (mg N kg-1) versus
cumulative nitrification (mg N kg-1). Total N2O is the measured N2O emission whereas N2O
'by nitrification' is calculated (using coefficients α and β, see text). Nitrification is defined as
NO2- production, i.e. cumulative NH4
+ oxidation rates.
185

CHAPITRE 5
0.00
0.02
0.04
0.06
0.08
0.10
0.12
0 2 4 6 8 10 12 14 16
NO2--N (mg kg-1)
N 2O
(mg
kg-1
d-1)
0.3%0.7%1.4%4%20.5%
Figure 8. Relationship between total N2O emissions rates (mg N kg-1 d-1) and NO2-
concentrations (mg N kg-1) measured in soil at the end of each time interval, at different O2
concentrations: 0.3, 0.7, 1.4, 4.0 and 20.5%.
186

CHAPITRE 5
pH evolution
The mean pH value at the beginning of incubation was 8.04 ± 0.03. At day 14, the pH had
increased in soil incubated at 0% O2, but had decreased at other O2 concentrations. The pH
decrease was greater for the highest O2 pressure, except for the 20.5 kPa. The aerobic
conditions favoured nitrification and consequently pH decrease, whereas at 0% O2, pH had
increased because there was only denitrification.
In the 20.5 kPa O2 treatment, the nitrification was over at day 14 and the higher pH is
attributed to a pH re-equilibration in soil (due to the carbonates equilibrium).
7.3
7.5
7.7
7.9
8.1
8.3
t=0 0% 0.3% 0.7% 1.4% 4% 20%
pH
Figure 9: Soil pH measured at the beginning (t = 0) and at the end of the incubation (t = 14
days) in soils incubated at various O2 concentrations: 0, 0.3, 0.7, 1.4, 4.0 and 20.5%.
187

CHAPITRE 5
DISCUSSION
Methodology of quantification and calculation
One important condition required for a successful application of isotope methods to
quantify N transformations is that the added inorganic 15N becomes homogeneously mixed
with the native, unlabelled inorganic N in soil (Davidson et al., 1991). The comparison of the
isotope composition of NH4+, NO3
- and N2O (Table 3) suggests that this condition was not
fulfilled in our experiment. The reason for that explanation is that the added 15NH4+ did not
diffuse rapidly within soil aggregates due to its high adsorption capacity. The 15NO3-
produced by nitrification was then unevenly distributed soon after its production. Stevens et
al. (1997), using a similar 15N application procedure, found that the NO3- pool was rather
uniform, enough to perform calculations of the contribution of nitrification and denitrification
to N2O emission, using an isotope dilution equation. The difference with our experiment is
that these authors used urea instead of NH4+ which probably diffused within soil aggregates
before being hydrolysed into NH4+. The lack of uniformity in our experiment has different
consequences: a) it should not affect the validity of nitrification estimates (using FLUAZ),
because nitrification must have occurred in the soil zone where all the added 15NH4+ was
present. In this zone, the NH4+ and NO3
- can be considered as uniformly labelled. Davidson et
al. (1991) have shown that an heterogeneous distribution of tracer in soil may have little
effect on the rate estimates. The validity of our estimates of nitrification rates is also
confirmed by the linear relationship with the O2 consumption rate, the slope of which is equal
to the theoretical value (Fig. 6).
b) it affected the calculation of the proportion of N2O derived from nitrification, since the
application of the isotope dilution equation was not possible. We proposed another method of
calculation which accounts for two origins of N2O, one being derived from labelled NH4+ and
the other from unlabelled NO3-. The first origin is attributed to nitrification and the second
one to denitrification. Although this assumption may be discussed, this calculation provided
results which were in good agreement with a second independent method, based on the
measured ratio 15N2O:15N2. This agreement gives confidence in our conclusions.
188
CHAPITRE 5
Denitrification in well aerated aggregates
Both methods also indicated that denitrification occurred even at atmospheric O2 pressure.
This result is surprising since the moisture content was chosen (at 0.21 g g-1 soil) to obtain
unsaturated aggregates, considering the shrinking-swelling curve previously established on
that soil (Sillon, 1999). The explanation may come from the technique of adding solution to
soil aggregates using pipette which does not deliver the same volume of solution to each
aggregate. Some of the aggregates must have been saturated after this addition. Anoxic
conditions can occur if their radius is greater than a critical value (Renault and Stengel, 1994).
The critical radius was calculated using O2 consumption rate and O2 concentration in the
atmosphere; it varied from 1.0 mm in the treatment 0.3 kPa O2 to 3.5 mm in the treatment
20.5 kPa O2. Therefore denitrification was possible in some of the 3 mm size aggregates.
Effect of O2 availability on nitrification and N2O production
Our results show that O2 availability had a large influence on the nitrification. Nitrification
rates were reduced by a factor of 6-9 when O2 pressure decreased from 20.5 to 0.3 kPa. Only
few results on O2 effect have been reported in soils. Our results are close to those obtained by
Goreau et al. (1980) for pure cultures of Nitrosomonas europea. These authors found that
nitrification rate was reduced by a 7 fold factor when O2 was reduced from 20 to 0.5 kPa.
Our results also allow to estimate the Michaelis constant of NH4+ oxidation relative to O2
pressure. At the beginning of the experiment, NH4+ concentrations were much higher than the
Michaelis constant for NH4+ which is about 1 mol m-3 (Laanbroek and Gerards, 1993),
corresponding to3.0 mg N kg-1. The nitrification rates versus O2 concentration were fitted to
Michaelis-Menten kinetics to obtain Vmax and Km at 3 time intervals (0-2, 2-4 and 4-7 days).
We obtain Km = 2.5 ± 0.6 kPa O2, or 1.1 ± 0.3 mol O2 m-3 air. This value is much greater than
those reported by Laanbroek and Gerards (1993) for Nitrosomonas europea grown in
continuous cultures : 1.3-15 mmol m-3. The value of Vmax increased with time, from 0.8 to 1.3
mmol kg-1 d-1 at 20°C, due to the growth of nitrifiers in soil.
Oxygen concentration exerted also a marked effect on N2O production. We found that
the yield of N2O emission by nitrification, i.e. the amount of N2O-N emitted per unit of NH4
oxidised, increased rapidly when O2 pressure decreased. The yield varied from 0.16% to
1.48% when O2 pressure fell from 20.5 to 0.7 kPa. The maximum yield was obtained at 0.7
189
CHAPITRE 5
kPa but we had not enough accuracy to make calculations at 0.3 kPa O2 pressure. Anderson et
al. (1993) found that the optimum O2 pressure for N2O production in pure culture was 0.3 kPa
O2 for Nitrosomonas europea and 2-4 kPa for the heterotrophic nitrifier Alcaligenes faecalis.
They obtained a yield of 1% at 5 kPa O2 (in our study 0.42% at 4.0 kPa). Goreau et al. (1980)
reported that N2O production by Nitrosomonas europea in pure culture increased by 3-4 times
when O2 pressure fell from 20 to 1 kPa. They measured higher yields than ours: 0.3%, 0.9%,
3% and 8% at 20, 5, 1 and 0.5 kPa O2 pressure, respectively. However they measured yields
in isolates of Nitrosomonas, Nitrosolobus and Nitrosospira from soils which were similar to
ours at 21 kPa O2: 0.47%, 0.09% and 0.11%, respectively. Bollmann and Conrad (1998),
working on soils, found that the maximum N2O emission by nitrification occurred at 0.5 kPa
pO2. Using the results published by Stevens et al. (1997), we could calculate a yield similar
to ours at atmospheric pressure: 0.18 ± 0.01%, independent of the water content (40, 50 and
60% WHC). A large variability in yield has been reported at 20 kPa O2: 0.03-1% (Garrido et
al., 2001), 0.5-2% (Bolle, 1986), 0.09-0.28% (Breitenbeck et al., 1980) and 0.02% (Tortoso
and Hutchinson, 1990).
The origin of N2O emitted by nitrification is still on debate. Ritchie and Nicholas (1972)
suggested that NH4+ oxidisers reduced NO2
- to N2O to minimize intracellular accumulation of
NO2- which is toxic. Remde and Conrad (1990) showed that N2O could derive from nitrite
produced inside the cells. Poth and Focht (1985) confirmed this hypothesis for N. europea
cultivated in pure culture at various O2 pressures and called it denitrification of nitrite, the
nitrite being the terminal electron acceptor. They indicated that O2 was required in NH4+
oxidising bacteria only for the first oxidation step: oxidation of NH4+ into hydroxylamine by
mono-oxigenase.
190

CHAPITRE 5
Appendix
Let α be the proportion of N2O derived from nitrification and (1-α) the proportion derived
from denitrification. Two methods can be used to calculate this proportion:
Method 1: use of the ratio 15N2O:15N2
Three hypotheses are made:
H1) the ratio N2O:N2 due to denitrification process remains constant with time and treatments;
H2) N2O and N2 emitted by denitrification have the same origin and isotope composition, so
that the ratio N2O:N2 is equal to the ratio 15N2O:15N2;
H3) no N2 is produced during nitrification.
Let Q be the total amount of 15N2O produced (mg N kg-1)
Let D be the total amount of 15N2 produced (mg N kg-1)
Let QD be the amount of 15N2O produced by denitrification (mg N kg-1)
Let RD be the ratio 15N2O: 15N2 associated to denitrification
Let R be the overall ratio 15N2O: 15N2 measured
DQR D
D = (hypothesis H3) A1.1
( )D
QRDα−
=1 (hypothesis H2) A1.2
DQR = A1.3
( )α−= 1RRD (hypothesis H1) A1.4
so that:
RRD−=1α A1.5
191

CHAPITRE 5
Method 2: use of the isotope composition of 15N2O
This method assumes that the N2O produced has two origins: it is derived from two
populations, each having a specific isotopic composition. N2O signal is measured at mass 44
(14N14N16O) and mass 45 (14N15N16O).
Population Proportion Atom%
abundance
14N isotope
frequency
15N isotope
frequency
Isotope ratio
P1 α A1 a1 b1=1-a1 R1
P2 1-α A2 a2 b2=1-a2 R2
P1+P2 1 A R
Isotope ratio of population 1:
1
11
2ab
R = A2.1
Isotope ratio of population 2:
2
22
2ab
R = A2.2
Mass 44 of the mixture:
A2.3 ( αα −+= 122
2144 aaM )
)Mass 45 of the mixture:
A2.4 ( αα −+= 122 221145 babaM
Isotope ratio of the mixture:
( )
( )αααα
−+−+
==1
12222
21
2211
44
45
aababa
MM
R A2.5
Equations A2.1 and A2.2 yield:
11 2
2R
a+
= A2.6
22 2
2R
a+
= A2.7
1
11 2 R
Rb+
= A2.8
192
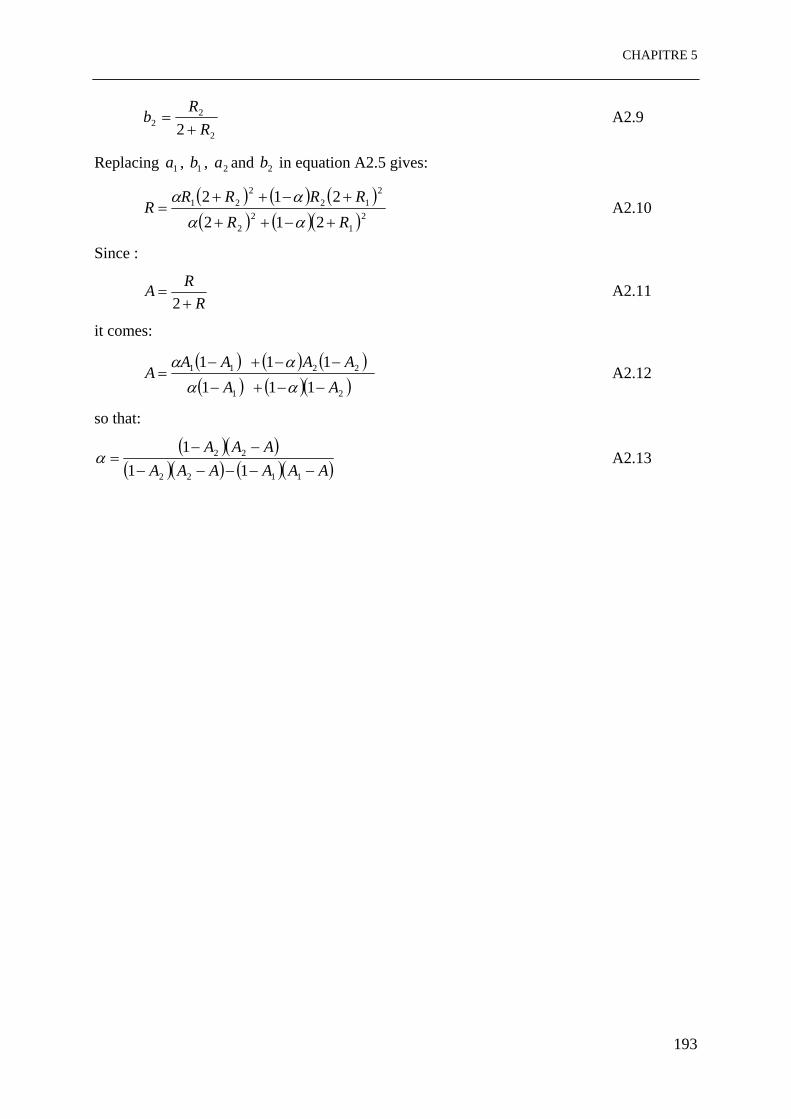
CHAPITRE 5
2
22 2 R
Rb+
= A2.9
Replacing , , and in equation A2.5 gives: 1a 1b 2a 2b
( ) ( ) ( )( ) ( )( )2
12
2
212
221
212212RR
RRRRR
+−++
+−++=
αααα
A2.10
Since :
RRA+
=2
A2.11
it comes:
( ) ( ) (( ) ( )( )
)21
2211
111111AA
AAAAA
−−+−
−−+−=
αααα
A2.12
so that:
( )( )( )( ) ( )( )AAAAAA
AAA−−−−−
−−=
1122
22
111
α A2.13
193

CHAPITRE 5
ACKNOWLEDGEMENTS
This work was supported by the French programs PNSE and GESSOL, the Region
Picardie and the Institut National de la Recherche Agronomique. We thank O. Delfosse and
G. Alavoine for their help in measurements. We are grateful to Miss A.M. Wall of the
Translation Unit, INRA, for reviewing the English version of the manuscript.
194
CHAPITRE 5
REFERENCES
1. Abbasi M. K., Adams, W. A., 1998. Loss of nitrogen in compacted grassland soil by
simultaneous nitrification and denitrification. Plant & Soil 200, 265-277.
2. Anderson I. C., Poth M., Homstead J., Burdige D., 1993. A comparison of NO and N2O
production by the autotrophic nitrifier Nitrosomonas europaea and the heterotrophic
nitrifier Alcaligenes faecalis. Applied and Environmental Microbiology, 3525-3533.
3. Blackmer A. M., Bremner J. M., Schmidt E. L. 1980. Production of nitrous oxide by
ammonia oxidizing chemoautotrophic microorganisms in soil. Applied and Environmental
Microbiology 40, 1060-1066.
4. Bolle H. J., Seiler W., Bolin B. 1986. Other greenhouse gases and aerosols. In: Bolin B.,
Jager J., Warrick R. A. and Doos B.R. (eds.). The greenhouse effect, climatic change and
ecosystems. John Wiley and Sons, New York, pp. 157-203.
5. Bollmann A., Conrad R. 1998. Influence of O2 availability on NO and N2O release by
nitrification and denitrification in soils. Global Change Biology 4, 387-396.
6. Breitenbeck G. A., Blackmer A. M., Bremner,J. M. 1980. Effects of different nitrogen
fertilizers on emission of nitrous oxide from soil. Geophysical Research Letters 7, 85-88.
7. Bremner J. M., Blackmer A. M. 1981. Terrestrial nitrification as a source of atmospheric
nitrous oxide. In: Delwiche C. C. (ed.). Denitrification, nitrification and atmospheric
nitrous oxide. John Wiley & Sons, Inc., New York pp. 151-170.
8. Brooks P. D., Stark J. M., McInteer B. B. and Preston T. (1989) Diffusion method to
prepare soil extracts for automated nitrogen-15 analysis. Soil Science Society of America
Journal 53, 1707-1711.
9. Conrad R. 1996. Soil microorganisms as controllers of atmospheric trace gases (H2, CO,
CH4, OCS, N2O and NO). Microbiology Review 60, 609-640.
10. Davidson E.A., Hart S. C., Shanks C. A., Firestone M. K., 1991. Measuring gross nitrogen
mineralization, immobilization and nitrification by 15N isotopic pool dilution in intact soil
cores. Journal of Soil Science 42, 335-349.
11. Davidson E. A. 1993. Soil water content and the ratio of nitrous oxide to nitric oxide
emitted from soil. In: Uremland R.S. (ed.). Biogeochemistry of global change. Chapman
and Hall, New York, pp. 369-386.
195

CHAPITRE 5
12. Garrido F., Hénault C., Gaillard H., Pérez S., Germon J. C. 2001. N2O and NO emissions
by agricultural soils with low hydraulic potentials. Soil Biology and Biochemistry 34, 559-
575.
13. Goreau T. J., Kaplan W. A., Wofsy S. C., McElroy M. B., Valois F. W., Watson S. W.,
1980. Production of NO2- and N2O by nitrifying bacteria at reduced concentrations of
oxygen. Applied and Environmental Microbiology 40, 526-532.
14. Grant R. F., 1995. Mathematical modelling of nitrous oxide evolution during nitrification.
Soil Biology and Biochemistry 27, 1117-1125.
15. Groffman P.M., 1991. Ecology of nitrification and denitrification in soil evaluated at
scales relevant to atmospheric chemistry. In: Rogers J.E., Whitman W.B. (eds.). Microbial
production and consumption of greenhouse gases: methane, nitrogen oxides and
halomethanes. American Society for Microbiology, Washington D.C, pp. 201-217.
16. Hénault C., Germon J.C., 1995. Quantification de la dénitrification et des émissions de
protoxyde d'azote (N2O) par les sols. Agronomie 15, 321-355.
17. I.P.C.C., 1996. In: Climate change 1995: the science of climate change. Contribution of
working group I to the second assessment report of the intergovernmental panel on
climate change. (eds Houghton, J.T., Meira Filho, L.G., Callander, B.A., Harris, N.,
Kattenberg, A., Maskell K.). Cambridge University Press, Cambridge.
18. Kamphake L.J., Hannah, S.A., Cohen, J.M., 1967. Automated analysis for nitrate by
hydrazine reduction. Water Research 1, 205-216.
19. Khalil K., Renault P., Mary B., Guérin N, 2003a. Modelling Denitrification including the
Dynamics of Denitrifiers and their Progressing Ability to Reduce Nitrous Oxide:
Comparison with Batch Experiments. Submitted in European Journal of Soil Science.
20. Krom M.D., 1980. Spectrometric determination of ammonia: a study of a modified
Berthelot reaction using salycilate and dichloroisocyanurate. The analyst 105, 305-316.
21. Laanbroek H. J., Gerards S., 1993. Competition for limiting amounts of oxygen between
Nitrosomonas europaea and Nitrobacter winogradskyi grown in mixed continuous
cultures. Arch. Microbiol. 159, 453-459.
22. Linn D. M., Doran J. W., 1984. Effect of water-filled pore space on carbon dioxide and
nitrous oxide production in tilled and non-tilled soils. Soil Science Society of America
Journal 48, 1267-1272.
23. Mary B., Recous S., Robin D., 1998. A model for calculating nitrogen fluxes in soil using 15N tracing. Soil Biology and Biochemistry 30, 1963-1979.
196

CHAPITRE 5
24. Nielsen T. H., Nielsen L. P., Revsbech N. P,. 1996. Nitrification and coupled nitrification-
denitrification associated with a soil-manure interface. Soil Science Society of America
Journal 60, 1829-1840.
25. Parton W. J., Mosier A. R., Ojima D. S., Valentine D. W., Schimel D. S., Weier K.,
Kulmala A. E., 1996. Generalized model for N2 and N2O production from nitrification and
denitrification. Global Biogeochemical Cycles, 10, 401-412.
26. Poth M., Focht D. D., 1985. 15N kinetic analysis of N2O production by Nitrosomonas
europaea: an examination of nitrifier denitrification. Applied and Environmental
Microbiology, 1134-1141.
27. Remde A., Conrad R., 1990. Production of nitric oxide in Nitrosomonas europaea by
reduction of nitrite. Arch. Microbiol. 154, 187-191.
28. Renault P., Stengel P., 1994. Modeling oxygen diffusion in aggregated soils. I.
Anaerobiosis inside the aggregates. Soil Science Society of America Journal 58,1017-
1023.
29. Richard G., Boizard H., Roger-Estrade J., Boiffin J., Guérif J., 1999. Study of soil
compaction due to traffic in field conditions: pore space and morphological analysis. Soil
and Tillage Research 51, 151-160.
30. Ritchie G. A. F., Nicholas D. J. D., 1972. Identification of the sources of nitrous oxide
produced by oxidative and reductive processes in Nitrosomonas europaea. Biochemistry
Journal 126, 1181-1191.
31. Sillon J. F., 1999. Etude expérimentale et modélisation des effets de la structure de la
couche labourée sur le régime hydrique du sol nu en phase de dessèchement: Application
à la prévision des jours disponibles. Thesis of Institut National Agronomique Paris-
Grignon, 222 p.
32. Smith K. A., 1990. Greenhouse gas fluxes between land surfaces and the atmosphere.
Prog. Phys. Geograph. 14, 349-372.
33. Stevens R. J., Laughlin R. J., Burns L. C., Arah J. R. M.., Hood R. C., 1997. Measuring
the contributions of nitrification and denitrification to the flux of nitrous oxide from soil.
Soil Biology and Biochemistry 29, 139-151.
34. Stevens R. J., Laughlin R. J., 1998. Measurement of nitrous oxide and di-nitrogen
emissions from agricultural soils. Nutrient Cycling in Agroecosystems, 52, 131-139.
35. Tortoso A. C., Hutchinson G. L., 1990. Contributions of autotrophic and heterotrophic
nitrifiers to soil NO and N2O emissions. Applied and Environmental Microbiology 56,
1799-1805.
197

CHAPITRE 5
36. Tiedje J.M., 1988. Ecology of denitrification and dissimilatory nitrate reduction to
ammonium. In: Zehnder A.J.B. (ed.). Biology of anaerobic microorganisms. John Wiley
and Sons, New York, pp. 179-244.
37. Wood P. M., 1986. Nitrification as a bacterial energy source. In: Prosser, J. I., (Ed.),
Nitrification, IRL, Press, Oxford, pp. 39-62.
38. Zanner C. W., Bloom P. R., 1995. Mineralization, nitrification and denitrification in
histosols of northern Minnesota. Soil Science Society of America Journal 59, 150559,
1505-1511.
198

SYNTHESE DES RESULTATS
199
Synthèse des résultats
L’objectif de notre travail était d’étudier les émissions de N2O par nitrification et
dénitrification en relation avec la structure du sol (à l'échelle centimétrique), l’aération et les
activités microbiennes. Nous avons choisi de travailler sur un seul type de sol, mais dont la
structure était fortement différenciée en raison des opérations de travail du sol (Richard et al.,
1999). Cette différenciation a conduit à des proportions différentes de mottes compactes sans
porosité visible à l'œil (mottes ∆) et de mottes fragmentaires à porosité visible (mottes Γ) sur
lesquelles nous avons travaillé. Nous avons:
1) caractérisé les processus microbiens à l'origine de la production et de la
consommation de N2O par dénitrification,
2) évalué les émissions de N2O par dénitrification sur des mottes soumises à 2 niveaux
d'activités microbiennes (respiratoire aérobie et dénitrifiante) obtenus par une pré-incubation
ou non des mottes en anaérobiose,
3) caractérisé la structure des mottes et modélisé son effet sur le volume anoxique et sur
les émissions de N2O par dénitrification, avec ou sans pré-incubation anaérobie,
4) décrit les effets de la concentration en NH4+ et en O2 sur les vitesses de nitrification
et d'émission de N2O par nitrification.
I. Synthèse des principaux acquis
I.1. Fonctionnement dénitrifiant en condition anaérobie
Une majorité de travaux sur les émissions de N2O ont porté sur la dénitrification
considérée comme la principale source de ce gaz. En fait, la production nette de N2O est le
bilan entre la production brute et la consommation de N2O. Certains travaux ne considèrent
que la production nette de N2O et ne prennent pas en compte les interactions possibles entre
production et consommation qui ont été mises en évidence. D'autres études quantifient
simultanément production brute et production nette (notamment en présence ou absence de
C2H2), mais peu d'entre elles ont permis de caractériser finement les 2 processus. Dans ce
travail, nous avons développé une méthode combinant des mesures sur des boues de sol
incubées en anaérobiose à un modèle de simulation des réductions microbiennes de NO3- et
N2O dans le sol (chapitre 2). Le modèle simule la réduction de NO3- en N2O et de N2O en N2
par des cinétiques Michaelis Menten, avec prise en compte d'une compétition non
200

Synthèse des résultats
enzymatique entre NO3
- et N2O comme accepteurs d'électrons terminaux, et simule la
dynamique de 2 groupes microbiens l'un étant capable de réduire N2O en N2, l'autre non.
Trois hypothèses ont été évaluées alternativement :
- hypothèse 1 : les deux populations microbiennes (NO3 réductase et N2O réductase) se
développent indépendamment, sans accroissement de la capacité à réduire N2O. Avec
cette hypothèse, le modèle s'avère incapable de reproduire les données expérimentales.
Ceci suggère que certains dénitrifiants initialement incapables de réduire N2O en N2
deviennent capables de réaliser cette réduction ;
- hypothèse 2 ou 3 : elle simule cette adaptation, en considérant soit une synthèse
progressive et simultanée pour tous les dénitrifiants de la N2O réductase (hypothèse 2),
soit une synthèse brutale de l'enzyme pour certains dénitrifiants, ces derniers
n'acquérant pas tous ensemble la capacité à réduire N2O (hypothèse 3). Ces deux
hypothèses permettent de beaucoup mieux décrire les données expérimentales, bien
que des biais subsistent. La biomasse microbienne estimée en ajustant les données
simulées aux données expérimentales est en bon accord avec la biomasse mesurée.
L'acquisition de la capacité à réduire N2O en N2 sur des durées de 2 à 5 jours (à 20°C) est un
résultat cohérent avec d'autres résultats publiés sur la synthèse de la N2O réductase. Ce
processus entraîne donc une diminution du rapport N2O/(N2O+N2) au cours du temps.
Cependant, le rapport peut être considéré comme stable avant la période d'induction. Nous
l'avons estimé à 12% dans nos conditions expérimentales (anaérobiose totale).
L'une des causes possibles des écarts entre modèle et expérience est la validité de
l'hypothèse faite dans le modèle, à savoir que le flux d'électrons traversant les chaînes
respiratoires microbiennes est constant tant que les accepteurs terminaux d'électrons (NO3-
et/ou N2O) ne sont pas limitants et qu'il est indépendant de la nature de ces accepteurs. Il
faudrait évaluer la validité de cette hypothèse, ou tester une hypothèse alternative avec le
modèle.
I.2. Anoxie, respiration et dénitrification
L'anoxie dans le sol dépend simultanément de la consommation en O2 des micro-
organismes et des possibilités de transfert d'O2, celles-ci étant affectées par la structure du sol,
par sa teneur en eau et les propriétés de diffusion de l'oxygène au sein des zones saturées et
des pores libres à l'air du sol. Afin de caractériser la consommation en O2 du sol et sa
201

Synthèse des résultats
dépendance aux concentrations en O2 et en CO2, nous avons repris la méthode proposée par
Renault et Stengel (1994).
Nous avons analysé les émissions de N2O produites au cours d'une incubation aérobie par
des mottes de sol ayant 2 niveaux d'activités microbiennes (respiratoire aérobie et
dénitrifiante), obtenus par incubation préalable ou non de mottes en anaérobiose (6 jours). La
pré-incubation anaérobie a été conduite en présence d'acétylène qui inhibe de façon
irréversible la nitrification (Berg et al., 1982) ainsi que la synthèse et l'activation de la N2O
réductase, ce qui minimise la variation dans le temps du rapport N2O/(N2O+N2) des produits
de la dénitrification. Nous avons observé que l'émission nette de N2O par les mottes de sol en
incubation aérobie était très fortement accrue par la pré-incubation anaérobie, alors que ces
mottes avaient été très fortement appauvries en NO3- durant la période d'anoxie
(contrairement à celles qui n'avaient pas subi la pré-incubation). Le marquage isotopique a
prouvé que l'essentiel des émissions provenait de la dénitrification. Les mesures de teneur en
CO2 ont confirmé que la pré-incubation stimulait fortement la respiration aérobie sur 24
heures et que l'effet disparaissait après 4 jours (à 20°C). Compte tenu de la vitesse de
respiration mesurée sans ou avec pré-incubation (respectivement 3.2 et 12.2 nmol O2 kg-1 s-1),
le calcul montre qu'une motte totalement saturée doit avoir un rayon respectif de 1.0 et 0.5 cm
pour qu'elle ait un cœur anaérobie. Ceci est cohérent avec nos observations, à savoir qu'une
activité dénitrifiante a été détectée sur 44% des mottes (d'environ 3 cm de diamètre) n'ayant
pas subi de pré-incubation et sur 100% des mottes ayant subi cette pré-incubation anaérobie.
L'effet très marqué de la pré-incubation anaérobie sur les émissions de N2O peut avoir 2
explications:
- un fort accroissement de la vitesse de respiration aérobie suite à la période d'anaérobiose,
sans doute en raison de la dégradation de petites molécules organiques accumulées en
phase anaérobie (de type AGV) et facilement dégradables en conditions aérobies;
- le fait que la présence de C2H2 en anaérobiose inhibe la synthèse de la N2O-réductase et
qu'elle permet de maintenir le rapport N2O/(N2O+N2) à un niveau élevé.
A l'aide d'un modèle mécaniste, nous avons alors vérifié:
1) que l'accroissement de respiration et d'activité dénitrifiante permettait d'expliquer les
écarts d'émission de N2O entre mottes ayant subi ou n'ayant pas subi de pré-incubation
anaérobie,
202
Synthèse des résultats
2) que ces résultats étaient cohérents avec les différences d'émissions de N2O entre mottes
de structures ∆ et Γ (relation entre niveau d'émission et masse des mottes, corrélée à leur
structure ∆ ou Γ).
Le modèle prend en compte explicitement la structure du sol et la consommation d'O2 par
le sol dans le calcul de la fraction anoxique des mottes ; il simule la dénitrification, incluant la
réduction de N2O en N2, au sein des zones anoxiques. L’analyse d’image s’est avérée être un
outil pertinent pour décrire la structure des mottes de sol à partir des lames minces.
I.3. Emissions de N2O par nitrification
Des travaux récents ont montré que la nitrification peut contribuer fortement aux émissions
de N2O. Plusieurs facteurs pouvant influencer ces émissions ont été étudiés. Toutefois, peu
d’études sur l’effet direct de O2 sur ces émissions existent. Une série d'expérimentations
permettant d’étudier l’effet de NH4+ et O2 sur la nitrification et les émissions de N2O par
nitrification a été réalisée. Nos résultats ont mis en évidence et quantifié l’effet de la
concentration en ammonium sur l’activité nitrifiante et sur l’accumulation du nitrite. Ils ont
montré que la pression partielle en O2 influence fortement les cinétiques de nitrification. Nous
avons obtenu une bonne corrélation entre nitrification et consommation de O2, correspondant
à la stœchiométrie des équations de nitrification. Ces résultats soulignent l’importance de la
consommation en O2 par nitrification en comparaison avec la consommation par respiration;
cette forte consommation est souvent négligée dans l’étude des émissions de N2O alors
qu’elle peut favoriser la création des sites anoxiques et en conséquence favoriser la
dénitrification. Les émissions de N2O par nitrification sont bien corrélées avec les quantités
d'azote nitrifié; les pentes des droites de régression étant très variables selon la pression
partielle en O2. La structure du sol affectant la distribution de l'oxygène dans le sol peut donc
modifier la nitrification et les émissions de N2O par nitrification, et dans une gamme de
teneurs plus large que pour la dénitrification: ainsi le passage d'une concentration de 20% à
4% O2 diminue la vitesse de nitrification d'environ 50% et augmente la perte de N2O d'un
facteur 2.5. Ces résultats montrent la nécessité de prendre en compte l’effet de O2 pour mieux
prévoir les émissions de N2O et mieux expliquer leur variabilité.
I.4. Données complémentaires
203
Synthèse des résultats
II.
Nous avons acquis d'autres données relatives au fonctionnement respiratoire et dénitrifiant
des mottes en séparant les matières organiques particulaires (MOP) et le reste du sol (appelé
matrice). Ces données restent à traiter complètement, mais il apparaît dès à présent que les
teneurs en MOP sont similaires à celles obtenues dans d'autres expérimentations et que les
activités respiratoire et dénitrifiante sont similaires en ordre de grandeur à celles obtenues
dans des contextes cultivés (Parry et al., 2000). Toutefois et contrairement aux résultats de
Parry et al. (2000), il semble que l'activité dénitrifiante puisse être négligée au niveau de ces
matières organiques particulaires dans notre sol. Parmi les hypothèses permettant d'expliquer
cette contradiction, nous proposons l'hypothèse "taille": la taille moyenne des MOP de notre
sol pourrait être plus faible que celle des mottes étudiées par Parry et al. (2000) et minimiser
leur caractère "hot-spot" si elle est trop faible.
Comparaison avec le comportement du sol in situ
Les résultats que nous avons obtenus sur des mottes isolées, au laboratoire, peuvent être
comparés aux résultats de terrain acquis sur le même sol par les équipes INRA de Laon et
Avignon (site d'Estrées-Mons, projet GESSOL). Deux périodes d'expérimentation de terrain
ont été réalisées, dans des conditions agricoles classiques, l'une en automne après une culture
de blé, l'autre au printemps avant une culture de maïs. Les résultats ont fait apparaître :
1) des émissions de N2O égales en moyenne à 1.2 g N-N2O ha-1 j-1 à l'automne, au cours
d'un suivi continu sur 2 mois (13/09/1999-12/11/1999), qui ont décru parallèlement à la
température;
2) des émissions de N2O égales en moyenne à 2.6 g N-N2O ha-1 j-1 au printemps, au cours
d'un suivi semi-continu de 2 mois (07/04/2000-09/06/2000), qui ont atteint un
maximum après l'apport d'engrais et ont diminué ensuite;
3) l'absence d'effet significatif de la structure du sol sur les émissions de N2O, alors que
les parcelles étaient très différenciées sur le plan structural, notamment par leur
proportion de mottes ∆ (mottes sans porosité visible à l'œil);
4) un rapport N2O/(N2O+N2) des produits de la dénitrification faible, estimé à 13 ± 4 %
(estimation réalisée grâce au marquage 15NO3), ce qui indique que ce sol est actif pour
réduire le N2O en N2.
Les émissions in situ peuvent être comparées aux émissions mesurées au labo, en
supposant une densité apparente de 1.5 g cm-3, une profondeur de zone émettrice de N2O de
30 cm (correspondant à la couche labourée) et une loi de température exponentielle (avec un
204

Synthèse des résultats
III.
Q10 = 2). Les vitesses d'émission de N2O moyennes mesurées au champ de 1.2 et 2.6 g N ha-1
jour-1 correspondent à des vitesses de 0.37 et 0.70 pmol kg-1 s-1 à 20°C.
Pour un rapport N2O/(N2O+N2) égal à 0.13, on en déduit que les vitesses de dénitrification
seraient de 2.9 et 5.4 pmol kg-1 s-1 à 20°C. Ces valeurs sont tout à fait en accord avec les
vitesses de dénitrification totale (avec C2H2) mesurées sur mottes au laboratoire : 4.2 ± 3.7
pmol kg-1 s-1 à 20°C.
Nos travaux suggèrent que pour passer de la modélisation des processus microbiens étudiés
au laboratoire à une modélisation opérationnelle des émissions in situ, il faut tenir compte des
variations des paramètres décrivant les cinétiques microbiennes en fonction de "l'histoire" du
sol, en particulier des alternances de périodes d'aérobiose et d'anaérobiose.
1) d'abord l'induction de la N2O réductase pendant une période d'anaérobiose qui apparaît
1 à 2 jours après le début d'anoxie selon la concentration en NO3-
2) éventuellement pour des périodes d'anaérobiose de plusieurs jours, l'accumulation de
substrats carbonés supplémentaires (acides organiques, acides gras volatils) au cours de
la phase d'anoxie, qui deviennent métabolisables après rétablissement de l'aérobiose.
La décomposition de ces substrats carbonés augmente alors la vitesse de consommation
d'O2 et donc le volume anoxique, favorisant à nouveau les émissions de N2O.
Nos travaux montrent aussi qu'une forte activité nitrifiante (induite par un apport d'engrais
sous forme ammoniacale) peut fortement accroître la consommation de O2 pendant quelques
jours et ainsi augmenter le risque d'anaérobiose et d'émission de N2O par dénitrification, en
plus des émissions de N2O par nitrification. Les conséquences de ces 2 processus sur les
émissions de N2O in situ restent à évaluer. Cependant, ils remettent en cause une modélisation
basée sur des paramètres invariants, estimés à partir d'incubations de courte durée et faites
uniquement dans le sens aérobie → anaérobie.
Perspectives de ce travail
Les perspectives de recherche ouvertes par notre travail concernent 3 aspects:
III.1. Aspect méthodologique
205

Synthèse des résultats
Afin de distinguer nitrification et dénitrification biologiques à l’origine de la production de
N2O, nous avons utilisé la technique isotopique par un apport d’une solution ammoniacale 15N. Toutefois, lors de l’apport de la solution, des zones anoxiques ont pu être créées,
favorisant ainsi la dénitrification. Une autre difficulté de cette méthode est d'obtenir un
mélange 15N et 14N aussi homogène que possible pour toutes les formes minérales azotées du
sol.
Pour étudier la nitrification, nous avons cherché à obtenir des conditions expérimentales
défavorables à la dénitrification et limitant les problèmes d’hétérogénéité spatiale. Pour cela,
les incubations ont été réalisées sur des échantillons de sol tamisés entre 2 et 3 mm, fortement
enrichis en NH4+. La petite taille des agrégats favorise l’aération du sol et limite les risques de
présence de microsites anaérobies au cœur des agrégats (Sextone et al., 1985 ; Renault et
Stengel, 1994). Toutefois, aux plus faibles teneurs en O2 testées (0.3% O2), nous ne pouvons
plus considérer que la dénitrification est absente de ces petits agrégats.
Dans tout le travail sur la dénitrification, le potentiel hydrique des mottes a été maintenu
à une valeur constante. Cette condition est nécessaire car des variations de ce facteur
pourraient masquer l’influence de la structure sur les émissions de N2O par dénitrification
notamment. Le potentiel choisi, -0.5 kPa, correspond à des conditions très humides, proches
de la saturation que l'on rencontre au champ surtout en automne/hiver, en particulier après des
opérations de travail du sol "dégradantes" (du type récolte de betterave ou de maïs). Un
potentiel hydrique plus faible permettrait peut-être de mieux extérioriser les différences de
structure des mottes en saturant plus ou moins de pores.
III.2 Aspect d'analyse des mécanismes
a) Concernant la dénitrification:
Nous avons constaté le très fort effet d’une pré-incubation anaérobie de 6 jours sur les
émissions de N2O par les mottes de sol. Qu'en serait-il si cette période d'anaérobiose était
accrue ou réduite ? Une durée aussi longue est sans doute très exceptionnelle au champ, sauf
en sol hydromorphe. L'effet d'une courte pré-incubation anaérobie mériterait d'être étudié.
Par ailleurs, la présence de C2H2 pendant cette pré-incubation inhibe la synthèse de la N2O-
réductase et permet de maintenir le rapport N2O/(N2O+N2) à un niveau élevé. L’absence de
C2H2 pourrait favoriser la réduction de N2O en N2 et par conséquent minimiser la production
de N2O pendant la phase aérobie après la pré-incubation anaérobie. Il faudrait le confirmer.
206

Synthèse des résultats
b) Concernant la nitrification:
Nous avons mis en évidence un fort effet de la pression en O2 sur l’activité nitrifiante ainsi
que sur les émissions de N2O par nitrification. Néanmoins, les mécanismes des émissions de
N2O par nitrification dans les sols restent encore mal définis. Nous pouvons envisager une
meilleure description de la nitrification elle même en tenant en compte des 2 réactions : la
production de NO2- et la production de NO3
- ainsi que l’effet de O2 sur chacune des 2
réactions. Une bonne compréhension de ces processus facilitera l’étude des mécanismes
d'émissions de N2O par nitrification ainsi que l’effet de O2 sur ces émissions. Elle devrait
permettre d'améliorer les modèles de prévision des émissions de N2O. Parallèlement, il est
nécessaire de passer d'un modèle d'aération des sols utilisant le critère volume anoxique à un
modèle prenant en compte les gradients de concentration en O2 dans la motte ou le profil de
sol
III.3. Extrapolation à des échelles d'espace et de temps plus larges
Nous nous intéressons aux perspectives d’adaptation et d’utilisation du modèle à des
problématiques agronomiques et environnementales. A l’échelle de notre travail, peut se poser
le problème de la non prise en compte de la certains processus ou de leurs conséquences
comme la distribution verticale des concentrations gazeuses et des concentrations en NO3-.
Ces aspects pourraient requérir la nécessité de couplages entre des modèles établis à l'échelle
de la motte et des modèles de fonctionnement à l'échelle du profil. Un premier modèle
d'émission de N2O par dénitrification a été proposé par Lafolie et al. (2000) à l'échelle du
profil : ce modèle doit être complété par les acquis de notre travail et étendu à la prise en
compte des émissions de N2O par nitrification.
Les descripteurs de la structure tels que les distances d’un point d’une motte au pore libre à
l’air le plus proche pourraient être utilisés pour caractériser les possibilités d’oxygénation
locales. Toutefois, si de tels critères sont utiles pour les études de mécanismes à l’échelle
locale, ils sont inadaptés à l’approche régionale des émissions de N2O de par leur mesure
délicate et de par l’absence de méthodes fiables d’extrapolation spatiale et temporelle. A ce
207

Synthèse des résultats
type de critères, il semble possible (tout au moins à l'échelle de la parcelle) de substituer des
critères simples tels que la taille des éléments structuraux du sol, la nature morphologique des
éléments constitutifs du sol ainsi que les travaux visant à analyser la proportion des
différentes types de mottes et leur localisation au sein du profil.
A l’heure actuelle, les modèles sont généralement des produits de fonctions décrivant
l'action individuelle des différents facteurs (teneur en eau, NO3-, matière organique,
température, pH, ...) sur les émissions de N2O. Ces modèles prennent en compte les effets
moyens de ces paramètres et ne cherchent pas à décrire les processus élémentaires liés à ces
émissions. Ces modèles sont fonctionnels à de grandes échelles (parcelle), mais souvent ils ne
sont pas généralisables à d’autres sites. Lors de notre travail, nous avons montré que la
réduction de N2O, la nitrification et les émissions de N2O par nitrification ainsi que la
structure des mottes, ne sont pas négligeables dans les prévisions des émissions de N2O. La
prise en compte de ces facteurs dans les modèles pourrait être une base à l’élaboration de
nouveaux modèles simplifiés.
208

BIBLIOGRAPHIE
209

BIBLIOGRAPHIE
Abbasi M. K., Adams W. A., 1998. Loss of nitrogen in compacted grassland soil by
simultaneous nitrification and denitrification. Plant and Soil 200, 265-277.
Almeida J. S., Julio S. M., Reis M. A. M., Carrondo M. J. T., 1995. Nitrite inhibition of
denitrification by Pseudomonas Fluorescens. Biotechnology and Bioengineering 46, 194-201.
Ambus P., 1998. Nitrous oxide production by denitrification and nitrification in temperate
forest, grassland and agricultural soils. European Journal of Soil Science 49, 495-502.
Alvarez C. R., Alvarez R., Grigera M. S., Lavado R. S., 1998a. Associations between
organic matter fractions and the active soil biomass. Soil Biol. & Biochem. 30, 767-773.
Anderson I. C., Poth M., Homstead J., Burdige D., 1993. A comparison of NO and N2O
production by the autotrophic nitrifier Nitrosomonas europaea and the heterotrophic nitrifier
Alcaligenes faecalis. Applied and Environmental Microbiology, 3525-3533.
Arah J. M., 1988. Modelling denitrification in aggregated and structureless soils. In Nitrogen
efficiency in agricultural soils. (D. S. Jenkinson and K. A. Smith, ed.) Elsevier Applied
Science, London, 433-444.
Arah J. M., Smith K. A., 1989. Steady-state denitrification in aggregated soils: A
mathematical model. Journal of Soil Science 40, 139-149.
Arah J. R. M., 1997. Apportioning nitrous oxide fluxes between nitrification and
denitrification using gas-phase mass spectrometry. Soil Biol. Biochem. 29(8), 1295-1299.
Aulakh M. S., Rennie D. A. and Paul E. A., 1984. The influence of plant residues on
denitrification rates in conventional and zero tilled soils. Soil Science Society of America
Journal 48, 790-794.
Aulakh M. S., Doran J. W., Mosier A. R., 1992. Soil denitrification significance,
measurement and effects of management. Adv. Soil Sci. 18, 1-57.
Avinimelech Y., 1971. Nitrate transformation in peat. Soil Sci.111, 113-118.
Bakken L. R., Boressen T., Njos A., 1987. Effect of soil compaction by tractor trafic on soil
structure, denitrification and yield of wheat. J. Soil. Sci. 38, 541-552.
Barcelona M. J., 1984. TOC determinations in ground water. Groundwater 22, 18-24.
Baumann Barbara, Snozzi Mario, Zehnder Alexander J.B., Jan Roelof Van Der Meer,
1996. Dynamics of denitrification activity of paracoccus denitrificans in continuous culture
during aerobic-anaerobic changes. Journal of Bacteriology, 4367-4374.
Beauchamp E. G., 1997. Nitrous oxide emission from agricultural soils. Can. J. Soil Sci. 77,
113-123.
210

BIBLIOGRAPHIE
Bell L. C., Richardson D. J., Ferguson S. J., 1990. Periplasmic and membrane bound
respiratory nitrate reductases in Thiosphaera pantotropha. FEBS Lett. 265, 85-87.
Berg P., Klemedtsson L., Rosswall T., 1982. Inhibitory effect of low partial pressures of
acetylene on nitrification. Soil Biology and Biochemistry 14, 301-303
Bergwall C., Bengtsson G., 1999. Phenotypic plasticity in groundwater denitrifiers. Oikos
87, 123-128.
Betlach M. R., Tiedje J. M., 1981. Kinetic explanation for accumulation of nitrite, nitric
oxide, and nitrous oxide during bacterial denitrification. Appl. Environ. Microbiol. 42, 1074-
1084.
Bidel L., Renault P., Pages L., Riviere L. M., 2000. Mapping meristem respiration of
Prunus persica (L.) Batsch seedlings: potential respiration of the meristems, O2 diffusional
constraints and combined effects on root growth. Journal of Experimental Botany. 51(345),
755-768.
Blackmer A. M., Bremner J. M., 1978. Inhibitory effect of nitrate on reduction of N2O to N2
by soil microorganisms. Soil Biol. Biochem. 10, 187-191.
Blackmer A. M., Bremner J. M., 1979. Stimulatory effect of nitrate on reduction of N2O to
N2 by soil microorganisms. Soil Biol. Biochem. 11, 313-315.
Blackmer A. M., Bremner J. M., Schmidt E. L., 1980. Production of nitrous oxide by
ammonia oxidizing chemoautotrophic microorganisms in soil. Appl. Environ. Microbiol. 40,
1060-1066.
Bock E., Koops H. P., Harms H., 1986. Cell Biology of nitrifying bacteria. In: Prosser, J. J.
(Ed.), Nitrification IRL Press, Oxford, pp. 17-38.
Bolle H. J., Seiler W., Bolin B., 1986. Other greenhouse gases and aerosols. In: Bolin, B.,
Jager, J., Warrick, R. A. and Doos, B.R. (Eds), The greenhouse effect, climatic change and
ecosystems, Wiley and Sons, New York, 157-203.
Bollmann Annette, Ralf Conrad, 1998. Influence of O2 availability on NO and N2O release
by nitrification and denitrification in soils. Global Change Biology 4, 387-396.
Bouwman A. F., 1996. Direct emission of nitrous oxide from agricultural soils. Nutrient
Cycling in Agrosystems 46, 53-70.
Bowman R. A., Focht D. D., 1974. The influence of glucose and nitrate concentrations upon
denitrification rates in sandy soils. Soil Biol. Biochem. 6, 297-301.
Breitenbeck G. A., Blackmer A. M., Bremner J. M., 1980. Effects of different nitrogen
fertilizers on emission of nitrous oxide from soil. Geophys. Res. Lett. 7, 85-88.
211

BIBLIOGRAPHIE
Bremner J. M., Shaw K., 1958. Denitrification in soils. II. Factors affecting denitrification.
J. Agric. Sci. 51, 40-52.
Bremner J. M., Blackmer A. M., 1978. Nitrous oxide: emission from soils during
nitrification of fertilizer nitrogen. Science 199, 295-296.
Bremner J. M., Blackmer A. M., 1981. Terrestrial nitrification as a source of atmospheric
nitrous oxide. In: Delwiche C. C. (ed.). Denitrification, nitrification and atmospheric nitrous
oxide. John Wiley & Sons Inc., New York, pp. 151-170.
Broadbent F.E., 1951. Denitrification in some California soils. Soil Sci. 72, 129-137.
Brooks P. D., Stark J. M., McInteer B. B., Preston T., 1989. Diffusion method to prepare
soil extracts for automated nitrogen-15 analysis. Soil Science Society of America Journal 53,
1707-1711.
Bruand A., Cousin I., Nicoullaud B., Duval O., Begon J. C., 1996. Backscattered electron
scanning images of soil porosity for analyzing soil compaction around roots. Soil Science
Society of America Journal. 60, 895-901
Burford J., Bremner J. M., 1975. Relationships between the denitrification capacities of
soils and total, water soluble and readily decomposable soil organic matter. Soil Biol.
Biochem. 7, 389-394.
Burns L. C., Stevens R. J., Laughlin R. J., 1996. Production of nitrite in soil by
simultaneous nitrification and denitrification. Soil. Biol. Biochem. 28, 609-616.
Cambardella C. A., Elliot E. T., 1992. Particulate organic matter accross a grassland
cultivation sequence. Soil Science Society of America Journal 56, 777-783.
Chaussod R., Houot S., Guiraud G., Hetier J. M., 1988. Size and turnover of the microbial
biomass in agricultural soils: laboratory and field measurements. In: Nitrogen efficiency in
agricultural soils and the efficient use of fertilizer nitrogen (Jenkinson, D.S., and K.A. Smith
Eds.) pp. 312-326. Elsevier Science, London.
Chin K. J., Conrad R., 1995. Intermediary metabolism in methanogenic paddy soil and the
influence of temperature. FEMS Microbiology Ecology 18, 85-102.
Cho C. M., Sakdinan L., 1978. Mass spectrometric investigation on denitrification. Can. J.
Soil Sci. 58, 443-457.
Cochran W.G., 1950. Estimation of bacterial densities by means of the « most probable
number ». Biometrics 6, 105-116.
212

BIBLIOGRAPHIE
Conrad R., 1990. Flux of NOx between soil and atmosphere: importance and soil
metabolism. In: Revsbech, N.P. and Sorensen, J, (Ed.). Denitrification in soil and sedimentol.
Plenum Press, New York, 1:105-127.
Conrad R., 1996. Soil microorganisms as controllers of atmospheric trace gases (H2, CO,
CH4, OCS, N2O and NO). Microbiol. Rev. 60, 609-640.
Conrad R., 1999. Contribution of hydrogen to methane production and control of hydrogen
concentrations in methanogenic soils and sediments. FEMS Microbiology Ecology 28, 193-
202.
Cooper G. S., Smith R. L., 1963. Sequence of products formed during denitrification in
some diverse western soils. Soil Sci. Soc. Am. Proc. 27, 659-662.
Currie J. A., 1961. Gaseous diffusion in the aeration of aggregated soils. Soil Science 92, 40-
45.
Dassonville F. , Renault P., 2002. Interactions between microbial processes and geochemical
transformations under anaerobic conditions: a review. Agronomie 22, 51-68.
Davidson E.A., Hart S. C., Shanks C. A., Firestone M. K., 1991. Measuring gross nitrogen
mineralization, immobilization and nitrification by 15N isotopic pool dilution in intact soil
cores. Journal of Soil Science 42, 335-349.
Davidson, E. A. 1993. Soil water content and the ratio of nitrous oxide to nitric oxide emitted
from soil. Biogeochemistry of global change, edited by R.S. Uremland, pp: 369-386,
Chapman and Hall, New York.
DeCatanzaro J. B., Beauchamp, E. G., 1985. The effect some carbon substrates on
denitrification rates and carbon utilization in soil. Biol. Fert. Soils 1, 183-187.
Decker K., Jungermann K., Thauer R. K., 1970. Energy production in anaerobic
organisms. Angew. Chem. Internat. Edit., 9(2).
Dendooven, L., Anderson J. M., 1994. Dynamics of reduction enzymes involved in the
denitrification process in pasture soil. Soil. Biol. Biochem., 26(11), 1501-1506.
Dröge M., Pühler A., Selbitschka W., 1999. Horizontal gene transfer among bacteria in
terrestrial and aquatic habitats as assessed by microcosm and field studies. Biol. Fertil. Soils
29, 221-245.
Edwards R. M., Tiedje J. M., 1981. Determination of Km for dissimilatory nitrate reduction
by cells of pseudomonas fluorescens. Abst. Ann. Meet. Am. Soc. Microbiol. 48, 181.
Eichner M. J., 1990. Nitrous oxide emissions from fertilized soil. J. Environ. 19, 272-280.
213
BIBLIOGRAPHIE
Ellis S., Howe M. T., Goulding K. W. T., Mugglestone M. A., Dendooven L., 1998.
Carbon and nitrogen dynamics in a grassland soil with varying pH: effect of pH on the
denitrification potentiel and dynamics of the reduction enzymes. Soil. Biol. Biochem. 30(3),
359-367.
Fewson C. A., Nicholas J. D., 1961. Nitrate reductase from Pseudomonas aeruginosa.
Biochemical and Biophysical Acta 49, 335- 349.
Fewson C. A., Nicholas J. D., 1961. Nitrate reductase from Pseudomonas aeruginosa.
Biochemical and Biophysical Acta 49, 335- 349.
Fiès J. C., Stengel P., 1981. Densité texturale de sols naturels. II. - Méthode de mesure.
Agronomie. 1(8):651-658.
Firestone M. K., Smith M. B., Firestone R. B., Tiedje J. M., 1979. The influence of nitrate,
nitrite and oxygen on the composition of the gaseous products of denitrification in soil. Soil
Sci. Soc. Am. J. 43, 1140-1144.
Firestone M. K., Tiedje J. M., 1979. Temporal change in nitrous oxide and dinitrogen from
denitrification following onset of anaerobiosis. Applied and Environmental Microbiology, 38,
673-679
Firestone M.K., M.B. Smith, R.B. Firestone, and J.M. Tiedje. 1979. The influence of
nitrate, nitrite and oxygen on the composition of the gaseous products of denitrification in
soil. Soil Sci. Soc. Am. J. 43: 1140-1144.
Firestone M. K., 1982. Biological denitrification. In Nitrogen in agricultural soils (F.J.
Stevensen, Ed.), pp. 289-326. Agronomy Monograph, 22, American Society of Agronomy,
Madison, Wisconsin, Wiley, New York.
Firestone M. K., Davidson E. A., 1989. Microbiological basis of NO and N2O production
and consumption in soil. In: Andrea M.O., Schimel D.S., (Ed.), Exchange of trace gases
between terrestrial ecosystems and the atmosphere, J. Wiley and L. Sons, Chichetser, United
Kingdom, pp. 7-21.
Förstner U., 1987. Metals speciation, separation and recovery. In Lewis Publishers, Chelsea.
Gaffney J. S., Marley N. A., Clark S. B., 1996. Humic and fulvic acids: isolation, structure
and environmental role. American Chemistry Society (Chap. 1), 2-16.
Gamble T. N., Betlach H. R. and Tiedje J. M., 1977. Numerically dominant denitrifying
bacteria from world soils. Appl. Environ. Microbiol. 33(4), 926-939.
214

BIBLIOGRAPHIE
Garrido F., Hénault C., Gaillard H., Pérez S., Germon J. C. 2001. N2O and NO emissions
by agricultural soils with low hydraulic potentials. Soil Biology and Biochemistry 34, 559-
575.
Garrido F., 2001. Les mécanismes de production de d’oxydes d’azote gazeux (N2O et NO)
par les sols en conditions aérées. Thesis, Université Bourgogne, France, 144 p.
Gaskell J. F., Blackmer A. M., Bremner J. M., 1981. Comparison of effects of nitrate,
nitrite and nitric oxide on reduction of nitrous oxide to dinitrogen by soil microorganisms.
Soil Sci. Soc. Am. J. 45, 1124-1127.
Goreau T. J., Kaplan W. A., Wofsy S. C., McElroy M. B., Valois F. W., Watson S. W.,
1980. Production of NO2- and N2O by nitrifying bacteria at reduced concentrations of oxygen.
Appl. Environ. Microbiol. 40, 526-532.
Graedel T. E., Crutzen P. J., 1992. Atmospheric change. An earth system perspective. W.H.
Freeman and Company, New York.
Granli T., Bockman O. C., 1994. Nitrous oxide from agriculture. Norv. J. Agri. Sci. 12
(supplement), 1-125.
Grant R.F., 1991. A technique for estimating denitrification rates at different soil
temperatures, water contents and nitrate concentrations. Soil Science 152, 41-52.
Grant R. F. 1993a. Evolution of nitrous oxide from soil: I. model development. Soil Science,
156, 259-265.
Grant R. F. 1995. Mathematical modelling of nitrous oxide evolution during nitrification.
Soil Biology and Biochemistry. 27(9), 1117-1125.
Greenwood D. J., Berry G, 1962. Aerobic respiration in soil crumbs. Nature 195, 161-163.
Groffman, P.M. 1991. Ecology of nitrification and denitrification in soil evaluated at scales
relevant to atmospheric chemistry. pp. 201-217 in J.E. Rogers & W.B. Whitman (eds.).
Microbial production and consumption of greenhouse gases: methane, nitrogen oxides and
halomethanes. American Society for Microbiology, Washington, D.C.
Grundman G. L., Rolston D. E., 1987. A water function approximation to degree of a
anaerobiosis associated with denitrification. Soil Sci. 144, 437-441.
Guérin-Dachkevitch, N. 1999. Emissions de N2O par les sols cultivés, effet de la teneur en
NO3- et de la température. PhD, Burgundy University, France.
215

BIBLIOGRAPHIE
Guthrie, J.M. & Duxburry, J.M. 1978. Nitrogen mineralization and denitrification in
organic soils. Soil Sci. Soc. Am. J., 42, 908-912.
Hassink J., 1994. Active organic matter fractions and microbial biomass as predictors of N
mineralization. Eur. J. Agron. 3(4), 257-265.
Hénault C., 1993. Quantification de la dénitrification dans les sols à l’échelle de la parcelle
cultivée, à l’aide d’un modèle prévisionnel. Ph.D. thesis, ENSA Montpellier, 108 pp.
Hénault, C., and J.C. Germon. 1995. Quantification de la dénitrification et des émissions de
protoxyde d'azote (N2O) par les sols. Agronomie 15: 321-355.
Hénault C., Germon J. C., 2000. NEMIS, a predictive model of denitrification on the field
scale. Eur. J. Soil Sci. 51, 257-270.
Henriksen and Selmer-Olsen 1970. Automatic methods for determining nitrate and nitrite in
water and soil extracts. The Analyst 955, 514-518
Holtan-Hartwig, Liv, Dörsch, Peter & Bakken, Lars Reier. 2000. Comparison of
denitrifying communities in organic soils: kinetics of NO3- and N2O reduction. Soil Biology
and Biochemistry, 32, 833-843.
Hommes N. G., Russel S. A., Bottomley P. J., Arp D. J., 1998. Effects of soil on ammonia,
ethylene, chloroethane and 1,11-trichloroethane oxidation by Nitrosomonas europaea. Appl.
Environ. Microbiol. 64(4), 1372-1378.
IPCC, 1995. Climate change 1994. Report of working groups I and III of the
intergovernmental panel on climate change, Cambridge University Press, UK, 339 p.
I.P.C.C., 1996. In: Climate change 1995: the science of climate change. Contribution of
working group I to the second assessment report of the intergovernmental panel on climate
change. (eds Houghton, J.T., Meira Filho, L.G., Callander, B.A., Harris, N., Kattenberg, A.,
Maskell K.). Cambridge University Press, Cambridge.
Jambert C., 1995. Emissions de composés azotés dans l’atmosphère par des agrosystèmes
fertilisés : Maïsculture dans les landes de Gascogne. Thesis, Université Paul Sabatier,
Toulouse, pp : 1-111.
Kalbitz K., Solinger S., Park J.H., Michalzic B. and Matzner E., 2000. Controls on the
dynamics of dissolved organic matter in soils: a review. Soil Science 165, 277-304.
Kamphake L. J., Hannah S. A. and Cohen J. M., 1967. Automated analysis for nitrate by
hydrazine reduction. Water Research 1, 205-216.
Kaspar, H. F., 1985. The denitrification capacity of sediment from a hypereutrophic lake.
Freshwater Biol., 15, 449-453.
216

BIBLIOGRAPHIE
Khalil K., Renault P.,Mary B., Guérin N, 2003a. Modeling Denitrification including the
Dynamics of Denitrifiers and their Progressing Ability to Reduce Nitrous Oxide: Comparison
with Batch Experiments. Submitted in European Journal of Soil Science.
Khalil K., Renault P., Mary B., 2003b. The effect of transient anaerobic pre-incubation on
subsequent aerobic respiration and N2O emission of clods in atmospheric conditions.
Submitted to Soil Biology and Biochemistry.
Kieft Thomas L., Soroker Edith, Firestone Mary K., 1987. Microbial biomass response to
a rapid increase in water potential when dry soil is wetted. Soil. Biol. Biochem. 19(2), 119-
126.
Killham K., 1986. Heterotrophic nitrification. In: Prosser, J.I. (Ed.), Nitrification, IRL Press,
pp. 1-16.
Klemedtsson L., Svensson B. H., Lindberg T., Rosswall T., 1977. The use of acetylene
inhibition of nitrous oxide reductase in quantifying denitrification in soils. Swedish Journal of
Agricultural Research 7, 179-185.
Klemedtsson L., Svensson B. H. and Rosswall T., 1988. A method of selective inhibition to
distinguish between nitrification and denitrification as sources of nitrous oxide in soil.
Biology and Fertility of Soils 6, 112-119.
Knowles R. 1982. Denitrification. Microbiol. Rev., 46, 43-70.
Koskinen W. C., Keeney D. R., 1982. Effect of pH on the rate of gaseous products of
denitrification in a silt loam soil. Soil Science Society of America Journal
46(6), 1165-1167.
Kowalchuk George A., John R. Stephen, 2001. Ammonia-Oxidizing bacteria : a model for
molecular microbial ecology. Annu. Rev. Microbiol. 55 : 485-529.
Krom M. D., 1980. Spectrometric determination of ammonia: a study of a modified Berthelot
reaction using salicylate and dichloroisocyanurate. The Analyst 105, 305-316.
Lafolie F., Renault P., Hénault C., Sévenier G., 2001. Nitrous oxide emission: A
comparison of field measurements and model predictions. 11th Nitrogen Workshop, Reims,
France.
Lalisse-Grundmann G., Brunel B., Chalamet A., 1988. Denitrification in a cultivated soil:
optimal glucose and nitrate concentrations. Soil Biol. Biochem., 20, 839-844.
Laanbroek H. J., Gerards S., 1993. Competition for limiting amounts of oxygen between
Nitrosomonas europaea and Nitrobacter winogradskyi grown in mixed continuous cultures.
Arch. Microbiol. 159, 453-459.
217
BIBLIOGRAPHIE
Leffelaar P. A., 1979. Simulation of partial anaerobiosis in a model soil in respect to
denitrification. Soil Science 128 (2).
Leffelaar P. A., Wessel W. 1988. Denitrification in a homogeneous closed system:
experiment and simulation. Soil Sci., 146, 335-349.
Lensi R., Domenach A. M., Abbadie L., 1992. Field study of nitrification and denitrification
in a wet savanna of West Africa (Lamto, Côte d’Ivoire). Plant and Soil 147, 107-113.
Lensi R., Clays-Josserand A., Jocteur Monrozier L., 1995. Denitrifiers and denitrifying
activity in size fractions of a mollisol under permanent pasture and continuous cultivation.
Soil. Biol. Biochem., 27(1), 61-69.
Letey J., Valoras N., Hadas A., Focht D. D., 1980. Effect of air-filled porosity, nitrate
concentration and time on the ratio of N2O/N2 evolution during denitrification. J. Environ.
Qual., 9, 227-231.
Li C., Frolking S., Frolking T. A., 1992. A model of nitrous oxide evolution of soil driven
by rainfall events: 1- Model structure and sensitivity. Journal of Geophysical Research.
97(D9), 9758-9776.
Li C., Frolking S., Frolking T. A., 1992. A model of nitrous oxide evolution of soil driven
by rainfall events: 2- Model applications. Journal of Geophysical Research. 97(D9), 9777-
9783.
Li C., Narayanan V. R., Harriss C., 1996. Model estimates of nitrous oxide emissions from
agricultural lands in the United States. Global Biogeochemical Cycles 10(2), 297-306.
Linn D. M., Doran J. W., 1984. Effect of water filled pore space on carbon dioxide and
nitrous oxide production in tilled and non tilled soils. Soil Sci. Soc. Am. J. 48, 1267-1272.
Lovel R. D., Jarvis S. C., 1998. Soil Microbial Biomass and activity in soil from different
grassland management treatments stored under controlled conditions. Soil. Biol. Biochem.
30(14), 2077-2085.
Luo J., White R. E, Ball P. R., Tillman R. W., 1996. Measuring denitrification activity in
soils under pasture: optimizing conditions for the short-term denitrification enzymes assay
and effects of soil storage on denitrification activity. Soil Biol. Biochem. 23(3), 409-417.
Maag M., Malionovsky M., Nielsen S. M., 1997. Kinetics and temperature dependence of
potential denitrification in riparian soils. J. Environ. Qual. 26: 215-223.
MacKay R., Khalil M. A. K., 1991. Theory and Development of a one dimensional time
dependant radiative convective climate model. Chemosphere 22, 383-417.
Mahne I., Tiedje J. M., 1995. Criteria and methodology for identifying respiratory
denitrifiers. Appl. Environ. Microbiol. 61, 1110-1115.
218

BIBLIOGRAPHIE
Malhi S. S., McGill W. B., Nyborg M., 1990. Nitrate losses in soils: effect of temperature,
moisture and substrate concentration. Soil Biol. Biochem. 22(6), 733-737.
Mariotti A., Germon J. C., Hubert P., Kaiser P., Letolle R., Tardieux, J., Tardieux P.,
1981. Experimental determination of nitrogen kinetic isotope fractionation: Some principles;
illustration for the denitrification and nitrification processes. Plant and Soil 62, 413-430.
Marquardt D., 1963. An algorithm for least-squares estimation of non linear parameters.
SIAM J. Appl. Math. 11, 431-441.
Mary B., Recous S., Robin D., 1998. A model for calculating nitrogen fluxes in soil using 15N tracing. Soil Biol. Biochem. 30(14), 1963-1979.
McConnaughey P. K., Bouldin D. R.., 1985a. Transient microsite models of denitrification:
I. Model development. Soil Sci. Soc. Am. J. 49, 886-901.
McConnaughey P. K., Bouldin D. R.., 1985b. Transient microsite models of denitrification:
II. Model results. Soil Sci. Soc. Am. J. 49, 886-901.
McConnaughey P. K., Bouldin D. R.., 1985c. Transient microsite models of denitrification:
III. Comparison of experimental and model results. Soil Sci. Soc. Am. J. 49, 886-901.
McInerney M. J., 1988. Biology of anaerobic microorganisms. United States of America :
John Wiley & Sons. Anaerobic hydrolysis and fermentation of fats and Proteins, 373-417.
McKenney D. J., Shuttleworth K. F., Vriesacker J. R., Findlay W. I., 1982. Production
and loss of Nitric oxide from denitrification in anaerobic Brookston clay. Appl. Environ.
Microbiol., 43(3), 534-541.
Moore T. R., 1998. Dissolved organic carbon: sources, sinks and fluxes and role in the soil
carbon cycle. In Soils processes and the carbon cycle (R. Lal, J. M. Kimble, R. F. Follett eds.)
pp. 281-292. CRC Press Inc. Boca Raton, USA.
Mosier A. R., 1980. Acetylene inhibition of ammonium oxidation in soil. Soil Biol.&
Biochem. 12, 443-444.
Murray R. E., Parsons L. L., Smith M. S., 1989. Kinetics of nitrate utilization by mixed
populations of denitrifying bacteria. Applied and Environmental Microbiology 55, 717-721.
Myrold D. D., Tiedje J. M., 1985. Diffusional constraints on denitrification in soil. Soil. Sci.
Soc. Am. J., 49, 651-657.
Nakajima M., Hayamizu T., Nishimufa H., 1984. Effect of oxygen concentration on the
rate of denitrification and denitrification in the sediments of an eutrophic lake. Water Res., 18,
335-338.
219

BIBLIOGRAPHIE
Nielsen T. H., Nielsen L. P. and Revsbech N. P., 1996. Nitrification and coupled
nitrification-denitrification associated with a soil-manure interface. Soil Science Society of
America Journal 60, 1829-1840.
Nömmik H., 1956. Investigations on denitrification in soil. Acta Agric. Scand., 6, 195-228
Nömmik, H., Pluth, D.J. & Melin, J. 1984. Dissimilatory reduction of 15N-labeled nitrate in
the presence of non-labeled nitric oxide or nitrous oxide. Can. J. Soil Sci., 64, 21-29.
Nougier J. P., 1983. Méthodes de calcul numérique. Masson, Paris, 317 p.
Otte Sandra, Grobben Nicole G., Robertson Lesley A., Jetten Mike S. M., Kuenen J.
Gijs, 1996. Nitrous oxide Production by Alcaligenes faecalis under transient and dynamic
aerobic and anaerobic conditions. Applied and Environmental Microbiology, 2421-2426.
Paccard E., 1995. Dénitrification biologique d’effluents industriels à fortes concentrations en
nitrates. Thesis, Université Provence Aix-Marseilles I, pp., 1-45.
Parkin T. B., 1987. Soil microsites as a source of denitrification variability. Soil Sci. Am. J.
51, 1194-1199.
Parry S., Renault P., Chenu C., Lensi R., 1999. Denitrification in pasture and cropped soil
clods as affected by the pore space structure. Soil Biol. Biochem. 31, 493-501.
Parry S, Renault P., Chadoeuf J., Chenu C., Lensi R., 2000. Particulate organic matter as a
source of variation in denitrification in clods of soil. European Journal of Soil Science. 51,
271-281.
Parton W. J., Mosier A. R, Schimel D. S., 1988. Rates and Pathways of nitrous oxide
production in a shortgrass steppe. Biochemistry 6, 45-58.
Parton W. J., Mosier A. R., Ojima D. S., Valentine D. W., Schimel D. S., Weier K.,
Kulmala A. E., 1996. Generalized model for N2 and N2O production from nitrification and
denitrification. Global Biogeochemical Cycles 10(3), 401-412.
Parsons L. L., Murray R. E., Scott Smith M., 1991. Soil denitrification dynamics : Spatial
and temporal variations of enzyme activity, populations and nitrogen gas loss. Soil Sci. Soc.
Am. J. 55, 90-95.
Patureau D., Bernet N., Moletta R., 1996. Study of the denitrifying enzymatic system of
Comamonas sp. Strain SGLY2 under various aeration conditions with a particular view on
nitrate and nitrite reductases. Current Microbiology 32, 25-32.
Pelmont J., 1993. Soufre et hydrogène. In Bactéries et environnement: adaptations
physiologiques, pp. 633-660. Presses Universitaires de France, Grenoble.
Pennington P. I., Ellis R. C., 1993. Autotrophic and heterotrophic nitrification in acidic
forest and native grassland soils. Soil Biol. Biochem. 25(10), 1399-1408.
220
BIBLIOGRAPHIE
Pigliucci M., 1996. How organisms respond to environmental changes : from phenotypes to
molecules (and vice versa). Trends Ecol. Evol. 11, 168-173.
Poth Mark, Dennis D. Focht, 1985. 15N kinetic analysis of N2O production by Nitrosomonas
europaea: an examination of nitrifier denitrification. Applied and Environmental
Microbiology, pp. 1134-1141.
Potter C. S., Matson P. A. Vitousek P. M., Davidson E. A., 1996. Process modeling of
controls on nitrogen trace gas emissions from soil worldwide. Journal of Geophysical
Research 101(D1), 1361-1377.
Prosser J. I., 1986. Nitrification, IRL Press, Oxford.
Rappoldt C., 1992. Diffusion in aggregated soil. Doctoral Thesis, Wageningen Agricultural
University, Wageningen, The Netherlands.
Recous S., Fresneau C., Faurie G. and Mary B., 1988. The fate of labelled 15N urea and
ammonium nitrate applied to a winter wheat crop. Plant and Soil 112, 205-214.
Reddy K. R., Patrick W. H., Phillips R. E., 1978. The role of nitrate diffusion in
determining the order and rate of denitrification in flooded soil:I Experimental results. Soil
Sci. Soc. Am. J., 42, 268-272.
Reddy K. R., Rao P. S. C., Jessup R. E., 1982. The effect of carbon mineralization on
denitrification kinetics in mineral and organic soils. Soil Sci. Soc. Am. J., 46, 62-68.
Remde A., Conrad R., 1990. Production of nitric oxide in Nitrosomonas europaea by
reduction of nitrite. Arch. Microbiol. 154, 187-191.
Renault P., Stengel P., 1994. Modeling oxygen diffusion in aggregated soils: I. Anaerobiosis
inside the aggregates. Soil Sci. Soc. Am. J. 58, 1017-1023.
Renault P., Sierra J., 1994. Modeling oxygen diffusion in aggregated soils II. Anaerobiosis
in topsoil layers. Soil Science Society of America Journal 58, 1023-1030.
Renner E. D., Becker G. E., 1970. Production of nitric oxide and Nitrous oxide during
denitrification by Corynebacterium nephredii. J. Bacteriology., 101(3), 821-826.
Richard G., Boizard H., Roger-Estrade J., Boiffin J., Guérif J., 1999. Study of soil
compaction due to traffic in field conditions: pore space and morphological analysis. Soil and
Tillage Research 51, 151-160.
Richardson David J., 2000. Bacterial respiration: a flexible process for a changing
environment. Microbiology, 146, 551-571.
Richaume A., Bernillon D., Faurie G., 1992. Role of the intraspecific competition in the
regulation of agrobacterium tumefaciens transconjugant population level in soil experiments.
FEMS Microbiology Ecology, 86, 321-330.
221

BIBLIOGRAPHIE
Ritchie G. A. F., Nicholas D. J. D., 1972. Identification of the sources of nitrous oxide
produced by oxidative and reductive processes in Nitrosomonas europaea. Biochem. J. 126;
1181-1191.
Robertson G. P., 1989. Nitrification and denitrification in humid tropical ecosystems:
Potential controls on nitrogen retention, in mineral nutrient. In: Procter, J. (Ed.), Tropical
Forest and Savanna Ecosystems, Blackwell Scientific, Boston, Mass., pp. 55-69.
Rojo M. J., Carcedo S. G., Mateos M. P., 1990. Distribution and characterization of
phosphatase and organic phosphorus in soil fractions. Soil Biol. & Biochem. 22, 169-174.
Rolston D.E., Rao P.S.C., Davidson J.M., Jessup R.E.,1984. Simulation of denitrification
losses on nitrate fertilizer applied to uncropped, cropped and manure-amended field plots.
Soil Science 137(4), 270-279.
Ross D. J., Tate K. R., 1993. Microbial C and N, and respiratory activity, in litter and soil of
a southern beech (Nothofagus) forest: distribution and properties. Soil. Biol. Biochem., 25(4),
477-483.
Serra J., 1982. Image analysis and mathematical morphology. Academic press, London.
Sextone A. J., Revsbech N. P., Timothy B.P., Tiedje, J. M., 1985. Direct measurement of
oxygen profiles and denitrification rates in soil aggregates. Soil Sci. Soc. Am. J. 49, 645-651.
Shimuzu T., Furukitwaki T., Tchikawak K., 1978. Metabolic characteristics of
denitrification by Paracoccus denitrificans. J. Fermentation Technol. 56, 207-213.
Siedow A., Cramm R., Siddiqui R. A., Friedrich. B., 1999. A megaplasmid-borne
anaerobic ribonucleotide reductase in Alacaligenes eutrophus H16. J. Bacteriol., 181, 4919-
4928.
Sierra J., Renault P., 1995. Oxygen consumption by soil microorganisms as affected by
oxygen and carbon dioxide. Applied Soil Ecology 2, 175-184
Sierra J., Renault P., Vallès V., 1995. Anaerobiosis in saturated soil aggregates:modelling
and experiment. European Journal of Soil Science. 46:519-531.
Sillon J. F., 1999. Etude expérimentale et modélisation des effets de la structure de la couche
labourée sur le régime hydrique du sol nu en phase de dessèchement: Application à la
prévision des jours disponibles. Thesis of Institut National Agronomique Paris-Grignon, 222
p.
Smith K. A., 1990. Greenhouse gas fluxes between land surfaces and the atmosphere. Prog.
Phys. Geograph. 14, 349-372.
222

BIBLIOGRAPHIE
Smith R. V., Doyle R. M., Burns L. C., Stevens R. J., 1997. A model for nitrite
accumulation in soils. Soil. Biol. Biochem. 29(8), 1241-1247.
Soohoo C., Hollocher T. C., 1990. Loss of nitrous oxide reductase in pseudomonas
aeruginosa cultured under N2O as determined by rocket immunoelectrophoresis. Appl.
Environ. Microbiol. 56, 3591-3592.
Sorensen P., Jensen E. S., 1995. Mineralization of carbon and nitrogen from fresh and
anaerobically stored sheep manure in soils of different texture. Biol. Fertil. Soils 19, 29-35.
Stams J. M. 1994. Metabolic interactions between anaerobic bacteria in methanogenic
environments. Ant. Van Leeuw 66, 271-294.
Standford G., Vander Pol R. A., Dzienia S., 1975. Denitrification rates in relation to total
and extractable soil carbon. Soil Sci. Soc. Am. Proc. 39, 284-289.
Starr R. C., Gillham R. W., 1993. Denitrification and organic carbon availability in two
aquifers Ground Water 31, 934-947.
Stevens R. J., Laughlin R. J., Burns L. C., Arah J. R. M., Hood R. C., 1997. Measuring
the contributions of nitrification and denitrification to the flux of nitrous oxide from soil. Soil
Biol. Biochem. 29 : 139-151.
Stevens R. J., Laughlin R. J., 1998. Measurement of nitrous oxide and di-nitrogen emissions
from agricultural soils. Nutrient Cycling in Agroecosystems. 52 : 131-139.
Stouthamer A. H., 1973. A theoretical study on the amount of ATP required for synthesis of
microbiol cell material. Antonie van Leeuwenhoek 39, 545-565.
Stouthamer A. H., 1988. Dissimilatory reduction of oxidized nitrogen compounds.
Biological Laboratory, Vrije Universiteit, Amsterdam, The Netherlands, 245-286.
Stumm W., Morgan J. J., 1996. Aquatic chemistry. Chemical equilibra and rates in natural
waters. In Oxydation and reduction. Equilibria and microbial mediation, pp. 425-513. John
Wiley & Sons, New York.
Sudarshana Padma, Knudsen, Guy R., 1995. Effect of parental growth on dynamics of
conjugative plasmid transfer in the pea spermosphere. Applied and Environmental
Microbiology, 3136-3141.
Terry R. E., Tate R. L., 1980. The effect of nitrate and nitrous oxide reduction in organic
soils and sediments. Soil Sci. Soc. Am. J., 44, 744-746.
Terry K. T., Hooper A. B., 1981. Hydroxylamine oxidoreductase: a 20-heme; 200000
molecular weight cytochrome c with unusuel denaturation properties which forms a 63000
molecular weight monomer after heme removal. Biochemistry 20, 7032-7076.
223

BIBLIOGRAPHIE
Thurman E. M., 1985. Organic geochemistry of natural waters, 497 pp. Martinus Nijhoff
and W. Junk Publishers, Dordrecht.
Tiedje J. M., Sexstone A. J., Myrold D. D.,. Robinson J. A., 1982. Denitrification:
ecological niches, competition and survival. Anton Leeuwen 48, 569-583.
Tiedje J. M., 1988. Ecology of denitrification and dissimilatory nitrate reduction to
ammonium. In: Zehnder AJB (ed) Biology of anaerobic microorganisms. pp. 179-244. John
Wiley and Sons, New York.
Thurman E. M., 1985. Organic geochemistry of natural waters. Martinus Nijhoff and W.
Junk Publishers, Dordrecht.
Tortoso A. C., Hutchinson G. L., 1990. Contributions of autotrophic and heterotrophic
nitrifiers to soil NO and N2O emissions. Applied & Environmental
Microbiology 56(6), 1799-1805.
Tsusuki K., Ponnamperuma F. N., 1987. Behavior of anaerobic decomposition products in
submerged soils. Effects of organic material amendment, soil properties and temperature. Soil
Science and Plant Nutrition 33, 13-33.
Unden G., Schirawski S., 1997. The oxygen responsive transcriptional regulator FNR of
Escherichia coli : the search for signals and reactions. Mol. Microbiol. 25(2), 205-210.
Vallès V., Bourgeat F., 1988. Geochemical determination of gypsum requirements of
cultivated sodic soil. In Chemical interactions, Arid Soil Res. Rehabil., 165-177.
Van Cleemput Oswald, Samater Abdullahi H., 1996. Nitrite in soils: accumulation and role
in the formation of gaseous N compounds. Fertilizer Research. 45, 81-89.
Van Spanning Rob J. M., De Boer Anthonius P. N., Reijnders Willem N. M., De Gier Jan
Willem L., Delorme Cécile O., Stouthamer Adriaan H., Westerhoff Hans V., Harms
Nellie, Van der Oost John, 1995. Regulation of oxidative phosphorylation: the flexible
respiratory network of paracoccus denitrificans. Journal of Bioenergetics and biomembranes,
27(5).
Vavilin V. A., Vasiliev V. B., Ponomarev A. V., Rytow S. V., 1994. Simulation model
“methane” as a tool for effective biogas production during anaerobic conversion of complex
organic matter. Biores. Tech. 48, 1-8.
Vinther F. P., Eiland F., Lind A. M., Elsgaard L., 1999. Microbial biomass and numbers of
denitrifiers related to macropore channels in agricultural and forest soils. Soil Biology and
Biochemistry, 31, 603-611.
Watson S. W., 1971. Reisolation of Nitrosospira briensis S. Winogradsky and H.
Winogradsky 1933. Arch. Microbiol. 75, 179-188.
224

BIBLIOGRAPHIE
Weier K. L., Doran J. W., Power, J. F., Walters D. T., 1993. Denitrification and the
dinitrogen/nitrous oxide ratio as affected by soil water, available carbon and nitrate. Soil Sci.
Soc. Am. J., 57, 66-72.
Wijler J., Delwiche C. C., 1954. Investigations on the denitrifying process in soil. Plant Soil,
5, 155-169.
Williams E. J., Hutchinson G. L., Fehsenfeld F. C., 1992. NOx and N2O emissions from
soil. Global Biogeochem. Cy. 6(4), 351-388.
Wood P. M., 1986. Nitrification as a bacterial energy source. In: Prosser, J. I., (Ed.),
Nitrification, IRL, Press, Oxford, 39-62.
Wu J., Jørgensen R. G., Pommerening B. , Chaussod R., Brookes P. C., 1990.
Measurement of soil microbial biomass C by fumigation-extraction – an automated
procedure. Soil Biol. Biochem., 22, 1167-1169.
Xu C., Shaffer M. J., Al-Kaisi M., 1998. Simulating the impact of management practices on
nitrous oxide emissions. Soil Science Society of America Journal 62, 736-742.
Zanner C. W.,. Bloom P. R., 1995. Mineralization, nitrification and denitrification in
histosols of Northern Minnesota. Soil. Sci. Soc. Am. J. 59, 1505-1511.
Zumft G., 1997. Cell biology and molecular basis of denitrification. In: Microbiology &
Molecular biology reviews, 533-616.
225

226
Top Related