


Languages
Pages
Legal

Elsevier Editorial System(tm) for Atmospheric Research Manuscript Draft Manuscript Number: Title: The Cloud and Rain Liquid Water Characteristics of Different Precipitation Regimes in Brazil Article Type: SI: Precipitation Sci Part II Keywords: Cloud Liquid Water, cloud types, Droplet Size distribution, radar, radiometer Corresponding Author: Mr. Luiz Augusto Toledo Machado, Ph.D. Corresponding Author's Institution: INPE - Instituto Nacional de Pesquisas Espaciais First Author: Alan J Calheiros, Ms. Order of Authors: Alan J Calheiros, Ms.; Luiz Augusto Toledo Machado, Ph.D. Abstract: Between 2010 and 2012, the CHUVA project collected information regarding cloud and rain trends in different precipitation regimes in Brazil. CHUVA had four field campaigns, located in the North, Northeast and Southeast regions of Brazil, covering the semi-arid, Amazonas, coastal and mountain regions. The purpose of this study is to present statistics related to the integration of cloud and rain liquid water and the profiles for different cloud types and regimes. The synergy of several instruments allows us to describe the cloud process characteristics and to classify rain events. Microwave radiometer, LIDAR, radar, and disdrometer were employed in this study. The rain type classification was made using vertical profiles of reflectivity (VPR) and polarimetric variables from dual-polarization radar (XPOL). The profiles and integrated cloud liquid water (ILWC) was retrieved with a microwave ground-based radiometer using a neural network. For rainy conditions, the profiles from the liquid water content (LWCR) and their integrated (ILWR) properties were estimated by Micro Rain Radar (MRR) and XPOL VPRs. For non-precipitating clouds, the ILWC values were larger for the sites in Northeast Brazil near the coast than for the other regions. For rainy cases, distinct LWCR profiles and ILWR were observed for different rain classifications and regions with a distinctive rainfall regime. The ILWR for the convective systems show the highest values, followed by stratiform and warm systems. The clouds in the Vale do Paraiba and Belem showed the largest reflectivity in the mixed and glaciated layers, respectively. In contrast, the coastal sites show larger values of cloud and rain liquid water content for non-precipitating and warm clouds. The Vale and Belem clouds present the deepest clouds and larger convective cloud liquid water. Several analyses are presented, describing the cloud process and the differences among the regions.

Dear Silas Michaelides
Please find attached the manuscript “The Cloud and Rain Liquid Water Characteristics of Different
Precipitation Regimes in Brazil” from Alan Calheiros and myself. I would like to submit this
manuscript to the special issues - “Perspectives of Precipitation Science II”. I would like to
apologize for the late submission.
Best Regards
Luiz Machado
Cover Letter

Dear Editor and Reviewers,
This study is one of the first results from the CHUVA project. CHUVA that means rain in Portuguese
is a Project to study the Cloud processes of tHe main precipitation systems in Brazil: A
contribUtion to cloud resolVing modeling and to the GPM (GlobAl Precipitation Measurement).
This study discusses the regional characteristics of the cloud liquid water for different cloud types
and regions. The first four CHUVA campaigns measured specifics targets, the first one focus on the
satellite precipitation estimation of warm clouds as well the second one in Fortaleza. Fortaleza is
also associated to organize cloud clusters from the Ocean, both sites are in Northeast of Brazil. The
third campaign was held in Belém, in the mouth of Amazonas river´s. Belém typical rainfall regime
at this period are the large squall lines that organize precipitation in different space-time scales.
The Fourth Campaign was in a region with intense frequency of thunderstorm, the Paraiba Valley
in Southeast Brazil. The relationship between cloud liquid water and thickness, the cloud droplets
distribution and the cloud and rain liquid water profiles are evaluated. We found interesting
features, the experimental measurements, collected over different rain regimes in Brazil, were
very useful in classifying and regionally defining the cloud processes of warm, deep and stratiform
clouds.
Highlights
Differences among different measurement techniques of the same physical parameter are discussed.
The comparison between adiabatic liquid water content obtained by radiosonde and by
radiometry was very useful for inferring the importance of the entrainment and
coalescence processes.
Regional analyses present the typical warm clouds profiles and integrated values for rain
and no rain clouds.
Different brightness band (form and height) were found for each region in stratiform
clouds.
Best Regards
Luiz Machado
Highlights (for review)

The Cloud and Rain Liquid Water Characteristics of Different
Precipitation Regimes in Brazil
Alan J. P. Calheiros and Luiz A. T. Machado
Instituto Nacional de Pesquisas Espaciais, Centro de Previsão de Tempo e Estudos
Climáticos, Cachoeira Paulista, SP, Brazil
ABSTRACT
Between 2010 and 2012, the CHUVA project collected information regarding cloud and
rain trends in different precipitation regimes in Brazil. CHUVA had four field
campaigns, located in the North, Northeast and Southeast regions of Brazil, covering the
semi-arid, Amazonas, coastal and mountain regions. The purpose of this study is to
present statistics related to the integration of cloud and rain liquid water and the profiles
for different cloud types and regimes. The synergy of several instruments allows us to
describe the cloud process characteristics and to classify rain events. Microwave
radiometer, LiDAR, radar, and disdrometer were employed in this study. The rain type
classification was made using vertical profiles of reflectivity (VPR) and polarimetric
variables from dual-polarization radar (XPOL). The profiles and integrated cloud liquid
water (ILWC) was retrieved with a microwave ground-based radiometer using a neural
network. For rainy conditions, the profiles from the liquid water content (LWCR) and
their integrated (ILWR) properties were estimated by Micro Rain Radar (MRR) and
XPOL VPRs. For non-precipitating clouds, the ILWC values were larger for the sites in
Northeast Brazil near the coast than for the other regions. For rainy cases, distinct LWCR
profiles and ILWR were observed for different rain classifications and regions with a
distinctive rainfall regime. The ILWR for the convective systems show the highest
values, followed by stratiform and warm systems. The clouds in the Vale do Paraiba
and Belem showed the largest reflectivity in the mixed and glaciated layers,
respectively. In contrast, the coastal sites show larger values of cloud and rain liquid
water content for non-precipitating and warm clouds. The Vale and Belem clouds
present the deepest clouds and larger convective cloud liquid water. Several analyses
are presented, describing the cloud process and the differences among the regions.
*ManuscriptClick here to view linked References

1. INTRODUCTION
Clouds cover approximately 67.7% of Earth (Rossow and Shiffer 1999), and it is critical
to know the physical properties of clouds to diagnose Earth’s energy and water balance.
Atmospheric water is found as vapor (gas phase), cloud and rain liquid water (liquid
phase) and different types of ice, such as snow and hail (solid phase) (Rogers and Yau,
1989). The significant variability of hydrometeors is due to the complex atmospheric
physical processes that directly impact the weather conditions and climate. For example,
the quantity of water in the clouds influences the quantity of latent heat and,
consequently, the upward and downward motion within the cloud (Zhao and Carr,
1997). The energy balance is also strongly dependent on the amount of water and ice in
the clouds (Crewell and Lörnert, 2003; Zhao and Weng, 2002), which directly
influences the climate. However, as mentioned by Löhnertet al. (2001), the lack of
information concerning these complex processes, especially with respect to cloud
microphysics, has limited the available parameterizations in high-resolution numerical
models. Unlike other meteorological parameters, the liquid water content of clouds is
not measured operationally, and there is little information about the variability of the
average properties. The importance of this knowledge goes beyond forecasting and
climate modeling: it is also important for the nowcasting of severe events (Greene and
Clark, 1972). According to Pruppacher and Klentt (1997), the cloud liquid water content
varies considerably among clouds, from approximately 0.2 gm-3
in the initial stage of
cumulus cloud development up to 14 gm-3
during severe storms. Cotton et al. (2011) list
a series of characteristics associated with different cloud types, showing that the content
of liquid water varies significantly. For example, stratus cloud liquid water presents
values of approximately 0.05 to 0.25 gm-3
, although cases exist in which these values
range up to 0.6 gm-3
. This is in agreement with Hogan et al. (2005), based on the
synergistic use of many active sensors. Although the maximum found for ordinary
cumulus clouds was 1 gm-3
. However, Lawson and Blyth (1998) found a large
variability. Nonetheless, this value is easily exceeded by systems with large vertical
development, such as cumulonimbus, which can have values above 1.5 gm-3
.
Atlas et al. (1954) and Donaldson Jr. (1955) were among the first to use active remote
sensing to study cloud liquid water content and precipitation. According to Hagen and
Yuter (2003), the relationships between radar reflectivity and water content are not as
frequently considered as ZR relations (radar reflectivity and rain rate, Michaelides et al.,
2010); thus, the authors present several relationships that are applicable to radar
measurements. However, the attenuation effects must be considered to correct the error
sources associated with the content of liquid water, according to Eccles and Mueller
(1971). Recently, Zhao et al. (2013) showed different relationships based on
polarimetric variables to estimate the rainwater content, as well as the effects of
attenuation on the X-band radar retrieval. Meylek et al. (2005) showed several
techniques that allow the estimation of liquid water content, in addition to the synergy
between the various co-located equipment. According Ebell et al. (2010) the use of a
ground based radiometer may assist in the estimation performed by a cloud radar. The
use of passive microwave radiometers to estimate the cloud ILW has been widely
applied (Peter and Kampfer, 1992; Liljegren et al., 2001; Ware et al., 2003; Westwater
et al., 2005; Mätzler and Morland, 2009; Karmakar et al., 2011). The accuracy of these
measurements can achieve 16 gm-2
, depending on the microwave channel, calibration
and weather conditions (Crewell and Lörnert, 2003). The major difficulty is the
partitioning of cloud and rain water content within the same cloud. Based on studies of
the polarization difference signal in raindrops, performed by Czekala and Simmer
(1998) and Czekala et al. (2001), Saavendra et al. (2012) found mean squared errors of
0.144 mm and 0.052 mm, respectively, for cloud and rain liquid water content during
precipitation events using active and passive sensors.
The goal of this study is to determine the water content of precipitating and non-
precipitating clouds, using passive and active sensors in several field experiments
throughout Brazil during the CHUVA project campaigns, further characterizing the
quantities both regionally and by cloud type. This work presents the main differences
between the profiles of liquid water content (LWC) and the corresponding integrated
liquid water (ILW) for the various regimes of precipitation over the continental and
coastal regions in tropical or subtropical latitudes and their differences with respect to
the cloud types observed. This study discusses the different results obtained with the
different sensors and the limitations and errors associated with each type of
measurement.
2. DATA AND METHODS
2.1 The CHUVA project
The CHUVA project [Cloud process of the main precipitation system in Brazil: A
contribution to cloud resolving modeling and the GPM (Global Precipitation
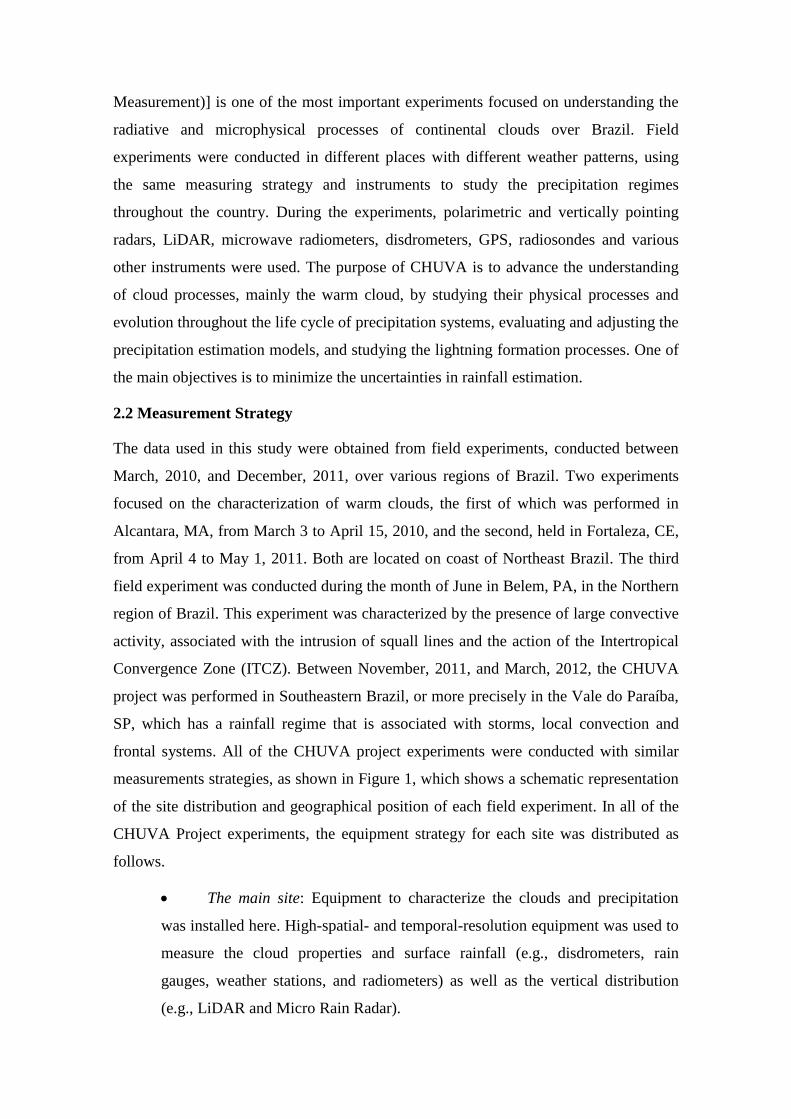
Measurement)] is one of the most important experiments focused on understanding the
radiative and microphysical processes of continental clouds over Brazil. Field
experiments were conducted in different places with different weather patterns, using
the same measuring strategy and instruments to study the precipitation regimes
throughout the country. During the experiments, polarimetric and vertically pointing
radars, LiDAR, microwave radiometers, disdrometers, GPS, radiosondes and various
other instruments were used. The purpose of CHUVA is to advance the understanding
of cloud processes, mainly the warm cloud, by studying their physical processes and
evolution throughout the life cycle of precipitation systems, evaluating and adjusting the
precipitation estimation models, and studying the lightning formation processes. One of
the main objectives is to minimize the uncertainties in rainfall estimation.
2.2 Measurement Strategy
The data used in this study were obtained from field experiments, conducted between
March, 2010, and December, 2011, over various regions of Brazil. Two experiments
focused on the characterization of warm clouds, the first of which was performed in
Alcantara, MA, from March 3 to April 15, 2010, and the second, held in Fortaleza, CE,
from April 4 to May 1, 2011. Both are located on coast of Northeast Brazil. The third
field experiment was conducted during the month of June in Belem, PA, in the Northern
region of Brazil. This experiment was characterized by the presence of large convective
activity, associated with the intrusion of squall lines and the action of the Intertropical
Convergence Zone (ITCZ). Between November, 2011, and March, 2012, the CHUVA
project was performed in Southeastern Brazil, or more precisely in the Vale do Paraíba,
SP, which has a rainfall regime that is associated with storms, local convection and
frontal systems. All of the CHUVA project experiments were conducted with similar
measurements strategies, as shown in Figure 1, which shows a schematic representation
of the site distribution and geographical position of each field experiment. In all of the
CHUVA Project experiments, the equipment strategy for each site was distributed as
follows.
The main site: Equipment to characterize the clouds and precipitation
was installed here. High-spatial- and temporal-resolution equipment was used to
measure the cloud properties and surface rainfall (e.g., disdrometers, rain
gauges, weather stations, and radiometers) as well as the vertical distribution
(e.g., LiDAR and Micro Rain Radar).
The radar site: Polarimetric radar was installed at this site. Two scan
strategies were performed, including a volume scan and Height Indicator Range
(RHI). The latter was oriented over the main site.
The radiosonde Sites: At least three sites were used to characterize the
thermodynamic operating systems every 6 hours (00, 06, 12, 18 GMT), except
for Alcantara where only one site was used.
2.3 Instrument and Limitations
To analyze the liquid water content in the non-precipitating clouds, a ground-based
MP3000A radiometer was used (Radiometrics Corp., Ware et al., 2003). This
instrument measures the passive radiation at microwave wavelengths in 35 channels,
ranging from 22.00 to 30.00 GHz (21 channels), associated with the emission by water
vapor, and from 51.00 to 59.00 GHz (14 channels), associated with the emission by
oxygen molecules. Details regarding the physical principles can be found in Westwater
et al. (1993 and 2005). The MP3000A is a robust instrument designed to handle the
most diverse weather conditions. The most sensitive structural part of the instrument is
the radome (Rose et al., 2005) through which the radiation passes before reaching the
receiver. Problems associated with precipitation and condensation on the radome may
produce erroneous estimations of atmospheric parameters. Even when the radome is
built with a hydrophobic material and fitted with a Superblower, the presence of water
during precipitation events influences the signal. This generates unreliable
measurements. Thus, only measurements in moments without rain were considered.
Another uncertainty in the measurements performed by radiometers is related to the
errors in instrument calibration (Skou and Vine, 2006). To avoid these problems,
calibration was performed using liquid nitrogen (Hardy, 1973) before each campaign,
and during the measurements, tip calibration was applied (Han and Westwater, 2000;
Cimini et al., 2003). Other uncertainties associated with retrieval are described by
Hewison (2006). For cases associated with rain clouds, the rain integrated liquid water
content (ILWR) and the rain liquid water (LWCR) content profiles were determined
using the vertical profiles of reflectivity (VPR) of two radar systems, Micro Rain Radar
(MRR, Peters et al., 2005; Leueberger, 2009) and mobile radar (Selex Meteor 50DX for
all sites except Alcantara, where a fixed EEC X Band Dual Polarization was employed),
including X-band and dual-polarization at 9.365 GHz (XPOL). Both radar systems
suffer attenuation effects as a result of rain (see Peters et al., 2010; Doviak and Zrnic,

1993), which can affect and represent the differences in the estimates of LWCR/ILWR
between them. The measurement strategy covered the distance from the main site to the
radar site, which did not exceed 22 km, to minimize the effects of attenuation.
Additionally, attenuation corrections were applied to both radars. Nevertheless,
depending on the intensity of precipitation, attenuation can be very strong, particularly
for MRR. Moreover, the updrafts and downdrafts can cause significant variations in the
droplet distribution estimations, which is directly reflected in the reflectivity
determination of MRR (Peters et al. 2005). Hence, the presence of deep convective
systems can cause erroneous liquid water content in MRR measurements; therefore,
MRR was not used for this purpose.
2.4. The Liquid Water Calculation
During the CHUVA Project experiments, the MP3000A performed continuous
thermodynamic soundings in all weather conditions with a temporal resolution less than
2.5 minutes. This measurement provides the temperature (K), relative humidity (%), and
liquid water (g/m3) profiles up to 10 km in height, as well as the water vapor (mm) and
liquid water (mm) integrations. The retrieval of these parameters was performed using
neural networks (Solheim et al. 1998). Historical radiosondes data sets from locations
near the sites of each campaign were used for network training. The retrieval for the
cloud integrated liquid water (ILWC) content by ground-based radiometer was made
only for conditions without rain. According to Won et al. (2009), the formation of rain
in clouds can influence the signals received by ground-based radiometers for up to 2
hours before the rain begins, while the greatest difference between microwave channels
can be observed within 30 minutes prior to the rainy event. Therefore, for the analysis
of the non-precipitating clouds, ILWC values were not estimated in the period of 30
minutes before and after the rain so that the raindrop presence in the clouds would not
influence the ILWC estimation. Such rainy events were classified from the
measurements made by disdrometers, which were installed at each main site. Further, to
reduce the effects on the MP3000A estimations of large amounts of raindrops in the
non-precipitating clouds, only events in which the maximum reflectivity of VPR, as
measured by XPOL radar, was less than 20 dBZ were considered. According to
Marshall and Palmer (1948) and Marshall and Gunn (1952), such reflectivity values are
associated with a droplet distribution that can cause a rain rate of approximately 0.25
mm/h. Further, detailed analysis of the data allowed the elimination of peak instances
associated with estimation errors of the cloud base by radiometer in addition to the
periods in which dew had formed on the radome. For radiosondes, the methodology
applied by Ingold et al. (1998) was used to calculate the values of adiabatic LWCadia and
the integrations (ILWadia). These values were calculated only for non-precipitating
events. The classification used to determine the events without rain was based only on
the measurements provided by the disdrometer at each main site, where only the cases
without precipitation events for 3 hours before and after the sounding launch were used.
The characterization of the total liquid water content in a given cloud at any given can
only be performed by using several aircraft, which must simultaneously profile the
cloud. It is not possible to specify the mixed layer thickness of ice and water or the
densities through indirect measurement. Thus, we chose to perform only two distinct
analyses, the non-precipitating event mentioned above and another for clouds with rain.
In the latter, only the amount of liquid water in the warm part of the cloud was
considered, i.e., the cloud base, measured based on the lifting condensation level (LCL)
to a value below the melting level. This approach was selected due to the bright band
(BB) effect that occurs in stratiform clouds, which is characterized by a peak of
reflectivity that can provide an erroneous LWCR estimation. The sudden change of
reflectivity in this layer is associated with changes in the refractive index with respect to
the thickness of the water film around the melting hydrometeor (Battan, 1973; Houze,
1996). Thus, the ILWR is calculated by integrating the LWCR of the LCL up to a height
of 1 km below the 0°C mean level of each experiment. This layer is considered to be the
layer that can potentially transform into precipitation. To determine the average freezing
level and LCLs, we used the nearest, both spatially and temporally, radiosonde with
respect to each VPR.
The estimated LWCR by XPOL is based on VPR, which in turn is determined by the
mean reflectivity of 500 m around the main site with a vertical resolution of 200 m.
Thus, the XPOL LWCR was estimated using the methodology of Greene and Clark
(1972). In addition to removing the BB effect, other corrections must be performed,
such as those associated with strong signal attenuation by rain. In the MRR correction, a
path-integrated attenuation was used (PIA), according to Peters et al. (2010). The XPOL
correction methodology is described in Schneebeli et al. (2012). For Alcantara, as
different radar systems were employed, a specific bias adjustment was applied using a
co-located MRR radar. Further, radar systems can present surface noise effects, such as

radio frequency. Therefore, to avoid the noise associated with ILWR values, for both
radar types, the threshold must exceed MRRNOISE=0.004 mm and XPOLNOISE=0.025
mm. These thresholds are based on the observed distributions in which the LiDAR
identified the absence of clouds. The rainfall events for each site were identified as the
events whose precipitation, as measured by disdrometer, was greater than 0.1 mm/h.
4. RESULTS
4.1 Cloud Liquid Water
Figure 2 shows the relative frequency histograms of ILWC (a) and ILWadia (b) for all
CHUVA project experiments used in this work, the statistics of which can be viewed in
Table 1. As shown in Figure 2, the majority of the distributions are relatively similar,
except for Alcantara, which is characterized by proportionally more cloud liquid water
content, as measured by the radiometer. It is our belief that the adiabatic method is quite
realistic. In principle, the entrainment effect reduces the liquid water content more than
that estimated by adiabatic processes. However, the microphysical (in particular,
coalescence) and non-adiabatic effects tend to generate higher contents of liquid water.
For Alcantara and Fortaleza, which are the sites located closest to the coast, it was noted
that the last two effects dominate, due to the higher measures of liquid water content in
the clouds, which is particular true for Alcantara.
Table 1 shows the mean values, standard deviations and estimation methodology for
each region. At Alcantara, the mean value for ILWC is 0.36 mm, which is the largest
value obtained from the sites. According to Lohnert and Crewell (2003), an ILWC above
0.4 mm may be associated with the existence of raindrops that strongly affect the
microwave brightness temperatures. During the experiment, the presence of virga was
observed, despite the fact that the site’s thermodynamic properties did not promote
precipitation. This shows that the presence of warm clouds over this site led to rapid
droplet formation processes, generating clouds with high values of ILWC. It is evident
in Figure 2a that, above 0.2 mm, large populations of Alcantara clouds exist. However,
in the adiabatic distributions (Figure 2b), not co-located with the radiometer, the
frequency of values above 0.6 mm is significantly lower in comparison to the
radiometer estimates. Thus, the microphysics and non-adiabatic processes are
emphasized as the predominant processes in Alcantara in particular, although they also
occur in the other sites.
Vale do Paraiba has the lowest liquid water content, while Belem and Fortaleza have
similar values. As previously mentioned, the non-precipitating clouds in Alcantara, on
average, have values that are approximately 2.5 times larger than that of the Vale.
Although Belem and Fortaleza presented similar mean values (approximately 0.23 mm),
Belem had a number of events without rain, which was significantly fewer than that of
Fortaleza. This finding suggests that, when clouds are present in Belem, they quickly
develop into deep convection clouds, which are associated with precipitation. Generally,
Table 1 shows that the average behaviors of the adiabatic estimates are higher than that
estimated by the radiometer for the more continental sites. This finding stresses the
importance of the entrainment process of the non-saturated air within clouds causing the
evaporation of droplets and the consequent reduction of the LWC values in these
regions.
The Fortaleza experiment LiDAR and ground-based radiometer systems were co-
located to analyze the relationship between the cloud thickness and the non-
precipitating liquid water content. Figure 3 shows boxplots with the values of liquid
water for each cloud layer, in ranges of 100 meters. After analyzing this relation, we
note that the median ILWC increases with cloud thickness. Further, it is evident from the
figure that there is greater variability in the values obtained for thicker clouds. It should
be noted that only layers below 300 m were observed. Korolev et al. (2007), working
with ice stratus clouds, found a linear relationship between ILW and cloud thickness. In
the present study, the clouds are non-rainy and are significantly thinner than those
studied by Korolev et al.
4.2 Rain Liquid Water
4.2.1. Integrated Liquid Water
This section analyzes the distribution of rain liquid water content, integrated up to 1 km
below the freezing level. Figure 4 shows the distribution of the ILWR measurements,
estimated by MRR (a) and XPOL (b), for the CHUVA sites. However, at Alcantara,
MRR was not used in the vertical orientation; instead, it was employed at a slant,
pointed toward the XPOL radar. The statistics for the different combinations discussed
here also can be observed in Table 1. In this case, to generate the values of Table 1, we
applied a filter, limiting the estimate of LWCR for the LWC maximum observed on the
disdrometers during each campaign to avoid unrealistic values. ILWR values above 1.5
mm were observed and were included in the statistical computations, although they are
not shown in Figure 4 due to their low frequency in comparison to the lower values.
Upon the inspection of both figures, the rainwater content in the analyzed layer is higher
than estimated by XPOL when compared to the MRR data for most of the sites. This
result is expected, given the larger attenuation at 24 GHz MRR than 9.36 GHz in
XPOL. Further, the XPOL measurement strategy favors the upper layers, in comparison
to MRR.
Table 1 shows that the Fortaleza site yielded the most significant difference between the
MRR and XPOL data for the ILWR estimation. This may be due to the presence of
larger drops in the analyzed layer, which also has the highest attenuation signal.
However, it is important to recall that such measurements were not obtained for
Alcantara; therefore, this result cannot be evaluated in this region. Nonetheless, the
smallest difference was observed in the Vale, which possibly could be associated with
greater numbers of smaller raindrops. Further details on the drop size distribution are
given in later sections. Generally, Figure 4a shows that the ILWR distributions are
similar among regions based on MRR, which may be the result of attenuation, as
mentioned previously. However, further details can be observed by XPOL. Figure 4b
shows that the highest values were associated with Fortaleza, which had an average of
0.58 mm, followed by Alcantara at 0.47 mm. These high values may be associated with
the conditions of environments that are rich in hygroscopic aerosols, which could
contribute to the efficient development of convective rain formation in these regions.
The ILWR values in Belem and Vale are lower than the values of the other sites. This
could be linked to the process of cold cloud formation because both regions are
characterized by strong convective activity, as evidenced by higher rain rates (above 60
mm/h) (see Table II), which are related to deep convective clouds.
In addition to the ILWR values in the liquid cloud layer, the VIL for the mixture (0 to -
20 °C) and glaciated (-20 to -40 °C) layers were also calculated. The events observed in
the Vale do Paraiba and Belem regions (Table 1) yielded the highest values. Because
the convection over this region is intense, where the presence of squall lines and other
convective systems are observed, updrafts can cause the rise of super-cooled water in
higher layers, which may increase the VIL values significantly. The Vale do Paraiba is a
typical example, where the mixed layer is superior to all other regions, and Belem has
the highest values in the glaciated cloud layer. From these results, we can conclude that,
in Fortaleza and Alcantara, the layers below zero degrees in temperature have higher
liquid water contents than the more continental sites, most likely because larger
raindrops are present. However, the clouds in Belem and Vale have more developed ice
stages and higher rain rates. In comparison, Vale has a more developed mixed layer,
while Belem has a more developed glaciated layer.
4.2.2 The Integrated Liquid Water contents of the different cloud types.
This section analyzes the average behaviors and distributions that are associated with
the different types of precipitation. The classifications of deep convective, stratiform
with bright band and warm clouds are based on information from the XPOL RHI
profiles and the local radiosondes. The first classification level is associated with the
identification of warm rain events for which the whole profile of reflectivity must be
below 0°C. The next step is to identify the bright band in stratiform events, as described
above, based on the work of Fabry and Zawadzky (1995). The classification is applied
as a function of the vertical variation of radar reflectivity (dZ/dh, dBZ/km) and the
polarimetric ρHV variable (the co-polar correlation coefficient), described by Zrnic et al.
(1994). If the BB is not found and the reflectivity is greater than the 39-dBZ threshold,
then the system is classified as convective (Awaka et al., 2007). Clouds not filling these
conditions were not classified.
Table 1 shows that, while warm and stratiform clouds had similar liquid water contents,
the convective events were significantly higher. The ILWR distributions for the three
classes and for each site can be observed in Figure 5. Because the histogram associated
with the warm clouds shows larger values than that of the stratiform clouds for a few
cases, the charts were limited to 2.5 mm. It can be observed in Figure 5a,b that the
values above 0.6 mm occur more frequently in warm than stratiform clouds. However,
the smallest values were also observed for the warm clouds. This explains the
similarities observed between the mean values of the general classification, presented in
Table 1 (the final lines). Table 2 shows the frequency of events classified by each VPR,
related to rain rates greater than or equal to 0.1 mm/h and associated with different types
of clouds (convective, stratiform with bright band and warm); thus, the mean rain rate is
also considered. Note that Table 2 refers only to the specific cloud types described
before, clouds such as multilayers, high clouds, stratiform clouds without bright band,
and weak convective clouds (Z<39 dBZ) were not considered. It can be observed that
Vale and Belem have the largest rainfall intensity for convective clouds and that
Alcantara has the largest for the warm and stratiform clouds. The reason for this
behavior is discussed further. Note that, in Figure 5, the observed events varied
significantly by region, where the mean values of the ILWR can be observed in Table 1.
For the sites located near the coast, the liquid water content that was associated with
warm clouds (Figure 5a) was higher than the contents observed in Belem and Vale do
Paraiba, where the frequency of events with ILWR below 0.5 mm was greater. However,
with respect to stratiform clouds, as observed in Figure 5b, the values were similar to
the Vale do Paraiba, Belem and Fortaleza regions. Even so, the largest estimated values
were observed in Alcantara, where the stratiform clouds had a more active liquid layer,
as presented subsequently. The high liquid water content in the liquid layer classified as
stratiform could be associated with the active warm clouds. Active warm clouds can
grow to a few meters above the freezing level, thereby creating a thin layer of ice.
However, the observed rainfall is associated with rain processes in warm clouds. The
convective events presented in Figure 5c show the highest liquid water contents,
particularly in Fortaleza, where several severe events with ILWR greater than 8 mm
were observed. Belem and Vale had similar distributions because the processes of cold
clouds were prevalent in these regions. The convective clouds over the Vale were
observed to have high precipitation efficiency; that is, even with the lowest ILWR
content, these clouds generated the highest rain rates (see Table 2). Alcantara, in turn,
showed the lowest liquid water content, despite also exhibiting the largest liquid water
content of non-rainy clouds. This is most likely due to the inhibition of deep convective
clouds, which was observed a few times. Moreover, the convective clouds have specific
maximums, which must be associated with the occurrence of different droplet size
distributions in each region, as discussed in the next section. Generally, only in
Fortaleza did the ILWR measurements for the warm clouds have larger values than that
of the stratiform clouds. In Alcantara, the values were slightly smaller, and in Belem
and Vale, the ILWR was significantly lower for the warm system than the stratiform
system, which was particularly true in Vale. For the latter, this result could be related to
the formation of young cells, which are associated with storm propagation over the site.
4.2.3. Vertical LWCR Profiles for the Different Cloud Types
In the previous section, we determined that an intrinsic relationship exists between the
distributions of rain liquid water and the different types of precipitating events observed
in each region. Our analysis of the vertical profiles of these distributions showed which
layer is more important within the analyzed systems, as well as how that layer varies.
This is an important parameter for modeling radiative processes and is useful in satellite
meteorology. Figure 6 shows the mean profiles of LWCR (gm-3
) for each site, as
estimated by XPOL for warm, stratiform and convective clouds. The MRR profiles
were not displayed due to the effect of rainfall attenuation, which was associated with
convective events; in such cases, unrealistic results are obtained for the upper levels.
Further, the figure shows that the warm events that have the lowest liquid water content,
followed by stratiform events, which occur in the layer between the LCL and 0°C-1 km
in height. The effect of the bright band, which is disregarded in this study, is evident in
the figure in addition to the large contents of liquid water observed in the convective
clouds, as expected.
Figure 6a shows a significant difference between the coastal warm cloud profiles, in
which significantly more liquid water was observed, and the continental warm cloud
profiles. Further, the mean profiles of the stratiform clouds (Figure 6b) show that the
bright band height observed near the coast is higher than that of the continental clouds.
The mean freezing level is 4.9 km at Fortaleza and Alcantara, 4.5 km at Belem and 4.4
km at the Vale do Paraiba. The warm processes in the coastal clouds would benefit from
the presence of a larger layer at the coast than in the continental systems, which would
consequently provide a comparatively longer time for droplet development, yielding
larger droplets. Additionally, it is important to consider that both of the coastal sites are
in regions predominated by subsidence. The subsidence reduces the deep convective
process, increasing the lifetimes of the non-raining clouds and the warm cloud
processes. As already mentioned, a significant amount of liquid water was observed in
the liquid layers in the stratiform clouds at Alcantara. It is possible that some of these
clouds were not stratiform but, instead, were warm clouds exhibiting the strong
development of a liquid phase and the formation of a small ice cap on top, causing them
to be classified as stratiform. There are also similarities between the events observed at
the Vale do Paraiba and Belem, as well as in the clouds found in the Alcantara and
Fortaleza regions. However, if we look at the rain rates of the stratiform clouds over the
sites, as detailed in Table 2, we note that higher values can be observed for Vale than
Belem. The same is true for Alcantara in comparison to Fortaleza. This could be the
reason that the biggest raindrops were observed in Vale and Alcantara, as noted in the
next section. With respect to convective clouds (Figure 6c), Belem showed events with

higher LWCR in the glaciated layer, while Vale presented higher values in the mixed
layer. The highest values at Fortaleza occurred in the liquid layer, especially at
elevations below 3 km, where the average LWCR reached 1.8 gm-3
. The brightness
bands were higher at Alcantara and Fortaleza, which can be associated with the aloft ice
structure. Because these sites also presented clouds with less deep development, the
higher brightness band can be related to the rapid melting of ice into low density ice
clouds above the melting layer.
4.2.4. Surface Raindrop Size Distribution
Understanding the raindrop size distribution (DSD) for the different systems over the
sites is essential for rain characterization as well as for our understanding of the
processes and differences between all of the previously analyzed distributions (Hu and
Srivastava, 1995; Martin et al., 2010). DSD varies with precipitation intensity, cloud
type, location and measurement instrument (Tokay and Short, 1996; Tokay et al., 2001;
Caracciolo et al., 2006; Islam et al., 2012). Figures 7a,b,c show the average
concentrations (mm-6
m-3
) of raindrops with respect to raindrop diameter (mm), as
observed by PARSIVEL disdrometer for all sites and rain classifications. These
distributions confirm the previous results. With respect to warm clouds (Figure 7a),
Alcantara exhibited the largest droplets, while Vale had the highest concentration of
smaller raindrops, with these two locations demonstrating the highest and lowest rain
rates, respectively. The warm clouds in Belem show drops up to 4.5 mm in diameter,
while Fortaleza yielded a maximum of approximately 4 mm, and at Alcantara, the
maximum was nearly 8.5 mm. Moreover, in Vale, the events with frequencies similar to
that of Fortaleza (Table 2) also exhibited significantly lower rain rates. This finding
indicates that the warm cloud layer near the coast has a higher rain liquid water content
and is more efficient at raindrop formation. The distributions for the stratiform clouds
(Figure 7b) are usually similar. However, peculiarities can be observed in the Alcantara
measurements. Where the systems showed the highest contents of liquid water, higher
concentrations of drops between 1 and 2.5 mm in size were observed in comparison to
that of other sites; additionally, diameters up to 4.5 mm were noted. This feature could
be related to the warm clouds, which develop their dynamics in lower layers but retain
ice covers above the freezing level, as already discussed. The biggest raindrop in this
classification was observed at Vale (5.5 mm). With respect to the convective DSDs
(Figure 7c), the largest droplets and concentrations formed by the intense systems of the

Vale and Belem are evident and are less significant in Alcantara. However, Fortaleza
showed a higher concentration of drops larger than 6 mm, which explains the high
values of liquid water observed in the previous analyses. The distributions in Belem and
Vale presented similarities up to 5.5 mm. The Vale clouds were followed by Fortaleza
clouds (in order of decreasing size); at the first site, the concentration of larger drops
was slightly higher, reflecting the organization of the convective clouds generated over
Southeast Brazil.
The contribution of each class of raindrop to the total liquid water content was
computed using the values of LWCDi (the LWC only for a particular drop, Di) and the
total LWC observed for each DSD. Figures 7c,d,e show the diameter contribution (%)
for the LWC, based on each classification. Figure 7c shows that the warm events in
Vale do Paraiba are more influenced by raindrops smaller than 1 mm. In contrast, the
events in Fortaleza are more highly associated with drops between 1 and 2 mm in
diameter. Belem and Alcantara showed similar behaviors up to diameters of 3 mm,
where the maximum was associated with drops measuring approximately 1.5 mm,
which is the same size as that for Fortaleza. However, it was observed that larger
raindrops have higher contributions to the total liquid water content in Belem and Vale
than in Fortaleza. Among the sites studied, Alcantara presented the most significant
contribution of larger drops in the total liquid water content of warm clouds, which
confirms the previous analyses. Stratiform clouds (Figure 7d) showed a similar
distribution. However, there was a greater contribution of drops below 1.5 mm in size at
Vale and Fortaleza, while above this diameter, the greatest contributions were obtained
at Belem and Alcantara. Unlike what was observed for the integrated liquid water
content, the results from Belem and Alcantara exhibit similar characteristics, with Vale
and Fortaleza being more similar to each other. The convective clouds (Figure 7e)
observed in Alcantara received greater contributions from raindrops measuring 2 and 3
mm, while at the other sites, larger raindrops were the most important. This result was
particularly true at Vale, where the highest rain rates were observed.
4.2.5. The precipitation system and mean ILWR
Understanding the average behavior of the rain liquid water content according to its
intensity is essential to determine relationships that can be applied for improvements in
satellite precipitation estimations and numerical weather forecasting models. Figure 8
shows the XPOL estimated ILWR values for the events, classified according to their
precipitation intensity, i.e., light (1 to 2.5 mm/h), moderate (2.5 to 10 mm/h), intense
(10 to 50 mm/h) and severe rain (more than 50 mm/h). The values tend to increase
gradually with the precipitation rate, and in some cases, this increase is more
pronounced, such as in Fortaleza. Our analyses of the rain intensity show as the rain rate
increases, the liquid water content also increases, specifically within the rain layer up to
a 1 km below the 0°C elevation. It is also worth noting that, in the light to moderate
event classifications, a growth of the mean ILWR values can be observed, even if small.
This slope is steeper from the moderate to intense rainfalls, and increasing with rainfall
next class, which further increases the regional variability. As shown by our results,
both the regional and cloud type variability are significant, depending on several
features, such as drop size and concentration, cloud layer and the ice processes. Table 2
and Figure 7 show that the raindrop formation processes result in different rain rates,
which are related to the variations in DSDs, as shown in the previous section. Therefore,
it is not possible to define a universal relationship between ILW and RR. Each region
and cloud type has a specific behavior. Based on our results, for the warm processes, the
thermodynamic properties (deep convection inhibition) and aerosols (rich coastal
aerosol) should be taken into account. For deep convective clouds, this relationship
should consider the processes that occur in the mixed and glaciated layers. Meanwhile,
for stratiform clouds, this relationship appears to be significantly more universal, except
for the fact that some clouds appear to be classified as stratiform but exhibit distinct
behaviors (i.e., warm clouds with ice caps).
5. CONCLUSION
The experimental measurements, collected over different rain regimes in Brazil, were
very useful in classifying and regionally defining the cloud processes of warm, deep and
stratiform clouds. The cloud liquid water content of non-precipitating events in
Northeast Brazil, in the coastal region, and in the regions characterized by significant
subsidence, tends to generate higher values than those over the continent and in which
deep convective processes are more noticeable. The adiabatic liquid water content
obtained by radiosonde was very useful for inferring the importance of the entrainment
and coalescence processes. In comparing the adiabatic liquid water estimation with that
obtained by radiometry, we observed that clouds on coastal sites contain more measured
liquid water than the clouds of continental sites, when compared according to adiabatic

calculations. This result can be related to the occurrence of more important coalescence
processes at the coastal sites, in contrast to more entrainment at the continental sites
(less liquid water than the adiabatic calculations). This calculation is performed for non-
raining clouds, where the large amounts of highly hygroscopic aerosols and the larger
deep convective inhibition can favor this behavior. However, for deep convective
systems, the continental clouds are significantly more efficient in the production of
rainfall than the coastal clouds. The ILWC and thickness of the cloud layer have a
positive relationship; however, the larger variations of ILWC with cloud thickness do
not allow a single relationship to be established.
The integrated rain liquid water content (from the cloud base up to 1 km above the
melting layer) was similar between Fortaleza and Alcantara, as well as between Vale do
Paraiba and Belem. This reflects the individual characteristics of the precipitation
regimes of the clouds in these regions. The most significant values were observed in the
coastal region, which according to our analysis could be associated with warm cloud
processes. Meanwhile, the upper layers showed higher values in Vale do Paraiba and
Belem. This indicates the presence of cold cloud processes because these regions are
known for their well-developed convective systems and high rain rates. With respect to
the different types of rainy systems, it was noted that the LWCR and ILWR of the liquid
water cloud layers were higher in convective events than other systems. Meanwhile, a
small difference was observed among the ILWR for the warm and stratiform clouds.
However, our regional analyses showed that the values of liquid water content were
higher in the warm clouds for sites near the coast than those observed over the
continental sites, particularly for Alcantara. The warm clouds in Vale had the lowest
values of liquid water. Coastal stratiform events have high water content in the liquid
water layer, most likely due to the presence of clouds with ice caps, causing them to be
classified as stratiform but with warm cloud processes. It was noted that the clouds at
Vale do Paraiba exhibit more intense processes in the mixed layer than any other cloud
types. This is most likely due to the large amount of supercooled water; additionally, in
this field campaign, several thunderstorm and hailstorms were reported. In Belem, we
found clouds with more important glaciated layers and high cloud tops. The stratiform
clouds showed different brightness band signatures. The clouds in the coastal regions
presented closer brightness bands to the melting layer than the others. This is most
likely due to the occurrence of faster ice melting here than in the regions where deep
convective clouds are more pronounced.
With respect to raindrop size, it was noted that, except for stratiform clouds, convective
events, whether shallow or deep, vary significantly between sites. Such behavior reflects
the dominant microphysical processes of each region. The DSDs for warm clouds on
the coast confirm that higher ILWs are associated with larger raindrops. A specific
range of raindrops can cause differences in the rainfall observed at each site, as well as
the LWC values. It was noted that certain diameters have a greater effect on the total
liquid water content, which depends on the system observed and the location where the
rain was generated. This is a reflection of the predominant rain process in the cloud. The
evaluation of the rain liquid water behavior in relation to the rain rate intensity showed
that there is significant variability in the values associated with cloud type. It was also
observed that as the rain intensity increases, the rain liquid water content is increased.
The relationship between ILW and RR is strongly associated with the observed cloud
type. However, developing a universal association with these variables is complex and
requires ancillary information.
Although there are similarities among the mean water distributions of the studied sites,
it was evident that significant variability exists in the cloud liquid water values and
precipitation, which includes the microphysical, adiabatic and non-adiabatic processes
at each site.
Acknowledgements. This work was supported by FAPESP grant No. 2009/15235-8 and
CNPQ No. 140818/2011-1. We also thank the CHUVA campaign team for their efforts
to help with equipment function.
6. REFERENCES
Atlas, D., 1954: The Estimation of Cloud Parameters by radar. J. Meteor. (11), 309–
317.
Awaka, J., Iguchi, T., Okamoto, K., 2007. Rain Type Classification Algorithm, In
Measuring Precipitation from Space. Advances in Global Change Research (28), pp
213-224.

Battan, L.J., 1973: Radar Observation of the Atmosphere. The University of Chicago
Press, Chicago.
Caracciolo, C., Prodi, F., Uijlenhoet, R., 2006. Comparison between Pludix and
impact/optical disdrometers during rainfall measurement campaigns, Atmospheric
Research (82), Issues 1–2, 137-163.
Cimini, D., Westwater, E.R., Han, Y., Keihm, S.J., 2003. Accuracy of Ground-based
Microwave Radiometer and Balloon-Borne Measurements During WVIOP2000 Field
Experiment, IEEE T. Geosci. Remote (41), 2605–2615.
Czekala, H. Simmer, C., 1998. Microwave radiative transfer with nonspherical
precipitating hydrometeors, J. Quant. Spectrosc. Radiat. Transfer, 60(3), 365–374.
Czekala, H., Crewell, S., Simmer, C., Thiele, A., 2001. Discrimination of cloud and rain
liquid water path by groundbased polarized microwave radiometry, Geophys. Res. Lett.,
28(2), 267–270.
Cotton, W.R., Bryan, G.H., van den Heever, S.C., 2011. Storm and cloud dynamics,
Academic Press.
Crewell, S., Loehnert, U., 2003. Accuracy of cloud liquid water path from ground-based
microwave radiometry: 2. Sensor accuracy and synergy, Radio Sci., 38(3), 8042.
Donaldson, R.J., 1955. The Measurement of Cloud Liquid-Water Content by radar. J.
Meteor., 12, 238–244.
Doviak, R.J., Zrnic, D.S., 1993. Doppler Radar and Weather Observations. Academic
Press New York, NY, USA, 2nd
edition, 562 pp.
Ebell, K., Löhnert, U., Crewell, S., Turner, D.D., 2010. On characterizing the error in a
remotely sensed liquid water content profile, Atmospheric Research (98), Issue 1, 57-
68.
Eccles, P.J., Mueller, E.A., 1971. X-Band Attenuation and Liquid Water Content
Estimation by a Dual-Wavelength Radar. J. Appl. Meteor. (10), 1252–1259.
Fabry, F., Zawadzki, I., 1995. Long-Term Radar Observations of the Melting Layer of
Precipitation and Their Interpretation. J. Atmos. Sci. (52), 838–851.
Greene, R., Robert, D.R., Clark, A., 1972. Vertically Integrated Liquid Water – A New
Analysis Tool. Mon. Wea. Rev. (100), 548–552.
Hagen, M., Yuter, S.E., 2003. Relations between radar reflectivity, liquid-water content,
and rainfall rate during the MAP SOP. Q.J.R. Meteorol. Soc. (129), 477–493. doi:
10.1256/qj.02.23
Han, Y., Westwater, E.R., 2000. Analysis and improvement of tipping calibration for
ground-based microwave radiometers. Geoscience and Remote Sensing, IEEE Tras.
(38), Issue 3, 1260 – 1276.
Hardy, W.N., 1973. Precision Temperature Reference for Microwave Radiometry. IEEE
Trans. Microwave Theory (21), 149-150.
Hewison, T.J., 2006. Profiling Temperature and Humidity by Ground-based Microwave
Radiometers, PhD Thesis, University of Reading.
Hogan, R.J., Gaussiat, N., Illingworth, A.J., 2005. Stratocumulus Liquid Water Content
from Dual-Wavelength Radar. J. Atmos. Oceanic Technol. (22), 1207–1218.
Houze, R. A. Jr., 1993. Cloud Dynamics. 573 pp., Academic, San Diego.
Hu, Z., Srivastava, R.C., 1995. Evolution of raindrop size distribution by coalescence,
breakup, and evaporation: theory and observations. Journal of the Atmospheric Sciences
(52), 1761–1783.
Ingold, T., Peter, R., Kämpfer, N., 1998. Weighted mean tropospheric temperature and
transmittance determination at millimeter-wave frequencies for ground-based
applications, Radio Sci. (33), 905-918.
Islam, T., Rico-Ramirez, M.A., Thurai, M., Han, D., 2012. Characteristics of raindrop
spectra as normalized gamma distribution from a Joss–Waldvogel disdrometer,
Atmospheric Research (108), 57-73.
Karmakar, P.K., Maiti, M., Sett., S., Angelis, C.F., Machado, L.A.T., 2011. Radiometric
estimation of water vapor content over Brazil. J. Adv. Space Res. (28), 1506-1514.
Korolev, A. V., Isaac, G. A., Strapp, J. W., Cober, S. G., Barker, H. W., 2007. In situ
measurements of liquid water content profiles in midlatitude stratiform clouds. Q.J.R.
Meteorol. Soc. (133), 1693–1699. doi: 10.1002/qj.147.
Lawson, R.P., Blyth, A.M., 1998. A comparison of optical measurements of liquid
water content and drop size distribution in adiabatic regions of Florida cumuli,
Atmospheric Research (47–48), 671-690.
Leuenberger, A., 2009. Precipitation Measurements with Microwave Sensors. Bern
University.
Liljegren, J., Clothiaux, E., Mace, G., Kato, S., Dong, X., 2001. A new retrieval for
cloud liquid water path using a groundbased microwave radiometer and measurements
of cloud temperature, J. Geophys. Res. (106), 14485–14500.
Löhnert, U., Crewell, S., Simmer, C., Macke, A., 2001. Profiling Cloud Liquid Water
by Combining Active and Passive Microwave Measurements with Cloud Model
Statistics. J. Atmos. Oceanic Technol. (18), 1354–1366.
Löhnert, U., Crewell, S., 2003. Accuracy of cloud liquid water path from ground-based
microwave radiometry 1. Dependency on cloud model statistics, Radio Sci., 38, 8041.
Marshall, J.S.; Gunn, K.L.S., 1952. Measurement of snow parameters by radar. Journal
of the Atmospheric Sciences (9), 5, 322–327.
Marshall, J.S., Palmer, W.McK., 1948. The distribution of raindrops with size. J.
Meteor. (5), 165–166.
Martins, C.R., Machado, L.A.T., Costa, A.A., 2010. Characterization of the
microphysics of precipitation over Amazon region using radar and disdrometer data.
(96), Issues 2-3, 388-394.

Matzler, C., Morland, J., 2009. Refined Physical Retrieval of Integrated Water Vapor
and Cloud Liquid for Microwave Radiometer Data. IEEE Transactions on Geoscience
and Remote Sensing 47:6, 1585-1594.
Meywerk, J.,Quante, M., Sievers, O., 2005. Radar based remote sensing of cloud liquid
water—application of various techniques—a case study, Atmospheric Research (75),
Issue 3, 167-181.
Michaelides, S., Levizzani, V., Anagnostou, E., Bauer, P., Kasparis, T., Lane, J.E.,
2009. Precipitation: Measurement, remote sensing, climatology and modeling,
Atmospheric Research (94), Issue 4, 512-533.
Peter, R., Kämpfer, N., 1992. Radiometric determination of water vapor and liquid
water and its validation with other techniques, J. Geophys. Res., Vol. 97, No. D16,
18173-18183.
Peters, G., Fischer, B., Münster, H., Clemens, M., Wagner, A., 2005. Profiles of
Raindrop Size Distributions as Retrieved by Microrain Radars. J. Appl. Meteor. (44),
1930-1949.
Peters, G., Fischer, B., Clemens, M., 2010. Rain Attenuation of Radar Echoes
Considering Finite-Range Resolution and Using Drop Size Distributions. Journal of
Atmospheric and Oceanic Technology 27:5, 829-842.
Pruppacher, H.R., Klett, J.D., 1998. Microphysics of Clouds and Precipitation. 2nd
Edn.
Kluwer Academic Publishers, Boston.
Rogers, R.R., Yau, M.K., 1989. A Short Course in Cloud Physics. Pergamon Press, 293
pp.
Rose, T., Crewell, S., Löhnert, U., and Simmer, C., 2005. A network suitable
microwave radiometer for operational monitoring of the cloudy atmosphere, Atmos.
Res. (75), 183-200.
Rossow, W.B., Schiffer, R.A., 1999. Advances in understanding clouds from ISCCP,
Bull. Amer. Meteor. Soc. (80), 2261-2287.
Saavedra, P., Battaglia, A., Simmer, C., 2012. Partitioning of cloud water and rainwater
content by ground-based observations with the Advanced Microwave Radiometer for
Rain Identification (ADMIRARI) in synergy with a micro rain radar, J. Geophys. Res.
(117), 1984-2012.
Schneebeli, M., Sakuragi, J., Biscaro, T., Angelis, C. F., Carvalho da Costa, I., Morales,
C., Baldini, L., Machado, L. A. T., 2012. Polarimetric X-band weather radar
measurements in the tropics: radome and rain attenuation correction, Atmos. Meas.
Tech. (5), 2183-2199.
Solheim, F., Godwin, J., Westwater, E., Han, Y., Keihm, S., Marsh, K., Ware, R., 1998.
Radiometric profiling of temperature, water vapor, and liquid water using various
inversion methods. Radio Sci. (33), 393–404.
Skou, N., Vine, D., 2006. Microwave radiometer systems: design and analysis. 2nd
ed.
ISBN 1-58053-974-2.

Tokay, A., Short, D.A., 1996. Evidence from Tropical Raindrop Spectra of the Origin of
Rain from Stratiform versus Convective Clouds. J. Appl. Meteor. (35), 355–371.
Tokay, A., Kruger, A., Krajewski, W.F., 2001. Comparison of Drop Size Distribution
Measurements by Impact and Optical Disdrometers. J. Appl. Meteor. (40), 2083–2097.
Ware, R., Carpenter, R., Guldner, J., Liljegren, J., Nehrkorn, T., Solheim, F.,
Vandenberghe, F., 2003. A multichannel radiometric profiler of temperature, humidity,
and cloud liquid. Radio Sci. (38), 8079, doi:10.1029/2002RS002856.
Westwater, E., 1993. Ground-based microwave remote sensing of meteorological
variables, In Atmospheric Remote Sensing by Microwave Radiometry, edited by M.
Janssen, chap. 4, 145–213, John Wiley, New York.
Westwater, E., Crewell, S., Matzler, C., Cimini, D., 2005. Principles of surface-based
microwave and millimeter wave radiometric remote sensing of the troposphere. Quat.
Soc. Ital. Elettromagn. (1), 50-90. 8041, doi:10.1029/2002RS002654.
Won, H.Y., Kim, Y-H., Lee, H.S., 2009. An application od brightness temperature
received from a ground-based microwave radiometer to estimation of precipitation
occurrence. Asian-Pacific Journal of atmospheric (45), 1, 55-69.
Zhao, G., Chu, R., Zhang, T., Jia, W., 2013. Rainwater content estimated using
polarimetric radar parameters in the Heihe River Basin, Atmospheric Research (120–
121), 155-161.
Zhao, L., Weng, F., 2002. Retrieval of Ice Cloud Parameters Using the Advanced
Microwave Sounding Unit. J. Appl. Meteor. (41), 384–395.
Zhao, Q., Carr, F.H., 1997. A Prognostic Cloud Scheme for Operational NWP Models.
Mon. Wea. Rev. (125), 1931-1953.
Zrnic, D.S., Raghavan, R., Chandrasekar, V., 1994. Observations of Copolar
Correlation Coefficient through a Bright Band at Vertical Incidence. J. Appl. Meteor.,
(33), 45-52.
Table and Figure Caption
Table 1. The cloud and rain liquid water contents by active and passive sensors for
different regions and rainy systems in Brazil during the CHUVA campaign.
Table 2. The classifications* of rainy event occurrence (RR>0.1 mm/h) over the main
site for all CHUVA Project experiments.
Figure 1. The sites locations and a schematic representation of the measurement
strategy for the CHUVA campaign from 2010 to 2012.
Figure 2. The relative frequency histogram of the cloud liquid water content for all sites
during the CHUVA campaign, estimated by (a) microwave ground-based radiometer
MP3000A (ILWC, mm) and (b) the adiabatic approach from radiosondes (ILWadia, mm).
Figure 3. The ILWC (mm) estimated by the radiometer, related to the cloud thickness
(m) retrieved by LiDAR in the non-precipitation condition at Fortaleza.
Figure 4. The relative frequency histogram of the rain liquid water content (ILWR, mm)
integrated up to 1 km below the 0°C height for all sites during the CHUVA campaign,
estimated by (a) MRR and (b) XPOL.
Figure 5. The relative frequency histogram of the rain liquid water content (ILWR, mm)
integrated up to 1 km below the 0°C height for different rainy systems, estimated by
XPOL for each site for (a) warm rain, (b) stratiform, and (c) convective.
Figure 6. The mean profile of the rain liquid water content (LWCR, mm) below the 0°C
height for different rainy systems, estimated by XPOL for each site for (a) warm rain,
(b) stratiform, and (c) convective.
Figure 7. (a-c) The mean raindrop concentrations (mm-6
m-3
) and (d-f) the relations (%)
between the liquid water content for each diameter (Di) and the total observed for each
DSD from the disdrometer measurements for warm (a,d), stratiform (b,e), and
convective (c,f) clouds for all sites during the CHUVA project.
Figure 8. The integrated rain liquid water (ILWR, mm) estimated by XPOL for different
rain intensities, including light rain (1 to 2.5 mm/h), moderate rain (2.5 to 10 mm/h),
heavy rain (10 to 50 mm/h), and severe rain (larger than 50 mm/h) for all sites in the
CHUVA campaign.

Figure 1. The sites locations and a schematic representation of the measurement
strategy for the CHUVA campaign from 2010 to 2012.
Figure and Tavles
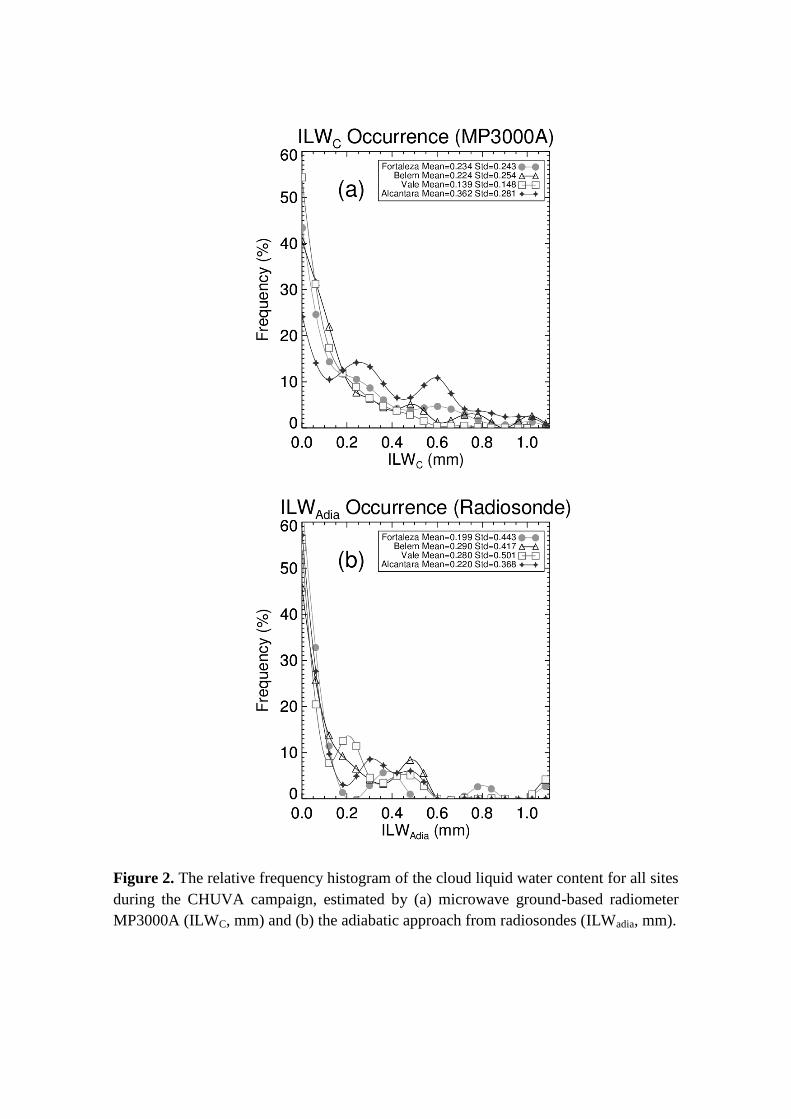
Figure 2. The relative frequency histogram of the cloud liquid water content for all sites
during the CHUVA campaign, estimated by (a) microwave ground-based radiometer
MP3000A (ILWC, mm) and (b) the adiabatic approach from radiosondes (ILWadia, mm).
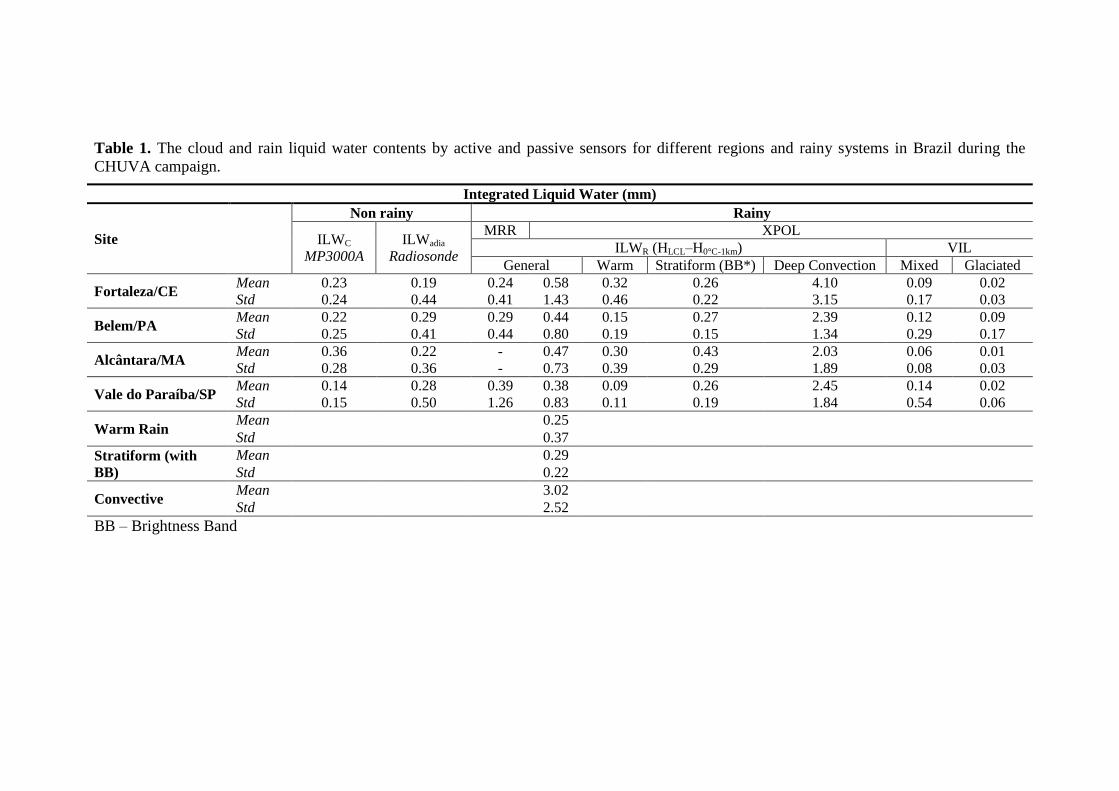
Table 1. The cloud and rain liquid water contents by active and passive sensors for different regions and rainy systems in Brazil during the
CHUVA campaign.
Integrated Liquid Water (mm)
Site
Non rainy Rainy
ILWC
MP3000A
ILWadia
Radiosonde
MRR XPOL
ILWR (HLCL–H0°C-1km) VIL
General Warm Stratiform (BB*) Deep Convection Mixed Glaciated
Fortaleza/CE Mean 0.23 0.19 0.24 0.58 0.32 0.26 4.10 0.09 0.02
Std 0.24 0.44 0.41 1.43 0.46 0.22 3.15 0.17 0.03
Belem/PA Mean 0.22 0.29 0.29 0.44 0.15 0.27 2.39 0.12 0.09
Std 0.25 0.41 0.44 0.80 0.19 0.15 1.34 0.29 0.17
Alcântara/MA Mean 0.36 0.22 - 0.47 0.30 0.43 2.03 0.06 0.01
Std 0.28 0.36 - 0.73 0.39 0.29 1.89 0.08 0.03
Vale do Paraíba/SP Mean 0.14 0.28 0.39 0.38 0.09 0.26 2.45 0.14 0.02
Std 0.15 0.50 1.26 0.83 0.11 0.19 1.84 0.54 0.06
Warm Rain Mean 0.25
Std 0.37
Stratiform (with
BB)
Mean 0.29
Std 0.22
Convective Mean 3.02
Std 2.52
BB – Brightness Band
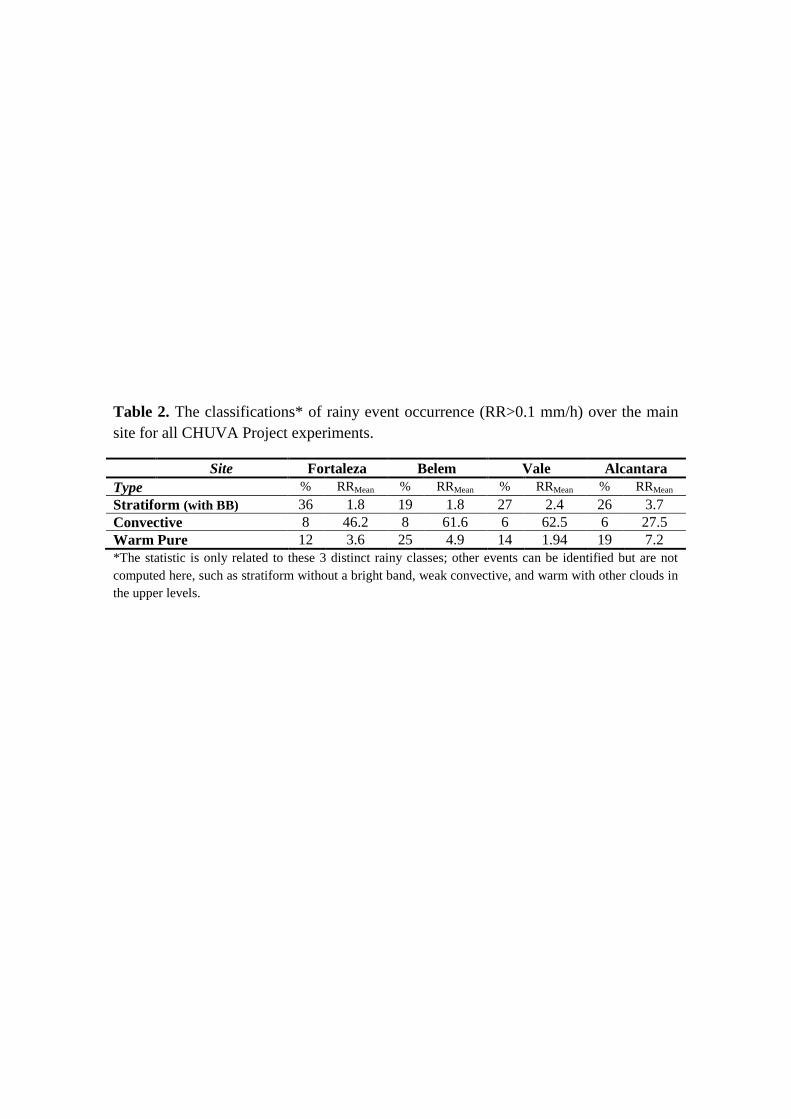
Table 2. The classifications* of rainy event occurrence (RR>0.1 mm/h) over the main
site for all CHUVA Project experiments.
Site Fortaleza Belem Vale Alcantara
Type % RRMean % RRMean % RRMean % RRMean
Stratiform (with BB) 36 1.8 19 1.8 27 2.4 26 3.7
Convective 8 46.2 8 61.6 6 62.5 6 27.5
Warm Pure 12 3.6 25 4.9 14 1.94 19 7.2
*The statistic is only related to these 3 distinct rainy classes; other events can be identified but are not
computed here, such as stratiform without a bright band, weak convective, and warm with other clouds in
the upper levels.
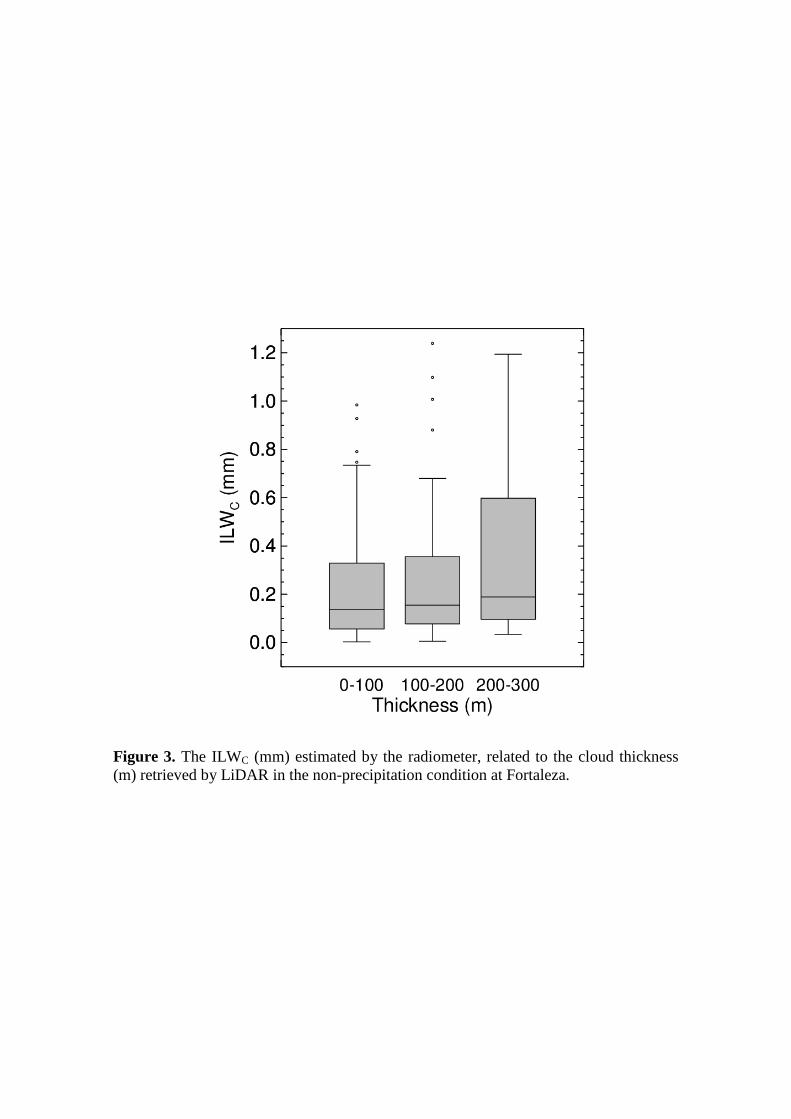
Figure 3. The ILWC (mm) estimated by the radiometer, related to the cloud thickness
(m) retrieved by LiDAR in the non-precipitation condition at Fortaleza.

Figure 4. The relative frequency histogram of the rain liquid water content (ILWR, mm)
integrated up to 1 km below the 0°C height for all sites during the CHUVA campaign,
estimated by (a) MRR and (b) XPOL.
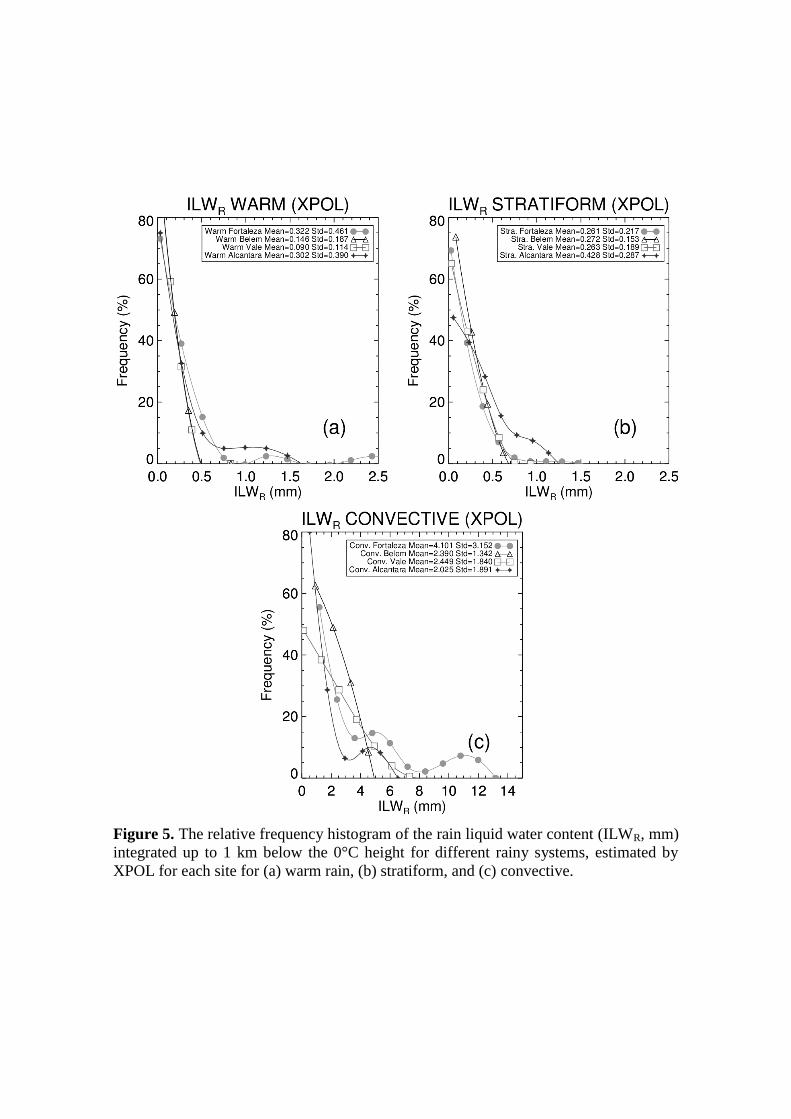
Figure 5. The relative frequency histogram of the rain liquid water content (ILWR, mm)
integrated up to 1 km below the 0°C height for different rainy systems, estimated by
XPOL for each site for (a) warm rain, (b) stratiform, and (c) convective.
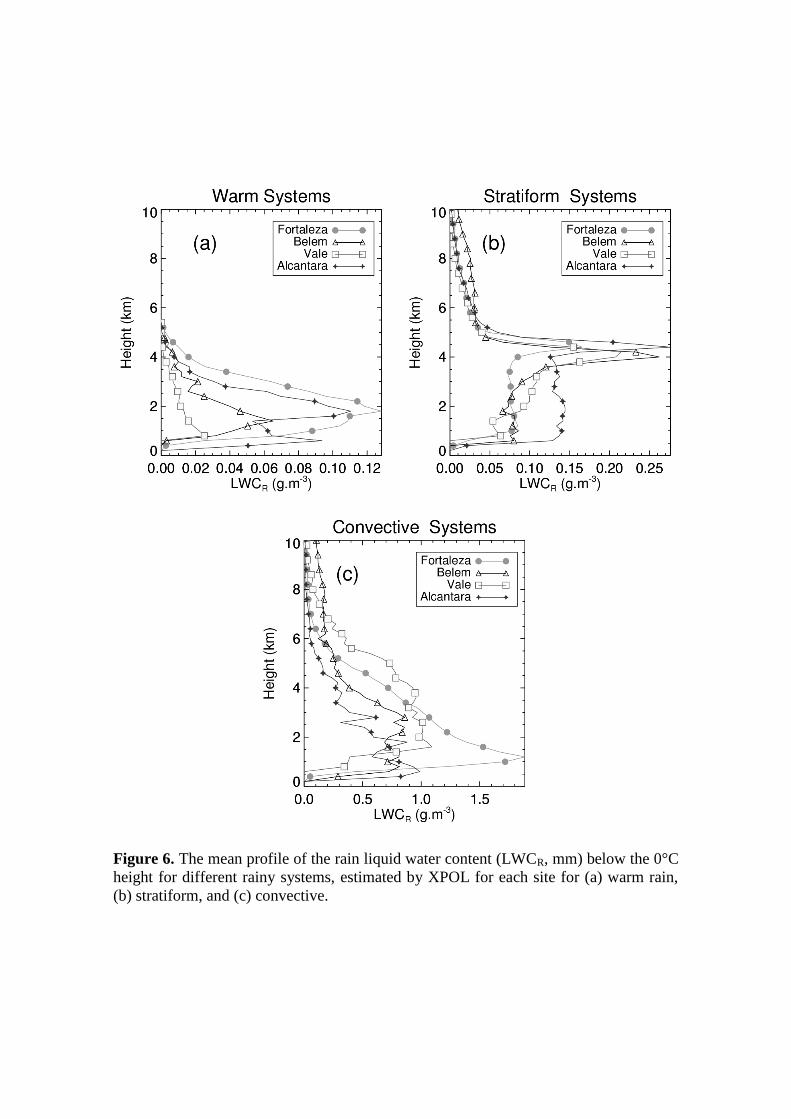
Figure 6. The mean profile of the rain liquid water content (LWCR, mm) below the 0°C
height for different rainy systems, estimated by XPOL for each site for (a) warm rain,
(b) stratiform, and (c) convective.

Figure 7. (a-c) The mean raindrop concentrations (mm-6
m-3
) and (d-f) the relations (%)
between the liquid water content for each diameter (Di) and the total observed for each
DSD from the disdrometer measurements for warm (a,d), stratiform (b,e), and
convective (c,f) clouds for all sites during the CHUVA project.

Figure 8. The integrated rain liquid water (ILWR, mm) estimated by XPOL for different
rain intensities, including light rain (1 to 2.5 mm/h), moderate rain (2.5 to 10 mm/h),
heavy rain (10 to 50 mm/h), and severe rain (larger than 50 mm/h) for all sites in the
CHUVA campaign.
Top Related