


Languages
Pages
Legal

17
Chapter 2
Effects of Single Metal-Ion Doping on the
Visible-Light Photo-reactivity of TiO2
The text of this chapter has been accepted for publication in Journal of Physical Chemistry C Choi, J.; Park, H.; Hoffmann, M.R. November 2009.
18
Abstract
Titanium dioxide (M-TiO2), which was doped with 13 different metal ions (i.e., silver
(Ag+), rubidium (Rb+), nickel (Ni2+), cobalt (Co2+), copper (Cu2+), vanadium (V3+),
ruthenium (Ru3+), iron (Fe3+), osmium (Os3+), yttrium (Y3+), lanthanum (La3+), platinum
(Pt4+, Pt2+), and chromium (Cr3+, Cr6+)) at doping levels ranging from 0.1 to 1.0 atom-%
was synthesized by standard sol-gel methods and characterized by X-ray diffraction
(XRD), BET surface area measurement, SEM, and UV-Vis diffuse reflectance
spectroscopy (DRS). Doping with Pt(IV.II), Cr(III), V(III), and Fe(III) resulted in a
lower anatase to rutile phase transformation (A-R phase transformation) temperature for
the resultant TiO2 particles, while doping with Ru(III) inhibited the A-R phase
transformation. Metal-ion doping also resulted in a red-shift of the photophysical
response of TiO2 that was reflected in an extended absorption in the visible between 400
and 700 nm. In contrast, doping with Ag(I), Rb(I), Y(III), and La(III) did not result in a
red-shift of the absorption spectrum of TiO2. As confirmed by elemental composition
analysis by Energy Dispersive X-ray Spectroscopy (EDS), the latter group of ions was
unable to be substituted for Ti(IV) in the crystalline matrix due to their incompatible
ionic radii. The photocatalytic activities of doped TiO2 samples were quantified in terms
of the photo-bleaching of methylene blue (MB), the oxidation of iodide (I), and the
oxidative degradation of phenol in aqueous solution both under visible-light irradiation
(> 400 nm) and under broader-band UV-vis irradiation (> 320 nm). Pt- and Cr-doped
TiO2, which had relatively percentages of high rutile in the particle phase, showed
significantly enhanced visible-light photocatalytic activity for all three reaction classes.
19
Introduction
Titania (TiO2) has been extensively studied as a photocatalyst for applications such as
water and air remediation because of its relatively high photocatalytic activity, robust
chemical stability, relatively low production costs, and non-toxicity. Redox reactions of
environmental interests are initiated on the TiO2 surface with trapped electron-hole after
band-gap excitation. However, TiO2 is active only under near-ultraviolet irradiation due
to its wide band gap energy of 3.0 ~ 3.2 eV. Therefore, significant efforts have been
made over the last 20 years to develop modified TiO2 particles that are active under
visible-light irradiation (> 400 nm). Various strategies have been pursued including
doping with metal ions (e.g., iron,1-3 nickel,4,5 vanadium,6-8 and chromium9-11) or
nonmetallic element (e.g., nitrogen,12-14 sulfur,15,16 and carbon17,18).
Metal ion-doped TiO2 has been primarily studied to enhance the photocatalytic
activity under UV irradiation.19-23 Choi et al.19 reported that doping with Fe3+, Ru3+, V4+,
Mo5+, Os3+, Re5+, and Rh3+ ions increased photoactivity for the degradation of CHCl3
under UV irradiation, whereas doping with Co3+ and Al3+ decreased photoactivity. The
relative photocatalytic efficiency of a metal-ion dopant depends on whether it serves as a
mediator of interfacial charge transfer or as a recombination center. Chen et al.22 also
showed that Fe- or Ni-doped TiO2 have higher photoactivities than undoped TiO2 under
UV irradiation.
Numerous metal ions have been investigated as potential dopants including iron,1-3
nickel,4,5 vanadium,6-8 chromium,9-11 platinum,24 ruthenium,25 and cobalt ions.26,27
However, there are conflicting results on the effects of doping on the visible-light
photoactivity of TiO2. The wide-variablity in reported impact on visible light activity
20
may be due to the specific preparation methods, the actual photolysis and experimental
conditions used to quantify activity, and broad array of chemical reactions used to verify
photoactivity over a broad range of wavelengths at > 400 nm. For example, metal ion-
doped TiO2 is prepared in the form of powders2,25,27 and films6,7 by different synthetic
methods such as sol-gel syntheses,6,8,11 MOCVD,1 hydrothermal synthesis,3 solid-state
reactions,4 and ion implantation.10,28 Photoactivity in the visible has been quantified
using a wide array of substrates including dyes,1,3,6,8,11 phenolic compounds,2,24,29
acetaldehyde,6,27 and nitric oxide.10,28 Therefore, it is difficult to compare the net effects
of metal-ion dopants on the photocatalytic activity of TiO2. Several reports30-32 compare
the effects of metal-ion dopants on visible-light photocatalytic activities of TiO2 using
high-throughput (HT) screening techniques. However, the physicochemical properties of
various doped TiO2 samples were not made in such combinatorial approaches.
Herein, we report on the synthesis of sol-gel TiO2 doped with 13 different metal ions
and compare the effects of individual dopants on the resulting physicochemical properties
(e.g., a crystal structure and UV-vis absorption) and their corresponding photocatalytic
activities with respect to the catalysis of several reactions under visible-light irradiation
( > 400 nm). In this regard, the photocatalytic activities of metal ion-doped TiO2 are
quantified in terms of the photo-bleaching of methylene blue (MB), the oxidation of
iodide (I-), and the degradation of phenol in aqueous suspensions.
Experimental
Chemicals
21
The specific reagents used in this study include: titanium tetraisopropoxide (TTIP,
Aldrich), absolute ethanol (Mallinckrodt), nitric acid (HNO3, Aldrich), methylene blue
(MB, J.T. Baker), potassium iodide (KI, EM Science), and phenol (Mallinckrodt). The
metal ion salts used in the preparations include: AgNO3 (Mallinckrodt), Cu(NO3)2·4H2O
(Alfar Aesar), Ni(NO3)2·6H2O (Alfar Aesar), Cr(NO3)3·9H2O (Adrich), CrO3 (Aldrich),
CoCl2 (Aldrich), VCl3 (Aldrich), RuCl3 (Aldrich), FeCl3·6H2O (Aldrich), YCl3·6H2O
(Aldrich), LaCl3·7H2O (Aldrich), OsCl3 (Aldrich), PtCl4 (Aldrich), Pt(NH3)4(NO3)2
(Alfar Aesar), RbClO4 (MP Biomedicals Inc.).
Synthesis and Characterization of Catalysts
TiO2 nanoparticles were prepared by standard sol-gel methods. TiO2 sols were
prepared by dropwise addition of 5 mL of an ethanolic TTIP solution, which had been
dissolved in 50 mL of absolute ethanol, into 50 mL of distilled water adjusted to pH 1.5
with nitric acid under vigorous stirring at room temperature. After continuously stirring
for 24 hours, the resulting transparent solution was evaporated using a rotary evaporator
at 45 oC and dried in the oven (70 oC) overnight. The obtained powder was calcined at
various temperatures from 200 oC to 700 oC (typically at 400 oC) for 1 hour under air.
Metal ion-doped TiO2 samples (M-TiO2) were prepared according to the above procedure
in the presence of the corresponding metal ion salt precursors to give a doping level from
0.1 to 1.0 atomic-% (at.%). The appropriate amount of metal-ion precursor was added to
the distilled water before hydrolysis of TTIP and the remaining procedures were the same
as described above. The doped TiO2 products exhibited a variety of different colors.
Doping with Cr3+, Cu2+, and Ni2+ produced TiO2 samples with a green color. Os3+ , Pt4+
22
and Pt2+ doping- produced brown products; Ru3+ doping yielded a dark brown product;
V3+ doping produced an orange product; Fe3+ doping produced a light orange product;
and Co2+ doping gave a light yellow TiO2 product. All the other metal doped samples are
white colored.
Crystal structure patterns of the M-TiO2 powder samples were examined by X-ray
diffraction (XRD) using a Philips diffractometer (X’pert Pro) with Cu-K radiation.
Brunauer-Emmett-Teller (BET) surface area measurement were carried out by using N2
as the adsorptive gas (Micromeritics Gemini), and the morphology and elemental
composition analysis were performed by scanning electron microscopy (SEM, LEO
1550VP) equipped with EDS (Energy Dispersive X-ray Spectroscopy). UV-vis diffuse
reflectance spectra (DRS) were obtained on a Shimadzu UV-2101PC spectrophotometer.
Determination of Photocatalytic Activity
The photocatalytic activities of the array of synthesized TiO2 samples were quantified
by measuring the rates of photo-bleaching and degradation of MB, the rates of I
oxidation, and the rates of degradation of phenol. Synthesized TiO2 samples were
dispersed in distilled water (1 gL-1). This was followed by the addition of an aliquot of
the target substrate stock solution to the catalyst suspension to give a specific substrate
concentration (i.e., [MB]0 = 10 M, [I]0 = 50 mM, and [PhOH]0 = 50 M). The reaction
suspensions pH were circum-neutral at t=0. Before irradiation, the suspension was stirred
in the dark for 30 min to obtain a state of sorption equilibrium of the specific substrate on
TiO2. A high-pressure Hg(Xe) Arc lamp (500 W) was used as the light source. The
incident light beam was passed through an IR water filter and a UV cut-off filter giving

23
> 320 nm for UV irradiation or > 400 nm for visible irradiation before being focused
onto a cylindrical Pyrex reactor through a quartz window. The reactor was open to
ambient laboratory air during photolysis with a few exceptions. Time-sequenced sample
aliquots were collected from the reactor during the time-course of illumination for
analysis and filtered through a 0.45 m PTFE syringe filter to remove TiO2 particles.
Multiple photolysis experiments were performed under the identical reaction conditions
to determine reproducibility.
The rate constants for the observed degradation of MB during photolysis were
determined by measuring the absorbance of sample aliquots at 665 nm with a
conventional spectrophotometer. In the case of the photocatalytic oxidation of iodide, tri-
iodide ion (I3), which is the principal product of iodide oxidation in the presence of
excess iodide ion, was determined spectrophotometrically by measuring its absorbance at
352 nm. The degradation of phenol in aqueous solution was measured using high
performance liquid chromatography (HPLC, HP 1100 series with a C18 column).
Results and Discussion
X-ray Diffraction Analysis of Metal-Ion-Doped TiO2 (M-TiO2)
The structure of TiO2 samples synthesized by standard sol-gel methods appeared to be
amorphous thermal annealing; however, post-synthesis treatment at various temperatures
ranging from 200 to 700 oC resulted in higher degree crystallinity primarily as anatase.
The increasing calcination temperatures resulted in an increase in the intensity and
sharpness of the anatase peaks. This trend is clearly indicative of an improvement in the
degree of crystallinity corresponding to the formation of larger particles with fewer
24
defects. However, above a given temperature XRD peaks corresponding to the rutile
phase appear. No diffraction peaks that could be attributed to doping metals were
observed. Thus, the crystal structure of TiO2 indicates a mixture of anatase and rutile for
all the synthesized M-TiO2 samples. These results suggest that at the doping levels we
employed or the subsequent thermal treatment did not induce the formation of discrete
impurity phases and that the metal ion appears to have been integrated into the basic
structure of TiO2. However, it is conceivable that metal impurities, which were formed
during synthesis, were nanoscopic or possibly dispersed on the surface. We have
assumed that some of the metal ion dopants such as Pt4+, Cr3+, and V3+ ions are most
likely to be substituted at Ti4+ sites within TiO2 because ionic radii of dopants (Pt4+:
0.765 Å, Cr3+: 0.755 Å, and V3+: 0.78 Å) are similar to that of Ti4+ (0.745 Å), whereas
some other metal dopants such as Co2+, Cu2+ and Pt2+ ions are possibly located in
interstitial positions of the lattice rather than directly in Ti4+ sites because of the relatively
large size difference between dopant ions (Co2+: 0.89 Å, Cu2+: 0.87 Å and Pt2+: 0.94 Å)
and Ti4+. However, Ag+, Rb+, Y3+ and La3+ ions seem to be too large to be incorporated
in TiO2 lattice and thus, they are more likely to be found as dispersed metal oxides within
the crystal matrix or they are dispersed on the surface of TiO2.
The anatase-to-rutile phase transformation (i.e., the A-R phase transformation) of
pure TiO2 normally occurs between 600 and 700 oC.33-36 In our case, pure (undoped)
TiO2 samples that were calcined at 400 oC showed only the anatase phase. Calcination at
700 oC produced with a relatively small fraction of the rutile phase. However, it was
observed that, in some cases, metal-ion doping altered the temperature of the A-R phase
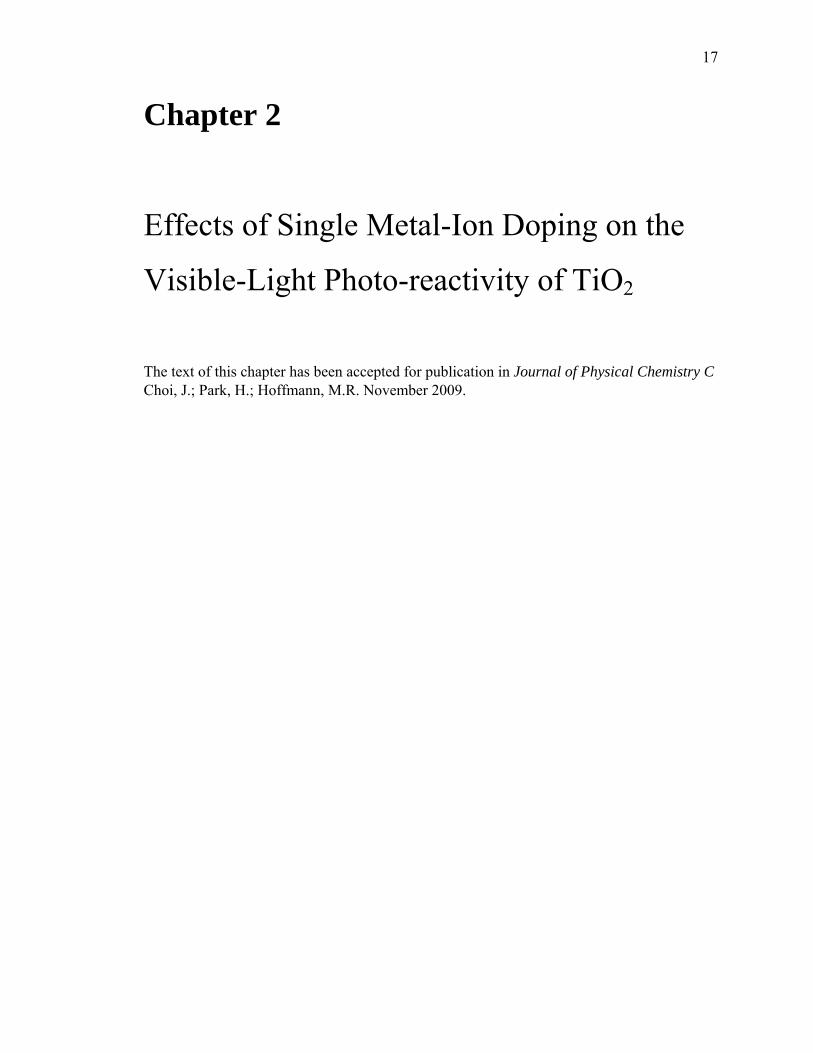
transformation of TiO2. In this regard, the XRD patterns of representative M-TiO2
25
samples that were calcined at different temperatures are shown in Figure 2.1. Similar to
undoped TiO2, La-TiO2 prepared at 400 oC was entirely in the anatase phase. Anatase
remained as the dominant phase until a minor rutile component was observed at 700 C
(Figure 2.1a). However, in the case of Pt-TiO2, a rutile peak at 2θ = 27.5o appeared at
400 oC as shown in Figure 2.1(b). This rutile peak was clearly dominant at 700 oC, while
the anatase peak at 2θ = 25.7o disappeared at 700 oC. In comparison, Ru-TiO2 was almost
exclusively pure anatase phase even at 700 oC in Figure 2.1(c), implying Ru ion inhibited
A-R phase transformation of TiO2.
In order to compare the effects of metal-ion doping on the A-R phase transformation,
the fraction of rutile, XR, was calculated from the respective peak intensities using
following equation: 37
XR (%) = {1- (1 + 1.26IR/IA)-1} 100 (2.1)
where IR and IA are the X-ray intensities of the rutile (101) and anatase (110) peaks,
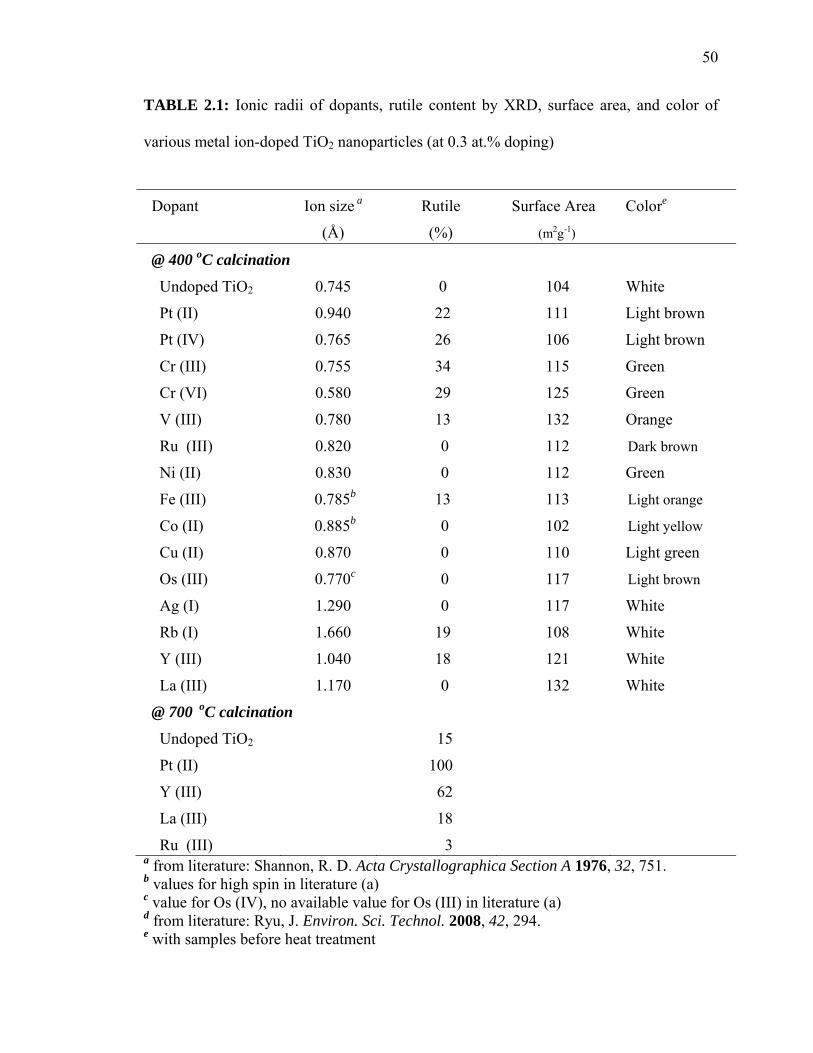
respectively. These relative rutile fractions are listed in Table 2.1 with ionic radii of the
dopants. Pt-TiO2, Cr-, V-, Fe-, Y-, and Rb-TiO2 also exhibited evidence of a rutile phase
after calcinations at 400 oC. Their rutile fractions were estimated to be 15 ~ 30 %,
whereas the undoped samples and remaining M-TiO2 samples were in the pure anatase
phase. Pt- and Y-TiO2, which were calcined at 700 oC, also exhibited high rutile
fractions (XR = 100% and 62 %, respectively) when compared to undoped TiO2 (XR = 15
%). Therefore, we conclude that certain dopants Pt, Cr, V, Fe, Y, and Rb) lowered the A-
R phase transformation temperature of TiO2. In the specific case of Ru-TiO2 calcined at
700 oC, the XR fraction was estimated to be only 3%, which indicates that Ru increased
26
the apparent temperature of A-R phase transformation. Similar results have been
reported elsewhere.1,38-42
However, some previous studies reported controversial results of doping effect on A-
R phase transformation. For example, Ruiz et al.43 reported that Cr-TiO2 inhibited the A-
R phase transformation. However, they observed an additional XRD peaks due to Cr2O3
as well as TiO2. The formation of chromium oxide is most likely due to the high doping
level of Cr at 5 ~ 10 at.%. In comparison, no Cr-related peaks were observed at our
doping level of Cr (0.3 at.%). Therefore, it is likely that an effect of doping on A-R
phase transformation temperature depends on the actual doping concentration. Doping at
high Cr ion concentrations, which may result in Cr segregated on TiO2 surface as
opposed to direct substitution in Ti4+ may impact the A-R phase transformation
differently. Some studies also showed that doping with Ce, La, or Y ions also inhibits the
A-R phase transformation.34,38,44 The inhibiting phenomena of these dopants has been
explained in terms of the formation of Ti-O-Ce (or La, Y) bonds at the interface since
they could be located primarily on the surface of TiO2 because of relatively large
differences in the ionic radii resulting in inhibited crystal grain growth.45,46 A similar
inhibition of A-R phase transformation has been pointed out for TiO2/SiO2 mixture as
well.33,36 However, our results indicate that La doping had little impact on the A-R phase
transformation, while Y accelerated the transformation. It should be noted that the
doping levels of La, Y, and Ce ions in TiO2 are about 5 ~10 at.% in most studies in
contrast to a level of 0.3 at.% in this study. In addition, Ghosh et al.38 showed that peaks
due to Y2Ti2O7 or La4Ti9O24 were identified in the XRD patterns of Y- or La-doped TiO2
27
samples that showed an inhibiting effect on the A-R phase transformation, whereas no Y
or La-derived peaks were observed in our XRD results.
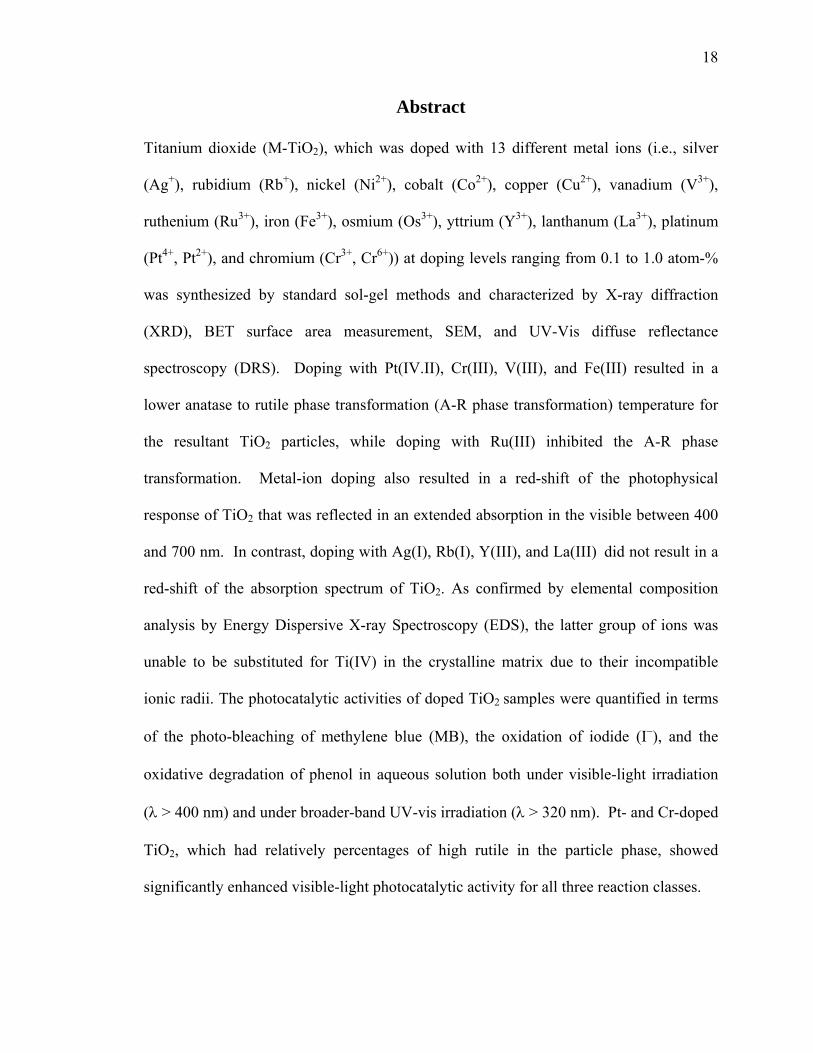
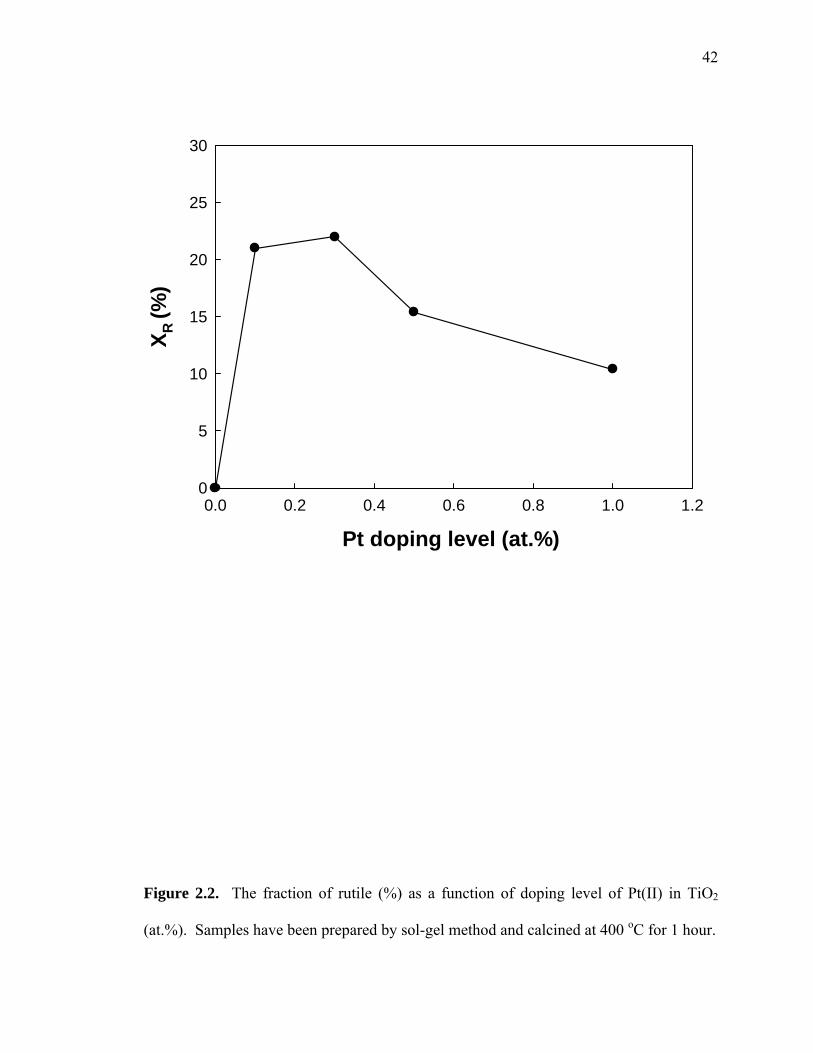
In order to investigate the effect of doping level concentration on the A-R phase
transformation, the fractions of rutile (XR) in Pt(II)-TiO2 with different Pt concentration
from 0.1 to 1.0 at.% were determined. As shown in Figure 2.2, XR fraction increases to
approximately 22 % when Pt is doped in the range of 0.1~0.3 at.% and then decreases at
higher doping levels in the range of 0.5~1.0 at.%. These results indicate that doping
effect of metal ions on the A-R phase transformation is dependent on not only the
intrinsic physicochemical properties of doping metal ion but also the concentrations of
the dopants. Shannon et al.47 also reported that the total impurity content can affect the
transformation through the structure stuffing effect and large quantities of impurities may
raise the transformation temperatures.
There are only a few concepts or rules to clarify the effects of impurities doped into
TiO2 on the A-R phase transformation. The primary factor that has been invoked in order
to explain the doping effect on A-R phase transformation is the creation of oxygen
vacancies since the A-R phase transformation involves a contraction or shrinking of the
oxygen structure.47 It is also believed that impurities can affect the rate of the
transformation by modifying the defect structures of TiO2. Based on this concept,
Shannon et al.47 suggested that processes that increase oxygen vacancies such as the
addition of ions of valence less than four and of small ionic radius which can enter the
structure via direct substitution, accelerate the A-R phase transformation (and vice versa).
They also hypothesized that an increase of oxygen vacancy concentration reduces the
strain energy that must be overcome before the rearrangement of Ti-O octahedral occurs.

28
In addition, Mackenzie et al.48 proposed a rank-ordered list of dopants in terms of their
effectiveness in accelerating the A-R phase transformation and concluded that
monovalent ions are more effective than divalent or trivalent ions since more oxygen
vacancies would be created in the doping of monovalent ions compared to divalent or
trivalent ions.
According to our results, however, there is no such a correlation observed between
valence state of dopant and the fraction of rutile phase of M-TiO2. For example, the
fractions of the rutile phase of Pt(IV)-TiO2 and Cr(III)-TiO2 are compared to Pt(II)-TiO2
and Cr(VI)-TiO2 in Table 2.1. The doping with Pt(IV) ion also accelerated the A-R
phase transformation with the fraction of rutile from 0 % to 26 % and it was similar to
rutile fraction of Pt(II)-TiO2 sample (22 %). With respect to Cr doping, both Cr(VI) and
Cr(III) accelerated the A-R phase transformation as well. In addition, the data as shown
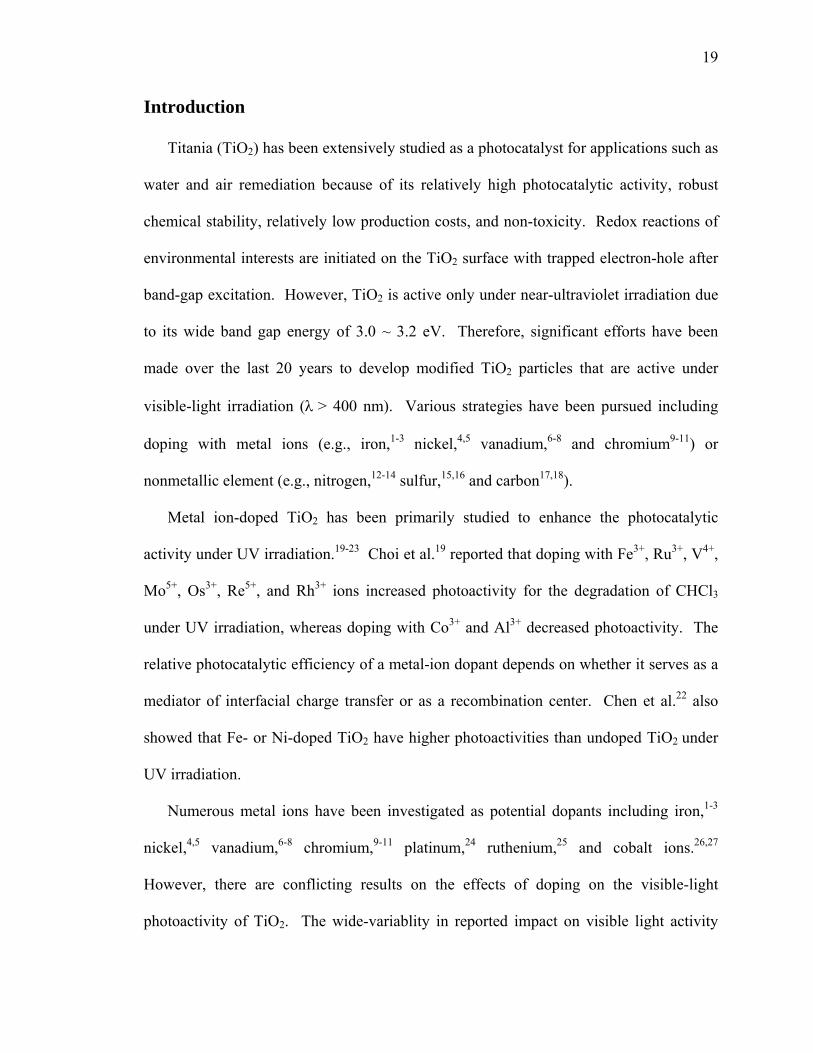
in Figure 2.3 demonstrates that there are no obvious correlations between XR in various
M-TiO2 samples as a function of valence state or ionic radius of each metal dopant.
Figure 2.3(a) also shows that the doping with monovalent ions was not more effective for
A-R phase transformation than divalent or trivalent ions and the fraction of rutile was
varied even with the same valence state of dopant ions. Figure 2.3(b) also shows the XR
fraction of the various trivalent ion-doped TiO2 samples as a function of their ionic radii.
It is clear that there is no correlation observed. Therefore, the valence state or ionic
radius of dopant metal ion is not a good predictor of the effectiveness of specific dopants
on the A-R phase transformation even if oxygen vacancies, which might be induced by
metal-ion doping, affect the A-R phase transformation of M-TiO2 samples.
29
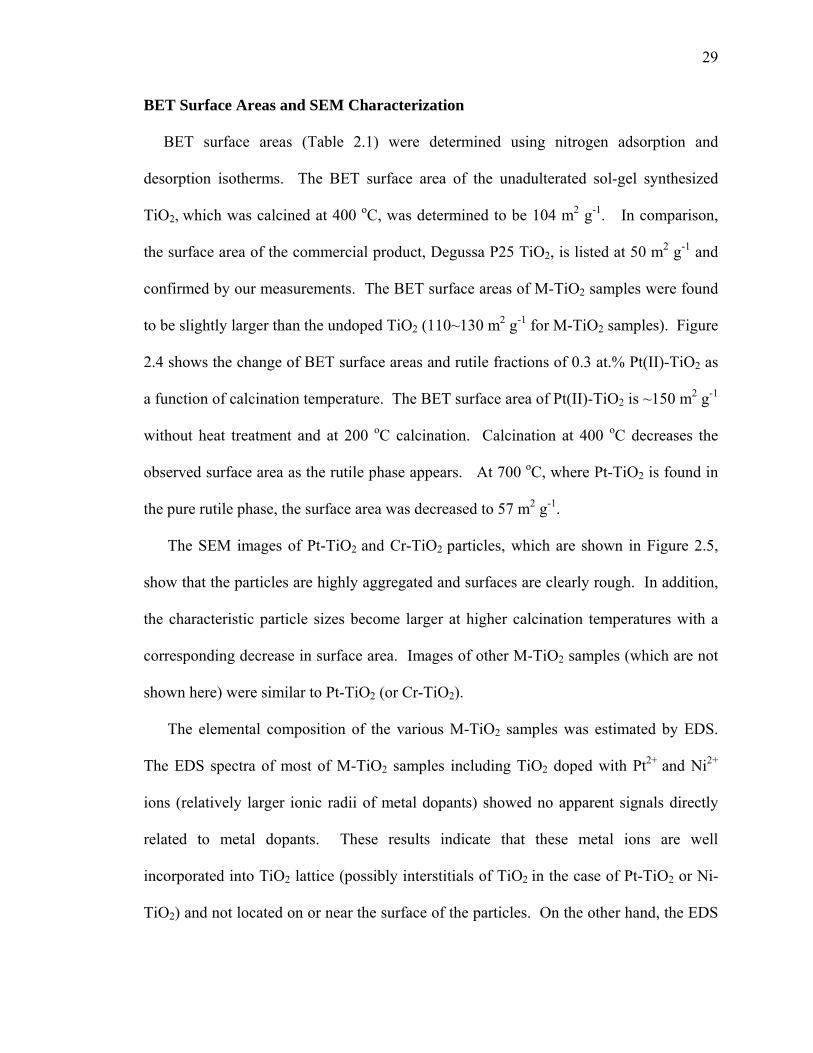
BET Surface Areas and SEM Characterization
BET surface areas (Table 2.1) were determined using nitrogen adsorption and
desorption isotherms. The BET surface area of the unadulterated sol-gel synthesized
TiO2, which was calcined at 400 oC, was determined to be 104 m2 g-1. In comparison,
the surface area of the commercial product, Degussa P25 TiO2, is listed at 50 m2 g-1 and
confirmed by our measurements. The BET surface areas of M-TiO2 samples were found
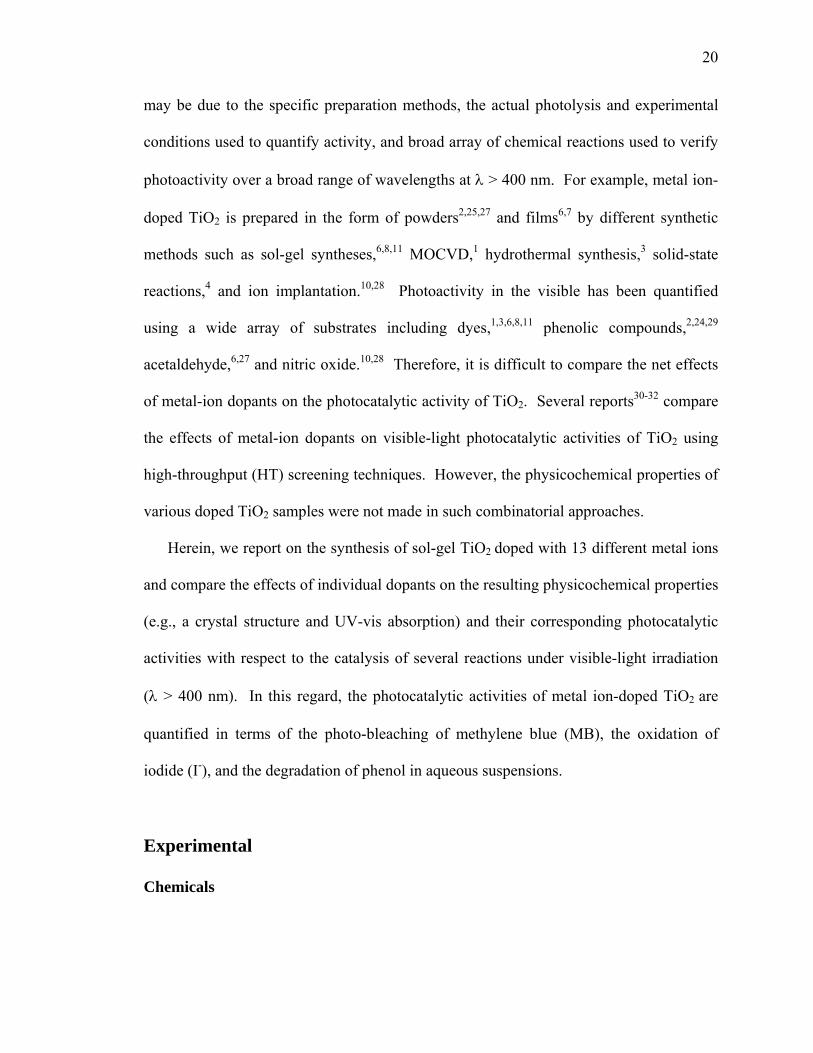
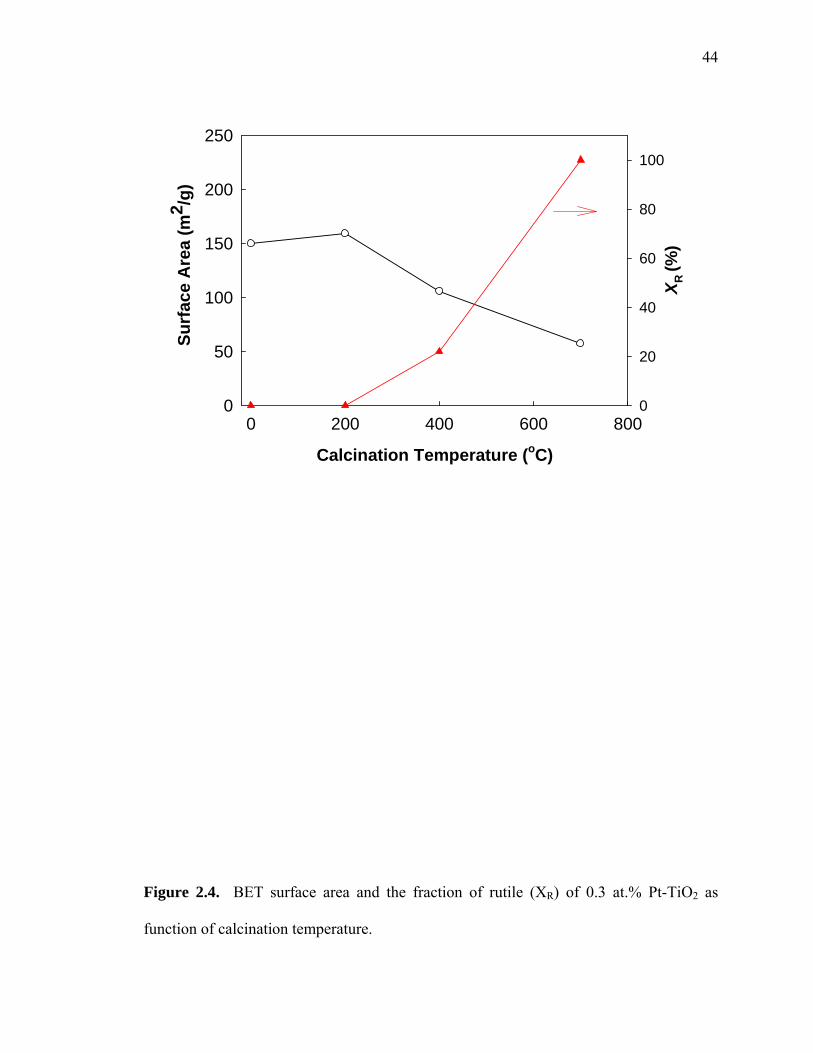
to be slightly larger than the undoped TiO2 (110~130 m2 g-1 for M-TiO2 samples). Figure
2.4 shows the change of BET surface areas and rutile fractions of 0.3 at.% Pt(II)-TiO2 as
a function of calcination temperature. The BET surface area of Pt(II)-TiO2 is ~150 m2 g-1
without heat treatment and at 200 oC calcination. Calcination at 400 oC decreases the
observed surface area as the rutile phase appears. At 700 oC, where Pt-TiO2 is found in
the pure rutile phase, the surface area was decreased to 57 m2 g-1.
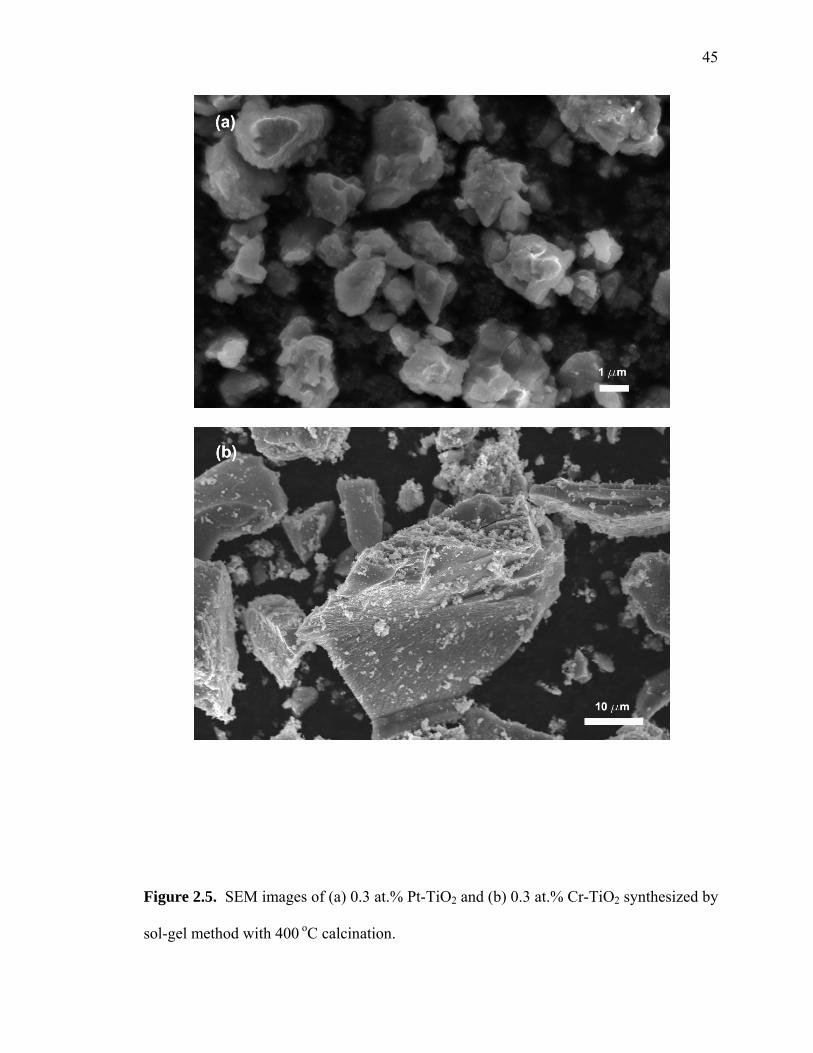
The SEM images of Pt-TiO2 and Cr-TiO2 particles, which are shown in Figure 2.5,
show that the particles are highly aggregated and surfaces are clearly rough. In addition,
the characteristic particle sizes become larger at higher calcination temperatures with a
corresponding decrease in surface area. Images of other M-TiO2 samples (which are not
shown here) were similar to Pt-TiO2 (or Cr-TiO2).
The elemental composition of the various M-TiO2 samples was estimated by EDS.
The EDS spectra of most of M-TiO2 samples including TiO2 doped with Pt2+ and Ni2+
ions (relatively larger ionic radii of metal dopants) showed no apparent signals directly
related to metal dopants. These results indicate that these metal ions are well
incorporated into TiO2 lattice (possibly interstitials of TiO2 in the case of Pt-TiO2 or Ni-
TiO2) and not located on or near the surface of the particles. On the other hand, the EDS
30
spectra of the larger ionic radii dopants (M-TiO2) such as Ag-TiO2 and Rb-TiO2 showed
the signals of the metal ions, which indicates that these metal-ion dopants (i.e., Ag, Rb,
Y, and La) were located near surface region, not incorporated into TiO2 lattice because of
their much larger ionic radii than Ti4+.
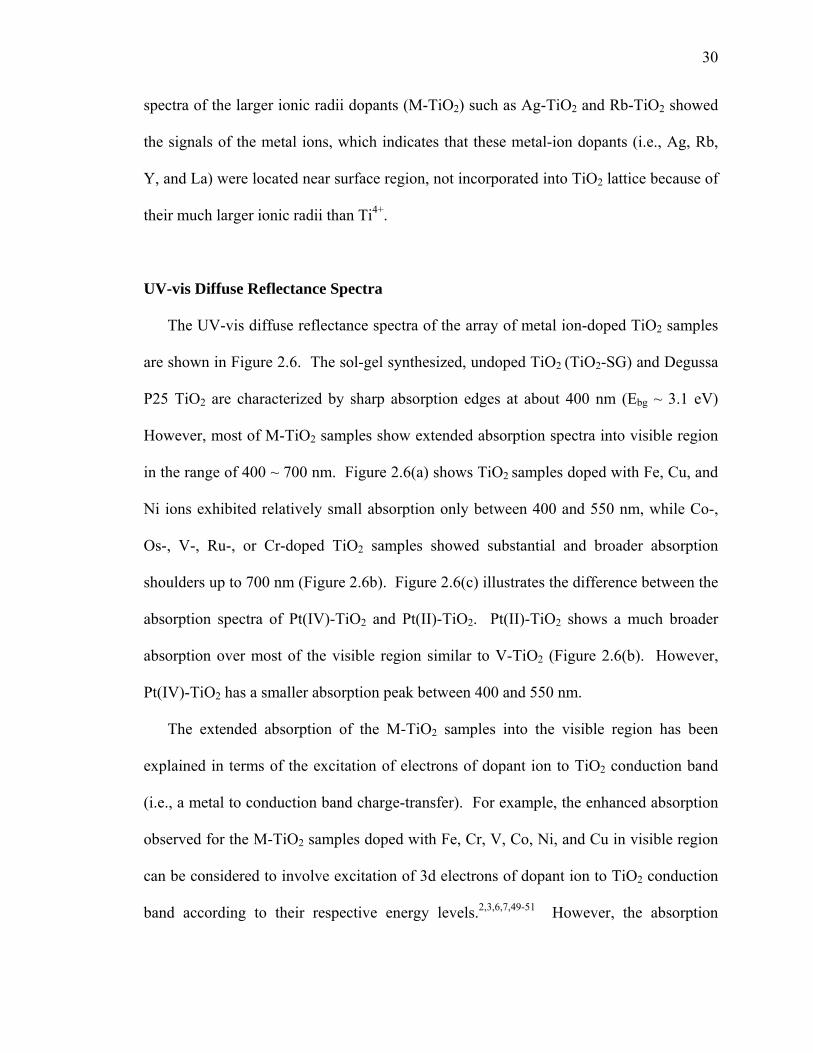
UV-vis Diffuse Reflectance Spectra
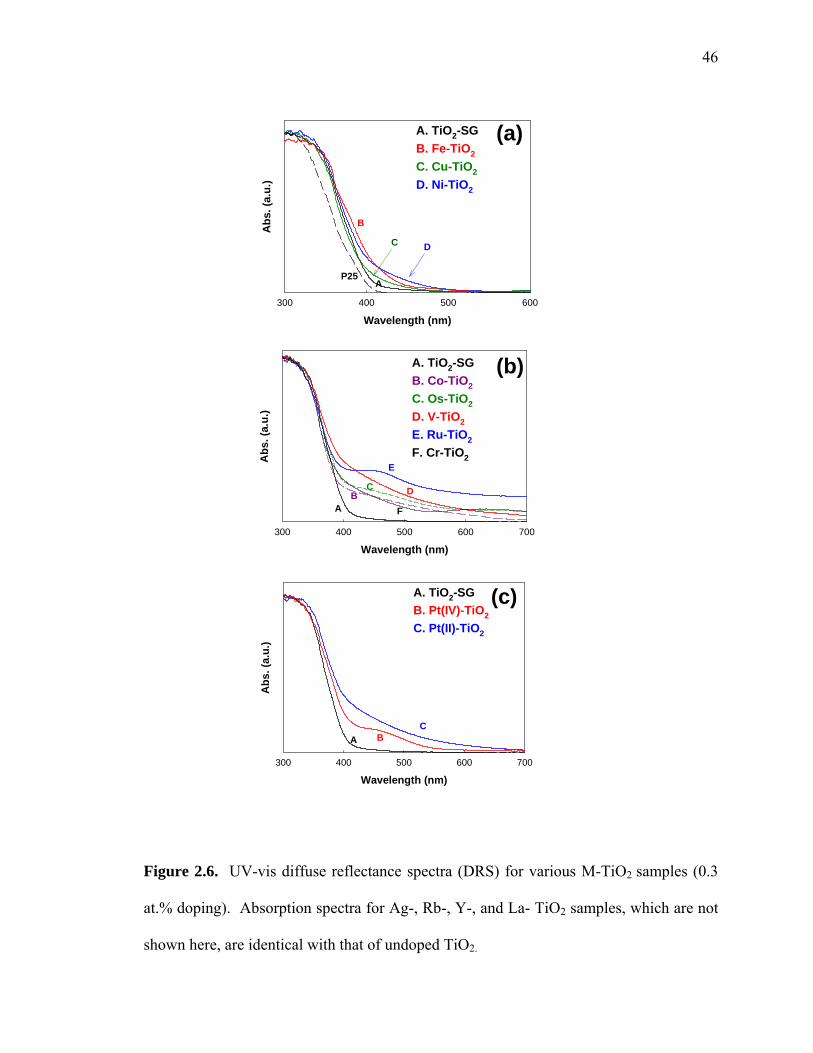
The UV-vis diffuse reflectance spectra of the array of metal ion-doped TiO2 samples
are shown in Figure 2.6. The sol-gel synthesized, undoped TiO2 (TiO2-SG) and Degussa
P25 TiO2 are characterized by sharp absorption edges at about 400 nm (Ebg ~ 3.1 eV)
However, most of M-TiO2 samples show extended absorption spectra into visible region
in the range of 400 ~ 700 nm. Figure 2.6(a) shows TiO2 samples doped with Fe, Cu, and
Ni ions exhibited relatively small absorption only between 400 and 550 nm, while Co-,
Os-, V-, Ru-, or Cr-doped TiO2 samples showed substantial and broader absorption
shoulders up to 700 nm (Figure 2.6b). Figure 2.6(c) illustrates the difference between the
absorption spectra of Pt(IV)-TiO2 and Pt(II)-TiO2. Pt(II)-TiO2 shows a much broader
absorption over most of the visible region similar to V-TiO2 (Figure 2.6(b). However,
Pt(IV)-TiO2 has a smaller absorption peak between 400 and 550 nm.
The extended absorption of the M-TiO2 samples into the visible region has been
explained in terms of the excitation of electrons of dopant ion to TiO2 conduction band
(i.e., a metal to conduction band charge-transfer). For example, the enhanced absorption
observed for the M-TiO2 samples doped with Fe, Cr, V, Co, Ni, and Cu in visible region
can be considered to involve excitation of 3d electrons of dopant ion to TiO2 conduction
band according to their respective energy levels.2,3,6,7,49-51 However, the absorption
31
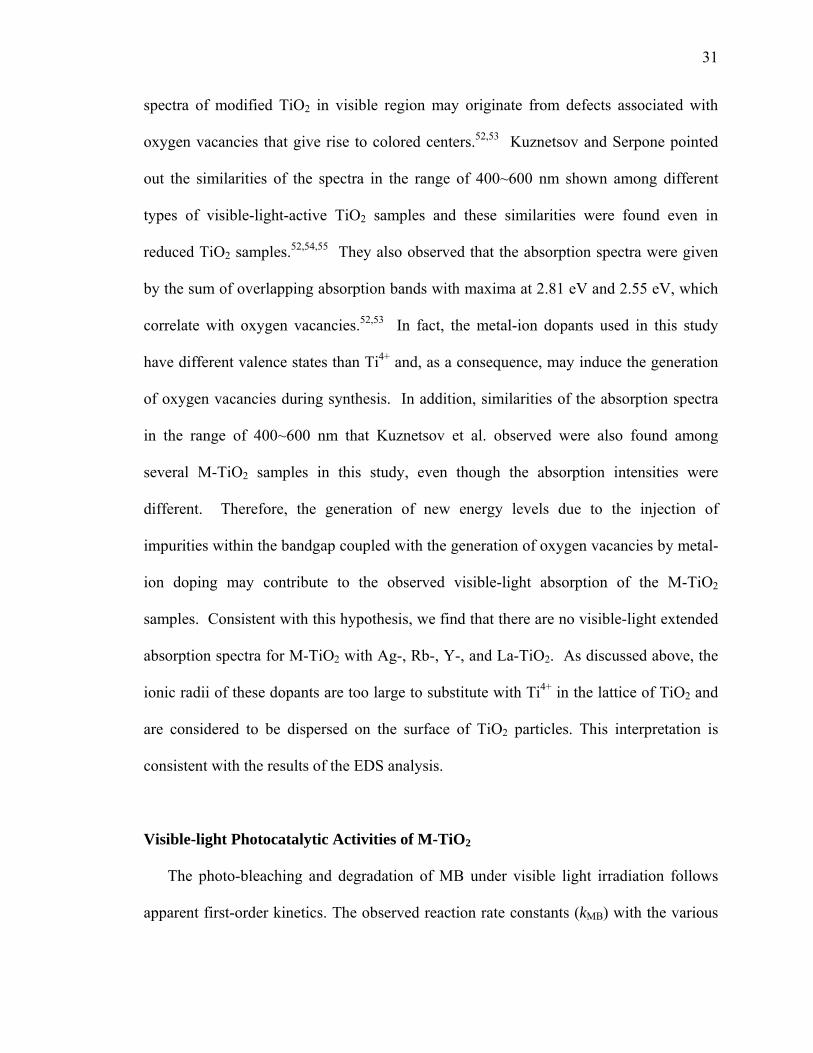
spectra of modified TiO2 in visible region may originate from defects associated with
oxygen vacancies that give rise to colored centers.52,53 Kuznetsov and Serpone pointed
out the similarities of the spectra in the range of 400~600 nm shown among different
types of visible-light-active TiO2 samples and these similarities were found even in
reduced TiO2 samples.52,54,55 They also observed that the absorption spectra were given
by the sum of overlapping absorption bands with maxima at 2.81 eV and 2.55 eV, which
correlate with oxygen vacancies.52,53 In fact, the metal-ion dopants used in this study
have different valence states than Ti4+ and, as a consequence, may induce the generation
of oxygen vacancies during synthesis. In addition, similarities of the absorption spectra
in the range of 400~600 nm that Kuznetsov et al. observed were also found among
several M-TiO2 samples in this study, even though the absorption intensities were
different. Therefore, the generation of new energy levels due to the injection of
impurities within the bandgap coupled with the generation of oxygen vacancies by metal-
ion doping may contribute to the observed visible-light absorption of the M-TiO2
samples. Consistent with this hypothesis, we find that there are no visible-light extended
absorption spectra for M-TiO2 with Ag-, Rb-, Y-, and La-TiO2. As discussed above, the
ionic radii of these dopants are too large to substitute with Ti4+ in the lattice of TiO2 and
are considered to be dispersed on the surface of TiO2 particles. This interpretation is
consistent with the results of the EDS analysis.
Visible-light Photocatalytic Activities of M-TiO2
The photo-bleaching and degradation of MB under visible light irradiation follows
apparent first-order kinetics. The observed reaction rate constants (kMB) with the various
32
M-TiO2, which are prepared at doping level of 0.3 at.% and calcined at 400 oC under both
UV and visible-light irradiation, are listed in Table 2.2. Under visible-light irradiation at
> 400 nm, kMB for direct photolysis without TiO2 particles is estimated 0.003 min-1.
The observed rate constant was increased slightly to 0.005 min-1 in the presence of
undoped TiO2, This activity may be due to additional light absorption above 400 nm of
TiO2 particles or enhanced direct electron injection from adsorbed MB to the conduction
band of TiO2. However, Pt-, Cr-, V-, Ni-, and Rb-TiO2 showed significantly enhanced
photocatalytic activities under the visible-light irradiation by an order of magnitude (kMB
> 0.01 min-1). Among all tested M-TiO2 samples, Pt-TiO2 (both Pt(II)-TiO2 and Pt(IV)-
TiO2) showed the best visible-light photo-activity for MB degradation. Most of other M-
TiO2 samples (i.e., Fe-, Co-, Cu-, Os-, Ag-, and Y-TiO2) showed slightly increased kMB,
while Ru- and La-TiO2 had negligible effect when compared to undoped TiO2. None of
the M-TiO2 samples had lower photocatalytic activities when compared to the undoped
SG-TiO2. Under UV irradiation (> 320 nm), Pt-TiO2 and Rb-TiO2 had significantly
enhanced photocatalytic activities for MB degradation as well. However, Cr- and V-
TiO2, which had comparable kMB values to Pt-TiO2 under visible-light irradiation, had
slightly enhanced photocatalytic activities under UV irradiation.
In some case, the rates of degradation of MB were increased even with several M-
TiO2 samples that did not show extended visible-light absorption. For example, Rb-TiO2,
which has same absorption spectrum as undoped TiO2, gave a higher kMB value than
undoped TiO2 under visible-light irradiation. In a similar fashion, Ag- and Y-TiO2 also
showed slightly enhanced visible-light photocatalytic activities. Therefore, the enhanced
photocatalytic activities of Rb-, Ag-, and Y-TiO2 for MB degradation were not attributed
33
to efficient utilization of visible-light with M-TiO2. It might be due to other effects of
dopants located on the surface of TiO2 such as enhanced transfer of charge carriers
generated by visible-light absorbed MB molecules. Therefore, it suggests that MB seems
to be inappropriate as model compounds to evaluate photocatalytic activities of new
visible-light photocatalysts (i.e., modified TiO2), and visible-light photocatalytic activity
should be evaluated by various reactions. Yan et al.56 also reported that the photo-action
spectrum for photocatalytic degradation of MB under visible-light irradiation is similar to
the photoabsorption spectrum of the dye, which supports their suggestion that the MB
molecules directly absorb photons, and thus the photoexcited electrons may be injected
into the underlying M-TiO2. However, some studies only showed extended absorption of
modified photocatalysts into visible range and enhanced degradation rates of dyes as
compared to unmodified ones and then concluded that their modified photocatalysts have
intrinsic visible-light photoactivities.3,8,15,16,57,58
Iodide is oxidized readily by valence-band holes or surface-bound hydroxyl radical in
aqueous solution to from tri-iodide (I3) according to the reaction sequence:
..
2 3I I
vbI h I I I (2.2)
The production of I3 ions from I oxidation during photolysis in the presence of Pt-TiO2
and Cr-TiO2 is shown in Figure 2.7(a). No I3 was produced in the absences of TiO2
particles at > 400 nm and undoped TiO2 showed little photocatalytic activity with
respect to the net photo-oxidation of I to I3-. In contrast, Cr-TiO2 and Pt(IV)-TiO2 had
significantly enhanced photocatalytic activities with respect to iodide oxidation. Unlike
undoped TiO2, the production of I3 with Cr-TiO2 or Pt(IV)-TiO2 occurred in a relatively
fast at initial period of irradiation followed by an approach to a steady-state that may be
34
due to the reduction of I3 to I by conduction band electrons (i.e., the rate of the back
electron transfer reaction increases as the concentration of I3 ions increases and thus a
steady-state is achieved).
The comparative photocatalytic activities of the all M-TiO2 samples ranked in terms
of the total amount of I3 produced during 15 min of irradiation are given in Table 2.2.
Cr-TiO2 and Pt(IV)-TiO2 have substantially enhanced visible-light photocatalytic activity
for I oxidation, while Pt(II)-, V-, and Ni-TiO2 are slightly enhanced. In contrast, the
other M-TiO2 products had negligible activity during the 15 min reaction time. Unlike
the degradation reaction of MB, Ag-, Rb-, Y-, and La-TiO2 exhibited no enhanced effects
on visible-light activities with respect to I oxidation.
The oxidation of iodide in suspensions of Pt-, Cr-, V-, and Ni-TiO2, which showed
enhanced visible-light photocatalytic activities, were also investigated under UV
irradiation at > 320 nm. In the case of UV light illumination, Pt-TiO2 had a higher
photoactivity than undoped TiO2. However, the other M-TiO2 materials showed almost
same photocatalytic activities as undoped TiO2. Pt(II)-TiO2 had comparable
photocatalytic activities to Pt(IV)-TiO2 under UV irradiation, whereas it had lower
photoactivity than Pt(IV)-TiO2 under visible-light irradiation.
The photocatalytic degradation of phenol vs. time in suspensions of Pt-TiO2 and Cr-
TiO2 under visible-light irradiation is shown in Figure 2.7(b). Pt(IV)-TiO2 was also the
most effective photocatalyst for phenol degradation. Pt(II)-TiO2 and Cr-TiO2 also
showed significantly enhanced visible-light photocatalytic activity, while V-TiO2 had a
moderately enhanced photoactivity. The results in terms of phenol degradation were
similar to those observed for I oxidation. However, the other M-TiO2 materials did not
35
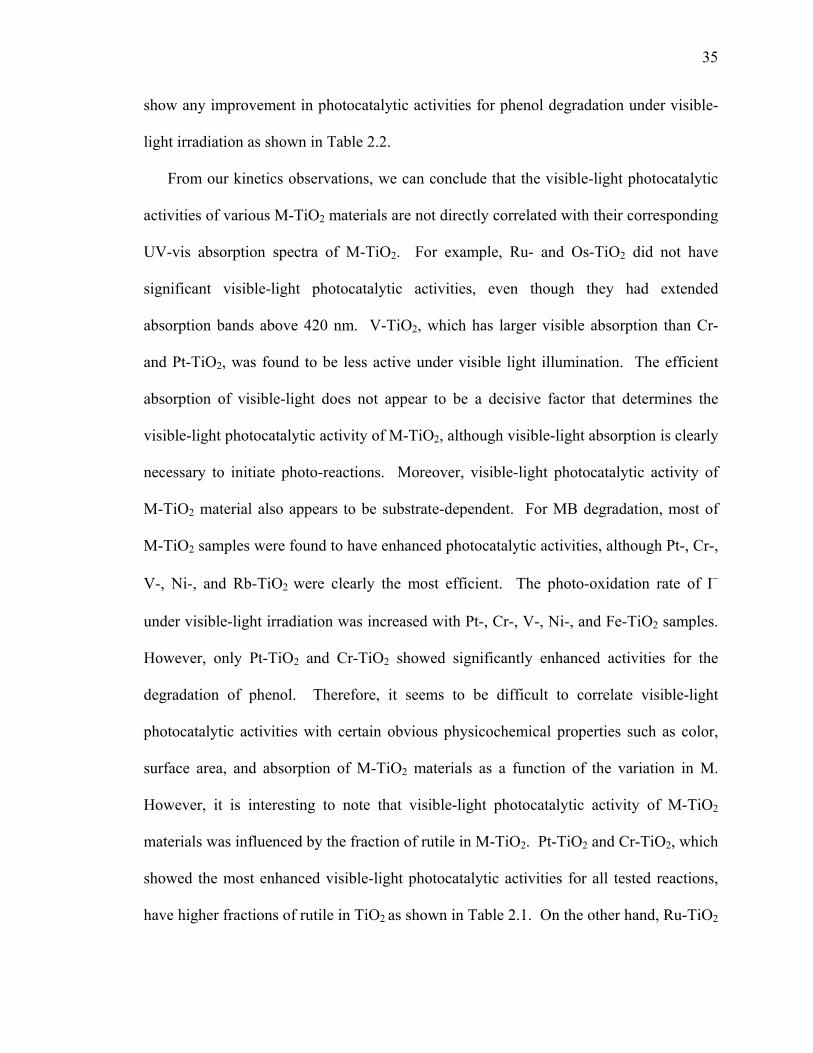
show any improvement in photocatalytic activities for phenol degradation under visible-
light irradiation as shown in Table 2.2.
From our kinetics observations, we can conclude that the visible-light photocatalytic
activities of various M-TiO2 materials are not directly correlated with their corresponding
UV-vis absorption spectra of M-TiO2. For example, Ru- and Os-TiO2 did not have
significant visible-light photocatalytic activities, even though they had extended
absorption bands above 420 nm. V-TiO2, which has larger visible absorption than Cr-
and Pt-TiO2, was found to be less active under visible light illumination. The efficient
absorption of visible-light does not appear to be a decisive factor that determines the
visible-light photocatalytic activity of M-TiO2, although visible-light absorption is clearly
necessary to initiate photo-reactions. Moreover, visible-light photocatalytic activity of
M-TiO2 material also appears to be substrate-dependent. For MB degradation, most of
M-TiO2 samples were found to have enhanced photocatalytic activities, although Pt-, Cr-,
V-, Ni-, and Rb-TiO2 were clearly the most efficient. The photo-oxidation rate of I
under visible-light irradiation was increased with Pt-, Cr-, V-, Ni-, and Fe-TiO2 samples.
However, only Pt-TiO2 and Cr-TiO2 showed significantly enhanced activities for the
degradation of phenol. Therefore, it seems to be difficult to correlate visible-light
photocatalytic activities with certain obvious physicochemical properties such as color,
surface area, and absorption of M-TiO2 materials as a function of the variation in M.
However, it is interesting to note that visible-light photocatalytic activity of M-TiO2
materials was influenced by the fraction of rutile in M-TiO2. Pt-TiO2 and Cr-TiO2, which
showed the most enhanced visible-light photocatalytic activities for all tested reactions,
have higher fractions of rutile in TiO2 as shown in Table 2.1. On the other hand, Ru-TiO2

36
and Os-TiO2, having pure anatase structure, did not show significantly enhanced visible-
light photocatalytic activities for all reactions, although they exhibited relatively large
absorption in visible region of the spectrum. In cases of Rb-TiO2 and Y-TiO2, even
though they had relatively high rutile contents, no enhancement in visible-light
photoactivity was observed, since they had no measurable absorption in the visible
region.
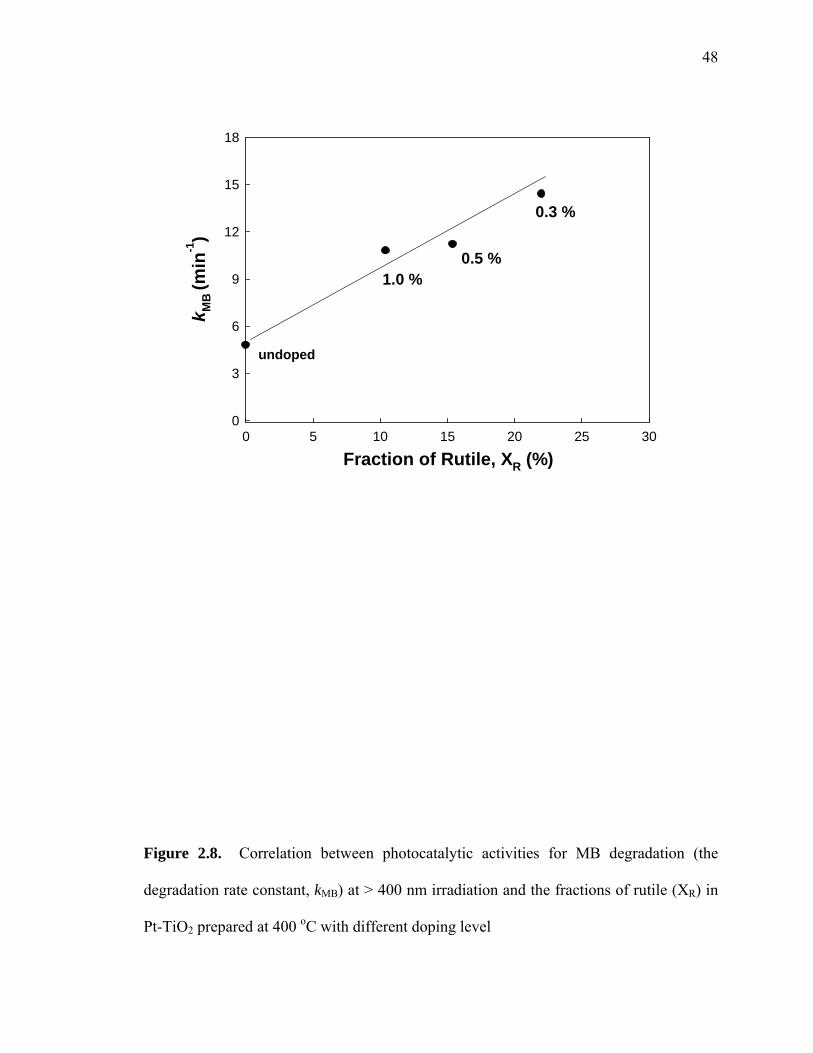
In order to investigate the effect of the fraction of rutile on visible-light photocatalytic
activity, the photo-bleaching and degradation rate constants of MB, kMB, under visible-
light irradiation were measured as a function of the fractional content of rutile, XR, in
Pt(II)-TiO2 calcined at 400 oC with different doping levels. As shown in Figure 2.8, kMB
is increased with an increasing fractional content of rutile in Pt-TiO2. This result
suggests clearly that the fractional content of rutile in TiO2 plays an important role in
photocatalytic activity in our experiments.
TiO2 particles in rutile phase are generally considered to be much less
photochemically active than their anatase phase counterparts.59-61 However, there are a
number of specific chemical reactions for which higher photoactivity has been reported
with rutile as the photocatalyst.62,63 For example, Kim et al.63 reported the Ni-TiO2 in the
rutile phase had a much higher photocatalytic activity than the anatase form of Ni-TiO2
for the decomposition of 4-chlorophenol under both UV and visible light irradiation,
whereas they found the anatase phase of undoped of TiO2 have higher photocatalytic
activity than undoped rutile. Furthermore, Torimoto and Ohtani59 established that the
photoactive crystalline phase of anatase/rutile mixed TiO2 powder is dependent even on
the kind of photocatalytic reaction. They observed that the photoreactivities of TiO2 in
37
anatase/rutile mixed phase for H2 production were between pure anatase and pure rutile
and shifted toward that of pure rutile with increase of rutile fraction; whereas the
photoreactivities of mixed TiO2 for Ag deposition and acetic acid decomposition were
similar to that of pure rutile and pure anatase phases, respectively, and not dependent on
the rutile fraction. In addition, it has been reported that TiO2 in anatase/rutile mixed
phases have higher activity than the pure anatase phase alone under UV irradiation.60,64,65
Another example from our study shows that the visible-light photocatalytic activity of
Pt(II)-TiO2 with respect to I oxidation is strongly influenced by the calcination
temperature. The photocatalytic activity of Pt-TiO2 gave a maximum at 400 oC where a
mixed rutile/anatase structure of Pt-TiO2 predominates. The pure anatase end member of
Pt-TiO2 at 200 oC and pure rutile end member of Pt-TiO2 at 700 oC clearly were less
photoactive than mixed-phase structural form of Pt-TiO2 at 400 oC.
Higher photocatalytic activities of Pt-TiO2 or Cr-TiO2 having a significant fraction of
the rutile phase due to calcinations at 400 oC may be due to a larger number of oxygen
vacancies66-68 For example, Li et al.68 proposed that the formation of sub-energy defect
level in Ce-TiO2 may be one of the critical reasons to reduce the recombination of
electron-hole pairs and to enhance photocatalytic activity. Ihara et al. also reported that
the oxygen deficient TiO2 induced by RF H2 plasma treatment (without doping) absorbed
visible light and showed visible light photocatalytic activity.69,70 In a similar fashion, the
formation of oxygen vacancies in Pt-TiO2 or Cr-TiO2, which results in a lowering of the
temperature of the A-R phase transformation leading to a rutile structure at 400 oC,
appears to lead to an enhancement of the photocatalytic activities of M-TiO2 under
visible-light irradiation.

38
Our group previously investigated metal-ion doping on photocatalytic activities of
TiO2 under UV light irradiation in terms of the transient charge-carrier recombination
dynamics.19,42,71,72 Choi et al.19 used laser flash photolysis measurements to show that the
lifetimes of the blue electron in the Fe-, V-, Mo-, and Ru-doped TiO2 were increased to
~50 ms, whereas undoped Q-sized TiO2 had a shorter lifetime of < 200 s. Hoffmann
and co-workers found a good correlation between experimental quantum yields for
oxidation or reduction and the measured absorption signals of the charge carriers that
survived from recombination over nano- to microsecond time domain (i.e., an increase in
concentration of the long-lived charge carriers is expected to result in higher
photoreactivity). In addition, Martin et al.42,71,72 used time-resolved microwave
conductivity (TRMC) measurements of various TiO2 samples including V-TiO2 and Fe-
TiO2. The charge-carrier recombination lifetime and the interfacial electron-transfer rate
constants were estimated from the decays of TRMC signals and also found to correlate
well with measured quantum efficiencies. Furthermore, in the case of V-doped TiO2, the
vanadium doping was shown to influence photoreactivity varied in samples prepared at
different sintering temperatures.42 For examples, V(IV) is found to reduce the
photoreactivity of TiO2 by promoting charge-carrier recombination via electron trapping
at >VO2+ present in V-TiO2 (25 oC) or via hole trapping at V(IV) impurities in surficial
V2O5 islands on V-TiO2 (200 or 400 oC); whereas in case of V-TiO2 prepared at 600 or
800 oC, substitutional V(IV) in the lattice of TiO2 appears to act as a charge-carrier
recombination center that resulted in reduced photoreactivity. The above observations
emphasize that metal-ion dopants influence the photoreactivity of TiO2 by altering the
charge-carrier recombination and interfacial charge-transfer rate constants. In

39
conclusion, we believe that these effects are also important for the M-TiO2 materials
prepared as part of this study as well.
Conclusions
In conclusion, we have synthesized an array of metal-doped titanium dioxide
materials, M-TiO2, in order to evaluate their visible-light photocatalytic activities. Pt-,
Cr-, V-, Fe-, Rb-, Y-TiO2 lowered the temperature of the anatase-to-rutile phase
transformation whereas Ru-TiO2 increased the temperature of A-R phase transformation.
The fraction of rutile in M-TiO2 is observed to be dependent on the doping level.
However, there appears to be no correlation between the effectiveness of an individual
dopant on the A-R phase transformation and its valence state or ionic radius, as
previously suggested.47,48 The majority of M-TiO2 materials prepared herein gave
absorption spectra that were extended into visible beyond 400 nm. Ag-, Rb-, Y-, and La-
TiO2 did not change the original absorption spectrum of pristine SG-TiO2. As verified by
EDS analysis, the latter group of ions were most likely not incorporated into the lattice of
TiO2 and most likely concentrated in near surface region because of their relatively large
ionic radii. The photocatalytic activities of M-TiO2 were evaluated for MB degradation,
I oxidation, and phenol degradation under visible-light irradiation at > 400 nm. Pt-
TiO2 and Cr-TiO2, which were prepared at a 0.3 at% doping level and annealed at 400 oC,
had a relatively high fraction of rutile and showed significantly enhanced photocatalytic
activity compared to SG-TiO2 for all test reactions under visible-light irradiation. These
results indicate that the presence of the rutile structure in the doped TiO2 may affect
photocatalytic activities of M-TiO2. Pt-TiO2 substantially improved the observed
40
photocatalytic activity under UV irradiation at > 320 nm as well. On the other hand, V-
, Rb-, Ni-, and Fe-TiO2 showed visible-light photocatalytic activities only for one or two
of the three test reactions.
Acknowledgements
We gratefully acknowledge the generous support for this research that has been
provided by the Northrop-Grumman Corporation. In particular, we would like to give
special credit to Dr. Ronald Pirich for his enthusiastic encouragement and intellectual
support for our joint projects over the years.

41
2Theta (degree)20 30 40 50 60
Int.
(a
.u.)
0
200
400
600
800
N.H.
400 oC
700 oC
(a)
A
A
R
R
A
RRA A
2Theta (degree)20 30 40 50 60
Int.
(a.
u.)
0
200
400
600
800
N.H.
400 oC
700 oC
(b)
A
A
A
R
RR
R
R
RR
R
R
2Theta (degree) 20 30 40 50 60
Int.
(a.
u.)
0
200
400
600
800
N.H.
400 oC
700 oC
(c)A
A A A
Figure 2.1. X-ray diffraction pattern measured for (a) 0.3 at.% La-TiO2, (b) 0.3 at.% Pt-
TiO2, (c) 0.3 at.% Ru-TiO2 with various calcination temperatures (at 700 oC, 400 oC, and
no heat treatment)
42
Pt doping level (at.%)
0.0 0.2 0.4 0.6 0.8 1.0 1.2
XR
(%)
0
5
10
15
20
25
30
Figure 2.2. The fraction of rutile (%) as a function of doping level of Pt(II) in TiO2
(at.%). Samples have been prepared by sol-gel method and calcined at 400 oC for 1 hour.

43
Valence state of dopant
1 2 3 4
XR (
%)
0
10
20
30
40
(a)
ionic radius of dopant ( )
0.6 0.8 1.0 1.2 1.4
XR (
%)
0
10
20
30
40
Å
(b)
Figure 2.3. The fraction of rutile phase (%) in M-TiO2 as a function of (a) valence state
of dopant and (b) ionic radius of trivalent ion dopants
44
Calcination Temperature (oC)
0 200 400 600 8000
50
100
150
200
250
0
20
40
60
80
100
XR
(%)
Su
rfac
e A
rea
(m2 /g
)
Figure 2.4. BET surface area and the fraction of rutile (XR) of 0.3 at.% Pt-TiO2 as
function of calcination temperature.
45
Figure 2.5. SEM images of (a) 0.3 at.% Pt-TiO2 and (b) 0.3 at.% Cr-TiO2 synthesized by
sol-gel method with 400 oC calcination.
46
Wavelength (nm)
300 400 500 600
Ab
s. (
a.u
.)
A
C D
B
(a)A. TiO2-SG
B. Fe-TiO2
C. Cu-TiO2
D. Ni-TiO2
P25
Wavelength (nm)
300 400 500 600 700
Ab
s. (
a.u
.)
A
D
(b)A. TiO2-SG
B. Co-TiO2
C. Os-TiO2
D. V-TiO2
E. Ru-TiO2
F. Cr-TiO2
BC
E
F
Wavelength (nm)
300 400 500 600 700
Ab
s. (
a.u
.)
A BC
(c)A. TiO2-SG
B. Pt(IV)-TiO2
C. Pt(II)-TiO2
Figure 2.6. UV-vis diffuse reflectance spectra (DRS) for various M-TiO2 samples (0.3
at.% doping). Absorption spectra for Ag-, Rb-, Y-, and La- TiO2 samples, which are not
shown here, are identical with that of undoped TiO2.

47
Irradiation Time (min)
0 3 6 9 12 15 18
[tri
-io
did
e] (
uM
)
0
5
10
15
20
25
30
35
Pt(IV)
Cr
undopedTiO2
Pt(II)
(a)
Irradiation Time (hr)
0 1 2 3 4
[Ph
OH
] /
[Ph
OH
] o
0.0
0.2
0.4
0.6
0.8
1.0
1.2
Cr
undoped
direct photolysis
Pt(II)Pt(IV)
(b)
Figure 2.7. Visible-light photocatalytic activities of 0.3 at.% Pt-TiO2 and 0.3 at.% Cr-
TiO2: (a) The production of tri-iodide by iodide oxidation with [I]0 = 50 mM, (b) the
degradation of phenol with [phenol]0 = 50 M. (total volume = 30 mL, 1 g/L suspension,
500 W, > 400 nm)
48
Fraction of Rutile, XR (%)0 5 10 15 20 25 30
k MB
(min
-1)
0
3
6
9
12
15
18
0.3 %
1.0 %0.5 %
undoped
Figure 2.8. Correlation between photocatalytic activities for MB degradation (the
degradation rate constant, kMB) at > 400 nm irradiation and the fractions of rutile (XR) in
Pt-TiO2 prepared at 400 oC with different doping level

49
temp vs KMB
Calcination Temperature (oC)
0 200 400 600 8000
3
6
9
0
20
40
60
80
100
120
XR
(%)XR
[tri
-io
did
e] (M
)
Figure 2.9. Photocatalytic activities for I oxidation in terms of the amount of I3 (M)
produced after 6 min at > 400 nm irradiation and the fractions of rutile (XR) of 0.3 at.%
Pt-TiO2 as function of calcination temperature
50
TABLE 2.1: Ionic radii of dopants, rutile content by XRD, surface area, and color of
various metal ion-doped TiO2 nanoparticles (at 0.3 at.% doping)
a from literature: Shannon, R. D. Acta Crystallographica Section A 1976, 32, 751. b values for high spin in literature (a) c value for Os (IV), no available value for Os (III) in literature (a) d from literature: Ryu, J. Environ. Sci. Technol. 2008, 42, 294. e with samples before heat treatment
Dopant Ion size a
(Å)
Rutile
(%)
Surface Area
(m2g-1)
Colore
@ 400 oC calcination
Undoped TiO2 0.745 0 104 White
Pt (II) 0.940 22 111 Light brown
Pt (IV) 0.765 26 106 Light brown
Cr (III) 0.755 34 115 Green
Cr (VI) 0.580 29 125 Green
V (III) 0.780 13 132 Orange
Ru (III) 0.820 0 112 Dark brown
Ni (II) 0.830 0 112 Green
Fe (III) 0.785b 13 113 Light orange
Co (II) 0.885b 0 102 Light yellow
Cu (II) 0.870 0 110 Light green
Os (III) 0.770c 0 117 Light brown
Ag (I) 1.290 0 117 White
Rb (I) 1.660 19 108 White
Y (III) 1.040 18 121 White
La (III) 1.170 0 132 White
@ 700 oC calcination
Undoped TiO2 15
Pt (II) 100
Y (III) 62
La (III) 18
Ru (III) 3

51
TABLE 2.2: Visible-light photocatalytic activities of various M-TiO2 samples for the
degradation of methylene blue (MB), the oxidation of iodide (I), and the degradation of
phenol (PhOH)
Dopant kMB (min-1) [I3]prod.15min (M) kPhOH (hr-1)
Vis UV Vis UV Vis
Direct Photolysis 0.003 0.011 0 0 0
Undoped TiO2 0.005 0.014 10 24 0.09
Pt (II) 0.014 0.053 19 40 0.80
Pt (IV) 0.013 0.057 32 42 1.29
Cr (III) 0.013 0.016 27 25 0.36
V (III) 0.012 0.015 16 21 0.13
Ni (II) 0.011 0.010 15 27 0.09
Ru (III) 0.005 0.007 8 0.07
Fe (III) 0.007 0.015 12 0.10
Cu (II) 0.009 0.016 8 0.08
Co (II) 0.009 0.015 12 0.11
Os (III) 0.009 0.013 12 0.09
Ag (I) 0.008 0.016 12 0.07
Rb (I) 0.011 0.033 12 0.07
Y (III) 0.007 0.018 9 0.08
La (III) 0.005 0.016 10 0.10
52
References
(1) Zhang, X. W.; Lei, L. C. Mater. Lett. 2008, 62, 895.
(2) Nahar, S.; Hasegawa, K.; Kagaya, S. Chemosphere 2006, 65, 1976.
(3) Zhu, J. F.; Chen, F.; Zhang, J. L.; Chen, H. J.; Anpo, M. J. Photochem. Photobiol.
A-Chem. 2006, 180, 196.
(4) Niishiro, R.; Kato, H.; Kudo, A. Phys. Chem. Chem. Phys. 2005, 7, 2241.
(5) Kim, D. H.; Lee, K. S.; Kim, Y. S.; Chung, Y. C.; Kim, S. J. J. Am. Ceram. Soc.
2006, 89, 515.
(6) Iketani, K.; Sun, R. D.; Toki, M.; Hirota, K.; Yamaguchi, O. Mater. Sci. Eng., B
2004, 108, 187.
(7) Klosek, S.; Raftery, D. J. Phys. Chem. B 2001, 105, 2815.
(8) Wu, J. C. S.; Chen, C. H. J. Photochem. Photobiol., A 2004, 163, 509.
(9) Borgarello, E.; Kiwi, J.; Gratzel, M.; Pelizzetti, E.; Visca, M. J. Am. Chem. Soc.
1982, 104, 2996.
(10) Anpo, M.; Ichihashi, Y.; Takeuchi, M.; Yamashita, H. Sci. Technol. Catal. 1999,
121, 305.
(11) Pan, C. C.; Wu, J. C. S. Mater. Chem. Phys. 2006, 100, 102.
(12) Asahi, R.; Morikawa, T.; Ohwaki, T.; Aoki, K.; Taga, Y. Science 2001, 293, 269.
(13) Gole, J. L.; Stout, J. D.; Burda, C.; Lou, Y. B.; Chen, X. B. J. Phys. Chem. B
2004, 108, 1230.
(14) Mrowetz, M.; Balcerski, W.; Colussi, A. J.; Hoffman, M. R. J. Phys. Chem. B
2004, 108, 17269.
(15) Umebayashi, T.; Yamaki, T.; Tanaka, S.; Asai, K. Chem. Lett. 2003, 32, 330.
(16) Wang, Y.; Meng, Y. L.; Ding, H. M.; Shan, Y. K.; Zhao, X.; Tang, X. Z. J. Phys.

53
Chem. C 2008, 112, 6620.
(17) Yang, X.; Cao, C.; Hohn, K.; Erickson, L.; Maghirang, R.; Hamal, D.; Klabunde,
K. J. Catal. 2007, 252, 296.
(18) Tachikawa, T.; Tojo, S.; Kawai, K.; Endo, M.; Fujitsuka, M.; Ohno, T.;
Nishijima, K.; Miyamoto, Z.; Majima, T. J. Phys. Chem. B 2004, 108, 19299.
(19) Choi, W. Y.; Termin, A.; Hoffmann, M. R. J. Phys. Chem. 1994, 98, 13669.
(20) Karakitsou, K. E.; Verykios, X. E. J. Phys. Chem. 1993, 97, 1184.
(21) Soria, J.; Conesa, J. C.; Augugliaro, V.; Palmisano, L.; Schiavello, M.; Sclafani,
A. J. Phys. Chem. 1991, 95, 274.
(22) Chen, J. H.; Yao, M. S.; Wang, X. L. J. Nano. Res. 2008, 10, 163.
(23) Di Paola, A.; Garcia-Lopez, E.; Ikeda, S.; Marci, G.; Ohtani, B.; Palmisano, L.
Catal. Today 2002, 75, 87.
(24) Kim, S.; Hwang, S. J.; Choi, W. Y. J. Phys. Chem. B 2005, 109, 24260.
(25) Ohno, T.; Tanigawa, F.; Fujihara, K.; Izumi, S.; Matsumura, M. J. Photochem.
Photobiol. A-Chem. 1999, 127, 107.
(26) Amadelli, R.; Samiolo, L.; Maldotti, A.; Molinari, A.; Valigi, M.; Gazzoli, D. Int.
J. Photoenergy 2008,
(27) Iwasaki, M.; Hara, M.; Kawada, H.; Tada, H.; Ito, S. J. Colloid Interface Sci.
2000, 224, 202.
(28) Anpo, M. Pure Appl. Chem. 2000, 72, 1787.
(29) Amadelli, R.; Samiolo, L.; Maldotti, A.; Molinari, A.; Valigi, M.; Gazzoli, D. Int.
J. Photoenergy 2008, 9.
(30) Lettmann, C.; Hinrichs, H.; Maier, W. F. Angew. Che., Int. Ed. 2001, 40, 3160.
54
(31) Woodhouse, M.; Parkinson, B. A. Chem. Soc. Rev. 2009, 38, 197.
(32) Sohn, J. M.; Oh, K. S.; Woo, S. I. Korean J. Chem. Eng. 2004, 21, 123.
(33) Ding, Z.; Lu, G. Q.; Greenfield, P. F. J. Phys. Chem. B 2000, 104, 4815.
(34) Jing, L. Q.; Sun, X. J.; Xin, B. F.; Wang, B. Q.; Cai, W. M.; Fu, H. G. J. Solid
State Chem. 2004, 177, 3375.
(35) Pillai, S. C.; Periyat, P.; George, R.; McCormack, D. E.; Seery, M. K.; Hayden,
H.; Colreavy, J.; Corr, D.; Hinder, S. J. J. Phys. Chem. C 2007, 111, 1605.
(36) Anderson, C.; Bard, A. J. J. Phys. Chem. B 1997, 101, 2611.
(37) Spurr, R. A.; Myers, H. Anal. Chem. 1957, 29, 760.
(38) Ghosh, S. K.; Vasudevan, A. K.; Rao, P. P.; Warrier, K. G. K. Br. Ceram. Trans.
2001, 100, 151.
(39) Borkar, S. A.; Dharwadkar, S. R. J. Therm. Anal. Calorim. 2004, 78, 761.
(40) Matteucci, F.; Cruciani, G.; Dondi, M.; Raimondo, M. Ceram. Int. 2006, 32, 385.
(41) Iida, Y.; Ozaki, S. J. Am. Ceram. Soc. 1961, 44, 120.
(42) Martin, S. T.; Morrison, C. L.; Hoffmann, M. R. J. Phys. Chem. 1994, 98, 13695.
(43) Ruiz, A. M.; Sakai, G.; Cornet, A.; Shimanoe, K.; Morante, J. R.; Yamazoe, N.
Sensors and Actuators B-Chemical 2003, 93, 509.
(44) Sibu, C. P.; Kumar, S. R.; Mukundan, P.; Warrier, K. G. K. Chem. Mater. 2002,
14, 2876.
(45) Ruiz, A. M.; Cornet, A.; Morante, J. R. Sens. Actuators, B 2004, 100, 256.
(46) Ogata, S.; Iyetomi, H.; Tsuruta, K.; Shimojo, F.; Nakano, A.; Kalia, R. K.;
Vashishta, P. J. Appl. Phys. 2000, 88, 6011.
(47) Shannon, R. D.; Pask, J. A. J. Am. Ceram. Soc. 1965, 48, 391.
55
(48) Mackenzie, K. J. D. Trans. J. British Ceram. Soc. 1975, 74, 29.
(49) Umebayashi, T.; Yamaki, T.; Itoh, H.; Asai, K. J. Phys. Chem. Solids 2002, 63,
1909.
(50) Zhao, Z. Y.; Liu, Q. J.; Zhang, J.; Zhu, Z. Q. Acta Physica Sinica 2007, 56, 6592.
(51) Kudo, A.; Niishiro, R.; Iwase, A.; Kato, H. Chem. Phys. 2007, 339, 104.
(52) Kuznetsov, V. N.; Serpone, N. J. Phys. Chem. B 2006, 110, 25203.
(53) Serpone, N. J. Phys. Chem. B 2006, 110, 24287.
(54) Lisachenko, A. A.; Kuznetsov, V. N.; Zakharov, M. N.; Mikhailov, R. V. Kinet.
Catal. 2004, 45, 189.
(55) Kuznetsov, V. N.; Krutitskaya, T. K. Kinet. Catal. 1996, 37, 446.
(56) Yan, X. L.; Ohno, T.; Nishijima, K.; Abe, R.; Ohtani, B. Chem. Phys. Lett. 2006,
429, 606.
(57) Ohno, T.; Tsubota, T.; Nishijima, K.; Miyamoto, Z. Chem. Lett. 2004, 33, 750.
(58) Bettinelli, M.; Dallacasa, V.; Falcomer, D.; Fornasiero, P.; Gombac, V.; Montini,
T.; Romano, L.; Speghini, A. J. Hazard. Mater. 2007, 146, 529.
(59) Torimoto, T.; Nakamura, N.; Ikeda, S.; Ohtani, B. Phys. Chem. Chem. Phys.
2002, 4, 5910.
(60) Zhang, Q. H.; Gao, L.; Guo, J. K. Appl. Catal., B 2000, 26, 207.
(61) Lucarelli, L.; Nadtochenko, V.; Kiwi, J. Langmuir 2000, 16, 1102.
(62) Addamo, M.; Bellardita, M.; Di Paola, A.; Palmisano, L. Chem. Commun. 2006,
4943.
(63) Kim, D. H.; Choi, D. K.; Kim, S. J.; Lee, K. S. Catal. Commun. 2008, 9, 654.
(64) Bakardjieva, S.; Subrt, J.; Stengl, V.; Dianez, M. J.; Sayagues, M. J. Appl. Catal.,

56
B 2005, 58, 193.
(65) Jung, K. Y.; Park, S. B. J. Photochem. Photobiol. A-Chem. 1999, 127, 117.
(66) Yang, J.; Bai, H. Z.; Jiang, Q.; Lian, H. S. Thin Solid Films 2008, 516, 1736.
(67) Kim, H. Y.; Lee, H. M.; Pala, R. G. S.; Shapovalov, V.; Metiu, H. J. Phys. Chem.
C 2008, 112, 12398.
(68) Li, F. B.; Li, X. Z.; Hou, M. F.; Cheah, K. W.; Choy, W. C. H. Appl. Catal., A
2005, 285, 181.
(69) Ihara, T.; Miyoshi, M.; Ando, M.; Sugihara, S.; Iriyama, Y. J. Mater. Sci. 2001,
36, 4201.
(70) Ihara, T.; Miyoshi, M.; Iriyama, Y.; Matsumoto, O.; Sugihara, S. Appl. Catal., B
2003, 42, 403.
(71) Martin, S. T.; Herrmann, H.; Choi, W. Y.; Hoffmann, M. R. Journal of the
Chemical Society-Faraday Transactions 1994, 90, 3315.
(72) Martin, S. T.; Herrmann, H.; Hoffmann, M. R. Journal of the Chemical Society-
Faraday Transactions 1994, 90, 3323.
Top Related