


![VENTURE CAPITAL FOR SUSTAINABILITY 2007 REPORT [2007] Venture Capital... · growing sector as Venture Capital for Sustainability ... Venture Capitalists’ stake in ... Venture Capital](https://static.fdocuments.us/doc/165x107/5a7926b77f8b9a00168dc540/venture-capital-for-sustainability-2007-2007-venture-capitalgrowing-sector.jpg)
Languages
Pages
Legal


Effects of Corporate Venture Capital activity, Vacillation frequency and
Vacillation Intensity on Firm Performance.
Examining the influence of Corporate Venture Capital, Vacillation frequency and Vacillation
intensity on Firm Performance
Master thesis Strategic Management
Corporate Venture Capital
Timans, D.G.A. (Danique)
s4359291
S. Khanagha
Radboud University Nijmegen
Faculty of Management
Business Administration
18-06-2018

1
Table of Contents
Abstract ................................................................................................................................................... 4
Acknowledgement ................................................................................................................................... 5
1. Introduction ......................................................................................................................................... 6
2. Theory Review .................................................................................................................................... 9
2.1 Corporate Venture Capital ............................................................................................................. 9
2.1.1 Characteristics of Corporate Venture Capital ....................................................................... 10
2.1.2 Process of Corporate Venture Capital .................................................................................. 12
2.1.3 CVC-Framework by Chesbrough (2002) ............................................................................. 13
2.2 Vacillation ................................................................................................................................... 15
2.2.1 Exploration and Exploitation ................................................................................................ 16
2.2.2 Organizational Ambidexterity .............................................................................................. 18
2.2.3 Vacillation between exploration and exploitation ................................................................ 20
3. Data and Measures ............................................................................................................................ 23
3.1 Data and Sample .......................................................................................................................... 23
3.2 Measures ...................................................................................................................................... 24
3.2.1 Dependent Variable .............................................................................................................. 25
3.2.2 Independent Variables .......................................................................................................... 26
3.2.3 Control Variables ................................................................................................................. 29
3.3 Panel Data and Research Method .................................................................................................... 30
4. Results ............................................................................................................................................... 31
4.1 Fixed or Random effects model .................................................................................................. 32
4.2 Hypothesis Testing ...................................................................................................................... 33
4.3 Additional Analysis ..................................................................................................................... 36
4.3.1 Energy Sector ....................................................................................................................... 38
4.3.2 Health Care Sector ................................................................................................................ 39
4.3.3 Technology Sector ................................................................................................................ 41
4.3.4 Total Sample versus Subsamples ......................................................................................... 43
5. Conclusion and Discussion ............................................................................................................... 45
5.1 Practical implications .................................................................................................................. 48
5.2 Limitations and Further Research ............................................................................................... 49
6. References ......................................................................................................................................... 50
7. Appendix ........................................................................................................................................... 55
7.1 VIF-scores ................................................................................................................................... 55
7.2 Pre analysis Tests ........................................................................................................................ 55
7.3 Hypotheses testing ....................................................................................................................... 56

2
7.3.1 Model 1 ................................................................................................................................. 56
7.3.2 Model 2 ................................................................................................................................. 57
7.3.3 Model 3 ................................................................................................................................. 58
7.4 Additional Analysis ..................................................................................................................... 59
7.4.1 Organizational focus and Firm performance ........................................................................ 59
7.4.2 Organizational focus and CVC activity ................................................................................ 60
7.4.3 Firm Size and CVC Activity ................................................................................................ 61
7.4.4 CVC activity and Firm growth ............................................................................................. 62
7.4.5 Energy Sector ....................................................................................................................... 63
7.4.6 Health Care Sector ................................................................................................................ 66
7.4.7 Technology Sector ................................................................................................................ 68

3
Overview of Figures
Figure 1, Number of active CVC units 6
Figure 2, basic conceptual model 9
Figure 3, CVC-framework 13
Figure 4, Global CVC deal share by continent 2015 and annual number of global CVC deals 23
Figure 5, overview of the different sectors included in the final sample 24
Figure 6, Conceptual model with the corresponding measures 25
Figure 7, Tobin’s Q Formula 26
Figure 8, Organizational focus formula 28
Figure 9, Vacillation intensity formula 29
Figure 10, Inverted U-curves of both frequency and intensity 34
Figure 11, Interaction terms 35
Figure 12, interaction term health care sector 40
Figure 13, interaction term technology sector 41
Overview of Tables
Table 1, Collinearity matrix 31
Table 2, Pre analysis tests 32
Table 3, Results of the random effects model regression 35
Table 4, Overview hypotheses 36
Table 5, Results of the random effects model regression in the energy sector 37
Table 6, Results of the random effects model regression in the energy sector 39
Table 7, Results of the random effects model regression in the health care sector 40
Table 8, Results of the random effects model regression in the technology sector 42
Table 9, Overview Hypotheses regarding the different samples 44

4
Abstract
The increasing importance of innovation goes along with an increase in costs of internal
innovation. Due to this, organizations seek for alternative ways of innovating. This said,
organizations increasingly conduct venture capital investments as a complement or alternative
way for their own research and development, with the goal of bolstering their performance
(Chesbrough, 2002). Organizations explore the environment for ventures with valuable
knowledge, products or innovating capabilities and invest in these by means of venture
capital. However, in order to benefit from this exploration, organizations need to exploit the
gained knowledge, products or innovations. Thus, there is a need for both exploration as
exploitation in order to benefit from venture capital activity. This is where the vacillation
theory becomes relevant. Vacillation is the dynamic process of ‘oscillating’ between
structures supporting either exploration or exploitation to achieve the state of ambidexterity
(Brown and Eisenhardt, 1997). However, despite the attention paid to both the concepts, there
has been no research conducted focusing on the relationship between the organization’s
structure/focus and corporate entrepreneurship. This study aims to narrow the scientific gap
by examining the interplay between corporate venture capital activity and vacillation between
structures supporting either exploration or exploitation.
The study was conducted by using 4 year panel data from 150 large North American
corporations, excluding financial institutions. The results indicate that both frequency and
intensity of vacillation have an inverted U-curve relationship with firm performance.
Furthermore, vacillation intensity positively moderates the relationship between corporate
venture capital activity and firm performance. In conclusion, the results of this study provides
new insights into the interplay between corporate venture capital activity and vacillation, with
the goal of supporting senior managers in their understanding and the utilization of both
concepts.
Keywords: Corporate venture capital, exploration, exploitation, vacillation

5
Acknowledgement
The process of writing this thesis was hard, but very instructive. During the process of
writing, a lot of people supported me and provided help if needed. This said, I want to thank
several people.
First, I would like to thank my supervisor Dr. Saeed Khanagha for his help and support during
the process. Especially in the beginning, when I was searching for an appropriate research
subject, his help was of great importance.
Second, I would like to thank my parents for their support, not only during the process, but
during the entire 5 years of study. They supported me from the beginning, even during the
times my study was on the second plan and I preferred the social activities in the city of
Nijmegen.
Third, I would like to thank my friends for their endless support, both socially and study
related. Without them, my time in Nijmegen would not be that great as it was.
Last but not least, I would like to thank Carlijn van Helmond, Thomas Pesiwarissa, Arnoud
van Leeuwen and Niek Minkels for their support and pleasant collaboration during my
master. Without them, I would have a much harder time studying for the exams and working
on projects.
Many Thanks!
6
1. Introduction
Since the introduction of corporate venturing in the early 60’s, corporate venturing evolved
following several waves. The fourth and current wave, starting at the beginning of this
century, is characterized by enormous growth. According to data from CB insights, the
number of corporate venturing units rose from 181 at the beginning of the century to more
than 1500 at the beginning of 2016. One of the major reasons for this growth is the increasing
importance and speed of innovation, along with the increasing uncertainty and shorter
product-life cycles. More than ever, organizations need to be reactive and adapt to the
changing environment (Trott, 2005) . This said, corporate venturing is ‘the set of
organizational systems, processes and practices that focus on creating businesses in existing
or new fields, markets or industries—using internal and external means’ (Narayanan, Yang
and Zahra, 2009, p.59). Corporate venturing practices can take many forms, with joint
venturing, licensing, acquisitions and corporate venture capital as the most used forms
(Narayanan et al, 2009). This last form, corporate venture capital, is one of the two central
topics in this research and is defined as ‘any equity investment made by non-financial
corporations in start-up companies, for strategic and financial purposes’ (Narayanan et al,
2009, p.64).
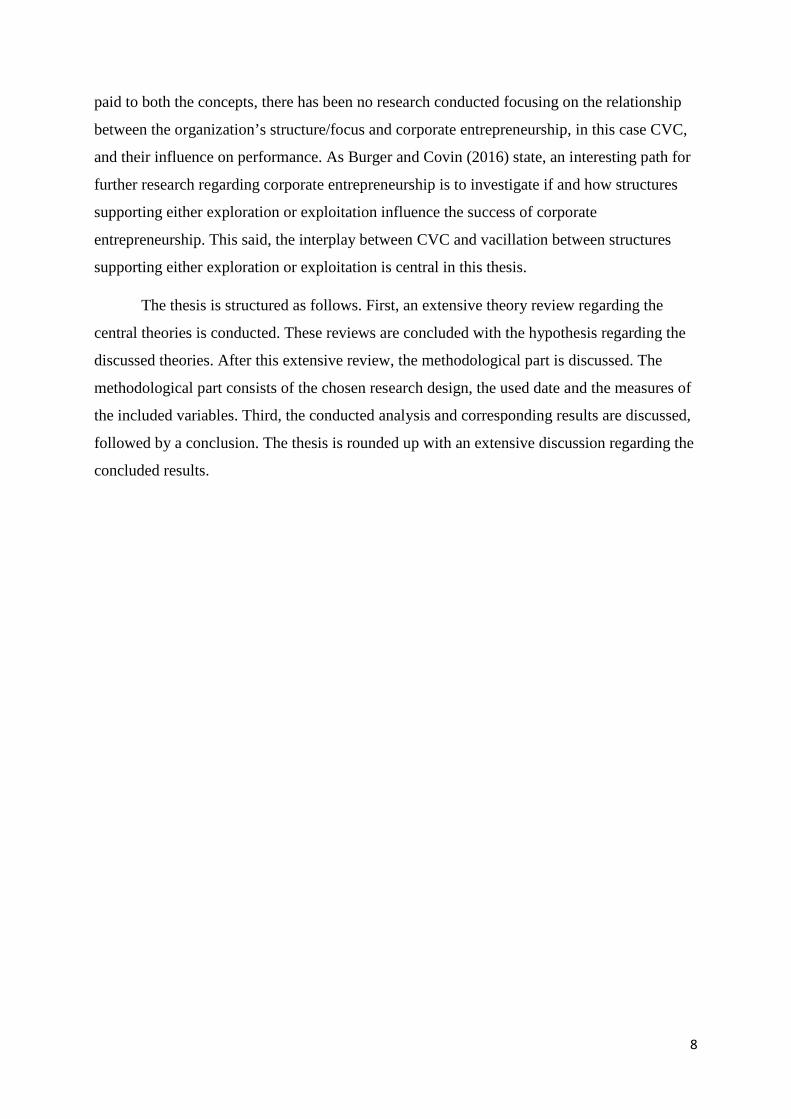
Along with the enormous growth of corporate venturing, corporate venture capital rose
in popularity. According to the data from CB insights in 2017, a total of 186 newly set-up
CVC (corporate venture capital) units invested for the first time. In comparison with the data
from 2016, this number increased with 66 percent. As is indicated in figure 1, the total
number of active CVC units worldwide rose from 482 in 2013 to 1067 in 2017, which is a
tremendous increase of 221 percent. Again, a major reason for this growth is the increasing
importance and speed of innovation. However, this increasing importance of innovation goes
along with an increase in costs of internal innovation, or in other
words, research and development. Due to this, organizations
seek for alternative ways of innovating. Thus, organizations
increasingly conduct CVC-investments as a complement or
alternative way for their own research and development, with
the goal of bolstering their performance (Chesbrough, 2002).
Figure 1, Number of active CVC units (CB insights, 2017)

7
By doing this, organizations explore the environment for ventures with valuable
knowledge, products or innovating capabilities. However, in order to benefit from this
exploration, organizations need to exploit the gained knowledge, products or innovation. In
addition, the process of exploring and investing in CVC-activities is a costly process, which
needs to be funded by the exploitative activities of the organization (March, 1991; Levinthal
and March, 1993; O’Reilly and Tushman, 2004; Boumgarden, Nickerson and Zenger, 2012).
Thus, it is essential for organizations to conduct both explorative as exploitative activities. A
strategy for achieving this, is by ‘oscillating’ or ‘vacillating’ between semi structures
supporting either exploration or exploitation (Brown and Eisenhardt, 1997; Rosenkopf and
Nerkar, 2001; Nickerson and Zenger, 2002; Kang, Kang and Kim, 2017). Boumgarden et al
(2012) define the strategy of vacillation as ‘a dynamic approach to achieving high
performance through simultaneously high levels of exploration and exploitation’
(Boumgarden et al, 2012, p.591). Thus, the organization’s goal, just as with corporate venture
capital, is to achieve high performance. This said, it is essential for organizations and their
senior management to understand how corporate venture capital and vacillation influence firm
performance, and then especially, how both influence each other with respect to performance.
This brings us to the following central research question in this research.
What are the implications of the vacillation strategy, with regard to the relation between
corporate venture capital and firm performance?
The vacillation strategy of firms is measured by either determining the frequency of
vacillation and the intensity of vacillation, which brings us to the following sub question.
What are the implications of vacillation frequency and vacillation intensity, with regard to the
relation between corporate venture capital and firm performance?
This research is conducted as a confirmation of the existing knowledge regarding CVC
and vacillation, but more important, as an extension of the current knowledge and literature.
Since the beginning of the 21th century, research regarding the two theories has been growing.
However, relative to other corporate venturing alternatives, the field of CVC is still
unexplored. One of the goals of this research is to contribute to the literature in the field of
CVC. Furthermore, most of the research conducted regarding vacillation is focused on
hypothesis building, rather than hypothesis testing (Kang et al, 2017). This said, this research
focusses on hypotheses testing, by using quantitative data. As stated above, both the concepts
of CVC and vacillation are discussed in previous literature. However, despite the attention
8
paid to both the concepts, there has been no research conducted focusing on the relationship
between the organization’s structure/focus and corporate entrepreneurship, in this case CVC,
and their influence on performance. As Burger and Covin (2016) state, an interesting path for
further research regarding corporate entrepreneurship is to investigate if and how structures
supporting either exploration or exploitation influence the success of corporate
entrepreneurship. This said, the interplay between CVC and vacillation between structures
supporting either exploration or exploitation is central in this thesis.
The thesis is structured as follows. First, an extensive theory review regarding the
central theories is conducted. These reviews are concluded with the hypothesis regarding the
discussed theories. After this extensive review, the methodological part is discussed. The
methodological part consists of the chosen research design, the used date and the measures of
the included variables. Third, the conducted analysis and corresponding results are discussed,
followed by a conclusion. The thesis is rounded up with an extensive discussion regarding the
concluded results.

9
2. Theory Review
As stated in the introduction, this research focusses on the influence of CVC and vacillation
on firm performance, where vacillation is divided into frequency and intensity (figure 2). This
chapter consists out of an extensive theory review regarding the central concepts. First, the
theory regarding CVC is discussed, concluded with the corresponding hypothesis. Second, the
theory regarding vacillation is discussed, concluded with the corresponding hypotheses.
Figure 2 visualizes the basis conceptual model including the hypotheses.
Figure 2, basic conceptual model
2.1 Corporate Venture Capital
As stated in the introduction, corporate venturing can be either classified as internal or
external. Hereby, internal implies the investing in new ventures within the firm and external
outside the firm. In more detail, internal venturing is the establishing or investing in new
ventures within the organization and focusses on exploiting opportunities and developing
capabilities which are already present in the firm. A widely accepted example of such
capability is the internal innovativeness (Maula, 2001; Keil, 2004).On the other hand, external
venturing is the establishing or investing in entities outside the firms boundaries. Again, firms
can use venturing here to amplify their innovativeness. However, in the case of external
venturing, the innovativeness is amplified by the innovative power of external ventures
(Maula and Murray, 2001; Keil, 2004). According to Chesbrough (2002), corporate venture
capital is ‘the investment of corporate funds directly in external start-up companies’
(Chesbrough, 2002, p.5). This definition by Chesbrough (2002) indicates corporate venture
capital is a type of external corporate venturing. Furthermore, Maula and Murray (2001)

10
define corporate venture capital as ‘equity or equity-linked investments in young, privately
held companies, where the investor is a financial intermediary of a non-financial corporation
(Maula and Murray, 2001, p. 9). Dushnitsky and Lenox (2005a;2005b) add the objective
aspect to the definition, namely, corporate venture capital can be indicated by having either a
strategic or financial goal. These strategic and financial objectives are discussed below
together with the other characteristics of corporate venture capital. Furthermore, the process
regarding corporate venture capital is discussed together with the framework of Chesbrough
(2002). This framework is developed to guide firms in the process of CVC activities. At last,
the potential advantages of corporate venture capital are discussed, followed by the
corresponding hypothesis.
2.1.1 Characteristics of Corporate Venture Capital
Corporate venture capital can be characterized by either the objective of the organization
regarding the CVC-investment and the degree of operational linkage between the parent
company and start-up (Chesbrough, 2002; Chesbrough and Tucci, 2002; Dushnitsky and
Lenox, 2006). Both are elaborated on below, starting with the objectives of the organization.
The objective of an organization regarding the CVC-investment can be either strategic or
financial. Firms with a strategic objective aim to boost their sales and profit. Furthermore,
these firms search for suitable start-ups to identify and utilize possible synergies (Chesbrough,
2002). Firms with a financial objective aim, most of the time, to invest in start-ups in order to
bolster their revenues. Hereby, firms have the goal to perform better as private investors.
Parent firms try to achieve this by using their extensive knowledge regarding their markets
and technologies and their ability to be a patient investor. Furthermore, the positive perception
of customers and potential investors towards the parent firm is possibly transferred to the
start-up. This again leads to new interested investors, which eventually leads to higher returns
for the initial investor, in this case the parent firm (Chesbrough, 2002; Chesbrough and Tucci,
2002). Strategic and financial objectives are not seen as either/or, but as both/and. It is
possible to strive for both strategic as financial objectives at the same time and use the one
objective as a motivation to strive for the other. However, too much focus on short-term
financial objectives can harm the strategic objectives on the long-term. This again can harm
the long-term financial objectives (Dushnitsky and Lenox, 2006; Allen and Hevert, 2007).

11
According to Maula and Murray (2001), strategic objectives can be observed and divided in
three categories: learning, option-building and leveraging.
First, learning is about a firm’s objective to learn by initiating CVC and consists out of
three forms: venture-specific, market-level and indirect learning (Maula and Murray, 2001).
First, venture-specific learning is simply learning from the relations with new ventures. An
example of such learning is firms using CVC as a way of external R&D, in order to gain
knowledge, new technologies or even products or certain processes (Sykes, 1990; Keil, 2000;
Dushnitsky and Lenox, 2006). Second, market-level learning is learning through continuously
observing new ventures in the market. By doing this, the firm obtains knowledge and
information about the industry and the environment they operate in. Examples of such
knowledge is new business models or technologies (Sykes, 1990; Keil, 2000; Dushnitsky and
Lenox, 2006). At last, indirect learning is about learning during the implementation process of
CVC (Maula and Murray, 2001). This type of learning is very broad and focusses on all the
aspects during the process of CVC. An example of such indirect learning is developing the
internal CVC-processes through reflection on CVC-processes in the past or processes of other
firms implementing CVC (Sykes, 1990; Keil, 2000). Furthermore, CVC is used to observe
and learn from other organizational cultures. In a later stage, this knowledge of other cultures
can be used to change the culture of the parent firm itself (Sykes, 1990; Keil, 2000; Maula and
Murray, 2001)
The second category is option building. According to Maula and Murray (2001),
option-building consists of either options of acquiring new ventures or options to enter new
markets. First, CVC is used to gather the option of acquiring the venture in a later stage. By
investing in a certain start-up, a parent firm gathers new information about the start-up. If at a
certain point this information indicates the highly strategical value of the start-up, the parent
firm has the option to acquire the start-up entirely. Second, options to enter new markets is
straightforward. In this way, CVC is used to invest in start-ups which operate in new markets
which are interesting for the parent firm. So, the parent firm strives to enter the new
interesting markets through the investment in start-ups (Maula and Murray, 2001).
The third and last category is leveraging. According to Maula and Murray (2001),
leveraging is either leveraging the firm owned technology or complementary assets. First,
leveraging of firm owned technology is about investing in CVC-activities in order to raise the
sales of their own products or/and technologies (Keil, 2000). An example of such leveraging
is a firm investing in ventures which use the products and technologies of the firm, in order to
12
bolster the demand (Keil, 2000; Maula and Murray, 2001). Second, leveraging of own
complementary assets is about using firm’s using CVC as a way of leveraging their assets like
distribution channels. In the case of leveraging a firm’s distribution channel, CVC is used to
add new products to their distribution channels (Sykes, 1990; Keil, 2004).
As stated above, the second characteristic of corporate venture capital is the degree of
operational linkage between the parent company and start-up (Chesbrough, 2002; Chesbrough
and Tucci, 2002; Dushnitsky and Lenox, 2006). In most of the cases, a firm gives the start-up
access to resources and processes in order to stimulate their performance. If the start-up
exploits these resources and processes and take advantage of it, the degree of operational
linkage is high (Chesbrough, 2002; Lesar, 2016). However, firms can be threatened by the
different and new technologies of the new venture, which eventually could lead to separation.
In this case, the degree of operational linkage is low (Chesbrough, 2002; Lesar, 2016). In
essence, the best way to is to learn from the new venture and aim to gather advantages. Only
in this way benefits are realized (Chesbrough, 2002; Lesar, 2016).
2.1.2 Process of Corporate Venture Capital
According to Poser (2003), the process of investing in CVC is executed in five stages: deal
flow generation, assessment, investment, interaction and exit. These stage are briefly
discussed below. First, the stage of deal flow generation is about the scouting of and gaining
access to new interesting ventures. This is done by keeping close contact with other parties in
the firm’s network, or with employees. Through this close contact with other parties, a firm
can identify interesting ventures to invest in (Siegel, Siegel and MacMillan, 1988). The
second stage of the process is assessing the interesting ventures of stage 1. An intensively
used method for assessing is the SWOT-method, or in other words, assessing the strengths,
weaknesses, opportunities and threats (van Gils, 2012). Furthermore, this stage focusses on
assessing the strategic fit between the firm and the interesting venture, and scouts for possible
opportunities to create value. If this stage results in a good assessment, the firm moves on to
the stage of actual investing in the venture. However, the stage of investing in the venture is
challenging, due to the fact that the earlier perceived potential opportunities and benefits are
not easily quantifiable (Poser, 2003; van Gils, 2012). The next stage is about the interaction
between the parent firm and the venture, which is the stage wherein the opportunities and
possible benefits of the assessment stage are exploited and realized. In order to exchange

13
knowledge and learn from each other, intensive interaction is necessary. As stated earlier, the
assessment of potential opportunities and corresponding benefits in the earlier stages is based
on estimation. However, in the interaction stage, these estimations can be tested and turned
into realized numbers due to extensive interaction and monitoring (Poser, 2003; van Gils,
2012). The last stage is about the post-CVC process, or as Poser (2003) states: the ‘exit’ stage,
and consists of several options. The parent firm can continue with investing in the venture, or
stop investing if the benefits do not fulfil the expectations. However, if the realized benefits
meet the expectations and the parent firm is highly satisfied with the performance of the
venture, they can choose to acquire the venture as a whole. At last, the venture has the option
to go public, which is done through an Initial Public Offering (IPO)( (Poser, 2003; van Gils,
2012).
2.1.3 CVC-Framework by Chesbrough (2002)
In order to guide firms in the process of deciding how and when to invest in CVC activities or
how to use CVC as an instrument to realize strategic goals, Chesbrough (2002) developed a
two-dimensional framework. Chesbrough state the following regarding the framework: ‘the
framework can help a company deciding whether it should invest in a particular start-up by
first understanding what kind of benefit might be realized from the investment’ (Chesbrough,
2002, p.5). In addition, the framework indicates what type of investment is suitable for which
kind of economic climate (Chesbrough. 2002). The framework (figure 3) makes use of the
two earlier discussed characteristics of a CVC-investment, the objective of
the investment (strategic/financial) and the degree
of operational linkage between the firm and the new
venture. As is displayed in figure 3, the framework
states four types of investments: driving, emergent,
enabling and passive. these are elaborated below.
First, driving investments are characterized
by having a strategic motive and a tight operational
linkage between the parent firm and the new venture
(figure 3). Figure 3, CVC-framework (Chesbrough, 2002)

14
Hereby, the parent firm aims to combine the start-up’s strong capabilities and highly potential
areas of growth with their own capabilities and initiatives. In other words, the process of
driving investments is about combining the processes and potential of the new venture with
the investing firm. This said, these types of investments are focussed on continuation with the
current strategy (Chesbrough, 2002). However, in the case of disruptive developments or the
emerging of new opportunities in the environment, firms need to alter their strategy and
capabilities to handle these changes. This said, in need of disruptive developments and
emerging opportunities, driving investments are not suited.
Second, emergent investments are characterized by having a financial motive and tight
operational linkage (figure 3). In case of a disruption in the environment or a change in
strategy, these new ventures can be extremely valuable. For example, if a firm senses
possibilities in a new market with great potential, it is often challenging to explore this market
and gather information while still focussing on the current market. A widely used method to
still gather information about the new market is the emergent investment method. A firm
invests in a start-up which is active in or enters the new potential market. In this way, the firm
can gather information about the new market while still focussing on their current practices
and strategy. If the gathered information confirms the beforehand determined potential, the
firm can choose to develop new capabilities and make the swap to a new strategy concerning
the new market (Chesbrough, 2002).
Third, enabling investments are characterized by having a strategic motive and loose
operational linkage (figure 3). According to Chesbrough (2002), enabling investments target
to bolster the benefits of the parent firm without linking their own operations and capabilities
with those of the venture invested in. This said, a tight operational linkage is not essential to
realize benefits for the investing firm. Firms realize benefits by means of complementarity, or
in other words, by using complementary goods to bolster their own performance. In his
article, Chesbrough (2002) states the following regarding complementarity: ‘Having one
products makes a person want another’ (Chesbrough, 2002, p. 7). So, enabling investments
are focussed on stimulating the demand of a firm by stimulating the ecosystem and industry
the firm is operating in. Hereby, it is essential for the firm to possess the capabilities to gain
advantage of the growing demand, or in other words, ‘capture a substantial portion of the
market growth they stimulate’ (Chesbrough, 2002, p. 8)
At last, passive investments are characterized by having a purely financial motive and
loose operational linkage to the venture invested in (figure 3). Firms investing in a passive

15
manner do not have the capabilities and means to bolster their growth and strategic
performance. This said, passive investments are simply investments in order to realize
financial gains, or as Chesbrough (2002) states: ‘In passive venturing, a corporation is just
another investor subject to the vagaries of financial returns in the private equity market’
(Chesbrough, 2002, p. 10). Due to the lack of strategic benefits, it can be argued that these
type of investments are not beneficial and a possible waste of funds (Chesbrough, 2002).
Concluding, CVC activities have either a strategic or financial motive and are focused
on enhancing the firm’s performance . One of the main reasons to invest in CVC-activities is
to gather knowledge and/or technologies. The costs of internal R&D are rising, so firms are
searching for external sources of knowledge and technology. By investing in start-ups, firms
get access to new valuable knowledge and technologies which lead to an enhanced
competitive advantage (Forti and Toschi, 2014). Furthermore, by investing in new ventures,
firms add new products to their portfolio which can lead to increasing sales and revenue
(Rijnders and Elfring, 2001). Another way of bolstering performance through CVC is by
stimulating demand through stimulation of the industry and ecosystem, which is discussed
above. According to Chesbrough (2002), this is realized by funding ‘enabling investments’
and by means of complementarity. This brings us to the first hypothesis regarding CVC-
activities:
Hypothesis 1. Corporate Venture Capital activity has a positive influence on firm performance
2.2 Vacillation
The metaphrase of vacillation is a state of indecision or unsteady movement and fluctuation.
When applying this to organizations, the term organizational vacillation is used. In this
research, vacillation refers to the modulation between organizational structures supporting
either exploration or exploitation. This dynamic process of vacillation between organizational
structures leads temporarily to an ambidextrous organization, supporting both exploration and
exploitation (Nickerson and Zenger, 2002; Lavie, Kang and Rosenkopf, 2011; Boumgarden et
al, 2012; Kang et al, 2017). This ambidextrous organization temporarily emerges due to the
difference in pace of transition between the informal and formal organization. Kang et al
(2017) state: ‘An ambidextrous organization emerges and then disappears during vacillation

16
because changes in the formal organization structure are followed by lagged changes in the
informal organization’ (Kang et al, 2017, p. 1357). In their article, Nickerson and Zenger
(2002) support this statement. They argue that the informal organization, consisting out of the
routines within an organization which support the formal organization, takes longer to
modulate. Due to this, the organization becomes temporal ambidextrous, which implies it
focusses on both exploration and exploitation (Kang et al, 2017). The concept of
organizational vacillation is discussed further in chapter 3.3.3. First, exploration and
exploitation are discussed followed by the relationship between. After this, organizational
ambidexterity is discussed. At last, vacillation is discussed together with the corresponding
hypothesis.
2.2.1 Exploration and Exploitation
The literature regarding the difference between exploration and exploitation is partitioned in
two streams, which are both widely elaborated in literature (Gupta, Smith and Shalley, 2006).
The first stream of literature states that both exploitation and exploration are focused on
learning and the difference is made between the type of learning. According to previous
literature (Baum, Li and Usher, 2000; Benner and Tushman 2002; Gupta et al, 2006),
exploration and exploitation are both about gaining knowledge, learning and improving
processes. However, exploitation refers to gathering knowledge, learning and improving
process by following the same, already familiar path, where exploration refers to exploring
new, unfamiliar paths (Gupta et al, 2006). In their article, Baum et al (2000) state the
following regarding the difference between exploration and exploitation: ‘Exploitation refers
to learning gained via local search, experimental refinement, and selection of existing
routines. Exploration refers to learning gained through processes of concerted variation,
planned experimentation, and play.’ (Baum et al, 2000, p. 786). Furthermore, Benner and
Tushman (2002) elaborate on exploration and exploitation by means of innovation, where
‘Exploitative innovations involve improvements in existing components and architectures and
build on the existing technological trajectory, whereas exploratory innovation involves a shift
to a different technological trajectory’ (Benner and Tushman, 2002, p. 679). In short, the first
stream of literature states that both exploration and exploitation include learning, but the
difference is in the type of learning (Baum, Li and Usher, 2000; Benner and Tushman 2002;
Gupta et al, 2006).

17
In contrast to the first stream, the second stream of literature states that the difference
between exploration and exploitation is in the presence versus absence of learning and
routines (Vermeulen and Barkema, 2001; Vassolo, Anand and Folta, 2004; Gupta et al, 2006).
According to this stream of literature, all activities regarding gaining knowledge, learning and
innovating are categorized as explorative, while the exploitative activities are categorized as
those using prior knowledge and routines regardless of learning (Vermeulen and Barkema,
2001; Vassolo, Anand and Folta, 2004; Gupta et al, 2006). This said, Vermeulen and Barkema
(2001) illustrate exploration as ‘the search for new knowledge’ (Vermeulen and Barkema,
2001, p. 459) and exploration as ‘the ongoing use of a firm’s knowledge base’ (Vermeulen
and Barkema, 2001, p.459). Hereby, the aim of exploitation is to ‘focus on the knowledge and
routines that contribute most to its success and filters out those routines that are less
successful in the current settings’ (Vermeulen and Barkema, 2001, p.459). In other words, the
knowledge which is not seen as particularly valuable dissipates. In combination with the focus
on the firm’s current knowledge base, certain knowledge becomes dominant. In short, the
second stream of literature states that the main difference between exploration and
exploitation is in the presence versus absence of learning (Vermeulen and Barkema, 2001;
Vassolo, Anand and Folta, 2004; Gupta et al, 2006).
The dominant logic in this research is based on the work of March (1991), which
partially agrees with the first stream of literature. March (1991) argues that both exploration
and exploitation include learning. As discussed earlier, the second stream of literature
regarding the defining of exploration and exploitation states that exploitation is about the
absence of learning and the focusing on prior knowledge and routines (Vermeulen and
Barkema, 2001; Vassolo, Anand and Folta, 2004; Gupta et al, 2006). However, March (1991)
suggests that even if firms focus on prior knowledge and routines, they still engage in a
learning process (Gupta et al, 2006). This said, March suggests that the essence of
exploitation and exploration are ‘the refinement and extension of existing competences,
technologies, and paradigms’ (March, 1991, p.85) and ‘the experimentation with new
alternatives’ (March, 1991, p.85). Furthermore, March (1991) suggests several terms to
define the concepts of exploration and exploitation. First, exploration can be defined by the
terms: ‘search, variation, risk taking, experimentation, play, flexibility, discovery, and
innovation’ (March, 1991, p.71). Second, exploitation can be defined by the terms:
‘refinement, choice, production, efficiency, selection, implementation, and execution’ (March,
1991, p.71). In short, the dominant logic in this research states that both exploration and

18
exploitation include learning, and that the difference between the two is about the type or/and
amount of learning (March, 1991; Gupta et al, 2006).
The relationship between exploration and exploitation is a trade-off, due to the fact
that both compete for the scare resources within an organization (March, 1991). However,
both exploration and exploitation are seen as complements and are both needed for
organizations to bolster performance and become successful (March, 1991; Levinthal and
March, 1993; O’Reilly and Tushman, 1997; Birkinshaw and Gibson, 2004; Boumgarden et al,
2012). Boumgarden et al (2012) states that ‘a capacity to exploit innovations is more valuable
in the presence of a larger capacity to generate innovations, just as a capacity to generate
innovations is more valuable in the presence of a larger capacity to exploit them.’
(Boumgarden et al, 2012, p. 589). Thus, achieving both high exploration and exploitation is
beneficial for organizations. This simultaneously exploring and exploiting by organizations is
known as organizational ambidexterity, which is elaborated later in chapter 2.3.2. However,
this organizational state of ambidexterity is not easily realized, due to the different structures
supporting both exploration and exploitation (March, 1991; Levinthal and March, 1993;
O’Reilly and Tushman, 1997; Nickerson and Zenger, 2002; Birkinshaw and Gibson, 2004;
Boumgarden et al, 2012). The concept of organizational ambidexterity is further elaborated
below.
2.2.2 Organizational Ambidexterity
The concept of ambidexterity was introduced in the business literature by Duncan in 1976,
referring to a structural perspective for conducting both explorative and exploitative activities
(Duncan, 1976). Since then, the concept was widely discussed in other literature which led to
a broad base of theory regarding the defining of organizational ambidexterity and strategies to
achieve it (Gibson and Birkinshaw, 2004; O’Reilly and Tushman, 2004; Gupta et al, 2006.
This discussion led to three separate strategies for realizing organizational ambidexterity:
sequential ambidexterity, structural ambidexterity and contextual ambidexterity.
First, sequential ambidexterity implies the temporal and dynamic process of shifting
dual structures which facilitate either explorative or exploitative activities (Duncan, 1976;
Andriopoulos and Lewis, 2009; Raisch, Birkinshaw, Probst and Tushman, 2009). In this way,
organizations separate exploration and exploitation and sequentially shift their configuration
of structure depending on the environment and their needs (Duncan, 1976; Jansen, 2005).

19
Thus, ‘the sequential ambidexterity arises when organizations adapt to a dynamic and
temporal sequencing between exploration and exploitation activities’ (Raisch et al, 2012,
p.688). According to Erikson (2012), the strategy of sequentially shifting between exploration
and exploitation is favorable for organizations with scare resources or in case of difficulties
regarding the distribution of resources. Furthermore, Brown and Eisenhardt (1997) refer to
‘oscillating’ between semi structures supporting either exploration or exploitation to achieve
the state of ambidexterity. This eventually originated in the theory of vacillation, which
argues that the shift between formal organizations is realized quicker and easier than the shift
between informal organizations (Rosenkopf and Nerkar, 2001; Nickerson and Zenger, 2002;
Kang et al, 2017). The concept of vacillation is discussed further in chapter 2.2.3.
Other literature suggests that organizational ambidexterity is realized by adopting a
certain organizational structure where the explorative and exploitative activities are separated
in separate units. In this way, units can focus entirely on either their exploitative or
explorative function and both activities are conducted simultaneously within an organization
(O’Reilly and Tushman, 2004; Gupta et al, 2006). In this way, it can be observed as
differentiation, due to the separate tasks of each unit (Andriopoulos and Lewis, 2009). A
major advantage of the structural strategy is that the separated units only need to focus on
their tasks, either exploration or exploitation. However, by separating, the organization risks
isolating the units, which leads to less efficient transfer of knowledge and capabilities. Senior
management is needed to prevent this from happening (Gibson and Birkinshaw, 2004). Raisch
et al (2012) argue that ‘a few people at the top need to act ambidextrously by integrating
exploitative and explorative activities’ (Raisch et al, 2012, p. 687). Structural ambidexterity
can be observed by either dividing the tasks within an unit, or temporal separation. The
division of tasks implies dividing the tasks within an unit, so not between units. Thus, one
part of the unit focusses on explorative activities, while the other focusses on the exploitative
activities. Temporal separation is similar to the strategy discussed above, sequential
ambidexterity, and implies that the entire unit conducts both exploration and exploitation.
However, explorative and exploitative activities are not conducted concurrent but in separate
periods. (Gibson and Birkinshaw, 2004; O’Reilly and Tushman, 2004; Andriopoulos and
Lewis, 2009; Vos, 2013). Thus, the strategy of structural ambidexterity implies separating the
explorative and exploitative activities between units within an organization.
However, Gibson and Birkinshaw (2004) argue that explorative and exploitative
activities need to be integrated in order to create value. They state that, instead of focusing on
20
the structural level, organizations should focus on the individual, or contextual, level to
realize ambidexterity. The actions undertaken regarding the realization of contextual
ambidexterity are focussed on the cultural, social and behavioral aspects within an
organization. By doing this, the organizations goal is to create the conditions and capabilities
for individuals to conduct both explorative as exploitative activities (Andriopoulos and Lewis,
2009). Thus, organizations with contextual ambidexterity poses ‘the behavioral capacity to
simultaneously demonstrate alignment and adaptability across an entire business unit’
(Gibson and Birkinshaw, 2004, p. 209). However, realizing contextual ambidexterity is
challenging due to the complexity, conflicting and divergent nature of the process, which
possibly leads to undesired outcomes. To prevent this, senior management has the essential
task to guide the employees and stimulate both explorative and exploitative behaviour
(Gibson and Birkinshaw, 2004; Andriopoulos and Lewis, 2009; Vos, 2013). Thus, the
strategy of contextual ambidexterity implies stimulating both explorative as exploitative
behavior on the individual level, without separation on the structural level.
2.2.3 Vacillation between exploration and exploitation
As stated in the paragraph regarding sequential ambidexterity, vacillation is the dynamic
process of ‘oscillating’ between structures supporting either exploration or exploitation to
achieve the state of ambidexterity (Brown and Eisenhardt, 1997). The dynamic process of
vacillating between structures includes both the formal and informal structure of an
organization. Boumgarden et al (2012) argue that the dynamic process regarding choices to
change the formal structure, influences the shape of the informal organization. This informal
organizations reflects the actual exploration and exploitation, or as Boumgarden et al (2012)
state, ‘the degree of actual exploration or exploitation produced reflects the underlying
informal organization—the routines, decision-making processes, and knowledge flows within
the organization, as well as the general behaviors, decisions, and actions of individuals
within the organization’ (Boumgarden et al, 2012, p.9). An essential element in this process
of change is the inertia within the informal organization (Rosenkopf and Zerkar, 2001;
Nickerson and Zenger, 2002; Boumgarden et al, 2012; Kang et al, 2017). According to Kang
et al (2017), inertia within an organization can be seen as the resistance to change.
Furthermore, the degree of inertia shapes the pace of change of the informal organization,
such that the higher and stronger the inertia, the longer it takes for the informal organization
to follow the structural change of the formal organization (Kang et al, 2017). Due to this lag

21
in change of the informal structure in comparison with the formal structure, a temporary state
of ambidexterity occurs. In this way, it can be concluded that the higher the degree of and the
stronger the inertia within an organization, the longer it takes for the organization to reach the
ambidextrous state. Hence, this implies that the state of ambidexterity will retain longer which
is beneficial for an organization (Rosenkopf and Zerkar, 2001; Nickerson and Zenger, 2002;
Boumgarden et al, 2012; Kang et al, 2017). Thus, it can be concluded that firms with a weak
inertia have a higher need for frequent vacillation, due to the fact that their state of
ambidexterity has a shorter life-span than firms with strong inertia. According to Kang et al
(2017), vacillation can be characterized by either the frequency of vacillation as the intensity.
In simple words, the vacillation frequency refers to the number of vacillations in a
specific period of time. According to previous literature, it is suggested that vacillation
frequency has an inverted U-shaped relationship with performance, such a firm has an optimal
frequency value (Nickerson and Zenger, 2002; Boumgarden et al, 2012; Kang et al, 2017).
However, firms struggle to find and sustain this optimal value. Nickerson and Zenger (2002)
argue that decisions to vacillate are made by senior management, and that these are based on
the difference between the desired and actual performance. Thus, vacillation can be seen as an
instrument for bolstering firm performance. Furthermore, previous literature indicates the fact
that managers are boundedly rational (Nickerson and Zenger, 2002; Boumgarden et al, 2012).
Hence, managers struggle with determining when to vacillate and how often. Following
previous literature, the second hypothesis is:
Hypothesis 2. The vacillation frequency of a firm has an inverted U-curve relationship with firm performance
As stated earlier, it is expected that CVC-activities have a positive influence on the
performance of firms. Furthermore, it was stated that both explorative as exploitative
activities were needed to benefit and to bolster the performance. However, previous literature
argues that CVC-activities can be labelled as being explorative . This said, in order to benefit
from CVC-activities, firms rely most of the time on explorative activities. However, the
higher the vacillation frequency of a firm, the less time a firm focusses on exploration. Thus,
it is expected that vacillation frequency weakens the positive effect of CVC. This said, the
third hypothesis is:
Hypothesis 3. The vacillation frequency has a negative influence on the relationship between CVC activities and firm performance.

22
Besides frequency, vacillation can vary in intensity. In the case of a high degree of
change from exploration to exploitation, or vice versa, the firm conducts high-intensity
vacillation. The intensity of vacillation is determined by the degree or number of
organizational resources devoted for the process. Previous literature states that a higher
intensity of vacillation results in an stronger inertia, and so said, an increased resistance to
change. This again leads to a longer lasting state of ambidexterity, due to the fact that the
inertia slows down the vacillation process of the informal organization (Nickerson and
Zenger, 2002; Boumgarden et al, 2012; Kang et al, 2017). Hence, a higher intensity of
vacillation of can be beneficial for firms and can bolsters performance. However, too
intensive vacillating can lead to too strong inertia, which eventually can lead to too much
resistance to change. In this way, the benefits of organizational ambidexterity dissipate due to
the rising costs of vacillating (Nickerson and Zenger, 2002; Kang et al, 2017). Furthermore,
Kang et al (2017) argue that a too high level of intensity leads to several disadvantages
regarding firm performance. First, Kang et al (2017) state that ‘overly intensive exploration
will end up creating excessively novel knowledge, which may be too disconnected and
dissimilar from the firm’s existing knowledge base’ (Kang et al, 2017, p. 1358). In this way,
the gained knowledge is too novel and too distant from the firm’s capabilities that effective
exploitation is impossible. Second, focussing to intensive on exploration can lead to the loss
of routines regarding exploitation, or vice versa. This loss of routines again lead to higher
costs of vacillation (Nelson and Winter, 1982; Kang et al, 2017). Taking the above into
consideration, it is expected that in general it has an inverted U-curve relationship with firm
performance. This said, the fourth hypothesis is:
Hypothesis 4. The vacillation intensity of a firm has an inverted U-curve relationship with firm performance
As stated earlier, in order to benefit from CVC-activities, firms rely most of the time
on explorative activities. Since a higher intensity of vacillation leads to a stronger inertia,
which again leads to a slower vacillation between exploration and exploitation, a longer
period of time is dedicated to exploration. This said, it is expected that vacillation intensity
has a positive influence on the relationship between CVC-activities and firm performance,
which leads to the fifth and last hypothesis:
Hypothesis 5. The vacillation intensity has a positive influence on the relationship between CVC-activities and firm performance

23
3. Data and Measures
3.1 Data and Sample
The dataset used in this research is created by retrieving data from several databases,
depending on the nature and sort of data. These are elaborated each with the corresponding
variable in chapter 3.2. Furthermore, the objects of interest in this research are the largest
corporations in North-America based on their annual revenue. The reason for choosing the
United States as focus point of this research is their dominance in the global CVC scene. As is
shown below (figure 4), 64.5 percent of CVC deals worldwide in 2015 were conducted in
North America. More details regarding the sample are discussed later this paragraph.
Figure 4, Global CVC deal share by continent 2015 and annual number of global CVC deals, retrieved from https://www.cbinsights.com/research-cvc-trends-mar2016
Furthermore, the data is retrieved in the form of panel data over a time span of 4 year
from 2011 till 2014. This time span is based on several reasons. First, the variable of firm
performance is measured using a time-lag of 3 years. Due to the fact that the latest available
financial data is from 2017, 2014 is the latest possible year to use. The variable of firm
performance and the corresponding time-lag is further elaborated on in chapter 3.2.1. Second,
as is shown in figure 4, the number of CVC deals rises steadily over the years. In addition, for
the research it is preferred to include as most as possible CVC-deals. In combination with the
time-lag in measuring firm performance, the best period to use panel data for is 2011 till
2014. So, the chosen time span is right after the financial crisis, from 2011 till 2014.
As stated above, the sample used in this research consists out of the largest North
American corporations based on annual revenue. The financial institutions like banks,
traditional venture capital firms and purely financial VC funds are excluded, due to the fact
that these institutions do not invest directly into startups and have purely financial objectives
(Chesbrough, 2002; Van Gils, 2012). Corporations in other sectors are included in the sample.
The initial sample consisted out of 200 corporations. However, after excluding the
24
corporations operating in the financial sector and the corporations with a too high degree of
missing values, 150 corporations remained. This said, the final sample consists out of 150
corporations. Figure 5 provides an overview of the different sectors included in the final
sample. The sectors of Energy and Health Care are represented with both 24 corporations,
followed by Technology (17) and Retailing (15).
Figure 5, overview of the different sectors included in the final sample
The 150 corporations in the final sample, conducted over the 4 years of interests a total
number of 1153 deals. Furthermore, the mean score regarding the number of CVC deals per
corporation over the 4 years measured is 1.92. This implies that the corporations included in
the final sample on average conducted 2 CVC deals per 4 years. Hereby, the minimum
number of CVC deals conducted by a corporation is 0, while the maximum number of CVC
deals by a corporation is 77.
3.2 Measures
As stated earlier, this research is about the influence of CVC activities and vacillation on firm
performance. This chapter discusses the measures regarding the variables. First, CVC
activities is measured by the number of CVC deals and CVC program existence. Second, the
variable of vacillation is measured following by determining both the frequency and intensity
of vacillation. Third, the dependent variable of firm performance is measured by using
Tobin’s Q. All of this is visualized in figure 4, together with the corresponding hypotheses.
All of the used measures are adopted from prior research, and are proven to be reliable and
valid.
1 1
6 7
24
1
4
10
24
2 3
7
1 3 3
15 17
5
8 9

25
Figure 6, Conceptual model with the corresponding measures
3.2.1 Dependent Variable
The dependent variable of firm performance is measured using Tobin’s Q, which is the
market valuation of a specific firm determined by its value of tangible assets (Dushnitsky and
M.J. Lenox, 2006). According to Montgomery and Wernerfelt (1988), the market-based value
of Tobin’s Q is a good proxy in determining a firm’s performance and competitive position.
The use of Tobin’s Q, instead of the regular accounting-based measure like ROA, is due to
several reasons. First, Tobin’s Q value takes into account the expected earnings in the future
and takes care of the eventual lag between the moment of conducting the CVC activity and
the realized benefits (Dushnitsky et al, 2006). In other words, by using a market-based value
like Tobin’s Q, both the short-term financial as long-term strategic performance of a firm are
taken into account (Lavie et al, 2011). This two-sided market-value measurement is especially
useful in the case of exploitation, exploration and the vacillation between both. As already
discussed in the previous chapter, exploitation differs in influence on performance and time
span of that influence in comparison with the explorative focus. For instance, the influence of
an explorative focus on performance takes longer to show effect than the influence of an
exploitative focus (Kang et al, 2017). Furthermore, unlike the regular accounting methods to
measure performance, Tobin’s Q uses knowledge creation as an indicator of expected strength
of competitiveness, where knowledge creation is measured by using patents (Kang et al, 2017;

26
Levitas and Mcfadyen, 2009). In this thesis, these patents are used for measuring the firm
focus, which is elaborated in the following chapter.
Since it was introduced, several methods to define the Tobin’s Q were introduced who
all tend to generate comparable values. In this research, the general method of James Tobin,
introduced in 1977, is used due to its simplicity. Furthermore, the financial data needed to
conduct the Q-analysis can be retrieved from the databases of Compustat and Orbis.
The Tobin’s Q ratio is calculated as the ratio between the total market value of the
firm and the value of the total assets of the firm (Wolfe and Sauaia, 2005). So, the ratio-score
is calculated as follows:
Figure 7, Tobin’s Q Formula
In their article, Singhal, Parkesh and Fu (2016) conclude that there is a positive
relationship between the Tobin’s Q ratio score and future firm performance. In other words,
firms with higher Q-ratio scores will perform better in the future than firms with lower Q-ratio
scores. Therefore, the Tobin’s Q ratio is used as a determent of firm performance. However,
previous literature indicates the existence of time lag in CVC-activity effect on firm
performance (Dushnitsky and Lenox, 2006; Van Gils, 2012; Sarkar, Echambadi and Harrison.
2001; Zahra and Hayton, 2008). In other words, the effect of certain CVC activities of a firm
in a specific year will not show up in the same year. This said, a time-lag of 3 years in
measuring performance is introduced. In other words, if a firm invests in certain CVC
activities in year t, the financial data used to measure the Tobin’s Q’s of year t+3 is collected
(Van Gils, 2012).
3.2.2 Independent Variables
The primary independent construct in this research is CVC activity, which implies the degree
of CVC related activities conducted by a specific firm. This construct is measured by using
several variables.
The first variable used is the number of CVC deals, which is widely used in in other
articles regarding CVC. In their article, Sahaym, Steensma and Barden (2010) measure CVC

27
activity by aggregating the count of CVC deals by each included firm. The data used to
measure the number of deals is retrieved from the VentureXpert Database (ThomsonReuter).
Furthermore, the database of Crunchbase is used as additional information and confirmation.
The second variable used is the CVC program existence, or in other words, do firms
have a CVC program or not. By using this variable, it is possible to determine the difference
in effect of having a CVC program or not on the performance of firms. Chesbrough and Tucci
(2002) used this variable in their research and coded it as a dummy variable. The dummy code
0 was given for every year not having a program, and the code 1 was given for every year the
firm had a program (Chesbrough and Tucci, 2002). The data used to measure program
existence is retrieved from the Zephyr (Orbis) database together with general search on the
web.
The second independent construct in this research is vacillation. As stated earlier, the process
of vacillation implies the dynamic process of vacillating, or in other words modulating,
between having an exploitative focus and an explorative focus in order to achieve high
performance (Kang et al, 2017; Boumgarden et al, 2012). The degree of a firm’s vacillation is
measured by either vacillation intensity as vacillation frequency. Both these characteristics of
the vacillation process are measured using the methods designed by Kang et al (2017). The
vacillation intensity illustrates the degree to which the firm modulates between the two types
of focus in a specific year. In other words, intensity is about the degree of change between
having an exploitative focus and an explorative focus in a specific year (O’Reilly and
Tushman, 2013; Kang et al, 2017). The process of calculating and actually measuring
intensity is elaborated on later this chapter. Furthermore, vacillation frequency is illustrated as
simply the number of vacillations in a specific period of time. The entire process of measuring
the two vacillation scores is discussed below.
First, both the types of focus, exploitation and exploration, are operationalized.
As stated earlier, firms have either an exploitative focus or an explorative focus. In their
research, Kang et al (2017) measure exploitation and exploration by using technological
innovation, or in other words, patents. This operationalization of exploitation and exploration
is widely used in previous research (Rosenkopf and Nerkar, 2001; Kang et al, 2017). This
said, the operationalization of these variables in this research is done in the same manner as in
previous research (Rosenkopf and Nerkar, 2001; Kang et al, 2017). First, the variable of
exploration is operationalized as follows:

28
‘’The patents filed during a given year and in technical classifications for which the focal
firm has not historically filed’’ (Kang et al, 2017, p 1359.)
Second, the variable of exploitation is operationalized as follows:
‘’ The patents filed during a given year and in technical classifications for which the focal
firm has historically filed’’ (Kang et al, 2017, p 1360.)
However, firms often conduct both exploration and exploitation during a year. This implies,
with the operationalization used in this research, that firms file both new patents as patents
which already have been filed in the past (Boumgarden, Nickerson and Zeller, 2012). To
solve this problem, and classify firms as either explorative or exploitative, the organizational
focus is measured as a ratio variable. If a firm files more patents which are not already
historically filed than patents which are already historically filed during a given year, the
organizational focus of the relevant firm in that given year can be perceived as explorative.
The other way around, the organizational focus can be perceived as exploitative (Kang et al,
2017). Furthermore, a patent is assigned to the year of publication. In this way, consistency is
created. The organizational focus is calculated with the following formula (Kang et al, 2017):
𝐹𝐹𝐹𝐹𝐹𝐹 = 𝑁𝑁𝑁𝑁𝑁𝑁𝑇𝑇𝑇𝑇𝑁𝑁𝑁𝑁
− 𝑂𝑂𝑁𝑁𝑁𝑁𝑇𝑇𝑇𝑇𝑁𝑁𝑁𝑁
Fot = Organization’s focus ratio score Not = Explorative patents
Figure 8, Organizational focus formula (Kang et al, 2017) TPot = Total patents filed Oot = Exploitative patents
The different aspects of the formula are as follows: Fot is the organization’s focus ratio score
at the year t, Not are the number of ‘newly’ filed patents perceived as explorative, Oot are the
number of ‘old’ patents, or in other words the patents which have been historically filed,
perceived as exploitative and TPot stands for the total patents filed by an organization in year
t. As stated earlier, the organization’s focus score is a ratio. In the case of an equal number of
‘explorative patents’ and ‘exploitative patents’, the focus score is 0. Hence, if a firm filed
more ‘new’ patents than ‘old patents’ in a given year, the ratio score is positive which implies
the firm has a more explorative focus. The other way around, if a firm filed more ‘old patents’
than new ones, the ratio score is negative which then implies the firm has a more exploitative
focus (Rosenkopf and Nerkar, 2001, Kang et al, 2017). As stated earlier, vacillation is about
the modulation between having an exploitative focus and an explorative focus (Boumgarden,
Nickerson and Zeller, 2012). Using the above discussed ratio scores, vacillation occurs when
a firm moves from a positive score to a negative score, and the other way around.

29
The first variable used to measure the construct of vacillation is vacillation intensity,
or in simple words, the degree of change. The formula used in this research is based on the
formula used by Kang et al (2017).
Iot = Vot x (Fot – Fot-1 )
Figure 9, vacillation intensity formula (Kang et al, 2017)
Where Iot is the intensity of vacillation and V denotes the occurrence of vacillation in year t.
If a vacillation occurred during year t, V is given the score of 1. Opposite, if no vacillation
occurred, V is given the score of 0. This said, the vacillation intensity is calculated by
multiplying the difference in focus ratio score of year t and year t-1 by the score of Vot,
indicating whether vacillation occurred or not.
The second variable used is vacillation frequency, or in other words, the number of
vacillations in a specific period of time. Again, the operationalization and calculation of this
variable is based on the method used by Kang et al (2017). The measurement of vacillation
frequency is done by using a time frame of 4 years. However, the other variables in the model
are measured yearly. In order to tackle this problem, the variable of frequency is transformed
into a yearly score. This is done by dividing the total score of the 4 year time span, by 4. At
last, the data regarding patents is retrieved from the Orbis and Espacenet database.
3.2.3 Control Variables
In order to control for firm-level characteristics, several variables are included. These
variables are often used in previous literature and especially in research regarding firm
performance measured by Tobin’s Q (Dushnitsky and Lenox, 2006; Van Gils, 2012; Kang et
al, 2017).
The first variable controlled for is ‘Organizational Size’. According to Dushnitsky and
Lenox (2005), the size of a firm has influence on their CVC activities by means of having a
larger pool of resources to invest. The variable of ‘Firm Size’ is measured as the log of the
company’s total assets (Dushnitsky and Lenox, 2006). The data regarding total assets is
retrieved from the databases of Orbis and Compustat (WRDS).
The second variable controlled for is ‘Organizational Growth’, again due to the reason
that growth has an influence on the CVC activities of a firm. The variable ‘Firm Growth’ is
measured as the annual percent change in sales (Dushnitsky and Lenox, 2006).

30
The third variable controlled for is ‘Organizational Slack’. According to Chesbrough
and Tucci (2004), organizational slack has great influence on the degree of CVC activity
within a firm, in such a way that firms with a high number of excess resources conduct more
CVC related activities than firms with less or even no slack. Furthermore, Sahaym et al
(2010) state that having a high slack leads to an increase of risk-taking and experimentation,
while low slacks lead to firms being more conservative. The variable ‘Organizational Slack’
is operationalized as current ratio and measured by dividing the current assets by current
liabilities (Dushnitsky and Lenox, 2006; Sahaym et al, 2010). The data used to measure
‘Organizational Slack’ is retrieved from the databases of Orbis and Compustat (WRDS).
3.3 Panel Data and Research Method
As stated earlier, the data sample consists out of panel data retrieved from 150 corporations.
This said, the panel data consists out of 150 panels with 4 periods of time (2011-2014). This
said, a short panel data is relevant, due to the fact that the dataset contains out of many entities
(150) but a few time periods (4). According to Baltagi (2008) and Hsiao (2014), using panel
data instead of time-series or cross-section has several advantages. First, panel data is used
due to the fact that the used samples can be larger, resulting in more degrees of freedom, re
variability and thus more information to use in the analysis (Baltagi, 2008; Hsiao, 2014).
Furthermore, with panel data, it is possible to control for any heterogeneity, either individual
or time. At last, panel data tackles several problems regarding the interpretation of the
regression coefficients, retrieved from the analysis. This said, it is essential that the chosen
analysis software is appropriate for conducting panel data analysis. For this reason, the
appropriate research method and analysis software is STATA.

31
4. Results
To test the hypotheses, a regression analysis is conducted with STATA. Before running the
models, several assumptions are checked with respect to the dataset used. The regression
analysis is conducted with three models. The first model contains the three used control
variables of slack, firm growth and firm size. In the second model, the independent variables
are included. The last model contains out of all control variables, independent variables and
the additional interaction terms.
First, the control variable of growth is transformed into a log variable to tackle
skewness and kurtosis. Since the other variables are measured as ratio’s, there is no need for
transforming them. Furthermore, the correlation matrix is checked in order to test for
multicollinearity (Table 1). According to Field (2013), correlations above 0.7 are problematic.
As is displayed in table 1, no correlations are above 0.7, which implies there is no
multicollinearity between the variables used. Furthermore, the VIF-scores of all the variables
are below the critical value of 10 (Appendix 7.1). This acts as an extra confirmation that there
is no problematic multicollinearity in the dataset (Field, 2013; Hair, 2014).
Correlation matrix of coefficients of regress model
e(V) | NumberD program Organi~s Vacfre~y VacInt~y Slack Firmsi logper~h
-------------+--------------------------------------------------------------------------------
NumberDeals | 1.0000
program| -0.3180 1.0000
Organizati~s| -0.0666 -0.0194 1.0000
Vacfrequency| 0.1004 -0.0403 0.1319 1.0000
VacIntensity| 0.0260 0.0078 -0.4186 -0.0823 1.0000
Slack| -0.2593 -0.0438 0.0276 -0.1418 -0.0120 1.0000
Firmsize_n| -0.0928 -0.0937 -0.0114 0.0423 0.0108 0.0283 1.0000
logpercgro~h| -0.0290 0.1109 -0.0840 0.1000 0.0199 -0.1669 0.1082 1.0000
Table 1: Collinearity matrix
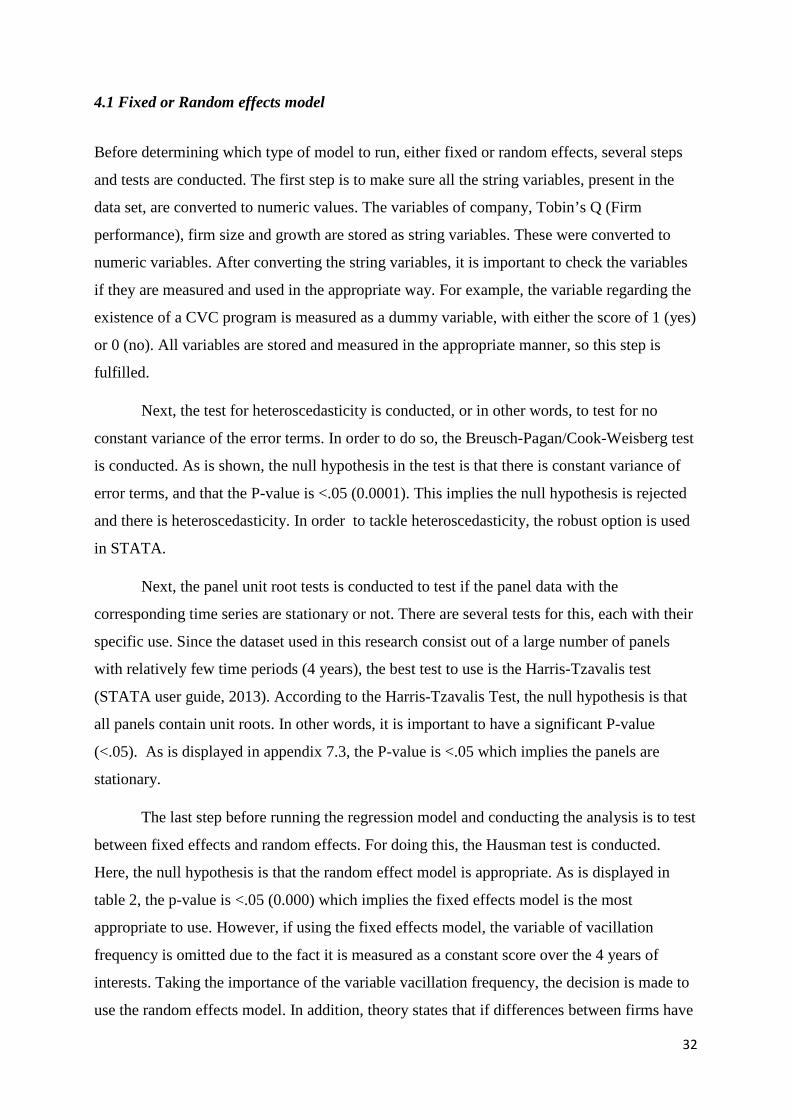
32
4.1 Fixed or Random effects model
Before determining which type of model to run, either fixed or random effects, several steps
and tests are conducted. The first step is to make sure all the string variables, present in the
data set, are converted to numeric values. The variables of company, Tobin’s Q (Firm
performance), firm size and growth are stored as string variables. These were converted to
numeric variables. After converting the string variables, it is important to check the variables
if they are measured and used in the appropriate way. For example, the variable regarding the
existence of a CVC program is measured as a dummy variable, with either the score of 1 (yes)
or 0 (no). All variables are stored and measured in the appropriate manner, so this step is
fulfilled.
Next, the test for heteroscedasticity is conducted, or in other words, to test for no
constant variance of the error terms. In order to do so, the Breusch-Pagan/Cook-Weisberg test
is conducted. As is shown, the null hypothesis in the test is that there is constant variance of
error terms, and that the P-value is <.05 (0.0001). This implies the null hypothesis is rejected
and there is heteroscedasticity. In order to tackle heteroscedasticity, the robust option is used
in STATA.
Next, the panel unit root tests is conducted to test if the panel data with the
corresponding time series are stationary or not. There are several tests for this, each with their
specific use. Since the dataset used in this research consist out of a large number of panels
with relatively few time periods (4 years), the best test to use is the Harris-Tzavalis test
(STATA user guide, 2013). According to the Harris-Tzavalis Test, the null hypothesis is that
all panels contain unit roots. In other words, it is important to have a significant P-value
(<.05). As is displayed in appendix 7.3, the P-value is <.05 which implies the panels are
stationary.
The last step before running the regression model and conducting the analysis is to test
between fixed effects and random effects. For doing this, the Hausman test is conducted.
Here, the null hypothesis is that the random effect model is appropriate. As is displayed in
table 2, the p-value is <.05 (0.000) which implies the fixed effects model is the most
appropriate to use. However, if using the fixed effects model, the variable of vacillation
frequency is omitted due to the fact it is measured as a constant score over the 4 years of
interests. Taking the importance of the variable vacillation frequency, the decision is made to
use the random effects model. In addition, theory states that if differences between firms have

33
an influence on the dependent variable, the random effect model is appropriate to use. This
said, it is believed that differences between firms in the sample have an influence on the
performance measure. Taken all of this in consideration, the decision is made to use the
random effects model analysis.
Breusch-Pagan/Cook-Weisberg Test Harris-Tzavalis Test Hausman Test
0.0001** 0.000*** 0.000***
ᵃ Standardized coefficients ᵇ * p < 0.05, ** p < 0.01, *** p < 0.001
Table 2: Pre analysis tests
4.2 Hypothesis Testing
While conducting the initial analysis, the variable of program existence was omitted due to
high collinearity with the variable number of CVC deals. In order to prevent this from
influencing the results, the decision was made to delete the variable of program existence
from the final analysis. Furthermore, the hypothesis assume there is an inverted U-curve
relationship between both vacillation frequency and intensity with firm performance. This
said, the variables of vacillation frequency and intensity are taken as squared variables. Table
3 displays the relevant results of the random effect model regression. Furthermore, the entire
regression analysis is displayed in appendix 7.3. As was stated, the first model contains out
solely the control variables of firm size, firm growth and slack. Starting with the control
variables, the variable of organizational slack has a positive significant effect on firm
performance (β = 0.130, p < .05). In other words, an increase of 1.00 in organizational slack
will lead to a 0.130 increase in firm performance. Since slack is measured as the current ratio
and firm performance as tobin’s q, it implies that a raise of 1.00 in the firms’ current ratio
leads to a 0.130 increase in the firms’ tobin q score. Furthermore, for both firm size and firm
growth , the results are not significant.
Examining the main independent variables, it was found that both vacillation intensity
(β = -0.051) as frequency (β = -0.084) have a significant effect on firm performance. It was
expected that both intensity as frequency have an inverted U-curve relationship with firm

34
performance. As is displayed in figure 10, both assumptions are met. In the case of inverted
U-curve relations, the effect is positive till a certain peak, after it becomes negative. For
vacillation frequency, this peak is at .316. Since frequency is measured as a constant over the
4 years of interest, this peak implies the optimal vacillation frequency is every 15 months.
Furthermore, the peak score for vacillation intensity is .090.
Figure 10, inverted U-curves of both frequency and intensity
Model 3 includes the interaction terms, which are displayed below. Since the variable of
program existence is deleted due to collinearity, two interaction terms are left. As is shown in
table 3, the interaction term of number of CVC deals with vacillation intensity on firm
performance is significant. The coefficient score 0.098 (β = 0.098), which indicates the
moderating effect is positive. The effect is displayed in figure 10, and indicates that firms with
a high level of vacillation intensity that conduct a high number of CVC deals will have a
better firm performance. Furthermore, firms that conduct a low number of deals, have more
benefit with a low intensity of vacillation. This said, the fifth hypothesis is accepted.
Furthermore, the interaction term of number of CVC deals with vacillation frequency on firm
performance is not significant (P > .05; β = 0.015). This said, the interaction between the
number of CVC deals and the frequency of vacillation have no significant influence on firm
performance. This leads to the rejection of the third hypothesis.

35
Figure 11, Interaction term of number of deals and vacillation intensity
Model Hypothesis 1 2 3 Controls Firm Size -0.265 -0.337* -0.337* Firm Growth -0.085 -0.082 -0.069 Slack 0.130* 0.127* 0.142* Number of Deals
-0.003 -0.0142 H1
Vacillation Frequency
-0.084* -0.120* H2 Vacillation Intensity
-0.051* -0.070** H4
Number of deals x Vacillation Frequency
0.015 H3 Number of deals x Vacillation Intensity
0.098*** H5
R² 0.051 0.067 0.074 Wald Chi 8.22* 19.60* 36.37** Observations 588 588 588 Groups 150 150 150 ᵃ Standardized coefficients
ᵇ * p < 0.05, ** p < 0.01, *** p < 0.001
Table 3: Results of the random effects model regression
Table 4 provides an overview of all the tested hypotheses together. As is displayed,
hypothesis 1 and 3 are not supported. Hypothesis 2, 4 and 5 are supported. In addition to the
testing of the hypotheses, an additional analysis is conducted. This analysis is discussed in
chapter 4.3.
11,5
22,5
33,5
44,5
5
Low Number of Deals High Number of Deals
Firm
per
form
ance Low
VacillationIntensityHighVacillationIntensity

36
Hypothesis
H1
Corporate Venture Capital activity has a positive influence on firm performance
Not Supported
H2 The vacillation frequency of a firm has an inverted u-curve relationship with firm performance
Supported
H3 The vacillation frequency has a negative influence on the relationship between CVC activities and firm performance.
Not Supported
H4 H5
The vacillation intensity of a firm has an inverted U-curve relationship with firm performance The vacillation intensity has a positive influence on the relationship between CVC-activities and firm performance Table 4: Overview Hypotheses
Supported Supported
4.3 Additional Analysis
The additional analysis is separated in two parts. The first part discusses the results of the
additional analysis using the same total sample as previous in this research (N=150). Here,
several effects are tested in addition to the effects tested above. In the second part, the total
sample is divided into three subsamples based on sector. These three subsamples consist out
of firms operating in the energy, technology and health care sector. The reason for choosing
these three sectors is the fact that they are best represented in the total sample.
The first part discusses the results of these are displayed in table 4 below. First, the
effect of organizational focus on firm performance is tested. As stated, an organization have
either an explorative or exploitative focus (Vermeulen and Barkema, 2001; Vassolo, Anand
and Folta, 2004; Gupta et al, 2006). However, how does organization focus influence firm
performance, and does it influences firm performance? Since the organizational focus of firms
is used to measure vacillation frequency and intensity, the data is available. The full
regression is displayed in appendix 7.4.1. As is shown in table 4, the effect is non-significant
(β = 0.029; P > .05). In addition, does the focus of an organization effects the CVC activities.
Again, the degree of CVC activity is measured by the number of deals and the existence of a
program. As stated earlier, the two variables have a too high collinearity between, so they
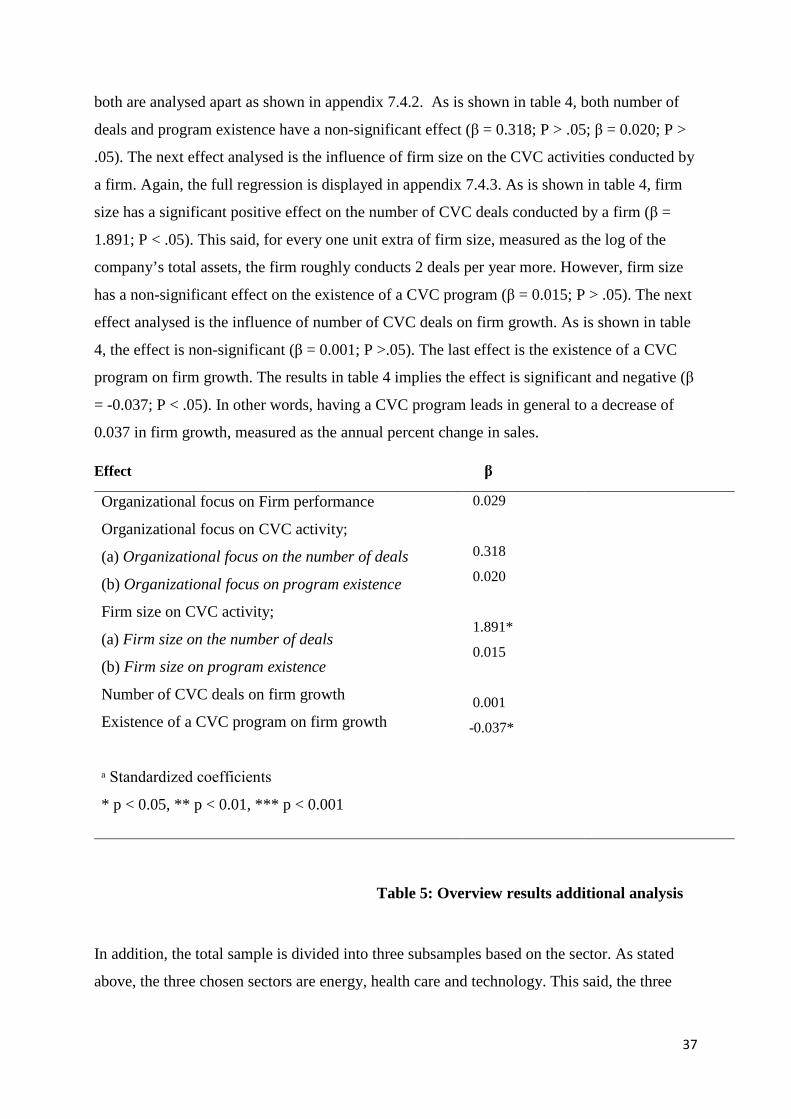
37
both are analysed apart as shown in appendix 7.4.2. As is shown in table 4, both number of
deals and program existence have a non-significant effect (β = 0.318; P > .05; β = 0.020; P >
.05). The next effect analysed is the influence of firm size on the CVC activities conducted by
a firm. Again, the full regression is displayed in appendix 7.4.3. As is shown in table 4, firm
size has a significant positive effect on the number of CVC deals conducted by a firm (β =
1.891; P < .05). This said, for every one unit extra of firm size, measured as the log of the
company’s total assets, the firm roughly conducts 2 deals per year more. However, firm size
has a non-significant effect on the existence of a CVC program (β = 0.015; P > .05). The next
effect analysed is the influence of number of CVC deals on firm growth. As is shown in table
4, the effect is non-significant (β = 0.001; P >.05). The last effect is the existence of a CVC
program on firm growth. The results in table 4 implies the effect is significant and negative (β
= -0.037; P < .05). In other words, having a CVC program leads in general to a decrease of
0.037 in firm growth, measured as the annual percent change in sales.
Effect β
Organizational focus on Firm performance
Organizational focus on CVC activity;
(a) Organizational focus on the number of deals
(b) Organizational focus on program existence
Firm size on CVC activity;
(a) Firm size on the number of deals
(b) Firm size on program existence
Number of CVC deals on firm growth
Existence of a CVC program on firm growth
ᵃ Standardized coefficients
* p < 0.05, ** p < 0.01, *** p < 0.001
0.029
0.318
0.020
1.891*
0.015
0.001
-0.037*
Table 5: Overview results additional analysis
In addition, the total sample is divided into three subsamples based on the sector. As stated
above, the three chosen sectors are energy, health care and technology. This said, the three

38
models used in the traditional analysis are tested in these subsamples. First, the energy sector
is analysed, followed by the health care sector. At last, the technology sector is analysed.
4.3.1 Energy Sector
The energy sector sample consists out of 24 North-American corporations operating in the
energy sector. Together with the 4 years of interests, this leads to a total of 96 observations, or
in other words, years of data. Table 5 displays the relevant results of the random effect model
regression. Furthermore, the entire regression analysis is displayed in appendix 7.4.5. As was
stated, the first model contains out solely the control variables of firm size, firm growth and
slack. This said, the original analysis of the total sample resulted in the control variable of
slack having a positive significant effect on firm performance (β = 0.130, p < .05). Unlike
with the total sample, using the energy sample results in the three control variables having no
significant effect on the performance of firms.
Examining the main independent variables, it was found that the number of deals have
a negative significant effect on the performance of firms (β = -0.062, p < .05). This is
remarkable since the analysis of the total sample resulted in no significant effect of number of
deals on firm performance. This said, regarding the energy sample, the first hypothesis is
partly supported since the effect is negative versus the expected positive effect. Furthermore,
the other main independent variables of vacillation frequency (β = -0.058, p > .05) and
intensity (β = 0.022, p > .05) have no significant effect on the performance of firms. This said,
hypothesis H2 and H4 are rejected.
Model 3 includes the interaction terms, which are displayed below. Since the variable
of program existence is deleted due to collinearity, two interaction terms are left. The results
of these interaction terms are displayed in table 5. Different than with the total sample, both
the interaction terms of vacillation frequency (β = -0.049, p > .05) and intensity (β = -0.208, p
> .05) are not significant. This said, the third and fifth hypothesis are rejected.

39
Model Hypothesis 1 2 3 Controls Firm Size 0.009 0.049 0.048 Firm Growth 0.005 0.018 -0.018 Slack 0.127 0.137 0.131 Number of Deals
-0.062* -0.056 H1
Vacillation Frequency
-0.058 -0.092 H2 Vacillation Intensity
0.022 -0.116 H4
Number of deals x Vacillation Frequency
-0.049 H3 Number of deals x Vacillation Intensity
-0.208 H5
R² 0.142 0.150 0.157 Wald Chi 1.42 9.25 36.21* Observations 96 96 96 Groups 24 24 24 ᵃ Standardized coefficients
ᵇ * p < 0.05, ** p < 0.01, *** p < 0.001
Table 6: Results of the random effects model regression in the energy sector
4.3.2 Health Care Sector
The health care sector sample consists out of 24 North-American corporations operating in
the health care sector. Together with the 4 years of interests, this leads to a total of 93
observations, or in other words, years of data. Table 6 displays the relevant results of the
random effect model regression. Furthermore, the entire regression analysis is displayed in
appendix 7.4.6. Again, the first model contains out solely the control variables of firm size,
firm growth and slack. This said, the original analysis of the total sample resulted in the
control variable of slack having a positive significant effect on firm performance (β = 0.130, p
< .05). Unlike with the total sample, using the health care sample results in the three control
variables having no significant effect on the performance of firms.
Examining the main independent variables, it was found that none of those
have a significant effect on firm performance. In other words, the number of CVC deals (β = -
0.031, p > .05), vacillation frequency (β = -0.087, p > .05) and vacillation intensity (β = --
0.092, p > .05) have no significant direct influence on the performance of the firms in the
sample. This said, H1, H2 and H4 can be rejected.
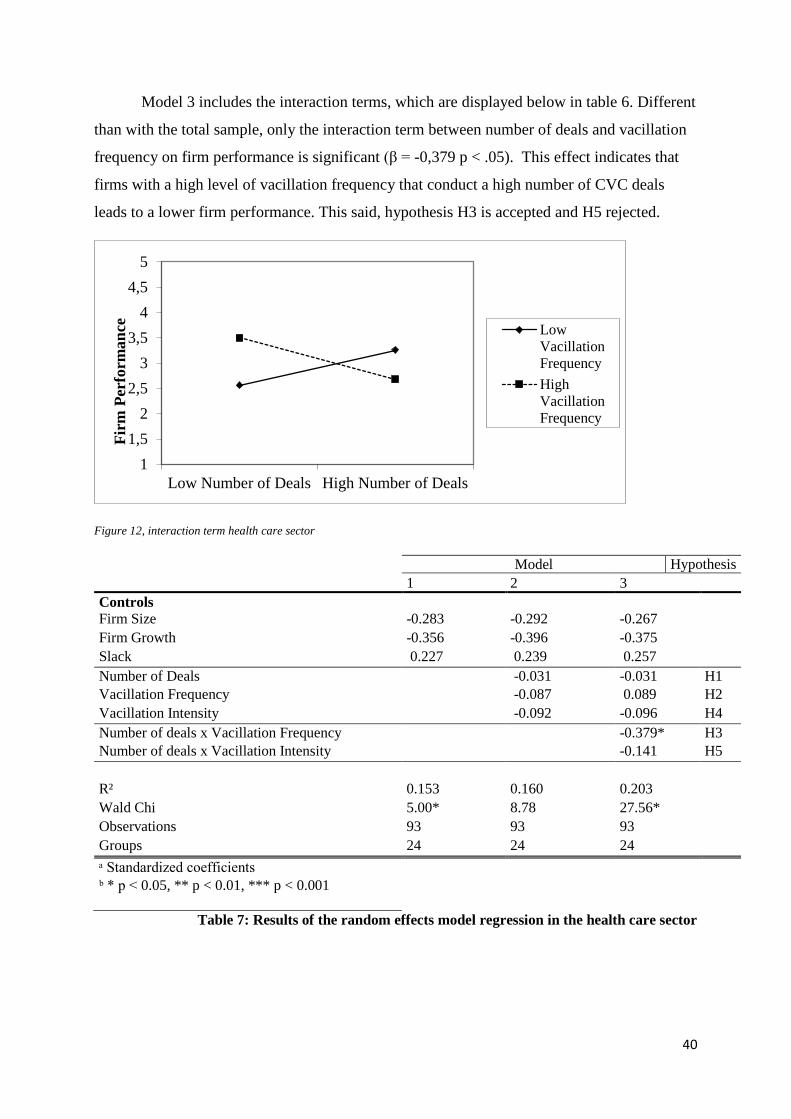
40
Model 3 includes the interaction terms, which are displayed below in table 6. Different
than with the total sample, only the interaction term between number of deals and vacillation
frequency on firm performance is significant (β = -0,379 p < .05). This effect indicates that
firms with a high level of vacillation frequency that conduct a high number of CVC deals
leads to a lower firm performance. This said, hypothesis H3 is accepted and H5 rejected.
Figure 12, interaction term health care sector
Model Hypothesis 1 2 3 Controls Firm Size -0.283 -0.292 -0.267 Firm Growth -0.356 -0.396 -0.375 Slack 0.227 0.239 0.257 Number of Deals
-0.031 -0.031 H1
Vacillation Frequency
-0.087 0.089 H2 Vacillation Intensity
-0.092 -0.096 H4
Number of deals x Vacillation Frequency
-0.379* H3 Number of deals x Vacillation Intensity
-0.141 H5
R² 0.153 0.160 0.203 Wald Chi 5.00* 8.78 27.56* Observations 93 93 93 Groups 24 24 24 ᵃ Standardized coefficients
ᵇ * p < 0.05, ** p < 0.01, *** p < 0.001
Table 7: Results of the random effects model regression in the health care sector
11,5
22,5
33,5
44,5
5
Low Number of Deals High Number of Deals
Firm
Per
form
ance Low
VacillationFrequencyHighVacillationFrequency

41
4.3.3 Technology Sector
The technology sector sample consists out of 17 North-American corporations operating in
the health care sector. Together with the 4 years of interests, this leads to a total of 66
observations, or in other words, years of data. Table 7 displays the relevant results of the
random effect model regression. Furthermore, the entire regression analysis is displayed in
appendix 7.4.7. Starting with the control variables in model 1, the variable of organizational
slack has a positive significant effect on firm performance (β = 0.100, p < .001). In other
words, an increase of 1.00 in organizational slack will lead to a 0.100 increase in firm
performance. Since slack is measured as the current ratio and firm performance as tobin’s q, it
implies that a raise of 1.00 in the firms’ current ratio leads to a 0.130 increase in the firms’
tobin q score. Furthermore, the control variable of firm growth has a significant effect on the
performance of firms (β = 1.348, p < .0001). This implies that for every unit extra of growth,
measured as the annual percentage change in sales, the tobin q of a firm raises with 1.348. At
last, the remaining control variable of firm size has no significant effect on firm performance.
Examining the main independent variables, it was found that none of those have a
significant effect on firm performance. In other words, the number of CVC deals (β = -0.004
p > .05), vacillation frequency (β = 0.253, p > .05) and vacillation intensity (β = -0.239, p >
.05) have no significant direct influence on the performance of the firms in the sample. This
said, H1, H2 and H4 can be rejected.
Model 3 includes the interaction terms, which are displayed below in table 7. Different
than in the health care sector, only the interaction term between number of deals and
vacillation intensity on firm performance is significant (β = -0,131 p < .05). This effect
indicates that firms with a high level of vacillation intensity that conduct a high number of
CVC deals leads to a lower firm performance. This said, hypothesis H5 is accepted and H3
rejected.

42
Figure 13, interaction term technology sector
Model Hypothesis 1 2 3 Controls Firm Size -0.088 -0.084 -0.059 Firm Growth 1.348** 1.271* 1.287* Slack 0.100** 0.098 0.099* Number of Deals
-0.004 -0.023 H1
Vacillation Frequency
0.253 0.557 H2 Vacillation Intensity
0.239 0.049 H4
Number of deals x Vacillation Frequency
-0.180 H3 Number of deals x Vacillation Intensity
-0.131* H5
R² 0.317 0.314 0.310 Wald Chi 18.64*** 62.40*** 51.71*** Observations 66 66 66 Groups 17 17 17 ᵃ Standardized coefficients
ᵇ * p < 0.05, ** p < 0.01, *** p < 0.001
Table 8: Results of the random effects model regression in the technology sector
1
1,5
2
2,5
3
3,5
4
4,5
5
Low Number of Deals High Number of Deals
Firm
Per
form
ance
Low VacillationIntensity
High VacillationIntensity

43
4.3.4 Total Sample versus Subsamples
Table 8 provides an overview of the tested hypotheses divided by the sample used. Hereby, S
stands for supported, NS for not supported and PS for partly supported. Partly supported
implies that the effect is significant, but the expected direction of it, positive or negative,
differs. For hypothesis 1, the number of CVC deals have no significant effect on the
performance of the firms in the total sample. The same counts for the health care and
technology sector. However, for the energy sector, the effect is negative significant (β = -
0.062, p < .05). So, it can be concluded that only firms operating in the energy sector have to
be aware of the negative influence of conducting CVC deals for their performance. For
hypothesis 2, the vacillation frequency have no significant effect on the performance of the
firms. After analysing the other sector-specific samples, it can be concluded that the
frequency of vacillation has no significant effect on firm performance, regardless of the
sector. For hypothesis 3, the interaction term of vacillation frequency and number of CVC
deals have a negative significant effect on the performance of firms in the total sample (β = -
0.107; p < .05). As is displayed in table 8, the same counts for firms operating in the health
care sector (β = -0,379 p < .05). However, the effect is stronger in the health care sector than
in the total sample. For the energy and technology sample, the interaction term is not
significant. For hypothesis 4, the effect of vacillation intensity on firm performance in the
total sample is not significant. The same counts for the three sector-specific samples, all three
samples show no significant effect here. At last, hypothesis 5 is partly supported in the total
sample (β = -0.065; p < 0.05), indicating that the interaction term of vacillation intensity and
number of CVC deals have a negative influence on the performance of firms. In the
technology sample, the interaction effect is significant too (β = -0,131 p < .05). This said, the
negative effect is stronger in the technology sector than in the total sample. Furthermore, for
the sector-specific samples of energy and health care, the interaction effects are not
significant.

44
Hypothesis Total Energy Health Care Technology
H1
Corporate Venture Capital activity has a positive influence on firm performance
NS PS NS NS
H2 The vacillation frequency of a firm has a positive relationship with firm performance
NS NS NS NS
H3 The vacillation frequency has a negative influence on the relationship between CVC activities and firm performance.
S NS S NS
H4 H5
The vacillation intensity of a firm has a positive relationship with firm performance The vacillation intensity has a positive influence on the relationship between CVC-activities and firm performance
NS NS NS NS PS NS NS PS
Table 9: Overview Hypotheses regarding the different samples
45
5. Conclusion and Discussion
Literature regarding corporate venture activities and their influence on factors like firm
performance is extensive. However, the field of CVC is relatively unexplored. This said, this
research is conducted as a confirmation of the existing knowledge regarding CVC, but more
important, as an extension of the current knowledge and literature. Furthermore, according to
previous literature (Rosenkopf and Nerkar, 2001; Boumgarden et al, 2012; Kang et al, 2017),
the vacillation theory is an important determiner of firm performance. However, despite the
attention paid to both the concepts, there has been no research conducted focusing on the
relationship between the organization’s structure/focus and corporate entrepreneurship, in this
case CVC, and their influence on performance (Burger and Cobin, 2016). This said, the
interplay between CVC and vacillation between structures supporting either exploration or
exploitation was central in this research.
First, it was expected that firms being actively involved in CVC in the form of
conducting CVC deals had a positive influence on the performance of those firms. Previous
literature states that CVC activity can influence firm performance in a positive manner due to
the gathering of valuable knowledge and/or technologies, adding new products to portfolios in
order to bolster sales and revenue and by stimulating the industry and ecosystem (Rijnders
and Elfring, 2001; Chesbrough, 2002; Forti and Toschi, 2014). In contrast to the literature
stated above, this study did not find evidence that there is a direct relationship between CVC
activity and firm performance. A reason for this is possibly that besides conducting CVC
deals, it is important for firms to manage the flow of knowledge and technologies in order to
gain advantage (Wright and Lockett, 2003). In this case, further research on the role of
knowledge management is needed.
As stated, vacillation of firms can be either determined by the frequency and intensity.
Nickerson and Zenger (2002) argue that senior management often use vacillation as an
instrument for bolstering firm performance, of which the decisions are based on the difference
between desired and actual performance. Furthermore, it is essential for firms to do both
exploration and exploitation in order to benefit. Firms conduct exploration to find new
technologies and gain knowledge from the environment and ecosystem. However, in order to
benefit from this new knowledge and/or technologies, it is important to exploit them within
your firm (Nickerson and Zenger, 2002; Boumgarden et al, 2012). As stated, vacillation was
measured by either frequency as intensity. For both, it was expected that they have an inverted

46
U-curve relation with firm performance. This study found evidence that both intensity as
frequency have significant influence on the performance of firms, and both effects are in the
form of an inverted U-curve. This implies that there is an optimal value, after it the effect
becomes negative. This study provides evidence that the optimal frequency of vacillation is
15 months. If firms decide to vacillate more often, this will lead to a decrease in firm
performance. A reason for this is the fact that firms need both exploration as exploitation to
benefit (Kang et al, 2017). In case of a too short time span between the vacillations, firms
cannot fully exploit the knowledge and technologies gained from the exploration phase. The
other way around, firms need time to explore for this new knowledge and technologies. So, if
the time span between vacillating is too short, they cannot fully gain knowledge which leads
to less knowledge to exploit.
Furthermore, as was assumed, this study provides evidence that the intensity of
vacillation has an inverted U-curve relation with firm performance. This implies the intensity
of vacillation has a positive influence till a certain point, after it becomes negative. Literature
provides several reasons for this result. First, too intensive vacillating can lead to too strong
inertia, which eventually can lead to too much resistance to change. In this way, the benefits
of organizational ambidexterity dissipate due to the rising costs of vacillating (Nickerson and
Zenger, 2002; Kang et al, 2017). Furthermore, too intensive exploration leads to too excessive
knowledge which is not of worth to the firm, In this way, effective exploitation is impossible.
At last, focussing to intensive on exploration can lead to the loss of routines regarding
exploitation, or vice versa. This loss of routines again lead to higher costs of vacillation
(Nickerson and Zenger, 2002; Kang et al, 2017).
As stated, the central purpose of this research is to research and determine the
interaction between CVC and vacillation, and their influence on firm performance. The
interaction effect is split up between either frequency or intensity of vacillation. First, this
study provides no support that the effect of vacillation frequency weakens the influence of
CVC activity on firm performance. However, the study does provide evidence that the
intensity of vacillation has a positive effect on the relationship between CVC activities and
firm performance. This effect is such, that firms with a high level of vacillation intensity that
conduct a high number of CVC deals will have a better firm performance. Furthermore, firms
that conduct a low number of deals, have more benefit with a low intensity of vacillation. A
reason for this is that CVC activities have mostly strategic goals. In other words, CVC
activities are mostly explorative activities and are focussed on gaining new knowledge and/or

47
technologies (Chesbrough, 2002). However, in order to gain advantage out of these CVC
activities, it is essential for firms to exploit the gained knowledge. This said, if firms are very
active on the CVC market and conduct a high number of deals, it is best for them to have a
high level of vacillation intensity. This in order to bolster the firm performance. So, it is
concluded that the vacillation intensity of firms have a strengthening effect on the relation
between CVC activities and firm performance.
Next, the effect and influence of the control variables were examined. The results
indicate that only the variable of organizational slack effects the performance of firm in a
positive manner. Previous literature stated that organizational slack has great influence on the
degree of CVC activity within a firm, in such a way that firms with a high number of excess
resources conduct more CVC related activities than firms with less or even no slack
(Chesbrough and Tucci, 2004). Furthermore, Sahaym et al (2010) stated that having a high
slack leads to an increase of risk-taking and experimentation, while low slacks lead to firms
being more conservative. This said, the results of this research indicate that the higher the
organizational slack, the better the organizational performance.
At last, an additional analysis was conducted in order to gain more knowledge about
the subject, and to indicate several opportunities for further research. The first part of the
additional analysis used the original sample and tested several additional effects. Two
significant effects were confirmed. First, the analysis confirmed that firm size has a positive
effect on the number of CVC deals conducted by firms. In other words, the larger a firm, the
higher the number of conducted CVC deals. A reason for this could be that the larger a firm,
the more funds it has to invest. Another reason could be that larger firms have possibly a
higher level or organizational slack. As was confirmed in the original analysis, a higher level
of slack leads to better firm performance, which again leads to more funds to invest.
However, further research is needed to confirm this. Second, the analysis confirmed that the
existence of a CVC program has a positive effect on the growth of firms. This is not strange,
since CVC activities are focussed on gathering new knowledge and/or technologies in order to
bolster organizational financial and strategic performance. This again leads to organizational
growth.
The second part of the additional analysis consisted out of three separate samples
based on sector: energy sector, health care sector and technological sector. Using those
samples, the same models as in the original analysis were used. Furthermore, only the
remarkable results are discussed. In the energy sector, the only proven effect is the one of
48
number of CVC deals on firm performance. The effect is positive, which implies that an
increase in CVC deals lead to a better firm performance. This is remarkable, since the direct
effect was not proven to be significant in the original analysis. Reasons for this are probably
industry specific. In order to test this, further research is needed. In the health care sample,
only the interaction term of number of CVC deals and vacillation frequency was supported,
while the original analysis resulted in both interaction terms being supported. At last, the
technology sector as analysed. The first remarkable result, in comparison with the original
results, is the significant effect of firm growth on firm performance. This effect is positive,
indicating that a higher level of firm growth for firms operating in the energy sector leads to
better performance. Furthermore, only the interaction term of number of CVC deals and
vacillation intensity was supported.
5.1 Practical implications
Besides a contribution to the existing literature concerning venture capital and vacillation, the
results of this study lead to several practical implications. First, the study provides evidence
that the optimal frequency of vacillation is 15 months. If firms vacillate more often, this will
lead to a decrease in performance. This said, it is essential for senior management to keep this
in mind when determining a vacillation strategy. Furthermore, it is of importance for senior
management to acknowledge the inverted u-curve relation between the intensity of vacillation
and the performance of their firm. It is essential to keep in mind there is an optimal point after
the effect becomes negative. In short, for senior management it is essential to be aware of the
effects of over intensive vacillating between structures supporting either exploration or
exploitation. If not, senior management risks lowering the performance of their firm. Besides
the direct effects, it was found that vacillation intensity moderates the relation between CVC
activity and firm performance in a negative manner. The results indicate that firms with a high
level of vacillation intensity that conduct a high number of CVC deals will have a better firm
performance. Furthermore, firms that conduct a low number of deals, have more benefit with
a low intensity of vacillation. So, if the senior management of a firm that is very active on the
CVC market is designing a vacillation strategy, it is of importance to acknowledge the results
of this research and implement a high level of intensity. This all in order to bolster their
performance. The other way around, if a firm conducts a low number of CVC deals, it is
better to implement a low level of vacillation intensity.

49
Besides the practical implications gained from the original analysis, the additional
analysis results lead to several practical implications. First, the additional analysis of the total
sample provides evidence that the existence of a CVC program has a positive influence on
firm growth. This said, CVC can be seen as a tool for realizing firm growth. For senior
management, it is of importance to know this when aiming for growth. Furthermore, the
analysis of the energy sector provides evidence that the number of CVC deals has a positive
influence on the performance of firms. This finding is of importance to senior management of
firms operating in the energy sector. In case senior management aims to enhance
performance, which is quite often the case, they could consider experimenting with CVC
investments or expanding their already existing activities. At last, the results of the energy
sector indicate, unlike the original analysis, indicate that firm growth has a positive influence
on firm performance. Again, this finding is of importance for senior management of firms
operating in the energy sector.
5.2 Limitations and Further Research
This study has several limitations which should be addressed in further research. First, the
additional analysis concerning the different sectors resulted in some different results than with
the original analysis. This said, it is of importance for further research to dig deeper into these
differences and conduct extensive analysis per sector. Second, this study did not find evidence
that there is a direct relationship between CVC activity and the performance of firms. As
stated, a possible reason for this that besides conducting CVC deals, it is important for firms
to manage the flow of knowledge and technologies in order to gain advantage (Wright and
Lockett, 2003). This said, further research on the role of knowledge management is needed.
At last, this study used several specific measures in order to test the hypotheses. These
measures are based on previous research regarding CVC and vacillation. However, there are
more possible measures to use. This said, it is of importance for future research to test
different measures and test if there are alternations in the results.

50
6. References
Andriopoulus, C., Lewis, M. (2009): Exploitation Tensions and Organizational
Ambidexterity: Managing Paradoxes of Innovation. Organization Science, Vol. 20, No. 4, pp.
696-717.
Allen, S. A., & Hevert, K. T. (2007). Venture capital investing by information technology
companies: Did it pay?. Journal of Business Venturing, 22(2), 262-282.
Baltagi, B. H. (2008). Panel Data Forecasting. Handbook of Economic Forecasting, 995-
1024.
Baum, J. A., Li, S. X., & Usher, J. M. (2000). Making the Next Move: How Experiential and
Vicarious Learning Shape the Locations of Chains' Acquisitions. Administrative Science
Quarterly, 45(4), 766-801.
Benner, M. J., & Tushman, M. (2002). Process Management and Technological Innovation: A
Longitudinal Study of the Photography and Paint Industries. Administrative Science
Quarterly, 47(4), 676-706.
Birkinshaw, J., & Gibson, C. B. (2004). Building an Ambidextrous Organisation. SSRN
Electronic Journal, 45(4), 46-56.
Boumgarden, P., Nickerson, J., & Zenger, T. R. (2012). Sailing into the wind: Exploring the
relationships among ambidexterity, vacillation, and organizational performance. Strategic
Management Journal, 33(6), 587-610.
Brown, S., & Eisenhardt, K. (1997). The Art of Continuous Change: Linking Complexity
Theory and Time-Paced Evolution in Relentlessly Shifting Organizations. Administrative
Science Quarterly, 42(1), 1-34.
Chesbrough, H.W. (2000). Designing corporate ventures in the shadow of private venture
capital. California Management Review, 42(3), 31-49.
Chesbrough, H. W. (2002). Making sense of corporate venture capital. Harvard business
review,80 (3), 90-99.
Chesbrough, H.W, & Tucci, C. L. (2002). Corporate venture capital in the context of
corporate innovation (No. CSI-REPORT-2005-001).

51
Duncan, R. B. 1976. The ambidextrous organization: Designing dual structures for
innovation. R. H. Kilmann, L. R. Pondy, D. P. Slevin, eds. The Management of Organization
Design, Vol. 1. Strategies and Implementation. North-Holland, New York, 167–188.
Dushnitsky, G., & Lenox, M. J. (2005a). When do firms undertake R&D by investing in new
ventures? Strategic Management Journal, 26(10), 947-965.
Dushnitsky, G., & Lenox, M. J. (2005b). When do incumbents learn from entrepreneurial
ventures: Corporate venture capital and investing firm innovation rates. Research Policy,
34(5), 615-639.
Dushnitsky, G., & Lenox, M. J. (2006). When does corporate venture capital investment
create firm value? Journal of Business Venturing, 21(6), 753-772.
Eriksson, P., (2012): Exploration and exploitation in project-based organizations:
Development and diffusion of knowledge at different organizational levels in construction
companies. International Journal of Project Management, Vol. 31, No. 3, pp. 333-341.
Field, A. P. (2012). Discovering statistics using SPSS (and sex and drugs and rock 'n'
roll) (4th ed.). Los Angeles California.: SAGE
Forti, E., & Toschi, L. (2014). Patents as Measure of Exploration and Exploitation Strategy:
The Case of CVC Investments. Department of Management, University of Bologna, 1-27.
Van Gils, M (2012). Analyzing the effect of corporate venture capital investments on a
corporation’s innovative performance, (Master’s Thesis). Retrieved from
http://arno.uvt.nl/show.cgi?fid=129625
Gupta, A. K., Smith, K. G., & Shalley, C. E. (2006). The interplay between exploration and
exploitation. Academy of Management Journal, 49(4)
Hair, J.F., Black W.C., Babin, B.J. & Anderson R.E. (2014). Multivariate Data Analysis (7th
edition). Edinburgh Gate, Pearson Education Limited.
Hsiao, Cheng (2014) Analysis of Panel Data. Third edition. Cambridge University Press, New
York.
Jansen, J (2005). Ambidextrous Organizations A Multiple-level Study of Absorptive Capacity,
Exploratory and Exploitative Innovation, and Performance, (Master’s Thesis). Retrieved
from https://www.erim.eur.nl/doctoral-programme/phd-in-management/phd-tracks/detail/250-

52
ambidextrous-organizations-a-multiple-level-study-of-absorptive-capacity-exploratory-and-
exploitative-innovation-and-performance/
Kang, J., Kang, R., & Kim, S. (2017). An empirical examination of vacillation
theory. Strategic Management Journal, 38(6), 1356-1370.
Keil, T. (2004). Building External Corporate Venturing Capability. Journal of Management
Studies, 41(5), 799-825.
Lavie, D., Kang, J., & Rosenkopf, L. (2011). Balance Within and Across Domains: The
Performance Implications of Exploration and Exploitation in Alliances. Organization
Science, 22(6), 1517-1538.
Lesar, S (2016). Corporations in the new world: could corporate venture capital be the
answer?, (Master’s Thesis). Retrieved from https://arno.uvt.nl/show.cgi?fid=142023
Levinthal D.A., March J.G., 1993. The myopia of learning. Strategic Management Journal ,
14: 95-112
Levitas, E., & McFadyen, M. A. (2009). Managing liquidity in research-intensive firms:
signaling and cash flow effects of patents and alliance activities. Strategic Management
Journal, 30(6), 659-678
March J.G., 1991. Exploration and exploitation in organizational learning. Organization
Science 2(1): 71-87.
Maula, M., & Murray, G. (2001). Corporate venture capital and the creation of US public
companies: The impact of sources of venture capital on the performance of portfolio
companies. Strategy in the Entrepreneurial Millennium, John Wiley & Sons.
Montgomery, C., Wernerfelt, B., 1988. Tobin’s q and the importance of focus in firm
performance. American Economic Review 78 (1), 246 – 250
Narayanan, V., Yang, Y., & Zahra, S. A. (2009). Corporate venturing and value creation: A
review and proposed framework. Research Policy, 38(1), 58-76.
Nelson RR, Winter SG. 1982. An Evolutionary Theory of Economic Change. Belknap Press:
Cambridge, MA.
Nickerson, J, Zenger, T. 2002. Being efficiently fickle: a dynamic theory of organizational
choice. Organization Science 13(5): 547–566.

53
Poser, T. B. (2003). The impact of corporate venture capital: Potentials of competitive
advantages for the investing company. Wiesbaden: Dt. Univ.-Verl.
Raisch, S., Birkinshaw, J., Probst, G., Tushman, L. (2009): Organizational Ambidexterity:
Balancing Exploitation and Exploration for Sustained Performance. Organization Science,
Vol. 20, No. 4, p. 685-695.
O’Reilly, C., Tushman, M. (2004): The Ambidextrous Organization. Harvard Business
Review, Vol. 8, No. 4, pp. 74-81.
O'Reilly, C. A., & Tushman, M. (2013). Organizational Ambidexterity: Past, Present and
Future. SSRN Electronic Journal.
Rijnders, D., & Elfring, T. (2001). Corporate Venture Capital: strategisch instrument voor het
ontwikkelen van groeiopties. Management Executive, 2, 28-45.
Rosenkopf, L., & Nerkar, A. (2001). Beyond local search: boundary-spanning, exploration,
and impact in the optical disk industry. Strategic Management Journal, 22(4), 287-306.
Sahaym, A., Steensma, H. K., & Barden, J. Q. (2010). The influence of R&D investment on
the use of corporate venture capital: An industry-level analysis. Journal of Business
Venturing, 25(4), 376-388.
Sarkar, M., Echambadi, R., & Harrison, J. S. (2001). Alliance entrepreneurship and firm
market performance. Strategic Management Journal, 22(6-7), 701-711.
Siegel R., Siegel E. and MacMillan I. (1988). Corporate venture capitalists: autonomy,
obstacles and performance. Journal of Business Venturing, 3, 233-247.
Singhal, R., Parkash, M., & Fu, L. (2016). Tobin’s q Ratio and Firm
Performance. International Research Journal of Applied Finance, 7(4), 1-11.
Sykes, H. B. (1990). Corporate venture capital: Strategies for success. Journal of Business
Venturing, 5(1), 37-47.
Trott, P. (2005). Innovation Management and New Product Development. FT Prentice Hall,
Harlow, UK
Vassolo, R. S., Anand, J., & Folta, T. B. (2004). Non-additivity in portfolios of exploration
activities: a real options-based analysis of equity alliances in biotechnology. Strategic
Management Journal, 25(11), 1045-1061.

54
Vermeulen, F., & Barkema, H. (2001). Learning through Acquisitions. Academy of
Management Journal, 44(3), 457-476.
Vos, J.E., (2013). De invloed van ambidexteriteit op het management control systeem; een
case study, (Master’s Thesis). Retrieved from http://www.scriptiesonline.uba.uva.nl/449794
Wolfe, J., & Sauaia, A. C. (2005). The Tobin q as a business game performance
indicator. Simulation & Gaming, 36(2), 238-249.
Wright, M., & Lockett, A. (2003). The Structure and Management of Alliances: Syndication
in the Venture Capital Industry. Journal of Management Studies, 40(8), 2073-2102.
Zahra, S. A., & Hayton, J. C. (2008). The effect of international venturing on firm
performance: The moderating influence of absorptive capacity. Journal of Business
Venturing, 23(2), 195-220.

55
7. Appendix
7.1 VIF-scores
Variable | VIF 1/VIF
-------------+----------------------
NumberDeals | 1.25 0.800660
Organizati~s | 1.25 0.802126
VacIntensity | 1.21 0.823771
program | 1.17 0.856333
Slack | 1.14 0.878658
logpercgro~h | 1.07 0.931004
Vacfrequency | 1.06 0.943581
Firmsize_n | 1.04 0.957966
-------------+----------------------
Mean VIF | 1.15
7.2 Pre analysis Tests
Breusch-Pagan / Cook-Weisberg test for heteroskedasticity
Breusch-Pagan / Cook-Weisberg test for heteroskedasticity
Ho: Constant variance
Variables: NumberDeals OrganizationalFocus Vacfrequency VacIntensity logpercgrowth
program Firmsize_n Slack
chi2(8) = 31.39
Prob > chi2 = 0.0001
Harris-Tzavalis unit-root test for TobinQ_n
Harris-Tzavalis unit-root test for TobinQ_n
-------------------------------------
Ho: Panels contain unit roots Number of panels = 150
Ha: Panels are stationary Number of periods = 4
AR parameter: Common Asymptotics: N -> Infinity

56
Panel means: Included T Fixed
Time trend: Not included
------------------------------------------------------------------------------
Statistic z p-value
------------------------------------------------------------------------------
rho 0.1641 -4.9952 0.0000
------------------------------------------------------------------------------
The Hausman-test
---- Coefficients ----
| (b) (B) (b-B) sqrt(diag(V_b-V_B))
| FE RE Difference S.E.
-------------+----------------------------------------------------------------
NumberDeals | -.008897 -.0056424 -.0032545 .0074019
Organizati~s | .0473833 .0623752 -.0149919 .0212777
VacIntensity | -.0372795 -.0439396 .0066601 .0048092
Slack | .0623217 .1419527 -.079631 .022557
Firmsize_n | -1.102569 -.3266313 -.7759382 .2093366
logGrowth | .0002466 .005166 -.0049194 .0048629
------------------------------------------------------------------------------
b = consistent under Ho and Ha; obtained from xtreg
B = inconsistent under Ha, efficient under Ho; obtained from xtreg
Test: Ho: difference in coefficients not systematic
chi2(6) = (b-B)'[(V_b-V_B)^(-1)](b-B)
= 34.10
Prob>chi2 = 0.0000
7.3 Hypotheses testing
7.3.1 Model 1
Random-effects GLS regression Number of obs = 588

57
Group variable: companynum Number of groups = 150
R-sq: Obs per group:
within = 0.0255 min = 2
between = 0.0429 avg = 3.9
overall = 0.0510 max = 4
Wald chi2(3) = 8.22
corr(u_i, X) = 0 (assumed) Prob > chi2 = 0.0416
(Std. Err. adjusted for 150 clusters in companynum)
-------------------------------------------------------------------------------
| Robust
TobinQ_n | Coef. Std. Err. z P>|z| [95% Conf. Interval]
--------------+----------------------------------------------------------------
Slack | .129994 .0636769 2.04 0.041 .0051897 .2547984
Firmsize_n | -.2649832 .1542992 -1.72 0.086 -.5674041 .0374377
logpercgrowth | -.0851406 .1944228 -0.44 0.661 -.4662024 .2959211
_cons | 3.617688 1.784304 2.03 0.043 .1205163 7.114859
--------------+----------------------------------------------------------------
sigma_u | .96484082
sigma_e | .37237461
rho | .87035774 (fraction of variance due to u_i)
-------------------------------------------------------------------------------
7.3.2 Model 2
Random-effects GLS regression Number of obs = 588
Group variable: companynum Number of groups = 150
R-sq: Obs per group:
within = 0.0350 min = 2
between = 0.0562 avg = 3.9
overall = 0.0669 max = 4
Wald chi2(8) = 19.60
corr(u_i, X) = 0 (assumed) Prob > chi2 = 0.0119
(Std. Err. adjusted for 150 clusters in companynum)

58
------------------------------------------------------------------------------
| Robust
TobinQ_n | Coef. Std. Err. z P>|z| [95% Conf. Interval]
-------------+----------------------------------------------------------------
NumberDeals | -.0031101 .0064777 -0.48 0.631 -.0158063 .009586
Vacfrequen~2 | -3.330027 1.373613 -2.42 0.015 -6.02226 -.6377941
Vacfrequency | 1.951358 .9487953 2.06 0.040 .0917534 3.810963
VacIntensi~2 | -.0511455 .0232062 -2.20 0.028 -.0966288 -.0056622
VacIntensity | -.003936 .0296734 -0.13 0.894 -.0620949 .0542228
Slack | .1276045 .0652659 1.96 0.051 -.0003142 .2555233
logpercgro~h | -.0817228 .1952284 -0.42 0.676 -.4643634 .3009179
Firmsize_n | -.3369172 .1678031 -2.01 0.045 -.6658053 -.0080291
_cons | 4.060135 1.882587 2.16 0.031 .3703314 7.749938
-------------+----------------------------------------------------------------
sigma_u | .9677565
sigma_e | .3732539
rho | .87050636 (fraction of variance due to u_i)
------------------------------------------------------------------------------
.
7.3.3 Model 3
Random-effects GLS regression Number of obs = 588
Group variable: companynum Number of groups = 150
R-sq: Obs per group:
within = 0.0432 min = 2
between = 0.0624 avg = 3.9
overall = 0.0739 max = 4
Wald chi2(11) = 36.37
corr(u_i, X) = 0 (assumed) Prob > chi2 = 0.0001
(Std. Err. adjusted for 150 clusters in companynum)
------------------------------------------------------------------------------
| Robust
TobinQ_n | Coef. Std. Err. z P>|z| [95% Conf. Interval]
-------------+----------------------------------------------------------------
NumberDeal~t | -.1415763 .1048573 -1.35 0.177 -.3470929 .0639402
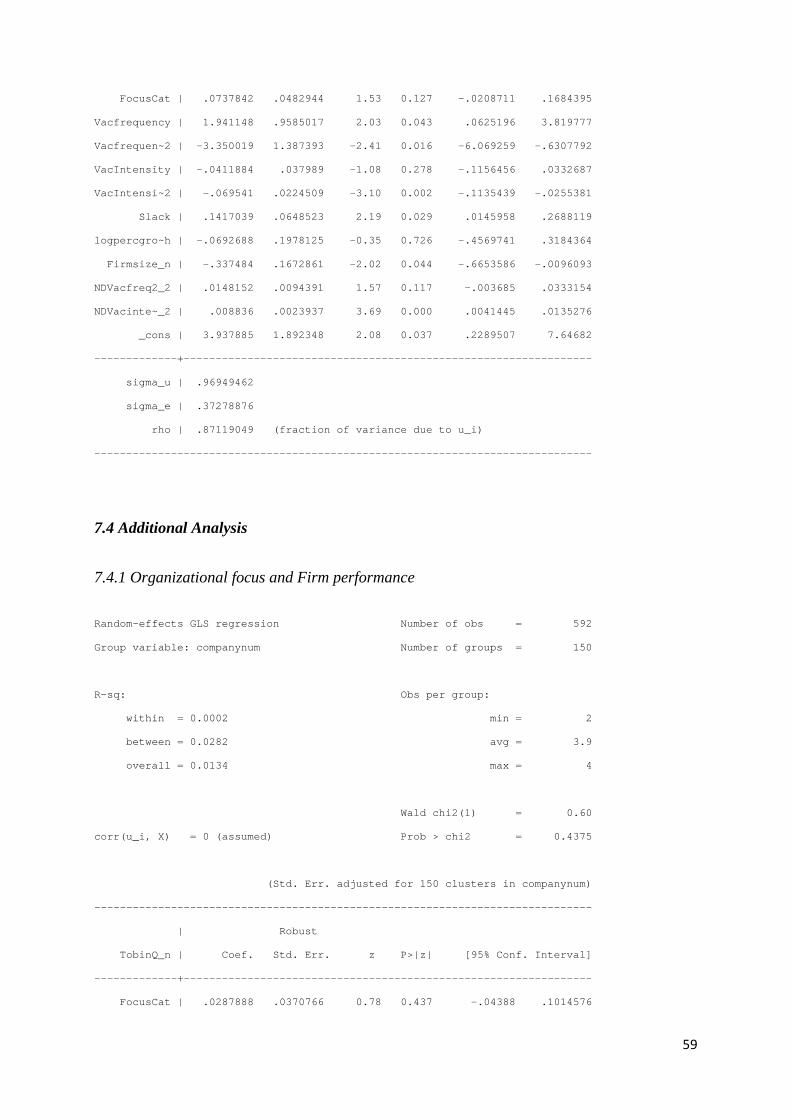
59
FocusCat | .0737842 .0482944 1.53 0.127 -.0208711 .1684395
Vacfrequency | 1.941148 .9585017 2.03 0.043 .0625196 3.819777
Vacfrequen~2 | -3.350019 1.387393 -2.41 0.016 -6.069259 -.6307792
VacIntensity | -.0411884 .037989 -1.08 0.278 -.1156456 .0332687
VacIntensi~2 | -.069541 .0224509 -3.10 0.002 -.1135439 -.0255381
Slack | .1417039 .0648523 2.19 0.029 .0145958 .2688119
logpercgro~h | -.0692688 .1978125 -0.35 0.726 -.4569741 .3184364
Firmsize_n | -.337484 .1672861 -2.02 0.044 -.6653586 -.0096093
NDVacfreq2_2 | .0148152 .0094391 1.57 0.117 -.003685 .0333154
NDVacinte~_2 | .008836 .0023937 3.69 0.000 .0041445 .0135276
_cons | 3.937885 1.892348 2.08 0.037 .2289507 7.64682
-------------+----------------------------------------------------------------
sigma_u | .96949462
sigma_e | .37278876
rho | .87119049 (fraction of variance due to u_i)
------------------------------------------------------------------------------
7.4 Additional Analysis
7.4.1 Organizational focus and Firm performance
Random-effects GLS regression Number of obs = 592
Group variable: companynum Number of groups = 150
R-sq: Obs per group:
within = 0.0002 min = 2
between = 0.0282 avg = 3.9
overall = 0.0134 max = 4
Wald chi2(1) = 0.60
corr(u_i, X) = 0 (assumed) Prob > chi2 = 0.4375
(Std. Err. adjusted for 150 clusters in companynum)
------------------------------------------------------------------------------
| Robust
TobinQ_n | Coef. Std. Err. z P>|z| [95% Conf. Interval]
-------------+----------------------------------------------------------------
FocusCat | .0287888 .0370766 0.78 0.437 -.04388 .1014576
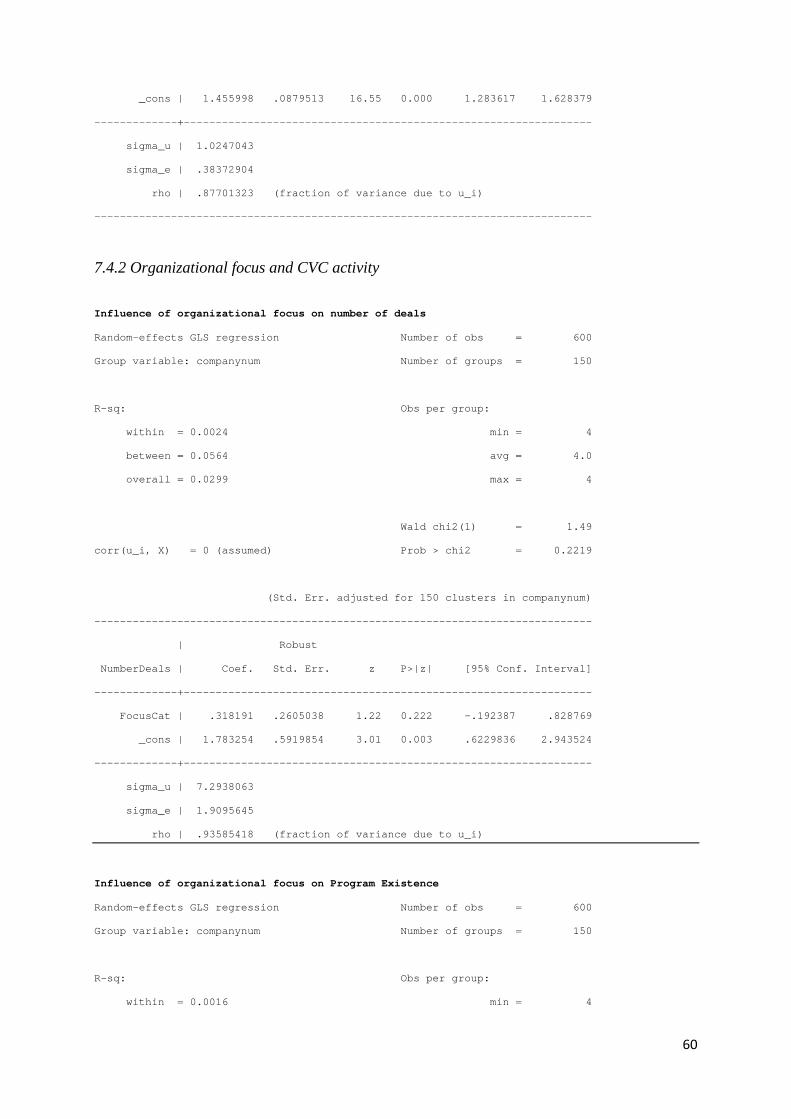
60
_cons | 1.455998 .0879513 16.55 0.000 1.283617 1.628379
-------------+----------------------------------------------------------------
sigma_u | 1.0247043
sigma_e | .38372904
rho | .87701323 (fraction of variance due to u_i)
------------------------------------------------------------------------------
7.4.2 Organizational focus and CVC activity
Influence of organizational focus on number of deals
Random-effects GLS regression Number of obs = 600
Group variable: companynum Number of groups = 150
R-sq: Obs per group:
within = 0.0024 min = 4
between = 0.0564 avg = 4.0
overall = 0.0299 max = 4
Wald chi2(1) = 1.49
corr(u_i, X) = 0 (assumed) Prob > chi2 = 0.2219
(Std. Err. adjusted for 150 clusters in companynum)
------------------------------------------------------------------------------
| Robust
NumberDeals | Coef. Std. Err. z P>|z| [95% Conf. Interval]
-------------+----------------------------------------------------------------
FocusCat | .318191 .2605038 1.22 0.222 -.192387 .828769
_cons | 1.783254 .5919854 3.01 0.003 .6229836 2.943524
-------------+----------------------------------------------------------------
sigma_u | 7.2938063
sigma_e | 1.9095645
rho | .93585418 (fraction of variance due to u_i)
Influence of organizational focus on Program Existence
Random-effects GLS regression Number of obs = 600
Group variable: companynum Number of groups = 150
R-sq: Obs per group:
within = 0.0016 min = 4

61
between = 0.0007 avg = 4.0
overall = 0.0007 max = 4
Wald chi2(1) = 2.95
corr(u_i, X) = 0 (assumed) Prob > chi2 = 0.0857
(Std. Err. adjusted for 150 clusters in companynum)
-------------------------------------------------------------------------------------
| Robust
program | Coef. Std. Err. z P>|z| [95% Conf. Interval]
--------------------+----------------------------------------------------------------
OrganizationalFocus | .0200521 .0116669 1.72 0.086 -.0028147 .0429189
_cons | .3414127 .0374203 9.12 0.000 .2680704 .4147551
--------------------+----------------------------------------------------------------
sigma_u | .4537643
sigma_e | .14911451
rho | .9025361 (fraction of variance due to u_i)
-------------------------------------------------------------------------------------
7.4.3 Firm Size and CVC Activity
Influence of Firm Size on number of deals
Random-effects GLS regression Number of obs = 598
Group variable: companynum Number of groups = 150
R-sq: Obs per group:
within = 0.0196 min = 2
between = 0.0162 avg = 4.0
overall = 0.0166 max = 4
Wald chi2(1) = 4.64
corr(u_i, X) = 0 (assumed) Prob > chi2 = 0.0312
(Std. Err. adjusted for 150 clusters in companynum)
------------------------------------------------------------------------------
| Robust
NumberDeals | Coef. Std. Err. z P>|z| [95% Conf. Interval]
-------------+----------------------------------------------------------------
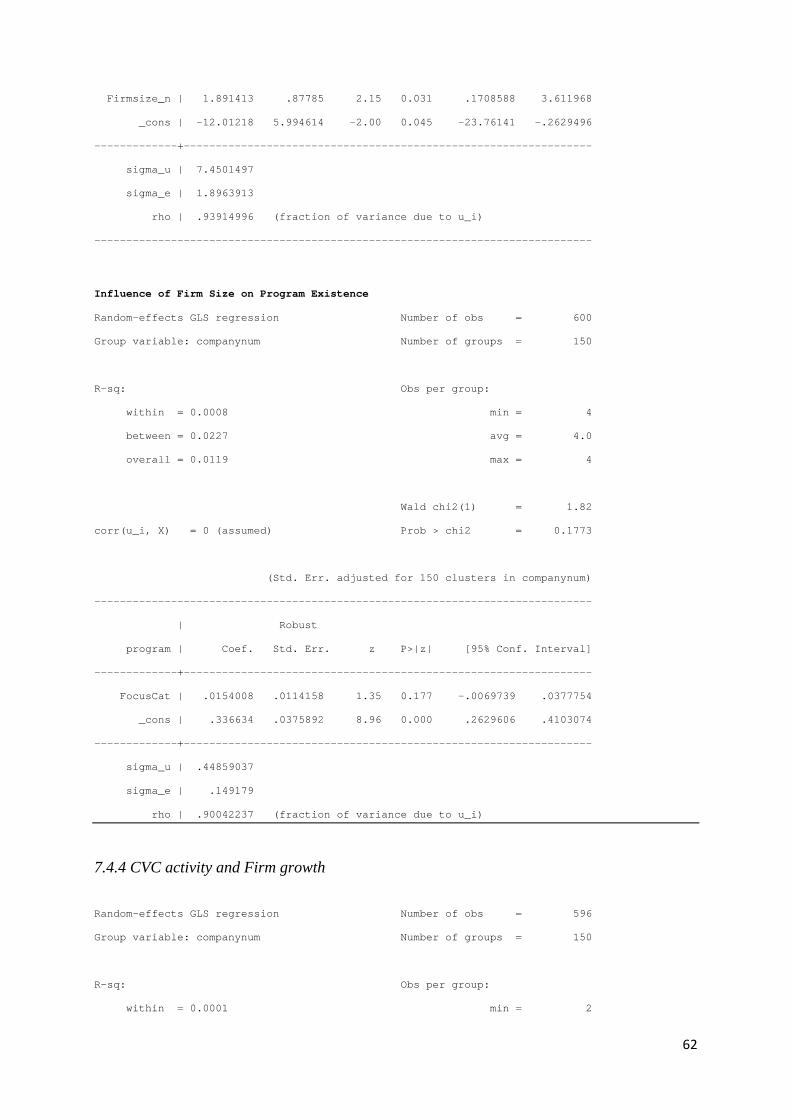
62
Firmsize_n | 1.891413 .87785 2.15 0.031 .1708588 3.611968
_cons | -12.01218 5.994614 -2.00 0.045 -23.76141 -.2629496
-------------+----------------------------------------------------------------
sigma_u | 7.4501497
sigma_e | 1.8963913
rho | .93914996 (fraction of variance due to u_i)
------------------------------------------------------------------------------
Influence of Firm Size on Program Existence
Random-effects GLS regression Number of obs = 600
Group variable: companynum Number of groups = 150
R-sq: Obs per group:
within = 0.0008 min = 4
between = 0.0227 avg = 4.0
overall = 0.0119 max = 4
Wald chi2(1) = 1.82
corr(u_i, X) = 0 (assumed) Prob > chi2 = 0.1773
(Std. Err. adjusted for 150 clusters in companynum)
------------------------------------------------------------------------------
| Robust
program | Coef. Std. Err. z P>|z| [95% Conf. Interval]
-------------+----------------------------------------------------------------
FocusCat | .0154008 .0114158 1.35 0.177 -.0069739 .0377754
_cons | .336634 .0375892 8.96 0.000 .2629606 .4103074
-------------+----------------------------------------------------------------
sigma_u | .44859037
sigma_e | .149179
rho | .90042237 (fraction of variance due to u_i)
7.4.4 CVC activity and Firm growth
Random-effects GLS regression Number of obs = 596
Group variable: companynum Number of groups = 150
R-sq: Obs per group:
within = 0.0001 min = 2
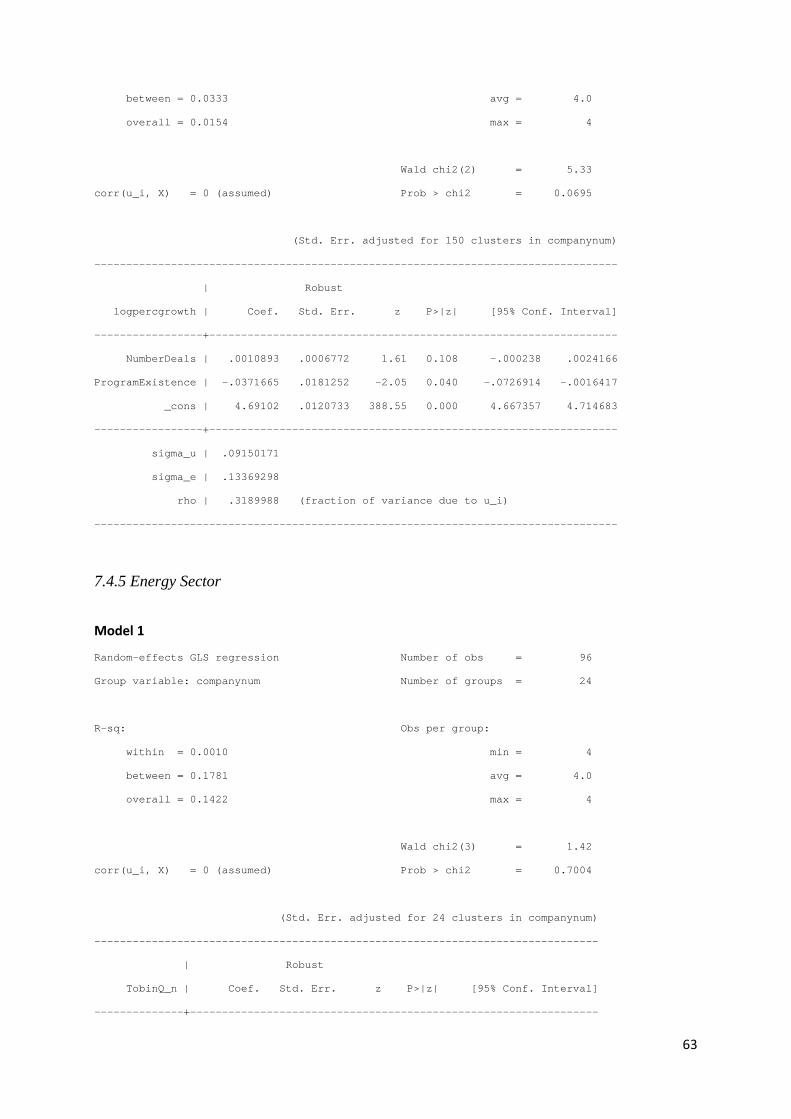
63
between = 0.0333 avg = 4.0
overall = 0.0154 max = 4
Wald chi2(2) = 5.33
corr(u_i, X) = 0 (assumed) Prob > chi2 = 0.0695
(Std. Err. adjusted for 150 clusters in companynum)
----------------------------------------------------------------------------------
| Robust
logpercgrowth | Coef. Std. Err. z P>|z| [95% Conf. Interval]
-----------------+----------------------------------------------------------------
NumberDeals | .0010893 .0006772 1.61 0.108 -.000238 .0024166
ProgramExistence | -.0371665 .0181252 -2.05 0.040 -.0726914 -.0016417
_cons | 4.69102 .0120733 388.55 0.000 4.667357 4.714683
-----------------+----------------------------------------------------------------
sigma_u | .09150171
sigma_e | .13369298
rho | .3189988 (fraction of variance due to u_i)
----------------------------------------------------------------------------------
7.4.5 Energy Sector
Model 1
Random-effects GLS regression Number of obs = 96
Group variable: companynum Number of groups = 24
R-sq: Obs per group:
within = 0.0010 min = 4
between = 0.1781 avg = 4.0
overall = 0.1422 max = 4
Wald chi2(3) = 1.42
corr(u_i, X) = 0 (assumed) Prob > chi2 = 0.7004
(Std. Err. adjusted for 24 clusters in companynum)
-------------------------------------------------------------------------------
| Robust
TobinQ_n | Coef. Std. Err. z P>|z| [95% Conf. Interval]
--------------+----------------------------------------------------------------

64
Slack | .1275337 .1087223 1.17 0.241 -.085558 .3406254
Firmsize_n | .0092631 .1197266 0.08 0.938 -.2253968 .243923
logpercgrowth | .0052136 .0871247 0.06 0.952 -.1655477 .1759748
_cons | .4908528 1.066769 0.46 0.645 -1.599975 2.581681
--------------+----------------------------------------------------------------
sigma_u | .33169551
sigma_e | .16041845
rho | .81043872 (fraction of variance due to u_i)
-------------------------------------------------------------------------------
Model 2
Random-effects GLS regression Number of obs = 96
Group variable: companynum Number of groups = 24
R-sq: Obs per group:
within = 0.0172 min = 4
between = 0.1868 avg = 4.0
overall = 0.1503 max = 4
Wald chi2(7) = 9.25
corr(u_i, X) = 0 (assumed) Prob > chi2 = 0.2351
(Std. Err. adjusted for 24 clusters in companynum)
-------------------------------------------------------------------------------
| Robust
TobinQ_n | Coef. Std. Err. z P>|z| [95% Conf. Interval]
--------------+----------------------------------------------------------------
NumberDeals | -.0617883 .0308164 -2.01 0.045 -.1221873 -.0013893
FocusCat | .0350499 .07562 0.46 0.643 -.1131625 .1832623
Vacfrequency | -.0580077 .4520811 -0.13 0.898 -.9440705 .828055
VacIntensity | .022234 .0621192 0.36 0.720 -.0995174 .1439855
Slack | .1370779 .125359 1.09 0.274 -.1086212 .382777
Firmsize_n | .0485569 .1580269 0.31 0.759 -.2611701 .3582838
logpercgrowth | .0178862 .0899677 0.20 0.842 -.1584472 .1942196
_cons | .139141 1.385921 0.10 0.920 -2.577215 2.855497
--------------+----------------------------------------------------------------
sigma_u | .31766591
sigma_e | .16073001
rho | .79617358 (fraction of variance due to u_i)

65
-------------------------------------------------------------------------------
Model 3
Random-effects GLS regression Number of obs = 96
Group variable: companynum Number of groups = 24
R-sq: Obs per group:
within = 0.0233 min = 4
between = 0.1950 avg = 4.0
overall = 0.1571 max = 4
Wald chi2(9) = 36.21
corr(u_i, X) = 0 (assumed) Prob > chi2 = 0.0000
(Std. Err. adjusted for 24 clusters in companynum)
-------------------------------------------------------------------------------
| Robust
TobinQ_n | Coef. Std. Err. z P>|z| [95% Conf. Interval]
--------------+----------------------------------------------------------------
NumberDeals | -.0564339 .0394766 -1.43 0.153 -.1338067 .0209388
FocusCat | .0425569 .0789688 0.54 0.590 -.1122191 .1973329
Vacfrequency | -.0915679 .4843129 -0.19 0.850 -1.040804 .857668
VacIntensity | -.1164036 .1570175 -0.74 0.458 -.4241523 .1913451
Slack | .1314361 .1309203 1.00 0.315 -.125163 .3880353
Firmsize_n | .0479125 .1639756 0.29 0.770 -.2734737 .3692988
logpercgrowth | .0176235 .093693 0.19 0.851 -.1660115 .2012585
NDVacfreq2 | -.0491914 .1882618 -0.26 0.794 -.4181778 .319795
NDVacintens2 | -.2078898 .2190114 -0.95 0.343 -.6371443 .2213648
_cons | .1621808 1.41281 0.11 0.909 -2.606876 2.931238
--------------+----------------------------------------------------------------
sigma_u | .33893954
sigma_e | .16293307
rho | .81229082 (fraction of variance due to u_i)
-------------------------------------------------------------------------------

66
7.4.6 Health Care Sector
Model 1
Random-effects GLS regression Number of obs = 93
Group variable: companynum Number of groups = 24
R-sq: Obs per group:
within = 0.0485 min = 2
between = 0.1915 avg = 3.9
overall = 0.1533 max = 4
Wald chi2(3) = 5.00
corr(u_i, X) = 0 (assumed) Prob > chi2 = 0.1716
(Std. Err. adjusted for 24 clusters in companynum)
------------------------------------------------------------------------------
| Robust
TobinQ_n | Coef. Std. Err. z P>|z| [95% Conf. Interval]
-------------+----------------------------------------------------------------
Slack | .2267564 .1442706 1.57 0.116 -.0560088 .5095216
Firmsize_n | -.2825786 .1801373 -1.57 0.117 -.6356413 .0704841
logpercgro~h | -.3564131 .6650053 -0.54 0.592 -1.6598 .9469733
_cons | 5.007095 2.773082 1.81 0.071 -.4280451 10.44224
-------------+----------------------------------------------------------------
sigma_u | .76383989
sigma_e | .55971168
rho | .65064436 (fraction of variance due to u_i)
------------------------------------------------------------------------------
Model 2
Random-effects GLS regression Number of obs = 93
Group variable: companynum Number of groups = 24
R-sq: Obs per group:
within = 0.0637 min = 2
between = 0.1887 avg = 3.9
overall = 0.1599 max = 4
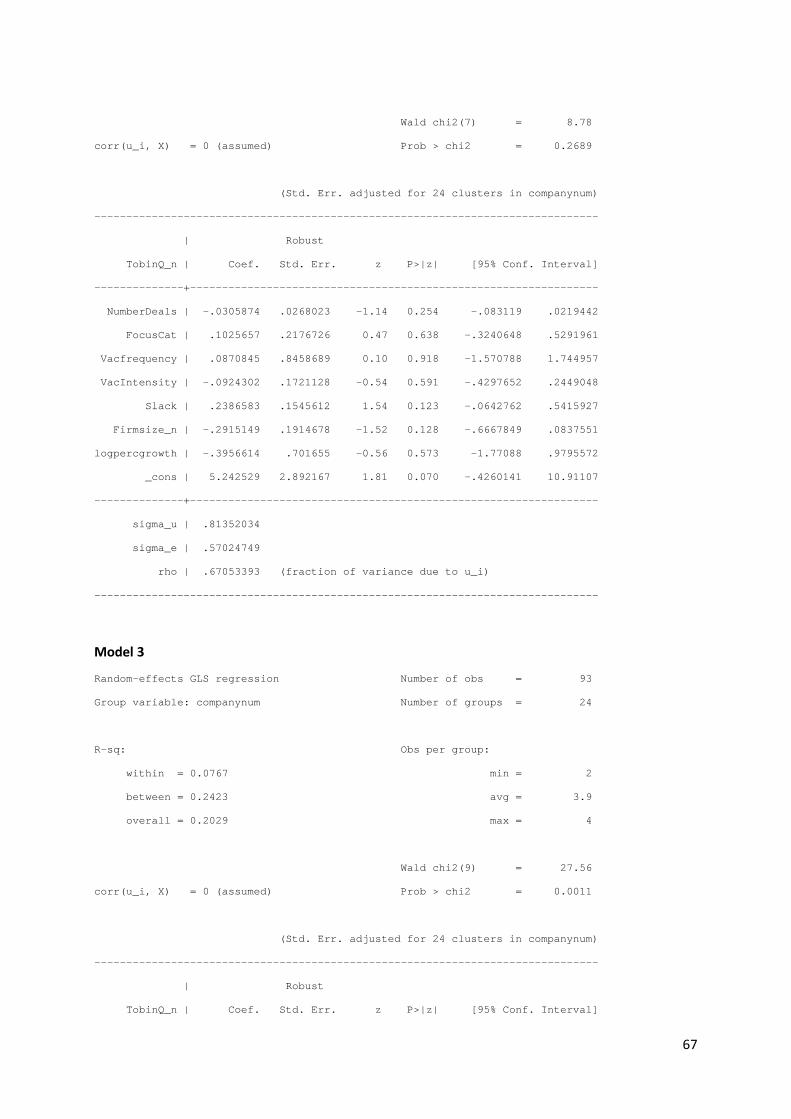
67
Wald chi2(7) = 8.78
corr(u_i, X) = 0 (assumed) Prob > chi2 = 0.2689
(Std. Err. adjusted for 24 clusters in companynum)
-------------------------------------------------------------------------------
| Robust
TobinQ_n | Coef. Std. Err. z P>|z| [95% Conf. Interval]
--------------+----------------------------------------------------------------
NumberDeals | -.0305874 .0268023 -1.14 0.254 -.083119 .0219442
FocusCat | .1025657 .2176726 0.47 0.638 -.3240648 .5291961
Vacfrequency | .0870845 .8458689 0.10 0.918 -1.570788 1.744957
VacIntensity | -.0924302 .1721128 -0.54 0.591 -.4297652 .2449048
Slack | .2386583 .1545612 1.54 0.123 -.0642762 .5415927
Firmsize_n | -.2915149 .1914678 -1.52 0.128 -.6667849 .0837551
logpercgrowth | -.3956614 .701655 -0.56 0.573 -1.77088 .9795572
_cons | 5.242529 2.892167 1.81 0.070 -.4260141 10.91107
--------------+----------------------------------------------------------------
sigma_u | .81352034
sigma_e | .57024749
rho | .67053393 (fraction of variance due to u_i)
-------------------------------------------------------------------------------
Model 3
Random-effects GLS regression Number of obs = 93
Group variable: companynum Number of groups = 24
R-sq: Obs per group:
within = 0.0767 min = 2
between = 0.2423 avg = 3.9
overall = 0.2029 max = 4
Wald chi2(9) = 27.56
corr(u_i, X) = 0 (assumed) Prob > chi2 = 0.0011
(Std. Err. adjusted for 24 clusters in companynum)
-------------------------------------------------------------------------------
| Robust
TobinQ_n | Coef. Std. Err. z P>|z| [95% Conf. Interval]

68
--------------+----------------------------------------------------------------
NumberDeals | -.0310866 .028794 -1.08 0.280 -.0875217 .0253486
FocusCat | .130567 .2240215 0.58 0.560 -.3085071 .5696411
Vacfrequency | .089176 .8363445 0.11 0.915 -1.550029 1.728381
VacIntensity | -.0959492 .2417997 -0.40 0.692 -.5698679 .3779695
Slack | .2574536 .1499616 1.72 0.086 -.0364657 .5513728
Firmsize_n | -.2664052 .1746367 -1.53 0.127 -.6086869 .0758764
logpercgrowth | -.3745254 .6969131 -0.54 0.591 -1.74045 .9913991
NDVacfreq2 | -.3792229 .1917693 -1.98 0.048 -.7550839 -.0033619
NDVacintens2 | -.1406155 .1212071 -1.16 0.246 -.3781771 .096946
_cons | 4.923842 2.93503 1.68 0.093 -.8287105 10.67639
--------------+----------------------------------------------------------------
sigma_u | .79199734
sigma_e | .57248273
rho | .65681911 (fraction of variance due to u_i)
-------------------------------------------------------------------------------
7.4.7 Technology Sector
Model 1
Random-effects GLS regression Number of obs = 66
Group variable: companynum Number of groups = 17
R-sq: Obs per group:
within = 0.0957 min = 2
between = 0.3199 avg = 3.9
overall = 0.3167 max = 4
Wald chi2(3) = 18.64
corr(u_i, X) = 0 (assumed) Prob > chi2 = 0.0003
(Std. Err. adjusted for 17 clusters in companynum)
-------------------------------------------------------------------------------
| Robust
TobinQ_n | Coef. Std. Err. z P>|z| [95% Conf. Interval]
--------------+----------------------------------------------------------------
Slack | .1001238 .035859 2.79 0.005 .0298415 .1704061

69
Firmsize_n | -.0882583 .2112471 -0.42 0.676 -.502295 .3257783
logpercgrowth | 1.348141 .5006819 2.69 0.007 .3668222 2.329459
_cons | -3.975722 1.459502 -2.72 0.006 -6.836294 -1.115151
--------------+----------------------------------------------------------------
sigma_u | .99046988
sigma_e | .37854077
rho | .87255173 (fraction of variance due to u_i)
-------------------------------------------------------------------------------
Model 2
Random-effects GLS regression Number of obs = 66
Group variable: companynum Number of groups = 17
R-sq: Obs per group:
within = 0.1150 min = 2
between = 0.3164 avg = 3.9
overall = 0.3136 max = 4
Wald chi2(7) = 62.40
corr(u_i, X) = 0 (assumed) Prob > chi2 = 0.0000
(Std. Err. adjusted for 17 clusters in companynum)
-------------------------------------------------------------------------------
| Robust
TobinQ_n | Coef. Std. Err. z P>|z| [95% Conf. Interval]
--------------+----------------------------------------------------------------
NumberDeals | -.0042634 .0067906 -0.63 0.530 -.0175727 .0090459
FocusCat | -.0677628 .2620858 -0.26 0.796 -.5814416 .445916
Vacfrequency | .2533061 1.382614 0.18 0.855 -2.456568 2.96318
VacIntensity | .2393846 .1956753 1.22 0.221 -.1441319 .6229011
Slack | .0981153 .0513255 1.91 0.056 -.0024808 .1987113
Firmsize_n | -.0838343 .2201466 -0.38 0.703 -.5153138 .3476451
logpercgrowth | 1.271132 .5451752 2.33 0.020 .2026087 2.339656
_cons | -3.585628 1.481857 -2.42 0.016 -6.490014 -.6812425
--------------+----------------------------------------------------------------
sigma_u | 1.1092733
sigma_e | .38699909
rho | .89149234 (fraction of variance due to u_i)

70
-------------------------------------------------------------------------------
Model 3
Random-effects GLS regression Number of obs = 66
Group variable: companynum Number of groups = 17
R-sq: Obs per group:
within = 0.1451 min = 2
between = 0.3133 avg = 3.9
overall = 0.3101 max = 4
Wald chi2(9) = 51.71
corr(u_i, X) = 0 (assumed) Prob > chi2 = 0.0000
(Std. Err. adjusted for 17 clusters in companynum)
-------------------------------------------------------------------------------
| Robust
TobinQ_n | Coef. Std. Err. z P>|z| [95% Conf. Interval]
--------------+----------------------------------------------------------------
NumberDeals | -.0234668 .019815 -1.18 0.236 -.0623035 .01537
FocusCat | .109835 .2665744 0.41 0.680 -.4126412 .6323112
Vacfrequency | .5571311 1.406906 0.40 0.692 -2.200353 3.314616
VacIntensity | .0493052 .1420504 0.35 0.729 -.2291085 .3277189
Slack | .0990953 .0536726 1.85 0.065 -.0061011 .2042917
Firmsize_n | -.0593286 .2114045 -0.28 0.779 -.4736739 .3550166
logpercgrowth | 1.286985 .5880668 2.19 0.029 .1343958 2.439575
NDVacfreq2 | -.179916 .1556408 -1.16 0.248 -.4849664 .1251344
NDVacintens2 | -.1306138 .058876 -2.22 0.027 -.2460087 -.0152189
_cons | -3.985778 1.887859 -2.11 0.035 -7.685914 -.2856421
--------------+----------------------------------------------------------------
sigma_u | 1.2282188
sigma_e | .39003944
rho | .90839095 (fraction of variance due to u_i)
-------------------------------------------------------------------------------
Top Related