


Languages
Pages
Legal


Air Force Institute of TechnologyAFIT Scholar
Theses and Dissertations Student Graduate Works
6-18-2015
Effect of Mixture Pressure and Equivalence Ratioon Detonation Cell Size for Hydrogen-AirMixturesCurtis A. Babbie
Follow this and additional works at: https://scholar.afit.edu/etd
This Thesis is brought to you for free and open access by the Student Graduate Works at AFIT Scholar. It has been accepted for inclusion in Theses andDissertations by an authorized administrator of AFIT Scholar. For more information, please contact [email protected].
Recommended CitationBabbie, Curtis A., "Effect of Mixture Pressure and Equivalence Ratio on Detonation Cell Size for Hydrogen-Air Mixtures" (2015).Theses and Dissertations. 201.https://scholar.afit.edu/etd/201
EFFECT OF MIXTURE PRESSURE AND EQUIVALENCE RATIO ON
DETONATION CELL SIZE FOR HYDROGEN-AIR MIXTURES
THESIS
JUNE 2015
Curtis A. Babbie, Captain, USAF
AFIT-ENY-MS-15-J-045
DEPARTMENT OF THE AIR FORCE AIR UNIVERSITY
AIR FORCE INSTITUTE OF TECHNOLOGY
Wright-Patterson Air Force Base, Ohio
DISTRIBUTION STATEMENT A.
APPROVED FOR PUBLIC RELEASE; DISTRIBUTION UNLIMITED.

The views expressed in this thesis are those of the author and do not reflect the official
policy or position of the United States Air Force, Department of Defense, or the United
States Government. This material is declared a work of the U.S. Government and is not
subject to copyright protection in the United States.

AFIT-ENY-MS-15-J-045
EFFECT OF MIXTURE PRESSURE AND EQUIVALENCE RATIO ON
DETONATION CELL SIZE FOR HYDROGEN-AIR MIXTURES
THESIS
Presented to the Faculty
Department of Aeronautics and Astronautics
Graduate School of Engineering and Management
Air Force Institute of Technology
Air University
Air Education and Training Command
In Partial Fulfillment of the Requirements for the
Degree of Master of Science in Aeronautical Engineering
Curtis A. Babbie, BS
Captain, USAF
June 2015
DISTRIBUTION STATEMENT A.
APPROVED FOR PUBLIC RELEASE; DISTRIBUTION UNLIMITED.
AFIT-ENY-MS-15-J-045
EFFECT OF MIXTURE PRESSURE AND EQUIVALENCE RATIO ON
DETONATION CELL SIZE FOR HYDROGEN-AIR MIXTURES
Curtis A. Babbie, BS
Captain, USAF
Committee Membership:
Dr. Paul I. King
Chair
Dr. Marc Polanka
Member
Dr. Fred Schauer
Member

iv
AFIT-ENY-MS-15-J-045
Abstract
Cell sizes of fuel and oxidizer combinations are the fundamental length scale of
detonations. The detonation cell size is correlated to dynamic detonation properties.
One of the properties, detonability is the motivation for this research. In order to
design combustion chambers for detonating engines, specifically PDEs and RDEs,
the cell size is needed. Higher than atmospheric mixture pressure detonation cell
sizes are important for scaling the combustion chambers, and before this research
no data existed for hydrogen and air detonation cell sizes at mixture pressures up to
10.0 atm. This research successfully validated a new detonation cell size
measurement technique and measured 15 cases for varying mixture pressures up to
10 atm and equivalence ratios. The results were concurrent with previous trends, as
increase in mixture pressure decreased detonation cell size and a decrease in
equivalence ratio from stoichiometric increased detonation cell size. The
experimental results were used to establish a correlation that estimates hydrogen
and air detonation cell size given initial mixture pressure and equivalence ratio. The
15 new data points will be added to the detonation database for future experiments
involving detonations.

v
Acknowledgments
I would like to express my sincere appreciation to my faculty advisor, Dr. Paul I. King,
for his guidance and support throughout the course of this thesis effort. The insight and
experience was certainly appreciated. I would, also, like to thank my sponsor, Dr. Fred
Schauer, from the Air Force Research Laboratory for both the support and latitude
provided to me in this endeavor. Last and most importantly, I would like to thank my
wife. Without her love and support over the last year and a half I would not have been
able to accomplish what I have.
Curtis A. Babbie
vi
Table of Contents
Page
Abstract .............................................................................................................................. iv
Table of Contents ............................................................................................................... vi
List of Figures .................................................................................................................. viii
Nomenclature .................................................................................................................... xii
List of Abbreviations ....................................................................................................... xiii
I. Introduction .....................................................................................................................1
General Issue ................................................................................................................1
Research Objectives .....................................................................................................2
Methodology.................................................................................................................3
Assumptions/Limitations ..............................................................................................4
II. Literature Review ............................................................................................................5
Chapter Overview .........................................................................................................5
Background...................................................................................................................5
Previous Research ......................................................................................................12
Summary.....................................................................................................................32
III. Methodology ...............................................................................................................33
Chapter Overview .......................................................................................................33
Experimental Methods................................................................................................33
Analysis Method .........................................................................................................43
IV. Analysis and Results ...................................................................................................51
Chapter Overview .......................................................................................................51
Results ........................................................................................................................51
Investigative Questions Answered .............................................................................58
vii
Summary.....................................................................................................................59
V. Conclusions and Recommendations ............................................................................60
Chapter Overview .......................................................................................................60
Conclusions of Research ............................................................................................60
Significance of Research ............................................................................................62
Recommendations for Future Research......................................................................63
Summary.....................................................................................................................63
Appendix A - Previous Research Data ..............................................................................64
Appendix B - Raw Schlieren Images .................................................................................71
Appendix C - Results by Equivalence Ratio and Pressure ..............................................102
Bibliography ....................................................................................................................112
viii
List of Figures
Page
Figure 1. Detonation triple point (Ciccarelli et al., 1994) ................................................... 6
Figure 2. Single detonation cell (Ciccarelli et al., 1994) .................................................... 7
Figure 3. Multiple cells with detonation front (Ciccarelli et al., 1997) .............................. 8
Figure 4. RDE dimensions ................................................................................................ 11
Figure 5. Open air detonation tube (Guirao et al., 1982) .................................................. 14
Figure 6. Soot foil trace (Moen et al., 1982) ..................................................................... 15
Figure 7. Soot trace end cap (Stevens et al., 2014) ........................................................... 19
Figure 8. Dominant mode method (Moen et al., 1982) .................................................... 20
Figure 9. Cell size vs. equivalence ratio (temperature range 277K to 650K) (Ciccarelli et
al., 1994, Ciccarelli et al., 1997, Guirao et al., 1982, Stamps et al., 1991, and Tieszen
et al., 1987) ................................................................................................................. 24
Figure 10. Cell size vs. equivalence ratio (temperature range 277K to 373K) (Ciccarelli et
al., 1994, Ciccarelli et al., 1997, Guirao et al., 1982, Stamps et al., 1991, and Tieszen
et al., 1987) ................................................................................................................. 25
Figure 11. Cell size vs. mixture pressure (Ciccarelli et al., 1994, Ciccarelli et al., 1997,
Guirao et al., 1982, Stamps et al., 1991, and Tieszen et al., 1987) ............................ 27
Figure 12. Cell size vs. mixture pressure with varying curve fits (Ciccarelli et al., 1994,
Ciccarelli et al., 1997, Guirao et al., 1982, Stamps et al., 1991, and Tieszen et al.,
1987) .......................................................................................................................... 29
Figure 13. Cell size vs. mixture pressure predictions with experimental data (Stamps et al,
1991) .......................................................................................................................... 32

ix
Figure 14. High pressure detonation tube ......................................................................... 34
Figure 15. Detonation tube viewing section ..................................................................... 34
Figure 16. Detonation tube viewing section cross section ................................................ 35
Figure 17. High pressure detonation tube exterior schematic ........................................... 36
Figure 18. High pressure detonation tube cut-away schematic ........................................ 37
Figure 19. Detonation tube and optics configuration ........................................................ 38
Figure 20. Hydrogen and oxygen detonation critical initial pressure versus critical tube
diameter (Matsui and Lee, 1979) ............................................................................... 40
Figure 21. Test matrix ....................................................................................................... 42
Figure 22. Raw schlieren images of detonation at 1.0 atm and 1.0 equivalence ratio ...... 43
Figure 23. Detonation triple point movement ................................................................... 45
Figure 24. Schlieren image of hydrogen and air detonation (P = 4.0 atm, Φ = 1.0)......... 46
Figure 25. Schlieren image of hydrogen and air detonation transverse shocks annotated (P
= 4.0 atm, Φ = 1.0) ..................................................................................................... 47
Figure 26. Figure 27. Schlieren image of hydrogen and air detonation with transverse
shocks annotated (P = 4.0 atm, Φ = 1.0) .................................................................... 48
Figure 28. Hydrogen-air detonation raw image and processed image comparison (P = 4.0
atm, Φ = 1.00) ............................................................................................................ 48
Figure 30. Hydrogen/air detonation cell size vs mixture pressure by equivalence ratio .. 54
Figure 31. Hydrogen/air detonation cell size vs equivalence ratio by mixture pressure .. 55
Figure 31. Hydrogen-air detonation cell size vs equivalence ratio, experimental data with
model overlay ............................................................................................................. 58
x
Figure C - 1. Hydrogen/air detonation cell size vs mixture pressure (P=1.0-4.0 atm,
Φ=1.00) .................................................................................................................... 103
Figure C - 2. Hydrogen/air detonation cell size vs mixture pressure (P=2.0-10.0 atm,
Φ=0.80) .................................................................................................................... 104
Figure C - 3. Hydrogen/air detonation cell size vs mixture pressure (P=4.0-10.0 atm,
Φ=0.70) .................................................................................................................... 105
Figure C - 4. Hydrogen/air detonation cell size vs mixture pressure (P=6.0-10.0 atm,
Φ=0.65) .................................................................................................................... 106
Figure C - 5. Hydrogen/air detonation cell size vs equivalence ratio (P=2.0 atm, Φ=0.80-
1.00) ......................................................................................................................... 107
Figure C - 6. Hydrogen/air detonation cell size vs equivalence ratio (P=4.0 atm, Φ=0.70-
1.00) ......................................................................................................................... 108
Figure C - 7. Hydrogen/air detonation cell size vs equivalence ratio (P=6.0 atm, Φ=0.65-
0.80) ......................................................................................................................... 109
Figure C - 8. Hydrogen/air detonation cell size vs equivalence ratio (P=8.0 atm, Φ=0.65-
0.80) ......................................................................................................................... 110
Figure C - 9. Hydrogen/air detonation cell size vs equivalence ratio (P=10.0 atm, Φ=0.65-
0.80) ......................................................................................................................... 111

xi
List of Tables
Page
Table 1. Pressure and equivalence ratios .......................................................................... 42
Table 2. Summary of results ............................................................................................. 52
Table 3. Error results......................................................................................................... 56
Table A - 1. Detonation data, Ciccarelli et al., 1994 ........................................................ 64
Table A - 2. Detonation data, Ciccarelli et al., 1997 ........................................................ 66
Table A - 3. Detonation data, Guirao et al., 1982 ............................................................. 67
Table A - 4. Detonation data, Stamps et al., 1991 ............................................................ 68
Table A - 5. Detonation data, Tieszen et al., 1987............................................................ 69
xii
Nomenclature
atm atmospheres
cm centimeters
dpi dots per inch
fps frames per second
ID inside diameter
λ cell size (mm, cm)
m meters
mJ millijoule mm millimeters
n sample size
N/A not available
Φ equivalence ratio
P pressure (torr, atm) initial pressure (torr, atm)
psia absolute pounds per square inch R
2 R-squared, goodness of fit
s sample standard deviation s
2 sample variance sample mean

xiii
List of Abbreviations
AFIT Air Force Institute of Technology
DDT Deflagration to Detonation
MAPE Mean Absolute Percent Error
PDE Pulsed Detonation Engine
RDE Rotating Detonation Engine
ZND Zel’dovich von Neumann Döring
1
EFFECT OF MIXTURE PRESSURE AND EQUIVALENCE RATIO ON
DETONATION CELL SIZE FOR HYDROGEN-AIR MIXTURES
I. Introduction
General Issue
Pressure gain combustors have the potential to replace traditional combustions
systems in gas turbine engines (Tellefsen et al., 2012). There is ongoing research into
pressure gain combustion systems, specifically RDEs, as standalone systems. At this
point, pressure gain combustion has not been fully incorporated into turbine engines. In
order to fully integrate RDEs into turbine engines, RDEs must be able to function using
pressures from high pressure compressors. At a turbine jet engine design point altitude of
approximately 30k ft, the inlet pressure is approximately 0.31 atm. Current jet engines in
aircraft have compressor pressure ratios of 30 and above (Millhouse et al., 2000). In an
RDE were to replace a traditional combustor, the RDE at 30k ft would have an input
pressure of approximately ten atm or higher. However, current RDE testing has not been
accomplished with input pressures at or above 10 atm (DeBarmore et al., 2013).
RDEs are sized based on the cell size of a detonation of the fuel and oxidizer
mixture. RDEs have three major design dimensions, the internal channel width, length,
and height, where the channel length is the circumference of the RDE and channel height
is measured perpendicular to the circumference. Two of the RDE dimensions are of
interest to cell size, channel length and channel height. Detonations can propagate into
two dimensional areas where the third dimension is less than the size of one detonation
cell; however, the other two dimensions must be larger than a cell width (Lee, 2008).

2
The internal channel width of an RDE can be less than the size of the detonation cell, and
the detonation will continue without transitioning into a deflagration. However, the
channel length and channel height must be greater than the cell size to sustain a
detonation.
In order to size RDEs correctly, the cell size of the detonation must be known. In
order to replace traditional combustors with RDEs, testing and design of RDEs are
necessary at pressures equal to post-compressor pressures greater than 2.5 atm.
Currently, there is no data available for cell sizes of non-diluted fuel and air mixtures at
mixture pressures greater than 2.5 atm.
There are measurements of detonation cell sizes for a variety of fuels, oxidizers,
and equivalency ratios at atmospheric pressures. As the mixture pressure is raised, the
amount of data decreases (Kaneshige, and Shepherd, 1997). There are data points for
mixtures at elevated mixture pressures where oxygen is used as an oxidizer (Kaneshige,
and Shepherd, 1997). However, turbine engines will inevitably use air as an oxidizer.
The difference in oxidizer will increase the cell size. There is also data for detonation
cell sizes at elevated pressures with air as an oxidizer, but with diluents added (Shepherd,
1985). The diluents were added to increase the cell size for ease of measurements. There
are known empirical formulas that show how much the diluent affects the cell size, but
correlations are not substitutes for actual data.
Research Objectives
This research started with the measurement of hydrogen and air at atmospheric
pressure to establish validity of the measurement technique used in this research. The
3
measurements were compared to historic data to establish a baseline. The mixture
pressure was increased to 2.0, 4.0, 6.0, 8.0, and 10.0 atm. The equivalence ratio was
decreased from 1.00 to 0.65 incrementally. The main goal of this research was to
measure hydrogen and air detonation cell size at 10 atm.
After 10 atm was reached, other variations of mixture pressure and equivalence
ratio were tested. The range of mixture pressures and equivalence ratios were used to
make an algorithm to predict hydrogen and air detonation cell sizes in the range of
mixture pressures and equivalence ratios tested.
This research developed a baseline method to measurement hydrogen and air
mixtures at up to 10 atm. The same method is being used to measure propane and air
detonation cell sizes. Eventually, methane and air and JP-8/10 and air mixtures will be
detonated and measured using the techniques found in the current research to fulfill the
need for data in the 10 atm mixture pressure regime.
Methodology
The experimental methods in this research included a detonation tube and an
optics configuration. A detonation was started inside the detonation tube through a
deflagration to detonation transition device. The detonation travelled through the tube
with an inside diameter of 66.64 mm, through a viewing section with fused silica glass on
two sides. The optics configuration then took images of the front of the detonation at the
center of the cross section. The optics configuration consisted of: an extended light
source, two parabolic mirrors, two flat mirrors, a knife-edge cut-off, and a high speed
camera.

4
The images were used to measure the cell width of the hydrogen and air
detonations at varying equivalence ratios and mixture pressures. The cell boundaries
were determined by finding triple points at the detonation front, or, where the triple
points were not visible, the transverse shock waves were used at the cell boundaries.
There are two transverse shock waves for each detonation cell. In order to find the
average cell size, the height of each image was divided by half the number of transverse
shocks plus one. One more was added because the transverse shocks did not follow the
exact edge of the window allowing for one more cell to be present.
Assumptions/Limitations
Experimental research in the detonation field is not exact due to the inherent
irregular nature of detonations. This research captures attributes of detonations in such a
way as to minimize the noise and irregularity in detonations. Though there are controls
to help the consistency of the detonations, the data shows that detonation measurements
are noisy and vary even within the same test.
5
II. Literature Review
Chapter Overview
The purpose of this chapter is to discuss what detonation cell size is and its
importance. In order to develop an appreciation for detonation cell size, a brief definition
of detonations is given followed by an in depth discussion of what a detonation cell is and
how it can be measured. Photographs and diagrams of detonations and detonation cells
are shown to support a complete understanding of the foundation of this research.
Further, this chapter will discuss previous research methods and the results
obtained. The previous results are analyzed to show trends in the data that were used in
the research for this paper. The previous research trends and data will be used to
compare to the current research in Chapter V. The relevance and motivation of cell size
to the current research is discussed.
Background
Definition of a detonation
A self-sustaining detonation is a wave consisting of a shock coupled with a
deflagrating reaction zone (Ciccarelli et al., 1997). The shock wave adiabatically
compresses the mixture, which quickly increases the temperature and pressure, allowing
the reaction to occur more quickly than a deflagration alone. A detonation consists of an
incident shock, transverse waves, and Mach stems (Ciccarelli et al, 1994). Transverse
waves continually collide creating Mach stems and propel the incident shock forward and
continuing the process until the reactants are no longer available or the mixture has
reached the detonability limits due to the geometry of the vessel (Tieszen et al., 1987).
6
The Zel’dovich von Neumann Döring (ZND) model was once used to characterize
detonations, but a detonation is not a simple planar wave with a reaction behind it. They
are complex irregular transverse shocks that create Mach stems and triple points in
varying patterns.
Definition of cell size
Detonation cell size is a fundamental physical characteristic of detonation waves.
The cell size can refer to the length or width of a detonation cell. This research only
measured the cell width, which will later be shown to be a more useful characteristic. A
detonation cell is defined by its boundaries. The boundaries of a detonation cell fall at
the triple point paths (Lee, 2008). A triple point is a point on the detonation front where
the incident shock, Mach stem, and transverse shock wave intersect. Figure 1 shows a
close up of the three components of a triple point. The trajectory shown in Figure 1
demonstrates the path the triple point takes while the detonation is moving.
Figure 1. Detonation triple point (Ciccarelli et al., 1994)
7
When two triple point paths cross, the four outside boundaries of a detonation cell
are formed. The triple point paths give the detonation cell a diamond shape or commonly
referenced as a fish scale. Denisov was the first to discover the cell pattern and it has
been called the fish scale pattern since (Denisov, 1960). Figure 2 shows a singular
detonation cell.
Figure 2. Single detonation cell (Ciccarelli et al., 1994)
In a detonation there is more than one cell. The number of cells depends upon the
fuel and oxidizer combusting, whether diluents are added, mixture temperature, mixture
stoichiometry, geometry of the facility, and mixture pressure in the facility (Lee, 1984).
Adding diluents or changing the equivalence ratio from 1.0 increases detonation cell size
(Ciccarelli et al, 1994). Increasing mixture pressure or temperature decreases detonation
cell size (Tieszen et al., 1987). Figure 3 shows multiple cells within an arbitrary
detonation. The cells are generally not of equal size and are referenced by the average
cell size.

8
Figure 3. Multiple cells with detonation front (Ciccarelli et al., 1997)
Importance of cell size
Detonation cell size is the fundamental length scale of detonations (Tieszen et al.,
1986). The cell size is correlated with other dynamic properties of detonations (Lee,
1984). These dynamic properties are detonation initiation energy, transmission, and
propagation (Lee, 1977). The dynamic detonation properties are all based on cell size
and detonation sensitivity, which is why the cell size has also been referred to as the
sensitivity of a detonation. Detonation sensitivity has been shown to be inversely
proportional to the cell size (Ciccarelli et al., 1997).
Detonation initiation energy is the minimum energy required to start a detonation
in a gas mixture (Ciccarelli et al., 1994). The initiation energy has been shown through
empirical correlations to be proportional to the cube of the detonation cell size (Lee,
1977). If the cell size were known, the minimum energy to start a detonation could be
used, which would allow for a safer design. Often times in testing, a high-explosive was
used to initiate a detonation inside a facility. They did not want to use more high-
explosive than was required.
, λ

9
Detonation transmission refers to a detonation’s ability to continue from one
geometry to another. The most used geometry is the critical tube diameter referring to
the minimum diameter a tube can be and allow a detonation to continue detonating into
an unconfined environment (Tieszen et al., 1987). A correlation was found by
Mitrofanov and Soloukhin that the critical tube diameter is approximately 13 times the
detonation cell size (Mitrofanov and Soloukhin, 1965). This relation was further tested
and verified by Moen et al., 1980.
Detonation cell size is most import for this research due to its correlation with
detonability or detonability limits. A vessel must contain the correct geometry in order to
allow a certain number of cells to form within (Dupre et al., 1985). The exact number of
cells required is different for each geometry and fuel-oxidizer combination, the absolute
minimum being one cell in height. If the internal height of a vessel is not at least as large
as one detonation cell, at most a deflagration will occur but will not transition to a
detonation. It was once thought that the detonability of a mixture was based only on the
equivalence ratio. This was found to be only partially true, and in fact, the detonability is
was found to be based on the geometry of the vessel (Tieszen et al., 1987). The
detonation cell size allows designers to build vessels that are no larger in cross-sectional
height than needed to allow a detonation to propagate.
The detonation dynamic properties have made the detonation cell size the
fundamental length scale for detonations. The cell size is also important in the reaction
zone length behind the detonation. The reaction zone length is directly proportional to
the speed of the detonation (Shepherd, 1986). The reaction zone length is important
because it drives the detonation speed and sensitivity (Shepherd, 1986). The cell size is
10
equal to an empirically derived constant times the reaction zone length (Schelkin and
Troshin, 1965). This relationship can help calculate the speed of the detonation wave.
Detonation waves are not constant velocity waves because of the changing reaction zone.
The detonation velocity can range from 0.6 to 1.6 times the Chapman Jouguet (CJ)
velocity, where the CJ velocity is the velocity where the reaction zone reaches sonic
velocity compared to the leading shock velocity (Shepherd, 1986). As the detonation
starts to decay, the reaction zone lengthens and pushes the transverse waves which further
accelerate the detonation wave (Shepherd, 1986). Therefore, the wave speed is closely
tied to the reaction zone length and transverse wave motion, and the transverse wave
motion is what creates the detonation cell boundaries.
The main motivation of this research was to find cell size for the use of
detonability limits inside of RDEs. An RDE geometry design will be based on the cell
size of the detonation it contains. Two of the three RDE channel dimensions are critical
for detonations, the channel height and circumference. The circumference can be
indefinite in size, but the minimum circumference is necessary for detonation
propagation. The minimum circumference is related to the detonation cell length,
however, the current research only measures cell width. Therefore, the current research
is only concerned with RDE height. Figure 4 shows the three dimensions of the channel
in an RDE. There is ongoing research to find the minimum channel height of an RDE,
but channel height cannot be less than one cell in order for a detonation to propagate
(Lee, 1984).

11
Figure 4. RDE dimensions
The RDE channel width is not a factor because detonations can propagate where
the cell thickness is less than one cell. According to Lee, a detonation can propagate in a
narrow channel where it is approximated by a two-dimensional model (Lee, 2008).
However, the circumference must be larger than one cell length and height of the channel
must be larger than one cell width. The actual dimensions will be different for each
mixture used.
One goal for RDEs is to replace traditional deflagrating combustors in jet engines
with an RDE. The combustor sits behind a compressor that can compress incoming air to
30 times the inlet pressure. At a design point altitude of about 30k feet, an inlet pressure
would be approximately 0.3 atm. This would yield a combustor intake air pressure near
ten atmospheres. For this reason, it would be advantageous to design an RDE combustor

12
for intake pressures in the ten atmosphere range. In order to design the RDE the cell size
must be known at that pressure, but no cell size data for hydrogen and air detonations has
been tested. Data for hydrogen and air detonations at less than one atmosphere is
numerous (Ciccarelli et al., 1994, Ciccarelli et al., 1997, Guirao et al., 1982, Stamps et al.,
1991, and Tieszen et al., 1987). There is also data for hydrogen and air detonations
above one atmosphere, but the greatest mixture pressure used was approximately three
atmospheres (Stamps et al., 1991, and Tieszen et al., 1987). The current research is an
effort to fill the data gap for hydrogen and air detonation cell size for mixture pressures
from one to ten atmospheres.
Previous Research
Previous research overview.
There have been other organizations and people measuring hydrogen and air
detonation cell size since the 1960s. One of the forerunners of hydrogen and air
detonation cell size was Sandia National Laboratories (SNL) and the associated
universities who worked with SNL. The most common purpose to measure cell size in
previous research was for nuclear reactors (Ciccarelli et al, 1994, Ciccarelli et al, 1997,
Stamps et al., 1991, Tieszen et al., 1986, Tieszen et al., 1987, and Guirao et al., 1982).
The reactors were dissipating hydrogen into the air in an enclosed facility which allowed
conditions for a detonation to occur (Tieszen et al., 1987). One of the most well-known
examples is the 3-mile Island incident. Though it was not proven whether a detonation
actually took place, it is known that the hydrogen in the air at least deflagrated and
created catastrophic failure. The reason for the SNL research in measuring hydrogen and
13
air detonation cell size was to find out how to prevent the mixture from detonating inside
the nuclear reactor facilities (Ciccarelli et al., 1994). If the cell size is large enough for a
given geometry, a detonation cannot occur. The SNL research found that by adding
steam to the mixture, the cell size was increased to render it safe from detonations
(Ciccarelli et al., 1994).
Previous experimental methods.
In the past, hydrogen and air detonation cell sizes have been measured through
different techniques and tools. Most of the techniques included diluting the mixture with
argon, helium, or steam which increase the cell size, but the current research is focused
on measuring detonation cell size in a non-diluted mixture to keep in line with an
operational purpose. To keep an aircraft as light as possible detonations would occur
without the extra weight of onboard diluents in pressured vessels. Previous research was
more concerned with avoiding ground detonations inside of nuclear reactors where extra
weight is not an issue.
The simplest experimental technique incorporated a detonation tube that was open
to the outside atmosphere. A soot foil was placed in the tube to record the detonation
cells. The soot foil was a piece of thin metal, often aluminum, with soot coating one
surface. The soot foil was placed inside the tube as a cylindrical shape. The first use of a
soot foil to record detonation cells was conducted by Denisov and Troshin, 1959. The
triple point paths leave an etching into the soot foil as they pass by. The exact reason that
the triple point paths leave a trace on the soot foil is not known, but it is believed to be
related to the vortices in the shear layer that extends from the triple points (Ciccarelli et
al., 1997).

14
In the simpler experiments the mixture pressure only had the option of being one
atmosphere, as it was not sealed. Figure 5 shows a picture of the experimental setup from
McGill University (Guirao et al., 1982). In the figure the end is not closed allowing the
detonation to continue to an unconfined space.
Figure 5. Open air detonation tube (Guirao et al., 1982)
The hydrogen and air gases were introduced through one end of the tube and
ignited. The gases passed over a DDT device and became a detonation before
approaching the exit of the tube. As the detonation passed through the tube, the higher
density triple points removed soot from the foil. Figure 6 shows a picture of one of these
soot foils. The traces along the soot foils effectively showed the outlines of detonation
cells. These soot foils were then used to measure the cell sizes in the analysis.
15
Figure 6. Soot foil trace (Moen et al., 1982)
The other dominant experimental setup mimicked a shock tube, with the
exception that it contained a detonation. Brookhaven National Labs (BNL) built and
tested several detonation tubes with hydrogen and air detonations. BNL’s main
detonation tubes were called the High-Temperature Combustion Facility (HTCF) and the
Small-Scale Development Apparatus (SSDA) (Ciccarelli et al., 1994 and (Ciccarelli et
al., 1997). SNL built and tested their Heated Detonation Tube (HDT) (Stamps et al.,
1991). These differed from McGill University’s in that they were sealed (Guirao et al.,
1982).
Sandia’s HDT was 0.43 m inside diameter and 13.1 m long (Stamps et al., 1991).
It was enclosed on both ends to contain the detonation. They were able to heat the tube,
change the equivalence ratio, and change the mixture pressure. Detonations were

16
initiated in their tube via direct initiation. This was composed of 110 g of DuPont
Detasheet high-explosive. Direct initiation is the easiest to set off a detonation, but it has
its drawbacks. A detonation requires a lot of energy to start and high-explosives contain
the required energy in a simple to install package. However, high-explosives are unsafe
and difficult to handle. A direct initiated detonation also will overdrive the detonation to
a velocity faster than it would travel on its own. For this reason the tube had to be longer
to allow the detonation to slow down to approximately its CJ velocity. At the end of the
tube a 3.66 m soot foil was placed to record the detonation cells. Sandia’s goal was to
measure and predict hydrogen and air detonation cell size based on equivalence ratio,
mixture temperature, and mixture pressure and to find the detonability limits with respect
to equivalence ratio.
BNL’s detonation tubes were similar to each other in setup, except the sizes were
different (Ciccarelli et al., 1994). The SSDA was an enclosed tube with an inside
diameter of 0.10 m and a length of 6.1 m (Ciccarelli et al., 1994). The HTCF was larger
with an inside diameter of 0.27 m and a length of 21.3 m (Ciccarelli et al., 1997). Both
the SSDA and the HTCF had the ability to change the mixture temperature from 300 K to
650 K and the ability to change to mixture pressure from one atmosphere to just less than
three atmospheres.
Before BNL designed their detonation tubes, it was common for detonation tubes
to employ a gas driver initiation system (Ciccarelli et al., 1994). The gas driver system
worked by inserting a diaphragm between two gas mixtures and detonating a driver gas
with less initial energy and letting the driver gas detonate the test gas. The driver gas was
usually a mix of acetylene and oxygen or any other easily detonable mixture, and the test
17
gas could be any mixture for that test. The driver gas was easily detonated through a
small exploding wire and detonated through the diaphragm, tearing it, and detonating the
test gas. The gas driver initiation system was safer than using direct initiation and it
would not allow the test gas to be overdriven. The main drawback to the gas driver
initiation system was that the diaphragm had to be replaced after each test.
In order to save time from replacing the diaphragms, BNL designed a
diaphragmless gas driver initiation system (Ciccarelli et al., 1994). In their system, the
driver gas was premixed in a separate container and injected quickly into one end of the
detonation tube. At the instant the correct amount of gas was injected, a small exploding
wire was ignited and started a detonation in the driver gas. In the same way as the
diaphragm system, the diaphragmless system allowed the detonation to transfer from the
driver gas to the test gas. In the diaphragm system, the diaphragm took some energy
from the detonation, which was avoided in BNL’s system. The drawback to the
diaphragmless initiation system was that there existed a potential for the driver gas to mix
with the test gas, but the time was so short and the tube was so long that BNL neglected
any mixing effects. Both the SSDA and the HTCF employed soot foils to trace the
detonation waves (Ciccarelli et al., 1994, Ciccarelli et al., 1997).
The previous methods established for measuring detonation cell sizes worked well
for each purpose. Most of the previous methods only included measuring cell sizes for
mixture pressures less than one atmosphere, where some included limited data points less
than three atmospheres. The current research required data points up to ten atmospheres;
therefore, even though the previous methods worked for their purpose, they did not work
18
for elevated mixture pressures. The results from previous methods are discussed in the
Previous results section.
More recently, an elevated mixture pressure setup has been tried using some of
the previous methods (Stevens et al., 2014). This method included using a smaller
detonation tube. The largest difference with this method was that it was designed to start
at higher than atmospheric pressure before the detonation occurred. The tube was filled
with air and hydrogen and mixed with a fan. After which a detonation was started by a
spark and a DDT device. The DDT device was a Shelkin spiral. This method of
detonation initiation is the safest, but it can make initiation more difficult.
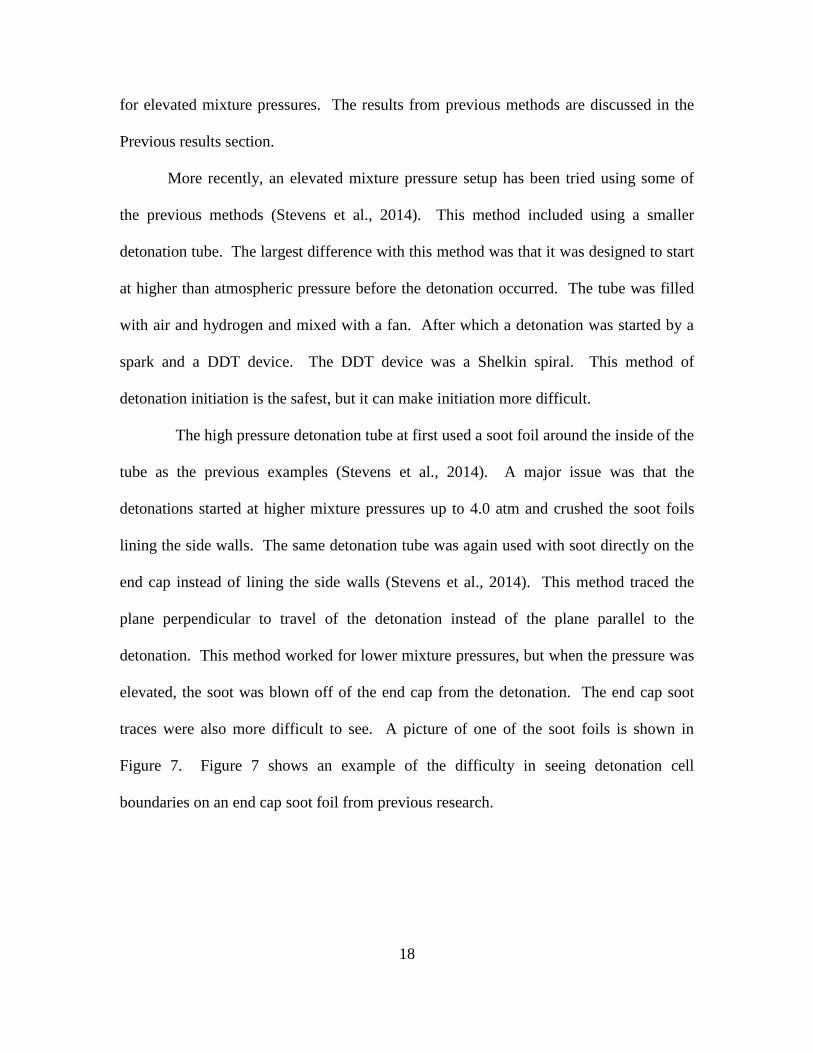
The high pressure detonation tube at first used a soot foil around the inside of the
tube as the previous examples (Stevens et al., 2014). A major issue was that the
detonations started at higher mixture pressures up to 4.0 atm and crushed the soot foils
lining the side walls. The same detonation tube was again used with soot directly on the
end cap instead of lining the side walls (Stevens et al., 2014). This method traced the
plane perpendicular to travel of the detonation instead of the plane parallel to the
detonation. This method worked for lower mixture pressures, but when the pressure was
elevated, the soot was blown off of the end cap from the detonation. The end cap soot
traces were also more difficult to see. A picture of one of the soot foils is shown in
Figure 7. Figure 7 shows an example of the difficulty in seeing detonation cell
boundaries on an end cap soot foil from previous research.
19
Figure 7. Soot trace end cap (Stevens et al., 2014)
Previous analysis methods.
Each of the previous methods incorporated different approaches to measure
detonation cell size on soot foils or soot traces. The two primary methods to measure cell
size used in most of the previous research were based on Moen et al., 1982. The first
method is referred to as the single cell method. In this method may cells are measured all
over the soot foil and then the average is taken of the cells. This method leaves much
subjectivity in what counts as a cell. Moen et al. found that there seemed to be a
substructure within the cells that made it difficult to distinguish what counted as a cell or
what was a substructure.
The second method to measure detonation cells was referred to as the primary cell
method or dominant cell method (Moen et al., 1982). This idea was based on the idea
that detonations have multiple modes of length scales for cell sizes. There can be
different size cells within cells called substructures. The dominant mode is the largest
20
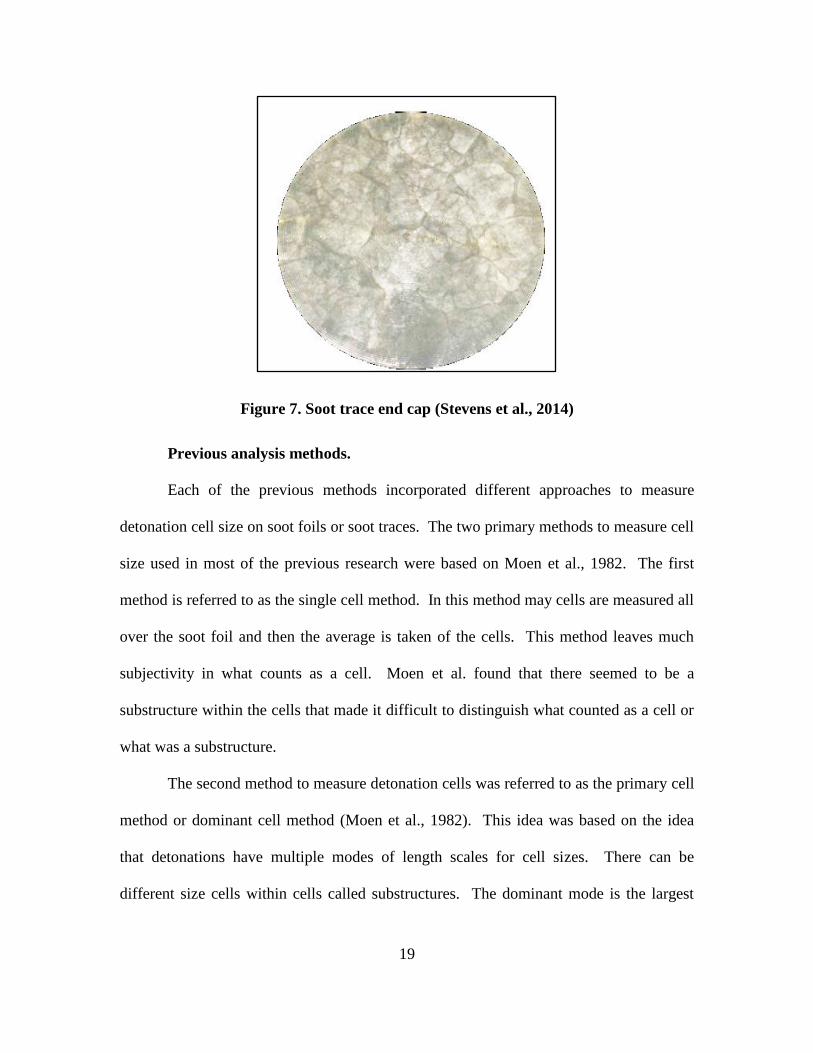
length scale. The dominant mode is observed on soot foils generally by looking for the
darkest lines of cell boundaries. Figure 8 shows the dark lines as the primary modes.
The cells were counted between two parallel lines and divided by the length of the lines.
In Figure 8, the highlighted cells would be counted. The dominant cell method was used
by Tieszen et al, 1994, Ciccarelli et al., 1997, Stamps et al., 1991, and Guirao et al., 1982.
Figure 8. Dominant mode method (Moen et al., 1982)
There are some criticisms of the dominant mode measurement of cell size.
Hydrogen and air detonations are generally irregular in cell structure which hampers the
ability to distinguish the dominant cell structure from the substructure (Guirao et al.,
1982). Moen et al., 1984 even later questioned whether there was a single dominant
mode or if there was a range of widths for each mixture, which would render a cell size
point estimate useless and bring about a need for a range of cell sizes where the
maximum cell size may be more important. Stamps et al., 1991 admitted that there was
21
subjectivity in distinguishing the cell boundaries and the end number was heavily
influenced by human error. Though the dominant mode method is subjective, it is still
the most reliable method to measure cell size.
More recent research has measured cells perpendicular to the detonation direction
(Stevens et al., 2014). The cells were viewed from an end cap of a detonation tube. The
triple points removed soot from a soot foil that the detonation reflected. The
measurement was done using the outside boundary of the end cap. The cells were
measured from the circumference of the end cap using the traced portions from the edge.
A cell was counted by dividing the circumference of the end cap by the number of cell
boundaries. There were not measurements taken; the research’s objective was to explore
new ways of measuring detonation cell size (Stevens et al., 2014).
In any method there is some subjectivity that causes uncertainty. According to
Tieszen et al., 1987, measuring detonation cell size is more of an art than a science. And
because there is subjectivity in the measurement, there is also subjectivity in the error
bounds. Tieszen et al., 1987 placed a subjective 25 percent error on cell size
measurements when comparing with other measurements within the report, and a 100
percent error on cell size measurements when comparing to cell sizes from other
research. They found error bounds by forcing the measured points into the known
relationship of the “U” shape in the graph of cell size versus equivalence. Prior to
finding the error, each author measured the cells using the dominant cell method and
were each assigned a subjective weight to their measurement based on their confidence in
their work. Then the weighted average was used as the cell size point estimate. The

22
weighted average was made to fit the “U” shaped graph and then the error bars were
subjectively selected.
Stamps et al., 1991 used their own error bound methods. Each author measured
the detonation cell size independently and the average was taken. On average one
author’s measurements were 1.16 times the size of the second author’s measurements
(Stamps et al., 1991). They assumed the standard deviation was 0.13 times the measured
cell size. They suggested that the true average detonation cell size was within 0.372 to
1.628 times the measured cell size. Stamps et al used an error of approximately 63
percent that came from a subjective standard deviation and a difference in each authors’
measurement of the same soot foil.
In other research, error bounds are ignored and only a point estimate is given. It
is clear from previous research that cell measurements and error bounds are subjective in
nature and relied on the authors’ ability to locate the dominant cells instead of
substructures..
Previous results.
Previous research came to many of the same conclusions about the effects of
mixture pressure, temperature, and equivalence ratio on cell size, but contained different
data points. Previous results are shown in Figures 9 to 13, as well as in Tables A-1 to A-
5. Data was obtained from all sources from Cal-Tech’s Detonation Database and refined,
corrected, and added to in order use only data from hydrogen and air detonations without
any diluents added (Ciccarelli et al., 1994, Ciccarelli et al., 1997, Guirao et al., 1982,
Stamps et al., 1991, and Tieszen et al., 1987). The data ranged in mixture pressure from
approximately 0.40 atmospheres to 3.00 atmospheres. Though not as important in this
23
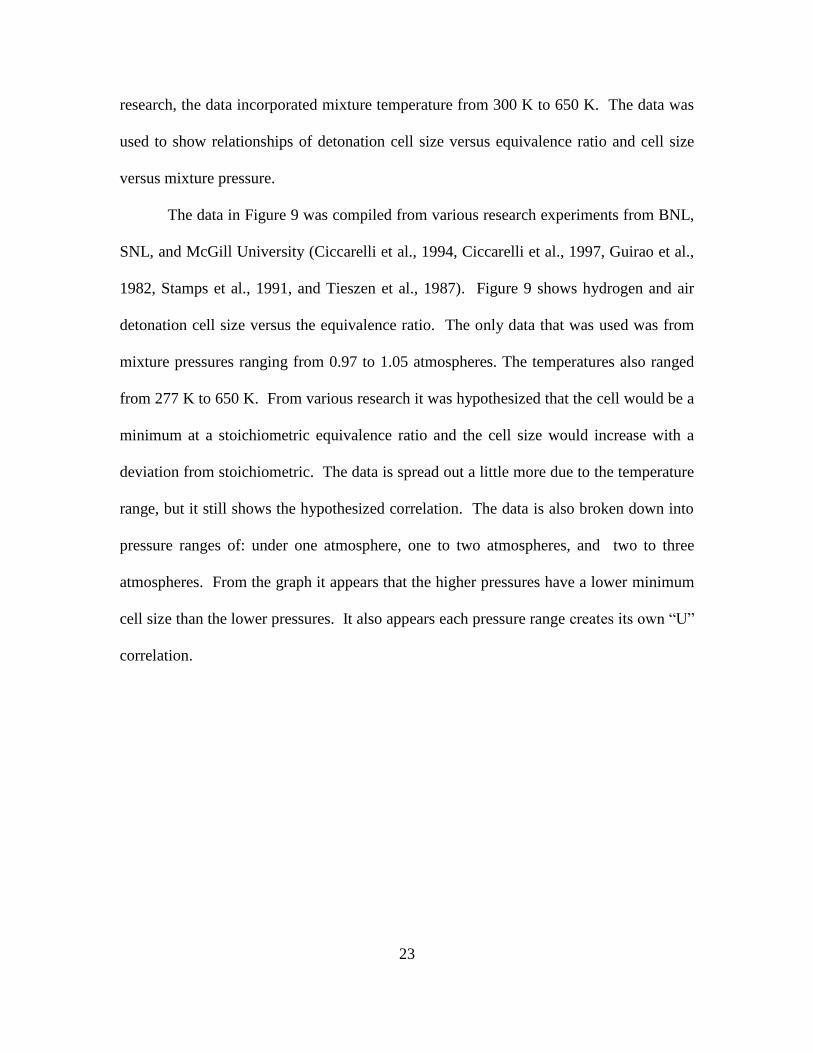
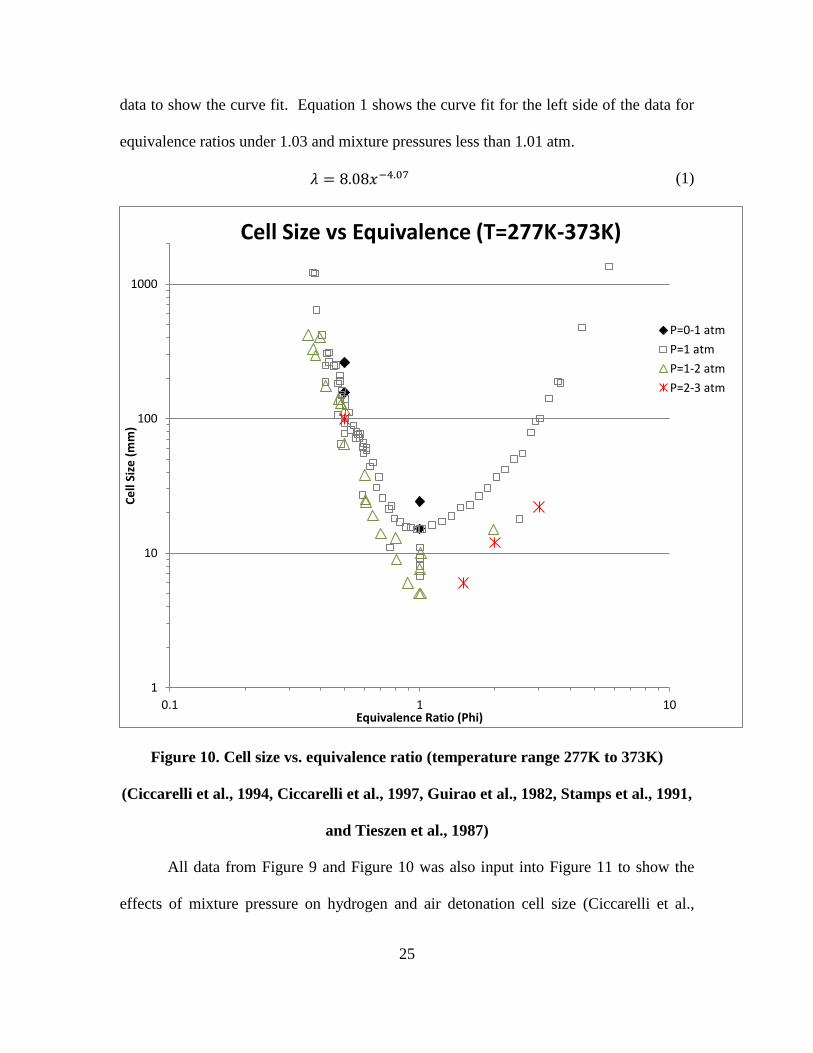
research, the data incorporated mixture temperature from 300 K to 650 K. The data was
used to show relationships of detonation cell size versus equivalence ratio and cell size
versus mixture pressure.
The data in Figure 9 was compiled from various research experiments from BNL,
SNL, and McGill University (Ciccarelli et al., 1994, Ciccarelli et al., 1997, Guirao et al.,
1982, Stamps et al., 1991, and Tieszen et al., 1987). Figure 9 shows hydrogen and air
detonation cell size versus the equivalence ratio. The only data that was used was from
mixture pressures ranging from 0.97 to 1.05 atmospheres. The temperatures also ranged
from 277 K to 650 K. From various research it was hypothesized that the cell would be a
minimum at a stoichiometric equivalence ratio and the cell size would increase with a
deviation from stoichiometric. The data is spread out a little more due to the temperature
range, but it still shows the hypothesized correlation. The data is also broken down into
pressure ranges of: under one atmosphere, one to two atmospheres, and two to three
atmospheres. From the graph it appears that the higher pressures have a lower minimum
cell size than the lower pressures. It also appears each pressure range creates its own “U”
correlation.

24
Figure 9. Cell size vs. equivalence ratio (temperature range 277K to 650K)
(Ciccarelli et al., 1994, Ciccarelli et al., 1997, Guirao et al., 1982, Stamps et al., 1991,
and Tieszen et al., 1987)
The same data from Figure 9 is shown in Figure 10 with the mixture temperature
range restricted to 277 K to 373 K (Ciccarelli et al., 1994, Ciccarelli et al., 1997, Guirao
et al., 1982, Stamps et al., 1991, and Tieszen et al., 1987). Without the temperatures
above 373 K, the data is tighter and shows a more uniform shape, though there is less
1
10
100
1000
0.1 1 10
Ce
ll Si
ze (
mm
)
Equivalence Ratio (Phi)
Cell Size vs Equivalence (T=277K-650K)
P=0-1 atm
P=1 atm
P=1-2 atm
P=2-3 atm
25
data to show the curve fit. Equation 1 shows the curve fit for the left side of the data for
equivalence ratios under 1.03 and mixture pressures less than 1.01 atm.
(1)
Figure 10. Cell size vs. equivalence ratio (temperature range 277K to 373K)
(Ciccarelli et al., 1994, Ciccarelli et al., 1997, Guirao et al., 1982, Stamps et al., 1991,
and Tieszen et al., 1987)
All data from Figure 9 and Figure 10 was also input into Figure 11 to show the
effects of mixture pressure on hydrogen and air detonation cell size (Ciccarelli et al.,
1
10
100
1000
0.1 1 10
Ce
ll Si
ze (
mm
)
Equivalence Ratio (Phi)
Cell Size vs Equivalence (T=277K-373K)
P=0-1 atm
P=1 atm
P=1-2 atm
P=2-3 atm
26
1994, Ciccarelli et al., 1997, Guirao et al., 1982, Stamps et al., 1991, and Tieszen et al.,
1987). Figure 11 shows hydrogen and air detonation cell size versus mixture pressure.
The mixture pressures are divided into categories based on ranges of equivalence ratio
with a trend line through them. The range of mixture temperatures is from 277 K to 373
K. Correlations were added to the data by equivalence ratio. The data is focused on 1.0
atm and is not consistent in the curve fits.

27
Figure 11. Cell size vs. mixture pressure (Ciccarelli et al., 1994, Ciccarelli et al.,
1997, Guirao et al., 1982, Stamps et al., 1991, and Tieszen et al., 1987)
1000
100
10
X
R1 = 0 .8619
222.14x.0·67
fl1 = 0.8971
X
5 0
Cell Size vs Pressure (T=277K-373K)
y = lE+OBx·W> ~ R1 = 0.7999
<>
0
0 0
y • 3E-.·06x·2-~»7
R2 :: 0.9095
¢\ <>
0
~
@ 0 1:>. 0
y • 94634x·'·"~' R2 • 0 .9918
... y ;; 3 4 229x·UOL+
R2 • 0.9221
~
100 150
<>
Pressure (kPa)
200
y = 6255.1x·l.H8 R2 = 0.997 5
250 300 350
0 Phi=0.350-0.399
0 Phi::~~ Q.400-0.449
1:::. Phl=0.450-0.499
X Phi= O.S00-0.54 9
0 Phi=O.SS0-0.599
l Phl=O.G00-0.659
+ Phl= O.GS0-0.699
Phl=O. 700-0.799
Phl:o0 .800.0.899
Phl= l
[] Phl= l .OS-1 .39
Phl,. 1.40-1 .69
Phl= 1.70-2.09
Phl= 2. 10 -3.70
-Power (Phi: Q.350-0.399)
-Power (Phi=0.450-0 .499)
- Power (Phi=O.S00-0.549)
- Power (Phi=O.G00-0 .659)
- Power (Phi=O.GS0-0 .699)
- Power (Phi<::;Q.B00-0 .899)
- Power (Phi=l)
- Power (Phlz 1.4 0-1 .69)
- Power (Phlz 1.70-2.09)

28
Figure 12 shows the same data as Figure 11 except pressure ranges with less than
three data points has been removed for clarity (Ciccarelli et al., 1994, Ciccarelli et al.,
1997, Guirao et al., 1982, Stamps et al., 1991, and Tieszen et al., 1987). The equivalence
ratios where there are multiple data points have been averaged for trends and clarity. In
both Figure 12 and Figure 11, it is evident that an increase in mixture pressure decreases
the cell size. Each equivalence ratio range trend line has a different slope based on a
power series curve fit added to the data. The exponent ranges from -0.5 to -2.4. The
exponents do not appear to follow any trends when compared to changing equivalence
ratios and mixture pressures. The range of exponents and the lack of a general trend
shows that the previous results don’t establish a clear baseline to make comparisons. The
previous data trend fits do give a range to make generalized comparisons to the current
research. There is not enough data to make any clear conclusions to a more exact
empirical formula for all equivalence ratios for the previous data. The mixture pressures
in Figure 11 and Figure 12 only reach just over 2.5 atmospheres. The slopes of the trend
lines are unknown for mixture pressures greater than 2.5 atmospheres.

29
Figure 12. Cell size vs. mixture pressure with varying curve fits (Ciccarelli et al.,
1994, Ciccarelli et al., 1997, Guirao et al., 1982, Stamps et al., 1991, and Tieszen et
al., 1987)
1000
X
y = 865.3Sx-0-4 19 R2 • 0.8619 X
y • 1E-+·0Sx·2.571 Rl • 0.7999
<>
Cell Size vs Pressure (T=277K-373K)
<> <>
<>
100 0 Phi= 0 .350..0.399
1 0
0
y • 222.14x-o·674
R1 "" 0 .8971
50
y "' 9 4 634x·l.624
R2 • 0.99:18
y = 3 4 229x·l.:wl R1 • 0.9221
+
100 150
Pressure (kPa)
<>
200 250 300
6. Phi:zOAS0-0.499
X Phlz O.S00-0.54 9
I Phi"'O.G00-0.659
+ Phi,.O.GS0-0.699
Phi= O.S00-0.899
Phi= l
Phi= 1.40 -1.69
Phi,. l .?0-2 .09
- Power (Phi: Q.350-0.399)
- Power (Phi=0.450-0.499)
- Power (Phi"'O.S00-0.549)
- Power {Phi=O.G00-0.659)
- Power (Phi=O.GS0-0 .699)
- Power (Phi=O.B00-0 .899)
- Power (Phi=l)
- Power (Phl=1 .40-1.69)
- Power (Phi• l .?0-2.09)
30
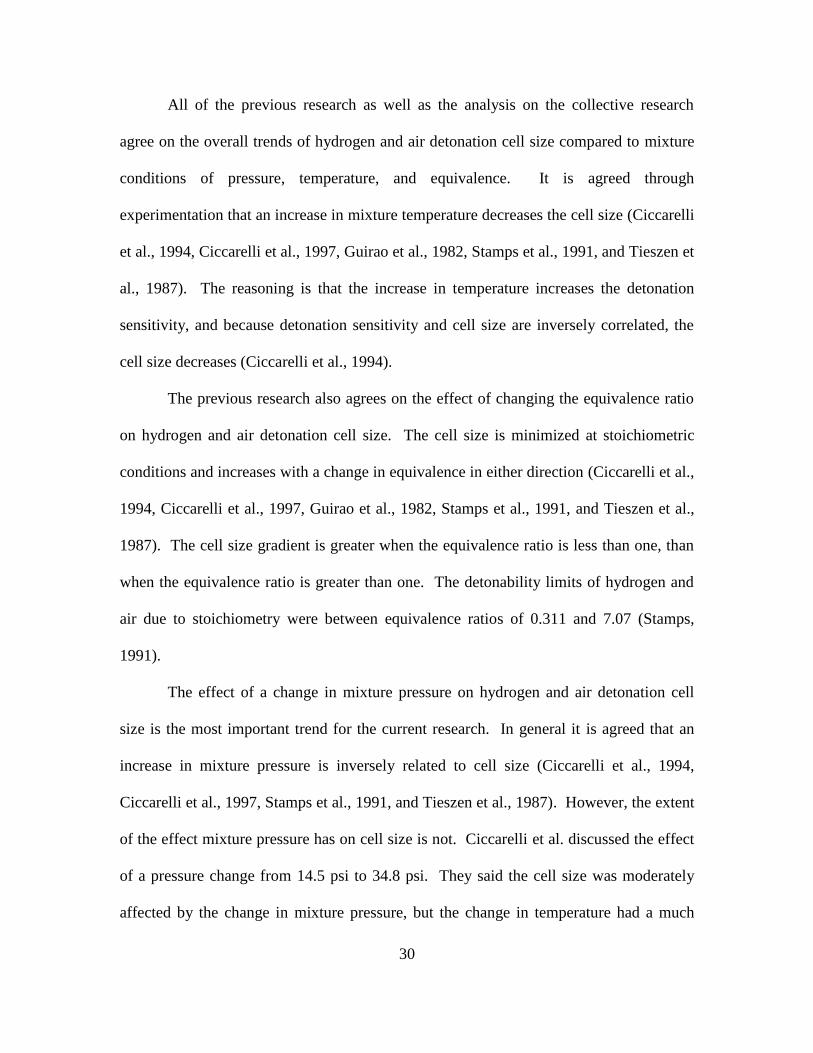
All of the previous research as well as the analysis on the collective research
agree on the overall trends of hydrogen and air detonation cell size compared to mixture
conditions of pressure, temperature, and equivalence. It is agreed through
experimentation that an increase in mixture temperature decreases the cell size (Ciccarelli
et al., 1994, Ciccarelli et al., 1997, Guirao et al., 1982, Stamps et al., 1991, and Tieszen et
al., 1987). The reasoning is that the increase in temperature increases the detonation
sensitivity, and because detonation sensitivity and cell size are inversely correlated, the
cell size decreases (Ciccarelli et al., 1994).
The previous research also agrees on the effect of changing the equivalence ratio
on hydrogen and air detonation cell size. The cell size is minimized at stoichiometric
conditions and increases with a change in equivalence in either direction (Ciccarelli et al.,
1994, Ciccarelli et al., 1997, Guirao et al., 1982, Stamps et al., 1991, and Tieszen et al.,
1987). The cell size gradient is greater when the equivalence ratio is less than one, than
when the equivalence ratio is greater than one. The detonability limits of hydrogen and
air due to stoichiometry were between equivalence ratios of 0.311 and 7.07 (Stamps,
1991).
The effect of a change in mixture pressure on hydrogen and air detonation cell
size is the most important trend for the current research. In general it is agreed that an
increase in mixture pressure is inversely related to cell size (Ciccarelli et al., 1994,
Ciccarelli et al., 1997, Stamps et al., 1991, and Tieszen et al., 1987). However, the extent
of the effect mixture pressure has on cell size is not. Ciccarelli et al. discussed the effect
of a pressure change from 14.5 psi to 34.8 psi. They said the cell size was moderately
affected by the change in mixture pressure, but the change in temperature had a much
31
larger effect on cell size (Ciccarelli et al., 1997). It is important to note that the pressure
range they used is just over double the starting pressure. They did not gather enough data
points to make clear quantifiable relationships to show how much mixture pressure and
temperature independent of each other affected cell size (Ciccarelli et al., 1997).
Stamps et al. came to a similar conclusion that an increase in pressure did in
general decrease the cell size, but with a local minimum (Stamps et al., 1991). They
found that the cell size decreased by a factor of approximately two between the mixture
pressures of 1.0 atmospheres and 3.0 atmospheres. Figure 13 shows a proprietary model
Stamps et al. used to predict the cell size for a given pressure. They predicted that the
cell size could have a local minimum depending on the equivalence ratio. Figure 13
shows four equivalence ratios predicted and two equivalence ratios tested. Stamps et al.
predicted cell size for mixture pressures up to 3.0 atmospheres but only tested to about
2.5 atmospheres. There are only four and five data points for each equivalence ratio at a
range of pressures from approximately 0.25 atm to 2.5 atm.

32
Figure 13. Cell size vs. mixture pressure predictions with experimental data (Stamps
et al, 1991)
Summary
Detonation cell size is an important characteristic of detonations. It is the
fundamental length scale that can be used to find other detonation properties. Detonation
properties can be useful to designers for many reasons, but the most important reason for
the current research is in helping design an RDE with the correct dimensions. Designers
use cell size to determine the minimum circumference and length of an RDE that can
sustain a detonation. There is much data available for hydrogen and air detonation cell
size for mixture pressures less than three atmospheres, but until this research no data
existed for mixture pressures between three and ten atmospheres.

33
III. Methodology
Chapter Overview
The purpose of this chapter is to explain the methods used to conduct the
experiments and to analyze the data from the experiment. The experimental setup is
similar to previous detonation tubes with differences in the optics section. The analysis
methods use different techniques to measure detonation cells from the classic dominant
mode of cell counting. With information on the setup and analysis, others should be able
to replicate and improve upon the process in order to obtain more detonation cell size
data for any gaseous mixture required.
Experimental Methods
Experimental Setup
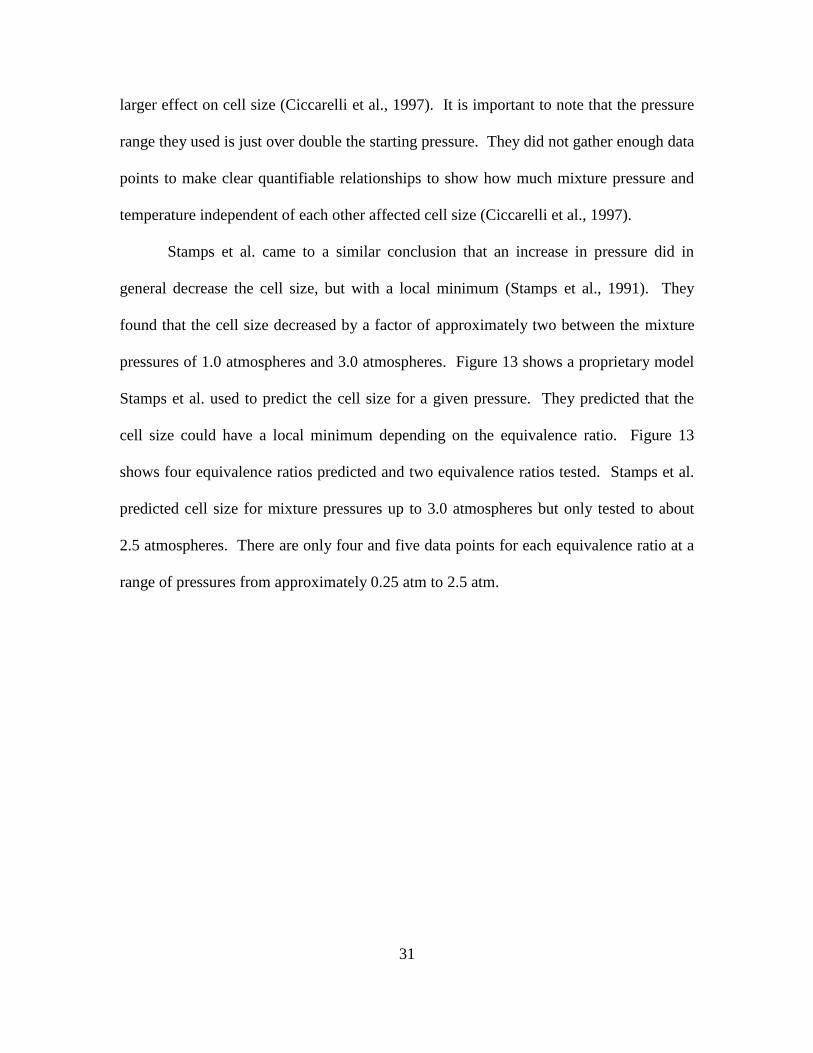
The test and measurement system consisted of a high pressure detonation tube
with a viewing section for the optical equipment. Figure 14 is a picture of the system.
The high pressure tube is 4.42 m long and contains a viewing section 2.62 m from the
right side of the highlighted detonation tube in Figure 14. The right end of the detonation
tube contains an ignition system with a DDT device to transition the flame into a
detonation before entering the viewing section. The tube has an internal diameter of 67
mm. The viewing section, shown in Figure 15, allows light to pass horizontally through
60 mm of Tosoh N grade quartz and then through the inside 47 mm passage width where
the detonation passes. The window of the viewing section is 47.24 mm high and 101.6
mm long. This window allows for the observation of cells smaller than 47 mm.
34
Figure 14. High pressure detonation tube
Figure 15. Detonation tube viewing section

35
The detonation tube has a circular cross section until it transitions at the flange in
the viewing section. At the flange in Figure 15, the cross section changes to Figure 16.
The transition is immediate and occurs approximately 18 cm before the viewing section
window.
Figure 16. Detonation tube viewing section cross section
A schematic of the shock tube system is shown in Figure 17. To start each test,
the system was evacuated to approximately 0.02 atm to remove impurities that could
cause erroneous results. The tube was then filled with air to the correct partial pressure
for that test’s mixture total pressure and equivalence ratio. Then hydrogen was added to
the tube to the total pressure for that test. Because of hydrogen’s low density, it tends to
move to the top of the tube; therefore, the mixture was circulated via a fan with a flow
rate of 1.16 m3/min for 10 minutes.

36
Figure 17. High pressure detonation tube exterior schematic
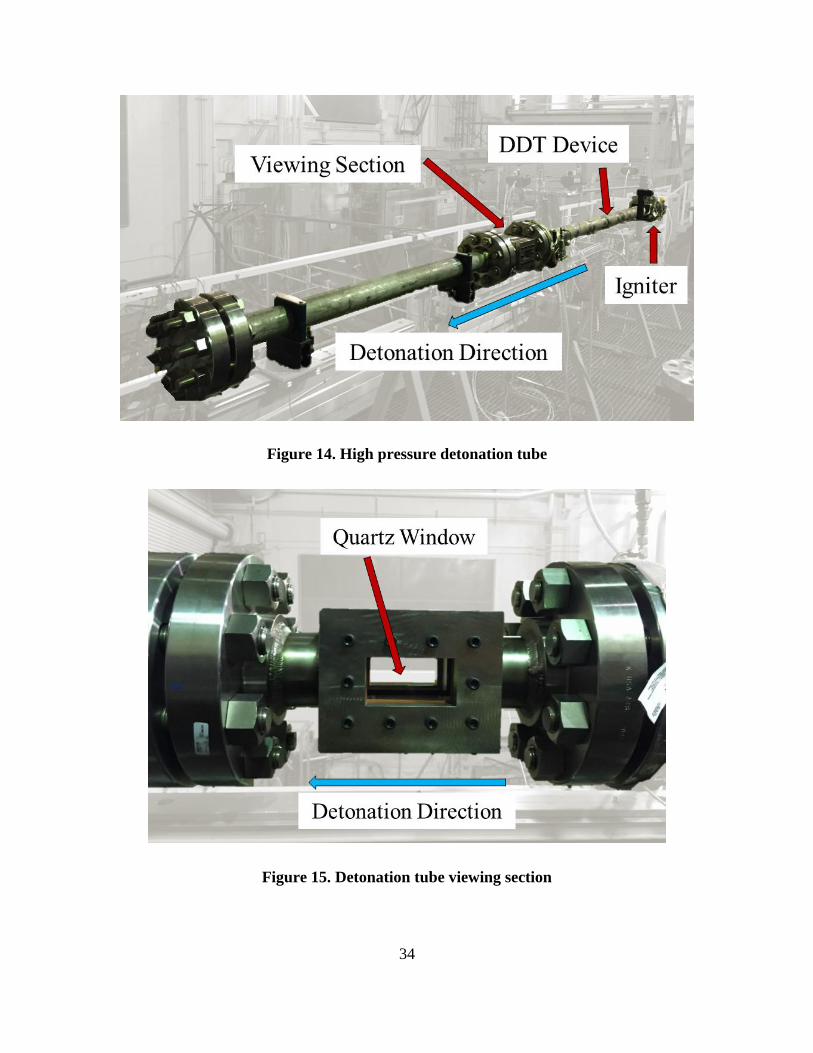
Figure 18 shows a cutaway schematic of the shock tube system. Less than 30
seconds after mixing, the hydrogen and air mixture was ignited via a 100 mJ spark plug.
The deflagration traveled through a 1.200 m DDT device before passing through the
viewing section. The detonation traveled from right to left in Figure 18. During the
detonation’s first pass through the viewing section, images were taken. After passing the
viewing section, the detonation reflected off of the flange and back flowed through the
viewing section several times. The reflected waves were normal shocks and were not
used for measurements though they appeared on the schlieren images.
37
Figure 18. High pressure detonation tube cut-away schematic
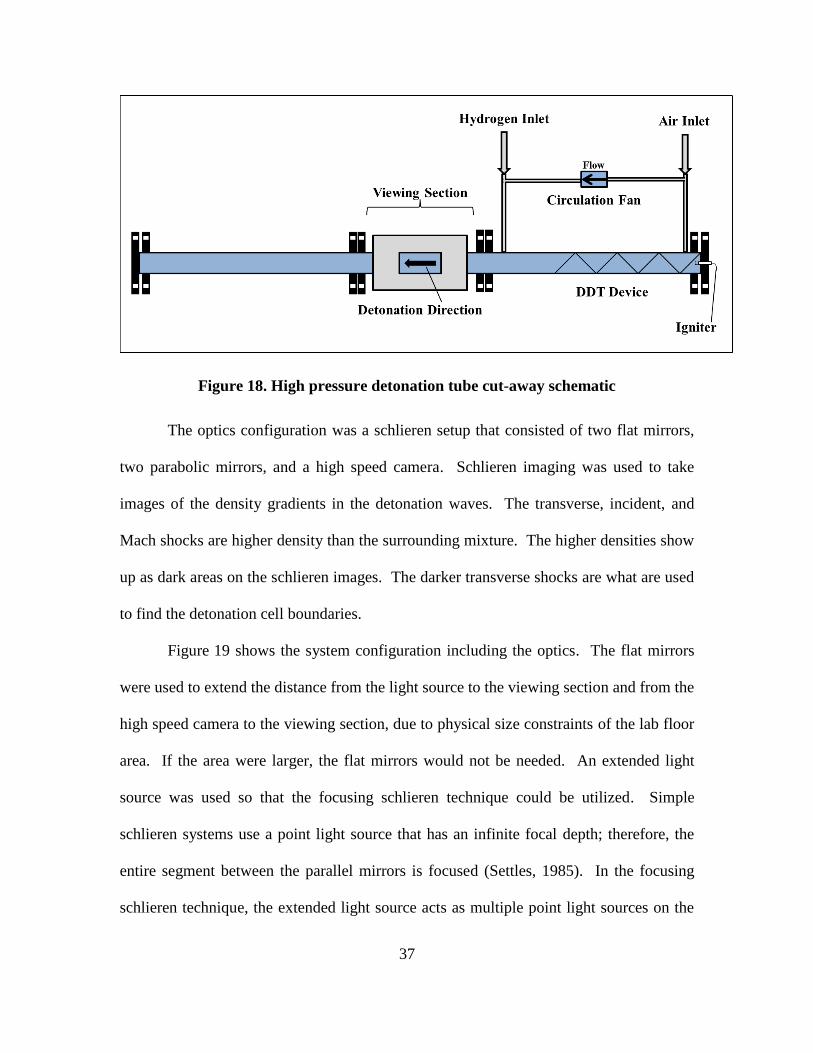
The optics configuration was a schlieren setup that consisted of two flat mirrors,
two parabolic mirrors, and a high speed camera. Schlieren imaging was used to take
images of the density gradients in the detonation waves. The transverse, incident, and
Mach shocks are higher density than the surrounding mixture. The higher densities show
up as dark areas on the schlieren images. The darker transverse shocks are what are used
to find the detonation cell boundaries.
Figure 19 shows the system configuration including the optics. The flat mirrors
were used to extend the distance from the light source to the viewing section and from the
high speed camera to the viewing section, due to physical size constraints of the lab floor
area. If the area were larger, the flat mirrors would not be needed. An extended light
source was used so that the focusing schlieren technique could be utilized. Simple
schlieren systems use a point light source that has an infinite focal depth; therefore, the
entire segment between the parallel mirrors is focused (Settles, 1985). In the focusing
schlieren technique, the extended light source acts as multiple point light sources on the
38
object. Each light beam illuminates the object and the focal depth is shortened
proportional to the source diameter. The extended light source configuration allows the
schlieren image plane to be moved by moving the camera, mirrors, and light. By moving
the image plane, the image can be focused on any plane in space. The system was
focused on the center of the viewing section to measure the cells far from the walls to
eliminate boundary effects.
A Phantom ® 711 high speed camera recorded the density gradients at 49,000 fps
and a pixel density of 20,000 dpi. The mirrors were set up so that the image the camera
sees is at the center of the viewing window. An object was placed at the focal plane, and
the camera was focused by adjusting the camera’s focus until the object was in focus.
Figure 19. Detonation tube and optics configuration
39
Execution
The tests were completed at increasing pressures with decreasing equivalence
ratios in order to increase cell size so that the cells would be large enough to measure
using the techniques in this research. As the pressure is increased the cell size is
decreased. This relationship can be modeled by Equation 2 at stoichiometric conditions,
where Pi is the mixture pressure in torr and λ is in cm (Lee, 2008). For a hydrogen and
oxygen mixture ‘a’ and ‘b’ are approximately 1,452 and 0.928, respectively. The current
experiment used air as an oxidizer which will have an effect on cell size. Even though
cell size is different for hydrogen and air, this equation was used to find the approximate
cell size at each pressure to find out if the cells would be visible on the schlieren images.
(2)
Using Equation 2, the approximated cell size for a mixture pressure of 2.0 atm
was 0.073 cm and the approximated cell size for an mixture pressure of 4.0 atm was
0.035 cm. Cell sizes less than two mm were too small to measure with the techniques
used in this research due to camera constraints. The camera speed setting selected was
49,000 fps. At 49,000 fps the pixel dimensions available was 512 pixels long and 256
pixels high. The pixels were approximately 0.02 cm in height. In order to be able to see
cell boundaries, it was assumed that at least ten pixels per detonation cell were needed;
therefore, detonation cell sizes had to be at least 0.2 cm in order to measure them. A
greater number of pixels decreased the uncertainty of the results. In order to keep the
uncertainty less than 50 percent, which is the approximate maximum uncertainty
discussed later, the number of required pixels was increased. In order to make the cells
40
visible with the given camera constraints and minimize uncertainty, the cell size had to be
increased.
A known relationship was used to increase the cell. Figure 20 shows a
relationship of how the mixture pressure affects critical tube diameter for hydrogen and
oxygen detonations (Lee, 2008). The critical tube diameter is approximated as 13λ (Lee,
2008). Therefore, the relationship in Figure 20 can be used to approximate cell size.
Figure 20. Hydrogen and oxygen detonation critical initial pressure versus critical
tube diameter (Matsui and Lee, 1979)
41
In order to increase the size of the cells in a range that would be measureable
within the camera constraints, the equivalence ratio was decreased. There are data for
known relationships of cell size versus equivalence ratio discussed in Chapter II
(Ciccarelli et al., 1994, Ciccarelli et al., 1997, Guirao et al., 1982, Stamps et al., 1991,
and Tieszen et al., 1987). The smallest cell size occurs at an equivalence ratio of
approximately one. As the equivalence ratio decreases from unity with all other variables
held constant, the cell size increases rapidly.
Hydrogen and oxygen detonation data on cell size versus equivalence ratio were
used as approximations of hydrogen and air detonation cell size (Lee, 2008). The
approximations were used to find equivalence ratios that would allow the detonation cells
be measurable within the viewing section. The values chosen for each test case are in
Table 1. The first four cases were first calculated then tested. The remaining 11 cases
were each tested with the knowledge of the cell size from the previous case. The
pressure was increased and the equivalence ratio was changed to keep the cells large
enough to be viewable. Table 1 shows the order of testing. Due to time constraints each
case was tested once.

42
Table 1. Pressure and equivalence ratios
Case P Φ
1 1.0 atm 1.00
2 2.0 atm 1.00
3 2.0 atm 0.80
4 4.0 atm 0.80
5 4.0 atm 0.70
6 6.0 atm 0.70
7 6.0 atm 0.65
8 8.0 atm 0.65
9 10.0 atm 0.65
10 10.0 atm 0.70
11 8.0 atm 0.70
12 10.0 atm 0.80
13 8.0 atm 0.80
14 6.0 atm 0.80
15 4.0 atm 1.0
The goal was to reach 10.0 atmospheres. Once that goal was reached, the next
goal was to measure cell size for 10.0 atmospheres at a range of equivalence ratios. After
multiple equivalence ratios were measured at 10.0 atmospheres, the rest of the cases were
tested in order to fill in Figure 21. Figure 21 shows the test cases by mixture pressure
and equivalence ratio.
Test Matrix
Pre
ssure
(at
m)
10.0 X X X
8.0 X X X
6.0 X X X
4.0 X X X
2.0 X X
1.0 X
1.00 0.80 0.70 0.65
Equivalence Ratio (Φ)
Figure 21. Test matrix
43
Analysis Method
The cell size was measured for all of the 15 cases. The schlieren images from the
high speed camera were used to visually count the cells in each detonation. For each
case, there were two images that were analyzed. There were two images from each test
due to the camera frame rate and detonation speed. Due to time constraints, there are two
images available for each case. Figure 22 shows two of the raw images from a single
detonation at a mixture pressure of 1.0 atm and an equivalence ratio of 1.0. The wave is
moving from right to left. There is approximately 20.40 micro seconds between each
image.
Figure 22. Raw schlieren images of detonation at 1.0 atm and 1.0 equivalence ratio
In order to calculate the cell size, the number of triple points was counted at each
shock front. The number of triple points varies depending on where the image was taken
of the detonation. Therefore, an average of the number of triple points was taken from
the two images to calculate the number of cells in each case.
A detonation produces cells where the cell boundaries are defined by transverse
shocks. Triple points are the points where the transverse shock, Mach stem, and incident
shock intersect (Lee, 2008). The triple points are visible in the images taken by the high
speed camera. The triple points visible by the naked eye are counted to find the number

44
of cell boundaries in a vertical cross section of the detonation. When the triple points are
difficult to see due to chemiluminesence, transverse shockwaves are counted instead.
Transverse shockwaves stem from the triple point; therefore, the number of transverse
shock waves will be equal to the number of triple points.
In the current research triple points are viewed at the incident shock wave of the
detonation. Figure 23 shows an example of one cell in green, where the green lines
indicate the triple point paths that form cell boundaries (Lee, 2008, Lefebvre, 1993). The
detonation shock fronts are shown in blue, located at different steps in time at points A,
B, and C (Lefebvre, 1993). The incident shock front represents the density gradients
visible in the schlieren images. If the cell triple point path intersections also intersected
the detonation front, one triple point would be visible for two cells. Figure 23 at point A
shows the detonation front intersecting a triple point path intersection. If the cell triple
point path intersections were located exactly at the edge of the inside of the tube where
they intersect the detonation shock front, the number of cells would be defined by the
number of triple points plus one. Figure 23 at point B shows a detonation front with no
triple points because the triple point path intersection is located at the edge of the tube.
The likelihood of the capturing the image when the detonation wave front is at points A
or B is practically zero. Because it is highly unlikely that the triple points would intersect
the detonation front at the triple point path intersection (Figure 23, point A) or where the
triple point path intersection meets the edge of the image (Figure 23, point B) there is
approximately twice the number of triple points as there are cells as shown in Figure 23
at point C. This shows that there are two triple points in a detonation wave front for each
detonation cell.
45
Figure 23. Detonation triple point movement
The number of cells within the vertical cross section of the tube is then equal to
half the number of triple points plus one. The height of the image was divided by the
number of cells plus one to find the cell size for each test. Figure 24 shows one of the
raw images used to measure the cell size. It is a hydrogen and air detonation at
equivalence ratio of 4.0 and a mixture pressure of 1.0 atm. The detonation is moving
from right to left.
46
Figure 24. Schlieren image of hydrogen and air detonation (P = 4.0 atm, Φ = 1.0)
Figure 24 was used to count the number of triple points that were in the
detonation wave front, using the transverse wave. Figure 25 is a copy of Figure 24 with
the transverse shocks annotated. The images were analyzed in software to find edges and
then invert the colors for more clear pictures. The drawn-in lines show the transverse
shock waves that lead to the triple points. When the triple points were not clearly
evident, which was in most cases, the transverse shocks were used to count the number of
cell boundaries. The horizontal white lines in Figure 25 show the transverse shocks.
In order to count the horizontal line as a transverse shock, several criteria had to
be met. The horizontal line had to start at the reaction zone. It had to have an aspect
ratio of at least 10:1. The potential transverse shock had to be at least twice as long as the
47
reaction zone. If these criteria were met, the white horizontal line was counted as a
transverse shock.
Figure 25. Schlieren image of hydrogen and air detonation transverse shocks
annotated (P = 4.0 atm, Φ = 1.0)
Often the image had to be increased in size to accurately find the cell boundaries.
Figure 25 shows the same image from Figure 24 zoomed to see the cell boundaries.
48
Figure 25 shows two transverse shocks forming detonation cells. Each of the transverse
shocks were counted to find the average cell size.
Figure 26. Schlieren image of hydrogen and air detonation with transverse shocks
annotated (P = 4.0 atm, Φ = 1.0)
Error! Reference source not found. is the raw image beside the processed
image of a detonation wave at a mixture pressure of 4.0 atm and an equivalence ratio of
1.00. The two images show how the transverse waves match up to the original image.
Figure 27. Hydrogen-air detonation raw image and processed image comparison (P
= 4.0 atm, Φ = 1.00)
49
All of the raw Schlieren images are in Appendix B. The images were zoomed or
softened in order to read them more clearly. All 15 cases are shown in Figure B - 1 to
Figure B - 60. Each case has two unique images with a color image based on pixel
density and a grey scale from the actual image, yielding four images for each case. It is
important to note that in two of the cases, one of the images was too blurry to find cell
boundaries. This was most likely due to the chemiluminesence from the reaction. Filters
were added to the camera to reduce the chemiluminesence, but in two cases it was not
enough to make the image visible.
With limited data points per test, the error tends to be high. There were two types
of error in the analysis. There was random uncertainty or statistical error and systematic
uncertainty or system induced error (Wheeler, 2004). Random uncertainty originates
from the variation in cell sizes in each image. The random uncertainty was found by
using a 95 percent confidence interval for each case. The student’s t-distribution was
used to find the confidence interval. The assumption was made that the measurements of
the cell sizes would be normally distributed about the population mean in order to use the
t-distribution. The t-distribution was used instead of the z-distribution because there
were less than 30 samples for each case. The number of sample data points was based on
the number of total counted detonation cells in two images. The total counted detonation
cells ranged from 12 to 25 detonation cells. The variance and standard deviation were
found by measuring each cell independently.
The second source of error was from systematic uncertainty. Systematic
uncertainty was introduced from visual analysis. The main source of this error was in
counting the number of visible cell boundaries through either triple points or transverse

50
shocks. To account for this error, the number of counted cell boundaries was assumed to
have an uncertainty of 25 percent. This is a subjective uncertainty based on previous
research using 25 to 100 percent uncertainty in measurements. In order to find the total
uncertainty for each case, the root sum of the squares of random uncertainty and
systematic uncertainty were calculated. The uncertainty values are discussed in Chapter
IV.
51
IV. Analysis and Results
Chapter Overview
Schlieren images were analyzed in order to measure the hydrogen and air
detonation cell size. The raw images are shown in the Appendix B. The raw images are
presented to show the differing degrees of clarity for each combination of mixture
pressure and equivalence ratio and for the reader to analyze the images. The current
chapter displays the results through tables and charts to show trends, as well as
empirically derived formulas for cell size predictions.
Results
The results from the experiments and analysis are divided into five sections:
summary results, results by mixture pressure and equivalence ratio, error analysis, and
empirical formulas. The summary results show all 15 cases in the same tables and charts.
The summary results give the big picture view of the trends between the different mixture
pressures and equivalence ratios. The results by mixture pressure and equivalence ratio
divide the results into charts with a few cases of either a single equivalence ratio or single
mixture pressure. The error analysis shows how the error was calculated for each
measurement. The empirical formulas use the formula from the methodology section and
update it with results from the current research.
Summary results
The results, as outlined in Table 2, include 15 cases with varying mixture
pressures and equivalence ratios. The mixture pressure ranges from 1.0 atm to 10.0 atm
and the equivalence ratios range from 0.65 to 1.00. The cases are not in order of being
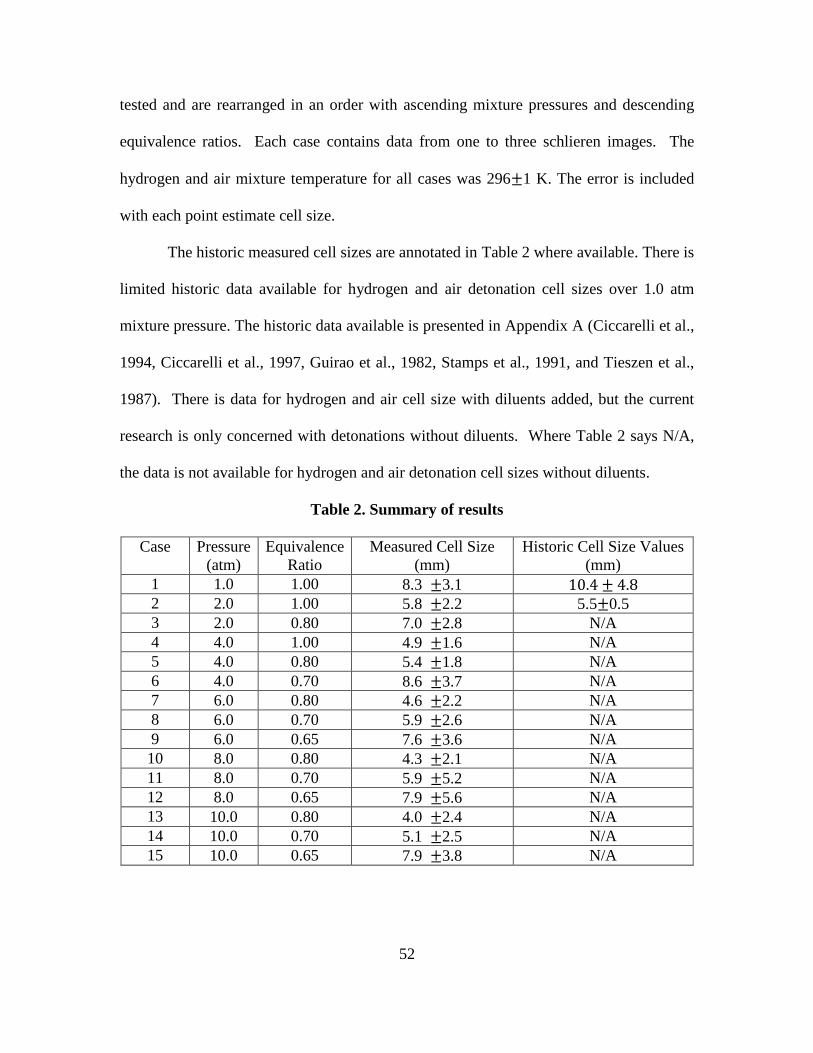
52
tested and are rearranged in an order with ascending mixture pressures and descending
equivalence ratios. Each case contains data from one to three schlieren images. The
hydrogen and air mixture temperature for all cases was 296 1 K. The error is included
with each point estimate cell size.
The historic measured cell sizes are annotated in Table 2 where available. There is
limited historic data available for hydrogen and air detonation cell sizes over 1.0 atm
mixture pressure. The historic data available is presented in Appendix A (Ciccarelli et al.,
1994, Ciccarelli et al., 1997, Guirao et al., 1982, Stamps et al., 1991, and Tieszen et al.,
1987). There is data for hydrogen and air cell size with diluents added, but the current
research is only concerned with detonations without diluents. Where Table 2 says N/A,
the data is not available for hydrogen and air detonation cell sizes without diluents.
Table 2. Summary of results
Case Pressure
(atm)
Equivalence
Ratio
Measured Cell Size
(mm)
Historic Cell Size Values
(mm)
1 1.0 1.00 8.3 3.1
2 2.0 1.00 5.8 2.2 5.5 0.5
3 2.0 0.80 7.0 2.8 N/A
4 4.0 1.00 4.9 1.6 N/A
5 4.0 0.80 5.4 1.8 N/A
6 4.0 0.70 8.6 3.7 N/A
7 6.0 0.80 4.6 2.2 N/A
8 6.0 0.70 5.9 2.6 N/A
9 6.0 0.65 7.6 3.6 N/A
10 8.0 0.80 4.3 2.1 N/A
11 8.0 0.70 5.9 5.2 N/A
12 8.0 0.65 7.9 5.6 N/A
13 10.0 0.80 4.0 2.4 N/A
14 10.0 0.70 5.1 2.5 N/A
15 10.0 0.65 7.9 3.8 N/A

53
The data from all 15 cases is presented in Figure 28 to show trends. Trends are
based on lines of constant equivalence with different mixture pressures. The pressures
are in atm and cell sizes are in cm. There are four trend lines for equivalence ratios of:
0.65, 0.70, 0.80, and 1.00. Each trend line has a different number of data points.
Equivalence ratios of 0.65 and 1.00 have three data points. Equivalence ratio of 0.7 has
four data points, and equivalence ratio of 0.80 has five data points.
Figure 28 shows that increasing the mixture pressure decreases the cell size.
Based on Figure 28, the preliminary changes in pressure from 1.0 atm to about 4.0 atm
represent a greater negative gradient in cell size. After approximately 4.0 atm, the
change in mixture pressure has less of an effect on changing cell size. All five trend lines
follow a power law decay with an exponent between -0.177 and -0.381.

54
Figure 28. Hydrogen/air detonation cell size vs mixture pressure by equivalence
ratio
Figure 29 shows the 15 cases from Figure 28 arranged by mixture pressure.
There are five trend lines for mixture pressures of: 2.0 atm, 4.0 atm, 6.0 atm, 8.0 atm, and
10.0 atm. All trend lines except for the 2.0 atm line contain three data points; therefore
the 2.0 atm trend line has lower accuracy than the other trend lines and is displayed for
comparison purposes.
y = 0.7999x-0.381
y = 0.8941x-0.356
y = 0.9102x-0.232
y = 1.1725x-0.177
0.3
0.4
0.5
0.6
0.7
0.8
0.9
1
0.00 1.00 2.00 3.00 4.00 5.00 6.00 7.00 8.00 9.00 10.00
Det
on
ati
on
Cel
l S
ize,
λ (
cm)
Mixture Pressure (atm)
Hydrogen/air detonation cell size vs mixture
pressure
and equivalence ratio
Φ=1.0 Φ=0.8 Φ=0.7 Φ=0.65
Power (Φ=1.0) Power (Φ=0.8) Power (Φ=0.7) Power (Φ=0.65)

55
In Figure 29 the trend lines for 6.0 atm, 8.0 atm, and 10.0 atm follow a similar
slope with an exponent of approximately -3.0. The 4.0 atm trend line has a more gradual
slope. The difference between the slopes may be due the equivalence ratios not spanning
the same range. The 2.0 atm trend line is only two points, so no conclusions can be
drawn from it.
Figure 29. Hydrogen/air detonation cell size vs equivalence ratio by mixture
pressure
y = 0.576x-0.899
y = 0.478x-0.796 y = 0.2357x-2.868 y = 0.2247x-2.855
y = 0.1869x-3.173
0.30
0.40
0.50
0.60
0.70
0.80
0.90
1.00
0.6 0.65 0.7 0.75 0.8 0.85 0.9 0.95 1 1.05
Det
on
ati
on
Cel
l S
ize,
λ (
cm)
Equivalence Ratio, Φ
Hydrogen/air detonation cell size vs equivalence ratio
and initial pressure
2.0 atm 4.0 atm 6.0 atm 8.0 atm 10.0 atm
Power (2.0 atm) Power (4.0 atm) Power (6.0 atm) Power (8.0 atm) Power (10.0 atm)

56
Error analysis
The error analysis included systematic error and random error. The results from
the error calculations for each of the 15 cases are shown in Table 3. The total error is the
root sum squares of the random error and systematic error. The random error is a 95
percent confidence interval using the standard deviation and sample size, n, for each case.
The systematic error is the error introduced in the measurements from visual error in
counting the detonation cell boundaries. The systematic error is somewhat subjective due
to the subjectivity of measuring detonation cell sizes. The systematic error includes a
25% assumed error for counting the transverse waves in the schlieren images.
Table 3. Error results
Case P
(atm) Φ n
(mm)
s2
(mm)
s
(mm)
Random
Error
(mm)
Systematic
Error
(mm)
Total
Error
(mm)
1 1.0 1.00 12 8.3 5.8 2.4 1.5 2.7 3.1
2 2.0 1.00 17 5.8 4.6 2.2 1.1 1.9 2.2
3 2.0 0.80 13 7.0 6.3 2.5 1.5 2.3 2.8
4 4.0 1.00 19 4.9 0.60 0.78 0.36 1.6 1.6
5 4.0 0.80 25 5.4 0.88 0.94 0.39 1.8 1.8
6 4.0 0.70 6 8.6 4.6 2.2 2.3 2.9 3.6
7 6.0 0.80 20 4.6 7.8 2.8 1.3 1.5 2.0
8 6.0 0.70 7 5.9 9.7 3.1 1.7 2.0 2.6
9 6.0 0.65 8 7.6 16 4.0 2.5 2.5 3.6
10 8.0 0.80 22 4.3 12 3.5 1.6 1.4 2.1
11 8.0 0.70 8 5.9 17 4.1 3.4 3.9 5.2
12 8.0 0.65 6 7.9 22 4.7 5.0 2.6 5.6
13 10.0 0.80 12 4.0 10 3.2 2.0 1.3 2.4
14 10.0 0.70 18 5.1 14 3.7 1.8 1.7 2.5
15 10.0 0.65 6 7.9 19 4.3 2.7 2.6 3.8
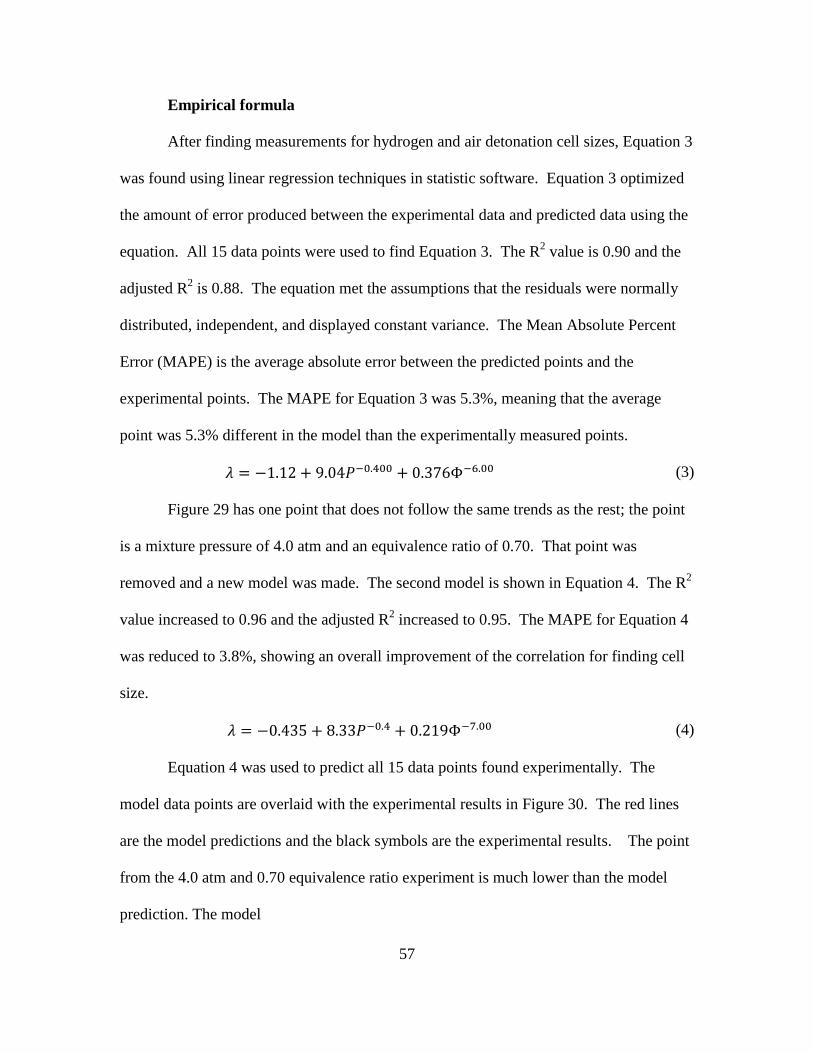
57
Empirical formula
After finding measurements for hydrogen and air detonation cell sizes, Equation 3
was found using linear regression techniques in statistic software. Equation 3 optimized
the amount of error produced between the experimental data and predicted data using the
equation. All 15 data points were used to find Equation 3. The R2 value is 0.90 and the
adjusted R2 is 0.88. The equation met the assumptions that the residuals were normally
distributed, independent, and displayed constant variance. The Mean Absolute Percent
Error (MAPE) is the average absolute error between the predicted points and the
experimental points. The MAPE for Equation 3 was 5.3%, meaning that the average
point was 5.3% different in the model than the experimentally measured points.
(3)
Figure 29 has one point that does not follow the same trends as the rest; the point
is a mixture pressure of 4.0 atm and an equivalence ratio of 0.70. That point was
removed and a new model was made. The second model is shown in Equation 4. The R2
value increased to 0.96 and the adjusted R2 increased to 0.95. The MAPE for Equation 4
was reduced to 3.8%, showing an overall improvement of the correlation for finding cell
size.
(4)
Equation 4 was used to predict all 15 data points found experimentally. The
model data points are overlaid with the experimental results in Figure 30. The red lines
are the model predictions and the black symbols are the experimental results. The point
from the 4.0 atm and 0.70 equivalence ratio experiment is much lower than the model
prediction. The model

58
Figure 30. Hydrogen-air detonation cell size vs equivalence ratio, experimental data
with model overlay
Investigative Questions Answered
The goal of this research was to measure the cell size of hydrogen and air
detonations at mixture pressures of up to 10.0 atm. The measurements were successful
and trends were established that allow empirical formulas to help predict cell sizes for a
larger variety of mixture pressure and stoichiometry combinations. At 10.0 atm and an
equivalence ratio of 0.80, hydrogen and air detonations have a cell size of 4.0 mm.
0.25
0.35
0.45
0.55
0.65
0.75
0.85
0.95
1.05
0.6 0.65 0.7 0.75 0.8 0.85 0.9 0.95 1
Deto
nati
on
Cell
Siz
e,
λ (
cm
)
Equivalence Ratio, Φ
Hydrogen/air detonatinon cell size vs equivalence ratio
by initial pressure - model vs experimental results
Experimental, 2.0 atm Experimental, 4.0 atm Experimental, 6.0 atm Experimental, 8.0 atm Experimental, 10.0 atm
Model, P=2.0 atm
= 0.435 + 8.33 0.4 + 0.219 7.00
Model, P=10.0 atm
Model, P=8.0 atm
Model, P=6.0 atm
Model, P=4.0 atm
59
Summary
The 15 test cases provided more insight into hydrogen and air detonation cell
sizes with mixture pressures from 1.0 atm to 10.0 atm. The trend lines give the ability to
predict true cell size for mixture conditions that fall within the tested limits. The trend
lines appear to show that the closer the detonation mixture was to stoichiometric
conditions, the higher the R2 value was which yielded more accurate prediction models.
60
V. Conclusions and Recommendations
Chapter Overview
The results from this research give more insight into hydrogen and air detonation
cell sizes. The cell size information can be used to derive the dynamic detonation
properties of hydrogen and air detonations. Specifically, the detonability of hydrogen
and air can be found for specific geometries of RDEs for future design.
Conclusions of Research
The measured cell sizes for hydrogen and air detonations are within expectations.
A baseline case was used to assess the accuracy of the measurement system. Historic
point estimate values for 1.0 atm at Φ = 1.00 are between 5.0 mm and 15.1 mm and for
2.0 atm at Φ = 1.00 are between 5.0 mm and 6.0 mm. The 2.0 atm case only has three
historic values from the same research creating a tighter range. The uncertainty bounds
for the historic cell size measurements for 1.0 atm at Φ = 1.00 are between 0.0 mm and
30.2 mm and for 2.0 atm at Φ = 1.00 are between 0.0 mm and 12.0 mm. The measured
cell size for 1.0 atm at Φ = 1.00 was approximately 8.3 mm with a 3.1 mm uncertainty
and for 2.0 atm at Φ = 1.00 was approximately 5.7 mm with a 2.2 mm uncertainty.
This is consistent with historic data and suggests that the method of cell size
measurement in this research is valid. The subsequent cases are also consistent with
expectations. As the pressure was increased it was expected that the cell size should
decrease as was the case illustrated in Figure 28. It was also anticipated that the cell size
would increase with a decrease in equivalence ratio holding pressure constant. Figure 29
shows that, indeed, cell size increases with a decrease in equivalence ratio.
61
Though the trends were as anticipated, the rates of change were not what was
anticipated. It was anticipated that the increasing mixture pressures would have a more
linear effect on cell size, i.e. it was assumed that the cell size would halve with doubled
mixture pressure. This was not the case. The mixture pressure deviation had the greatest
effect on a change in cell size. Higher mixture pressure causes small changes in cell size.
This could be due to properties of detonations or experimental constraints. Images for
higher pressures were not as easily visible as the lower pressure images. Also, the higher
pressure tests were at lower equivalence ratios, where such lower equivalence ratios
resulted in irregularly shaped detonation waves making it more difficult to measure the
cells.
The key conclusions from this research are:
1. Increasing mixture pressure, decreased detonation cell size.
2. The range of elevated mixture pressures had less of an effect on cell size than
the range of equivalence ratios.
3. Decreasing equivalence ratio from stoichiometric increased cell size.
4. The change in equivalence ratio had a greater effect on cell size than a change
in mixture pressure.
5. Detonation cell size measurements continue to have high uncertainty.
6. Detonation cell size measurements are now possible at mixture pressures up to
10.0 atm.
The research exponent ‘n’ values in the curve fits in Figure 28 are between 0.177
and 0.381 with mixtures between 1.0 and 10.0 atm and equivalence ratios between 0.65
and 1.00. These are lower than the exponent ‘n’ values from previous research hydrogen
62
and air detonation cell size curve fits of 0.419 to 2.571 with mixture pressures between
0.24 atm and 2.5 atm and equivalence ratios between 0.374 and 3.64. Previous research
exponent values for each equivalence ratio curve fit were not consistent showing that
there is not a clear correlation for all cell size data based on mixture pressure. The data is
difficult to compare due to the differing ranges of mixture pressures and equivalence
ratios between historic data and the current research. Though the current research
hyperbola equations have lower exponents than previous data curve fits, they are close to
the lower value. In order to gain more fidelity in research curve fit equation, more tests
are required at a range of mixture pressures.
More tests are needed at each case in order to decrease the uncertainty and make
more accurate predictions of the average cell size of hydrogen and air detonations. If
time allowed more tests would be conducted for each case. Each test can be conducted
inside of an hour; however, due to test equipment damage from each experiment, days or
weeks were required to repair and reset the experimental setup. In this research there are
only two images per case, due to the camera speed, to derive the trend lines and make
conclusions; ideally there would be at least 30 images for each case.
Significance of Research
This research has successfully measured hydrogen and air detonation cell sizes
without any diluents in elevated mixture pressure above 3.0 atm for the first time. The
new data can be added to current detonation databases for use by organizations outside of
the Air Force for any detonation related purpose.

63
Recommendations for Future Research
In addition to this research, the same test equipment is being used to find the cell
size of propane and air detonations. This information will be directly used to design an
RDE for a proof of design air craft. The propane and air research is measuring
detonation cell sizes for multiple equivalence ratios, mixture pressures, as well as
elevated mixture temperatures via pre-shocking the detonation tube.
Future research should focus on using the techniques within this research to
measure detonation cell sizes for other gaseous mixtures to include methane and
ultimately JP-8 or JP-10. Detonation cell size for JP fuels would allow RDEs to be
designed for air craft that the Air Force could support more easily than propane or
hydrogen.
Summary
The techniques in this research have been used to measure hydrogen and air
detonations with mixture pressures up to 10.0 atm. The trend lines through the data
match historic trends for lower mixture pressures and validate the techniques. The new
data points will be the foundation of further elevated mixture pressure detonation cell
measurements.
64
Appendix A - Previous Research Data
Table A - 1 to Table A - 5 show all previous data used in Chapter II Figure 9 to
Figure 13. Table A - 1 to Table A - 5 are the cell size measurements of undiluted
hydrogen and air detonation from 5 sources (Ciccarelli et al., 1994, Ciccarelli et al., 1997,
Guirao et al., 1982, Stamps et al., 1991, and Tieszen et al., 1987).
Table A - 1. Detonation data, Ciccarelli et al., 1994
Test # Temp (K)
Equivalence
Ratio
Pressure
(kPa)
Cell Size
(mm)
334 300.9 1.959 101.51 78.5
318 297.6 1.961 101.58 76
258 293.2 1.843 101.71 46
206 298.2 1.691 100.06 25
151 300.0 1.690 101.30 31
317 297.6 1.353 101.71 9.4
207 298.2 1.355 101.71 10
164 300.0 1.011 101.30 9
175 300.0 1.013 101.30 9
146 300.0 1.018 101.30 9
156 300.0 0.843 101.30 12
35 300.0 0.669 101.30 34
254 292.6 0.674 101.85 42
256 294.3 0.677 101.58 47
147 300.0 0.591 101.30 59
187 300.0 0.594 101.30 96
177 300.0 0.592 101.30 98
150 300.0 0.568 101.30 140
343 497 1.690 102.1 10.5
204 500 1.693 102 10
273 504 1.691 102 17
208 498 1.013 102 6
274 508 1.014 101.9 9
341 497 0.740 101.8 8.15
271 510 0.591 102 15
272 506 0.589 102 15
203 498 0.589 101.9 20
65
Test # Temp (K)
Equivalence
Ratio
Pressure
(kPa)
Cell Size
(mm)
350 500 0.541 102 24
281 505 0.538 101.9 28.6
355 495 0.473 102 78.5
351 500 0.473 102 78.5
342 497 0.474 102 63
279 500 0.471 101.8 98
344 497 0.439 102.2 105
356 497 0.439 102.1 105
205 643 1.691 102.2 9
287 658 1.690 102.2 10
200 646 1.016 102.2 5
199 648 1.014 102.2 5
184 647 1.014 101 4
201 649 0.590 102.2 12
286 657 0.589 102.1 15.5
282 650 0.504 102.1 16
285 655 0.508 102 16
267 643 0.406 102.7 37
333 652 0.406 102.7 31
337 641 0.406 102.7 36
269 646 0.410 102.7 34
338 640 0.371 102.7 41
290 652 0.373 102.1 37
347 644 0.339 102.7 47
376 644 0.338 102.7 78.5
293 647 0.337 102.5 78.5
66
Table A - 2. Detonation data, Ciccarelli et al., 1997
Test # Temp (K)
Equivalence
Ratio
Pressure
(kPa)
Cell Size
(mm)
23 300 1.735968 100 18
18 300 1.002846 100 8
21 300 0.814918 100 11
19 300 0.672958 100 27
22 300 0.584402 100 93
297 300 0.504634 100 187
298 300 0.503282 100 248
107 500 0.999804 100 6
108 500 0.493818 100 52
104 500 0.4225 100 98
109 500 0.377208 100 196
329 500 0.367406 100 429
119 650 0.482664 100 17
122 650 0.385996 100 30
249 650 0.323804 100 46
318 650 0.298454 100 74
254 650 0.296426 100 94
255 650 0.264654 100 213
256 650 0.253838 100 230
373 650 0.313326 170 2
358 650 0.31434 240 85

67
Table A - 3. Detonation data, Guirao et al., 1982
Temp (K)
Equivalence
Ratio
Pressure
(kPa)
Cell Size
(mm)
293 0.540540541 101.3 245
293 0.557432432 101.3 183
293 0.574324324 101.3 162.3
293 0.591216216 101.3 123.8
293 0.608108108 101.3 110.8
293 0.628378378 101.3 88.9
293 0.641891892 101.3 80
293 0.648648649 101.3 76.2
293 0.675675676 101.3 55.4
293 0.709459459 101.3 44
293 0.743243243 101.3 30.7
293 0.777027027 101.3 25.6
293 0.810810811 101.3 21.4
293 0.844594595 101.3 18.1
293 0.878378378 101.3 17
293 0.912162162 101.3 15.7
293 0.945945946 101.3 15.5
293 0.97972973 101.3 15
293 1 101.3 15.1
293 1.013513514 101.3 15.1
293 1.081081081 101.3 16.2
293 1.148648649 101.3 17.2
293 1.216216216 101.3 19
293 1.283783784 101.3 21.8
293 1.351351351 101.3 22.9
293 1.418918919 101.3 26.7
293 1.486486486 101.3 30.5
293 1.554054054 101.3 37
293 1.621621622 101.3 41.8
293 1.689189189 101.3 50
293 1.756756757 101.3 55
293 1.824324324 101.3 79
293 1.858108108 101.3 95
293 1.891891892 101.3 100
293 1.959459459 101.3 141.5
293 2.027027027 101.3 189.2

68
Table A - 4. Detonation data, Stamps et al., 1991
Test # Temp (K)
Equivalence
Ratio
Pressure
(kPa)
Cell Size
(mm)
134 375.5 0.3396 101.39 305
102 372.5 0.3601 101.35 444
101 369.6 0.4163 101.35 150
162 375.3 0.518 102.23 38
100 370 0.5966 101.11 24
99 371.3 1.0081 101.35 20
99II 375.4 1.0026 101.39 7
103 374 2.0202 101.42 14
104 374.4 3.0417 101.35 37
97II 302.4 0.9942 101.62 11
97III 311.3 0.9973 101.46 9
172 298 1.0462 101.52 13
98 281.6 0.9803 101.77 15
135 300.4 0.4996 10.22 56
135II 297.9 0.4901 10.18 210
135III 302.9 0.4977 10.02 250
159 296.4 0.489 15.36 215
136 269.1 0.4779 26.4 450
136II 298.9 0.5026 25.78 260
137 297 0.488 50.73 157
138 296.9 0.4958 101.47 76
139 300.9 0.4919 264.07 100
140 298.1 0.9912 10.02 39
141 296 1.0018 25.43 24
142 296.3 0.9812 51.25 15
143 296.9 0.9817 150.58 7.5
69
Table A - 5. Detonation data, Tieszen et al., 1987
Test # Temp (K)
Equivalence
Ratio
Pressure
(kPa)
Cell Size
(mm)
15 281.1 0.3743 97.423 1220
14 277.6 0.3812 97.905 1200
67 294.6 0.3868 100.801 640
68 299.6 0.4071 100.801 420
66 301.1 0.4248 101.008 305
12 277.6 0.4334 99.974 310
69 298.6 0.4335 100.87 265
65 298.6 0.4623 100.732 250
11 276.9 0.4792 99.284 190
64 300.1 0.4867 100.939 150
63 294.1 0.5037 100.801 100
70 302.1 3.6647 100.87 185
71 299.6 4.4655 100.939 475
72 303.6 5.7129 100.939 1350
74 371.6 0.3575 147.685 420
73 373.1 0.3747 148.65 330
77 372.1 0.3827 149.685 295
62 372.1 0.4213 150.236 175
76 372.1 0.4981 155.338 65
60 372.1 0.6059 160.923 25
78 370.6 0.6088 160.647 24
42 368.1 0.6501 161.199 19
80 371.1 0.6985 166.577 14
56 372.6 0.8085 171.817 9
82 371.6 0.8964 176.781 6
84 372.3 0.9957 182.573 5
53 371.6 1.0098 182.641 5
86 372.5 1.5 210.014 6
50 373.1 1.9974 236.698 12
88 372.3 3.0077 290.751 22
96 295.3 0.3989 118.452 400
95 294.6 0.5011 122.726 115
94 292.4 0.6036 126.725 38
93 293.4 0.8038 135.344 13
92 292.9 1.0116 143.962 10
91 295.9 1.9776 186.778 15

70
Test # Temp (K)
Equivalence
Ratio
Pressure
(kPa)
Cell Size
(mm)
46 287.6 0.4807 100.801 210
47 323.1 0.4788 101.008 135
48 373.1 0.4701 100.87 106
49 372.1 0.4848 100.87 65
11 276.9 0.4792 99.284 190
44 370.1 0.4853 127.69 130
45 323.6 0.4736 111.902 140
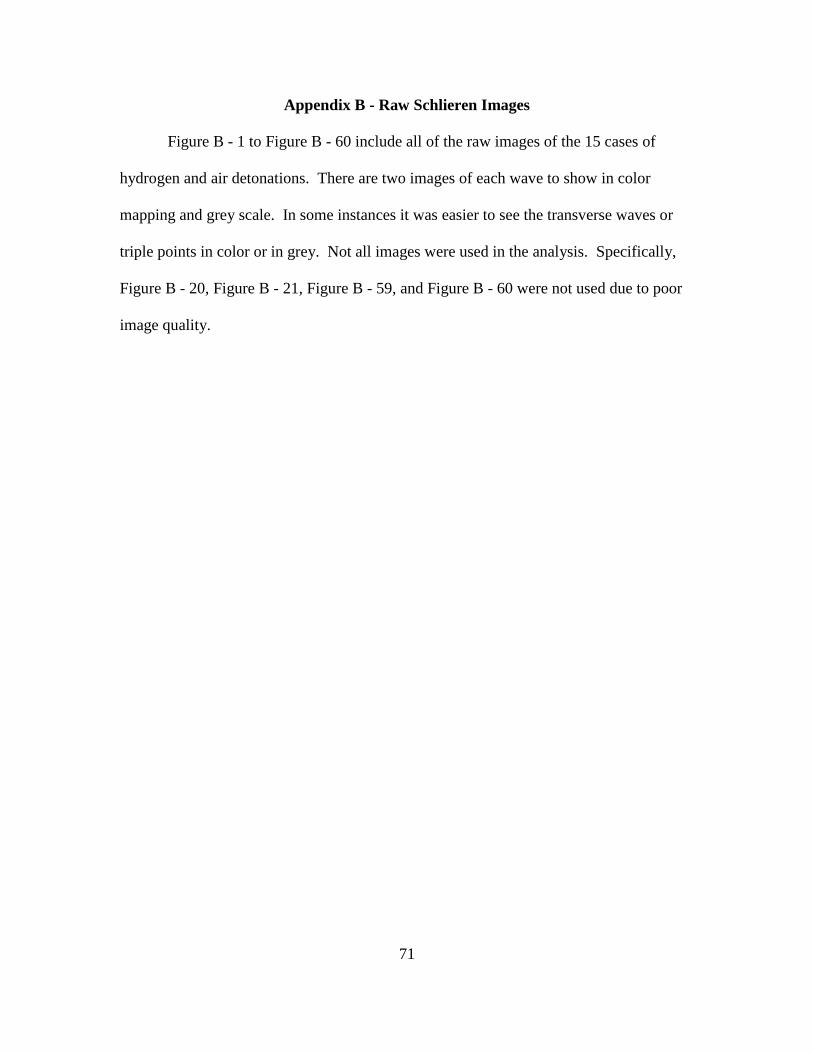
71
Appendix B - Raw Schlieren Images
Figure B - 1 to Figure B - 60 include all of the raw images of the 15 cases of
hydrogen and air detonations. There are two images of each wave to show in color
mapping and grey scale. In some instances it was easier to see the transverse waves or
triple points in color or in grey. Not all images were used in the analysis. Specifically,
Figure B - 20, Figure B - 21, Figure B - 59, and Figure B - 60 were not used due to poor
image quality.
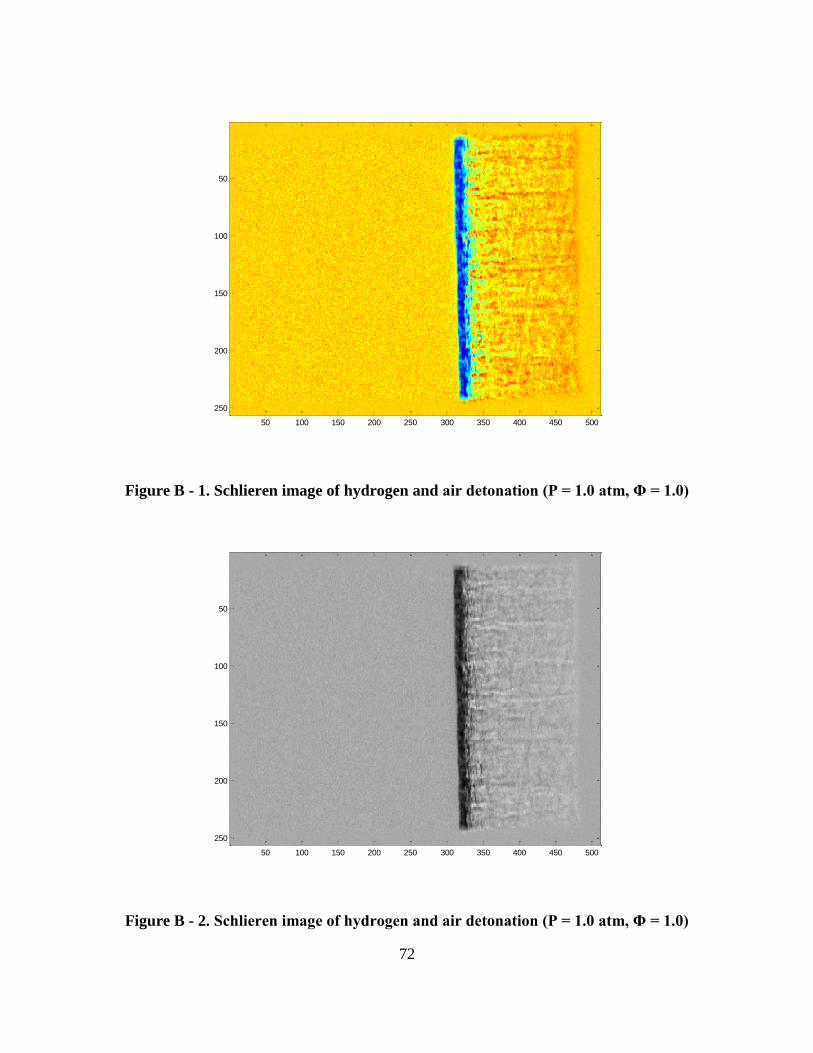
72
Figure B - 1. Schlieren image of hydrogen and air detonation (P = 1.0 atm, Φ = 1.0)
Figure B - 2. Schlieren image of hydrogen and air detonation (P = 1.0 atm, Φ = 1.0)
50 100 150 200 250 300 350 400 450 500
50
100
150
200
250
50 100 150 200 250 300 350 400 450 500
50
100
150
200
250

73
Figure B - 3. Schlieren image of hydrogen and air detonation (P = 1.0 atm, Φ = 1.0)
Figure B - 4. Schlieren image of hydrogen and air detonation (P = 1.0 atm, Φ = 1.0)
50 100 150 200 250 300 350 400 450 500
50
100
150
200
250
50 100 150 200 250 300 350 400 450 500
50
100
150
200
250
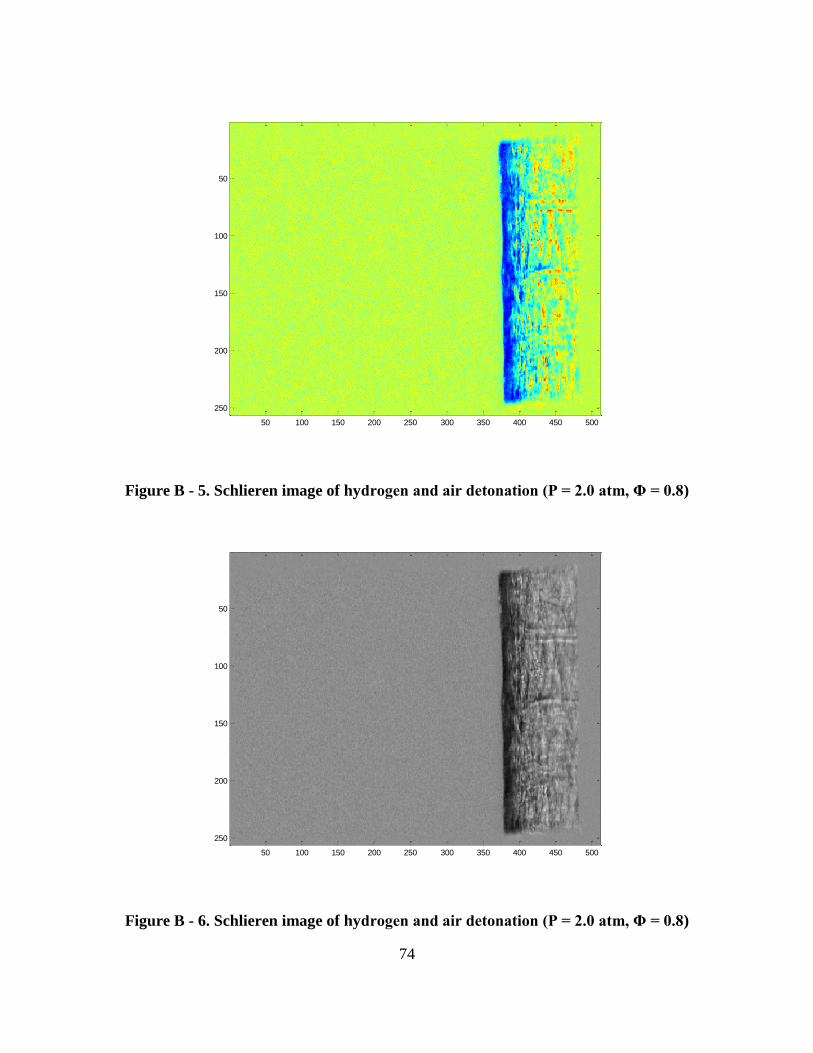
74
Figure B - 5. Schlieren image of hydrogen and air detonation (P = 2.0 atm, Φ = 0.8)
Figure B - 6. Schlieren image of hydrogen and air detonation (P = 2.0 atm, Φ = 0.8)
50 100 150 200 250 300 350 400 450 500
50
100
150
200
250
50 100 150 200 250 300 350 400 450 500
50
100
150
200
250

75
Figure B - 7. Schlieren image of hydrogen and air detonation (P = 2.0 atm, Φ = 0.8)
Figure B - 8. Schlieren image of hydrogen and air detonation (P = 2.0 atm, Φ = 0.8)
50 100 150 200 250 300 350 400 450 500
50
100
150
200
250
50 100 150 200 250 300 350 400 450 500
50
100
150
200
250

76
Figure B - 9. Schlieren image of hydrogen and air detonation (P = 2.0 atm, Φ = 1.0)
Figure B - 10. Schlieren image of hydrogen and air detonation (P = 2.0 atm, Φ = 1.0)
50 100 150 200 250 300 350 400 450 500
50
100
150
200
250
50 100 150 200 250 300 350 400 450 500
50
100
150
200
250
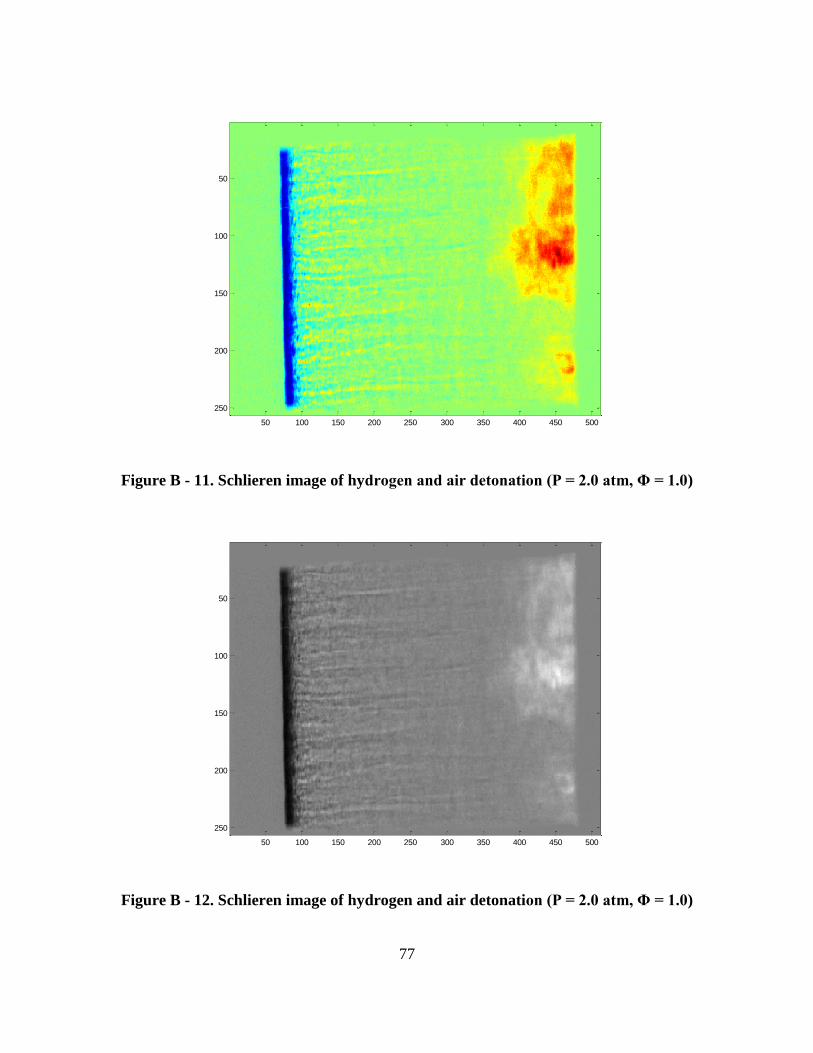
77
Figure B - 11. Schlieren image of hydrogen and air detonation (P = 2.0 atm, Φ = 1.0)
Figure B - 12. Schlieren image of hydrogen and air detonation (P = 2.0 atm, Φ = 1.0)
50 100 150 200 250 300 350 400 450 500
50
100
150
200
250
50 100 150 200 250 300 350 400 450 500
50
100
150
200
250

78
Figure B - 13. Schlieren image of hydrogen and air detonation (P = 4.0 atm, Φ = 0.7)
Figure B - 14. Schlieren image of hydrogen and air detonation (P = 4.0 atm, Φ = 0.7)
50 100 150 200 250 300 350 400 450 500
50
100
150
200
250
50 100 150 200 250 300 350 400 450 500
50
100
150
200
250

79
Figure B - 15. Schlieren image of hydrogen and air detonation (P = 4.0 atm, Φ = 0.7)
Figure B - 16. Schlieren image of hydrogen and air detonation (P = 4.0 atm, Φ = 0.7)
50 100 150 200 250 300 350 400 450 500
50
100
150
200
250
50 100 150 200 250 300 350 400 450 500
50
100
150
200
250
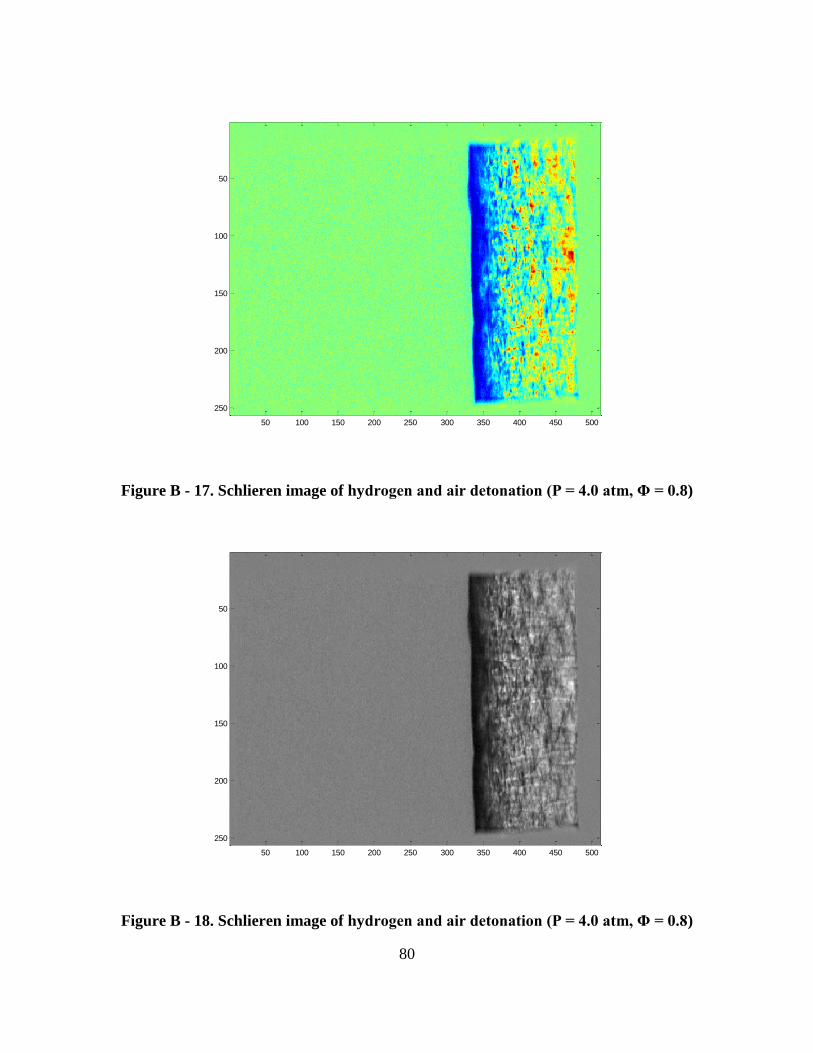
80
Figure B - 17. Schlieren image of hydrogen and air detonation (P = 4.0 atm, Φ = 0.8)
Figure B - 18. Schlieren image of hydrogen and air detonation (P = 4.0 atm, Φ = 0.8)
50 100 150 200 250 300 350 400 450 500
50
100
150
200
250
50 100 150 200 250 300 350 400 450 500
50
100
150
200
250

81
Figure B - 19. Schlieren image of hydrogen and air detonation (P = 4.0 atm, Φ = 0.8)
Figure B - 20. Schlieren image of hydrogen and air detonation (P = 4.0 atm, Φ = 0.8)
50 100 150 200 250 300 350 400 450 500
50
100
150
200
250
50 100 150 200 250 300 350 400 450 500
50
100
150
200
250

82
Figure B - 21. Schlieren image of hydrogen and air detonation (P = 4.0 atm, Φ = 1.0)
Figure B - 22. Schlieren image of hydrogen and air detonation (P = 4.0 atm, Φ = 1.0)
50 100 150 200 250 300 350 400 450 500
50
100
150
200
250
50 100 150 200 250 300 350 400 450 500
50
100
150
200
250

83
Figure B - 23. Schlieren image of hydrogen and air detonation (P = 4.0 atm, Φ = 1.0)
Figure B - 24. Schlieren image of hydrogen and air detonation (P = 4.0 atm, Φ = 1.0)
50 100 150 200 250 300 350 400 450 500
50
100
150
200
250
50 100 150 200 250 300 350 400 450 500
50
100
150
200
250
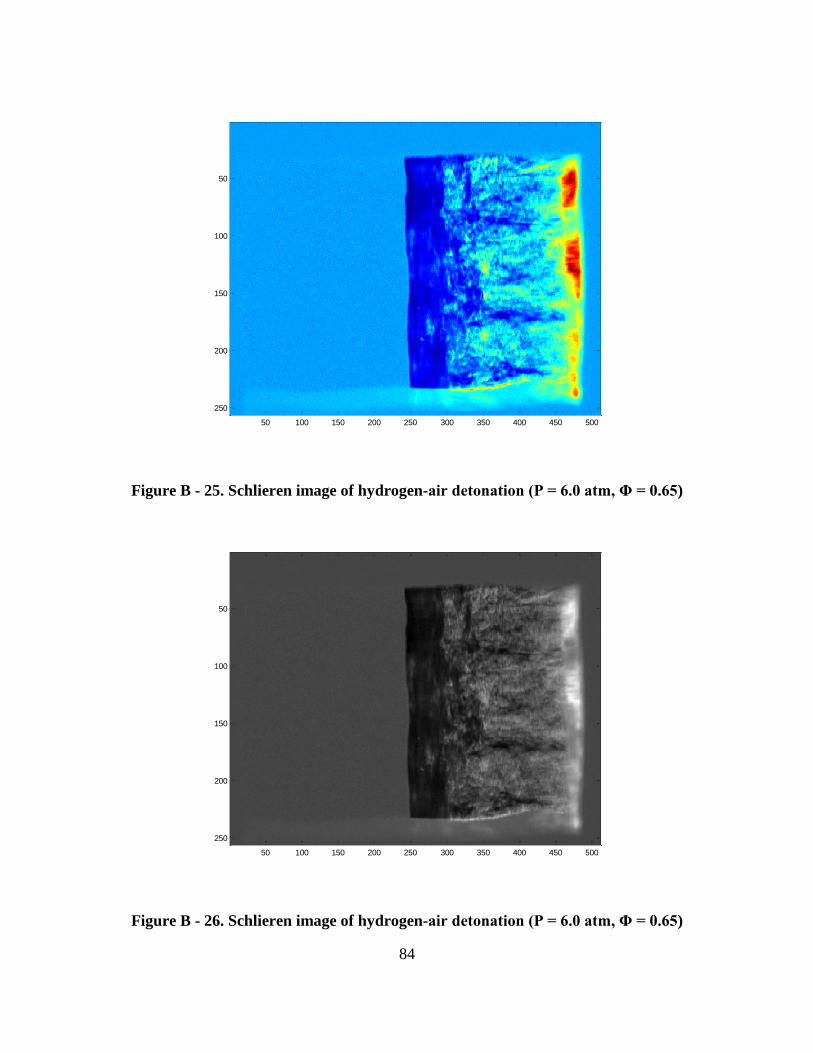
84
Figure B - 25. Schlieren image of hydrogen-air detonation (P = 6.0 atm, Φ = 0.65)
Figure B - 26. Schlieren image of hydrogen-air detonation (P = 6.0 atm, Φ = 0.65)
50 100 150 200 250 300 350 400 450 500
50
100
150
200
250
50 100 150 200 250 300 350 400 450 500
50
100
150
200
250
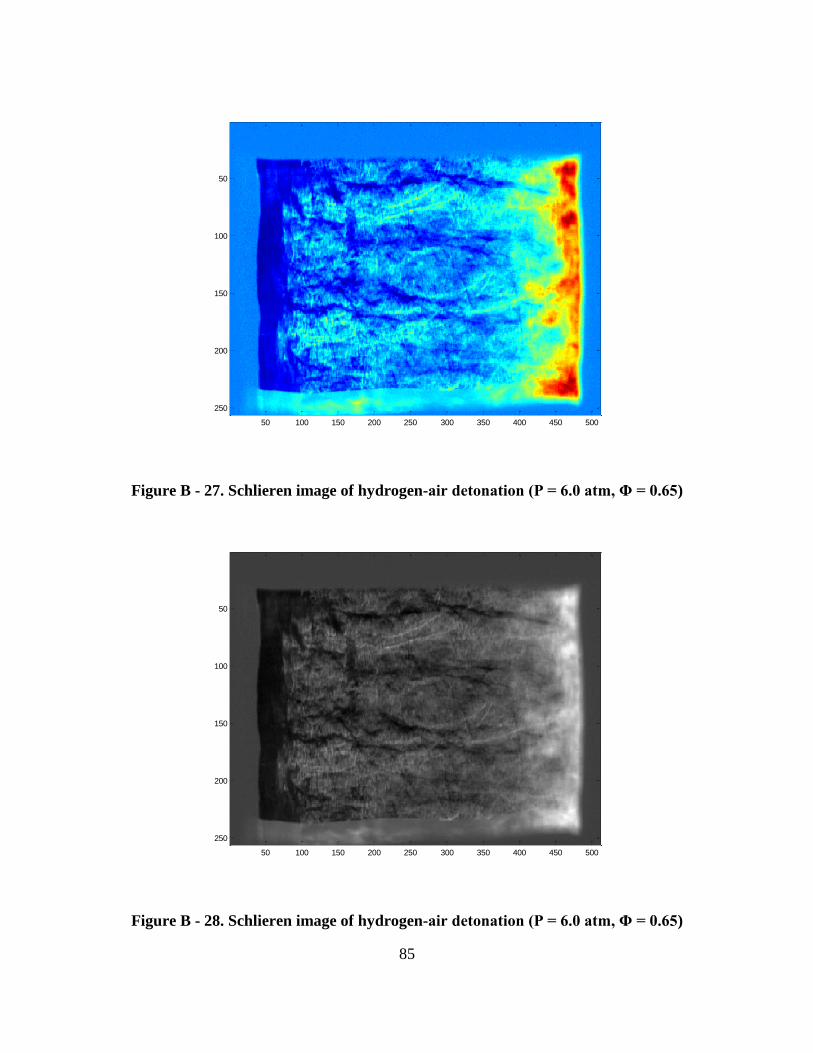
85
Figure B - 27. Schlieren image of hydrogen-air detonation (P = 6.0 atm, Φ = 0.65)
Figure B - 28. Schlieren image of hydrogen-air detonation (P = 6.0 atm, Φ = 0.65)
50 100 150 200 250 300 350 400 450 500
50
100
150
200
250
50 100 150 200 250 300 350 400 450 500
50
100
150
200
250
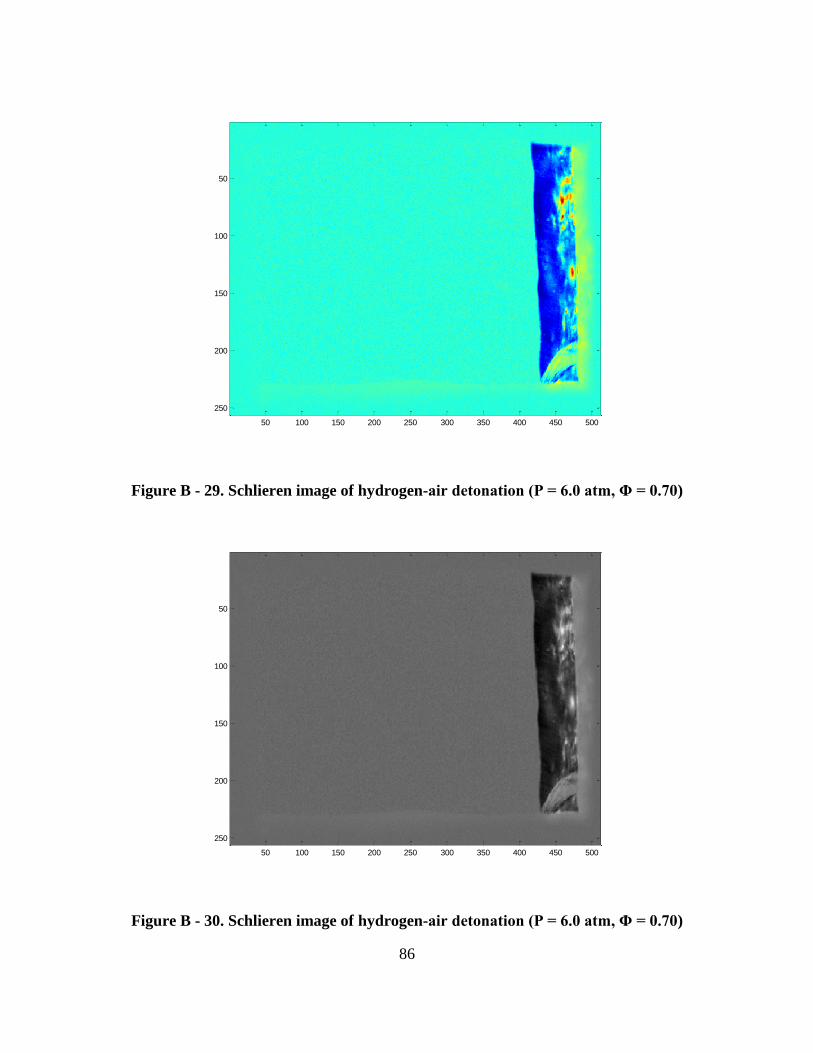
86
Figure B - 29. Schlieren image of hydrogen-air detonation (P = 6.0 atm, Φ = 0.70)
Figure B - 30. Schlieren image of hydrogen-air detonation (P = 6.0 atm, Φ = 0.70)
50 100 150 200 250 300 350 400 450 500
50
100
150
200
250
50 100 150 200 250 300 350 400 450 500
50
100
150
200
250
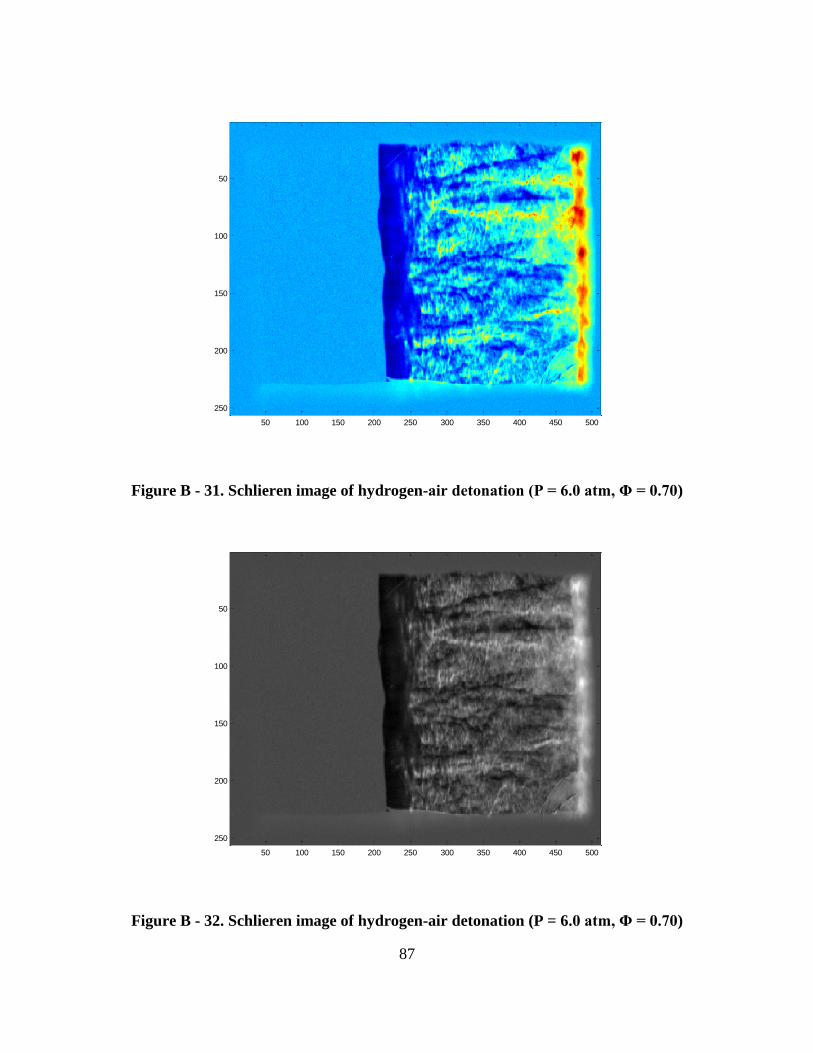
87
Figure B - 31. Schlieren image of hydrogen-air detonation (P = 6.0 atm, Φ = 0.70)
Figure B - 32. Schlieren image of hydrogen-air detonation (P = 6.0 atm, Φ = 0.70)
50 100 150 200 250 300 350 400 450 500
50
100
150
200
250
50 100 150 200 250 300 350 400 450 500
50
100
150
200
250
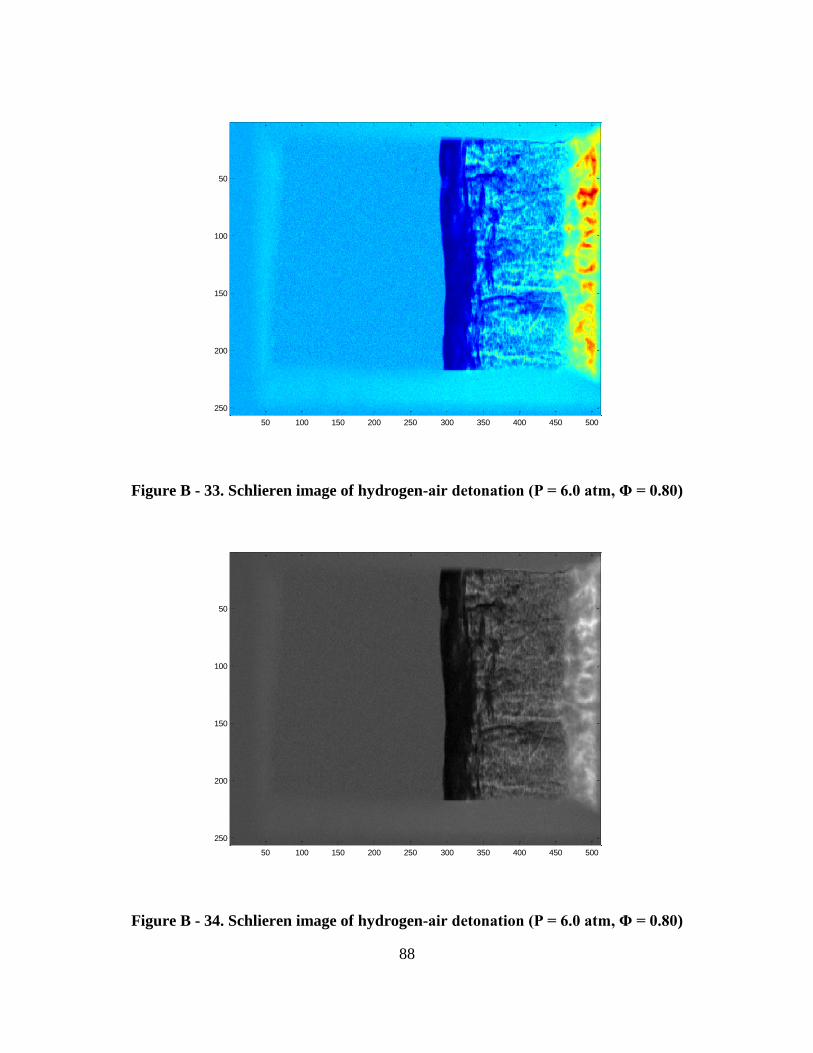
88
Figure B - 33. Schlieren image of hydrogen-air detonation (P = 6.0 atm, Φ = 0.80)
Figure B - 34. Schlieren image of hydrogen-air detonation (P = 6.0 atm, Φ = 0.80)
50 100 150 200 250 300 350 400 450 500
50
100
150
200
250
50 100 150 200 250 300 350 400 450 500
50
100
150
200
250
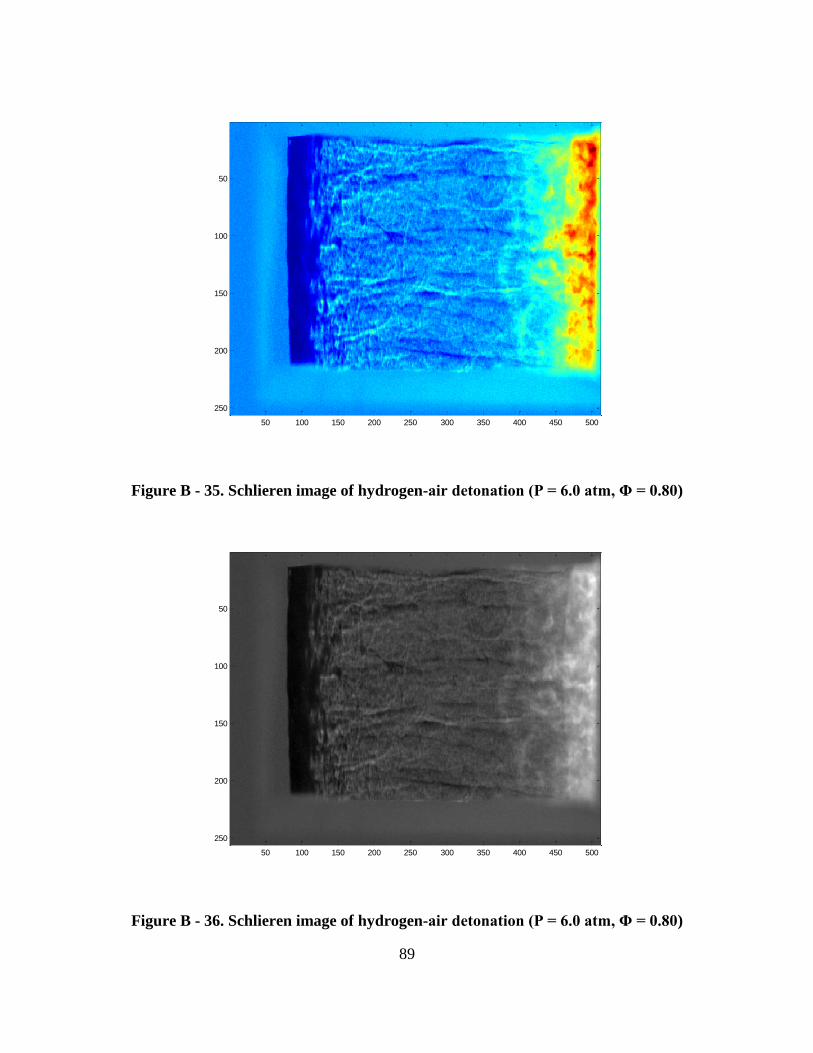
89
Figure B - 35. Schlieren image of hydrogen-air detonation (P = 6.0 atm, Φ = 0.80)
Figure B - 36. Schlieren image of hydrogen-air detonation (P = 6.0 atm, Φ = 0.80)
50 100 150 200 250 300 350 400 450 500
50
100
150
200
250
50 100 150 200 250 300 350 400 450 500
50
100
150
200
250
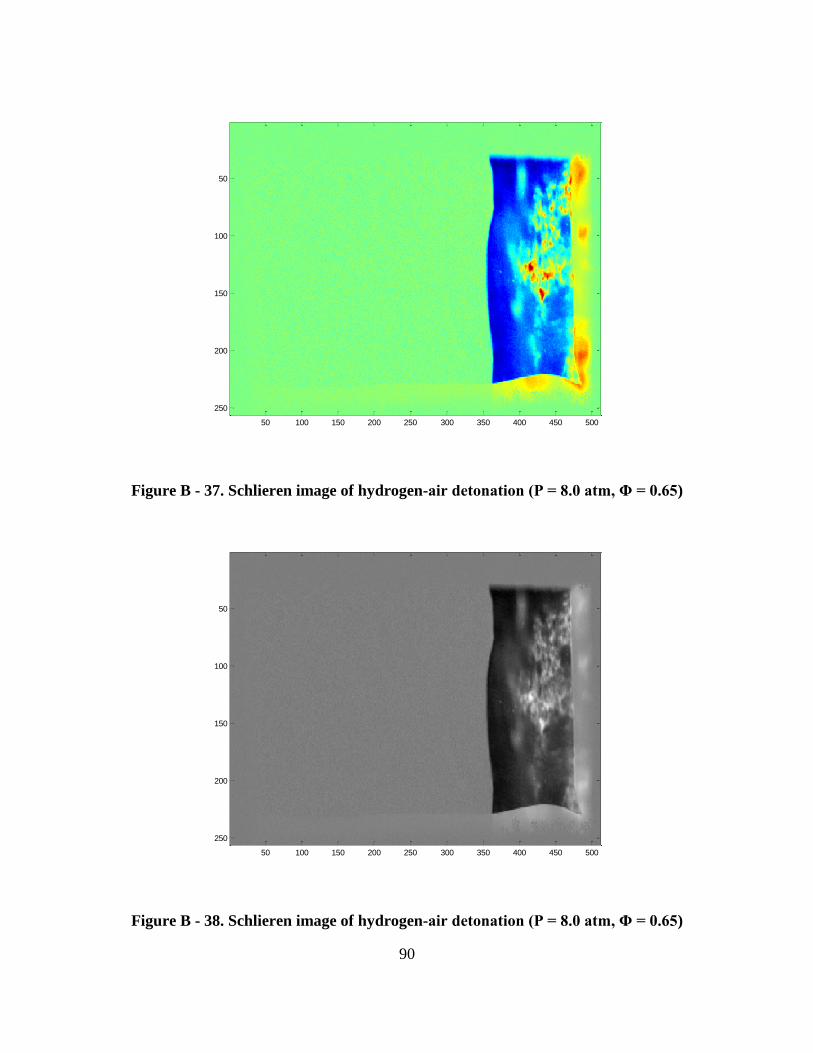
90
Figure B - 37. Schlieren image of hydrogen-air detonation (P = 8.0 atm, Φ = 0.65)
Figure B - 38. Schlieren image of hydrogen-air detonation (P = 8.0 atm, Φ = 0.65)
50 100 150 200 250 300 350 400 450 500
50
100
150
200
250
50 100 150 200 250 300 350 400 450 500
50
100
150
200
250

91
Figure B - 39. Schlieren image of hydrogen-air detonation (P = 8.0 atm, Φ = 0.65)
Figure B - 40. Schlieren image of hydrogen-air detonation (P = 8.0 atm, Φ = 0.65)
50 100 150 200 250 300 350 400 450 500
50
100
150
200
250
50 100 150 200 250 300 350 400 450 500
50
100
150
200
250
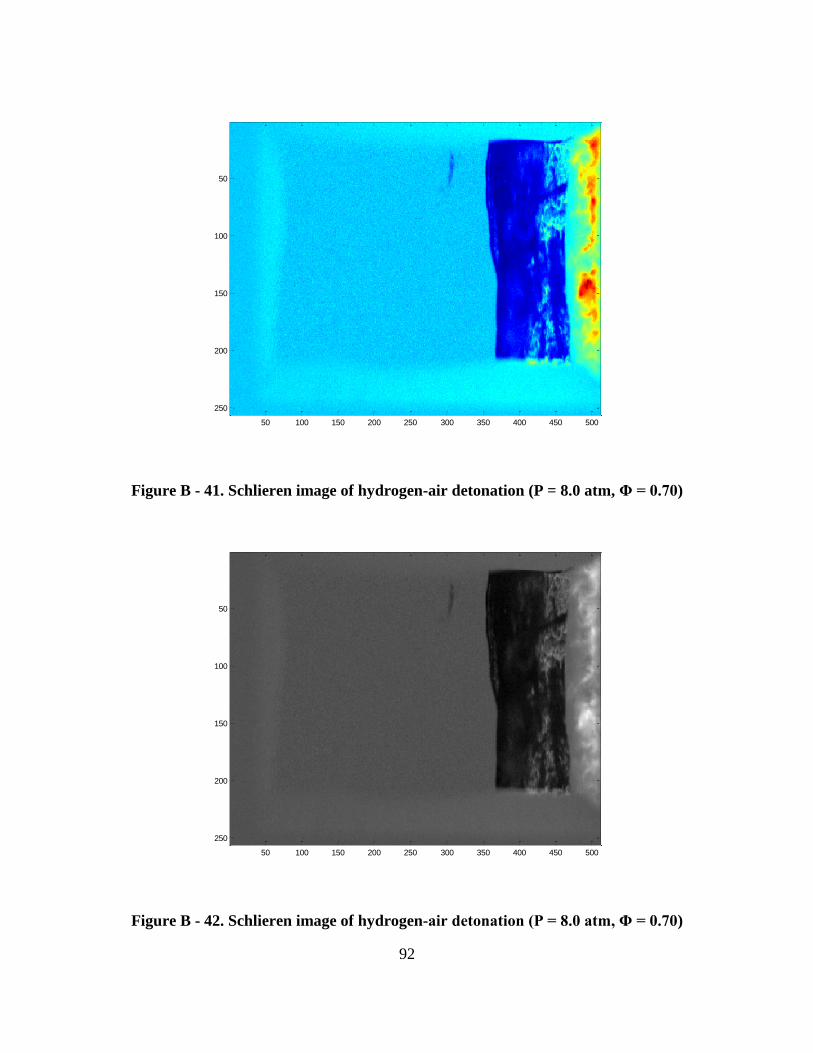
92
Figure B - 41. Schlieren image of hydrogen-air detonation (P = 8.0 atm, Φ = 0.70)
Figure B - 42. Schlieren image of hydrogen-air detonation (P = 8.0 atm, Φ = 0.70)
50 100 150 200 250 300 350 400 450 500
50
100
150
200
250
50 100 150 200 250 300 350 400 450 500
50
100
150
200
250
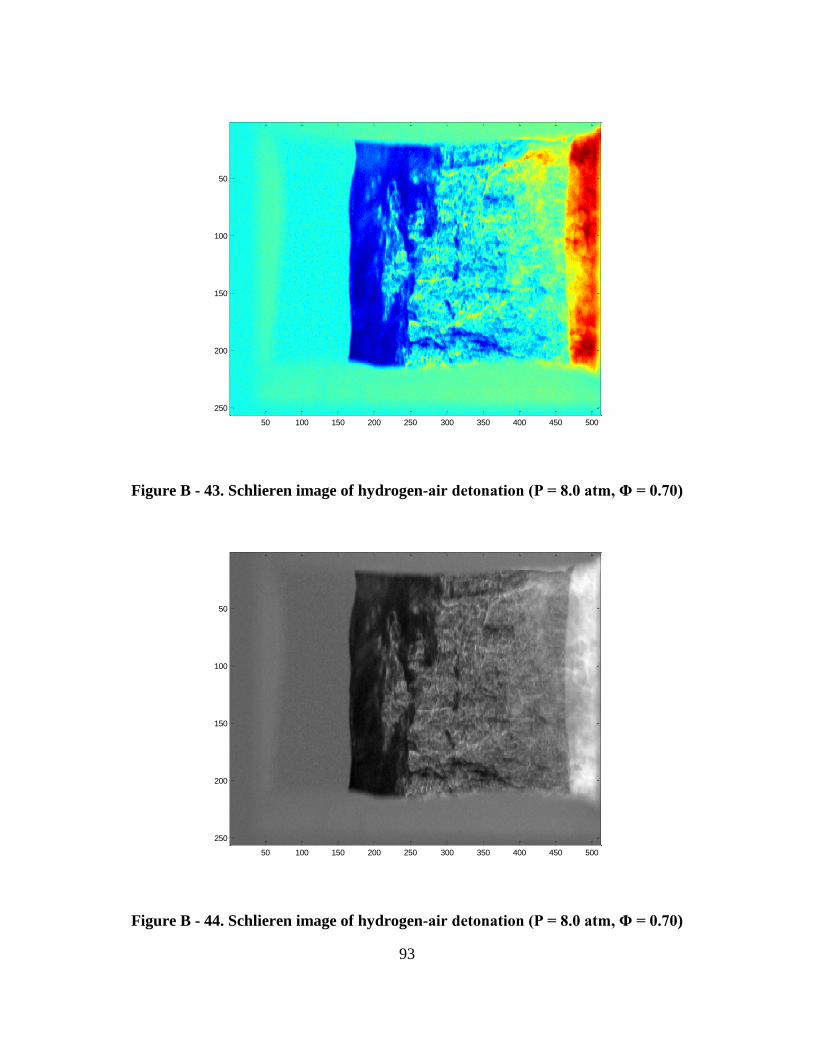
93
Figure B - 43. Schlieren image of hydrogen-air detonation (P = 8.0 atm, Φ = 0.70)
Figure B - 44. Schlieren image of hydrogen-air detonation (P = 8.0 atm, Φ = 0.70)
50 100 150 200 250 300 350 400 450 500
50
100
150
200
250
50 100 150 200 250 300 350 400 450 500
50
100
150
200
250
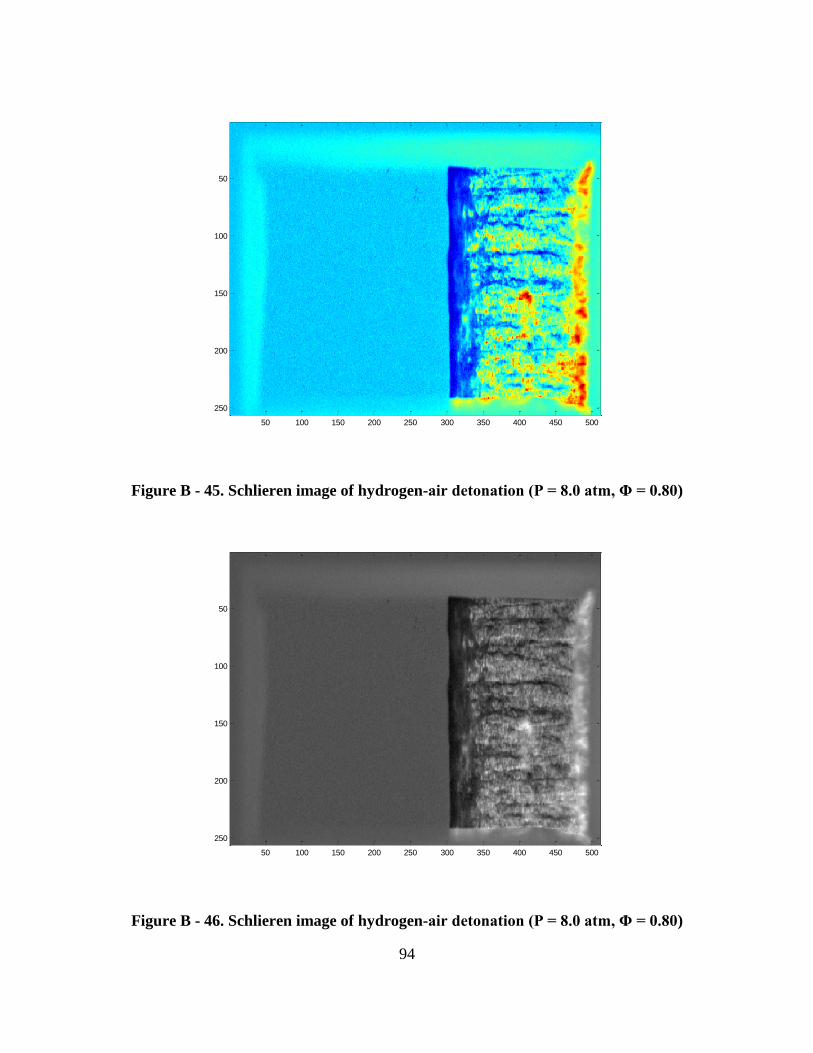
94
Figure B - 45. Schlieren image of hydrogen-air detonation (P = 8.0 atm, Φ = 0.80)
Figure B - 46. Schlieren image of hydrogen-air detonation (P = 8.0 atm, Φ = 0.80)
50 100 150 200 250 300 350 400 450 500
50
100
150
200
250
50 100 150 200 250 300 350 400 450 500
50
100
150
200
250

95
Figure B - 47. Schlieren image of hydrogen-air detonation (P = 8.0 atm, Φ = 0.80)
Figure B - 48. Schlieren image of hydrogen-air detonation (P = 8.0 atm, Φ = 0.80)
50 100 150 200 250 300 350 400 450 500
50
100
150
200
250
50 100 150 200 250 300 350 400 450 500
50
100
150
200
250
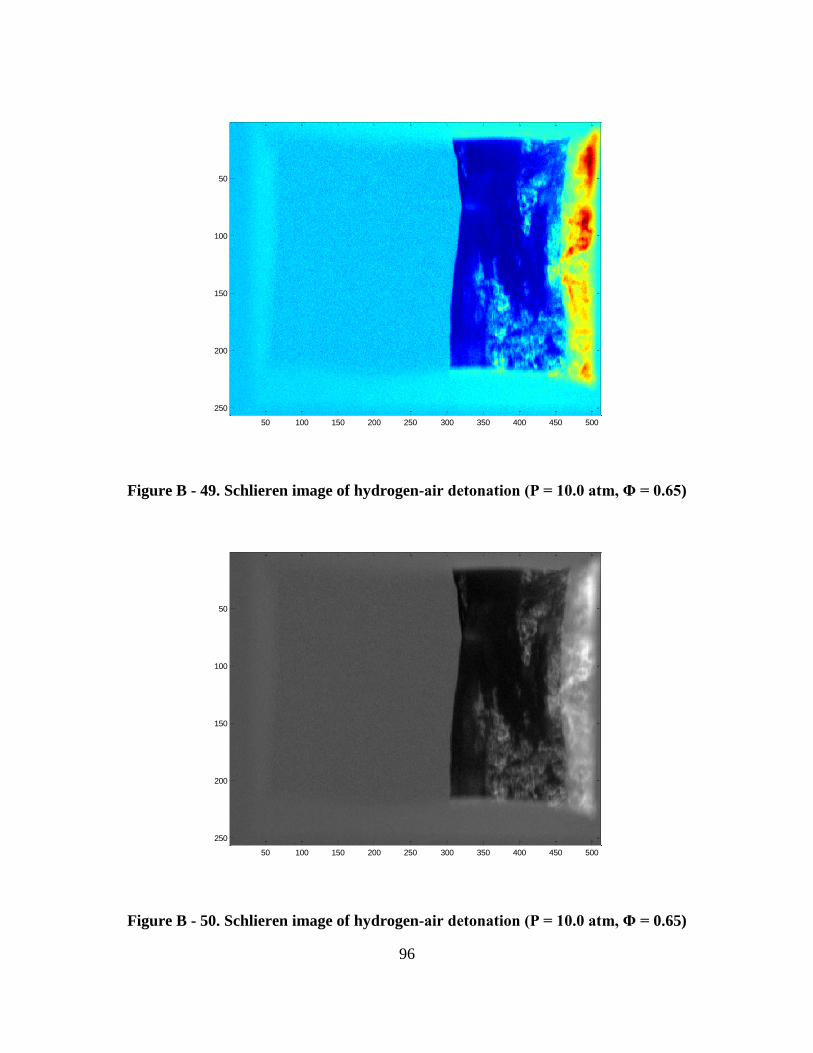
96
Figure B - 49. Schlieren image of hydrogen-air detonation (P = 10.0 atm, Φ = 0.65)
Figure B - 50. Schlieren image of hydrogen-air detonation (P = 10.0 atm, Φ = 0.65)
50 100 150 200 250 300 350 400 450 500
50
100
150
200
250
50 100 150 200 250 300 350 400 450 500
50
100
150
200
250
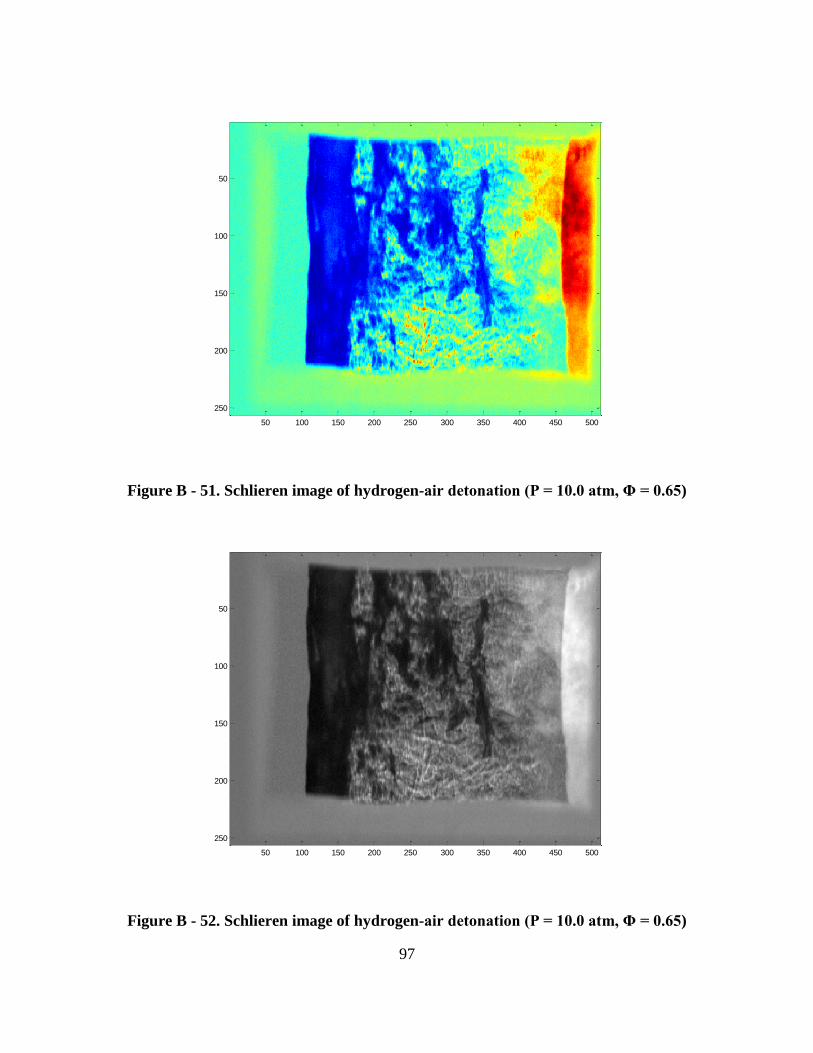
97
Figure B - 51. Schlieren image of hydrogen-air detonation (P = 10.0 atm, Φ = 0.65)
Figure B - 52. Schlieren image of hydrogen-air detonation (P = 10.0 atm, Φ = 0.65)
50 100 150 200 250 300 350 400 450 500
50
100
150
200
250
50 100 150 200 250 300 350 400 450 500
50
100
150
200
250
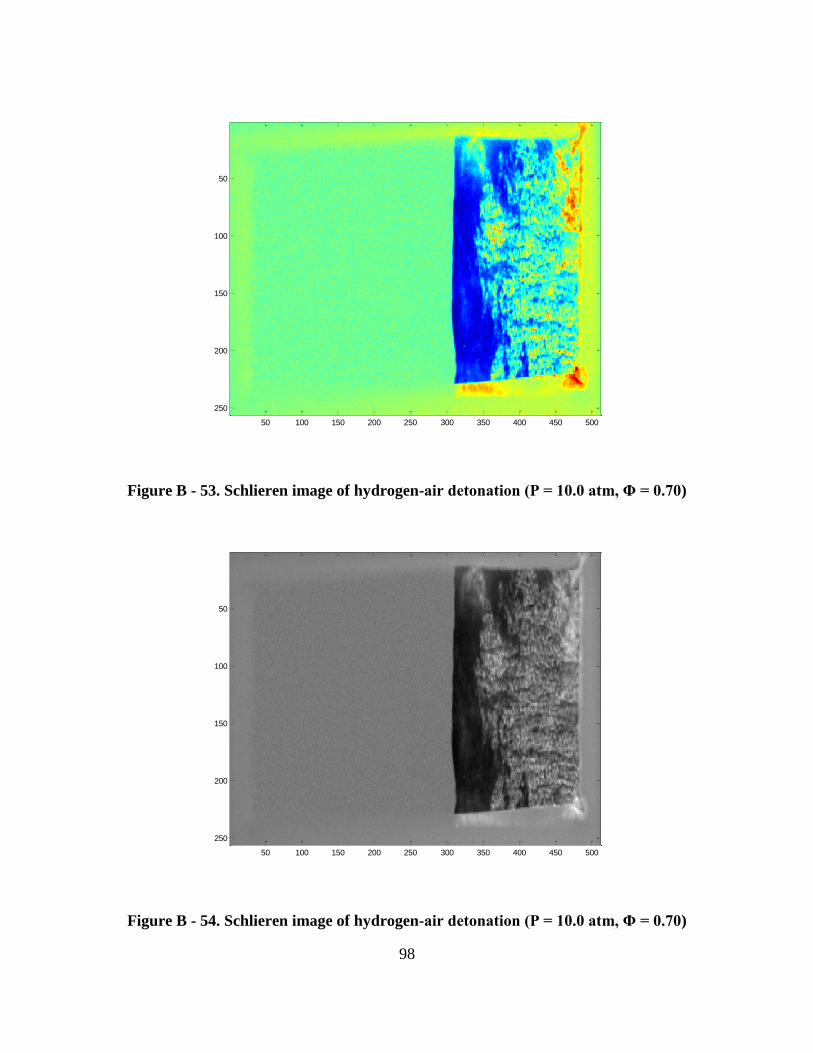
98
Figure B - 53. Schlieren image of hydrogen-air detonation (P = 10.0 atm, Φ = 0.70)
Figure B - 54. Schlieren image of hydrogen-air detonation (P = 10.0 atm, Φ = 0.70)
50 100 150 200 250 300 350 400 450 500
50
100
150
200
250
50 100 150 200 250 300 350 400 450 500
50
100
150
200
250
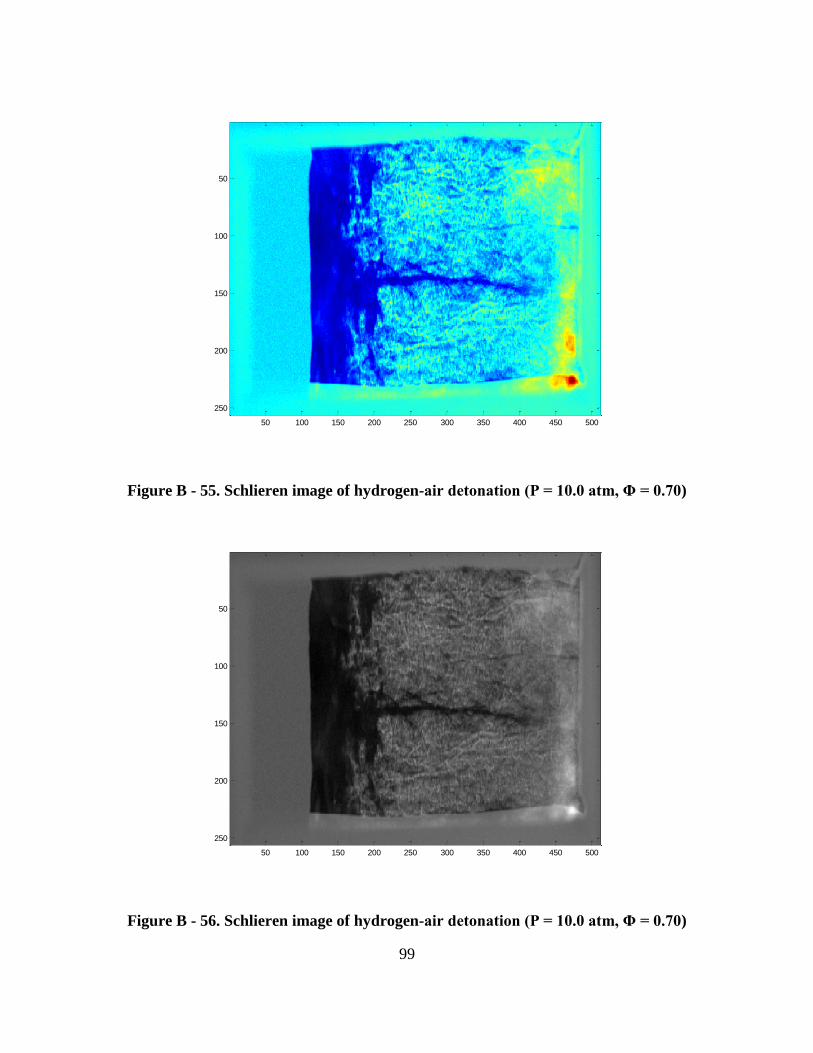
99
Figure B - 55. Schlieren image of hydrogen-air detonation (P = 10.0 atm, Φ = 0.70)
Figure B - 56. Schlieren image of hydrogen-air detonation (P = 10.0 atm, Φ = 0.70)
50 100 150 200 250 300 350 400 450 500
50
100
150
200
250
50 100 150 200 250 300 350 400 450 500
50
100
150
200
250
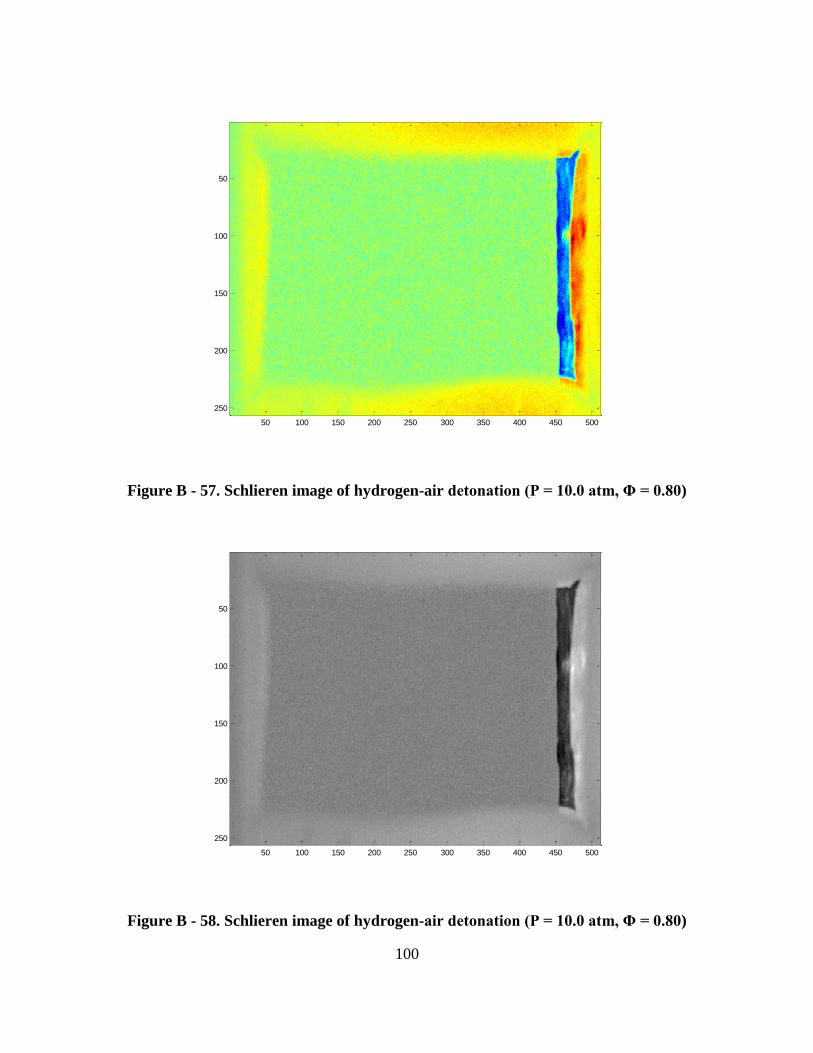
100
Figure B - 57. Schlieren image of hydrogen-air detonation (P = 10.0 atm, Φ = 0.80)
Figure B - 58. Schlieren image of hydrogen-air detonation (P = 10.0 atm, Φ = 0.80)
50 100 150 200 250 300 350 400 450 500
50
100
150
200
250
50 100 150 200 250 300 350 400 450 500
50
100
150
200
250
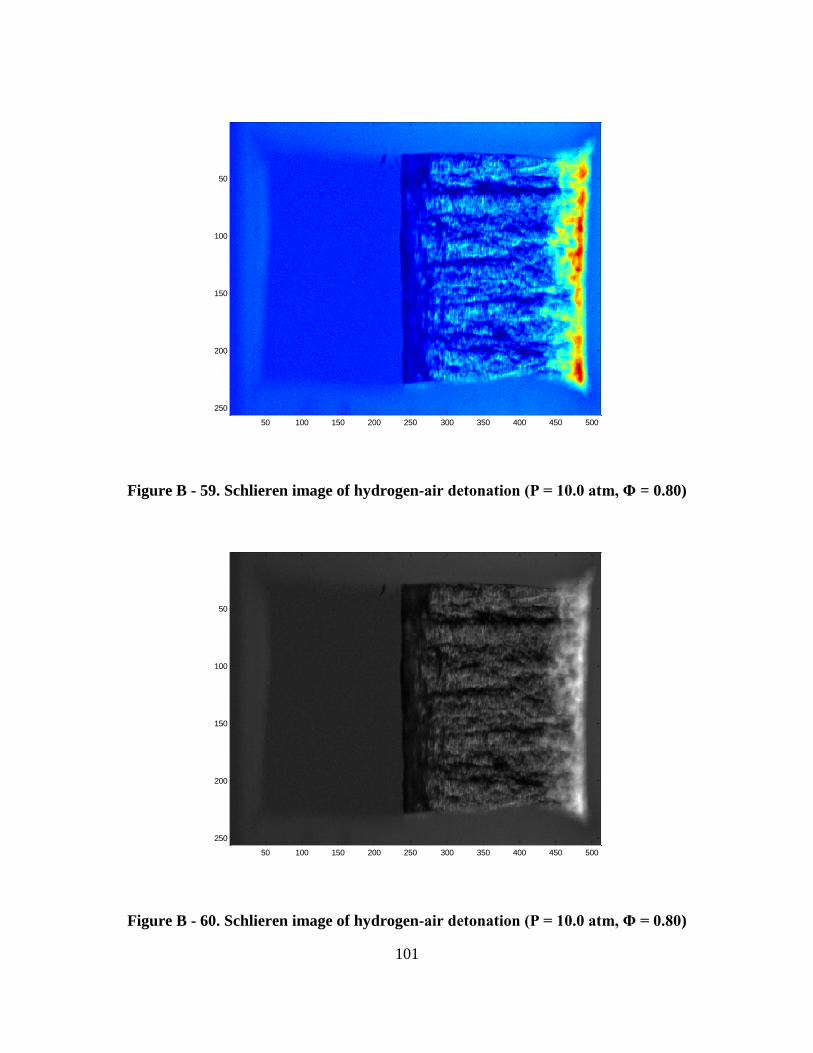
101
Figure B - 59. Schlieren image of hydrogen-air detonation (P = 10.0 atm, Φ = 0.80)
Figure B - 60. Schlieren image of hydrogen-air detonation (P = 10.0 atm, Φ = 0.80)
50 100 150 200 250 300 350 400 450 500
50
100
150
200
250
50 100 150 200 250 300 350 400 450 500
50
100
150
200
250

102
Appendix C - Results by Equivalence Ratio and Pressure
The results by equivalence and pressure display the 15 cases in individual charts
to see each trend independently. Each chart contains either a single pressure with
changing equivalence ratios or a single equivalence ratio with changing pressures. The
charts in Appendix C contain R2 values and error bars to allow conclusions to be drawn
independently of the entire experiment. The R2 values and error bars were not included
into Chapter IV figures because the error bars would overlap. Figure C - 1 to Figure C -
4 show the effect of mixture pressure on cell size by holding equivalence ratio constant
with mixture pressure changing. Figure C - 5 to Figure C - 9 show the effect of
equivalence ratio on cell size by holding mixture pressure constant with changing
equivalence ratios. Figure C - 1 to Figure C - 4 give pressure in torr while Figure C - 5 to
Figure C - 9 give trend lines with constant pressure in atm.
Figure C - 1 shows an equivalence ratio of 1.00 with mixture pressures from 1.0
atm to 4.0 atm. This chart contains three data points. The power series trend line yields
an exponent of -0.381. The data fits the trend well with an R2 of 0.958.

103
Figure C - 1. Hydrogen/air detonation cell size vs mixture pressure (P=1.0-4.0 atm,
Φ=1.00)
Figure C - 2 shows an equivalence ratio of 0.80 with mixture pressures from 2.0
atm to 10.0 atm. This chart contains five data points, the most of any trend in this
research. The power series trend line yields an exponent of -0.356. The data fits the
trend well with an R2 of 0.997. Because this trend line contains the most data points and
highest R2, it has the potential for less error in the results and the best ability to predict
true cell size in the range of the tests.
y = 10.022x-0.381
R² = 0.9576
0.300
0.400
0.500
0.600
0.700
0.800
0.900
1.000
1.100
1.200
0 500 1000 1500 2000 2500 3000 3500 4000 4500
Det
on
ati
on
Cel
l S
ize,
λ (
cm)
Mixture Pressure (torr)
Hydrogen/air detonation cell size vs mixture pressure
(P=1.0-4.0 atm, Φ=1.00)
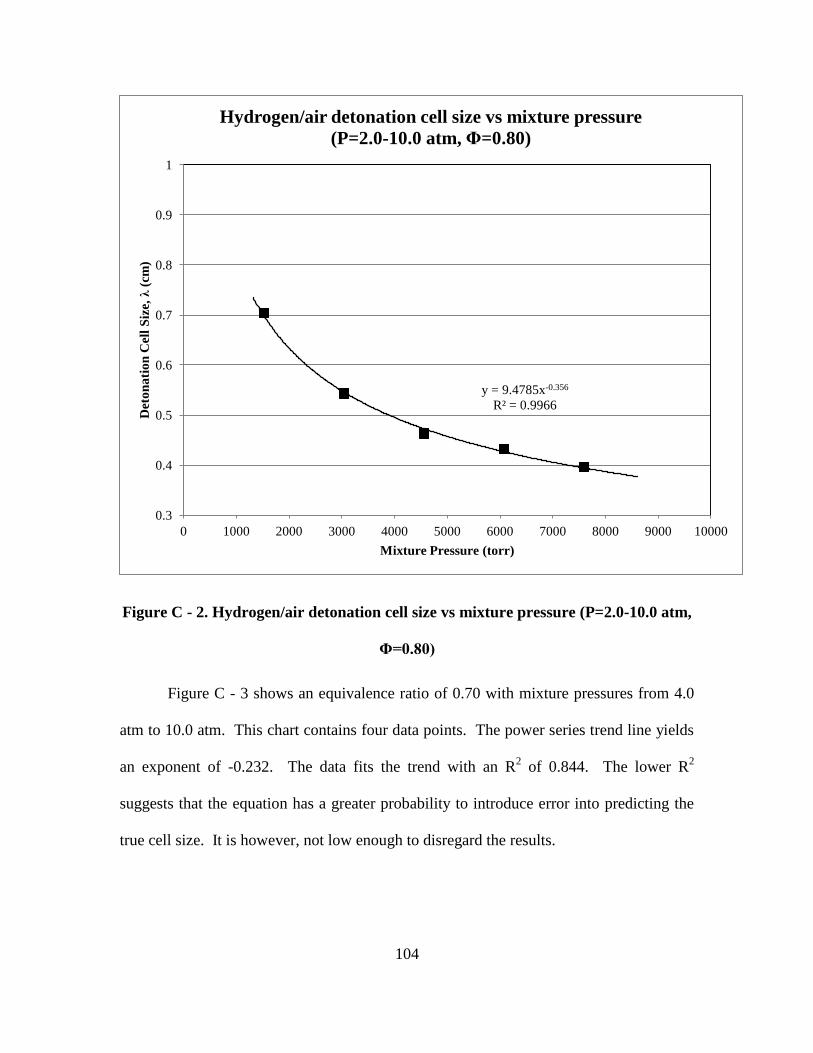
104
Figure C - 2. Hydrogen/air detonation cell size vs mixture pressure (P=2.0-10.0 atm,
Φ=0.80)
Figure C - 3 shows an equivalence ratio of 0.70 with mixture pressures from 4.0
atm to 10.0 atm. This chart contains four data points. The power series trend line yields
an exponent of -0.232. The data fits the trend with an R2 of 0.844. The lower R
2
suggests that the equation has a greater probability to introduce error into predicting the
true cell size. It is however, not low enough to disregard the results.
y = 9.4785x-0.356
R² = 0.9966
0.3
0.4
0.5
0.6
0.7
0.8
0.9
1
0 1000 2000 3000 4000 5000 6000 7000 8000 9000 10000
Det
on
ati
on
Cel
l S
ize,
λ (
cm)
Mixture Pressure (torr)
Hydrogen/air detonation cell size vs mixture pressure
(P=2.0-10.0 atm, Φ=0.80)

105
Figure C - 3. Hydrogen/air detonation cell size vs mixture pressure (P=4.0-10.0 atm,
Φ=0.70)
Figure C - 4 shows an equivalence ratio of 0.65 with mixture pressures from 6.0
atm to 10.0 atm. This chart contains three data points. The power series trend line yields
an exponent of -0.177. The data fits the trend line with an R2 of 0.810. The low R
2
suggests that the equation has a greater probability to introduce error into predicting the
true cell size. It is however, is still not low enough to disregard the results. The lowest
R2 may be due to only having three data points or higher pressures may be more irregular
or lower equivalence ratios may be more irregular.
y = 4.2412x-0.232
R² = 0.8443
0.3
0.4
0.5
0.6
0.7
0.8
0.9
1
0 1000 2000 3000 4000 5000 6000 7000 8000 9000 10000
Det
on
ati
on
Cel
l S
ize,
λ (
cm)
Mixture Pressure (torr)
Hydrogen/air detonation cell size vs mixture pressure
(P=4.0-10.0 atm, Φ=0.70)

106
Figure C - 4. Hydrogen/air detonation cell size vs mixture pressure (P=6.0-10.0 atm,
Φ=0.65)
Figure C - 5 to Figure C - 9 show trend lines with constant mixture pressure.
Figure C - 5 shows an mixture pressure of 2.0 atm with equivalence ratios between 0.80
and 1.00. Because this trend line only contains two data points, the trend line values are
not as meaningful. The exponent for the power series is -0.899. The R2 is not given
because it would be 1.00 for two data points.
y = 3.7826x-0.177
R² = 0.8102
0.3
0.4
0.5
0.6
0.7
0.8
0.9
1
0 1000 2000 3000 4000 5000 6000 7000 8000 9000 10000
Det
on
ati
on
Cel
l S
ize,
λ (
cm)
Mixture Pressure (torr)
Hydrogen/air detonation cell size vs mixture pressure
(P=6.0-10.0 atm, Φ=0.65)

107
Figure C - 5. Hydrogen/air detonation cell size vs equivalence ratio (P=2.0 atm,
Φ=0.80-1.00)
Figure C - 6 shows an mixture pressure of 4.0 atm with equivalence ratios
between 0.70 and 1.00. This trend line contains three data points. The exponent for the
power series is -0.795. The trend line fits the data with an R2 of 0.91. The R
2 suggests
that the trend line should be a good predictor of cell size for the given mixture conditions.
y = 0.576x-0.899
0.3
0.4
0.5
0.6
0.7
0.8
0.9
1
0.6 0.65 0.7 0.75 0.8 0.85 0.9 0.95 1 1.05 1.1
Det
on
ati
on
Cel
l S
ize,
λ (
cm)
Equivalence Ratio, Φ
Hydrogen/air detonation cell size vs equivalence ratio
(P=2.0 atm, Φ=0.80-1.00)
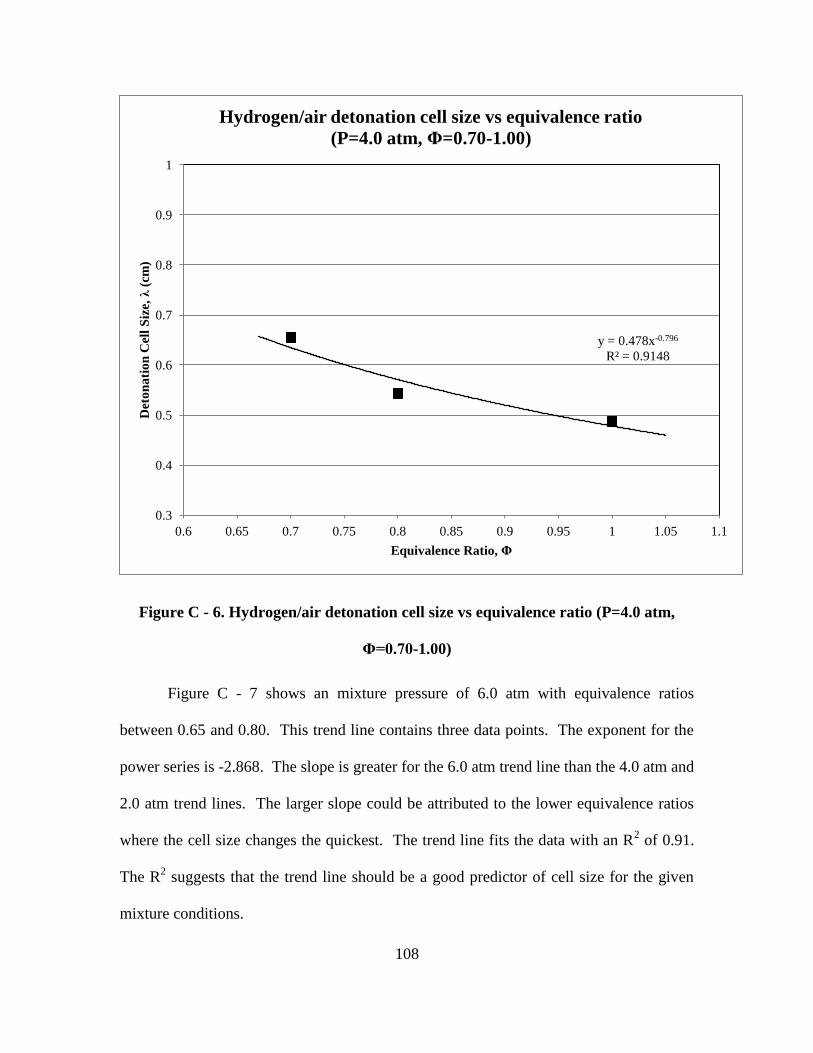
108
Figure C - 6. Hydrogen/air detonation cell size vs equivalence ratio (P=4.0 atm,
Φ=0.70-1.00)
Figure C - 7 shows an mixture pressure of 6.0 atm with equivalence ratios
between 0.65 and 0.80. This trend line contains three data points. The exponent for the
power series is -2.868. The slope is greater for the 6.0 atm trend line than the 4.0 atm and
2.0 atm trend lines. The larger slope could be attributed to the lower equivalence ratios
where the cell size changes the quickest. The trend line fits the data with an R2 of 0.91.
The R2 suggests that the trend line should be a good predictor of cell size for the given
mixture conditions.
y = 0.478x-0.796
R² = 0.9148
0.3
0.4
0.5
0.6
0.7
0.8
0.9
1
0.6 0.65 0.7 0.75 0.8 0.85 0.9 0.95 1 1.05 1.1
Det
on
ati
on
Cel
l S
ize,
λ (
cm)
Equivalence Ratio, Φ
Hydrogen/air detonation cell size vs equivalence ratio
(P=4.0 atm, Φ=0.70-1.00)

109
Figure C - 7. Hydrogen/air detonation cell size vs equivalence ratio (P=6.0 atm,
Φ=0.65-0.80)
Figure C - 8 shows an mixture pressure of 8.0 atm with equivalence ratios
between 0.65 and 0.80. This trend line contains three data points. The exponent for the
power series is -2.855. The slope for the 8.0 atm trend line is nearly the same as the 6.0
atm trend line with exponents less than 1.0% different. The trend line fits the data well
with an R2 of 0.98. The R
2 suggests that the trend line should be a better predictor of cell
size compared to the other trend lines with constant mixture pressure in this research.
y = 0.2357x-2.868
R² = 0.9239
0.3
0.4
0.5
0.6
0.7
0.8
0.9
1
0.6 0.65 0.7 0.75 0.8 0.85 0.9 0.95 1 1.05 1.1
Det
on
ati
on
Cel
l S
ize,
λ (
cm)
Equivalence Ratio, Φ
Hydrogen/air detonation cell size vs equivalence ratio
(P=6.0 atm, Φ=0.65-0.80)

110
Figure C - 8. Hydrogen/air detonation cell size vs equivalence ratio (P=8.0 atm,
Φ=0.65-0.80)
Figure C - 9 shows an mixture pressure of 10.0 atm with equivalence ratios
between 0.65 and 0.80. This trend line contains three data points. The exponent for the
power series is -3.173. The slope for the 10.0 atm trend line is close to the 8.0 atm and
6.0 atm trend lines with exponents less than 10% different. The trend line fits the data
with an R2 of 0.91. The R
2 suggests that the trend line should be a good predictor of cell
size for the given mixture conditions.
y = 0.2247x-2.855
R² = 0.982
0.3
0.4
0.5
0.6
0.7
0.8
0.9
1
0.6 0.65 0.7 0.75 0.8 0.85 0.9 0.95 1 1.05 1.1
Det
on
ati
on
Cel
l S
ize,
λ (
cm)
Equivalence Ratio, Φ
Hydrogen/air detonation cell size vs equivalence ratio
(P=8.0 atm, Φ=0.65-0.80)
Lower Bound Mean Upper Bound
Power (Lower Bound) Power (Mean) Power (Upper Bound)
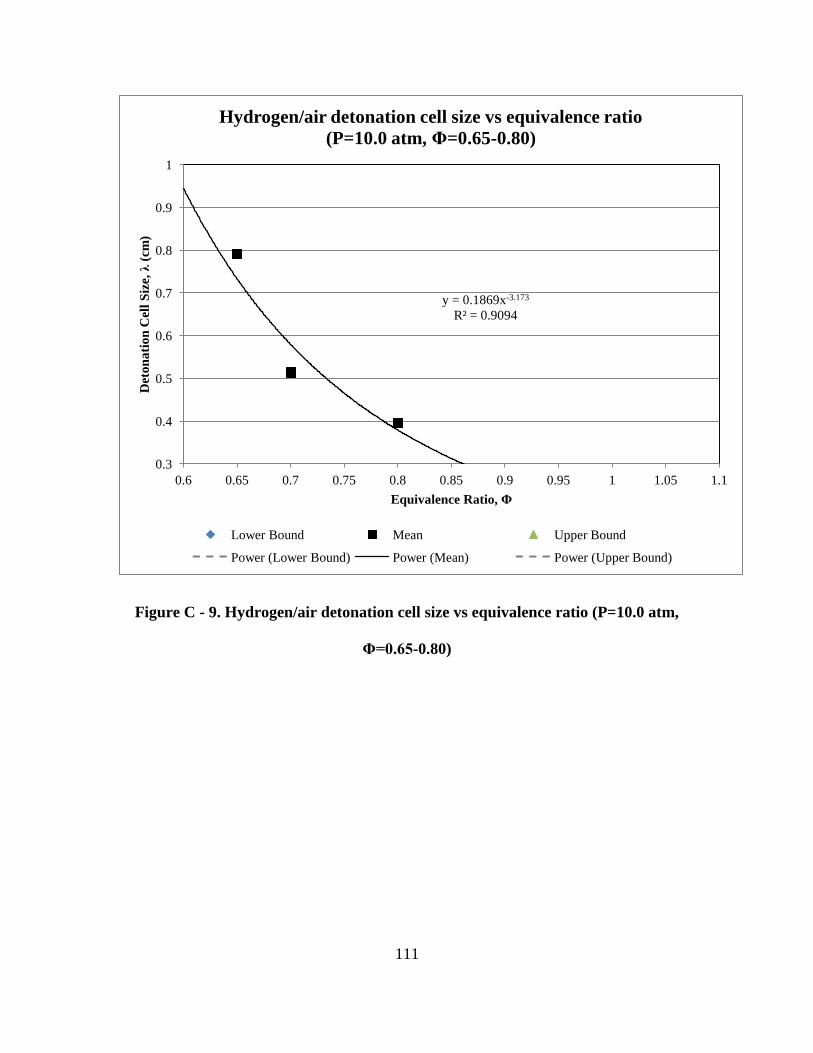
111
Figure C - 9. Hydrogen/air detonation cell size vs equivalence ratio (P=10.0 atm,
Φ=0.65-0.80)
y = 0.1869x-3.173
R² = 0.9094
0.3
0.4
0.5
0.6
0.7
0.8
0.9
1
0.6 0.65 0.7 0.75 0.8 0.85 0.9 0.95 1 1.05 1.1
Det
on
ati
on
Cel
l S
ize,
λ (
cm)
Equivalence Ratio, Φ
Hydrogen/air detonation cell size vs equivalence ratio
(P=10.0 atm, Φ=0.65-0.80)
Lower Bound Mean Upper Bound
Power (Lower Bound) Power (Mean) Power (Upper Bound)
112
Bibliography
Bull, D.C., Ellsworth, J.E., and Schuff, P.J. (1982) Detonation cell structure in fuel/air
mixtures. Comb. Flame 45, 7-22.
Ciccarelli, G., T. Ginsburg, J. Boccio, C. Economos, C. Finfrock, L. Gerlach, K. Sato,
and M. Kinoshita. High-Temperature Hydrogen-Air-SteamDetoantion Experiments in
the BNL Small-Scale Development Apparatus. Technical Report NUREG/CR-6213,
BNL-NUREG-52414, Brookhaven National Laboratory, 1994.
Ciccarelli, G. T., Ginsberg, J. Boccio, C. Economos, K. Sato, and M. Kinoshita.
Detonation cell size measurements and predictions in hydrogen-air-steam mixtures at
elevated temperatures. Combust. Flame, 99(2):212-220, 1994.
Ciccarelli, G. T., Ginsberg, J. Boccio, C. Finfrock, L. Gerlach, H. Tagawa, and A.
Malliakos. Detonation cell size measurements in high-temperature hydrogen-air-
steam mixtures at the bnl high-temperature combustion facility. Technical Report
NUREG/CR-6391, BNL-NUREG-52482, Brookhaven National Laboratory, 1997.
DeBarmore, Nick D., Paul King, Fred Schauer, and John Hoke, “Nozzle Guide Vane
Integration into Rotating Detonation Engine,” 51st AIAA Aerospace Sciences
Meeting including the New Horizons Forum and Aerospace Exposition, AIAA 2013-
1030, Grapevine, TX, January 2013.
Denisov, Yu. N. "Concerning the Analogy Between Combustion in a Detonation Wave
and in a Rocket Engine", ARS Journal, Vol. 30, No. 9 (1960), pp. 834-840.
Denisov, Yu.N. and Ya.K. Troshin. Pulsating and spinning detonation of gaseous
mixtures in tubes. Dokl. Akad. Nauk SSSR, 125(1):110-113, 1959.
Dupre, G., R. Knystautas, J. Lee, Prog. In Astro. and Aero., Vol. 106, p. 244, 1985.
Guirao, C.M., R. Knystautas, J. Lee, W. Benedick, and M. Berman. Hydrogen-air
detonations. In 19th Symp. Int. Combust. Proc., pages 583-590, 1982.
Kaneshige, M. and Shepherd, J.E., “Detonation Database,” Graduate Aeronautical
Laboratories California Institute of Technology, Pasadena, CA, Technical Report
FM97-8, July 1997.
Lee, J.H.S, The Detonation Phenomenon, Cambridge University Press, 2008.
Lee, J. H. S., “Dynamic Parameters of Gaseous Detonations,” Ann. Rev. Fluid Mech., 3 1
1-336, 1984.
113
Lee, J. H.S., “Initiation of Gaseous Detonations,” Annual Review Phys. Chem., Vol. 28,
pp. 75-104, 1977.
Lefebvre, M. H., “Simulation of Cellular Structure in a Detonation Wave,” Dynamic
Aspects of Detonations, Vol. 153, 1993, pp. 64-77.
Matsui, H., and J.H.S. Lee. On the measure of the relative detonation hazards of gaseous
fuel-oxygen and air mixtures. In: Proceedings of the Seventeenth Symposium
(International) on Combustion. The Combustion Institute, Pittsburgh, pp 1269–1280.
1979.
Millhouse, Paul T., Stuart C. Kramer, Paul I. King, and Edward F. Mykytka, “Identifying
Optimal Fan Compressor Pressure Ratios for the Mixed-Stream Turbofan Engine,”
Journal of Propulsion and Power, Vol. 16, No. 1, January-February 2000.
Mitrofanov, V. V. and R. I. Solouhkin, Soviet Phys. Dokl., Vol. 9, p. 1055, 1965.
Moen, I. O., Donato, M., Knystautas, R. and Lee, J. H.: Eighteenth Symposium
(International) on Combustion, p. 1615, The Combustion Institute, Pittsburgh (1980).
Moen, I.O., Funk, J.W., Ward, S.A., Rude, G.M. and Thibault, P.A. (1984b) Detonation
length scales for fuel-air explosives. AIAA Progress in Astronautics and Aeronautics,
Vol. 94, 55-79. AIAA, New York.
Moen, I. O., S. E. Murray, D. Bjerketvedt, A. Rinnan, R. Knystautas, J. Lee, “Diffraction
of Detonation From tubes into a Large Fuel-Air Explosive Cloud,” 19th International
Symposium on Combustion, p. 635, 1982.
Settles, G., Schlieren and Shadowgraph Techniques: Visualizing Phenomena in
Transparent Media, Springer, Berlin, 2001.
Shchelkin, K. I. and Y. K. Troshin, Gas Dynamics of Detonations, Mono :Book Corp.,
Baltimore, Maryland, 1965.
Shepherd, J.E., “Chemical Kinetics of Hydrogen-Air-Diluent Detonations,” 10th
ICDERS, Berkley, CA, August 1985, pp. 263-293.
Shepherd, J.E.. Chemical kinetics and cellular structure of detonations in hydrogen
sulfide and air. In Prog. Astronaut. Aeronaut., volume 106, pages 294-320, 1986.
Stamps, D.W., W.B. Benedick, and S.R. Tieszen. Hydrogen-air-diluent detonation study
for nuclear reactor safety analyses. Technical Report NUREG/CR-5525, SAND89-
2398, Sandia National Laboratories, 1991.
114
Stevens, Christopher A., John L. Hoke, and Frederick R. Schauer, “Optical Measurement
of Detonation with a Focusing Schlieren Technique,” AIAA 53rd Aerospace Sciences
Meeting, AIAA-2015-1350, Kissimmee, FL, 2015
Stevens, Christopher A., John L. Hoke, and Frederick R. Schauer, “Cell Width of
Methane/Air Mixtures at Elevated Initial Pressure and Temperature,” AIAA-2014-
1320, AIAA SciTech, 2014.
Tellefsen, Johnathan R., Paul King, Fred Schauer, and John Hoke, “Analysis of an RDE
with Convergent Nozzle in Preparation for Turbine Integration,” 50th AIAA
Aerospace Sciences Meeting Including the New Horizons Forum and Aerospace
Exposition, AIAA 2012-0773, Nashville, TN, January 2012.
Tieszen, S.R., M.P. Sherman, W.B. Benedick, and M. Berman. Detonability of H_2-air-
diluent mixtures. Technical Report NUREG/CR-4905, SAND85-1263, Sandia
National Laboratories, 1987.
Tieszen, S.R., M.P. Sherman, W.B. Benedick, J.E. Shepherd, R. Knystautas, and J.H.S.
Lee. Detonation cell size measurements in hydrogen-air-steam mixtures. In Prog.
Astronaut. Aeronaut., volume 106, pages 205-219, 1986.
Wheeler, Anthony J., and Ahmad R. Ganji, Introduction to Engineering Experimentation,
Pearson, Upper Saddle River, NJ, 2004, pp. 190-202.
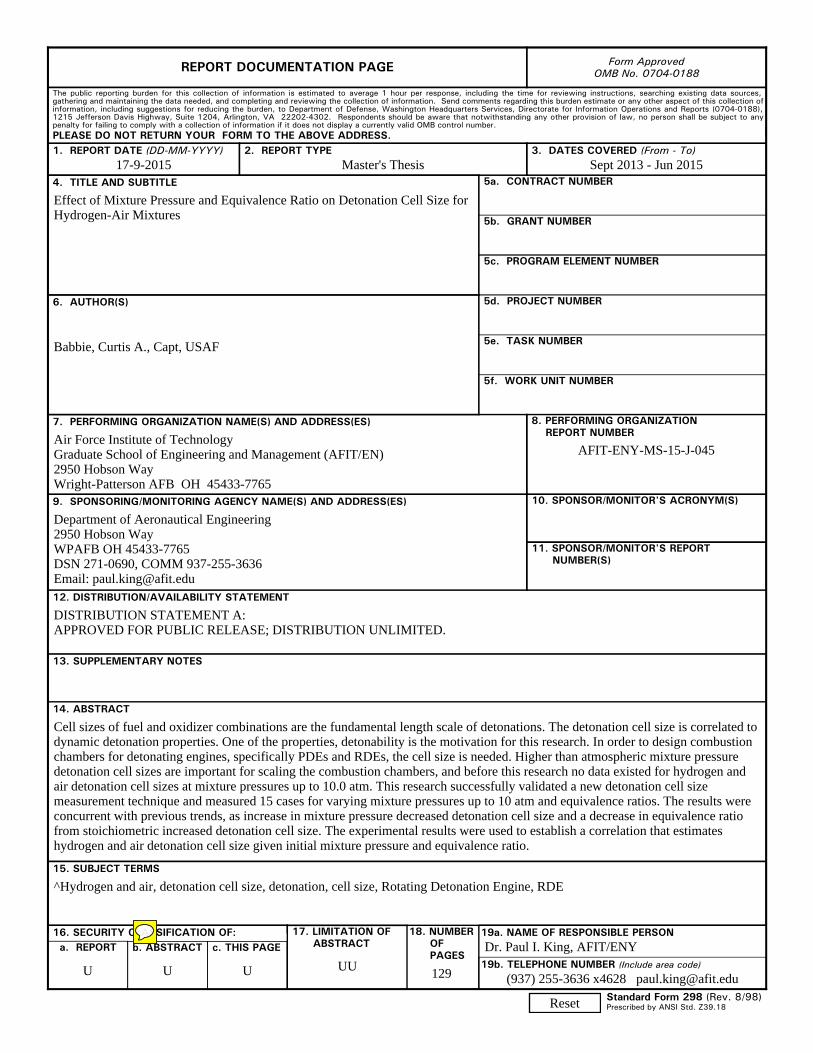
Standard Form 298 (Rev. 8/98)
REPORT DOCUMENTATION PAGE
Prescribed by ANSI Std. Z39.18
Form Approved OMB No. 0704-0188
The public reporting burden for this collection of information is estimated to average 1 hour per response, including the time for reviewing instructions, searching existing data sources, gathering and maintaining the data needed, and completing and reviewing the collection of information. Send comments regarding this burden estimate or any other aspect of this collection of information, including suggestions for reducing the burden, to Department of Defense, Washington Headquarters Services, Directorate for Information Operations and Reports (0704-0188), 1215 Jefferson Davis Highway, Suite 1204, Arlington, VA 22202-4302. Respondents should be aware that notwithstanding any other provision of law, no person shall be subject to any penalty for failing to comply with a collection of information if it does not display a currently valid OMB control number. PLEASE DO NOT RETURN YOUR FORM TO THE ABOVE ADDRESS. 1. REPORT DATE (DD-MM-YYYY) 2. REPORT TYPE 3. DATES COVERED (From - To)
4. TITLE AND SUBTITLE 5a. CONTRACT NUMBER
5b. GRANT NUMBER
5c. PROGRAM ELEMENT NUMBER
5d. PROJECT NUMBER
5e. TASK NUMBER
5f. WORK UNIT NUMBER
6. AUTHOR(S)
7. PERFORMING ORGANIZATION NAME(S) AND ADDRESS(ES) 8. PERFORMING ORGANIZATION REPORT NUMBER
9. SPONSORING/MONITORING AGENCY NAME(S) AND ADDRESS(ES) 10. SPONSOR/MONITOR'S ACRONYM(S)
11. SPONSOR/MONITOR'S REPORT NUMBER(S)
12. DISTRIBUTION/AVAILABILITY STATEMENT
13. SUPPLEMENTARY NOTES
14. ABSTRACT
15. SUBJECT TERMS
16. SECURITY CLASSIFICATION OF: a. REPORT b. ABSTRACT c. THIS PAGE
17. LIMITATION OF ABSTRACT
18. NUMBER OF PAGES
19a. NAME OF RESPONSIBLE PERSON
19b. TELEPHONE NUMBER (Include area code)
17-9-2015 Master's Thesis Sept 2013 - Jun 2015
Effect of Mixture Pressure and Equivalence Ratio on Detonation Cell Size for Hydrogen-Air Mixtures
Babbie, Curtis A., Capt, USAF
Air Force Institute of Technology Graduate School of Engineering and Management (AFIT/EN) 2950 Hobson Way Wright-Patterson AFB OH 45433-7765
AFIT-ENY-MS-15-J-045
Department of Aeronautical Engineering 2950 Hobson Way WPAFB OH 45433-7765 DSN 271-0690, COMM 937-255-3636 Email: [email protected]
DISTRIBUTION STATEMENT A: APPROVED FOR PUBLIC RELEASE; DISTRIBUTION UNLIMITED.
Cell sizes of fuel and oxidizer combinations are the fundamental length scale of detonations. The detonation cell size is correlated to dynamic detonation properties. One of the properties, detonability is the motivation for this research. In order to design combustion chambers for detonating engines, specifically PDEs and RDEs, the cell size is needed. Higher than atmospheric mixture pressure detonation cell sizes are important for scaling the combustion chambers, and before this research no data existed for hydrogen and air detonation cell sizes at mixture pressures up to 10.0 atm. This research successfully validated a new detonation cell size measurement technique and measured 15 cases for varying mixture pressures up to 10 atm and equivalence ratios. The results were concurrent with previous trends, as increase in mixture pressure decreased detonation cell size and a decrease in equivalence ratio from stoichiometric increased detonation cell size. The experimental results were used to establish a correlation that estimates hydrogen and air detonation cell size given initial mixture pressure and equivalence ratio.
^Hydrogen and air, detonation cell size, detonation, cell size, Rotating Detonation Engine, RDE
U U U UU 129
Dr. Paul I. King, AFIT/ENY
(937) 255-3636 x4628 [email protected]
Reset
Top Related