


Languages
Pages
Legal


1
Economic Models of OPEC Behaviour and the Role of Saudi Arabia
Nourah Al-Yousef
Department of Economics, University of Surrey
June 1998
1 INTRODUCTION
With the rise of the oil prices in 1973, numerous theoretical and empirical studies
were undertaken to analyse the structure of the world oil market and the role of
(OPEC). Most of these models analyse the oil market concentrating on OPEC as
a whole and analysing the Saudi role within the organisation.
With Saudi Arabia holding the highest world proven reserves, and a large
share in world production and exports, different studies have reviewed the relevant
models of OPEC behaviour and analysed Saudi Arabia’s role separately. Griffin
and Teece (1982) provided a collection of papers on OPEC and world oil where
they divided the models of OPEC into two distinct areas. The first are the wealth
maximising models that include monopolistic and competitive behaviour and the
second are non-wealth maximising models. Griffin and Teece provided an
interpretation of OPEC as the dominant producer with Saudi Arabia as the swing
producer who absorbs the fluctuations in supply and demand. Cremer and
Isfahani (1991) also provided a survey with different classifications of models on
OPEC behaviour. Mabro (1991) reviewed relevant works related to the pricing of
oil. He divided such works according to four lines of research. The first line dealt

2
with the exhaustible resource theory, while the second analysed OPEC behaviour
in relation to how far OPEC pricing was from competitive behaviour. The third
dealt with the game theory, while the fourth type of studies applied econometric
tests.
All these previous studies have suggested ways of explaining the behaviour
of OPEC as a group. The specific role of Saudi Arabia in the market and within
OPEC has received attention from some authors. We are interested in analysing
the role of Saudi Arabia in these models. In order to understand how OPEC
model explain the Saudi role, we need to review all the models that explained
OPEC behaviour and try to find how much they explain the role of Saudi Arabia
on the period from the 1973 increase in oil prices to the time of the study.
Table 1: The Models of OPEC Behaviour.
Models Type Model
Models that do not recognise Saudi Arabia’s role Monolithic cartelCompetitive Model
Models that address Saudi Arabia’s role Two block cartelGeroski, Ulph and UlphSwing Producer
Other theories of OPEC behaviour in the oilmarket
Property RightFiscal Constraint ModelsTarget Capacity Utilisation
Econometric Studies Griffin (1985)Dahl and Yucel (1991)Griffin and Neilson (1994)Al-Turki (1994)

3
Al-Yousef (1994)Gulen (1996)
Political Interpretation of Saudi Arabia’sbehaviour.
Stevens (1982,1992)Doran(1982)Moran(1982)Golub(1985)
In this paper we will divide, the models of OPEC 1 behaviour into four sets. The
first set of models does not address the role of Saudi Arabia, such as the
monolithic cartel models and the competitive models. The second set examines the
role of Saudi Arabia in the oil market such as the different group cartels, and the
swing producer model. Then we will discuss other theories of OPEC behaviour
that may apply to Saudi Arabia, namely the target capacity utilisation model, the
fiscal constraint model and the property right model. This will be followed by a
political interpretation of Saudi Arabia’s behaviour in the world oil market. The
previous empirical tests such as Griffin (1985) Dahl and Yucel (1991) Griffin and
Neilson (1994), Al-Turki (1994), Al-Yousef (1994), and Gulen (1996) will be
reviewed in the world oil market. These models will be evaluated under the
institutional evidence already discussed in chapter 3. Since Saudi Arabia is a
major producer of oil it might use its production and pricing policies to achieve
certain objectives. These objectives will be discussed in the light of each model
and compared with the expected oil policy according to that model in order to
identify those which are supported by the institutional evidence.
4
2 MODELS THAT DO NOT RECOGNISE SAUDI ARABIA’S ROLE
There are several studies that have analysed OPEC as a group with no emphasis
on Saudi Arabia’s role. Most of these studies appeared right immediately the first
price shock in the early seventies. Those models are grouped into two, the
monolithic cartel model such as Gilbert (1978) Pindyck (1978) and Salant (1976)
and the competitive model MacAvoy (1979).
2.1 The Monolithic Cartel
In these models OPEC is described as a unified group which sets prices for crude
oil with no competition among its members. The “competitive fringe” or the price
takers are the non-OPEC suppliers. The competitive fringe will increase their
production to equalise their short-term marginal cost with the price set by OPEC,
which sets crude oil prices by taking into account non-OPEC supplies and costs.
The demand for OPEC oil is the difference between the total world oil demand
and non-OPEC supplies at different levels of OPEC prices. Thus, OPEC is
viewed as the residual supplier.
In equilibrium, the price for both OPEC and the competitive fringe is equal.
When OPEC sets the price, the competitor takes it as given, and produces the
output which maximises its profit. When acting as the residual supplier OPEC's
output will be equal to:
Q Q QPOPEC
PW
PNO= − 1

5
where QOPEC is the OPEC supply, Qw is world oil demand and QNO is the
competitive fringe’s supply (non-OPEC suppliers).
According to Gilbert (1978) OPEC as a dominant cartel is a Stackelberg
leader, the price maker, and the other producers are the price takers. OPEC is
described as a dominant producer which maximises its profit by choosing an
optimal production path taking into consideration the reaction of the fringe to its
policies.
The competitive fringe takes prices as given and maximises its profit given
the cartel's production path. The demand for the competitor depends on total world
demand minus the demand facing the cartel. The production of the cartel is known
by the fringe, the inverse demand function is P f Q QtNO
tOPEC= ( , ) and the cost
function for both the fringe and the cartel production C C Q St t= ( , ) where St is
the remaining reserve.
The cartel, acting as a Stackelberg leader, chooses an extraction path that
maximises profits taking into account the response of the competitive fringe and
given that total extraction will not exceed total reserve. The response of the
competitive fringe depends on the cost of extraction.
Pindyck (1978) used an intertemporal model where the demand facing
OPEC is Q Q QOPEC W NO= − and the Q f P QtOPEC
t tNO= −( , )1 . The objective is to

6
derive the price Pt that would maximise the sum of the discounted profits of the
cartel taking into account the rate of depletion, reserve level, and production cost.
Maxr
Pm
RQpt
wt
t
T
tt
tOPEC=
+−
=∑ 1
11 ( )[ ] 2
where r is the cartel's rate of discount and m/Rt is the average production costs that
go to infinity as the resource is exhausted.
Salant (1976) assumed that the oil market is dominated by an OPEC cartel
that takes the sales path of the fringe as given and maximises its joint discounted
profits. Here the cartel takes account only of the response of consumers to its
policies and does not account for the response of the fringe (Nash Cournot
behaviour).
Salant analysed the market structures consisting of the competitive firms on
the one hand and on the other the producers forming a collusive cartel which
dominates the oil market. The price path of a competitive market rises at the rate
of interest until the initial stock of all firms is exhausted. The cartel will continue
to sell after the competitors stop selling at prices following the monopolistic path
where the rate of increase in price is less than the interest rate on other assets until
it reaches the backstop price.
According to this model, OPEC is a unified cohesive group that maximises
its profits without any competition among its members. It is the residual supplier
who sets the price. The competitive fringe is the non-OPEC supplier (price taker)
with limited production capacity. The power of OPEC would depend on the

7
elasticity of demand facing it, the elasticity of non-OPEC supply and the relative
share of OPEC in world supply. In such models world demand depends on the real
price (P) and economic activity (A) while non-OPEC production depends on real
price (P) and exogenous supply variables (Z).
Q Q QOPECP AW
P ZNO= −, , 3
Accordingly, OPEC supply as a unified group would be a function of the
real price of oil, economic activity and non-OPEC supply:
Q f P A QOPEC NO= ( , , ) 4
Saudi Arabia’s production is a percentage of total OPEC production QSA =
aQO since QOPEC =QOO +QSA . where QOO is the production of other members.
Thus , to test if Saudi Arabia is a member of a monolithic cartel
Q f Q PSA oo= ( , ) 5
According to this model, Saudi Arabia is a member of a unified group, which
means it will be acting in full co-operation with the other members of OPEC.
According to the model, since Saudi Arabia and the other Gulf producers have the
lowest production cost, full co-operation means that the production in the early
period should be from those with the higher costs. However, there are sufficient
significant differences in the OPEC members’ oil policies and their economic and
political objectives to warrant full co-operation between them.
Throughout the seventies and into the mid eighties when prices were set by
OPEC, Saudi Arabia insisted that OPEC should follow a policy of price
8
moderation. When the industrialised countries started to show signs of economic
recovery after the first oil price increase in 1974 and the demand for oil was
increasing, some OPEC members demanded an increase in the price level.
However, Saudi Arabia argued that such an increase was inappropriate and thus
was able to block any price increase until December of 1976. During the 48th
OPEC conference2 in Doha, Qatar in December 1976, Saudi Arabia and UAE
agreed to increase their prices by only 5% while other members insisted on a price
increase of 10%. This resulted in the famous two tier price system which
continued until the next conference (July 1977) when Saudi Arabia and the UAE
agreed to increase their price by another 5% while the other members froze theirs.
Another incidence of divergence between Saudi Arabia and other members was
during the Iran crisis in 1978-1979, when it increased its production at official
prices which were lower than spot prices in order to prevent further increases in
oil prices. This was criticised by other members of OPEC who set their prices in
line with that of the spot market.
During 1979/1981 Saudi Arabia tried to bridge the gap between its official
price and that of other members by increasing the price of its Arabian Light crude.
The other members responded by increasing their prices further. At one time the
price of Iranian Light was $30/B compared to $24/B for Arabian Light, a similar
product. But between 1983 and 1985 Saudi Arabia's Arabian Light 340 (the
official price) was $28/29/B while spot prices in the market were declining to a
9
lower level, due to lower demand and increasing excess capacity in OPEC and
world-wide crude oil production. Thus, even with the effort of Saudi Arabia, spot
prices differ than the official prices of OPEC.
When OPEC abandoned the fixed official price structure in 1987 and chose
quota allocation alone as a means to control the market, differences continued
among its members concerning the appropriate quota for each member, the
observance of the quotas and the choice of the ceiling. Saudi Arabia and other
GCC members argued for a higher ceiling for OPEC in order to stimulate demand
and advocated quota distribution along oil related criteria such as reserves,
historical production and sustainable capacity.
During the seventies and until the mid eighties, the monolithic cartel model
did not apply to OPEC owing to the disagreements over appropriate oil prices in
most of its meetings. After 1986, disagreements over ceilings, quotas and
cheating by other members as well as the decline of the monopolistic power of
OPEC were all so evident that Saudi Arabia was not acting as a member of
Monolithic group.
2.2 The Competitive Model
According to this model the market is the main determinant of oil price changes.
The increase in demand and the decline in world oil discoveries during the 1960
and early 1970s, might have increased depletion and user costs causing the price

10
of oil to rise. MacAvoy (1982) explained the changes in oil prices by focusing on
supply and demand rather than cartel behaviour. Price increases were attributed
primarily to supply disruptions. MacAvoy explained the price increase in 1973 as
a result of speculative increases in demand because of the supply cutback. The
rise of prices in 1979 and 1980 was brought about by a decline in production due
to the Iranian revolution and the Iraq-Iran War. On the other hand, most of the
cutbacks imposed by OPEC have had limited effects. MacAvoy found that
demand and reserve conditions were more important in influencing the oil price
increase. Thus, oil supply (Sit) is a function of price (Pt), Reserves (Rit ) and
supply of the past period (Si(t-1)).
S f P R Sit t it i t= −( , , )( )1 6
Demand is a function of prices Pt , income Yjt and past period demand Dj(t-1)
D g P Y Djt t jt j t= −( , , )( )1 7
MacAvoy simulated the equilibrium prices under a number of assumptions using
actual reserves, income, and some stipulated elasticities. His finding was that
OPEC should not take credit for the cutback of supply, but only for restraining the
supply expansion response in member countries. MacAvoy in his simulation
model realised the significant role of Saudi Arabia in that if there is a substantial
change in Saudi production it will have an effect on oil prices, since it has a very
low production/reserve ratio, that gave Saudi Arabia the ability to change the level
of output according to its objective.
11
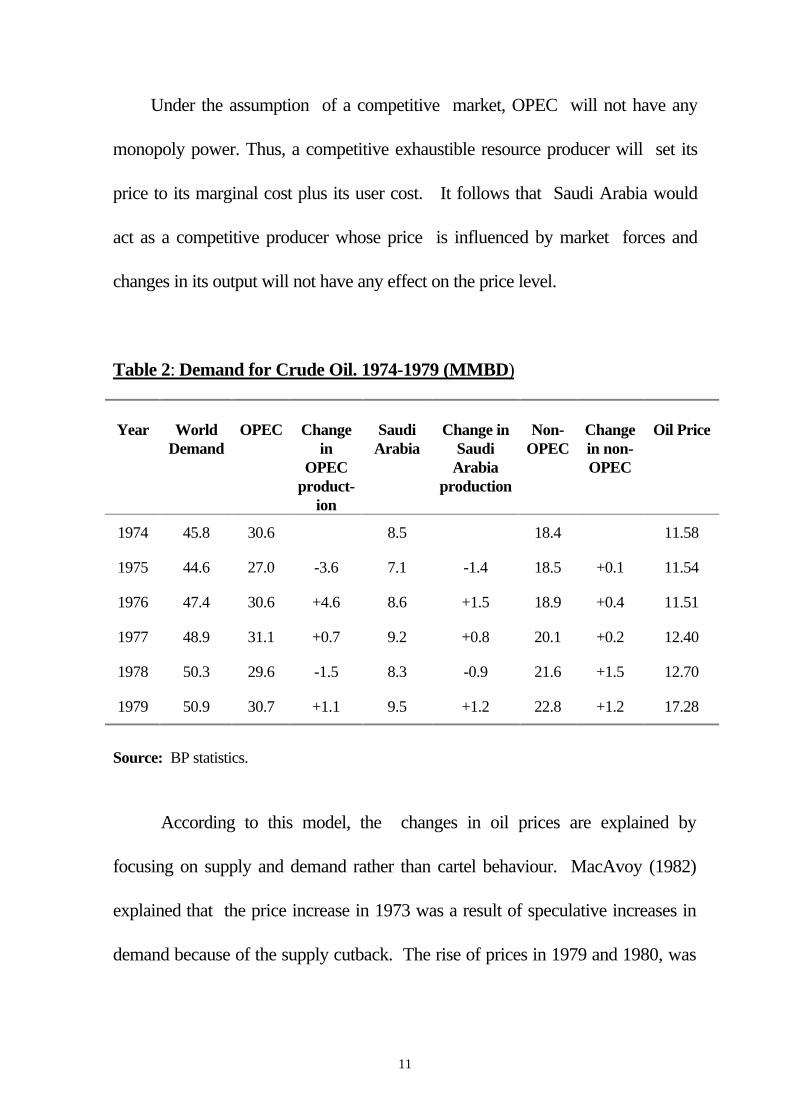
Under the assumption of a competitive market, OPEC will not have any
monopoly power. Thus, a competitive exhaustible resource producer will set its
price to its marginal cost plus its user cost. It follows that Saudi Arabia would
act as a competitive producer whose price is influenced by market forces and
changes in its output will not have any effect on the price level.
Table 2: Demand for Crude Oil. 1974-1979 (MMBD)
Year WorldDemand
OPEC Changein
OPECproduct-
ion
SaudiArabia
Change inSaudi
Arabiaproduction
Non-OPEC
Changein non-OPEC
Oil Price
1974 45.8 30.6 8.5 18.4 11.58
1975 44.6 27.0 -3.6 7.1 -1.4 18.5 +0.1 11.54
1976 47.4 30.6 +4.6 8.6 +1.5 18.9 +0.4 11.51
1977 48.9 31.1 +0.7 9.2 +0.8 20.1 +0.2 12.40
1978 50.3 29.6 -1.5 8.3 -0.9 21.6 +1.5 12.70
1979 50.9 30.7 +1.1 9.5 +1.2 22.8 +1.2 17.28
Source: BP statistics.
According to this model, the changes in oil prices are explained by
focusing on supply and demand rather than cartel behaviour. MacAvoy (1982)
explained that the price increase in 1973 was a result of speculative increases in
demand because of the supply cutback. The rise of prices in 1979 and 1980, was
12
brought about by a decline in production as a result of the Iranian revolution and
the Iraq-Iran war. In all major events the market generally determined the price.
According to this model, members of OPEC, including Saudi Arabia, take
the oil price as given, assuming that changes in each member’s output will not
have any effect on the price level. The oil prices are determined by the
fundamentals of supply and demand. Therefore an increase or a decrease in Saudi
output would have no effect on the oil prices.
However, a close look at the market raises doubts about the competitive
models. After WWII when the oil market was dominated by the majors, prices
ranged between $1.75 and $1.80/B (source: BP), increased during the 1956 Suez
war to $2.08/B and eventually returned to $1.90/B in 1959. Prices remained at
this level until 1971 when they rose to $2.18/B. The stability of these prices,
which remained steady in spite of the increase in oil demand during the sixties, is
an indication of the monopolistic power of the majors. However, between 1973
and 1978 OPEC had power over oil prices. OPEC and Saudi Arabia’s shares in
the market were high enough to enable them to have some influence in oil prices
on 1973-1978 when oil prices were fixed by OPEC.
Between 1974 and 1978 world demand for oil was fluctuating; it declined
in 1975 by 1.2 MMBD, while the demand for OPEC and Saudi crude declined
by 3.6 and 1.4 MMBD respectively in 1975. This, as discussed above, resulted
from the decline in demand caused by the recession at that time and the increase in

13
non-OPEC supply. However, oil prices were stable with an average of $11.58/B
due to the inelasticity of the supply curve, even with fluctuating demand prices
should have more fluctuation in the short-run. In 1978, although the world
demand for oil increased, the demand for OPEC and Saudi Arabian oil declined.
However, the price for oil stayed at $12.7/B and the requirements from OPEC
and Saudi Arabia declined in response to the higher official prices.
The competitive model would necessitate (in the short-run) a decline in
prices as a result of decreasing demand during some of the period 1979-1981.
However despite that, spot prices were running higher than official prices (see
Table. 3 and Figure 2, Figure 4)). The competitive model explains this spot price
behaviour as being due to supply uncertainty resulting from political events and
the scramble of consumers which bid prices up. But during the following period
from 1982-1985, by sticking to official prices and lowering its production to
defend such prices, Saudi Arabia kept spot prices ranging closer to the official.
Had Saudi Arabia abandoned volume control and followed the spot market, prices
might have deteriorated to much lower level. The experience of 1986 testifies to
this. When Saudi Arabia chose the competitive solution, prices dropped to less
than $10/B following the introduction of netback pricing and the beginning of
market-related prices. When OPEC, under the leadership of Saudi Arabia,
decided to cut back its production and reinstate the quota system prices went
back to $17/B. Therefore, the only time the market was competitive, was in
14
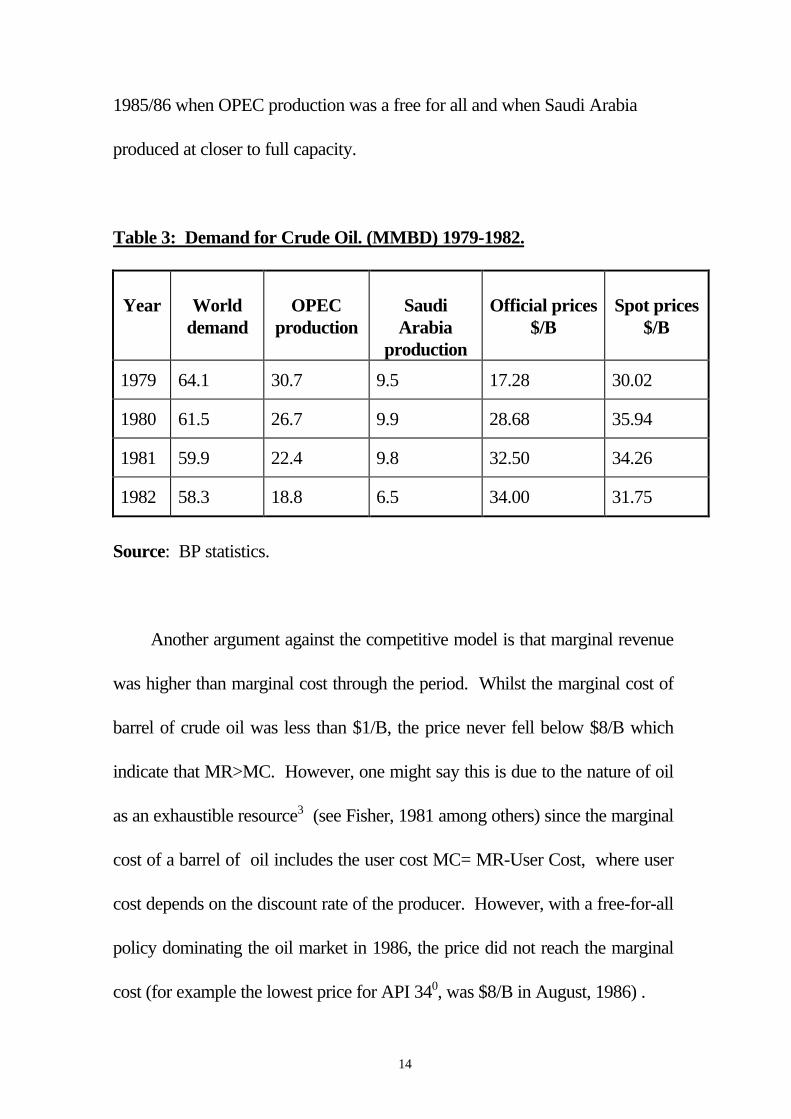
1985/86 when OPEC production was a free for all and when Saudi Arabia
produced at closer to full capacity.
Table 3: Demand for Crude Oil. (MMBD) 1979-1982.
Year Worlddemand
OPECproduction
SaudiArabia
production
Official prices$/B
Spot prices$/B
1979 64.1 30.7 9.5 17.28 30.02
1980 61.5 26.7 9.9 28.68 35.94
1981 59.9 22.4 9.8 32.50 34.26
1982 58.3 18.8 6.5 34.00 31.75
Source: BP statistics.
Another argument against the competitive model is that marginal revenue
was higher than marginal cost through the period. Whilst the marginal cost of
barrel of crude oil was less than $1/B, the price never fell below $8/B which
indicate that MR>MC. However, one might say this is due to the nature of oil
as an exhaustible resource3 (see Fisher, 1981 among others) since the marginal
cost of a barrel of oil includes the user cost MC= MR-User Cost, where user
cost depends on the discount rate of the producer. However, with a free-for-all
policy dominating the oil market in 1986, the price did not reach the marginal
cost (for example the lowest price for API 340, was $8/B in August, 1986) .
15
This history indicates that Saudi Arabia has influenced the oil market
since 1974 through different means, including insisting on moderate price
increases, and using its output capabilities to influence the market outcome.
The Doha 1976 price split, the utilisation of excess capacity in the 1978-1980
period to fill the shortfall of Iraqi and Iranian disruptions, the output response in
the second Gulf crisis and the production restraint throughout the period 1987-
1997 are all examples of the extent of the influence that Saudi Arabia has
exercised in the world oil market.
3 MODELS THAT ADDRESS SAUDI ARABIA’S ROLE
On 16 October 1973, OPEC Gulf producers decided to set the price unilaterally
from $3.011/B to $5.119/B. When that was followed in December 1973 by
another unilateral increase to $11.621/B by all OPEC members (Seymour, 1980),
the description of OPEC as a cartel was introduced to the literature. An important
aspect of OPEC relates to the role, the objective and the policies of Saudi Arabia.
Given the size of its proven reserves and large share in world oil production and
exports, the importance of the Saudi role was discussed in several studies in the
early seventies. Mabro (1975) indicated that “OPEC is Saudi Arabia” while
several studies of OPEC have treated Saudi Arabia separately and pointed to its
importance as a cartel member. (for example Stevens, 1982).
16
OPEC has been described as a cartel able to raise prices through co-
operation in reducing the quantity of the commodity supplied, causing prices to
exceed the marginal cost. These models assume that the oil market is dominated
by cartel whose members co-operate in order to maximise their joint profits.
Producers in this model take into consideration the responses to their policies of
both consumers and non-cartel producers. Where other models are used, there
are several variants: the two-block cartel, the dominant producer model with
Saudi Arabia as a swing producer and the market-sharing cartel.
3.1 OPEC as a Cartel with Different Groups
Since there are differences among OPEC members with respect to production and
pricing policies, OPEC can be divided into different groups according to their
financial needs, absorptive capacities, costs of extraction, and the size of reserve.
Two-Block Cartel: Hnyilicza and Pindyck (1976) considered OPEC as a two-part
cartel where members are divided into two groups according to their immediate
financial needs. The "savers" group consists of Saudi Arabia, Kuwait, UAE,
Qatar, Libya, and Iraq, and the "spenders" group consists of all other members.
Because of the limited domestic absorptive capacity of the first group, they would
have a low discount rate and the spenders have a high discount rate. The objective
function for the saver group is to maximise:

17
Max Wr
Pm
RQp
t
T
t tt 111
1
1
11
1=
+−
=∑ ( )
[ ] 8
while the objective function for the spenders group is
Max Wr
Pm
RQp
t
T
t tt 221
2
2
21
1=
+−
=∑ ( )
[ ] 9
the discount rate of the first group being smaller than the discount rate of the
second group r1 < r2. The output level for each group is determined by a division of
total cartel production, Qt1 = βt Qt, here βt is the share of the savers in the total
OPEC production and the second group's output Qt2 =(1-βt) Qt where 0< βt <1.
The depletion of reserve levels for each group is equal to Rt = Rt-1 -Qt
For OPEC, the weighted sum of the two objectives is as follows
MaxW W W= + −α α1 21( ) 10
Using the above equations, Hnyilicza and Pindyck, solving the optimisation
solution for the two groups, showed that the optimal price trajectory is quite
different from that in the monopolistic solution. The price path would depend on
the value which is determined through the use of the Nash solution and depends on
the negotiated agreement between the two groups. If the share is fixed, OPEC will
choose that of the monopolistic price. The model suggests that spender countries
would produce first because of the high discount rate, while the savers will
produce last.

18
In this model Saudi Arabia is a member of the saver group which means that
would co-operate with Kuwait, UAE, Qatar, Libya and Iraq in order to maximise
the group profit. To be a member of the saver group Saudi Arabia has to have a
limited domestic absorptive capacity, large surplus and hence, low discount rate.
The model suggests the use of Nash bargaining between the two groups and the
spender group should produce first which means that Saudi Arabia and other
members of the saver group should wait until the resources run out before they
produce, Hnyilicza and Pindyck assumed that a fixed share of total production
and bargaining between the two groups should relate to the overall production of
OPEC. Thus, according to this model Saudi Arabia would have a certain
percentage of agreed production, which should be low enough to allow the
spenders to produce enough to maximise their profit. Saudi Arabia should also be
in full co-operation with the saver group.
In respect of pricing and production decisions from Libya, and Iraq
(Doha’s two tier prices and 1979/81 price increase where Saudi Arabia was
joined only by the UAE) and differs in respect of pricing, to all other members
of OPEC. Its production at certain periods was at full capacity while others
were charging prices as high as the market would permit. Furthermore, from
the history of the dispute between Saudi Arabia and some members of the
saver group, most notably Libya and Iraq, full co-operation between members
was unlikely. However, between 1983 and 1985, Saudi Arabia co-operated
19
with the other members and this led to a decline in its oil production and
revenue. Thus ultimately in 1985, it abandoned its position as the swing
producer.
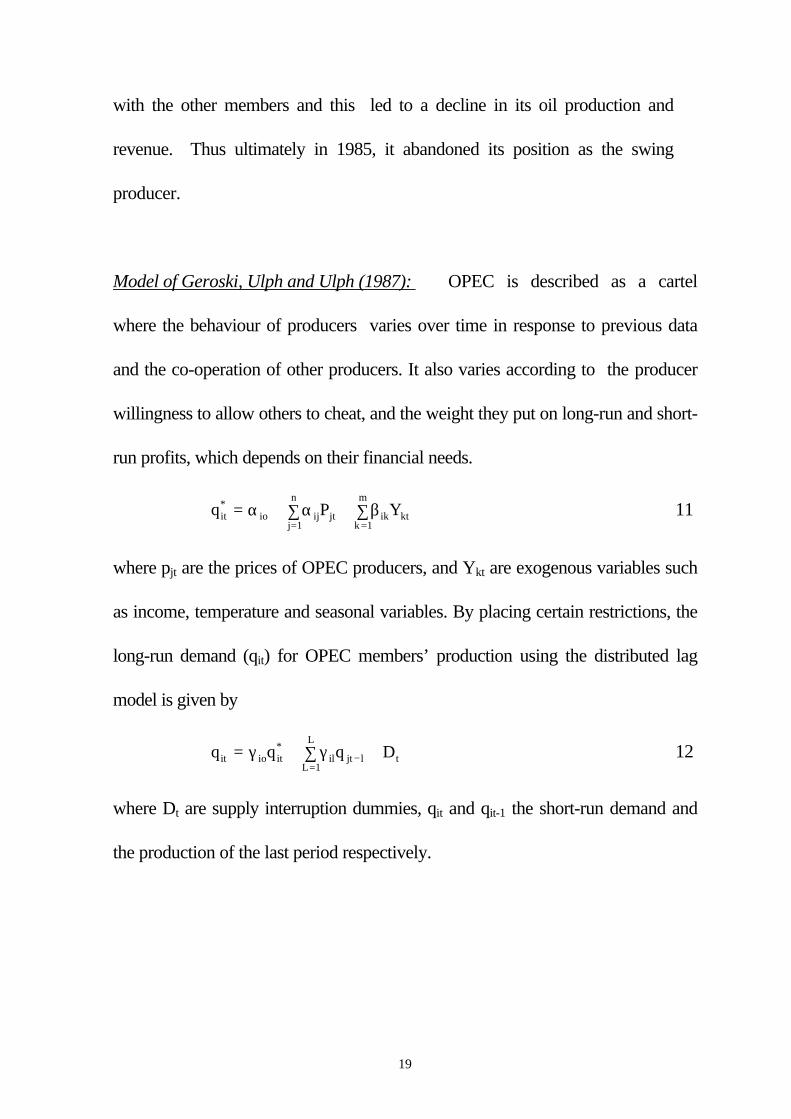
Model of Geroski, Ulph and Ulph (1987): OPEC is described as a cartel
where the behaviour of producers varies over time in response to previous data
and the co-operation of other producers. It also varies according to the producer
willingness to allow others to cheat, and the weight they put on long-run and short-
run profits, which depends on their financial needs.
q P Yit io ijj
n
jt ikk
m
kt∗
= == + ∑ + ∑α α β
1 1 11
where pjt are the prices of OPEC producers, and Ykt are exogenous variables such
as income, temperature and seasonal variables. By placing certain restrictions, the
long-run demand (qit) for OPEC members’ production using the distributed lag
model is given by
q q q Dit io it ilL
L
jt l t= + ∑ +∗
=−γ γ
1 12
where Dt are supply interruption dummies, qit and qit-1 the short-run demand and
the production of the last period respectively.

20
With the above two equations and, with Ci being the unit costs of
production which are assumed to be constant the ith producers long-run and short-
run profits are
iS
l i iP C q∏ = −( ) , iL
l i iP C q∏ = − ∗( ) 13
Thus, the objective function where the producers follow a Nash equilibrium is to
maximise V(P) and is given by
V P P P Pt t i ti
L
i ti
S
tj
L
j( ) ( ) ( ) ( ) ( )= ∏ + − ∏ + ∏∑
=δ δ θ1
1 14
where Pt = (P1t ..Pnt), is the vector of prices. The equation reflects the varying
conduct of the producer i, where δ is the weight the i producer puts on long-run
profit and (1-δ)i is the weight it puts on other short-run-profits, θ the value of
which reflects the degree of co-operation. It is the weight producer I attaches to
the long-run profits of other producer. If θ=0 it indicates non-co-operative
equilibrium which depends on the i producer's excess capacity, while the
coefficient δ depends on the financial needs of producers. The need for short-term
profits would lower the value of δ, raising the non-co-operative behaviour.
By dividing the ten major OPEC producers into four groups, (fringe, high
absorbers, low absorbers and Saudi Arabia) and using quarterly data for the period
1966-1981, Geroski et. al, estimated the model in two stages. First, by estimating
the demand parameters and then by imposing these parameters on the first order

21
conditions to maximise profits, they concluded that the member countries' conduct
varies over time.
Al-Roomy (1987) extended the model of Geroski, Ulph and Ulph by trying to
model the complete world oil market. He studied the interaction between OPEC
and major non-OPEC producers, using monthly data for the period 1974-84. Al-
Roomy grouped producers of oil into four groups; Saudi Arabia, the Gulf, African
producers, and the fringe. He also used θ as the only source of variation in the
behaviour of each country's financial needs. While Geroski et. al. assumed cost as
constant, Al-Roomy took into account various estimates of production costs. By
using monthly data, he tested the model and concluded that price movements
cannot be explained solely by conventional supply and demand features.
In the Geroski, Ulph and Ulph model and the Al-Roomy model, in edition
to the same criticism that was discussed above for the division of OPEC producers
into four groups (fringe, high absorbers (African producers), low absorbers (Gulf
producers) and Saudi Arabia). the GUU model used events of the market to build
the model. The problem with this approach is that models should explain the
changes in the market, while GUU use the events to implement the model.
22
3.2 The Dominant Producer Model with Saudi Arabia as Swing Producer
OPEC as a monolithic cartel is capable of setting the price that maximises its
discounted profits. In the long-run, if the price was high enough to provide a
positive economic profit to the fringe competitors, oil would be discovered
elsewhere and alternative energy forms would be developed. According to
Seymour (1990) the higher price levels increased the pace of oil development in
established fields, such as the North Sea, encouraged discoveries of new fields,
and made the high cost fields more profitable. Under these conditions, the demand
for OPEC oil would decline. Therefore, in order to maintain the monopolistic
price, the output of the cartel must be restricted through the allocation of output
quotas among its members. Some models attribute the cartel's stability to some
members acting as swing producers in order to keep OPEC's output at a certain
level. The swing producer role was borne by the producer with large revenues and
limited absorptive capacity.
Griffin and Teece (1982) described Saudi Arabia as the swing producer or the
balance wheel absorbing demand and supply fluctuations in order to maintain the
monopoly price. They stated that the monopoly price and the stability of OPEC
depends more on how much Saudi Arabia's share satisfies its objective, than on the
cartel's cohesion. According to this model, Saudi Arabia would choose the price
23
path when maximises its wealth over time taking into account the reaction of the
fringe.
Adelman (1982) described OPEC as a loosely co-operating oligopoly-cartel or a
residual-firm monopolist, that lets everybody else maximise profits individually by
choosing their own production levels while the cartel raises prices by restricting
output. OPEC chooses its own production, to maintain the cartel price and Saudi
Arabia acts as the swing producer. Adelman gave an example of output restriction
in 1975, when Saudi Arabia reduced its production from an average of 8479.7
Thousands Barrel per Day in 1974 to an average of 7075.4 Thousands Barrel per
Day in 1975 in order to maintain the price of oil at the monopolistic level.
Mabro (1975, 1986 , 1988, 1991) like Adelman, but from a different perspective,
draws attention to the important role of Saudi Arabia in OPEC. He applied the
dominant producer theory to the oil market and noted that OPEC is a cartel with
Saudi Arabia acting as a Stackelberg price leader. In the seventies, OPEC
determined the price of Arabian Light as a reference, and the members of OPEC
then set the price of their oil, selling as much as they wanted, while Saudi Arabia
was able to maintain its role as the residual supplier because of its relatively lower
absorptive capacity. However, the expansion of non-OPEC supply in the eighties
caused the demand for OPEC oil to decline, and when this demand was less than

24
the aggregate volume which could be produced, excess capacity increased,
causing difficulties in maintaining prices. According to Mabro, OPEC's ability to
survive was more apparent in the eighties (when demand for its oil was shrinking
and the organisation started allocating output under a quota system in 1982) than
in the seventies.
In explaining the causes of the 1986 oil price collapse, Al-Moneef (1987),
saw it as a result of Saudi Arabia abandoning the swing producer role when it
became less rewarding. This was as a result of the structural changes in world oil
demand and non-OPEC supply, reducing OPEC's market share and that of Saudi
Arabia, thus undermining the effectiveness of the residual role of OPEC and the
swing role of Saudi Arabia. Cremer and Salehi-Isfahni (1991) in their review of
world oil market models, analysed the role of Saudi Arabia as the dominant firm.
Saudi Arabia has significant market power in the short-run, but in the long-run the
influence of Saudi production is small because world demand and supply of the
fringe is more elastic.
Askari (1991) reviewed Saudi Arabia’s oil policy in a different period when as a
major player of OPEC between 1973 and 1978, it supported the organisation,
but, at the same time was reluctant to see the price of oil rise high enough to cause
any damage to the world economy. During the period 1978-1981 Saudi Arabia
increased its output to the maximum sustainable capacity to prevent price

25
increases as a result of economic and political factors, to avoid further shocks to
the world economy and to keep low prices for its long-term interest. From 1982-
1985 Saudi Arabia continued to act as a swing producer to maintain OPEC price
levels producing below its capacity for four years. By 1985, a long and costly
period of production cutbacks resulted in the need for short-term revenue.
4 OTHER MODELS OF OPEC BEHAVIOUR
In this section we will explore alternative approaches to explain the behaviour of
OPEC members, paying particular attention to Saudi Arabia. Such models fall
within these categories: the property rights model, the fiscal constraint model and
the target utilisation model.
4.1 Property Rights Model
This model involves the effects of the transfer of ownership from international oil
companies to the governments of the oil-exporting countries. The high discount
rate employed by companies which led them to excessive production, was
transformed through the change in property rights to lower rates by the
governments who favoured lower production to account for exhaustibility.
Johany (1978, 1980), adopted the property rights model to explain the oil price
increase of 1973-74. Johany argued that the sharp increase in the market price of

26
oil that followed the October 1973 Arab Israeli War, was not because OPEC had
become an effective cartel capable of reducing output to raise prices. Rather, it
was the result of a shift towards price setting by the oil producers instead of
through negotiations with the oil companies, as had been the practice before
October 1973. The role of the oil companies was reduced essentially to that of
contractors, and because OPEC countries have a lower discount rate than the
companies' effective discount rate, their oil output since 1973 has been lower than
what it would have been if the companies were still the owners of crude, which
would have led to higher oil prices.
The property rights model assumes that when the ownership of oil
companies transferred from the company to the government of the producing
countries, the discount rate dropped because the time horizon for the
concessionaires is limited as compared with an oil producing government. For
Saudi Arabia, the changes in ownership started with the participation
agreement signed in 1972 and its influence on the production of the oil
company in the following year. By 1980,4 Aramco was totally owned by the
government. The gradual transfer of ownership between 1972 and 1981 and
its effect on Saudi Arabia’s production and pricing of oil should be analysed to
see if the changes in rate of production had any relation to the percentage of
government equity.

27
Table 4: The Average Percentage Change for Saudi Oil Production from 1969-1996
Year Production %change
1969 3216.21970 3799.1 18.11971 4768.9 25.51972 6016.3 26.21973 7596.2 26.31974 8479.7 11.6
Aver 1969-1974 =22%
1975 7075.4 -0.171976 8577.2 +0.1751977 9199.9 +0.071978 8301.1 - 0.101979 9532.6 +0.151980 9900.5 +0.04
Aver. 1974-1980=+09.7%
1981 9808.0 -0.341982 6483.0 -0.301983 4539.4 -0.301984 4079.1 -0.101985 3175.0 -0.22
Aver. 1981-1985=-25.2%
1986 4784.2 +0.511987 3975.2 +0.281988 5083.5 -0.0031989 5064.5 +0.271990 6412.5 -0.271991 8117.8 +0.031992 8331.7 +0.031993 8047.7 -0.031994 8049.0 -0.001995 8000.0 -0.011996 8000.0 0.00
aver. 1988-1996=+00.1%
Source: OPEC Statistical Bulletin
28
In this model, Saudi Arabia has a lower discount rate, since it has a
longer horizon for production. Accordingly, production would fall, thereby
driving up the world price. Production of Saudi Arabia and its rate of change
in output level between 1969 and 1996 are shown in Table. 4.
The table shows that production increased by an average of 22%
annually during the 1969-1973 period. During the period of government
control (1975-1980), the rate of change of Saudi Arabian output averaged 9%.
The swing producer period (1981-1985) production changes averaged at a rate
of -25.2%. While the period of flexible price volume control of 1988-1996
averaged a rate of production change of 0.1%.
The rate of change in production between 1969 and 1974, could be
explained by the desire of Saudi Arabia for nationalisation,5 and the change in
power of decisions over production in 1974 from the company to the
government. From 1981 to 1985 the rate of change in production become
negative. From 1988 to 1996 it averaged 0.1%. Thus, this approach explains
one event, the changes in the rate of production between 1969 to 1974, when
the four owners of Aramco had a short horizon in controlling oil production in
Saudi Arabia6. However, it has little relevance to later history.
Moreover, while the theory partly explains the price increase in 1973, it
does not explain the decline in prices during the eighties. According to the
theory, following the 1979/80 price rise (due to a short-run of supply

29
constraints) it would return to its initial level and then gradually increase.
However, in real terms the price of oil fell lower in real terms than it had done
in the sixties.
4.2 Target Capacity -Utilisation Model (TCU)
There are two assumptions on which the target capacity-utilisation models are
based: First, OPEC is the residual supplier of the world oil market; Second,
OPEC prices are influenced by the gap between its current capacity utilisation
and some target level of capacity-utilisation.
The TCU model relates the production of OPEC to the rate of capacity-
utilisation, which is measured as the production level divided by the production
capacity level. Those who have tested the model previously found that prices
would increase dramatically at high capacity-utilisation and decrease slowly at
low rates of utilisation.
According to this view, OPEC attempts to maintain capacity-utilisation
near a target level. If capacity-utilisation rises above the target then high
demand stimulates OPEC price increases. The price increase will subsequently
lower demand and reduce capacity-utilisation down to the target. If capacity-
utilisation falls below the target, then OPEC uses price reductions to stimulate
demand and increase utilisation, until the target is reached. The target-capacity
pricing model was used for OPEC by the US Department of Energy’s Energy
Information Administration (DOEEIA) where they used regression analysis

30
between annual percentage changes in real prices and OPEC capacity
utilisation to forecast the price of oil.
To evaluate the ability of a target-capacity rule to satisfy OPEC's
objective, Steven Suranovic (1993), defined capacity-utilisation, CUt as
CUS
MAXCAPttopec
t
= 15
where Sopec is OPEC supply at time t and MAXCAPt is OPEC maximum
sustainable capacity given exogenously. The relationship between the rate of
change of the world oil price and capacity is given by:
P P
Pa
b
CUt −
= +−
−1
1 1 16
Stephen Powel (1990) used the historical behaviour of the world oil market by
plotting the annual percentage change in price and capacity utilisation. He
concluded that there is a relationship between the high capacity utilisation and
price increases, and low capacity utilisation and price decreases, but he was
critical of its continued use for forecasting after 1985.
Powel (1990) and Porter (1992) have been critical of the TCU because
the deteriorating empirical basis of the statistical relationship after 1985
diminished its predictive value. Gately (1995) criticised the TCU model
because of the shift of Saudi Arabia and other OPEC producers towards
production ceilings and quotas. To apply this mode to Saudi Arabia we need to
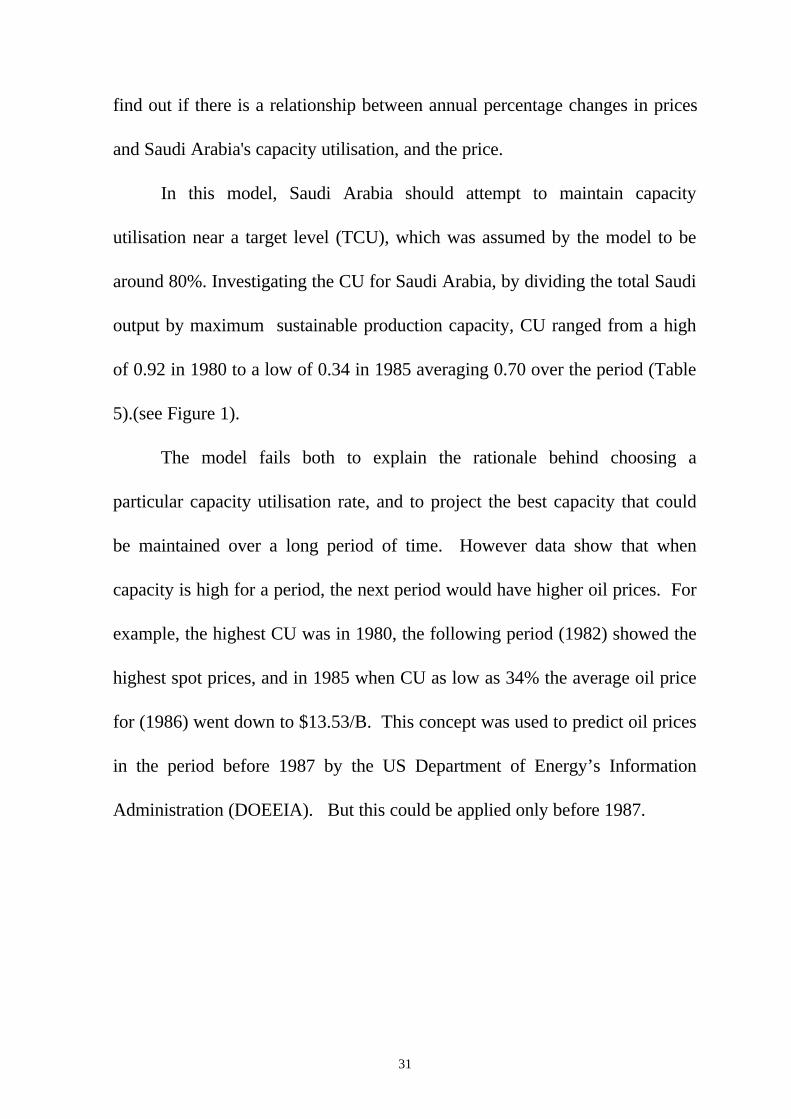
31
find out if there is a relationship between annual percentage changes in prices
and Saudi Arabia's capacity utilisation, and the price.
In this model, Saudi Arabia should attempt to maintain capacity
utilisation near a target level (TCU), which was assumed by the model to be
around 80%. Investigating the CU for Saudi Arabia, by dividing the total Saudi
output by maximum sustainable production capacity, CU ranged from a high
of 0.92 in 1980 to a low of 0.34 in 1985 averaging 0.70 over the period (Table
5).(see Figure 1).
The model fails both to explain the rationale behind choosing a
particular capacity utilisation rate, and to project the best capacity that could
be maintained over a long period of time. However data show that when
capacity is high for a period, the next period would have higher oil prices. For
example, the highest CU was in 1980, the following period (1982) showed the
highest spot prices, and in 1985 when CU as low as 34% the average oil price
for (1986) went down to $13.53/B. This concept was used to predict oil prices
in the period before 1987 by the US Department of Energy’s Information
Administration (DOEEIA). But this could be applied only before 1987.

Table 5 Arabia (1976-1993)
Yearcity
Product- CU Price Capa-city -ion
CU
1976 10790 8577.2 0.79 11.51 1987 8800 3975.2 0.45 17.73
1977 11840 9199.9 0.78 12.40 1988 7750 5083.5 0.58 14.24
1978 11840 8301.1 0.70 12.70 1989 7250 5064.5 0.69 17.31
1979 11840 9532.6 0.92 17.28 1990 7750 6412.5 0.82 22.26
1980 10800 9900.5 0.92 28.67 1991 9150 8117.8 0.88 18.62
1981 11300 9808.0 0.87 32.50 1992 8675 8331.7 0.91 18.44
1982 11700 6483.0 0.55 32.38 1993 9000 8047.7 0.89 16.33
1983 11300 4539.4 0.40 29.04 1994 9500 8049.0 0.85 15.53
1984 11300 4079.0 0.36 28.20 1995 10000 8000.0 0.80 17.18
1985 9300 3175.0 0.34 27.01 1996 10000 8000.0 0.80 19.81
1986 8800 4784.2 0.54 13.53 1997 10300
Source: OPEC Secretariat.

Figure 1 Saudi Arabia's Crude Oil Production and Sustainable OilProduction Capacity (1976-1994)
0
2000
4000
6000
8000
10000
1200019
76
1977
1978
1979
1980
1981
1982
1983
1984
1985
1986
1987
1988
1989
1990
1991
1992
1993
1994
Th
ou
san
ds
Bar
rel p
er D
ay
Capacity Production
year
4.3 The Fiscal Constraint Model
In the model espoused by Ezzati (1976,1978) and Cremer and Salehi-Isfahani
(1980), OPEC member countries are developing nations, some with limited
absorptive capacity. It is expected that when oil revenues become large in
comparison to the country's needs, output levels would be restricted to decrease
the oil revenue and force it to come in line with the country's needs. However,
others such as Adelman (1993) found that with low oil prices and given countries’
financial needs some members of OPEC tried to increase their production level to
cover their economic needs.
34
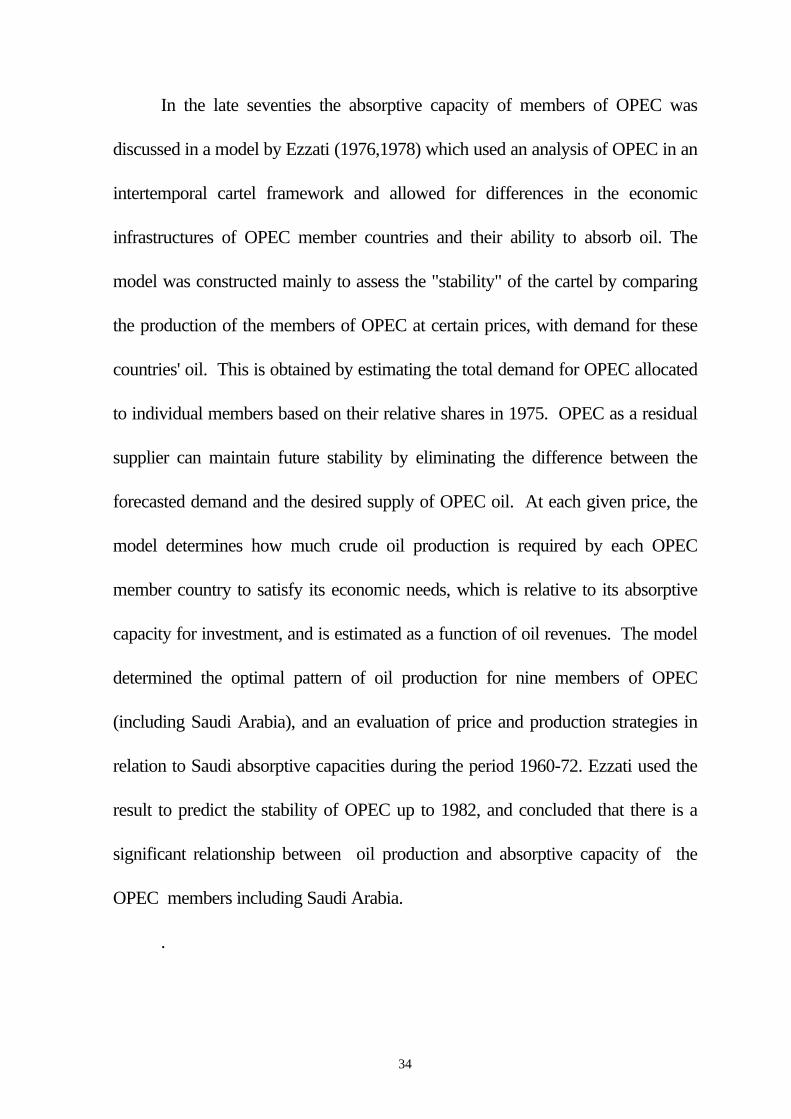
In the late seventies the absorptive capacity of members of OPEC was
discussed in a model by Ezzati (1976,1978) which used an analysis of OPEC in an
intertemporal cartel framework and allowed for differences in the economic
infrastructures of OPEC member countries and their ability to absorb oil. The
model was constructed mainly to assess the "stability" of the cartel by comparing
the production of the members of OPEC at certain prices, with demand for these
countries' oil. This is obtained by estimating the total demand for OPEC allocated
to individual members based on their relative shares in 1975. OPEC as a residual
supplier can maintain future stability by eliminating the difference between the
forecasted demand and the desired supply of OPEC oil. At each given price, the
model determines how much crude oil production is required by each OPEC
member country to satisfy its economic needs, which is relative to its absorptive
capacity for investment, and is estimated as a function of oil revenues. The model
determined the optimal pattern of oil production for nine members of OPEC
(including Saudi Arabia), and an evaluation of price and production strategies in
relation to Saudi absorptive capacities during the period 1960-72. Ezzati used the
result to predict the stability of OPEC up to 1982, and concluded that there is a
significant relationship between oil production and absorptive capacity of the
OPEC members including Saudi Arabia.
.

35
Following Ezzati, Cremer and Salehi-Isfahani (1980), argued that oil
revenue needs depended on the economic ability of the producing country to
absorb investment. Rather than analysing OPEC as a cartel like Ezzati, their
analysis of the oil market was in a competitive framework showing that the supply
curve of oil is backward bending. Production would decline in response to rising
oil prices and would increase in response to lower oil prices, in order to equate oil
revenues with investment needs, creating what is known as a “backward bending
supply curve.” According to this model, OPEC members have no incentive to
increase production when the price is high and vice versa. Thus oil revenues are
determined by internal investment needs which are constrained by the economy's
ability to absorb targeted investment. If Iit* represents investment needs, and qit is
the production of an OPEC member, then according to the model, I*it should be
equal to the target revenue.
P q It it it= * 17
Investment needs and oil prices are exogenous to the producer, so the quantity
produced takes the form:
ln ln ln *q P Iit i i t i it iy= + + +α γ γ ε1 2 18
Increase in investment needs would result in an increase in production; but for a
given price coefficient, γ , it would be negative.

36
Adelman (1993) argued that the objective of OPEC members is to
maximise their revenue. He said that OPEC is a cartel whose members co-operate
to set the price that covers their revenue needs. OPEC uses its monopolistic power
to gain the high revenue needed by member governments. Accordingly, Saudi
Arabia co-operates with other members of OPEC to raise its revenue by restricting
output either by using the dominant firm model or by co-operation with other
members in determining output.
Linderoth (1992), using data covering public revenues and expenditure plus
the balance of payments, tested the target revenue theory and concluded that Saudi
Arabia was on the backward sloping part of the supply curve only for a very short
time after the first and second oil shocks.
Evaluating the actual performance of Saudi Arabia in the market, we can
say that it differs from other OPEC members in that it has a huge reserve, and can
influence the price more than countries with a small reserve and little spare
capacity. Such countries will sell their oil at any price while Saudi Arabia is
interested in maximising the value of its oil revenue.

37
Table 6: Saudi Arabia’s GDP in Saudi Riyal 1974-1996
Year GDP real(Billion Saudi
Riyal)
GDPnominal(BillionSaudiRiyal
CurrentAccountBillionSaudiRiyal
Oil Price$/B
SaudiArabia
productionThousands
B/D
1974 31.7 139.60 81990.00 11.58 8479.7
1975 34.7 164.50 50336.00 11.54 7075.4
1976 39.7 205.10 50414.00 11.51 8577.2
1977 42.0 225.40 41971.00 12.40 9199.9
1978 44.8 249.50 -7528.00 12.70 8301.1
1979 49.4 385.80 40416.00 17.28 9532.6
1980 53.3 520.60 142240.00 28.67 9900.5
1981 54.2 524.70 139123.00 32.50 9808.0
1982 48.3 415.20 25955.00 32.38 6483.0
1983 48.3 372.00 -58216.00 29.04 4539.4
1984 47.2 351.40 -64845.00 28.20 4079.1
1985 45.3 313.90 -46855.00 27.01 3175.0
1986 47.8 271.10 -43680.00 13.53 4784.2
1987 47.2 275.50 -36604.00 17.73 3975.2
1988 50.7 285.10 -27492.00 14.24 5083.5
1989 50.8 310.80 -35776.00 17.31 5064.5
1990 56.2 392.00 -15555.00 22.26 6412.5
1991 61.0 442.00 -103502.00
18.62 8117.8
1992 62.3 461.40 -66437.00 18.44 8331.7
1993 59.5 443.90 -64668.00 16.33 8047.7
1994 61.5 150.00 -30940.00 15.53 8049.0
1995 63.8 469.40 -19900.00 17.18 8000.0
1996 67.0 509.80 700.00 19.81 8000.0Source: OPEC secretariat and IMF.

38
In 1979, 1980, and 1981 Saudi Arabian oil revenue reached a high level
(see Table 6), and the excess revenue was invested abroad. In other years (1983-
1986), it produced less than needed for financial requirements and suffered budget
deficits. Saudi Arabia did not cut its production but increased it to 10 MMBD in
1980. The problem was that the financial absorptive capacity hypothesis did not
come up when production declined in 1982 and revenues declined below the
financial absorptive capacity requirement. In the case of Saudi Arabia, its
national development strategy required heavy expenditure, which led to rapidly
increasing domestic investment opportunities, thereby raising the absorptive
capacity of the economy and its revenue requirements.
Furthermore, in dealing with its surplus funds during the period 1973-1981
Saudi Arabia invested part of it through the Saudi Arabian Monetary Agency
(SAMA) which placed part of this surplus in US treasury bills and notes and other
financial markets. Thus financial absorptive capacity did not deter countries from
producing at higher prices and accumulating funds. In addition, this contradicts
the model’s assumption that the oil-exporting countries would have no efficient
foreign investment opportunities (Bergendahl 1984).
Saudi Arabia cut its production twice (while the oil prices were high). The
first cut in 1975 was caused by the decline in oil consumption in the industrial
world as a result of economic recession. The second cut was in April 1979, and
various political reason. However, Saudi Arabia increased oil production to 10

39
MMBD a few months later. It lowered its production again in 1982 and 1983
owing to the low demand for OPEC crude.
Following the collapse of oil prices in 1986, Saudi Arabia increased its
production in order to increase its revenue. This caused its GDP to expand from
271 billion Riyals in 1986 to 455 billion Riyals in 1994. Hence, there was no
evidence to support the target revenue model for Saudi Arabia.
5 ECONOMETRIC TESTING
Econometric testing for the competitive model was done by Griffin (1985), using
the following equation to test a competitive model of OPEC behaviour :
ln lnq Pit it it t it= + +α γ ε 19
The result of the competitive model for Saudi Arabia is that the positive
coefficient (γ>0) on price is rejected, concluding that price (exogenously
determined) influences the decision of production for Saudi Arabia. But Griffin’s
study used OLS with no consideration of dynamics.
Griffin (1985) tested the model using the following equation, where under
the property right model production will be influenced by the percentage of
government controlled production:
ln q G= + +α δ ε 20

40
G is the percentage of production controlled by the government in the producing
country, with δ < 0. Griffin used annual data for the period 1971 to 1981, and
the result was not significant for Saudi Arabia. Griffin, also tested the target
revenue model using the following equation
ln ln ln *q P Iit i i t i it iy= + + +α γ γ ε1 2 21
where I* is the target investment. Griffin tested a restricted variant for the value
γi2=1, γi1 =- 1, which was rejected by ten members, including Saudi Arabia, for
whom investment data is available. On the other hand with the partially restricted
variant γi2<0 γi1>0 it was difficult to reject the hypothesis despite the lack of
evidence to support the theory even with the use of trended investment series.
Griffin used quarterly data for price and production for the period 1973.1 to
1983.3 in order to test different models of OPEC behaviour separately. The cartel
model was tested using the following equation:
ln ln lnq Q Pit io i itOO
i t it= + + +β β β ε1 2 22
where qit is the production of the ith member, Qit is the production of OPEC minus
the i member's production and p is the price. Using the OLS, Griffin concluded
that the production of Saudi Arabia varies with the production of others,
indicating the dominant firm models with Saudi Arabia acting as the market leader
which varies production inversely to the competitive output including the rest of
OPEC.
41
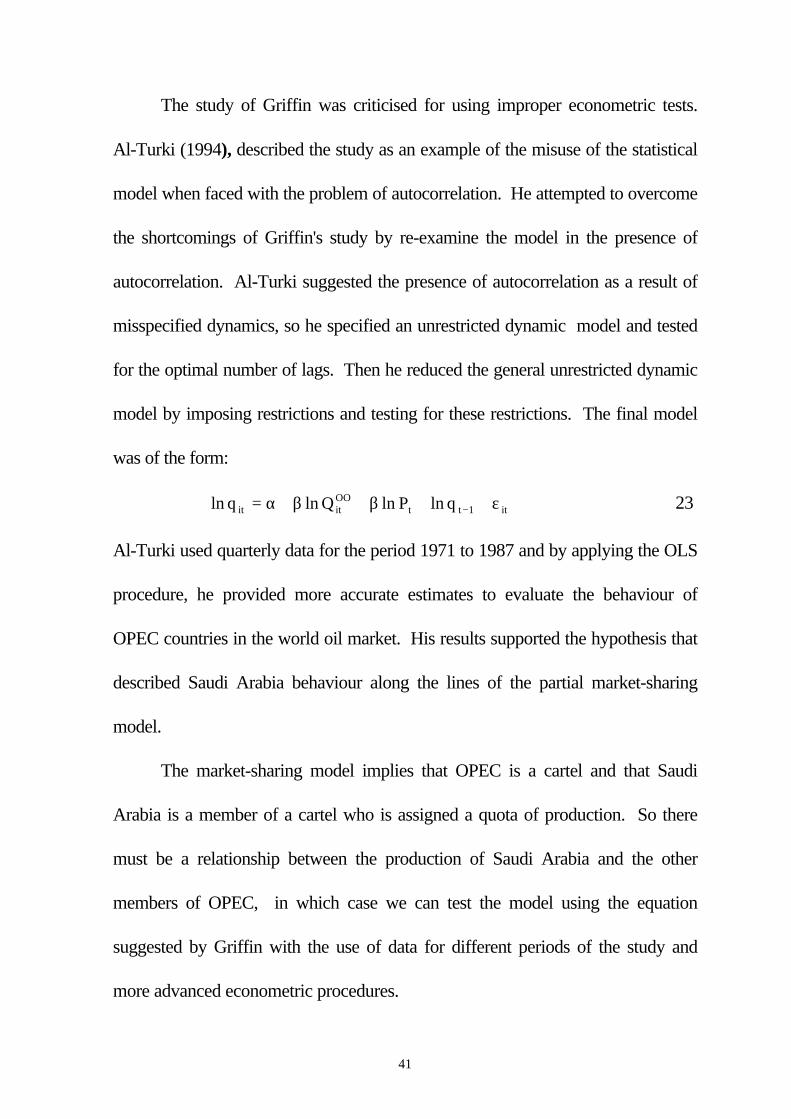
The study of Griffin was criticised for using improper econometric tests.
Al-Turki (1994), described the study as an example of the misuse of the statistical
model when faced with the problem of autocorrelation. He attempted to overcome
the shortcomings of Griffin's study by re-examine the model in the presence of
autocorrelation. Al-Turki suggested the presence of autocorrelation as a result of
misspecified dynamics, so he specified an unrestricted dynamic model and tested
for the optimal number of lags. Then he reduced the general unrestricted dynamic
model by imposing restrictions and testing for these restrictions. The final model
was of the form:
ln ln ln lnq Q P qit itOO
t t it= + + + +−α β β ε1 23
Al-Turki used quarterly data for the period 1971 to 1987 and by applying the OLS
procedure, he provided more accurate estimates to evaluate the behaviour of
OPEC countries in the world oil market. His results supported the hypothesis that
described Saudi Arabia behaviour along the lines of the partial market-sharing
model.
The market-sharing model implies that OPEC is a cartel and that Saudi
Arabia is a member of a cartel who is assigned a quota of production. So there
must be a relationship between the production of Saudi Arabia and the other
members of OPEC, in which case we can test the model using the equation
suggested by Griffin with the use of data for different periods of the study and
more advanced econometric procedures.

42
Salehi-Isfahani (1987), criticised the study for the use of misspecified
regression equations, at least for the target revenue model. He questioned Griffin's
interpretation of his results where he concluded that any increase in price would be
met with a decrease in production (restricted variant). Salehi-Isfahani suggested
the use of the expected price variable rather than actual ones. Using the same
model and data and allowing for expectations with a lagged price, Isfahani's results
supported the target-revenue model. Salehi-Isfahani used a dynamic model of
member countries of OPEC with high absorptive capacities, and with development
plans depending on oil revenues, to test for the oligopolistic model of the oil
market. The numerical results supported the hypothesis that there may be some
economic reasons to restrict oil output when prices rise to a certain level. He
described such reasons as low absorptive capacity, imperfect capital markets and
diminishing marginal utility of consumption.
Cremer and Salehi-Isfahani (1991), criticised Griffin's study for lack of
dynamic considerations made apparent by the presence of acute serial correlation.
They suggested including the long term expected price variable which would
solve the problem of the acute serial correlation.
Dahl and Yucel (1991) tested two variants of the target revenue model, the
strict and the weaker one for OPEC members using data for Saudi Arabia from
1971-87. The hypotheses of both variants were strongly rejected, but Dahl and
Yucel suggested including the investment in the general market model to be

43
tested for members of OPEC. Dahl and Yucel tested the swing producer model
using output co-ordination between members of OPEC and the total production of
OPEC, rejecting the hypothesis of co-ordination and concluding that Saudi
Arabia’s production doesn’t have any relationship with the production of others.
Dahl and Yucel used quarterly data for Saudi Arabia from 1971 to 1987.
Econometric testing for the swing producer model was undertaken by Griffin
and Neilson (1994), focusing on the strategies used by OPEC to generate cartel
profits over the period 1983-90. The result supported the hypothesis that OPEC
adopted a swing producer strategy from 1983-85. But when Saudi Arabia’s profit
fell below the level of Cournot profits in the summer of 1985, it abandoned the
role of swing producer, driving the prices to the Cournot level. According to
Griffin and Neilson, Saudi Arabia appears to have adopted a tit-for-tat strategy
designed to punish excessive cheating by other OPEC members.
For testing the swing producer model Griffin and Neilson used the
following:
Q Q Q QPASA
PAW
PANO
PAOO= − − 24
where PA denotes the price specified by OPEC. QW denotes world demand for
oil at price P, QNO denotes the supply of non-OPEC countries, and QOO denotes
the output of other OPEC countries. Fluctuations in Saudi Arabia’s output ( εSA)
should be positively related to demand shocks (εW) and negatively correlated
with non-OPEC and other OPEC supply shocks (εNO , εOO ) as follows:
44
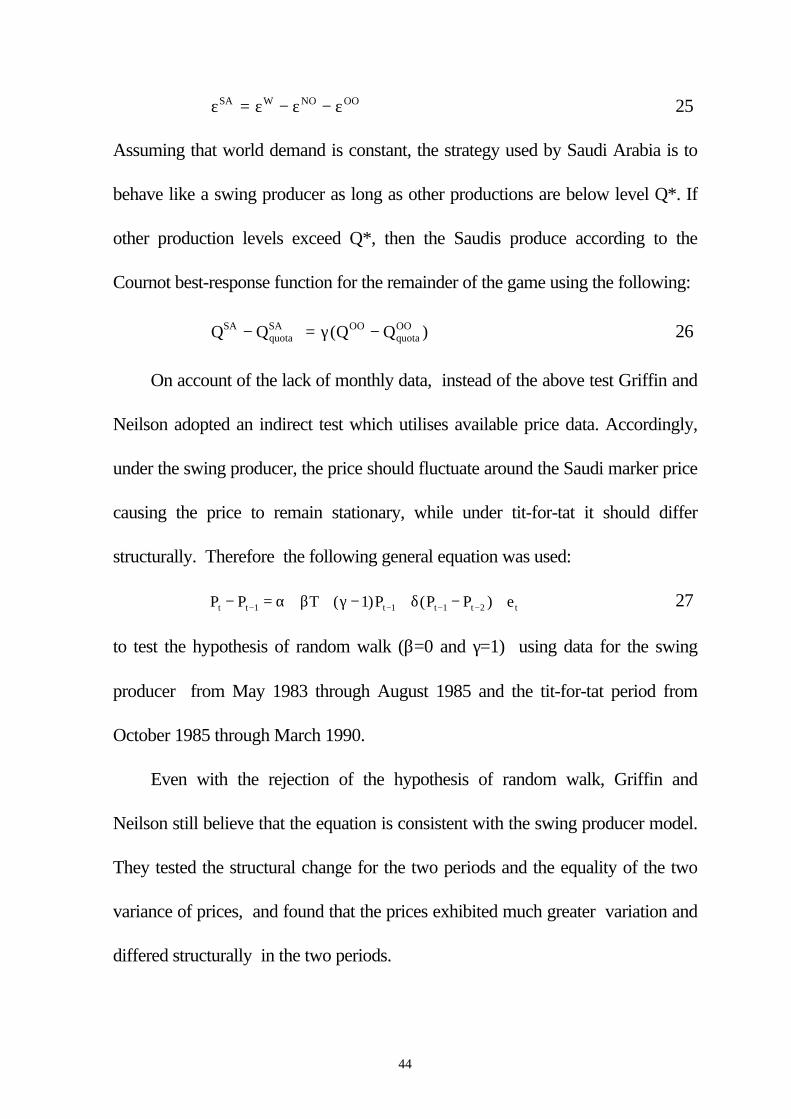
ε ε ε εSA W NO OO= − − 25
Assuming that world demand is constant, the strategy used by Saudi Arabia is to
behave like a swing producer as long as other productions are below level Q*. If
other production levels exceed Q*, then the Saudis produce according to the
Cournot best-response function for the remainder of the game using the following:
Q Q Q QSAquotaSA OO
quotaOO− = −γ ( ) 26
On account of the lack of monthly data, instead of the above test Griffin and
Neilson adopted an indirect test which utilises available price data. Accordingly,
under the swing producer, the price should fluctuate around the Saudi marker price
causing the price to remain stationary, while under tit-for-tat it should differ
structurally. Therefore the following general equation was used:
P P T P P P et t t t t t− = + + − + − +− − − −1 1 1 21α β γ δ( ) ( ) 27
to test the hypothesis of random walk (β=0 and γ=1) using data for the swing
producer from May 1983 through August 1985 and the tit-for-tat period from
October 1985 through March 1990.
Even with the rejection of the hypothesis of random walk, Griffin and
Neilson still believe that the equation is consistent with the swing producer model.
They tested the structural change for the two periods and the equality of the two
variance of prices, and found that the prices exhibited much greater variation and
differed structurally in the two periods.
45
Griffin and Neilson tested tit-for-tat. They used equation testing for the
punishment of cheating by Saudi Arabia to other members. So they added a non-
linear punishment for cheaters:
Q Q Q Q Q QSAquotaSA OO
quotaOO OO
quotaOO− = + − + −γ γ γ0 1 2
2( ) ( ) 28
The test shows that Saudi Arabia does not appear to react to low levels of
cheating and may absorb some minor cutbacks, but high levels of cheating evoke a
forceful response.
Gulen (1996) used monthly data for the thirteen OPEC members from 1965
to 1993. Using cointegration and causality tests for four different periods, 1965:1-
1993:2 (full sample), 1965:1-1973:9 and 1974:2-1993:2 and 1981:1-1993:2, he
compares the performance of OPEC before and after the first oil shock of 1973-74
to see whether the organisation has been successful in co-ordinating output among
its members since adopting the quota system in 1982. Gulen concluded that there
was co-ordination among the members during the output rationing era.
Al-Yousef (1994) used quarterly data from 1973:3-1993:3. to test the
market sharing model for all members of OPEC by using cointegration analysis
and Johansen procedures. It was found that members of OPEC differ in their
behaviour. Saudi Arabia behaviour was described as expanding market share since
its production changed by more than was proportionate to the production of other
members of OPEC. It also had a negative relationship with the price, which
indicated that Saudi Arabia’s production had some effect on the price of oil.
46
Gulen (1996) tested the cartel hypothesis for OPEC applying the same
relationship used by other tests. The relation between member’s production and
total OPEC production is:
Q Qit t t= α
Where Qit is the ith member’s production and Qt is the total OPEC
production at time t, and α is the production share of the ith members of the
cartel. Using Engle and Granger’s (1987) two-step cointegration tests,
between individual member production and total OPEC production, and testing
for different periods of the study using monthly data ((1965:1-1993:2) full
sample and 1965:1-1973:9 (before the oil shock ), 1974:2-1993:2 (after the
first oil shock) and 1982:1-1993:2 (the output rationing era)) Gulen concluded
that there was no-co-ordination between Saudi Arabia’s output and that of the
rest of OPEC. Gulen used Granger’s causality test to see if there was a
significant relationship between the production of OPEC and the oil price. He
also replaced the production of OPEC by Saudi Arabian production and
reached the same conclusion that there was no causal relation between OPEC
or Saudi Arabia’s output and the price of oil in either direction.
6 POLITICAL INTERPRETATION OF SAUDI ARABIA’S BEHAVIOUR
47
The above attempts have tried to explain the behaviour of OPEC members by
economic factors. In this section we to review the studies that tried to explain oil
policy by suggesting alternative political decision rules.
Saudi Arabia’s political and strategic importance has grown dramatically
with the increased reliance on Saudi oil by consuming countries. In the “Report
to the Congress of the United States explaining critical factors affecting Saudi
Arabia’s oil decisions” political and security factors, such as the peaceful
resolution of the Middle East conflict and the security of the country, were
discussed.
Stevens (1992) considered Saudi Arabia as the price setter in OPEC and the
objective of its pricing policy is crucial in understanding OPEC's behaviour. He
discussed reasons for Saudi Arabia's policy in pursuing moderately low prices:
The first is to keep a higher value on its huge reserve; second, is the influence of
the U.S.A on its oil policy. Stevens rejected this explanation on the grounds that
being on oil producer itself, the low oil prices would increase US dependence on
imported oil. Stevens also discussed the possibility of Saudi Arabia aiming for
higher oil prices, accommodate the other Arab oil-exporting countries, and to
cover its budget needs.
Doran (1977), recognised the different political reasons why members of
OPEC would adopt certain pricing strategies. For members with large petroleum
reserves, the long-term strategy is to increase oil prices slowly to minimise the

48
chance of the innovation of new energy sources and the processing of new
discoveries, and to reduce substitution possibilities.
Moran (1982) concentrated on Saudi Arabia as the largest member of
OPEC and explained the country's actions as a result of political factors more than
a result of optimising an economic model. Saudi Arabia has exercised price
leadership within the cartel to stabilise or moderate oil prices to achieve its
political objectives. Moran stated that “No economic calculation alone, such as the
strength and weakness of oil markets or the state of world economy, can account
for Saudi Arabia’s use of its petroleum base to shape the course of OPEC’s price
path. Insofar as Saudi Arabia has exercised price leadership within the cartel, the
decision to do so required a deeper dimension of policy-making which sprang
from Saudi political priorities.”
Quandt (1982). explained that long-term Saudi interests may dictate a
comparatively moderate pricing strategy, but uncertainties combined with a
cautious Saudi style of decision making, prevented the Kingdom from consistently
following such a long-term approach. In some circumstances, political pressure
from within the Arab world or from the OPEC members can influence Saudi oil
decisions for the short term.
Golub (1985) explained the pattern of Saudi Arabia’s behaviour in crises
and during what he calls routine periods. Saudi Arabia oil policy appears to be
determined by forces unrelated to long-term economic concerns but more related

49
to political factors. However, during routine periods, the profit motive is worthy of
attention.
7 CONCLUSION
Saudi Arabia has a vital role in meeting world petroleum needs because of its huge
oil reserves and productive capacity and the flexibility to increase or decrease oil
production. Its decisions on oil production and prices have been an important
factor in providing the world oil supplies. From the previous survey of the
literature and evaluation of the models, we can conclude that the two models that
would best describe the behaviour of Saudi Arabia are the swing producer model
and the market-sharing model.

50
REFERENCES
Adelman, M. (1976), ‘The World Oil Cartel: Scarcity Economics, andPolitics’, Quarterly Review of Economics & Business. Also, in. TheEconomics of Petroleum Supply”, papers by M. Adelman 1962-1993, M.Adelman (1993). The MIT Press.
Adelman, M. (1982), ‘OPEC as a Cartel’, In J. M. Griffin and D.J. Teece,OPEC Behaviour and World Oil Prices, London: George Allen & Unwin,pp.37-63.
Adelman, M. (1986), ‘Oil Producing Countries’ Discount Rates’, Resourcesand Energy 8: pp. 309-329.
Adelman, M. (1986), ‘The Competitive Floor to Oil Prices’, The Energy Journal.7(4): pp.
Adelman, M. (1992), ‘Modelling World Oil Supply’, The Energy Journal ,14: pp.1-31
Adelman, M.. (1993), The Economics of Petroleum Supply, Papers by M.A.Adelman 1962-1993, The MIT Press. Cambridge, Mass. US.
Adelman, M. (1995), The Genie out of the Bottle. World Oil since 1970, TheMIT Press. Cambridge, Mass. US.
Al-Moneef, M. (1987), ‘Falling Oil Prices: Causes Instruments andConsequences’, Presented in Kuwait University (In Arabic)
Al-Roomy, N. (1987), ‘A Model of Crude Oil Pricing and the InteractionBetween OPEC, the UK and Mexico’, Unpublished DoctoralDissertation, University of Southampton, England.
Al-Turki, S. (1994), ‘Autocorrelation in Static Economic Models and theirDynamic Respecifications: an Application to OPEC Behaviour’, Journalof King Saud University, Administrative Sciences
Al-Yousef, N. (1994), ‘Modelling OPEC Behaviour: an EconometricAnalysis’, Unpublished Masters Thesis, King Saud University. Riyadh,Saudi Arabia.
51
Askari, H. (1990), Saudi Arabia's Economy: Oil and the Reach for EconomicDevelopment, JAI Press, Greenwich, CT.
Askari, H. (1991), Saudi Arabia’s Oil Policy: Its Motivations and Impact, InWilfride Kohl After the Oil Collapse. OPEC the United States and theWorld Oil Market, John Hopkins University Press.
Cremer, J. and Salehi-Isfahani, D. (1980), ‘Competitive Pricing in the OilMarket: How Important is OPEC?’, Working Paper, University ofPennsylvania, Phil.
Cremer, J. and Salehi-Isfahani, D. (1991),Models of the Oil Market, UK:Hardwood Academic Publishers.
Cremer, J. and Weitzman, M. (1976), ‘OPEC and the Monopoly Price ofWorld Oil’, European Economic Review, 8: pp.155-64.
Dahl, C. and Yucel, M. (1991), ‘Testing Alternative Hypotheses of OilProducer Behaviour’, Energy Journal; 12(4): pp.117-38.
Dasgupta, P. and Heal, G. (1979), The Economic Theory of ExhaustibleResources, Cambridge University Press.
Doran, C. (1977), Myth, Oil, and Politics: Introduction to the PoliticalEconomy of Petroleum, New York: The Free Press.
.Ezzati, A. (1976), ‘Future OPEC Price and Production Strategies as Affectedby its Capacity to Absorb Oil Revenues’, European Economic Review,8: pp.107-38.
Ezzati, A. (1978), World Energy Markets and OPEC Stability, Cambridge,Mass: Lexington Books.
Fisher, A. (1981), Resource and Environmental Economics,: CambridgeSurveys of Economic Literature, Cambridge University Press.
Gately, D. (1983), ‘OPEC: Retrospective and Prospects 1973-1990’, EuropeanEconomic Review 21: pp.313-31.
Gately, D. (1984), ‘A Ten-Year Retrospective: OPEC and the World OilMarket’, Journal of Economic Literature, 22: pp.1100-1114.

52
Gately, D. (1995), ‘Strategies for OPEC’s Pricing and Output Decisions’, TheEnergy Journal, 16( 3).
Geroski, P. Ulph, A. and Ulph, D. (1987), ‘Model of the Crude Oil Market inwhich Market Conduct Varies’, Economic Journal, 97: pp. 77-86.
Gilbert, R. (1978), ‘Dominant Firm Pricing in a Market for an ExhaustibleResource’, The Bell Journal of Economics, 9: pp.385-395.
Golub, D. (1985), When Oil and Politics Mix Saudi Oil Policy, 1973-1985,Centre For Middle Eastern Studies. Harvard University.
Griffin, J. and Steel, H. (1980), Energy Economics and Policy, New York:Academic Press.
Griffin, J. (1985), ‘OPEC Behaviour: A Test of Alternative Hypotheses’,American Economic Review, 75: pp.954-963.
Griffin, J. and Jones (1986), ‘Falling Oil prices where is the Floor?’, TheEnergy Journal, 7(4): PP.
Griffin, J. and Teece, M. (1982), OPEC Behaviour and World Oil Prices,London: George Allen and Unwin.
Griffin, J. and Neilson (1994), ‘The 1985-86 Oil Price Collapse andAfterwards’, Economic Inquiry. 32(4): pp. 543-561.
Gulen, G. (1996), ‘Is OPEC a Cartel ? Evidence from Cointegration andCausality Tests’, The Energy Journal 17(2): pp. 43-57.
Hartshorn, J. (1993), Oil Trade Politics and Prospects, Cambridge:Cambridge University Press.
Hotelling, H. (1931), ‘The Economics of Exhaustible Resources’, The Journalof Political Economy, 39: pp.137-175.
Johany, A. (1978), ‘OPEC not a Cartel. The Property Rights Explanation ofthe Rise in Crude Oil Prices’, Unpublished Doctoral Dissertation, U.C.Santa Barbara.
Johany, A. (1980), The Myth of the OPEC Cartel The Role of Saudi Arabia,New York: John Wiley and sons.
53
Johany, A, Berne, M. Mixon, J. (1986), The Saudi Arabian Economy,Baltimore: The John Hopkins University Press.
Kelly, J. (1980), The Gulf and the West, New York: Basic Books.
Kohl, W. (1991), After the Oil Price Collapse OPEC, the United, States andthe World Oil Market, John Hopkins University Press
Mabro, R.(ed) (1986), The 1986 Oil Price Crisis: Economic Effects and PolicyResponses, Oxford: Oxford Institute for Energy Studies.
Mabro, R. (1975), ‘Can OPEC hold the line’, in OPEC and the World OilMarket: The Genesis of the 1986 Price Crisis, R. Mabro.(ed) OxfordInstitute for Energy Studies.
Mabro, R. (1984), On Oil Price Concept, Working Paper, Oxford Institutefor Energy.
Mabro, R. (1987), Netback Pricing and the Oil Price Collapse of 1986,Oxford. Institute for Energy Studies.
Mabro, R. (1988), Presentation at the Oxford Energy Seminar. 15/9/1988.
Mabro, R. (1989), OPEC's Production Policies: How do they work? Why don'tthey work?, Oxford Institute for Energy Studies.
Mabro, R. (1991), ‘OPEC and the Price of Oil’, The Energy Journal,, 13: pp. 1-17.
MacAvoy, P. (1982), Crude Oil Prices as Determined by OPEC and MarketFundamentals, Cambridge, Mass: Ballinger.
Middle East Economic Survey (MEES) Several Issues.
Moran, T. (1978), Oil Prices and the Future of OPEC, Washington. D.C:Resources for the Future.
Moran, T. (1982), ‘Modelling OPEC Behaviour: Economic and Political Alternatives’, in OPEC Behaviour and World Oil Prices, J.M. Griffin and D.J Teece, London: George Allen & Unwin, pp. 94-130.

54
OECD Economic Outlook and Energy Policies of IEA Countries 1984 and1987 Review.
Oil and Gas Journal, various years, weekly, annual supplement World Wide Oil, last issue of year.
Oil Daily 18/9/1989.
OPEC Annual Statistical Bulletin, Vienna: The Secretariat of OPEC, VariousIssues.
OPEC Official Resolutions and Press Releases 1960-1996. (1996), Vienna:TheSecretariat of OPEC.
OPEC Statute. (1993) Organisation of the Petroleum Exporting Countries.
Osborn, D. (1990) ‘A Survey of Seasonality in UK MacroeconomicsVariables’, International Journal of Forecasting, 6:pp. 327-336.
Osborn, D., Chui, J. Smith, P and Birchenhall, C. (1988) ‘Seasonality and theOrder of Integration for Consumption’, Oxford Bulletin of Economics andStatistics 50: pp. 361-377.
Petroleum Intelligence Weekly (PIW) 6/ 4/11979.
Petromin (1985), Petromin Reference, Ministry of Petroleum and Minerals, SA.
Pindyck, R. (1978), ‘Gains to Producers from the Cartelisation of Exhaustible Resources’, Review of Economics and Statistics 60: pp. 238-52.
Pindyck, R. (1982), ‘OPEC Oil Pricing, and the Implications for Consumersand Producers’, in J. Griffin and D. Teece, OPEC Behaviour and WorldOil Prices, London: George Allen and Unwin, pp. 175-85.
Pindyck, R. and Rubinfeld, D. (1998), Microeconomics, 4th ed. New Jersey:Prentice Hall, Inc. Simon & Schuster.
Porter, E. (1992), ‘Uncertainty and OPEC Supply Behaviour in the USDepartment of Energy’s Oil Market Simulation (OMS) Model’,American Petroleum Institute, December.
55
Powel, S. (1990), ‘The Target Capacity-Utilisation model of OPEC and theDynamics of the World Oil Market’ The Energy Journal, 11 (1): pp. 27-63
Quandt, W. (1982), Saudi Arabia’s Oil Policy, The Brooking Institution,Washington, DC.
Salant, S. (1976), ‘Exhaustible Resources and Industrial Structure: A Nash-Cournot Approach to the World Oil Market’, Journal of PoliticalEconomy, 84: pp. 1079-93.
Salehi-Isfahani, D. (1987), ‘Testing OPEC Behaviour: Comment’, Workingpaper, Virginia Polytechnic Institute and State University.
.Saudi Arabian Monetary Agency (SAMA). Annual Report, different issues.
Seymour, I. (1980), OPEC Instrument of Change, New York: The MacmillanPress Ltd.
Stevens, P. (1975), Joint Ventures in Middle East Oil 1957-1975, MiddleEast Economic Constants (Beirut).
Stevens, P. (1982 ), ‘Saudi Arabia’s Oil Policy in the 1970’s its Origins, Implementation and Implications’, in Niblock, T. State, Society and Economy in Saudi Arabia, Croom Helm London and Centre for Arab Gulf Studies, Exeter.
Stevens, P. (1991), ‘Oil Prices- an Economic Framework for Analysis’, in Contemporary Issues in Applied Economics, eds Graham Bird & Heather Bird, Edward Elgar.
Stevens, P. (1992), Oil and Politics: The Post-War Gulf, London: RoyalInstitute of International Affairs.
Suranovic, S. (1993) ‘Does a Target- Capacity Utilisation Rule Fulfil OPEC'sEconomic Objectives? , Energy Economics, April, pp. 71-79.
Teece, D. (1982), ‘OPEC Behaviour: An Alternative View’, in Griffin and D.Teece, OPEC Behaviour and World Oil Prices, London: Allen & Unwin.
Terzian, P. (1985), OPEC: The Inside Story, London: Zed Books Ltd.
56
NOTES
1 Most cartel models utilised the theory of exhaustible resources, where foran owner of such a resource, the optimal path of extraction depends on themarket structure and the elasticity of demand. For a competitive market,the price rises with the rate of interest. For a monopolist, the rate ofincrease in prices would be less than the relevant rate of return indicatingthat the monopolist is more conservative than a competitive supplier of anexhaustible resource [see Hotelling (1931) and Dasqupta and Heal (1979)].
2 48th OPEC Conference held in Doha, Qatar, from 15 to the 17 December1976.
3 The costs of producing oil are not just the extraction costs. Marginalcost include the opportunity cost of selling the oil today instead oftomorrow, taking into account the depletable nature of a non-renewableresource.
4 The difference between the legal ownership and the realistic ownership.
5 After the announcement of the Saudi Minister in the AmericanUniversity under the title “Participation Versus Nationalisation”.
6 Because of the agreement of participation between the Saudigovernment and Aramco four owners Company .