


Languages
Pages
Legal

1
Economic Dispatch and SCADA for Diesel Efficiency
Improvements*
2009 International Wind-Diesel WorkshopOttawa, Ontario, Canada
June 2, 2009
Richard Wies, UAF Electrical and Computer Engineering
A project funded by the US DOE National Energy Technology Lab (NETL) through the Arctic Energy Technology & Development Laboratory (AETDL)
* The economic dispatch analysis presented here for Kongiganak, Alaska was for data collected between Jan 2003 and Dec 2003. An economic dispatch system has been implemented at Kongiganak since 2005.
2
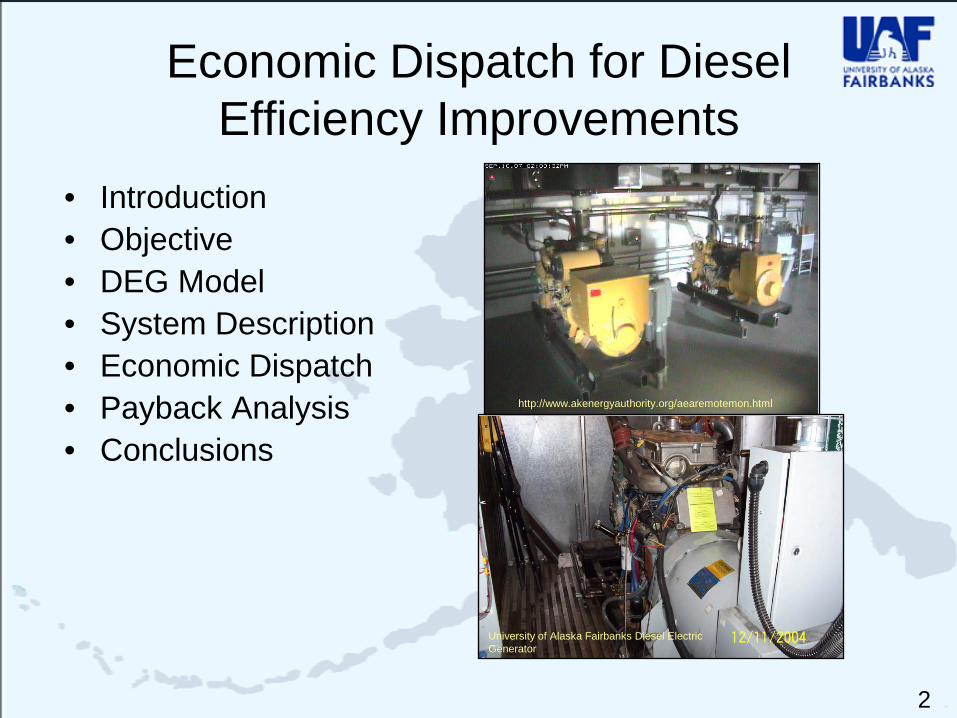
Economic Dispatch for Diesel Efficiency Improvements
• Introduction• Objective• DEG Model• System Description• Economic Dispatch• Payback Analysis• Conclusions
http://www.akenergyauthority.org/aearemotemon.html
University of Alaska Fairbanks Diesel Electric Generator
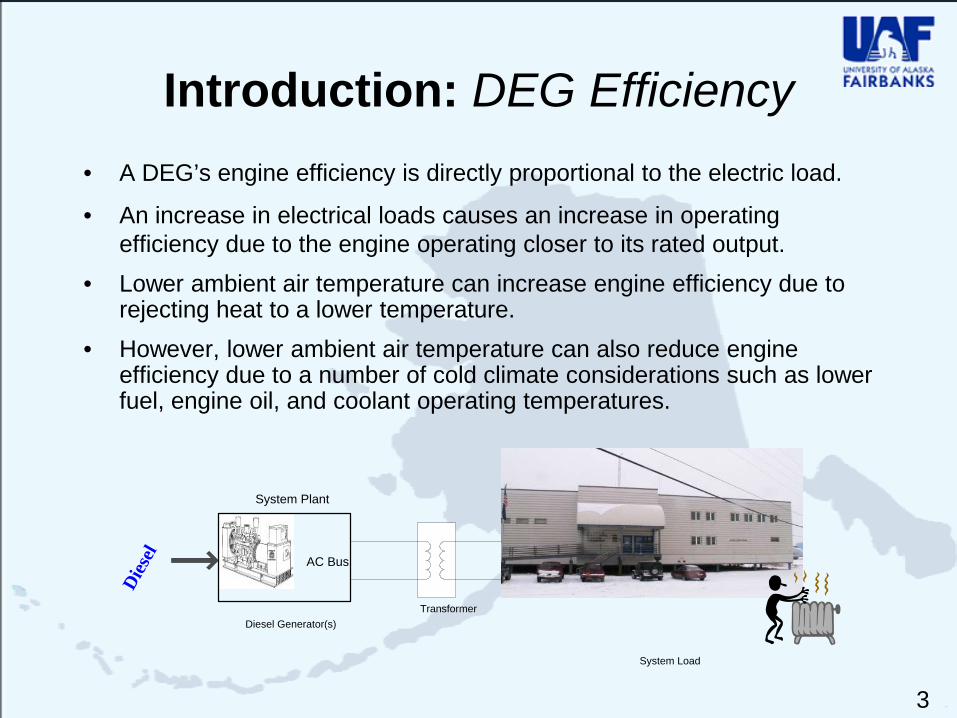
Introduction: DEG Efficiency• A DEG’s engine efficiency is directly proportional to the electric load.
• An increase in electrical loads causes an increase in operating efficiency due to the engine operating closer to its rated output.
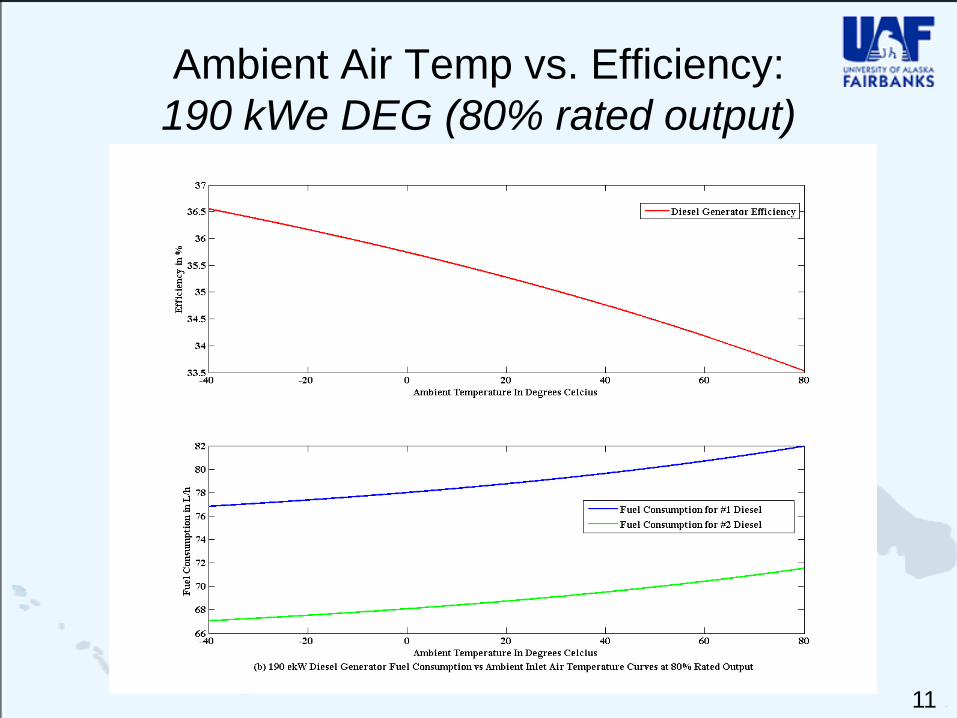
• Lower ambient air temperature can increase engine efficiency due to rejecting heat to a lower temperature.
• However, lower ambient air temperature can also reduce engine efficiency due to a number of cold climate considerations such as lower fuel, engine oil, and coolant operating temperatures.
3
System Load
AC Bus
TransformerDiesel Generator(s)
System Plant
Dies
el
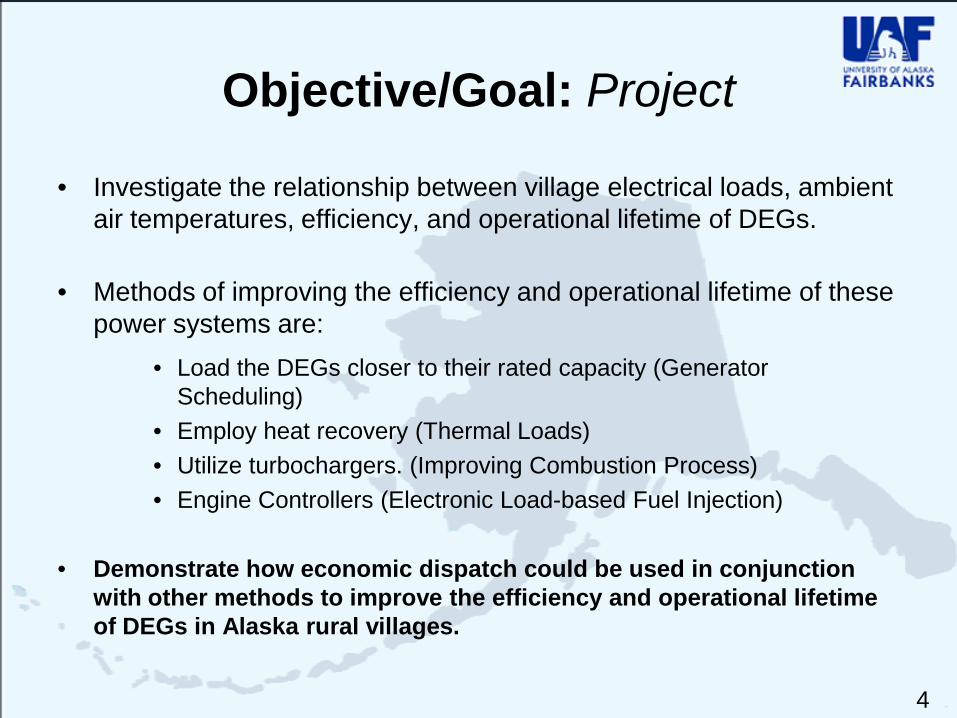
Objective/Goal: Project
• Investigate the relationship between village electrical loads, ambient air temperatures, efficiency, and operational lifetime of DEGs.
• Methods of improving the efficiency and operational lifetime of these power systems are:
• Load the DEGs closer to their rated capacity (Generator Scheduling)
• Employ heat recovery (Thermal Loads)• Utilize turbochargers. (Improving Combustion Process)• Engine Controllers (Electronic Load-based Fuel Injection)
• Demonstrate how economic dispatch could be used in conjunction with other methods to improve the efficiency and operational lifetime of DEGs in Alaska rural villages.
4
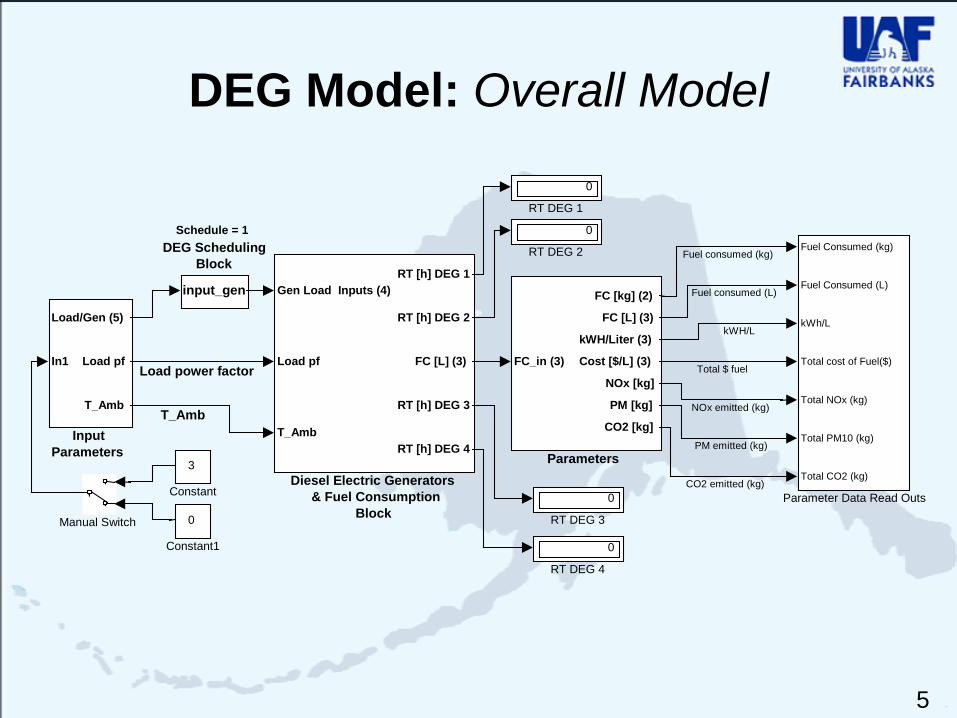
DEG Model: Overall Model
5
0
RT DEG 4
0
RT DEG 3
0
RT DEG 2
0
RT DEG 1
FC_in (3)
FC [kg] (2)
FC [L] (3)
kWH/Liter (3)
Cost [$/L] (3)
NOx [kg]
PM [kg]
CO2 [kg]
Parameters
Fuel Consumed (kg)
Fuel Consumed (L)
kWh/L
Total cost of Fuel($)
Total NOx (kg)
Total PM10 (kg)
Total CO2 (kg)
Parameter Data Read Outs
Manual Switch
In1
Load/Gen (5)
Load pf
T_Amb
Input Parameters
Gen Load Inputs (4)
Load pf
T_Amb
RT [h] DEG 1
RT [h] DEG 2
FC [L] (3)
RT [h] DEG 3
RT [h] DEG 4
Diesel Electric Generators & Fuel Consumption
Block
input_gen
DEG Scheduling Block
Schedule = 1
0
Constant1
3
Constant
Load power factor
T_Amb
Fuel consumed (kg)
Fuel consumed (L)
kWH/L
Total $ fuel
NOx emitted (kg)
PM emitted (kg)
CO2 emitted (kg)
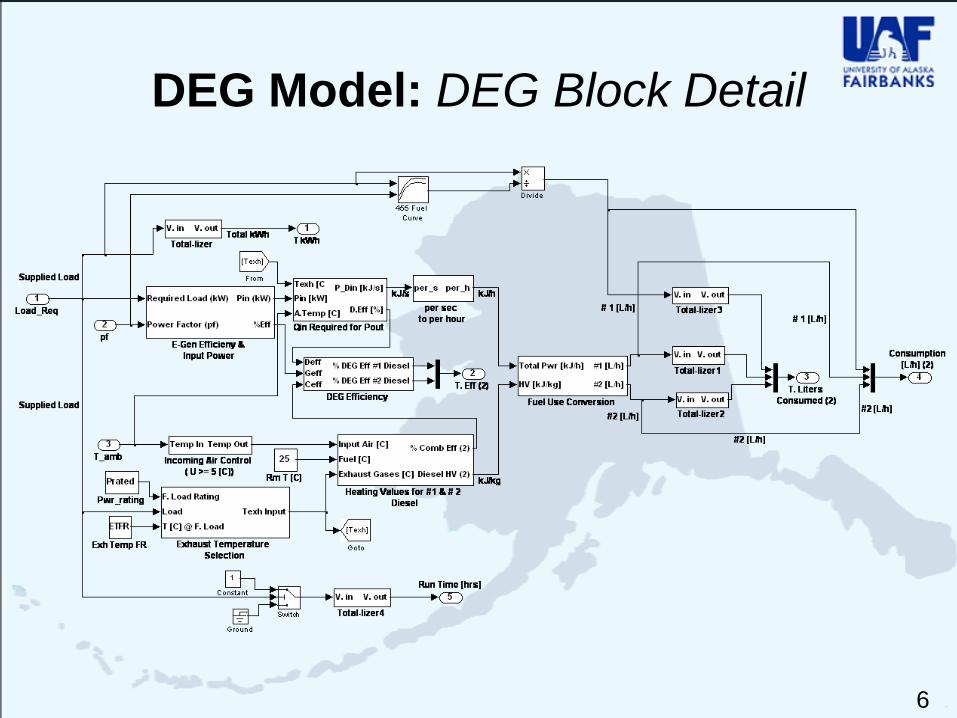
DEG Model: DEG Block Detail
6
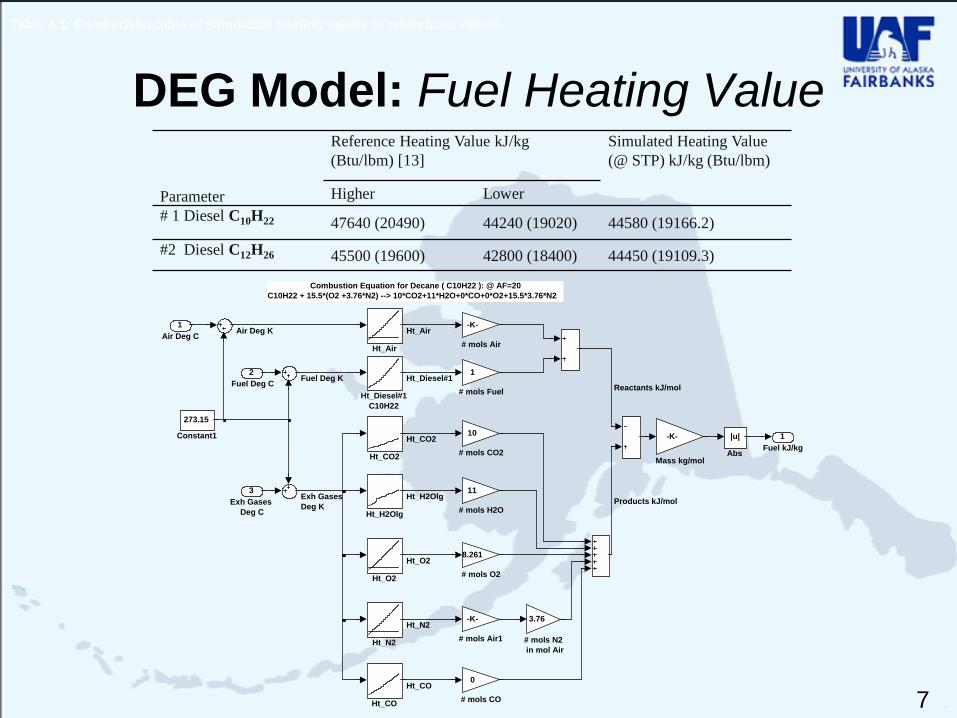
DEG Model: Fuel Heating Value
7
Parameter
Reference Heating Value kJ/kg (Btu/lbm) [13]
Simulated Heating Value (@ STP) kJ/kg (Btu/lbm)
Higher Lower# 1 Diesel C10H22 47640 (20490) 44240 (19020) 44580 (19166.2)
#2 Diesel C12H26 45500 (19600) 42800 (18400) 44450 (19109.3)
Table 4.1: Comparison table of simulation heating values to referenced values.
Combustion Equation for Decane ( C10H22 ): @ AF=20C10H22 + 15.5*(O2 +3.76*N2) --> 10*CO2+11*H2O+0*CO+0*O2+15.5*3.76*N2
1Fuel kJ/kg
-K-
Mass kg/mol
Ht_O2
Ht_N2
Ht_H2Olg
Ht_Diesel#1C10H22
Ht_CO2
Ht_CO
Ht_Air
273.15
Constant1 |u|
Abs
8.261
# mols O2
3.76
# mols N2 in mol Air
11
# mols H2O
1
# mols Fuel
10
# mols CO2
0
# mols CO
-K-
# mols Air1
-K-
# mols Air
3Exh Gases
Deg C
2Fuel Deg C
1Air Deg C
Reactants kJ/mol
Products kJ/mol
Fuel Deg K
Air Deg K
Exh Gases Deg K
Ht_Air
Ht_Diesel#1
Ht_CO2
Ht_H2Olg
Ht_O2
Ht_N2
Ht_CO
8
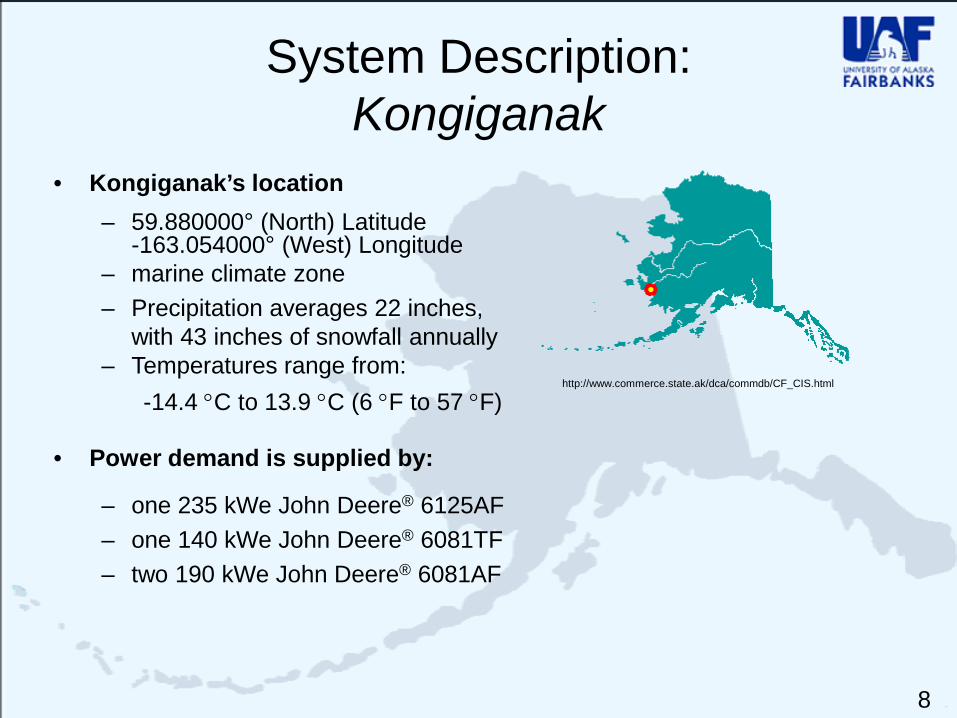
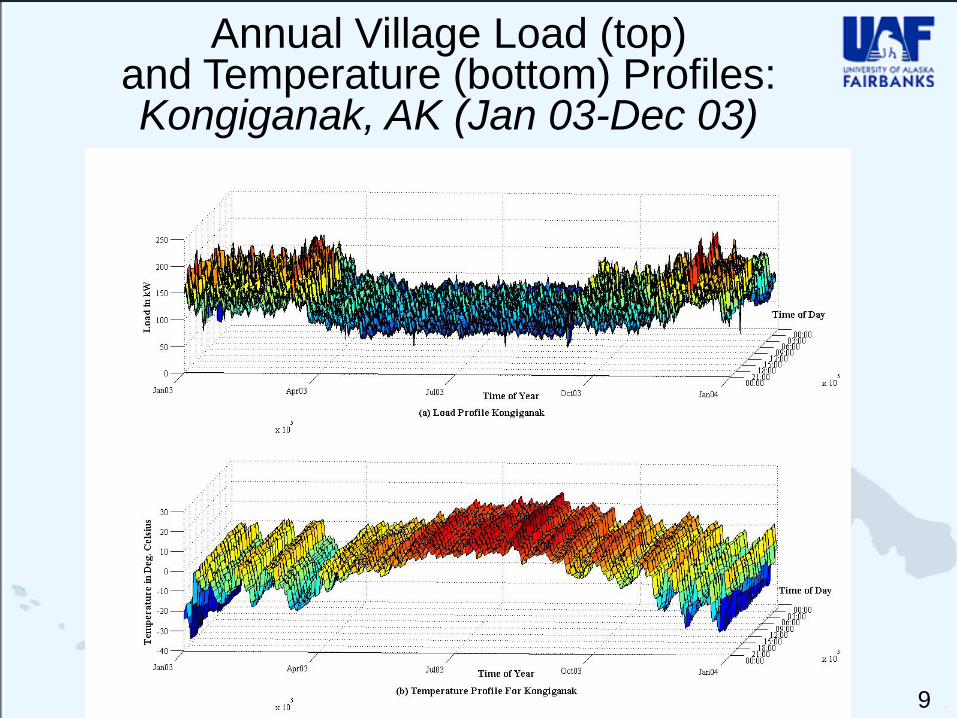
System Description: Kongiganak
• Kongiganak’s location– 59.880000° (North) Latitude
-163.054000° (West) Longitude – marine climate zone – Precipitation averages 22 inches,
with 43 inches of snowfall annually– Temperatures range from:
-14.4 °C to 13.9 °C (6 °F to 57 °F)
• Power demand is supplied by:
– one 235 kWe John Deere® 6125AF– one 140 kWe John Deere® 6081TF– two 190 kWe John Deere® 6081AF
http://www.commerce.state.ak/dca/commdb/CF_CIS.html
9
Annual Village Load (top) and Temperature (bottom) Profiles: Kongiganak, AK (Jan 03-Dec 03)
10
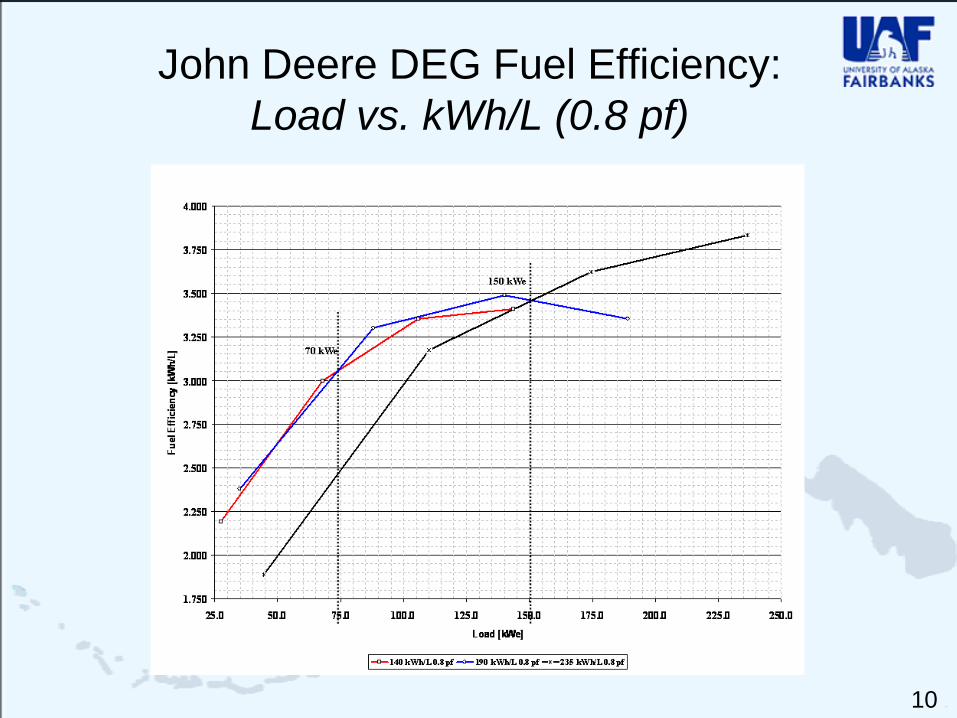
John Deere DEG Fuel Efficiency: Load vs. kWh/L (0.8 pf)
11
Ambient Air Temp vs. Efficiency: 190 kWe DEG (80% rated output)
12
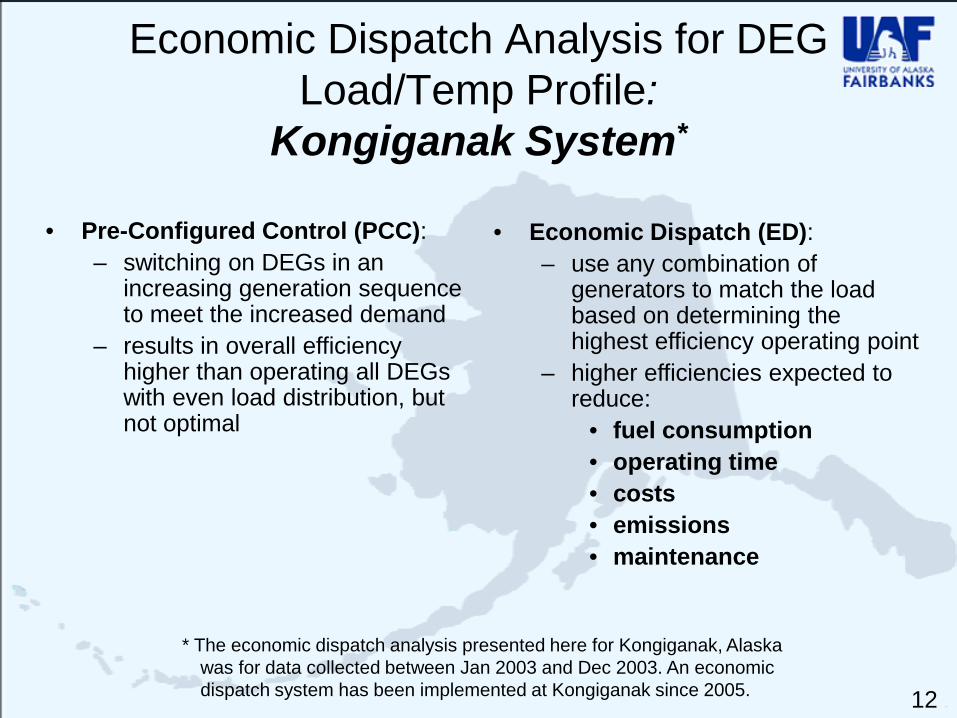
Economic Dispatch Analysis for DEG Load/Temp Profile:
Kongiganak System*
• Pre-Configured Control (PCC):– switching on DEGs in an
increasing generation sequence to meet the increased demand
– results in overall efficiency higher than operating all DEGs with even load distribution, but not optimal
• Economic Dispatch (ED):– use any combination of
generators to match the load based on determining the highest efficiency operating point
– higher efficiencies expected to reduce:
• fuel consumption• operating time• costs• emissions• maintenance
* The economic dispatch analysis presented here for Kongiganak, Alaska was for data collected between Jan 2003 and Dec 2003. An economic dispatch system has been implemented at Kongiganak since 2005.
13
Economic Dispatch Analysis for DEG Load and Temperature Profile:
Kongiganak System• Each scenario run for both #1 and #2 Diesel
with two temperature cases:– Case 1: no change in average ambient air temperature
– Case 2: 3 °C (5.4 °F) change in average ambient air
• Efficiency and fuel consumption values at load and ambient temperature points were interpolated from the efficiency curves.
14
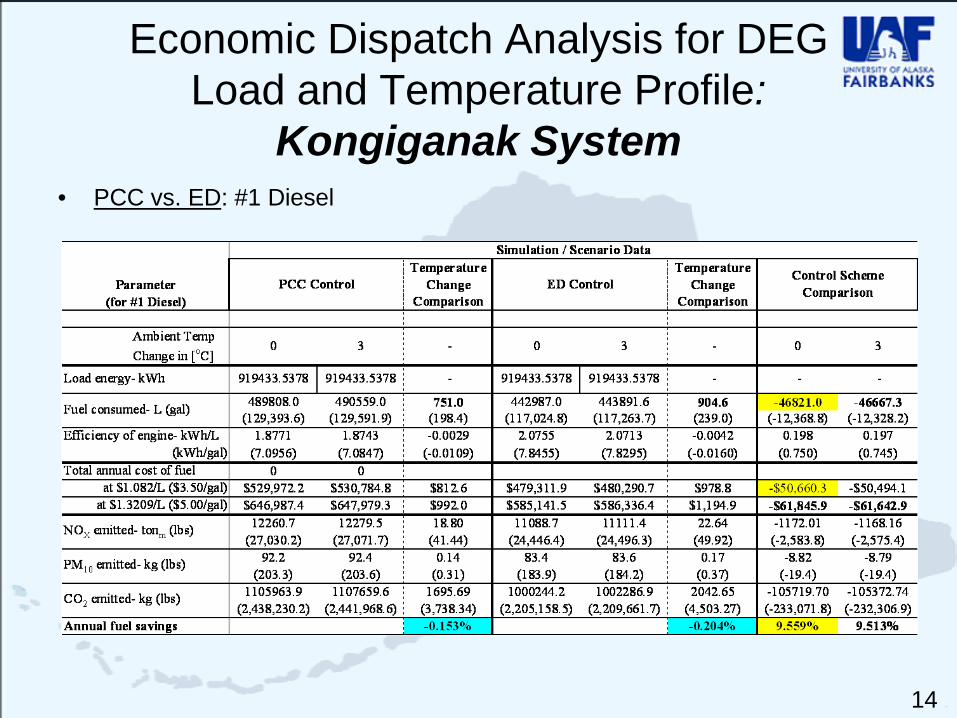
• PCC vs. ED: #1 Diesel
Economic Dispatch Analysis for DEG Load and Temperature Profile:
Kongiganak System
15
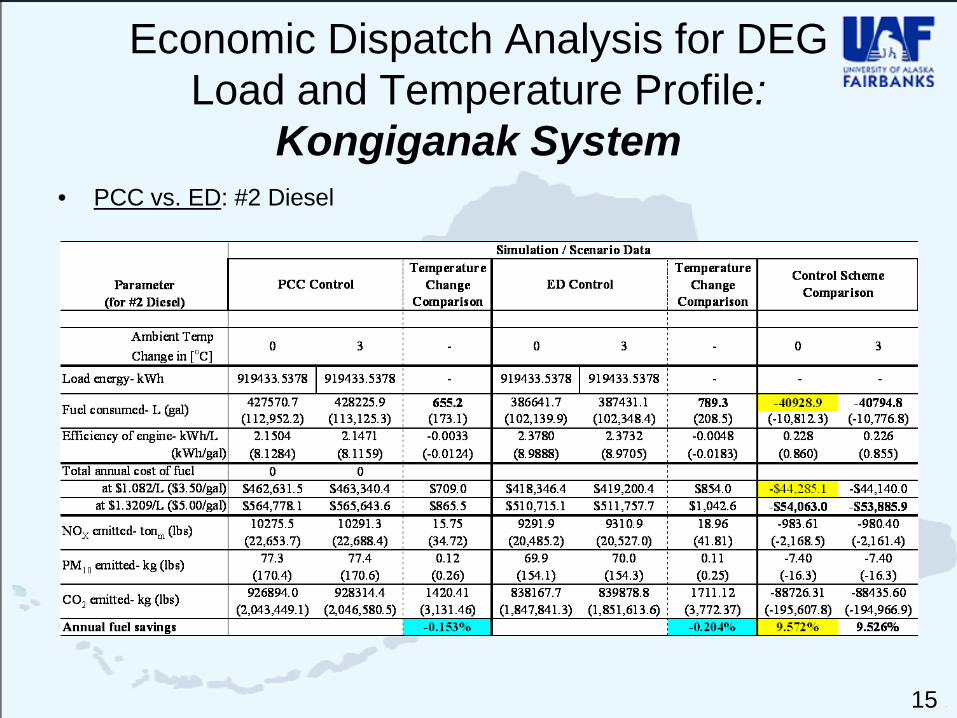
• PCC vs. ED: #2 Diesel
Economic Dispatch Analysis for DEG Load and Temperature Profile:
Kongiganak System
16
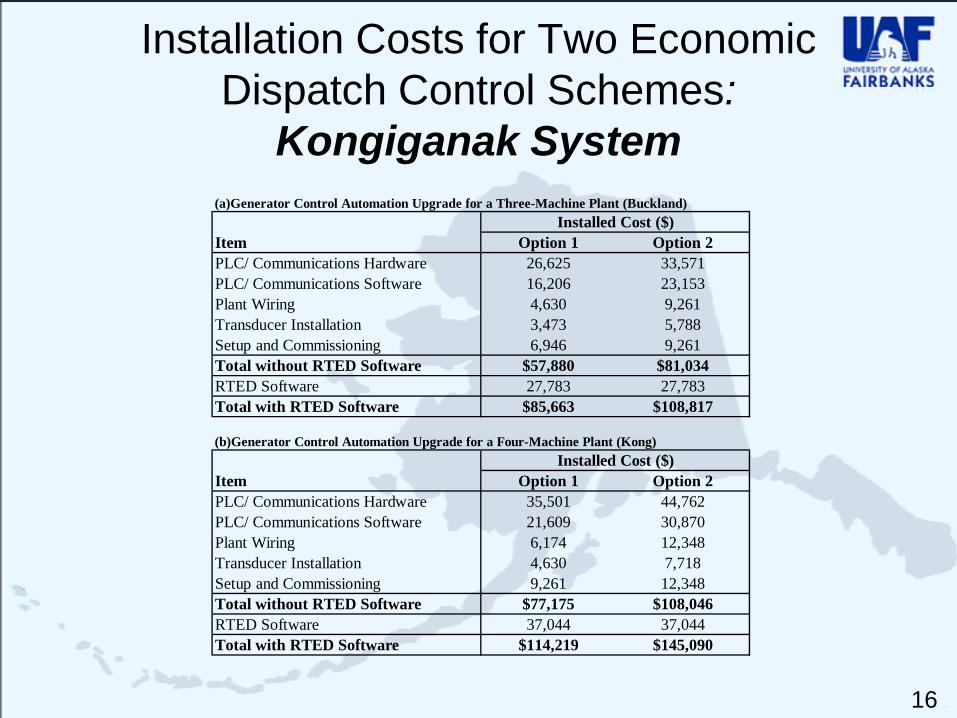
(a)Generator Control Automation Upgrade for a Three-Machine Plant (Buckland)
(b)Generator Control Automation Upgrade for a Four-Machine Plant (Kong)
Total with RTED Software
Total with RTED Software $85,663 $108,817
$114,219 $145,090
RTED Software 27,783 27,783
RTED Software 37,044 37,044
Option 2Installed Cost ($)
26,625
Transducer Installation
33,571
Setup and Commissioning
Option 1PLC/ Communications HardwarePLC/ Communications Software
Item
Plant Wiring
9,261
16,2064,6303,473
23,1539,2615,788
Total without RTED Software $57,880 $81,0346,946
ItemInstalled Cost ($)
Option 1 Option 2PLC/ Communications Hardware 35,501 44,762PLC/ Communications Software 21,609 30,870Plant Wiring 6,174 12,348Transducer Installation 4,630 7,718
Total without RTED Software $77,175 $108,046Setup and Commissioning 9,261 12,348
Installation Costs for Two Economic Dispatch Control Schemes:
Kongiganak System
17
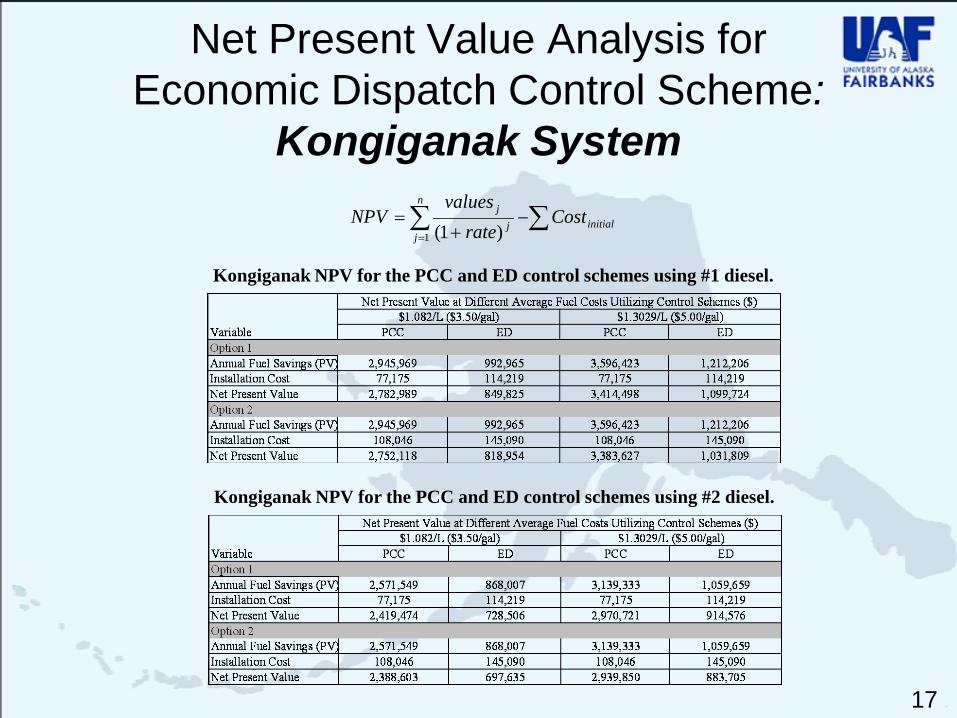
Net Present Value Analysis forEconomic Dispatch Control Scheme:
Kongiganak System
Kongiganak NPV for the PCC and ED control schemes using #1 diesel.
Kongiganak NPV for the PCC and ED control schemes using #2 diesel.
∑∑=
−+
= initial
n
jj
j Costrate
valuesNPV
1 )1(
18
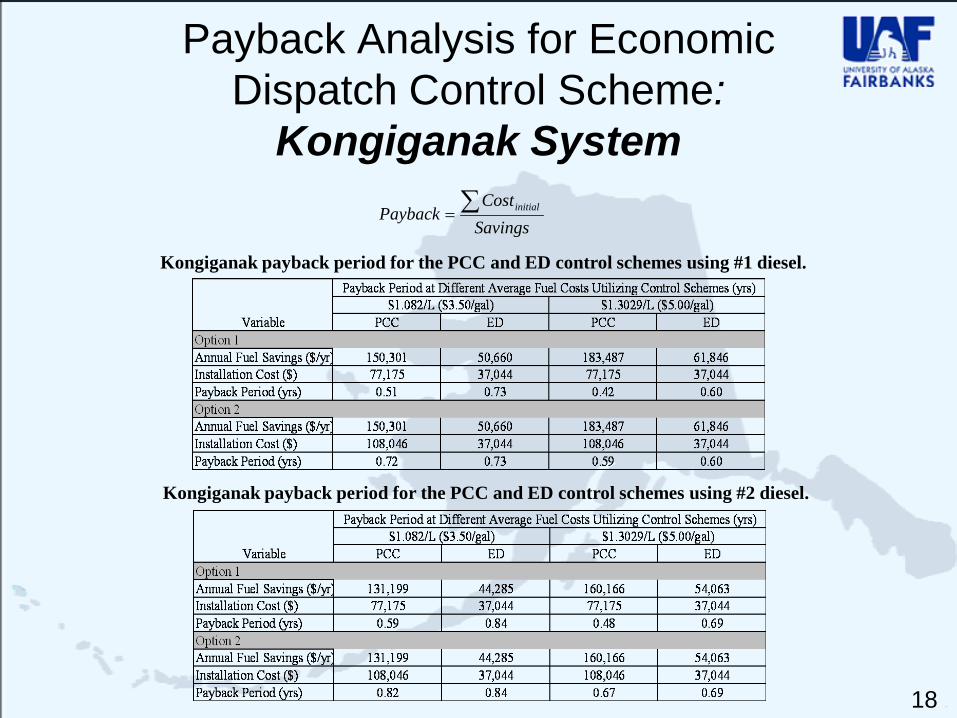
Payback Analysis for Economic Dispatch Control Scheme:
Kongiganak System
Kongiganak payback period for the PCC and ED control schemes using #1 diesel.
Kongiganak payback period for the PCC and ED control schemes using #2 diesel.
SavingsCost
Payback initial∑=
19
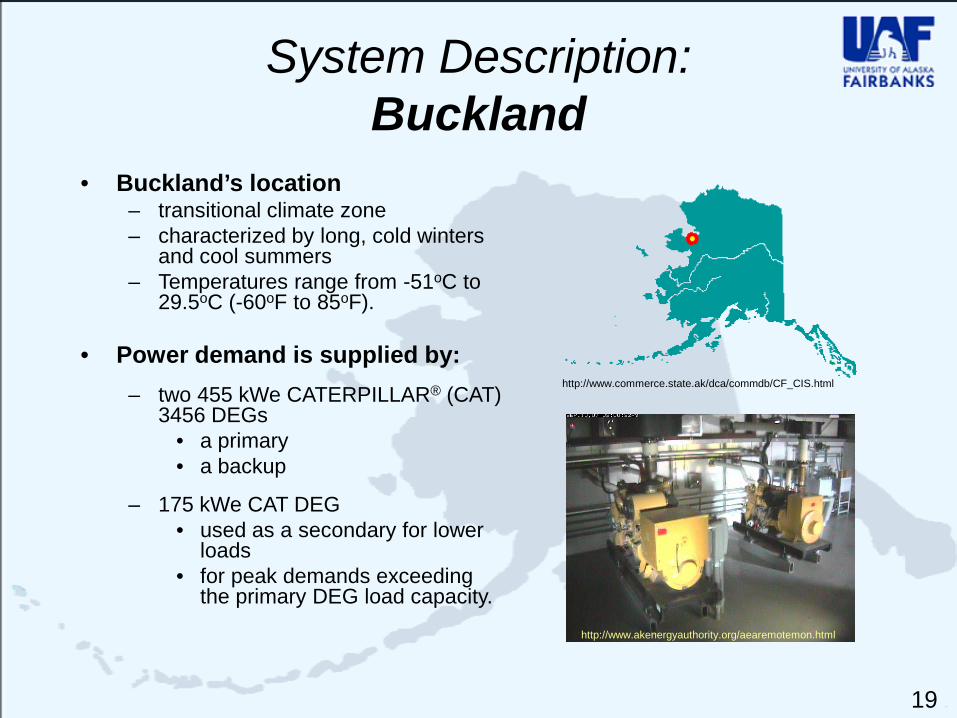
System Description: Buckland
• Buckland’s location– transitional climate zone– characterized by long, cold winters
and cool summers – Temperatures range from -51oC to
29.5oC (-60oF to 85oF).
• Power demand is supplied by:– two 455 kWe CATERPILLAR® (CAT)
3456 DEGs• a primary • a backup
– 175 kWe CAT DEG• used as a secondary for lower
loads • for peak demands exceeding
the primary DEG load capacity. http://www.akenergyauthority.org/aearemotemon.html
http://www.commerce.state.ak/dca/commdb/CF_CIS.html
20
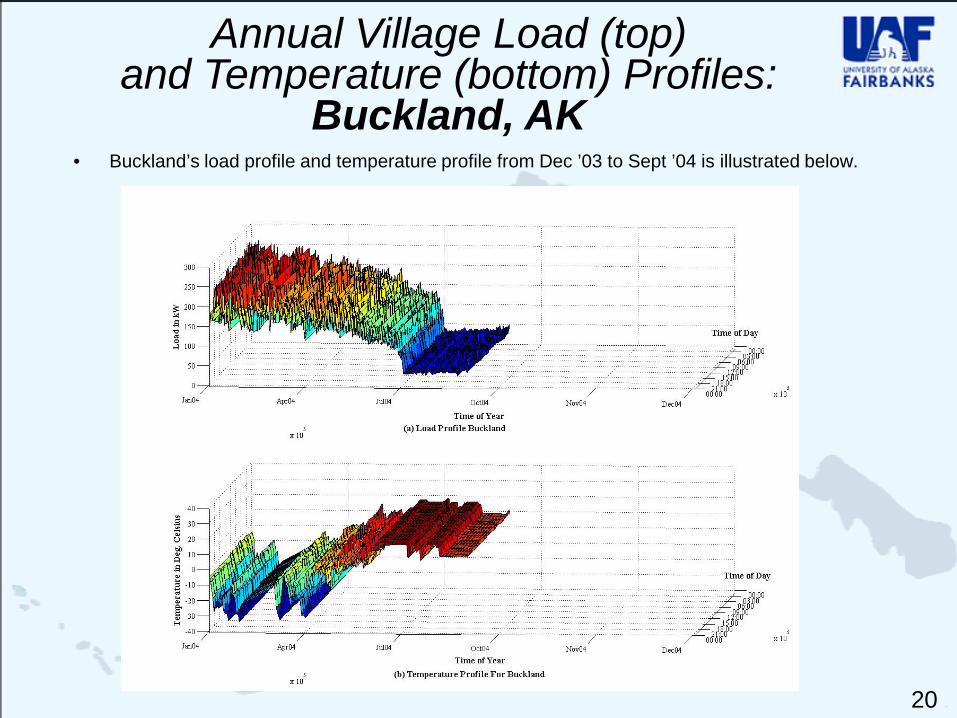
Annual Village Load (top) and Temperature (bottom) Profiles:
Buckland, AK• Buckland’s load profile and temperature profile from Dec ’03 to Sept ’04 is illustrated below.
21
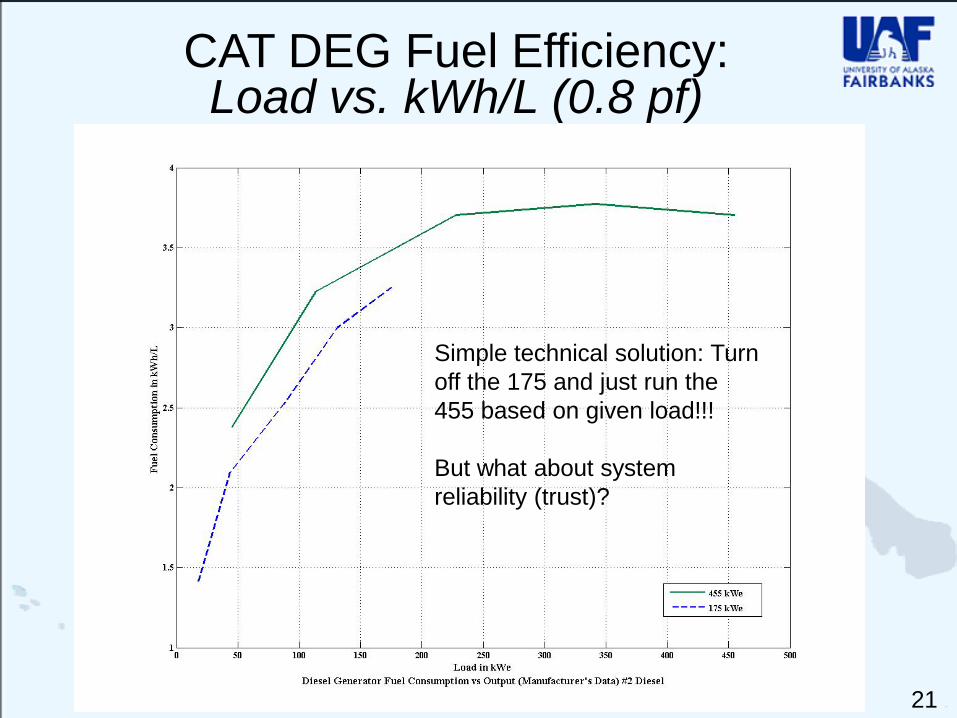
CAT DEG Fuel Efficiency: Load vs. kWh/L (0.8 pf)
Simple technical solution: Turn off the 175 and just run the 455 based on given load!!!
But what about system reliability (trust)?
22
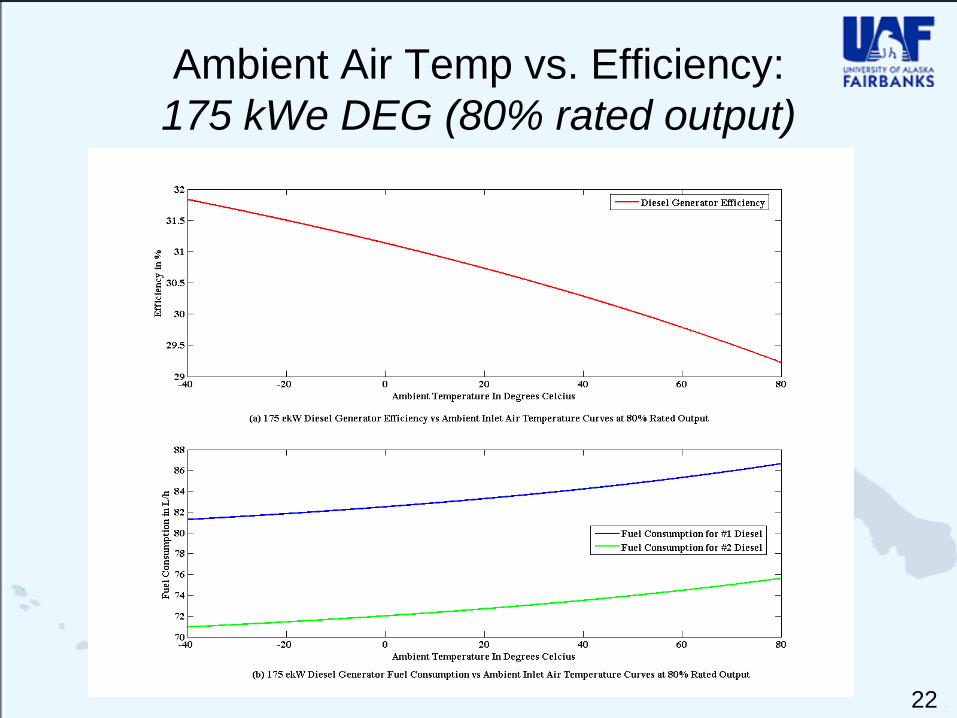
Ambient Air Temp vs. Efficiency: 175 kWe DEG (80% rated output)
23
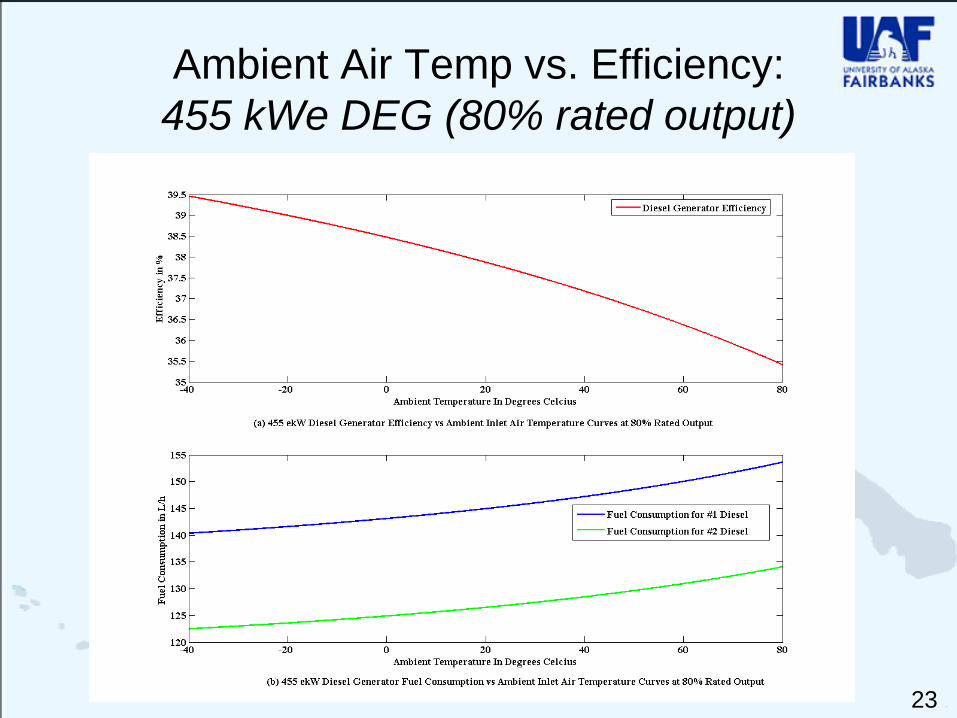
Ambient Air Temp vs. Efficiency: 455 kWe DEG (80% rated output)
24
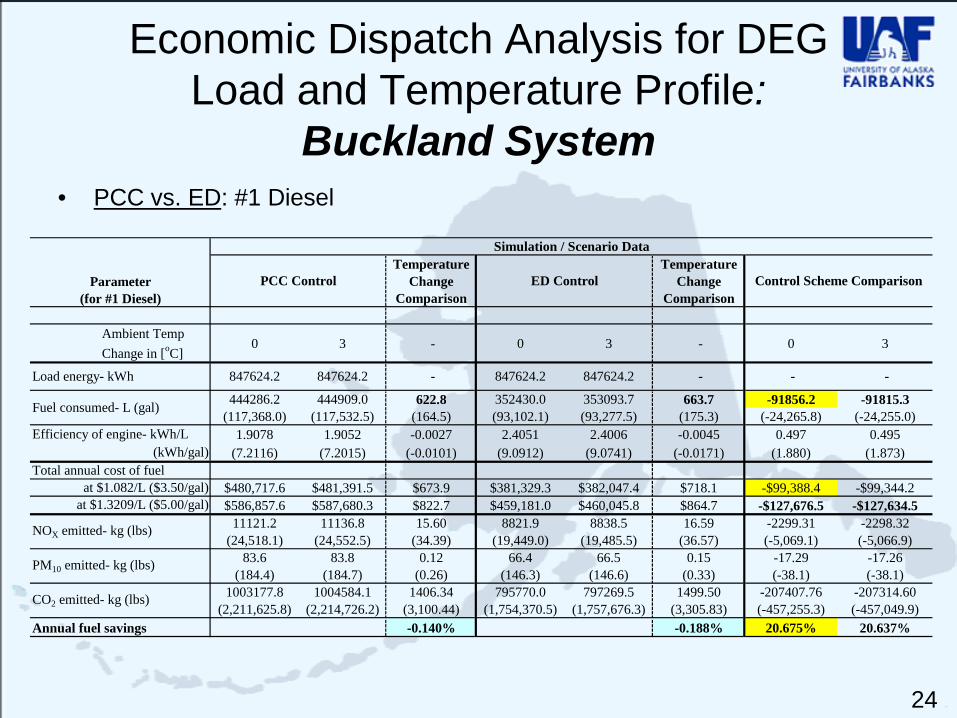
Economic Dispatch Analysis for DEG Load and Temperature Profile:
Buckland System• PCC vs. ED: #1 Diesel
Temperature Change
Comparison
Temperature Change
Comparison
Ambient Temp Change in [oC]
0 3 - 0 3 - 0 3
444286.2 444909.0 622.8 352430.0 353093.7 663.7 -91856.2 -91815.3(117,368.0) (117,532.5) (164.5) (93,102.1) (93,277.5) (175.3) (-24,265.8) (-24,255.0)
1.9078 1.9052 -0.0027 2.4051 2.4006 -0.0045 0.497 0.495(7.2116) (7.2015) (-0.0101) (9.0912) (9.0741) (-0.0171) (1.880) (1.873)
$480,717.6 $481,391.5 $673.9 $381,329.3 $382,047.4 $718.1 -$99,388.4 -$99,344.2$586,857.6 $587,680.3 $822.7 $459,181.0 $460,045.8 $864.7 -$127,676.5 -$127,634.5
11121.2 11136.8 15.60 8821.9 8838.5 16.59 -2299.31 -2298.32(24,518.1) (24,552.5) (34.39) (19,449.0) (19,485.5) (36.57) (-5,069.1) (-5,066.9)
83.6 83.8 0.12 66.4 66.5 0.15 -17.29 -17.26(184.4) (184.7) (0.26) (146.3) (146.6) (0.33) (-38.1) (-38.1)
1003177.8 1004584.1 1406.34 795770.0 797269.5 1499.50 -207407.76 -207314.60(2,211,625.8) (2,214,726.2) (3,100.44) (1,754,370.5) (1,757,676.3) (3,305.83) (-457,255.3) (-457,049.9)
Annual fuel savings -0.140% -0.188% 20.675% 20.637%
-847624.2 -
Parameter (for #1 Diesel)
Simulation / Scenario Data
PCC Control ED Control Control Scheme Comparison
-Load energy- kWh 847624.2
Total annual cost of fuel
Fuel consumed- L (gal)
Efficiency of engine- kWh/L(kWh/gal)
847624.2847624.2 -
at $1.082/L ($3.50/gal)at $1.3209/L ($5.00/gal)
NOX emitted- kg (lbs)
PM10 emitted- kg (lbs)
CO2 emitted- kg (lbs)
25
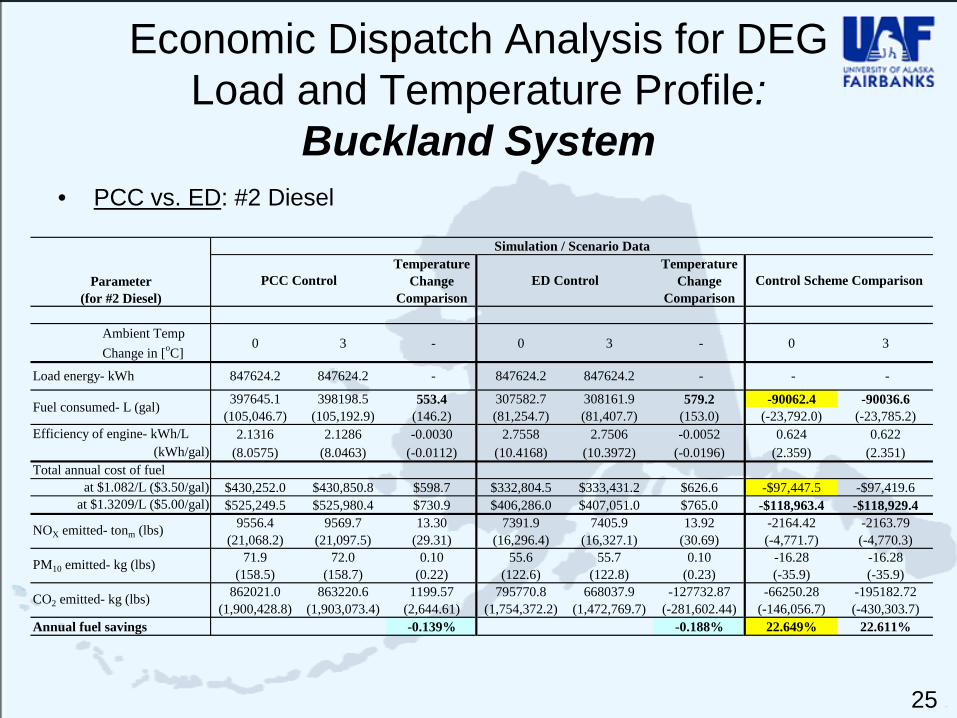
Economic Dispatch Analysis for DEG Load and Temperature Profile:
Buckland System• PCC vs. ED: #2 Diesel
Temperature Change
Comparison
Temperature Change
Comparison
Ambient Temp Change in [oC]
0 3 - 0 3 - 0 3
397645.1 398198.5 553.4 307582.7 308161.9 579.2 -90062.4 -90036.6(105,046.7) (105,192.9) (146.2) (81,254.7) (81,407.7) (153.0) (-23,792.0) (-23,785.2)
2.1316 2.1286 -0.0030 2.7558 2.7506 -0.0052 0.624 0.622(8.0575) (8.0463) (-0.0112) (10.4168) (10.3972) (-0.0196) (2.359) (2.351)
$430,252.0 $430,850.8 $598.7 $332,804.5 $333,431.2 $626.6 -$97,447.5 -$97,419.6$525,249.5 $525,980.4 $730.9 $406,286.0 $407,051.0 $765.0 -$118,963.4 -$118,929.4
9556.4 9569.7 13.30 7391.9 7405.9 13.92 -2164.42 -2163.79(21,068.2) (21,097.5) (29.31) (16,296.4) (16,327.1) (30.69) (-4,771.7) (-4,770.3)
71.9 72.0 0.10 55.6 55.7 0.10 -16.28 -16.28(158.5) (158.7) (0.22) (122.6) (122.8) (0.23) (-35.9) (-35.9)
862021.0 863220.6 1199.57 795770.8 668037.9 -127732.87 -66250.28 -195182.72(1,900,428.8) (1,903,073.4) (2,644.61) (1,754,372.2) (1,472,769.7) (-281,602.44) (-146,056.7) (-430,303.7)
Annual fuel savings -0.139% -0.188% 22.649% 22.611%
PM10 emitted- kg (lbs)
CO2 emitted- kg (lbs)
Total annual cost of fuelat $1.082/L ($3.50/gal)
at $1.3209/L ($5.00/gal)
NOX emitted- tonm (lbs)
Efficiency of engine- kWh/L(kWh/gal)
847624.2 -Load energy- kWh 847624.2
Control Scheme Comparison
Fuel consumed- L (gal)
- - -847624.2847624.2
Parameter (for #2 Diesel)
Simulation / Scenario Data
PCC Control ED Control
26
Conclusions• The results indicate that loading has a significant
impact on DEG efficiency.
• Simple economic dispatch for multiple DEG systems based on generator rated capacities and efficiency at given loads can increase system efficiency by better matching generator capacity to load.
• Results show a significant reduction in fuel consumption, operating time, and operating costs with short payback periods by implementing control with economic dispatch.

27
CONTACT INFO
Richard WiesElectrical and Computer EngineeringUniversity of Alaska FairbanksPhone: (907) 474-7071Fax: (907) 474-5135Email: [email protected]
Top Related