


Languages
Pages
Legal


Enbridge Energy, Limited Partnership 1320 Grand Avenue Superior, WI 54880 Tel 715 394 1400 Fax 715 394 1500
www.enbridgepartners.com
October 9, 2012
Don C. Faith 111 Air Management Engineer Wisconsin Department of Natural Resources 101 South Webster Street Madison, WI 53707
I J. , x·x--x -;;. os
@ NBRIDGE"
ECF.IVE 01 1 1 0 2012
I MANAGEMEN RE: Superior Terminal Enhancement Project Permit Application
Dear Mr. Faith:
Enbridge Energy, Limited Partnership (Enbridge) is submitting the enclosed prevention of significant deterioration permit application for expedited review. Two copies of the application are enclosed and we have directly provided a copy of the permit application to the Region to the attention of Neal Baudhuin at the Superior Service Center.
The proposed Superior Terminal Enhancement Project includes the construction of two new external floating roof tanks T 41 and T 42, each with a maximum liquid storage capacity of 584,232 barrels (bbl) (24,537,744 gallons). The proposed project will also increase the inbound pipeline capacity of Line 67 by 120,000 barrels per day and increase the outbound pipeline capacity of Line 61 by 395,000 barrels per day. To accommodate the additional volume of crude oil being transported through the Superior Terminal and to efficiently segregate products and maintain product quality of the crude oil as it travels through the pipeline system, Enbridge is proposing the following modifications of existing pumping and piping infrastructure throughout the Terminal:
• Manifold modifications to improve connectivity, pipeline delivery flexibility, and to enhance Enbridge's ability to segregate crude oil product batches through quality pooling and minimize product quality degradation due to mixing
• Replacement of existing piping within the facility with larger diameter piping to meet increased pipeline delivery rates
• Construction of additional piping and manifold piping connections
If you have any questions or need any additional information, please contact me at 715-398-4756 or Ron Reding with Barr Engineering Company at 952-832-2673.
Sincerely,
C) Rhonda O'Leary, P.E. Senior Air Quality Analyst
CC: Neal Baudhuin, Air Management Program, WDNR, Superior Service Center, 1701 N. 4th St., Superior, WI 54880
Joe McGaver, Enbridge Ron Reding, Barr Engineering Company
Enclosure: Revision Application and Application Fee ($7,500)

NBRIDGE™ Superior Terminal Enhancement Project
Prevention of Significant Deterioration Permit Application
Enbridge Energy, Limited Partnership Superior, Wisconsin Terminal
October 2012
BARR 4700 West 77'" Street Minneapo lis, MN 55435-4803 Phone: (952) 832-2600 Fax: (952) 832-2601

Superior Terminal Enhancement Project Prevention of Significant Deterioration
Permit Application
October 2012
Table of Contents 1.0 Introduction ............................................................................................................................................. 1
I. I Source Description ...................................................................................................................... 1 1.2 Operating Penni! Source Status .................................................................................................. 2 1.3 Description of Proposed Project ................................................................................................. 2
2.0 Emission Calculation Discussion ............................................................................................................ 4
3.0 Fonn 4530-100 Facility Identification .................................................................................................... 7
4.0 Form 4530-101 Facility Plot Plan ........................................................................................................... 9
5.0 Form 4530-102 Source and Site Descriptions ...................................................................................... 11
6.0 Form 4530-102A Source Description Supplemental ............................................................................ 13
7.0 Form 4530-102B Source Description Supplemental ............................................................................ 16
8.0 Form 4530-105 Storage Tanlcs .............................................................................................................. 18
9.0 Form 4530-118 Compliance Certification - Monitoring and Reporting Methods ................................ 23
10.0 Fonn 4530-125 Recordkeeping .......................................................................................................... 25
11.0 Form 4530-126 Emission Unit HAP Summary .................................................................................. 27
12.0 Fonn 4530-127 Facility Hazardous Air Pollutant Summary .............................................................. 29
13.0 Fonn 4530-128 Emission Unit Summary ........................................................................................... 31
14.0 Fonn 4530-129 Facility Emissions Smmnary .................................................................................... 33
15.0 Form 4530-109 Miscellaneous Processes ........................................................................................... 35
16.0 Form 4530-118 Compliance Certification - Monitoring and Reporting Methods .............................. 38
17.0 Form 4530-125 Recordkeeping .......................................................................................................... 40
18.0 Fonn 4530-126 Emission Unit HAP Smnmary ................................................................................. .42
19.0 Form 4530-128 Emission Unit Summary ........................................................................................... 44
20.0 Form 4530-134 Index of Air Pollution Pennit Application Fonns ..................................................... 46

Attachment A - Figures and Drawings
Figure 1 - Facility Plot Plan
Figure 2 - Site Location Map
List of Attachments
Attachment B-Project Prevention of Significant Deterioration (PSD) Applicability Volatile Organic Compound Emission Calculation
Table 1-1 Prevention of Significant Deterioration (PSD) Applicability Volatile Organic Compound Emission Calculation Summary
Table 1-2 Projected Actual Withdrawal Loss Calculations
Table 1-3 Capable of Being Accommodated Withdrawal Loss Calculations
Table 1-4 Baseline Actual Throughput and Volatile Organic Compound Emission Summary
Table 1-5 Project Piping Component Fugitive Volatile Organic Compound Emission Calculations
Table 1-6 Permitted Maximum Terminal Throughput Capacity Summary
Table 1-7 Project Green House Gas Emission Calculations
Attachment C -Facility-Wide Potential to Emit Calculation Summary Tables
Table 2-1 MTE/PTE Emission Calculation Smnmary
Table 2-2 MTE/PTE Facility-Wide Volatile Organic Compound Emissions Smnmary
Table 2-3 MTE/PTE Facility-wide Hazardous Air Contaminant and Hazardous Air Pollutant Emission Calculation Summary
Table 2-4 MTE/PTE Tank Roof Landing Volatile Organic Compom1d Emission Calculations
Table 2-5 MTE/PTE Piping Component Fugitive Volatile Organic Compound Emission Calculations
Table 2-6 MTE/PTE Crude Oil Heater Emission Calculations
Table 2-7 MTE/PTE Diesel Fuel Powered Fire Pump and Emergency Generator Emission Calculations
Table 2-8 MTE/PTE Tank Properties and Throughput Smnmary
Table 2-9 MTE/PTE Sump Tank Emission Calculations
Table 2-10 MTE/PTE Pigging Equipment Emission Calculations
Table 2-11 MTE/PTE Green House Gas Emissions from Storage Tanks
Attachment D - TANKS Emissions Summary Report
Attachment E - NR445 Compliance Modeling Analysis
Attachment F - 2011 Annual Compliance Certification
11

Attachment G - 2011 Actual Emission Calculation Summary Tables
Attachment H - PSD Permit Application BACT Analysis
Attachment I - PSD Penni! Application Additional Impact Analysis
111

1.0 Introduction
Enbridge Energy, Limited Partnership (Enbridge) is proposing to increase the delivery of crude oil
through its existing pipeline system to accommodate its shippers' increased transportation
requirements in serving secure and reliable crude oil supplies to refineries and nu1nerous 1narketing
hubs throughout the United States. The increased crude oil delivery will be accomplished through the
utilization of additional crude oil transportation capacity through Enbridge's pipeline system, adding
additional storage capacity at the Superior Terminal, and adding/modifying additional facility piping
within the Superior Terminal.
Enbridge is submitting the enclosed Prevention of Significant Deterioration (PSD) permit application
for the Superior Terminal Enhancement Project. Enbridge is requesting approval to construct two
new external floating roof storage tanks and to expand the total facility outbound pipeline throughput
of the Superior Terminal.
1.1 Source Description Enbridge operates a crude oil storage tenninal located at 2800 East 21st Street, Superior, Wisconsin
and consists of 40 storage tanks of varying capacity and design. The terminal's storage tanks are
identified as tanks TO 1 through T40 (refer to the Facility Site Location Map and Plot Plan in
Attachment A). Enbridge utilizes the tanks as breakout storage for crude oil arriving into the Superior
Tenninal from inbound pipelines prior to flow volume metering and reinjection back into the
outbound pipelines for continued transportation via Enbridge's pipeline system to refineries and
other market hubs.
The Superior Terminal also operates an 84.4 MMbtu-per-hour process heater that is used to heat
crude oil to improve viscosity and decrease the amount of energy required to pump the oil, three fire
pumps, six emergency generators, pig receiver/launchers, sump tanks, pumps, and piping components
such as valves and flanges.
The Superior Tenninal is classified as code 486110 in the North American Industry Classification
System (NAICS) for pipeline transportation of crude oil or as code 4612 in the U.S. Standard
Industrial Classification (SIC) system.

1.2 Operating Permit Source Status The Superior Terminal is currently a Part 70 (major) source which operates under operation permit
number 816010580-PO 1 and construction pennit 08-DCF-313. The existing terminal is considered a
major stationary source for Title V permitting and PSD purposes and is an area (minor) source for
hazardous air pollutants (HAPs) (Enbridge has accepted permit limitations to remain below the major
source thresholds of 25 tpy total HAP and 10 tpy of any single HAP).
Douglas County is designated attainment or unclassifiable for the National Ambient Air Quality
Standards for all criteria pollutants [carbon monoxide (CO), lead, nitrogen oxides (NOx), ozone,
particulate matter less than 2.5 microns in diameter (PM2.5), particulate matter less than 10 microns
in diameter (PMlO), and sulfur dioxide (S02)].
1.3 Description of Proposed Project Enbridge proposes to construct two new external floating roof tanks, each with a maximum liquid
storage capacity of 584,232 barrels (bbl) (24,537,744 gallons). Each new tank will have a
nominal/shell capacity of 640,000 barrels and a working capacity of approximately 504,000 barrels.
The tanks, identified as tanks T41 and T42 will be 286 feet in diameter and 55.75 feet high and will
be used to store crude oil. Piping equipment, including valves and flanges, will be constructed to
connect the proposed tanks to the Superior Terminal's piping manifolds.
Jn addition, the proposed project will increase the Superior Terminal's throughput capacity to
accommodate an increased inbound crude oil volume of 120,000 barrels per day (bbl/day) from Line
67 (increase from 450,000 bbl/day to 570,000 bbl/day) and an increase in outbound capacity of
395,000 bbl/day (increase from 440,000 bbl/day to 835,000 bbl/day) on Line 61. The pipeline
throughput capacities are based on an annual average throughput rate. To accommodate the
additional volume of crude oil being transported through the Superior Terminal and to efficiently
segregate products and maintain product quality of the crude as it travels through Enbridge's system,
Enbridge is proposing the following modifications of existing pumping and piping infrastructure
throughout the Terminal:
• Manifold modifications to improve connectivity, pipeline delivery flexibility, and to enhance Enbridge' s ability to segregate crude oil product batches through quality pooling and minimize product quality degradation due to mixing
• Replacement of existing piping within the facility with larger diameter piping to meet increased pipeline delivery rates
• Construction of additional piping and manifold piping connections
2

• Construction/modification/replacement of pumps and piping components (valves, flanges, etc.)
The proposed project will be constructed in phases with incremental throughput increases and piping
changes being completed over a three year period. Enbridge has included all Superior Terminal
throughput capacity increases that are currently anticipated within the three year period in this permit
application. Enbridge is requesting that the initial tenn of the construction permit be 36 months to
accommodate the construction schedule.
The proposed project emission increase is estimated to be 48.26 tons per year (tpy) (refer to the
project emissions summary calculations in Attachment B). The proposed project emission increase is
above the 40 tpy volatile organic compounds (VOC) significant emission rate for ozone as defined at
40 CFR 52.21(b) 23 ands. NR 405.02 (27)(a). As a result, Enbridge is submitting this PSD permit
application for the proposed project.
The proposed project will also result in an estimated 875 tpy increase in terminal green house gas
emissions (GHG) (calculated as C02 equivalents or C02e). Refer to Attachment B, Table 1-7 for a
summary of the project GHG emissions. The proposed new tanks and increased pipeline throughput
capacity will result in additional methane emissions which are considered a GHG. The proposed
project will not debottleneck, modify or affect tenninal combustion sources such as the crude heater,
fire pumps or emergency generators. The crude heater is only capable of heating crude oil prior to
delivery on Line 6A and the Line 6A throughput will not be debottlenecked as a result of the project.
The proposed increase in GHG emissions resulting from the project are below the 75,000 tpy C02e
trigger that requires PSD review for GHG emissions.
3

2.0 Emission Calculation Discussion
Air emissions from the terminal consist primarily ofVOCs from storage tank operations, piping
components (i.e., valves, flanges, pump seals) and a small amount from combustion sources (crude
oil heater and emergency diesel engines). Storage tank emissions are generated from standing losses
(rim seal losses, deck fitting losses, and deck seam losses), withdrawal losses, and floating roof
landing losses (refer to the facility-wide potential to emit calculations in Attachment C).
Storage tank emissions resulting from standing and withdrawal losses are calculated using US
Environmental Protection Agency (EPA) TANKS emission calculation program. Tank emissions
calculated using the TANKS program are provided in Attachment D. Internal and external floating
roof landing loss emission values are calculated using the methodology described in the EPA AP-42,
Chapter 7.1, Organic Liquid Storage Tanks guidance document (EPA, Compilation of Air Pollutant
Emission Factors, Volume 1, 5th edition, November 2006). Refer to the rooflanding emissions in
Table 2-4 of the facility-wide potential to emit calculations in Attachment C.
Fugitive emissions from piping components are calculated using marketing terminal average
emission factors from the Protocol for Equipment Leak Emission Estimates (EPA Office of Air
Quality Planning and Standards, November 1995, EP A-453/R-95-017). Enbridge assumes that all
piping components are in light liqnid VOC service and operate 8, 760 hours per year. Refer to the
piping component fugitive emission calculations in Table 2-5 of the facility-wide potential to emit
calculations in Attachment C.
Hazardous air pollutant (HAP) emissions are calculated based on crude oil chemical speciation data
from two data sources. The first data source is EPA's TANKS program crude oil chemical speciation
profile, the second source is an EPA EPCRA Section 313 industry guidance document for petroleum
tenninal and bulk storage facilities. The individual HAP speciation profiles are used to calculate the
vapor weight fraction using the calculation methodology described in the AP! Manual of Petroleum
Measurement Standards Chapter 19.4 - Recommended Practice for Speciation of Evaporative Losses,
Second Edition dated September 2005. If the two HAP speciation data sources contained different
speciation data for the same chemical, the higher of the two liquid or vapor weight fractions is used
in the calculations. HAP emissions are calculated by multiplying the total VOC emissions for an
emission unit by the HAP liquid or vapor weight fraction depending on the emission type. HAP
emissions from working losses are calculated by multiplying the working loss voe emissions by the
individual HAP liquid weigh fraction. HAP emissions from all other tank emissions and other
4

emission units are calculated by multiplying the voe emissions by the vapor weight fraction of the
individual HAP compounds.
The terminal is subject to WDNR hazardous air contaminant (HAC) regulations per s. NR 445.
Benzene is the only HAC emitted at the tenninal that exceeds NR445 emissions thresholds. Enbridge
has completed an air quality impacts analysis to demonstrate that HAC emissions from the Tenninal
comply with WDNR NR445 Control of Hazardous Pollutant regulations (refer to the NR445
Compliance Modeling Summary and summary calculations in Attachment E).
Tank throughput is bottlenecked by the maximum terminal outbound pipeline capacity, which will be
2,455,000 bbl/day after the proposed expansion of Line 61. The maximum terminal outbound
pipeline capacities are summarized in Attachment B, Table 1-6. With this permit application,
Enbridge is attempting to standardize the manner in which pipeline capacities are permitted.
Throughputs for the pipelines that are not increasing as a result of the proposed project may differ
from the capacities used in previous permit applications. The throughput that Enbridge is permitting
is the 1naxiinum daily capacity on an annual average basis (noted as Maxiinu1n Annual Pipeline
Capacity in bbl/day). The maximum daily pipeline design capacity is not achievable on an annual
basis due to required maintenance on the pipelines. In addition to standardizing the pipeline
capacities used in pennitting, we have also rounded the throughputs capacities to the nearest 1000
bbl/day accuracy or three significant figures instead of additional significant figures that are a result
of calculations.
Typically, the throughput for an individual tank is calculated based on the individual tanks capacity
as a fraction of the total tenninal storage capacity. This would result in approximately 93 turnovers
per tank per year for each of the 42 tanks. However to be consistent with previous permits,
emissions for tanks TO 1 through T34 were calculated based on 87 turnovers per year and emissions
for Tanks T35 through T40 and the proposed new tanks, T4 l and T42, are estimated based on 200
turnovers per tank per year, which is the estimated future potential throughput of the tanks. This
method results in combined tank throughput which exceeds the terminal's maximum throughput by
approximately 19% or 583,946 bbl/day and results in an over-estimation of potential emissions from
the storage tanks.
The number of turnovers should not be construed as an individual tank turnover or throughput limit.
This throughput is being used to estimate annual average withdrawal losses for the terminal's storage
tanks. Some tanks will have a higher number of actual turnovers and some tanks will have a lower
5

number of actual turnovers. Refer to the project emissions calculations in Attachment B and the
facility-wide emission calculations in Attachment C.
Tank emissions are calculated using crude oil with a Reid vapor pressure (RVP) of I 0.2 pounds per
square inch (psi) which is the representative of the worst case (highest vapor pressure) materials
being stored at the Superior Terminal.
6

3.0 Form 4530-100 Facility Identification
7

/:l -x )()( -.;l05
State of Wisconsin Department of Natural Resources dnr.wi.gov
OCT 1 0 2012 Facility Identification
Jr , , Air Pollution Control Permit Appl ication Form 4530-100 (R 1/11)
Notice: Use of this form is required by the Department for any air pollution control permit application filed pursuant toss. 285.61 , 285.62 or 285.66, Wis. Stats. Completion of this form is mandatory. The Department will not consider or act upon your application unless you complete and submit this application form. You are required to submit two copies in accordance withs. NR 407.05(2), Wis. Adm. Code. Personal information collected will be used for administrative purposes and may be provided to requesters to the extent required by Wisconsin's Open Records Law [ss. 19.31-19.39, Wis. Stats.]. Facility Information Facility Name Standard Industrial Class Code (SIC) Facility ID Number (FID) Enbridge Energy, Limited Partnership 4612 816010580
Street Address (where pollution sources are/will be located) 2800 East 21 Street
18] City of Superior
0 Town O Village County Douglas
Primary Operating Activity (e.g., lead-acid battery manufacturer ttw facility .an or sulfite paper mill) designated as nonattainment .
Pipeline transportation of crude oil D Yes No (refer to instruction booklet)
Applicant Information Applicant Name (provide full business or individual's name) Enbridge Energy, Limited Partnership
Mailing Address City 1320 Grand Ave Superior
Parent Corporation or Owner Name (if not wholly owned by applicant) Enbridge Energy, Limited Partnership
Mai ling Address 1320 Grand Ave
City Superior
State WI
If yes, indicate the pollutant(s) for the nonattainment designation
State WI
ZIP Code 54880
ZIP Code 54880
Country (if not U.S.)
Responsible Official Name-person legally responsible for the operation of the permitted air pollution sources [see NR 4D0.02(8De), Wis. Adm. Code] Mark Willoughby
Title GM, Superior Region
Phone Number 7153941410
Permit Contact Person - to be contacted for additional information concerning air pollution sources Rhonda O'Leary
Title Senior Air Quality Analyst
Phone Number 7153984756
Instructions: If applying for a construction permit (including modification, reconstruction, relocation, and replacement), you MUST also apply for an operation permit, an operation permit renewal, or an operation permit revision. Select 'Operation Permit' if you currently do not have a facility-wide operation permit. Select 'Operation Permit Renewal' if you are renewing your facility-wide operation permit in conjunction with the proposed project. Otherwise, select 'Operation Permit Revision' so that your facility-wide operation permit will be revised to reflect the proposed project.
Permit Type: 18] Construction Permit Anticipated construction start date: 05/01 /13
mm/dd/yy 18] Initial application fee attached ($7,500)
Anticipated operation start date: 07 /01 /14 mm/dd/yy
0 Construction Permit Exemption and Authority -List appropriate Code citation: -----0 Construction Permit Revision - List permit to be revised: -------------
18] Operation Permit Revision - List permit to be revised: 816010580-P01 --------------0 Administrative Revision
D Minor Revision (must be accompanied .by Form 4530-137)
D Significant Revision
18] Operation Permit - select type:
D Operation Permit Renewal - select type:
18] Part 70 Source 0 Synthetic Minor, Non - Part 70 Source D Non - Part 70 Source
List permit to be renewed: ______________ _
0 Elective Operation Permit (if requesting an operation permit that is otherwise not required) 0 Operation Permit Exemption and Authority - List appropriate Code citation: ____ _
Expedited review fee: If expedited review requested and fulfilled within the following time Periods, the construction permit application fee you will be billed will include a surcharge for this additional service:
50 days from receipt of completed D application for a review not conducted under ch. NR 405 or
408- $5,000
60 days from receipt of completed 181 application for a review conducted
under ch. NR 405 or 408 - $7,500
90 days from receipt of completed D application for a review conducted
under ch. NR 405 or 408 - $4,000
Is additional information attached?
18] Yes 0 No
Are two copies of completed form and additional information included?
18] Yes 0 No

-------------------- --------
4.0 Form 4530-101 Facility Plot Plan
9

State of Wisconsin FACILITY PLOT PLAN Departtnent ofNatural Resources AIR POLLUTION CONTROL PERMIT APPLICATION
Fonn4530-101 Rev. 12-99
Use of this fonn is required by the Department for any air pollution control pennit application filed pursuant to ss. 285 .61, 285.62 or 285.66, Wis Stats. Completion of this form is mandatory. The Depart1nent will not consider or act upon your application unless you co1nplete and submit this form. It is not the Department's intention to use any personally identifiable information from this form for any other purpose.
In order for a comprehensive air quality analysis to be accomplished, a facility plot plan MUST be included with the pennit application. Ifthe application is for an initial operation permit, submit the elements under #2 below. Ifthe application is for a renewal, answer #1 below first.
l, Have there been changes to the facility plot plan since the previous operation pennit application was submitted? D No. The plot plan submitted with the original application can be used for the renewal. IE! Yes. An up-to-date plot plan is attached. Note: See Figures 1 aud 2 iu Attachment A
2. If there have been changes to the facility plot plan since the last operation permit application submittal, RESUBMIT an up-to-date plot plan which must include the following or the permit application will be deemed incomplete:
FOR DEPARTMENT USE ONLY
COMPLETE INCOMPLETE NOT APPLICABLE
1. A building layout (blueprint, plan view) including all buildings occupied by or located on the site of the facility.
2. The maximum height of each building (excluding stack height).
3. The location and numerical designation of each stack. Please ensure these designations correspond to the appropriate stacks listed on the other permit forms in this application.
4. The location of fenced property lines (if any).
5. Identify direction "North" on all submittals.
6. All drawings shall be to scale and shall have the scale graphically depicted.
7. An additional regional map depicting the facility location in relation to the surrounding vicinity (roads or other features) shall be included.
Are there any outdoor storage piles on the facility site? IE! Yes 0 No
If so, v.rhat material does the pile(s) consist of? Temporary contaminated soil storage piles
Are there any dirt roads or unpaved parking lots on the facility site? IE! Yes 0 No
Note: Traffic on unpaved areas at the terminal consists of mowers and maintenance vehicles in the tank farm area. Emissions from paved and unpaved areas at the terminal are considered insignificant.
10

--------------------------------------
5.0 Form 4530-102 Source and Site Descriptions
11

State of Wisconsin SOURCE AND SITE DESCRIPTIONS Departinent of Natural Resources AIR POLLUTION CONTROL PERMIT APPLICATION
Fonn 4530-102 Rev. 12-99 Information attached? -1'!.._(y/n)
Use of this form is required by the Department for any air pollution control permit application filed pursuant toss. 285.61, 285.62 or 285.66, Wis Stats. Co1npletion of this fonn is mandatory. The Department will not consider or act upon your application unless you complete and sub1nit this fonn. It is not the Department's intention to use any personally identifiable information from this fonn for any other purpose.
l.Briefly describe the proposed project or existing Unit(s) to be permitted. Attached supplemental forms as needed.
Enbridge proposes to construct two new external floating roof tanks, each with a maximum liquid storage capacity of 584,232 barrels (bbl) (24,537,744 gallons). The tanks, identified as tanks T41 and T42 will be 286 feet in diameter and 55.75 feet high and will be used to store crude oil. Piping equipment including valves and flanges will be constructed to connect the proposed tanks to terminal piping manifolds.
Enbridge proposes to construct two new external floating roof tanks, each with a maximum liquid storage capacity of 584,232 barrels (bbl) (24,537,744 gallons). Each new tank will have a nominal/shell capacity of 640,000 barrels and a working capacity of approximately 504,000 barrels. The tanks, identified as tanks T41 and T42 will be 286 feet in diameter and 55.75 feet high and will be used to store crude oil. Piping equipment, including valves and flanges, will be constructed to connect the proposed tanks to the Superior Terminal's piping manifolds. In addition, the proposed project will increase the Superior Terminal's throughput capacity to accommodate an increased inbound crude oil volume of 120,000 barrels per day (bbl/day) from Line 67 (increase from 450,000 bbl/day to 570,000 bbl/day) and an increase in outbound capacity of 395,000 bbl/day (increase from 440,000 bbl/day to 835,000 bbl/day) on Line 61. The pipeline throughput capacities are based on an annual average throughput rate. To accommodate the additional volume of crude oil being transported through the Superior Terminal and to efficiently segregate products and maintain product quality of the crude as it travels through Enbridge's system, Enbridge is proposing the following modifications of existing pumping and piping infrastructure throughout the Terminal:
•Manifold modifications to improve connectivity, pipeline delivery flexibility, and to enhance Enbridge's ability to segregate crude oil product batches through quality pooling and minimize product quality degradation due to mixing
•Replacement of existing piping within the facility with larger diameter piping to meet increased pipeline delivery rates •Construction of additional piping and manifold piping connections •Construction/modification/replacement of pumps and piping components (valves, flanges, etc.)
For Renewal Applications: Not applicable 1. Were any new or 1nodified emissions units installed/modified at the facility since the last operation permit issuance date?
D No. Proceed to fmm 4530-102A. D Yes. Answer the following questions:
2. Briefly describe any nev..r/inodified e1nissions units installed at the facility since the last operation pennit issuance date and include the following infonnation. Attach supple1nental fo1ms as needed. Not applicable
a. List the Depart111ent issued construction and/or operation pennit number as applicable (identifying which units were covered by which permit if multiple pennits issued). i. If operation permit application forms were submitted for the new emission unit(s) covered by the construction pennit
mentioned above, reference the date of that application. ii.For Part 70 Sources Only: If no operation pennit application forms were submitted for the new emissions unit(s)
covered by the construction permit mentioned above, complete the appropriate forms 4530-118 through 4530-125. b. Include the Departinent issued construction permit exemption number, if one was assigned, or reference the date of the
letter of the exemption.
2. Site Description The Enbridge Superior terminal is located on 179 acres at the intersection of Bardon A venue and 21st Street in Superior, Wisconsin. The terminal consists of 40 existing storage tanks which are operated as crude oil pipeline breakout tanks.
12

-------------------------------------
6.0 Form 4530-102A Source Description Supplemental
13

State of Wisconsin SOURCE DESCRIPTION - SUPPLEMENTAL Department ofNatural Resources AIR POLLUTION CONTROL PERMIT APPLICATION
Form 4530-102A Rev. 12-99 Information attached?....!'!_ (yin) Use of this form is required by the Depart111ent for any air pollution control permit application filed pursuant toss. 285.61, 285.62 or 285.66, Wis Stats. Completion of this form is mandatory. The Department will not consider or act upon your application unless you co111plete and submit this form. It is not the Deparhnent's intention to use any personally identifiable information fro111 this form for any other putpose. 1. List all significant existing or proposed air pollution units, operations, and activities at the facility. A short narrative of the
inventory of air pollution e1nissions unit (e.g., boiler, printing line, etc.) followed by equipment specifications will suffice. If the facility consists of several individual einission units, present this information in an outline format. (See instruction booklet for an example Unit description.)
Existing Emission Units Process Tank TO!. External floating roof tank, 16,380,000 gallon capacity Process Tank T02, External floating roof tank, 16,380,000 gallon capacity Process Tank T03, Domed external floating roof tank, 6,300,000 gallon capacity Process Tank T04, Domed external floating roof tank, 6,300,000 gallon capacity Process Tank T05, External floating roof tank, 6,300,000 gallon capacity Process Tank T06, External floating roof tank, 6,300,000 gallon capacity Process Tank T07, External floating roof tank, 6,300,000 gallon capacity Process Tank T08, External floating roof tank, 6,300,000 gallon capacity Process Tank T09, External floating roof tank, 6,300,000 gallon capacity Process Tank TlO, External floating roof tank, 6,300,000 gallon capacity Process Tank Tl 1, External floating roof tank, 6,300,000 gallon capacity Process Tank T12, External floating roof tank, 6,300,000 gallon capacity Process Tank Tl3, External floating roof tank, 9,114,000 gallon capacity Process Tank Tl4, External floating roof tank, 9,114,000 gallon capacity Process Tank T15, External floating roof tank, 9,114,000 gallon capacity Process Tank T16, External floating roof tank, 9,114,000 gallon capacity Process Tank Tl 7, External floating roof tank, 9,114,000 gallon capacity Process Tank Tl8, External floating roof tank, 9,114,000 gallon capacity Process Tank Tl9, External floating roof tank, 9,114,000 gallon capacity Process Tank T20, External floating roof tank, 9,114,000 gallon capacity Process Tank T21, External floating roof tank, 9,114,000 gallon capacity Process Tank T22, External floating roof tank, 9,114,000 gallon capacity Process Tank T23, External floating roof tank, 9,114,000 gallon capacity Process Tank T24, External floating roof tank, 9,114,000 gallon capacity Process Tank T25, External floating roof tank, 9,114,000 gallon capacity Process Tank T26, Do1ned external floating roof tank, 9,114,000 gallon capacity Process Tank T27, External floating roof tank, 9,114,000 gallon capacity Process Tank T28, Internal floating roof tank, 9,114,000 gallon capacity Process Tank T29, Internal floating roof tank, 9,114,000 gallon capacity Process Tank T30, External floating roof tank, 10,500,000 gallon capacity Process Tank T3 l, External floating roof tank, 10,500,000 gallon capacity Process Tank T32, External floating roof tank, 7,680,000 gallon capacity Process Tank T33, External floating roof tank, 7,680,000 gallon capacity Process Tank T34, External floating roof tank, 16,471,098 gallon capacity Process Tank T35, External floating roof tank, 8,673,426 gallon capacity Process Tank T36, External floating roof tank, 8,673,426 gallon capacity Process Tank T37, External floating roof tank, 8,673,426 gallon capacity Process Tank T38, External floating roof tank, 8,673,426 gallon capacity Process Tank T39, External floating roof tank, 8,673,426 gallon capacity Process Tank T40, External floating roof tank, 8,673,426 gallon capacity Process HOl Crude Oil Heater, SOI, 84.4 lVWbtu natural gas heater, Excluded fro111 operating permit requirements Process EG I, EG2, EG3, EG4, EG5 - Diesel Engine Emergency Generators, ENI, ENG2, EN3 - Diesel Engine Water Pumps Process EG6, Stack 11 - Laboratory Emergency Generators Process FOi, Stack S02 -Piping Component/Pumping Fugitive VOC: Process STOI- ST03: Process (sump) Tanks, and Process PGO!- PG03: Pigging Equipment/ Operations
14

New Emission Units Process T41, External floating roof storage tank, 24,537,744 gallon capacity Process T42, External floating roof storage tank, 24,537,744 gallon capacity
For Renewal Applications: Not applicable 1. If there were any new or modified emissions units installed/modified at the facility since the last operation permit issuance date:
a. If any of these new/modified units were exe1npt from construction permit requirements, but are significant e1nissions units and operation pennit application(s) for the new unit(s) were submitted to the Department reference the date of those submittals.
b. If any of the new/modified units are insignificant emissions units list them on fonn 4530-102B. c. If any of the ne\v/modified emissions units do not fit any of the above categories, fill out the appropriate forms for each
emissions unit as follo\vs: i. For Part 70 Sources: Fill out the appropriate fonns 4530-103 through 4530-133; OR 11. For Synthetic Minor Non Pmi-70 Sources and Non-Pmi 70 Sources: Fill out the appropriate fonns 4530-103 through
4530-117 and 4530-126 through 4530-129.
15

-----------------------------------
7.0 Form 4530-1028 Source Description Supplemental
16

------------- ----------------------------------------------
State of\Visconsin SOURCE DESCRIPTION - SUPPLEMENTAL Department ofNatural Resources AIR POLLUTION CONTROL PERMIT APPLICATION
Form 4530-1028 Rev. 12-99 Information attached? _lL (y/n)
Use of this form is required by the Department for any air pollution control permit application filed pursuant toss. 285.61, 285.62 or 285.66, Wis Stats. Completion of this fonn is mandatory. The Department will not consider or act upon your application unless you co1nplete and subn1it this form. It is not the Depart1nent's intention to use any personally identifiable infonnation fro1n this fonn for any other purpose.
1. Mark all insignificant existing or proposed air pollution units, operations, and activities at the facility listed below. If not listed, provide a short narrative of the inventory of air pollution emissions unit (e.g., boiler, printing line, etc.) followed by equipment specifications. If the facility consists of several individual emission units, present this information in an outline format. For Renewal Applications, identify those that are new since the last update to your application. (See instruction booklet for an example Unit description.)
of grounds, equipment, and buildings (lawn care, painting, etc.) Maintenance activities (including lawn care, pest control, grinding. cutting, brazing, soldering, welding, sand blasting,
painting, fiber glassing, woodworking, general repairs and cleaning, etc) Boiler, turbine, and HV AC system maintenance
D Pollution control equipment 1naintenance Fire control equipment
IB1 Janitorial activities IB1 Office activities IB1 Convenience water heating 1BJ Convenience space heating(< 5 million BTU/hr Burning Gas, Liquid, or Wood)
oil storage tanks(< 10,000 gal.) Stockpiled conta1ninated soils
D Demineralization and oxygen scavenging of water for boilers Purging of natural gas lines Sanitary sewer and plumbing venting Parts cleaner
1BJ Electric incinerating toilet Chemical laboratory Pipeline and storage tank hydrostatic test water discharge Pipeline pigging equipment (prior to 2007) Pipeline pig cleaning facility with oil water separator Sump tanks (prior to 2007) Pipeline pressure relief surge tank systems Pipeline drag reducing agent (DRA) totes Mobile natural gas liquid flare Internal co1nbustion engines used for warehousing and 1naterial transpo1i from cars, trucks, forklifts, courier vehicles, front
loaders, graders, cranes, carts, hydrostatic and hydraulic testing equip1nent, maintenance trucks, helicopters, portable generators (engine driven) (that are moveable by hand), portable pumps, portable air compressors, portable welding machines (engine driven), and po1iable fuel tanks
Fugitive emissions from paved and unpaved roads Vacuu1n tanker truck emissions
1BJ Solid waste disposal containers Barbecue grills
17

---------------------------------------
8.0 Form 4530-105 Storage Tanks
Forms are included for the new external floating roof storage tanks T41 and T42 only.
18

----------------------------------------- -----------------------
State of Wisconsin STORAGE TANKS ')epaitment ofNatural Resources AIR POLLUTION CONTROL PERMIT APPLICATION
Fonn 4530-105 11-93 lnfonnation attached? _y_ (y/n) SEE ATTACHED SHEET FOR INSTRUCTIONS See the attached TANKS Summary Reports in Attachment C for a complete listing of the tank's physical properties.
I.Facility Name: Enbridge Energy. Limited Partnership
4.Control Device NUlllber (use number frmn appropriate Fonn(s) 4530-110, 111, 112, 113, 114, 115, 116,or117) Not applicable
7.Tank Height 8.Tank Diameter
2.Facility Identification Nmnber: 816010580
5.Storage Tank Capacity 24.537.744 gallons
9.Color ofTank (check one)
3.Storage Tank Number T41
6.Date of Installation or Last Modification Construction commence in May 2013 Initial fill in July 2014
_K_ White Other __________ Underground 55.75 feet 286 feet
1 O.ls this tank equipped with a submerged fill pipe? I I .ls this tank equipped with a pressure/vacuwn conservation vent? Yee _X_No
_X_ Yes No If yes; at what pressw·e is it set? _________ (psia)
at what vacuum is it set? (psia)
12.Type of Storage Tank (check one) _Open Top Tank
Pressurized Tank
13.For all Fixed RoofTanks:
a.Tank Configuration (check one):
fixcdRoof _X_ External .Floating Roof
(upright cylinder)
__ Fixed Roofw/Intemal floating Roof _ Variable Vapor Space
Horizontal
Roof - Indicate tank roof height ______ (feet)
_Other (specify)
b.Tank Roof Type (check one): (required if vertical was selected) _Dome Roof - Indicate tank roof height (feet) - Indicate tank shell radius ______ (feet)
14.For all Floating Roof Tanks (both internal and external) - Shell Condition (check one):
.5.For External Floating Roof Tanks: a.Tank Consttuction (check one):
b.Average Wind Speed at Tank Site:
c.Rim Seal System Description (check one): _ Shoe Mounted Primary _X Shoe Primary, Rim Secondary _ Shoe Primary, Shoe Secondary
d.RoofType (check one):
--2f. _Light Rust
_X Welded Tank Riveted Tank
_Vapor Mounted Primary _Vapor Primary, Rim Secondary _Vapor Primary w/\\1eather Shield
_ X _Pontoon Roof Double Deck Roof
e.Roof Fitting Types (indicate the number of each type):
Dense Rust _ Gunite Lined
_Liquid Mounted Primruy _Liquid Pritnary, Rim Secondary _Liquid Pri1nmy w/Weather Shield
Refer to the TANKS emission summary reports in Attachment D for the complete list of tank deck fittings
Access Hatches (3 are 24'' diameter and 3 are 3'x 4') _6_ Bolted cover, gaskcted
Unbolted cove1, ungasketed __ Unbolted cover, gasketed
Gauge-Hatch!srunple well (8" diameter) _9_ Weightcd mechanical actuation,
gasketed __ Weighted mechanical actuation,
iutgasketed
Unslotted guide-pole well (8" dimneter unslotted pole, 21" diameter well) __ Ungasketed sliding cover _!_ Gasketed sliding cover
Vaculllil Breaker (12" diameter well) _6_ Weighted mechanical actuation,
gasketed __ W cightcd mechanical actuation,
ungasketed
Slotted guide-pole/smnple well (8" diaineter dimneter slotted pole, 21" dimneter well)
Roofleg (3'' diatneter)
__ Ungasketed sliding cover, without float __ Ungasketed sliding cover, with float __ Gasketed sliding cover, without float __ Gasketed sliding cover, with float
_Jl_ Adjustable, pontoon area , sock ____l:!Q__ Adjustable, center area, sock __ Adjustable, double-deck roofs
Fixed
_ Gasketed sliding cover, with float, sleeve and wiper, -1- Gasketcd sliding cover, sleeve and wiper, without float,
Continued on following page
Gauge-float well (20" diameter) __ Unbolted cover, ungasketed __ Unbolted cover, gaskctcd __ Bolted cover, gasketed
Roof Drain (3-inch diameter) __ Open
90o/o closed
Roofleg(2-1/2" diameter) __ Adjustable, pontoon area
Adjustable, center ru·ea __ Adjustable, double deck rootS
Fixed
19

State of\Visconsin STORAGE TANKS 'Jeprutment ofNatura\ Resources AIR POLLUTION CONTROL PERMIT APPLICATION
Form 4530-105 11-93 Infonnation attached? ..Y.. (yin) page2
See the attached TANKS Summary Reports in Attachment C for a complete listing of the tank's physical properties.
16.For Internal Floating Roof Tanks:
a.Rim Seal System Description (check one): _Vapor Mounted Primary _Liquid Mounted Pri1nruy
_Vapor Mounted Pritnary plus Sccondmy Seal _ Liquid Mounted Pritnary plus Secondary Seal
b.Number of Columns:
c.EftCctive Coluinn Diatneter: _________ (feet)
cl.Deck Type (check one): Welded Bolted
e.Total Deck Scam Length: __________ (feet)
f.Deck Arca: __________ (square teet)
g.Dcck fitting Types (indicate the nmnber of each type):
Access Hatch (24" diameter) Automatic gauge float well __ Bolted cover, gasketed __ Unbolted cover, gasketed __ Unbolted cover, ungasketed
__ Bolted cover, gasketed __ Unbolted cover, gasketed __ Unbolted cover, ungasketed
Column Well (24" diameter) Sample pipe or well (24'' diameter) __ Builtup colmnn-slidlng cover, gasketed __ Slotted pipe-sliding cover, gasketcd __ Builtup column-sliding cover, ungasketed __ Slotted pipe-sliding cover, ungasketed
Ladder Well (36" diaineter) __ Sliding cover, gasketed __ Sliding cover, ungasketed
Roof leg or hanger well __ Adjustable
Fixed __ Pipe column-flexible fabric sleeve seal __ Smnple well-slit fabric seal IOo/o open area __ Pipe column-sliding cover, gasketed __ Stub drain (1" diameter) __ Pipe colrnnn-sliding cover, ungaskctcd
VacuUlil breaker (10" diameter) __ V..7 eighted inechanical actuation, gasketed __ Weighted mechanical actuation, ungasketed
17.For Variable Vapor Space Tanks: VolUlile Expansion Capacity __ Ni A ________ (gallons)
18 .C01nplete the tOJlowing table for niaterials to be stored in this tank:
' ··.·
.. . ·.·· -Daily Average Material Molecu.tar: I - JvlaterialVapor .··
Annual Throughput A.J:Qollnt Stored Weight Pressure StoragePressme _- ", Material Stored J:gal/y') - (gallons) (ll>nb'mole) --1 ]i,sia) -"-
18,403,308 Crude Oil 4,907 ,548,800 Assumes 75% 50 5.68 Atmospheric
(RVP 10.2) (200 tmnovers) of the tank 13.98 capacity
19.Maximmn Liquid Loading Rate of Tank: 60 500 (gallons/nlin)
20.Can this tank be loaded at the same tllne other tanks are loaded? _x_ Yes No
I Average Storage
I , Temperature , • ("F)
42.46
Tfycs, indicate which other tanks can be loaded at the san1e time: Capacity exists to fill all tanks simultaneously. but event is unlikely.
21. Describe the operations this tank will serve: Crude oil storage
20
Material Liquid Density
·. (lblll..ti _,
7.1

State of Wisconsin STORAGE TANKS Oepartincnt ofNatural Resources ATR POLLUTION CONTROL PERMIT APPLICATION
Form 4530-105 I I-93 TntOmmtion attached? _x_ (y/n) SEE ATTACHED SHEET FOR INSTRUCTIONS Sec the attached TANKS Summary Repo11s in Attachment C for a complete listing of the tank's physical properties.
I .Facility Nmne : Enbridge Energy. Limited Partncrshin 2.Facility Identification Number: 816010580
4.ControI Device Nmnber (use number from appropriate Form(s) 4530-110, 5.Storage Tank Capacity Ill, 112, 113, 114, 115, 116,orIJ7) Not applicable 24.537.744 gallons
7.Tank Height 8.Tank Diatneter 9.Color of Tank (check one)
3.Storage Tank Nmnber T42
6.Date of Installation or Last Modification Construction commence in 1\1ay 2013 Initial fill in July 2014
_lL \Vhite Other __________ Underground 55.75 feet 286 feet
IO.Is this tank equipped with a submerged fill pipe? I I.Is this tank equipped with a pressure/vacuum conservation vent? y"
l Yes No If yes; at what pressure is it set? _________ (psia)
at what vacuum is it set? (psia)
I2.Type of Storage Tank (check one) _Open Top Tank
Presswized Tank
13.For all Fixed Roof Tanks:
a.Tank Configuration (check one):
Fixed Roof l External Floating Roof
_Vertical (upright cylinder)
__ Fixed Roofw/lntemal Floating Roof _ V miable Vapor Space
Horizontal
_Cone Roof- Indicate tank roof height ______ (feet)
_Other (specify)
b.Tank Roof Type (check one): (required if vertical was selected) _Dome Roof - Indicate tank roof height (feet) - Indicate tank shell radius ______ (feet)
I4.For all Floating RoofTanks (both internal and external) - Shell Condition (check one):
J 5.For External Floating Roof Tanks: a.Tank Construction (check one):
b.Average Wind Speed at Tanlc Site:
c.Riln Seal System Description (check one): _ Shoe Mounted Primary _X Shoe Primary, Rim Secondary _ Shoe Primaty, Shoe Secondary
d.RoofType (check one):
__..K _ Light Rust
_X Welded Tank Riveted Tank
_Vapor Mounted Primary _Vapor Primary, Rhn Secondaty _Vapor Prllnary w/Weather Shield
_ X _Pontoon Roof Double Deck Roof
e.RoofFiuing Types (indicate the nmnber of each type):
Dense Rust _ Gunite Lined
_Liquid Mounted Pr:U.nary _Liquid Prllnary, Rim Secondary _Liquid Pr:U.nary w /\Veather Shield
Refer to the TANKS emission summary reports in Attachment D for the complete list of tank deck fittings
Access Hatches (3 are 24" diameter and 3 are 3'x 4') _6_ Bolted cover, gasketed __ Unbolted cover, ungasketed __ Unbolted cover, gask1.ied
Gauge-Hatch/smnplc well (8" diameter) _9_ \Veighted tnechanical actuation,
gasketed __ Weighted mechanical actuation,
ungasketed
Unslotted guide-pole well (8" diameter unslottcd pole, 2I" diameter well) __ Ungasketed sliding cover _1_ Gasketed sliding cover
Vacuum Breaker ( I2" dimnctcr well) __&_Weighted mechanical actuation,
gasketed __ Weighted 1nechanical actuation,
ungasketed
Slotted guide-pole/smnple well (8" diameter diameter slotted pole, 21 " dimneter well)
Roofleg (3" diameter)
__ Ungasketed sliding cover, without float __ Ungasketed sliding cover, with float __ Gaskcied sliding cover, without float __ Gasketed sliding cover, with float
· ____2l__ Adjustable, pontoon area , sock _JAQ__ Adjustable, center area, sock __ Adjustable, double-deck roofs
Fixed
_ Gasketed sliding cover, with float, sleeve and wiper, _1_ Gasketed sliding cover, sleeve and wiper, without float,
Continued on following page
Gauge-float well (20" dimneter) __ Unbolted cover, ungasketed __ Unbolted cover, gasketed __ Bolted cover, gasketed
Roof Drain (3-inch diameter) __ Open
90% closed
Roofleg(2-I/2" diameter) __ Adjustable, pontoon area __ Adjustable, center area __ Adjustable, double deck roofs
Fixed
21

\tate of Wisconsin STORAGE TANKS Department ofNatural Resources AIR POLLUTION CONTROL PERMIT APPLICATION
Fonn 4530-105 11-93 Information attached? _x__ (y/n) page2
See the attached TANKS Summary Reports in Attachment C for a complete listing of the tank's physical properties.
16.For Inte1nal Floating RoofTanks:
a.Rim Seal System Description (check one): Mounted Ptimary Mounted Primary
b.Nutnber ofColu1nns:
c.Effective Colmnn Diameter: _________ (feet)
d.Deck Type (check one): Welded Bolted
e.Total Deck Seam Length: __________ (feet)
f.Deck Area: __________ (square feet)
g.Deck Fitting Types (indicate the number of each type):
_ Vapor Mounted Prllnary plus Secondary Seal _Liquid Mounted Primary plus Secondary Seal
Access Hatch (24" diameter) __ Bolted cover, gasketed __ Unbolted cover, gasketed __ Unbolted cover, ungasketed
Autmnatic gauge float well __ Bolted cover, gasketed __ Unbolted cover, gasketed __ Unbolted cover, ungasketed
Ladder \Vell (36" dimneter) __ Sliding cover, gasketed __ Sliding cover, ungasketed
Colutnn Well (24" diameter) Smnple pipe or well (24" dimneter) __ Builtup colmnn-sliding cover, gasketed __ Slotted pipe-sliding cover, gasketed __ Builtup colutnn-sliding cover, ungasketed __ Slotted pipe-sliding cover, ungasketed
Roof leg or hanger well __ Adjustable
Fixed __ Pipe column-flexible tilbric sleeve seal __ Sample well-slit fabric seal 1 Oo/o open area __ Pipe column-sliding cover, gasketed __ Stub drain (I" dimneter) __ Pipe column-sliding cover, ungasketed
Vacuum breaker (10" diameter) __ Weighted mechanical actuation, gasketed __ \Veighted mechanical actuation, ungasketed
17.For Variable Vapor Space Tanks: Volume Expansion Capacity __ NIA ________ (gallons)
l 8.Co1nplete the following table fortnaterials to be stored in this tank:
-,- - -,-.
. Daily Average -- Material Molecular Materi'al Vapor Average-Storage . Annlial Throughput Amount Stored Weight Pres-sure Storage-Pressure Temperature Material Stored (gaVyr) (lb/lb-mole) (pi& -'- (°F) -'-
18,403,308 Crude Oil 4,907 ,548,800 Assutnes 75o/o 50 5.68 Atmospheric 42.46 (RVP 10.2) (200 turnovers) of the tank 13.98
capacity
19.Maximum Liquid Loading Rate ofTank: 60 500 (gallons/min)
20.Can this tank be loaded at the satne tllne other tanks are loaded? _X_ Yes No
If yes, indicate which other tanks can be loaded at the same tllne: Capacity exists to fill all tanks simultaneously, but event is unlikely.
21. Describe the operations this tank will serve: Crude oil storage
22
Materfa:t Liqitid D_enSity (lb/gal)
7.1

9.0 Form 4530-118 Compliance Certification -Monitoring and Reporting Methods
Fonn is included for the new external floating roof storage tanks T41 and T42 only.
23

--------------------------------------------------------------
State of Viisconsin Department of Natural Resources
COMPLIANCE CERTIFICATION - MONITORING AND REPORTING DESCRIPTION OF METHODS USED FOR DETERMINING COMPLIANCE Form 4530-118 11-93 Information attached? __ti_ (y/n)
All applicants except non-Part 70 sources are required to certify compliance with all applicable air pollution permit requirements by including a statement within the permit application of the methods used for determining compliance (please see sec. NR 407.05( 4)(i), Wis. Adm. Code.) This statement 1nust include a description of the monitoring, recordkeeping, and reporting requirements and test methods. In addition, the application Jnust include a schedule for compliance certification submittals during the permit term. These subn1ittals must be no less frequent than annually, and may need to be more frequent if specified by the underlying applicable requirement or by the Department.
SEE INSTRUCTIONS ON REVERSE SIDE
2.Facilit identification number: 816010580
3. Stack identification number: NIA 4. Unit identification number: T41 and T42
5. This Unit will use the following method(s) for detennining compliance with the requirements of the permit (check all that apply and attach the appropriate form(s) to this form).
D Continuous Emission Monitoring (CEM)- Fann 4530-119 Pollutant(s):
D Periodic E1nission Monitoring Using Portable Monitors - Fonn 4530-120 Pollutant(s):
D Monitoring Control System Parameters or Operating Parameters of a Process - Form 4530-121 Pollutant(s):
D Monitoring Maintenance Procedures - Form 4530-122 Pollutant(s):
D Stack Testing - Form 4530-123 Pollutant(s):
D Fuel Sampling and Analysis (FSA) - Fonn 4530-124 Pollutant(s):
181Recordkeeping-Form4530-125 Pollutant(s): VOC
D Other (please describe)- Fonn 4530-135 Pollutant(s):
6. Compliance certification reports will be submitted to the Department according to the following schedule:
Start date: January 1. 2014 and every 12 months thereafter.
Compliance monitoring reports will be submitted to the Department according to the follo\ving schedule:
Start date: January 1, 2014 and every 12 months thereafter.
24

10.0 Form 4530-125 Recordkeeping
Form is included for the new external floating roof storage tanks T41 and T42 only.
25

State of Wisconsin Depart1nent ofNatural Resources
COMPLIANCE DEMONS1RATION BY RECORDKEEPING AIR POLLUTION CONTROL PERMIT APPLICATION Form 4530-125 11-93 Information attached? _]i_ (yin)
Recordkeeping may be acceptable as a co1npliance demonstration method provided that a correlation between the para1neter value recorded and the emission rate of a particular pollutant is established in the fonn of a curve or chart of emission rate versus parameter values. This correlation may constitute the certification of the system. It should be attached for Department approval. If it is not attached, please submit it within 60 days of the startup of the system.
SEE INSTRUCTIONS ON REVERSE SIDE
1. Faci@y_ name: Energy, Limited Partnersh!I!_
3. Stack identification number: N/ A
5. Pollutant(s) being monitored: VOC
7. Method of monitoring and recording: Maintain records in accordance with NR 440.285.
8.List any EPA methods used: NIA
9. Is this an existing 1nethod of den1onstrating compliance? 181 Yes D No
11. Backu s stern: None
2. Facility_identification number: 816010580
4. Unit identification number: T41 thro'!l;_h T42
6. Material or parameter being 1nonitored and recorded: (a) The volatile organic liquid stored, (b) The period of storage, (c) Tank throughput, (d) The maximum true vapor pressure of that volatile organic liquid during the respective storage period, (e) The typical Reid vapor pressure of each type of petroleum liquid stored, (f) Monthly tank emissions based on a 12 consecutive month average and, fa) The dates on which the storage vessel is ellljJ!y,
10. Installation date: December 2010
12. Compliance shall be demonstrated: D Daily D Weekly 181 Monthly D Batch (not to exceed monthly)
13. Indicate by checking:
The monitoring syste1n shall be subject to appropriate performance specifications, calibration require1nents, and quality assurance procedures. DA quality assurance/quality control plan for the record.keeping syste1n is attached for Department approval. 181 If the plan is not attached, please sub1nit it within 60 days of the startup of the recordkeeping program. D The plan was submitted to the Depart1nent on
*****The compliance records shall be available for Depart1nent inspection. The format for the compliance ***** certification report and the excess e1nission report shall be approved by the Department. A proposed format for the co1npliance certification report and excess e1nission report shall be sub1nitted at the same time as the application.
***** The source shall record any malfunction that causes or inay cause an e1nission limit to be exceeded. ***** Malfunctions shall be reported to the Department the next business day. Hazardous air spills shall be reported to the Department ilnmediately.
26

---------------------------------------------------
11.0 Form 4530-126 Emission Unit HAP Summary
Form is included for the new external floating roof storage tanks T41 and T42 only.
27

------------------------------------------------------
3tate of Wisconsin Department of Natural Resources
EMISSION UNIT HAZARDOUS AIR POLLUTANT SUMMARY AIR POLLUTION CONTROL PERMIT APPLICATION Fonn 4530-126 11-93 Information attached? _x_ (yin)
SEE INSTRUCTIONS ON REVERSE SIDE
2. Facilit identification number: 816010580
3. Stack identification number: NIA 4. Unit identification number: T41 throu h T42
5. Unit 1naterial description: Crude Oil
6. Co1nplete the following sun1mary of hazardous air e1nissions fro1n this unit. Attach sample calculations and einission factor references. Attached? See emission calculation summarv tables in Attachment C. - --Pollutant CAI> ·. ACtual emissiOns -"-- Maxiulum theoretical emissions Potential to emit
Units Units
See the project emission calculation summary tables in Attachment C TPY
TPY
TPY
TPY
TPY
TPY
TPY
TPY
TPY
TPY
TPY
TPY
TPY
TPY
TPY
TPY
TPY
28

12.0 Form 4530-127 Facility Hazardous Air Pollutant Summary
29

----------------------------------------------
State of Wisconsin Depart1nent of Natural Resources
FACILITY HAZARDOUS AIR POLLUTANT SUMMARY AIR POLLUTION CONTROL PERMIT APPLICATION Form 4530-127 11-93 Information attached? _x_ (yin)
SEE INSTRUCTIONS ON REVERSE SIDE
1. Facility na1ne: Enbridge Energy, Limited Partnership 2.Facility identification number: 816010580
3. Complete the following emissions suminmy for all hazardous air emissions at this facility (as defined in ch. NR 445, Wis Adm. Code, and sec. 112, 1990 Clean Air Act See emission calculations located in Attachment C and G. -.,.- ---:- -.,.-
Pollutant CAS A:ctU:al emissions Maximum theoretical emissions Potential to emit
Units Units
__IEY_
See the facility-wide emission PTE calculation summary tables located in Attachments C and the TPY 2011 actual Emissions summary table in Attachment G.
TPY
TPY
TPY
TPY
TPY
TPY
TPY
TPY
TPY
TPY
TPY
TPY
TPY
TPY
TPY
TPY
TPY
TPY
TPY
TPY
TPY
TPY
TPY
30

-------------------------------
13.0 Form 4530-128 Emission Unit Summary
Form is included for the new external floating roof storage tanks T41 and T42 only.
31

------------------------------------------------------------
State ofWisconsin EMISSION UNIT SUMMARY DeparlJnent of Natural Resources AIR POLLUTION CONTROL PERMIT APPLICATION
Form 4530-128 11-93 Infonnation attached? _x_ (y/n) SEE INSTRUCTIONS ON REVERSE SIDE
1. Facility na1ne: Enbridge Ener , Limited Partnershi 2. Facility identification number: 816010580
3. Stack identification number: NIA 4. Unit identification number: T41 throu h T42
5. Complete the following emissions summary for the following pollutants. Attach sample calculations and emission factor references.
Attached? See thf;_pTQJ_ect em1ss1on calculation summai:ytables in Attachment B and C
Air pollul3"1 -'-. L
. •·... . . .· . ·. . I . Maximum theoretical Potential to emit Maximum allowable
I · emissions · ..:. . Actual
. _ u TPY l TPY u TPY
Particulates TPY
Sulfur dioxide TPY
Organic co1npounds See the project emission calculation summary tables in Attachment B and C.
Carbon inonoxide TPY
Lead TPY
Nitrogen oxides TPY
Total reduced sulfur TPY
Mercu!l'._ TPY
Asbestos TPY
Bervllium TPY
Vill2'.! chloride TPY
TPY
TPY
TPY
TPY
TPY
Units (U) should be entered as follows:
I 2 = lb/m1nBTU 3 = grains/dscf 4 = lb/ gallon 5 = ppmdv 6 =other (specify) 7 =other (specify) 8 =other (specify)
32

14.0 Form 4530-129 Facility Emissions Summary
33

State of Wisconsin FACILITY EMISSIONS SUMMARY Depaittnent of Natural Resources AIR POLLUTION CONTROL PERMIT APPLICATION
Fonn 4530-129 11-93 Information attached?__}'._ (y/n) SEE INSTRUCTIONS ON REVERSE SIDE
1. Facilit name: Enbridge Energy, Limited Partnership 2. Facilit identification number: 816010580
3. Co1nplete the following emissions summary for the listed einissions at this facility. See emission calculations located in Attachment C and G
. . . · .. . . . Air pollutant Actual Maximunttheoretical einiSSioils i ··•.• Potent.ial Maximum
. . . -
. . ... -"-- to emit .· allowable
TPY TPY TPY TPY
Particulates See the facility-wide emission PTE calculation summary tables located in Attachments C and the 2011 actual Emissions summa!Y_ table in Attachment G.
Sulfur dioxide See the facility-wide emission PTE calculation summary tables located in Attachments C and the 2011 actual Emissions summa!Y_ table in Attachment G.
Organic co1npounds See the facility-wide emission PTE calculation summary tables located in Attachments C and the 2011 actual Emissions summal)'._ table in Attachment G.
Carbon inonoxide See the facility-wide emission PTE calculation summary tables located in Attachments C and the 2011 actual Emissions summa!Y_ table in Attachment G
Lead See the facility-wide emission PTE calculation summary tables located in Attachments C and the 2011 actual Emissions summary table in Attachment G.
Nitrogen oxides See the facility-,vide emission PTE calculation summary tables located in Attachments C and the 2011 actual Emissions summa!:r_ table in Attachment G.
Total reduced sulfur
Mercury See the facility-,vide emission PTE calculation summary tables located in Attachments C and the 2011 actual Emissions summa!:r_ table in Attachment G.
Asbestos
chloride
34

15.0 Form 4530-109 Miscellaneous Processes
Fonn is included for the new Piping Component/Pumping Fugitives only.
35

State of Wisconsin MISCELLANEOUS PROCESSES Departinent of Natural Resources AIR POLLUTION CONTROL PERMIT APPLICATION
Fonn 4530-109 11-93 Information attached? _x_ (y/n) SEE INSTRUCTIONS ON REVERSE SIDE
I .Facility name: Enbridge Energy, Limited Partnership
3. Stack identification nun1ber: Existing Stack S02
2.Facility identification number: 816010580
4.Process number: Existing Process FOl
4a. Unit description: Piping Component/Pumping Fugitives
5.lndicate the control technology status. l&I Uncontrolled D Controlled
If the process is controlled, enter the control device number(s) from the appropriate form(s): 4530-110 __ 4530-111 4530-112 4530-113 4530-114 4530-115 4530-116 4530-117
6. Source Classification Code (SCC): 400400151
7.Date of construction or last modification: May 2013.
8. Normal operating schedule: ---1:!__ hrs./day __ 7_ days/wk. 365 days/yr.
9.Describe this process (please attach a flow diagram of the process). Fugitive emissions from piping components (valves, flanges, etc) and pumps
10. List the types and amounts of raw 1naterials used in this process:
Attached? N/ A
Material Storage/material handling Average u_sage
Units Maximum-usage Units
Crude Oil
Clean-up solvents
Other (specify)
1.. process
Transfer for crude oil from pipeline to tanks and back to the_jlijieline
11. List the types and amounts offm1shed products:
Material
Not Applicable
12. Process fuel usage:
Type of fuel
Not Applicable
Storage/material handling process
Maximum heat input to process million BTU/hr.
8760 hr/yr
Average amount
produced
Average usage
Units
Units
I 8760
M_axiln_um Units amonnt produced
-MriJS:iinurn usage Units
hr/yr
36

-------------------------------------------
13. Describe any fugitive emissions associated with this process, such as outdoor storage piles, unpaved roads, open conveyors, etc.:
Attached?
***** For this emissions unit, identify the method(s) of co1npliance demonstration by completing Fonn 4530-118, *****
*****
DESCRIPTION OF METHODS USED FOR DETERMINING COMPLIANCE. Attach Form 4530-118 and its attachrnent(s) to this form. This is not a requirement of non-Part 70 sources.
Please complete the Air Pollution Control Permit Application Forms 4530-126 and 4530-128 for this Unit. *****
37

16.0 Form 4530-118 Compliance Certification -Monitoring and Reporting Methods
Form is included for the new Piping Component/Pumping Fugitives only.
38

-------------------------------------------------
)tate of Wisconsin Dcparttnent ofNatural Resources
COMPLIANCE CERTIFICATION - MONITORING AND REPORTING DESCRIPTION OF METHODS USED FOR DETERMINING COMPLIANCE Form 4530-118 11-93 Information attached? .1i__ (yin)
All applicants except non-Part 70 sources are required to certify co1npliance with all applicable air pollution permit requirements by including a statement within the permit application of the methods used for determining compliance (please see sec. NR 407.05(4)(i), Wis. Adm. Code.) This state1nent 1nust include a description of the monitoring, recordkeeping, and reporting requirements and test methods. In addition, the application 1nust include a schedule for co1np1iance certification submittals during the permit term. These sub1nittals must be no less frequent than annually, and may need to be more frequent if specified by the underlying applicable require1nent or by the Department.
SEE INSTRUCTIONS ON REVERSE SIDE
2. Facilit identification number: 816010580
3. Stack identification number: Existin Stack S02 4. Unit identification number: Existin Process FOl
5. This Unit will use the following method(s) for determining compliance with the requirements of the permit (check all that apply and attach the appropriate fonn(s) to this form).
D Continuous Emission Monitoring (CEM) - Fann 4530-119 Pollutant(s):
D Periodic Emission Monitoring Using Portable Monitors - Form 4530-120 Pollutant(s):
D Monitoring Control System Parameters or Operating Parameters of a Process - Form 4530-121 Pollutant(s):
D Monitoring Maintenance Procedures - Form 4530-122 Pollutant(s):
D Stack Testing -Form 4530-123 Pollutant(s):
D Fuel Sampling and Analysis (FSA) - Form 4530-124 Pollutant(s):
181 Recordkeeping -Form 4530-125 Pollutant(s): VOC
D Other (please describe)- Form 4530-135 Pollutant(s):
6. Co1npliance certification reports wi!l be submitted to the Department according to the following schedule:
Start date: January 1. 2014 and every 12 1nonths thereafter.
Compliance monitoring reports \Vill be submitted to the Department according to the following schedule:
Start date: January 1, 2014 and every 12 months thereafter.
39

---------------------------------------------------------
17.0 Form 4530-125 Recordkeeping
Form is included for the new Piping Component/Pumping Fugitives only.
40

)tate of Wisconsin Deparbnent of Natural Resources
COMPLIANCE DEMONSTRATION BY RECORDKEEPING AIR POLLUTION CONTROL PERMIT APPLICATION Fonn 4530-125 11-93 Information (y/n)
Recordkeeping 1nay be acceptable as a compliance demonstration method provided that a correlation between the parameter value recorded and the emission rate of a particular pollutant is established in the form of a curve or chart of emission rate versus parameter values. This correlation may constitute the certification of the syste1n, It should be attached for Department approval. Ifit is not attached, please sub1nit it within 60 days of the startup of the system.
SEE INSTRUCTIONS ON REVERSE SIDE
l.Facilityname: Limited Partnershil>_
3. Stack identification number: Existing Stack S02
5. Pollutant(s) being monitored: VOC
7. Method of 1nonitoring and recording: Maintain records in accordance \Vith NR 439.04.
8. List any EPA methods used: Not applicable
9. Is this an existing method of demonstrating compliance? 181 Yes D No
11. Backup system: None
2. Facili!Y_identification number: 816010580
4. Unit identification number: Existing Process FOl
7. Material or parameter being monitored and recorded: (a) Maintain records of inspection, repair, and 1naintenance of the piping components (e.g. fittings, flanges, valves, pumps, etc_l
10. Installation date: December 2010
12. Compliance shall be demonstrated: D Daily D Weekly 181 Monthly D Batch (not to exceed monthly)
13. Indicate by checking:
The monitoring system shall be subject to appropriate performance specifications, calibration requirements, and quality assurance procedures. D A quality assurance/quality control plan for the recordkeeping syste1n is attached for Department approval. 181 If the plan is not attached, please submit it within 60 days of the startup of the recordkeeping program. D The plan was submitted to the Department on
*****The compliance records shall be available for Depart1nent inspection. The fonnat for the compliance ***** certification report and the excess emission report shall be approved by the Depart1nent. A proposed format for the co1npliance certification report and excess emission report shall be sub1nitted at the same time as the application.
***** The source shall record any malfunction that causes or may cause an e1nission limit to be exceeded. ***** Malfunctions shall be repo1ted to the Department the next business day. Hazardous air spills shall be reported to the Department immediately.
41

18.0 Form 4530-126 Emission Unit HAP Summary
Form is included for the new Piping Component/Pumping Fugitives only.
42

State of Wisconsin Department of Natural Resources
EMISSION UNIT HAZARDOUS AIR POLLUTANT SUMMARY AIR POLLUTION CONTROL PERMIT APPLICATION Form 4530-126 11-93 Inf01mation attached? _x_ (yin)
SEE INSTRUCTIONS ON REVERSE SIDE
2.Facilit identification number: 816010580
3. Stack identification nu1nber: Existin Stack S02 4. Unit identification number: Existin Process FOI
5. Unit material description: Crude Oil
6. Complete the following summary of hazardous air emissions fro1n this unit. Attach sample calculations and emission factor " A h d? S th . t 1 I f t bl . Art h t C re erences. ttac e ee e_l!fQJ_ec em1ss1on ca cu a ion summan:_ a es 1n ac men
··. .. M ... h. . I ....
··. .
Pollutant CAS Actual emissio'ns axnnu_m t _eorebca e1n1ss1ons ---• -'- l'oten.tiru to emit .
Units Units
See the project emission calculation summary tables in Attachment C TPY
TPY
TPY
TPY
TPY
TPY
TPY
TPY
TPY
TPY
TPY
TPY
TPY
TPY
TPY
TPY
TPY
43

19.0 Form 4530-128 Emission Unit Summary
Form is included for the new Piping Component/Pumping Fugitives only.
44

State of Wisconsin EMISSION UNIT SUMMARY Depmiment ofNatural Resources AIR POLLUTION CONTROL PERMIT APPLICATION
Fonn 4530-128 11-93 Information attached? _y_ (yin) SEE INSTRUCTIONS ON REVERSE SIDE
, Limited Partnershi 2. Facilit identification number: 816010580
3. Stack identification number: Existin Stack S02 4. Unit identification number: Existin Process F01
6. Complete the following emissions summary for the following pollutants. Attach sample calculations and emission factor references.
tac 1e . ee At l d? S th . .
Air pollutant .•
...c_ .
u TPY
Particulates
Sulfur dioxide
Organic compounds
Carbon monoxide
Lead
oxides
Total reduced sulfur
Asbestos
Beryllium
Vinyl chloride
Units (U) should be entered as follows:
1 =lb/hr 2=lb/mmBTU 3 = grains/dscf 4 = lb/ gallon 5 =ppmdv 6 =other (specify) 7 =other (specify) 8 =other (specify)
emission ca cu at1on summar . t I l . ta es1n ttac ment bl . A h B dC an ... I .··: .· . ·· . Actual Maximum .I Potential to emit I Maximum allowable
theoretical --'- . .·· emissions , -- -2··. ...c_ ___:_c:_
u TPY u TPY
TPY
TPY
See the project emission calculation summary tables in Attachment Band C.
TPY
TPY
TPY
TPY
TPY
TPY
TPY
TPY
TPY
TPY
TPY
TPY
TPY
45

20.0 Form 4530-134 Index of Air Pollution Permit Application Forms
46

Stale of Wisconsin Department of Natural Resources l.ADMINISTRA TION
INDEX OF AIR POLLUTION PERMIT APPLICATION FORMS Form 4530-134 Rev. 12-99
This application contains the following forms:
li51Fonn 4530-100, Facility Identification
li51Form 4530-101, Facility Plot Plan
li51Forms 4530-102, -102A, and -102B, Source and Site Descriptions
IL EMISSIONS SOURCE Total Number DESCRIPTION of This Form
This application contains the DFonn 4530-103, Stack Identification following forms (one fonn
DForm 4530-104, Boiler or Furnace for each facility boiler, printing operation, etc.):
li51Form 4530-105, Storage Tanks 2
DForm 4530-106, Incineration
DForm 4530-107,
DFom1 4530-108, Paintingand Coati11g_ O_JJerations
l!JForm 4530-109, Miscellaneous Processes 1
Ill.AIR POLLUTION CONTROL Total Number SYSTEM of This Form
This application contains the DFonn 4530-110, Miscellaneous following forms:
DForm 4530-111, Condensers
DFonn 4530-112, Adsorbers
DForm 4530-113, Cata!Jc!ic or Thennal Oxidation
DFonn 4530-114, Chambers
DForm 4530-115, Electrostatic Prec.lEitators
DFonn 4530-116, Wet Collection
DForm 4530-117, Baghouses/Fabric Filters
IV.COMPLIANCE Total Number DEMONSTRATION of This Form
This application li51Form 4530-118, Compliance Certification - Monitoring and 2 contains the following forms (one for each facility DFonn 4530-119, Continuous E1nission Monitorigg_ boiler, printing
DForm 4530-120, Periodic Emission Monitoring Using Portable operation, etc.): Monitors
DForm 4530-121, Control System Parameters or Operation Parameters of a Process
DFonn 4530-122, Monitoring Maintenance Procedures
47

DForm 4530-123, Stack Testing
DForm 4530-124, Fuel and Analysis
IElForm 4530-125, Recordkeeping 2 V.EMISSION SUMMARY AND COMPLIANCE Total Nmnber of CERTIFICATION This Form
This application IElForm 4530-126, Emission Unit Hazardous Air Pollutant Smnmary 2 contains the following forms IElForm 4530-127, Facility Hazardous Air Pollutant Summary 1 quantifying emissions, certifying IElFonn 4530-128, Emission Unit Summary 2 compliance with
IElForm 4530-129, Facility Emissions Smnrnary applicable 1 requiren1ents, and
DForm 4530-130, Current Emissions Requirements and Status of developing a compliance plan Unit
DForm 4530-131, Emission Unit Compliance Plan - Commitments and Schedule
IElForm 4530-132, CmTent Emissions Requirements and Status of 1 Facility
DFonn 4530-133, Facility Requirement Compliance Plan Commitments and Schedule
" VI.SIGNATURE OF RESPONSIBLE OFFICIAL A.STATEMENT OF COMPLETENESS
I have reviewed this application in its entirety and, based on information and belief formed after reasonable inquiry, I certify that the state1nents and information contained in this application are true, accurate and con1plete.
B.FOR RENEWALS ONLY I have reviewed this application, the original operation permit application dated , and operation pennit number in their entirety and, based on information and belief fanned after reasonable inquiry) I certify that the statements and information contained in this renewal application are true, accurate and complete.
C.CERTIFICATION OF FACILITY COMPLIANCE STATUS (check one box only) THIS IS NOT A REQUIREMENT OF NON-PART 70 SOURCES.
ll9 I certify that the facility described in this air pollution permit application is fully in compliance with all applicable require1nents.
D I certify that the facility described in this air pollution pennit application is fully in compliance with all applicable requirements, except for the following entlssions unit(s):
(list all non-con1£!Jin_g_ units)
Printed or Typed Nmne Title
Mark General
Date Signed LJ<'.T. C\ , z_o 1 z __ L c v SEND ALL MATERIALS TO:
N 1 DEPARTMENT OF NA TUR R WISCO S N AL RESOU CES BUREAU OF AIR MANAGEMENT
OPERATION PERMIT TEAM LEADER P.O. BOX 7921
MADISON, WI 53707-7921 48

.
State of Wisconsin Department ofNatural Resources
CURRENT EMISSIONS REQUIREMENTS AND STATUS OF FACILITY AIR POLLUTION CONTROL PERMIT APPLICATION Form 4530-132 I 1-93 Infonnation attached? _x._ (y/n)
SEE INSTRUCTIONS ON REVERSE SIDE
1. Facility name: Enbridge Energy, Limited Partnership 2. Facility identification number: 816010580
Pollutant . 4. Wis .. Adm. Code Wis. · 5. • 6. Threshold Value 7. Compliance Status I Slats., 40 CFR State
Only I (in or out)
_c:_ . . '
Refer to the 2011 Annual Compliance Certification in Various In Attachment F for a list of emission requirements and co1npliance status of the terminal.
Refer to the 2011 Annual Compliance Certification in * Various In Attachment F for a list of emission requirements and compliance status of the terminal.
'' 8.Is this facility subject to the provisions governing prevention of accidental releases of hazardous air contaminants contained in section l 12(r)(7) of the Clean Air Act?
DYes
If you answered yes, please describe how you will achieve compliance with these provisions, including the requirement to formulate a plan for preventing accidental releases (sec. 112(r)(7)(B)(ii)):
9 .. 0ther requirem·e:nts.(e .. g.·, lnalfunction·repo1iin.g, speciaJ.,operatihg conditions fro1n an .. State Only F Compliance existing permit, etc.) . Status
I (in or out)
-'-.. -"- '
,' .· ,'
Refer to the 2011 Annual Compliance Certification in Attachinent F for a list of In einission requirements and compliance status of the terminal.
Refer to the 2011 Annual Coinpliance Ce1iification in Attachment F for a list of * In einission require1nents and con1pliance status of the terminal.
49

36" LINE 4 ........-==34" LINE 3 -?'." ........:==26" LINE 2 -<. 18" LINE 1 ............... .. -:.--... :rr:.:. ... --- -\-- _,
(c1l ._.,,. ¥cH.
C1 EL£C.
100 I
200 I
=- === =r= :I: ,, 0 ,:: J ___
N-;:;fe: T-he Husky Oil tanks T28 and T29 are operated by the Enbridge Terminal and are considered part of the terminal for permitting purposes
805
.. /'
/ //
/ /
/ /
G
.__ __ @
-- @@@®
I! I! I I
DOME PETROLEUM CORP . • ST ORAGE
i ! _.J
-- -··-··-··- ·- -··-··-··- _,:;.=..-..=;,:.= • r··-··-··r-·- ··- ,.,,.-
i i I ! i ,/ Proposed ! i // Loacation of Tank I . /
! J /// T41 and T42 j,/ i!
250 500 250 0 I I I I
GRAPHIC SCALE: , . - 250'-0"
LEGEND
D STATION STRUCTURE
D FOREIGN OWNED
0 BUILDING/AREA IDENTIFICATION A Sl\HCHGEAR/ESB BUl\.OING J HAZMAT S10RAGE AREA A2 VfD BUILDING Jl [ MERr.ENCY RESPONSE BUILO:NG A4 PUA BUILDING K UTILITY COOPANY SUBSTATION B PUMPHOUSE Kl ENBRIDGE SUBSTATION AREA c PCV. ENCLOSURE K3 GENERATOR BUILDING C1 EQUIPMENT BUILDING M CON1ROL BUILDING C2 INSTURMENT SHELTER 0 FIRE POND C4 SCR APER 'TRAP BUILDING 0 4 FLUME POND
D STORAGE BUILDING p METERING BUILDING/ A REA 02 UTILITY BUILDING R3 [LS PRESSURE RELIEF VESS E MANIFOLD AREA s OFFICE El MANIFOLD BUILDING Sl LAB F SUMP PUMP & TANK T3 CRUDE OIL HEATER F2 TANKER AREA v ORA/QUALITY SKID G MAINLINE VAL VE AREA Vl FUEL GAS SKID H ffl[ PROTECTION PUMPHOUS[
9 A00£0 36, J7, 38, J9 AND 40 2 -J15J"-10 SD
8 SHOW HUSKY/ MURPHY TANK S IO(Nl lF'ICAllON REOUEST
JSL SD 0 - 10-10 CCT
R[VIS(C CONTAINM(NT PONDS ANO RIVCR 9 - 29-10 SD 7 JSL
R£VIS£0 PER lSR '-MO AC AOOITIONS 3-12-10 SD 6 ND REVISION DATE APP
SUPERIOR (WI) TERMINAL Figure 1 Facility Plot Plan
SCALE: AS NOTED DATE: DRAWN: JT
CHECK: P..ll APPR: OAC DATE: 10-23-03
APPR: APPR: so D-1 .2-00472-9-130

Photo: Bing Maps Image Service
0 1 Inch = 1 ,500 Feet
0 750 1,500
Feet
Figure 2
3,000 -SITE LOCATION MAP
Enbridge Energy, Limited Partnership Superior, WI
ENBRIDGE'"

Table 1-1 Enbridge Energy, Limited Partnership - Superior, WI Terminal
Superior Terminal Enhancement Project Prevention of Significant Deterioration (PSD) Applicability Volatile Organic Compound Emission Calculation Summary
Projected Capable of Being Excluded Baseline Potential to Actual Accommodated Demand Growth Actual Emission
Emission Unit Emit<1l Emissions<2J Emissions<3l Emissions<4l Emissions<5l lncrease<61
Description (tpy) (tpy) (tpy) (tpy) (tpy) (tpy) Notes Tank T41 Standing and Roof Landing Tank T 41 withdrawal losses are included as part of the Loss Emissions 6.00 - - - 0 6.00 withdrawal loss emissions increase calculations below. Tank T42 Standing and Roof Landing Tank T42 withdrawal losses are included as part of the Loss Emissions 6.00 - - - 0 6.00 withdrawal loss emissions increase calculations below.
Project withdrawal loss emissions resulting from the Line 61 throughput capacity increase. The pipeline throughput
Tank Withdrawal Loss increase will not result in increased storage tank standing Emissions - 97.10 61.38 6.98 54.40 35.73 or roof landi!J..9_loss emissions.
Emissions from new pumps and piping components Piping Components 0.54 - - - 0 0.54 (valves, flanges etc) constructed for the project.
PSD Project Emission lncreasesl'' (ton VOC/year) 48.26
Prevention of Significant Deterioration Significant Emission Threshold (ton VOC/year) 40 Is total project emissions increase greater than the Prevention of Significant Deterioration Emission
Threshold? Yes
Notes: 1. Potential to emit for the proposed new storage tank and piping components that will be constructed as part of the proposed Superior Terminal Enhancement Project. Refer to Table 2-2 for the Tank T41 and T42 emission calculations and Table 1-5 for the piping component emission calculations. 2. Projected actual emissions calculated per NR 405.02 (25f) based on the proposed increase in the Line 61 pipeline capacity which will debottleneck the throughput capacity of the terminal. Projected actual withdrawal loss emissions are estimated based on the maximum out-bound pipeline throughput capacity of the terminal after completion of the proposed Line 61 project. Refer to the projected actual withdrawal loss emission in Table 1-2. 3. Tank withdrawal loss emissions that the terminal was capable of accommodating is calculated based on the maximum monthly terminal throughput for the years 2010 through 2011 which was 45,012,613 bbl in July 2010. Annualized throughput (maximum monthly throughput x 12 months) is equal to 1,479,867 barrels per day, refer to Table 1-3. 4. Excluded product demand growth emissions are calculated as the difference between the capable of accommodating emissions minus the baseline emissions. Calculated per the NR 405.02 (25f)(b)(2). 5. Baseline actual emissions for the 24-month period 201 O and 2011, refer to Table 1-4. 6. The proposed project includes existing and new emission units, the proposed project emission increase is calculated per the requirements specified in NR 405.025(3). Project emissions increase is calculated as the sum of the difference between the projected actual and the baseline actual emissions for existing emission units and the difference between the potential-to-emit emissions and the baseline actual emissions for new emission units. 7. Project emission increase conservatively includes additional withdrawal losses resulting from increased throughput due to de bottlenecking of the terminals outbound pipeline capacity and additional piping components to connect the project to exiting storage tanks and manifolds and the proposed new storage tanks.
1 of 7 10/9/2012

Storage Tank Number
T01 T02 T03 T04 T05 T06 TOT T08 TOO T10 T11 T12 T13 T14 T15 T16 T17 T18 T19 T20 T21 T22 T23 T24 T25 T28 T27 T28 T29 no T31 T32 T33 T34 T35 T36 T37 T38 T39 T40 T41 T42
Notes:
Tank Type EFRT EFRT
DEFRT DEFRT EFRT EFRT EFRT EFRT EFRT EFRT EFRT EFRT EFRT EFRT EFRT EFRT EFRT EFRT EFRT EFRT EFRT EFRT EFRT EFRT EFRT
DEFRT EFRT IFRT IFRT
EFRT EFRT EFRT EFRT EFRT EFRT EFRT EFRT EFRT EFRT EFRT EFRT EFRT
Table 1-2 Enbridge Energy, Limited Partnership- Superior, WI Terminal
Superior Terminal Enhancement Project Projected Actual Withdrawal Loss Calculations'1l
Existing Faclllly Throughput (bbl/day) Projected Actual Throughputl'I (bbl/day)
Projected Actual Throughput1'l (bbl/yr) Potential Project Throughput lncrease131 (bbl/day)
Q - D -Storage
Tank Percent of Total Working Terminal Tank Tank Volume Working Throughputl•I Diameter
(bbl) Volume (bbl/yr) (ft) 390,000 4.05% 36,292,411 210 390,000 4.05% 36,292,411 210 150,000 1.56% 13,958,619 150 150,000 1.56% 13,958,619 150 150,000 1.56% 13,958,619 150 150,000 1.56% 13,958,619 150 150,000 1.56% 13,958,619 150 150,000 1.56% 13,958,619 150 150,000 1.56% 13,958.619 150 150,000 1.56% 13,958,619 150 150,000 1.56% 13,958,619 150 150,000 1.56% 13,958.619 150 217,000 2.25% 20,193,470 180 217,000 2.25% 20,193,470 180 217,000 2.25% 20,193.470 180 217,000 2.25% 20,193,470 180 217,000 2.25% 20,193.470 180 217,000 2.25% 20,193,470 180 217,000 2.25% 20,193,470 180 217,000 2.25% 20,193,470 180 217,000 2.25% 20,193,470 180 217,000 2.25% 20,193.470 180 217,000 2.25% 20,193.470 180 217,000 2.25% 20,193,470 180 217,000 2.25% 20,193,470 180 217,000 2.25% 20,193,470 180 217,000 2.25% 20,193.470 180 217,000 2.25% 20,193,470 180 217,000 2.25% 20,193,470 180 250,000 2.60% 23,264,366 200 250,000 2.60% 23,264.366 200 182,857 1.90% 17,016,222 165 182,857 1.90% 17,016,222 165 392,169 4.07% 36.494,252 224 205,653 2.14% 19,137,546 180 205,653 2.14% 19,137,546 180 205,653 2.14% 19,137,546 180 205,653 2.14% 19,137.546 180 205,653 2.14% 19,137,546 180 205,653 2.14% 19,137,546 180 584,232 6.07% 54,367,148 28e 584,232 6.07% 54,367,148 286
2,060,000 2,455,000
896,075,000 395,000
N, -Number of fixed roof support columns
25 25
F, -Effective column
diameter
c, ·-Shell
Clfngage factor
(bbl/101)1) ft') 0.006 0.006 0.()06 0.006 0.006 0.006 0.006 0.006 0.006 0.006 0.006 0.006 0.006 0.006 0.006 0.006 0.006 0.006 0.006 0.006 0.006 0.006 0.006 0.006 0.006 0.006 0.006
1 0.006 1 0.006
0.006 0.006 0.006 0.006 0.006 0.006 0.006 0.006 0.006 0.006 0.006 0.006 0.006
Totals 9,629,265 '"" '"'"' 100.00% 896.075,000
w, 0.943 -·- ·- Lwo - .. Average Potential Potential
organic liquid Constant Withdraw a I Withdrawal density (1000 ft' Losses1' 1 Losses (lb/gal) gal/bbl') (lb VOC/yr) (ton VOC/yr)
7.1 0.943 6,943 3.47 7.1 0.943 6,943 3.47 7.1 0.943 3,738 1.87 7.1 0.943 3,738 1.87 7.1 0.943 3,738 1.87 7.1 0.943 3,738 1.87 7.1 0.943 3,738 1.87 7.1 0.943 3,738 1.87 7.1 0.943 3,738 1.87 7.1 0.943 3,738 1.87 7.1 0.943 3.738 1.87 7.1 0.943 3,738 1.87 7.1 0.943 4,507 2.25 7.1 0.943 4,507 2.25 7.1 0.943 4.507 2.25 7.1 0.943 4,507 2.25 7.1 0.943 4,507 2.25 7.1 0.943 4,507 2.25 7.1 0.943 4,507 2.25 7.1 0.943 4,507 2.25 7.1 0.943 4,507 2.25 7.1 0.943 4,507 2.25 7.1 0.943 4,507 2.25 7.1 0.943 4,507 2.25 7.1 0.943 4.507 2.25 7.1 0.943 4.507 2.25 7.1 0.943 4,507 2.25 7.1 0.943 5,133 2.57 7.1 0.943 5.133 2.57 7.1 0.943 4,673 2.34 7.1 0.943 4,673 2.34 7.1 0.943 4,143 2.07 7.1 0.943 4,143 2.07 ,.1 0.943 6,545 3.27 7.1 0.943 4,271 2.14 ,.1 0.943 4,271 2.14 7.1 0.943 4,271 2.14 7.1 0.943 4,271 2.14 7.1 0.943 4,271 2.14 7.1 0.943 4,271 2.14 7.1 0.943 7,636 3.82 T.1 0.943 7,636 3.82
97.10
1. Projected actual withdrawal loss emissions calculated based on the potential outbound pipeline capacity of 2.455,000 bbl/day after construction of the proposed Line 61 capacity expansion project. Refer to Table 1-6 for a summary of the permitted maximum tenninal throughput capacity 2. Calculated based on operation 365 days per year and maximum physical pipeline capacity 3. Difference between the existing facility throughput at 2,020,000 bbl/day and the projected actual throughput capacity at 2.455.000 bbl/day after the proposed Line 61 pipeline throughput capacity increase. The potential outbound pipeline capacity includes a true-up of the Calumet Refinery takeoff pipeline that is not associated with the proposed Mainline Enhancement Project. Enbridge has increased the Calumet Refinery pipeline throughput capacity used in the potential terminal throughput calculations from 35,000 bbl/day (refinery throughput capacity used historically} to 95.000 bbl/day (existing pipeline/pump capacity) 4. Individual storage tank throughput is calculated using a tank volume flow weighted throughput allocation, this calculation method results in the same number of turnovers for all tanks. The individual tank throughput is calculated by multiplying the potential facilrty-wide throughput by the storage tank capacity and dividing by the combined terminal tank capacity 5. Withdrawal loss formula from US Environmental Protection Agency, Compilation of Air Pollutant Emission Factors, Volume 1, 5th edition, AP-42, Chapter 7.1 Liquid Storage Tanks. November 2006, Formula 2-4.
(D.9J3)QC-s WL [1
_,_Ne Fe l D Dj
2 of7 101912012

Storage Tank Number
T01 T02 T03 T04 T05 T06 TOT T08 TOO T10 T11 T12 T13 T14 T15 T16 T17 T18 T19 T20 T21 T22 T23 T24 T25 T26 T27 T28 T29 T30 T31 T32 T33 T34 T35 T36 T37 T38 T39 T40
Notes:
Table 1.3 Enbridge Energy, Limited Partnership· Superior, WI Terminal
Superior Terminal Enhancement Project Capable of Being Accommodated Withdrawal Loss Calculations(1)
Month with Highest Throughput12> (bbl/month) Annuali;i:ed Maximum Monthly ThroughputP1 (bbl/yr)
Capable of Being Accomodated Throughput l3f (bbl/day)
45,012,613 540,151,356
1,479,867
2-4 Note 2 Ne
2-4 Note 3 Table 7.1-10 Table 7.1-2 Q D . F, . C; . w,
Storage Percent of Shell Average Tank Total Terminal Tank Tank Number of fixed Effective Cllngage organic liquid
Working Working Throughput(4l Diameter roof support column factor density Tank Type Volume (bbl) Volume (bbl/yr) (ft) columns diameter (bbl/1000 ft2
) (lb/gal) EFRT 390,000 4.61% 24,898,236 210 0.006 7.1 EFRT 390,000 4.61% 24,898,236 210 0.006 7.1
DEF RT 150,000 1.77% 9,576,245 150 0.006 7.1 DEF RT 150,000 1.77% 9,576,245 150 0.006 7.1 EFRT 150,000 1.77% 9,576,245 150 0.006 7.1 EFRT 150,000 1.77% 9,576,245 150 0.006 7.1 EFRT 150,000 1.77% 9,576,245 150 0.006 71 EFRT 150,000 1.77% 9,576,245 150 0.006 7.1 EFRT 150,000 1.77% 9,576,245 150 0.006 7.1 EFRT 150,000 1.77% 9,576,245 150 0.006 7.1 EFRT 150,000 1.77% 9,576,245 150 0.006 7.1 EFRT 150,000 1.77% 9,576,245 150 0.006 7.1 EFRT 217,000 2.56% 13,853,634 180 0.006 7.1 EFRT 217,000 2.56% 13,853,634 180 0.006 7.1 EFRT 217,000 2.56% 13.853,634 180 0.006 7.1 EFRT 217,000 2.56% 13,853,634 180 0.006 7.1 EFRT 217,000 2.56% 13,853,634 180 0.006 7.1 EFRT 217,000 2.56% 13,853,634 180 0.006 7.1 EFRT 217,000 2.56% 13,853,634 180 0.006 7.1 EFRT 217,000 2.56% 13,853,634 180 0.006 7.1 EFRT 217,000 2.56% 13,853,634 180 0.006 7.1 EFRT 217,000 2.56% 13,853,634 180 0.006 7.1 EFRT 217,000 2.56% 13,853,634 180 0.006 7.1 EFRT 217,000 2.56% 13,853,634 180 0.006 7.1 EFRT 217,000 2.56% 13,853,634 180 0.006 7.1
DEFRT 217,000 2.56% 13,853,634 180 0.006 7.1 EFRT 217,000 2.56% 13,853,634 180 0.006 7.1 IFRT 217,000 2.56% 13,853,634 180 25 1 0.006 7.1 IFRT 217,000 2.56% 13,853,634 180 25 1 0.006 7.1 EFRT 250,000 2.95% 15,g60,408 200 0.006 7.1 EFRT 250,000 2.95% 15,960,408 200 0.006 7.1 EFRT 182,857 2.16% 11,673,898 165 0.006 7.1 EFRT 182,857 2.16% 11,673,898 165 0.006 7.1 EFRT 3g2,169 4.64% 25,036,709 224 0.006 7.1 EFRT 205,653 2.43% 13,129,223 180 0.006 7.1 EFRT 205,653 2.43% 13,129,223 180 0.006 7.1 EFRT 205,653 2.43% 13,129,223 180 0.006 7.1 EFRT 205,653 2.43% 13,129,223 180 0.006 7.1 EFRT 205,653 2.43% 13,129,223 180 0.006 7.1 EFRT 205,653 2.43% 13,129,223 180 0.006 7.1
Totals 8,460,801 ''"' '"'"' 100.00% 540, 151,356
0.943
Constant (1000 ft3
gal/bbl2)
0.943 0.943 0.943 0.943 o_g43 o_g43 o_g43 0.943 0.943 o.g43 o.g43 o_g43 0.943 o_g43 0.943 0.943 0.943 0.943 0.943 0.943 o_g43 o_g43 0.943 0.943 o.g43 0.943 0.943 o.g43 0.943 0.943 0.943 0.943 0.943 0.943 0.943 0.943 0.943 0.943 0.943 0.943
2·4 lwo ....
Potential Withdrawal
Losses(•! (lb VOC/yr)
4,763 4,763 2,565 2,565 2,565 2,565 2,565 2,565 2,565 2,565 2,565 2,565 3,092 3,092 3,092 3,092 3,092 3,092 3,092 3.092 3,092 3.og2 3,092 3,092 3,og2 3,092 3,092 3,521 3,521 3,206 3,206 2,842 2,842 4,490 2,g30 2,930 2,930 2,930 2,g30 2,930
Potential Withdrawal
Losses (ton VOC/yr)
2.38 2.38 1.28 1.28 1.28 1.28 1.28 1.28 1.28 1.28 1.28 1.28 1.55 1.55 1.55 1.55 1.55 1.55 1.55 1.55 1.55 1.55 1.55 1.55 1.55 1.55 1.55 1.76 1.76 1.60 1.60 1.42 1.42 2.25 1.47 1.47 1.47 1.47 1.47 1.47
-· --61.38
1. Represents the level of throughput and associated withdrawal loss emissions that the terminal has demonstrated that it is capable of accommodating during the consecutive 24-month period used to establish the baseline emissions and that are also unrelated to the project. 2. Tank withdrawal loss emissions the terminal was capable of accommodating are calculated based on the maximum monthly terminal throughput of 45,012,613 bbl/mo. in July 2010 which was part of the 24-month period used to establish the baseline actual emissions and that are unrelated to the project. 3. Annualized accommodated throughput (maximum monthly throughput x 12 months) is equal to 540,151,356 bbl/year or 1,47g,867 bpd. 4. Individual storage tank throughput is calculated using a tank volume flow weighted throughput allocation, this calculation method results in the same number of turnovers for all tanks. The individual tank throughput is calculated by multiplying the potential facility-wide throughput by the storage tank capacity and dividing by the combined terminal tank capacity. 5. Withdrawal loss fonnula from US Environmental Protection Agency, Compilation of Air Pollutant Emission Factors, Volume 1 5th edition, AP-42, Chapter 7.1 Liquid Storage Tanks, November 2006, Formula 2-4.
(0.9'43)QC; "'L [I+ Ne Fe] Lll'll D D
3of7 10/9/2012
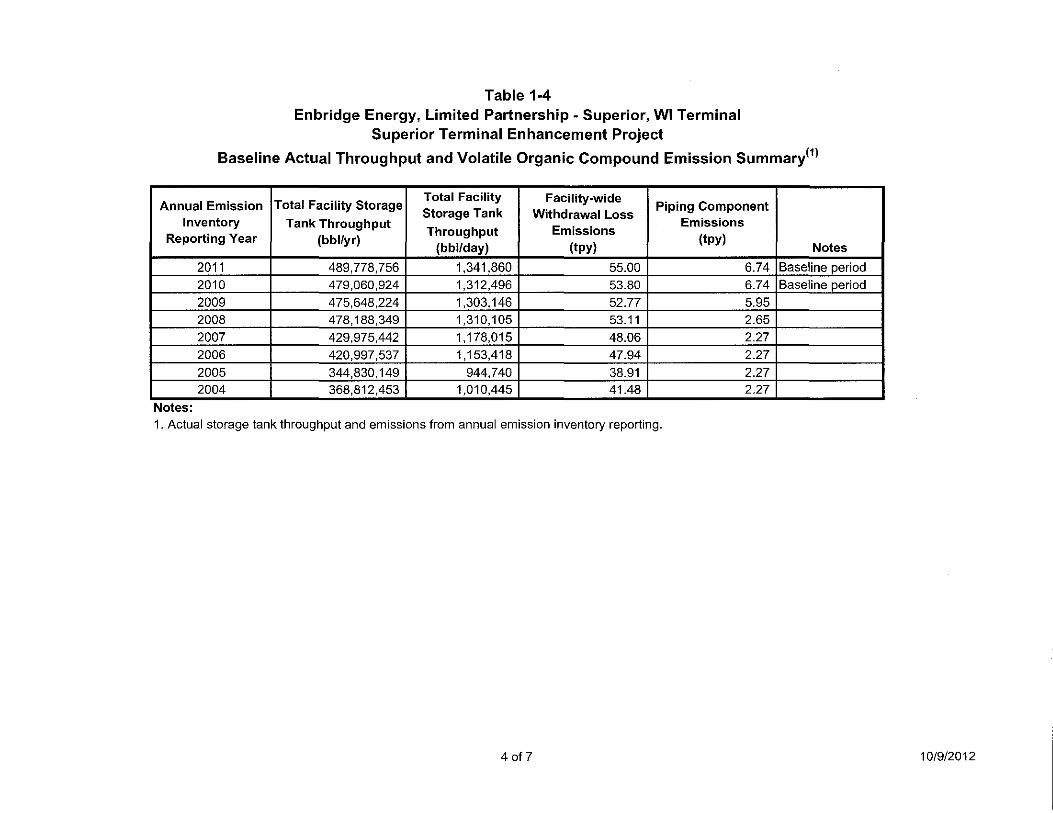
Table 1-4 Enbridge Energy, Limited Partnership - Superior, WI Terminal
Superior Terminal Enhancement Project Baseline Actual Throughput and Volatile Organic Compound Emission Summary(1)
Annual Emission Total Facility Storage Total Facility Facility-wide Piping Component Inventory Tank Throughput
Storage Tank Withdrawal Loss Emissions Throughput Emissions Reporting Year (bbl/yr) (bbl/day) (tpy) (tpy)
Notes 2011 489,778,756 1,341,860 55.00 6.74 Baseline period 2010 479,060,924 1,312,496 53.80 6.74 Baseline period 2009 475,648,224 1,303, 146 52.77 5.95 2008 478, 188,349 1,310,105 53.11 2.65 2007 429,975,442 1,178,015 48.06 2.27 2006 420,997,537 1, 153,418 47.94 2.27 2005 344,830, 149 944,740 38.91 2.27 2004 368,812,453 1,010,445 41.48 2.27
Notes: 1. Actual storage tank throughput and emissions from annual emission inventory reporting.
4 of 7 10/9/2012

Table 1-5 Enbridge Energy, Limited Partnership - Superior, WI Terminal
Superior Terminal Enhancement Project Project Piping Component Fugitive Volatile Organic Compound Emission Calculations
Emission Factor<2J Emission Factor Emissions(3l Emissions Component Count<11 Service (kg/hr/source) (lb/hr/source) (lb VOC/year) (ton VOC/yr)
Valves 370 Crude/ Light Liquid 4.30E-05 9.47E-05 307 0.15 Flanges 2,440 Crude/ Light Liquid 8.00E-06 1.76E-05 377 0.19 Other Equipment141 30 Crude/ Light Liquid 1.30E-04 2.86E-04 75 0.04 Pump Seals 30 Crude/ Light Liquid 5.40E-04 1.19E-03 313 0.16
Total . -1,071 -0.54 Notes: 1. Estimated piping component and pumps counts. 2. From Marketing Terminal Average Emission Factors from Protocol for Equipment Leak Emission Estimates,
USEPA Office of Air Quality Planning and Standards, November 1995 (EPA-453/R-95-017), Table 2-3 Light liquid emission factors. 3. Assumes 8, 760 hours of operation per year. 4. Includes orifices, sampling connections and open lines.
5 of 7 10/9/2012

Table 1-6 Enbridge Energy, Limited Partnership - Superior, WI Terminal
Superior Terminal Enhancement Project Permitted Maximum Terminal Throughput Capacity Summary<1l
Maximum Maximum Pipeline Maximum Pipeline Outbound Pipeline Design Design Capacity Design Capacity
Pipeline Number Capacity (m3/day) (bbl/day) (gal/day) Notes 5 85,844 540,000 22,680,000 No
6a 106,033 667,000 28,014,000 No Change 14/64 50,553 318,000 13,356,000 No
61 132,740 835,000 35,070,000 Increase from 440,000 bbl/day Calumet Refinery
Takeoff 15, 102 95,000 3,990,000 No Change12l
390,273 2,455,000 103,110,000 Notes: 1. The terminal throughput capacity is bottlenecked by the maximum terminal outbound pipeline capacity, which will be 2,455,000 bbl/day after the proposed expansion of Line 61. 2. Historically the potential outbound capacity to the refinery was assumed to be the potential refinery throughput of 35,000 bbl/day. Enbridge reviewed the existing pipeline and pump capacity for the refinery outbound line and determined 95,000 bbl/day represents the maximum pipeline design capacity.
6 of 7 10/912012

Table 1-7 Enbridge Energy, Limited Partnership - Superior, WI Terminal
Superior Terminal Enhancement Project Project Green House Gas Emission Calculations
Potential Tanks CH4 Emission Potential CH4 Potential CH4 Potential C02
Equivalent Emission Unit ID Throughput111 Factor121 Emissions Emissions Emissions(3Al
(MMgal/yr) (lb CH,IMMgal) (lb/yr) (tpy) (C02e, tpy) T41 4,908 5.25 25,760.21 12.88 T42 4,908 5.25 25,760.21 12.88
Project Related Throughput lncreasel5I 6,055 5.25 31,785.14 15.89
·"'' Total Notes 1. Refer to Table 2-8 for tank throughputs, assumes 200 tank turnover per year for tanks T 41 and T 42. 2. Methane emission factor obtained from 40 CFR 98.253 (m)(1 ), equation Y-22. Original value of 0.1 metric ton/MMbbl converted to 5.25 lb/MMgal. 3. Global warming potential (GWP) obtained from Table A-1 to Subpart A of Part 98 - Global Warming Potentials.
270 270
334 875
4. C02e calculated by equation A-1 of 40 CFR 98.2, which states the total CO,e is equal to the GWP factor for CH 4 multiplied by the potential CH4 emissions. The global warming potential for CH4 is 21. 5. Potential tank throughput resulting from the 395,000 bpd increase in terminal throughput capacity. 6. The project will not debottleneck, modify or otherwise physically change the terminal's crude heater or other combustion sources. The crude heater is only used to heat crude oil delivered on Line 6A which will not be debottlenecked as a result of the proposed project.
7 of 7 10/9/2012

Emission Unit ID voe Total HAP TD1 22.88 0.74 TD2 22.83 0.74 T03 3.25 0.15 T04 3.20 0.15 TOS 4.15 0.18 T06 9.25 0.31 T07 4.36 0.18 T08 7.01 0.25 T09 3.18 0.15 T10 9.50 0.32 T11 10.26 0.34 T12 11.09 0.36 T13 16.09 0.51 T14 9.88 0.34 T15 9.82 0.34 T16 15.90 0.51 T17 15.80 0.51 T18 9.82 0.34 T19 13.43 0.44 T20 15.88 0.51 T21 15.88 0.51 T22 9.71 0.34 T23 19.39 0.60 T24 9 90 0.35 T25 9.87 0.34 T26 2.44 0.14 T27 4.01 0.19 T28 11.23 0.39 T29 11.53 0.40 T30 4.33 0.20 T31 4.34 0.20 T32 3.66 0.17 T33 3.66 0.17 T34 5.50 0.26 T35 7.74 0.38 T36 7.60 0.37 T37 7.60 0.37 T38 7.60 0.37 T39 7.60 0.37 T40 7.60 0.37 T41 14.21 0.68 T42 14.21 0.68
ST01 1.02 0.03 ST02 0.30 0.01 ST03 0.50 0.01 ST04 0.11 0.00 ST05 0.30 0.01 ST06 0.07 0.00 PG01 0.14 0.00 PG02 0.00 0.00 PG03 0.00 0.00 PG04 0.01 0.00 PG05 0.01 0.00 PG06 0.01 0.00 PG07 0.01 0.00 PG08 0.01 0.00 PG09 0.01 0.00 PG10 0.01 0.00
Crude Oil Heater 4.07 0.68 Area 1 Fire 0.24 0.00 Area 1 Fire 0.24 0.00
Area 2 Fire 0.24 0.00 Area 1 Generator 0.05 0.00 Area 2 0.05 0.00
Area 3 #1 0.05 0.00 Area 3 0.05 0.00
Area 4 Generator 0.05 0.00 Lab Area 0.01 0.00
Piping Fugitive Emissions 7.22 0.20 Total Facility 421.90 16.21
voe Total HAP
Notes:
Table 2-1 Enbridge Energy, Limited Partnership- Superior, WI Terminal
MTE/PTE Emission Calculation Summary
Emlssions\'J (ton/yr) Highest Single HAP1i1
(Hexane) PM PM10 PM2.5 Lead so, NOx 0.51 0.50 0.08 0.07 0.10 0.21 0.10 0.16 0.07 0.21 0.23 0.25 0.35 0.22 0.22 0.35 0.35 0.22 0.30 0.35 0.35 0.22 0.43 0.22 0.22 0.06 0.09 0.25 0.26 0.10 0.10 0.08 0.08 0.13 0.18 0 18 0.18 0.18 0.18 0.18 0.33 0.33 0.02 0.01 0.01 0.00 0.01 0.00 0.00 0.00 0.00 0.00 0.00 0.00 0.00 0.00 0.00 0.00 0.65 14.79 14.79 14.79 0.0002 0.22 22.18
0.20 0.20 0.20 0.00 2.89 0.20 0.20 0.20 0.00 2.89 0.20 0.20 0.20 0.00 289 0.04 0.04 0.04 0.00 0.64 0.04 0.04 0.04 0.00 0.64 0.04 0.04 0.04 0.00 0.64 0.04 0.04 0.04 0.00 0.64 0.04 0.04 0.04 0.00 0.64 0.01 0.01 0.01 0.00 0.22
0.16 10.02 15.63 15.63 15.63 0.0002 0.22 34.25
Highest Single HAP«l
(Hexane) PM PM10 PM2.5 Lead so, NOx
1 Refer to tables 2-2 through 2-11 for supporting calculations. 2. The terminal is not a major source, permit limitation 1.ZZZ. 1.a.(1) limits actual individual HAP emissions below major source thresholds
1 of 13
co co, CH, N,O C02e 3.74 78.54 3.74 78.54 1.44 30.21 1.44 30.21 1.44 30.21 1.44 30.21 1.44 30.21 1.44 30.21 1.44 30.21 1.44 30.21 1.44 30.21 1.44 30.21 2.08 43.70 2.08 43.70 2.08 43.70 2.08 43.70 2.08 43.70 2.08 43.70 2.08 43.70 2.08 43.70 2.08 43.70 2.08 43.70 2.08 43.70 2.08 43.70 2.08 43.70 2.08 43.70 2.08 43.70 2.08 43.70 2.08 43.70 2.40 50.35 2.40 50.35 1.75 36.83 1.75 36.83 3.76 78.98 4.53 95.21 4.53 95.21 4.53 95.21 4.53 95.21 4.53 95.21 4.53 95.21
12.86 270.48 12.88 270.48 0.00 0.06 0.00 0.01 0.00 0.01 0.00 0.00 0.00 0.01 0.00 0.00
14.79 43,209.98 0.81 0.08 43,252.36 0.62 106.72 0.00 0.00 107.08 0.62 106.72 0.00 0.00 107.08 0 62 106.72 0.00 0.00 107.08 0.14 200.83 0.01 0.00 201.50 0.14 200.83 0.01 0.00 201.50 0.14 200.83 0.01 0.00 201.50 0.14 200.83 0.01 0.00 201.50 0.14 200.83 0.01 0.00 201.50 0.03 325.01 0.01 0.00 326.10
17.37 44,859.27 123.16 0.09 47,474.95
co co, CH, N,O C02e
10/912012

Annual Tank Throughputl'I
Emission Unit ID (bbl/yr)
Stor2Tanks TO> 33,930,000 TOO 33,930,000 TOO 13,050,000 TO< 13,050,000 TOO 13,050,000 TOO 13,050.000 TO< 13,050,000 TOO 13,050,000 TOO 13,050,000 no 13,050,000 rn 13,050,000 m 13,050,000 m 18,879,000 m 18 879,000 m 18,879,000 m 18,879,000 rn 18 879,000 m 18,879,000 m 18,879,000 TW 18 879,000 w 18,879,000 rn 18,879,000 m 18 879,000 m 18,879,000 m 18,879,000 T" 18,879,000 m 18,879,000 TW 18,879 000 TW 18,879,000 no 21,750,000 rn 21 750 000 m 15,908,571 no 15,908,571 n< 34118,703 TOO 41.130,600 no 41 130,600 rn 41,130,600 T'° 41,130,600 no 41,130,600 HO 41,130,600 rn 116,846,400 w 116,846,400
Piping Fugitive Emlsslons1' 1
Sump Tank Emissjons1' 1
ST01 25,018
ST02 2,857
ST03 2,857 ST04 1,071 ST05 2,857 ST06 m
Pigging Equipment Emissionsl'I
PG01 PG02 PG03 PG04 PG05 PG06 PG07 PG08 PG09 PG10
Combustion Sourcesl'I Crude Oil Heater
Area 1 Fire Pump #1 Area 1 Fire Pump #2
Area 2 Fire Pump Area 1 Emergency
Generator Area 2 Emergency
Genarator Area 3 Emergency
Generator #1 Area 3 Emergency
Generator #2 Area 4 Emergency
Generator I A:ea iomergency
Generator
Notes:
Table 2-2 Enbridge Energy, limited Partnership· Superior, WI Terminal
MTE/PTE Emission Calculations Facillty·Wide Volatile Organic Compound Emissions Summary
Withdrawal/ Roof Annual Tank Standing Working Landing Standing Withdrawal Tank Loss121 Loss1' 1 Loss1' 1 Total Loss Lossl'I
(gal/yr) Turnoversl1I (lbVOC/yr) {lbVOC/yr) (lbVOC/yr) (ton VOC/yr) (ton VOC/yr)
1.425,060,000 " 24,164 6,491 15,110 45,765 12.08 1,425,060,000 " 24,051 6,491 15,110 45,652 12.03
548,100,000 " 3,004 3,495 6,498 1.50 548,100,000 " 2,903 3,495 6,398 1.45 548,100,000 " 2,865 3,495 1,943 8,303 1.43 548 100 000 " 14,999 3,495 18,494 7.50 548,100,000 " 5,226 3,495 8,721 2.61 548,100,000 " 10,521 3,495 14016 5.26 548 100,000 " 2,857 3,495 6,351 1.43 548,100,000 " 15,505 3,495 19,000 7.75 548,100,000 " 17,017 3,495 20,512 8.51 548,100,000 " 18,684 3,495 22,179 9.34 792,918.000 " 16,177 4213 11 790 32,181 8.09 792,918,000 " 3,758 4,213 11,790 19,762 1.88 792,918,000 " 3,643 4,213 11,790 19,647 1.82 792,918,000 " 15 792 4,213 11,790 31,796 7,90 792,918,000 " 15,597 4,213 11,790 31,601 7.80 792,918,000 " 3,643 4,213 11,790 19,647 1.82 792,918,000 " 10 858 4,213 11,790 26,862 5.43 792,918,000 " 15,761 4,213 11,790 31,765 7.88 792,918,000 " 15,750 4,213 11,790 31,754 7.87 792,918,000 " 3 425 4,213 11,790 19,428 1.71 792,918,000 " 22,774 4,213 11,790 38,778 11.39 792,918,000 " 3,792 4,213 11,790 19,796 1.90 792 918 000 " 3,737 4,213 11,790 19,740 1.87 792,918,000 " """ 4,213 4,873 0.33 792,918,000 " 3,807 4,213 8 020 1.90 792.918,000 " 6,767 4,799 10,904 22,470 3.38 792,918,000 " 7,355 4,799 10,904 23,057 3.68 913,500,000 " 4,287 4 369 8 656 2.14 913.500,000 " 4,307 4,3()9 8,676 2.15 668,160,000 " 3,442 3,873 7,315 1.72 668,160,000 " 3,442 3 873 7 315 1.72
1.432,985,526 " 4,873 6,119 10,992 2-44 1,727,485,200 WO 3,496 9,179 2,798 15,473 1.75 1,727,485,200 WO 3,218 9,179 2,798 15,195 1.61 1,727,485,200 ,,, 3,218 9,179 2.798 15,195 1.61 1,727485,200 WO 3 218 9 179 2.798 15.195 1.61 1,727.485,200 WO 3,218 9,179 2,798 15,195 1.61 1,727,485,200 ,,, 3,218 9,179 2,798 15,195 1.61 4 907.548 800 WO 4 937 16,412 7 064 28,413 2.47 4,907,548,800 ,,, 4,937 16,412 7,064 28,413 2.47
14,443
1,050,774 "' 2,044 2,044
120,000 '° .. , .. , 120,000 '° 1,003 1,003
45,000 " '" '" 120,000 '° .. , .. , 30,000 ' "' "'
'" '0 '·' " " " " " " "
8,133 m m m ,,, "' ,,, ,,, ,,, " Total 344,899 235,830 238,165 843,796 172-45
Withdrawal/ Roof Land;ng Working Loss1' 1 Lossl>l Total Loss
(ton VOC/yr) (ton VOC/yr) {Ion VOC/yr)
3.25 7.56 22.88 3.25 7.56 22.83 1.75 3.25 1.75 3.20 1.75 0.97 4.15 1.75 9.25 1.75 4_3() 1.75 7.01 1.75 3.18 1.75 9.50 1.75 10.26 1.75 11.09 2.11 5.90 16.09 2.11 5,90 9.88 2.11 5.90 9.82 2.11 5.90 15.90 2.11 5,90 15.80 2.11 5.90 9.82 2.11 5.90 13.43 2.11 5.90 15.88 2.11 5.90 15.88 2.11 5.90 9.71 2.11 5.90 19.39 2.11 5.90 9.90 2.11 5.90 9.87 2.11 2.44 2.11 4.01 2.40 5.45 11.23 2.40 5.45 11.53 2.18 4.33 2.18 4.34 1.94 3.66 1.94 3.66 3.06 5.50 4.59 1.40 7.74 4.59 1.40 7.!iO 4.59 1.40 7.60 4.59 1.40 7.60 4.59 1.40 7.60 4.59 1.40 7.60 B.21 3.53 14.21 8.21 3.53 14.21
7.22
1.02 1.02
0.30 0.30
0.50 0.50 0.11 0.11 0.30 0,30 0.07 0.07
0.144 0.0005 0.0013
0.006 0.006 0.006 0.006 0.006 0.006 0,006
4.07 0.24 0.24 0.24
0.05
0.05
0.05
0.05
0.05
0.01 117.92 119.08 421.90
1. Previous PTE calculations for tanks T01 through T34 were basad on the maximum terminal throughput which was equal to approximately 87 turnovers per tank per year_ The PTE for tanks T35 through T42 are based on a maximum number of 200 turnovers per year. These same maximum tum overs of 87 per tank for T01 lhrough T34 are used hem in calculating the facility-wide PTE As a result, the facility-wide tank throughput is conservatively higher (3,038,946 bbl/day) than the potential throughput the terminal Is physically capable of accommodating after the Superior Terminal Enhancement Project (2,455,000 bbl/day) which also makes the total VOC per year conservativaly higher 2. Calculated using US Environmantal Protection Agency, TANKS program version 4_0_9d
3. See Table 2"4 MTEIPTE Tank Roof Landing Emission Calculations. All storage tanks may have roof landing emissions_ Enbridge has accepted parmit limits on roof landing emissions for tanks T35 through T40 and a 103 tpy roof landing emission limit for the other terminal storage tanks combined_ Roof landing emission summarized in this table include tanks T35 through T42 and eighteen other tanks with the highest potential roof landing emissions are also included so that the total roof landing emlS'Sions from these eighteen tanks is equal to the 103 tpy permit 4. See Table 2-5 Piping Component Volatjle Organic Compound EmiS'Sion Calculations 5. See Table 2-9 MTEIPTE Sump Tank Emission Calculations 6_ See Table 2-10 MTE/PTE Pigging Emission Calculations 7. See Tables 2·6 and 2·7 for the heater, fire pumps, and emergency generators Voe emission calculations
2 of 13 101912012


. rnmm m 00"
i_ ,.
§iB i 00 "'
§Q§ 000
§§§g§§§§ 000
!
I

§
' '
!]ffi.o:r;:;;-;;:;;
'
,
' !
, '
' '
§::; ' , i2:e ;::
:lj-glo ' §:;; ' , i ,, in ;:: ' §:;; ' ' 0
1;"m!l' §; !?! ,, , ,, 2\:)
'
'Mr ,, :2 I 8 fi5 2 \2
1111 ' 8 fi5
t I
@::; § ! @oi "'" ! i:j , \;; 2 !t
! ;;:;::; § "'"
;;
£"
' j ,tf
m
m !
!
N
§
m
I 'I'
,
l:i
i ! 8 ' ! ' ' )1 ! i ,, ' ' ' ! !l 8 8 ' !
i 13 § ' ! 8 !
i ! jl § 8 ' ! ! ' i ! 8§ 8 ' ' ' ! ! i ,, ' ! ! 8 ' ! !l § ' !
, ,, ' ! 8 8 ! ! !
! G ! 8 ' ! !
1:1
' "" "' "'
' ' 00 !c !
' ' ' §; E
' A ' ' ' !
00 ! ' '' I I ' ! ' ,,, §.!§ !
!
i ! !'! r
I ! '51! "'"" J,
I f" I
!

Ji ' ' ' ' ' is: 8 ' :J
Jj ' ,, ' 0 ,: 2g ' i'! ,, ' ' ' ' 'l'I" ' ,, ''
i'l I ' ' ' : 2§ '
' 1, ' " ' : i;;:s;:: 2S :
!l ' ' ' 0 : is: iii;:: :
' ' ' ' i;;:s;: 2S ' ,, gi ! : ' ' is:2;:: :
' ' ' ' 2S::: ,, '
2 li :;;:; ' : 2S :i '
: ' :J '
s [ !" '' : ' :J
!I ' : : :il:::: :J
11 ' : : " is: :il :;j:
' '
i;;:oi 'Im ' ! ' ' £3
i;;:s j !l ' ' i;;:s:::: ' izs:::
!I! i ! H--H+-1---H-"'-H
H-l++++-+-H H-1+++++-H H--+t++++,_,_,-H H-' H-H-+++++++,_,_,-H
H--+t++++,_,_,-H C0
l-! Cl-++++-++++l-l--'
H-H-Ctt++H-H-H-i-H
[j i"""' ·'
i i
'
' ' ,, 1:;0u
;;: . ' ' '
d00 ' B i
' ' i ! ' ' ! '
00 ' i'l ! §
§ ' g_ ! .
' -
ill ' B -
'ii $ -' '
' ! !
!- ! ' ! ! ' '
:, i ' ' § ,,,

Table 2-5 Enbridge Energy, Limited Partnership - Superior, WI Terminal
MTE/PTE Emission Calculations Facility-wide Piping Component Fugitive Volatile Organic Compound Emission Calculations
Existing piping component counts before project111
Emission Factorl2> Emission Factor Emissions13l Emissions Component Count Service (kg/hr/source) (lb/hr/source) (lb VOC/year) (ton VOC/yr)
Valves 6,086 Crude/ Light Liquid 4.30E-05 9.47E-05 5,049 2.52 Flanges 29,028 Crude/ LJ£!1t Liquid 8.00E-06 1.76E-05 4,481 2.24 Other Equipment141 1,000 Crude/ Light Liquid 1.30E-04 2.86E-04 2,508 1.25 Pump Seals 128 Crude/ Light Liquid 5.40E-04 1.19E-03 1,334 0.67 - .. Total 13,372 - --6.69 Superior Terminal Enhancement Project'"' -
Emission Factor12> Emission Factor Emissions13l Emissions Component Count Service (kg/hr/source) (lb/hr/source) (lb VOC/year) (ton VOC/yr)
Valves 370 Crude/ Light Liquid 4.30E-05 9.47E-05 307 0.15 Flanges 2,440 Crude/ Light Liquid 8.00E-06 1.76E-05 377 0.19 Other Equipment141 30 Crude/ Light Liquid 1.30E-04 2.86E-04 75 0.04 Pump Seals 30 Crude/ Light Liquid 5.40E-04 1.19E-03 313 0.16
Total . -1,071 -0.54 Total Facility component counts after project
Emission Facto,l2l Emission Factor Emissions(3) Emissions Component Count Service (kg/hr/source) (lb/hr/source) (lb VOC/year) (ton VOC/yr)
Valves 6,456 Crude/ LJ£!1t Liquid 4.30E-05 9.47E-05 5,356 2.68 31,468 Crude/ LJ£!1t 8.00E-06 1.76E-05 4,857 2.43
Other Equipment141 1,030 Crude/ Light Liquid 1.30E-04 2.86E-04 2,584 1.29 Pump Seals 158 Crude/ Light Liquid 5.40E-04 1.19E-03 1,646 0.82
Total 14,443 - --7.22
Notes: 1. Estimated piping component and pumps counts (from Permit 08-DCF-313 Revision Application) 2. From Marketing Terminal Average Emission Factors from Protocol for Equipment Leak Emission Estimates ,
USEPA Office of Air Quality Planning and Standards, November 1995 (EPA-453/R-95-017), Table 2-3 Light liquid emission factors. 3. Assumes 8,760 hours of operation per year. 4. Includes orifices, sampling connections and open lines. 5. Estimated project piping component and pumps counts.
7of13 10/9/2012

Emission Unit Description: Emission Unit ID: Heater Rating:
Table 2-6 Enbridge Energy, Limited Partnership - Superior, WI Terminal
MTE/PTE Emission Calculations Crude Oil Heater Emission Calculations
Line 6 Heater - Natural Gas H01 84.40 MM Btu/hr
Annual MTE/PTE Annual MTE/PTE Natural Gas Natural Gas MTE/PTE MTE/PTE Natural Gas Natural Gas
Pollutant Throughput!1) Throughput<2>
Emission Emission Emissions Emissions
(MM Btu) (MMscf) Factors Factor Units (lb/hr) (lb/yr)
PM 739,333 724.84 0.04 lb/MM Btu 3.38 29,573 PM2.5 739,333 724.84 0.04 lb/MM Btu 3.38 29,573 PM10 739,333 724.84 0.04 lb/MM Btu 3.38 29,573 S02 739,333 724.84 0.6 lb/MMscf 0.05 435 NOx 739,333 724.84 0.06 lb/MM Btu 5.06 44,360 voe 739,333 724.84 0.011 lb/MM Btu 0.93 8,133 co 739,333 724.84 0.04 lb/MM Btu 3.38 29,573
Lead 739,333 724.84 0.0005 lb/MMscf 4.1E-05 3.6E-01 Ammonia 739,333 724.84 0.49 lb/MMscf 0.04 355
co, 739,333 724.84 116.89 lb/MM Btu 9,865.29 86,419,959 CH, 739,333 724.84 2.2E-03 lb/MM Btu 0.19 1,630 N20 739,333 724.84 2.2E-04 lb/MM Btu 0.02 163
2-Methylnaphthalene 739,333 724.84 2.4E-05 lb/MMscf 2.0E-06 1.7E-02 Benzene 739,333 724.84 2.1 E-03 lb/MMscf 1.7E-04 1.5E+OO n-Hexane 739,333 724.84 1.8E+OO lb/MMscf 1.5E-01 1.3E+03
Formaldehyde 739,333 724.84 7.5E-02 lb/MMscf 6.2E-03 5.4E+01 Phenanathrene 739,333 724.84 1.7E-05 lb/MMscf 1.4E-06 1.2E-02
Toluene 739,333 724.84 3.4E-03 lb/MMscf 2.BE-04 2.5E+OO Barium 739,333 724.84 4.4E-03 lb/MMscf 3.6E-04 3.2E+OO
Cadmium 739,333 724.84 1.1 E-03 lb/MMscf 9.1 E-05 8.0E-01 Chromium 739,333 724.84 1.4E-03 lb/MMscf 1.2E-04 1.0E+OO
Cobalt 739,333 724.84 8.4E-05 lb/MMscf 7.0E-06 6.1E-02 Copper 739,333 724.84 8.5E-04 lb/MMscf 7.0E-05 6.2E-01
Manganese 739,333 724.84 3.8E-04 lb/MMscf 3.1 E-05 2.8E-01 Mercury 739,333 724.84 2.6E-04 lb/MMscf 2.2E-05 1.9E-01
Molybdenum 739,333 724.84 1.1 E-03 lb/MMscf 9.1E-05 8.0E-01 Nickel 739,333 724.84 2.1E-03 lb/MMscf 1.7E-04 1.5E+OO
Vanadium 739,333 724.84 2.3E-03 lb/MMscf 1.9E-04 1.7E+OO
Notes: 1. Assumes 8,760 hours per year. 2. Conversion assumes 1020 Btu per cubic foot of natural gas, EPA AP-42, Chapter 1, Section 1.4. Table 1.4-1, July 1998. 3. Maximum allowable PM emissions rate to not constitute a significant emissions increase under s. NR 405. 4. EPA AP-42, Chapter 1, Section 1.4. Tables 1.4-1 & 1.4-2, July 1998. 5. Manufacture's guaranteed or predicted emission rate. 6. Ammonia emission factor from: Development and Selection of Ammonia Emission Factors - Final Report. R. Battye, W. Battye,
MTE/PTE Emissions
(tonfyr)
14.79 14.79 14.79 0.22
22.18 4.07
14.79 1.8E-04
0.18
43,209.98 0.81 0.08
8.7E-06 7.6E-04 6.5E-01 2.7E-02 6.2E-06 1.2E-03 1.6E-03 4.0E-04 5.1 E-04 3.0E-05 3.1 E-04 1.4E-04 9.4E-05 4.0E-04 7.6E-04 8.3E-04
C. Overcash, and S. Fudge; EC/R Incorporated; Durham, NC. Report prepared for USEPA Office of Research and Development; August, 1994. 7. Emission factors for natural gas were obtained from 40 CFR 98 Subpart C, Tables C-1 and C-2.
Emission Factor Notes
See Note 3 See Note 3 See Note 3 See Note 4 See Note 5 See Note 5 See Note 5 See Note 4 See Note 6 See Note 7 See Note 7 See Note 7 See Note 8 See Note 8 See Note 8 See Note 8 See Note 8 See Note 8 See Note 8 See Note 8 See Note 8 See Note 8 See Note 8 See Note 8 See Note 8 See Note 8 See Note 8 See Note 8
8. EPA AP-42, Chapter 1, Section 1.4. Tables 1.4-3 & 1.4-4, July 1998, include pollutant emission factors with an emissions factor rating of "D" or better.
8 of 13 10/9/2012

Table2-7 Enbridge Energy, Limited Partnership - Superior, Wl Terminal
MTEIPTE Emission Calculations Diesel Fuel Powered Fire Pump and Emergency Generator Emission Calculations
Fire Pumps The terminal has three fire pump•
Pollutant
co
PM10
..:!5!' co,
Benzene Toluene
Formaldehyde Acetaldehyde
Acrolein
Notes:
Diesel fuel Dleul Fuel Emission Emission Factors
Power Rating
Emission Notes
110 0 110 0 110.0 110.0 110.0 110.0 110.0 110.0 110.0 110.0 110.0 110.0 110.0 110.0 110.0
3 09E-02 6 65E-03 1.09E-05 2.17E-03 2.52E-03 1.14E+OO 4.63E-05 9.26E-06 6 53E-06 2.B6E-06 2.00E-06 2.74E-07 6.26E-06 5.37E-06 6 48E-07
4.41 SeoNote3 0,95 Seo Note 3
O 002 See Note 4 0.31 See Note 3 0.36 See Note 3
163.05 See Note 5 O 01 See Note 5 O 00 See Note 5
9 33E-04 See Note 6 4 09E-04 See Note 6 2.65E-04 See Note 6 3.91E-05 See Note 6 118E-03 SeeNote6 7.67E-04 SeeNote6 9.25E-05 See Note 6
SeeNote6
MTEIPTE Emissions
MTEIPTE Emlsslonsm
(lb/yr)
MTEIPTE Emissions
340 5,77269 289 073 1,24355 062 000 2.03 000 0.24 405.79 0-20 = 125.55 213,437.57 106.72 0.01 B.66 0.00 0,00 1.73 0.00
718E-04 1.22 6.11E-04 315E-04 0.54 2.68E-04 219E-04 0.37 1.87E-04 3 01 E-05 0.05 2.56E-05 9 09E-04 1.54 7.72E-04 5 91 E-04 1.00 5.02E-04 7 12E-05 0.12 6.05E-05
0.11 -o
1_ Calculated emissions factor from horse power rating and lb/MM Btu emission factor, assumes 7,000 Btu/hp-hr 2_ Assumes 1.700 hours per year. diesel fuel limtt of 10,000 gallons per year divided by 5 62 gallons fuel used per hour 3_ EPA AP--42, Chapter 3 3, Table 3.3-1, October 1996 4_ Emission Factor calculated from the current actual sulfur content of#2 Fuel oil, 15 ppm oulfur, s•e Table 2--60 below 5_ Emission factors from 40 CFR 98, Subpart C Table C-1 for Ols!Llla!e Fuel 011 No 2- and Table C-2 lor Petroleum (All fu•I types in Table C-1) 6_ EPA AP--42, Chapter 3.3, Table 3.3-2, October 1996
Areas 1 2, 3 and 4 Emergency Electric
Pollutant
Diesel Fuel MTE/PTE Emissions
(ton/yr)
Number of Pumps
Number of Generators
Combined Emissions
(ton/yr)
320.16 0.01 0.00
1.83E-03 8.03E-04 5.60E-04 7.68E-05 2.32E-03 1.51E-03 1.82E-04 1.67E-04
Combined Emissions
(ton/yr)
0,36 Seo Note 4 0.26 co,
,,o Benzene Toluene Xylones
1,3-Butadiene Formaldeliyde Acetaldehyde
Acrolein
Notes.
207.0 207,0 207,0 207.0 207.0 207.0 207.0 207.0 207.0 207.0
1.14E+OO 4.63E-05 9-26E-06 6.53E-06 2.86E-06 2.00E-06 2.74E-07 8.26E-06 5.37E-06 6ABE-07
163.05 See Note 6 0,01 See Note 6 0.00 See Note 6
9.33E--04 See Note 7 4.09E--04 See Note 7 2.85E--04 See Note 7 3.91E--05 See Note 7 1.18E--03 SeeNote7 7.67E--04 SeeNote7 9 25E-05 See Note 7
See Note 7
236.27 401,650-70 0.01 16.29 0.00 3.26
1.35E-03 2-70E-01 5.93E-04 1.19E-01 4.13E-04 B.26E-02 5.67E-05 1.13E-02 1.71E-03 3-42E-01 1.11E-03 2-22E-01 1 34E-04 2.68E-02
""'
200.83 0.01 0.00
1.35E-04 5.93E-05 4. 13E-05 5.67E-06 1.71E-04 1.11E-04 1.34E·05
1_ The emergency electfic generators will be operated less than 200 hours per year and output is less than 3,000 kjlowatts per untt 2_ Calculated emissions factor from horse power rating and lb/MMBlu emis51on factor, assumes 7,000 Btu/hp-hr 3 Assumes 200 hours per year 4_ EPAAP--42, Chapter 3.3, Table 3.3-1, October 1996 5_ Emjss1on Factor calculated from the current actual sulfur content of#2 Fuel 011. 15 ppm sulfur, see Table 2-60 below 6 Emission factors from 40 CFR 98, Subpart C Table C-1 for Dist1llete Fuel 011 No 2. and Table C-2 for Petroleum (All fuel types in Table C-1) 7_ EPAAP--42, Chapter 3.3, Table 3 3·2, October 1996
Lab Area Emergency Electric Generator
Pollutant 00> co
'°' PM to
co,
"'° Benzene Toluene X lenes
1,3-Buladiene Formaldeh de Acelaldeh de
Acrole1n
Notes:
Generator Horse Power
Rating
'" '" '"
Diesel Fuel Emission
(lb/hp-hr) (power output)
6.59E-03 7.94E-04 1 23E-05 1-76E-04
=" 1.14E+OO 4.63E-05 9.26E-06 6.53E-06 2.86E-06 2.00E-06 2-74E-07 8.26E-06 5.37E-06 6-48E-07
Diesel Fuel Emlsslon Factors
(lb/MM Btu) (fuel input)
0"' 0.002
Emission Factor Notes
See Note 5 See Note 5 See Note 6 See Note 5 See Note 5
163 05 See Note 7 0.01 See Note 7
O 001 See Note 7 9 33E-04 See Note 8 4 09E-04 See Note B 2.85E-04 See Note 8 3 91E-05 See Note 8 1.18E-03 See Note 8 7.67E-04 See Note B 9.25E-05 See Note B
See Note 8
1. This unit is exempt from construction permitting requirement• per s. NR 406 04(1 ){w)
MTEIPTE Emissions
(lb/hr) 2.21 0.27 0,00 0,06
MTE/PTE Emissionsl'I
(lb/yr)
MTE/PTE Emissions
(ton/yr) 0.22 0,03 0,00
382.36 650,014.42 325.01 0.02 26,37 0.01
0.003 5.27 0,003 2 19E-03 4.38E-01 2.19E-04 9 59E-04 1.92E-01 9.59E-05 6,68E-04 1.34E-01 6.68E-05 9.17E-05 1.83E-02 9.17E-06 2.77E-03 5.53E-01 2.77E-04 1.80E-03 3.60E-01 1.BOE-04 2.17E-04 4.34E-02 2.17E-05 ""
2 The emergency electric generator will be operated less than 200 hours per yea; and output 1s less than 3,000 kilowatts 3 Calculated em1ss1ons factor from horse power rating and lb/MM Btu em;ss1on factor, assumes 7,000 Btu/hp-hr 4 Assumes 200 hours per year_ 5 Manufacture's guaranteed emission factors
Number of Generators
6 Emission Factor calculated from the current actual sulfur content 01#2 Fuel oil, 15 ppm sulfur, see the diesel fuel sulfur em1ss1on factor calculations below 7 Emission factors from 40 CFR 98, Subpart C Table C-1 for D1st1llate Fuel 011 No_ 2_ and Table C-2 for Petroleum {All fuel types 1n Table C-1) 8 EPAAP--42, Chapter 3 3. Table 3 3-2, October 1996
Diesel Fuel Emission Factor Calculation•
'"""' } l i l"°"W•o"'t""w"""'1 1 Percent Sul"!alculated Fuel lnpu Distillate FO #2 Sulfur Sulfur dio<ide Emission Rate (lb/hp-hr (lb S02/MMBtu) (ppm) {%) (gal/hr) Dens•ty (lb/gal) (lbllb·mole) (lbnb-mole) (lb S02/hr) S02/hr) (fuel Input)
Firn Pumps
'" 0 0015% 0"' " 32 07 64.07 0 001 1.09E-05 1.55E--03 Erner one Electric Generators
'" 0 0015% 10.90 " 32 07 64.07 0 002 1.12E-05 1.SOE--03 Lab Area Emergency Electric Generatol 1
'IT 0 0015% 19 40 'l 32 07 64.07 0.004 1 76E-03 oles:
1, #2 Fuel 011 used in the fire pumps and emergency generators contains a maximum sulfur content ol 15 ppm 2. Per40 CFR 60 Subpart 1111. Beginning June 1, 2010 diesel fuel used in the emergency generator IS subject to a maximum of 15 ppm sulfur per gallon otandard
9of13
1,004.13
0.01 6 76E-04 2 96E-04 2 06E-04 2 83E-05 8,55E-04 5 56E-04 6.70E-05 6.14E-05
Combined Emissions
(ton/yr)
"" 0.03 4.13E-04
0.01
°'' 325.01
0.003 2.19E-04 9.59E-05 6.68E--05 917E-06 2.77E-04 1.80E-04 2 17E-05
10/912012

Annual Throughput (bbl/yr) 896,075,000 Daily Throughput (bbl/day) 2,455,000
Crude Oil RVP (psia) 10.2 Crude Oil Density 7.1
RVP Tank Number Product (psia)
T01 Crude Oil 10.2 T02 Crude Oil 10.2 T03 Crude Oil 10.2 T04 Crude Oil 10.2 T05 Crude Oil 10.2 T06 Crude Oil 10.2 T07 Crude Oil 10.2 T08 Crude Oil 10.2 T09 Crude Oil 10.2 T10 Crude Oil 10.2 T11 Crude Oil 10.2 T12 Crude Oil 10.2 T13 Crude Oil 10.2 T14 Crude Oil 10.2 T15 Crude Oil 10.2 T16 Crude Oil 10.2 T17 Crude Oil 10.2 T18 Crude Oil 10.2 T19 Crude Oil 10.2 T20 Crude On 10.2 T21 Crude Oil 10.2 T22 Crude OU 10.2 T23 Crude Oil 10.2 T24 Crude OH 10.2 T25 Crude OH 10.2 T26 Crude OH 10.2 T27 Crude Oil 10.2 T28 Crude Oil 10.2 T29 Crude Oll 10.2 T30 Crude Oil 10.2 T31 Crude Oil 10.2 T32 Crude OU 10.2 T33 Crude OH 10.2 T34 Crude on 10.2 T35 Crude Oil 10.2 T36 Crude Oil 10.2 T37 Crude Oil 10.2 T38 Crude Oil 10.2 T39 Crude Oil 10.2 T40 Crude Oil 10.2 T41 Crude Oil 10.2 T42 Crude Oil 10.2
Notes:
Table 2-8 Enbridge Energy, Limited Partnership - Superior, WI Terminal
MTE/PTE Emission Calculations Tank Properties and Throughput Summary
Maximum throughput through tankage after project; limited by outbound pipeline throughput capacity Maximum throughput through tankage after project; limited by outbound pipeline throughput capacity Represents the maximum monthly volume weighted crude oil RVP stored at the Superior Terminal.
Tank Tank Fraction of Total MTE/PTE MTE/PTE Diameter Tank Height Volume Tank Volume Terminal Tank Throughpuf1l Throughput
(ft) (ft) (bbl) (gal) Volume (bbl/yr) (gal/yr) 210 64 390,000 16,380,000 4% 33,930,000 1,425,060,000 210 64 390,000 16,380,000 4% 33,930,000 1,425,060,000 150 48 150,000 6,300,000 2% 13,050,000 548,100,000 150 48 150,000 6,300,000 2% 13,050,000 548,100,000 150 48 150,000 6,300,000 2% 13,050,000 548,100,000 150 48 150,000 6,300,000 2% 13,050,000 548.100,000 150 48 150,000 6,300,000 2% 13,050,000 548,100,000 150 48 150,000 6,300,000 2% 13,050,000 548,100,000 150 48 150,000 6,300,000 2% 13,050,000 548,100,000 150 48 150,000 6,300,000 2% 13,050,000 548,100,000 150 48 150,000 6,300,000 2% 13,050,000 548,100,000 150 48 150,000 6,300,000 2% 13,050,000 548,100,000 180 48 217,000 9,114,000 2% 18,879,000 792,918,000 180 48 217,000 9,114,000 2% 18,879,000 792,918,000 180 48 217,000 9,114,000 2% 18,879,000 792,918,000 180 48 217,000 9,114,000 2% 18,879,000 792,918,000 180 48 217,000 9,114,000 2% 18,879,000 792,918,000 180 48 217,000 9,114,000 2% 18,879,000 792,918,000 180 48 217,000 9,114,000 2% 18,879,000 792,918,000 180 48 217,000 9,114,000 2% 18,879,000 792,918,000 180 48 217,000 9,114,000 2% 18,879,000 792,918,000 180 48 217,000 9,114,000 2% 18,879,000 792,918,000 180 48 217,000 9,114,000 2% 18,879,000 792,918,000 180 48 217,000 9,114,000 2% 18,879,000 792,918,000 180 48 217,000 9,114,000 2% 18,879,000 792,918,000 180 48 217,000 9,114,000 2% 18,879,000 792,918,000 180 48 217,000 9,114,000 2% 18,879,000 792,918,000 180 48 217,000 9,114,000 2% 18,879,000 792,918,000 180 48 217,000 9,114,000 2% 18,879,000 792,918,000 200 48 250,000 10,500,000 3% 21,750,000 913,500,000 200 48 250,000 10,500,000 3% 21,750,000 913,500,000 165 49 182,857 7,680,000 2% 15,908,571 668,160,000 165 49 182,857 7,680,000 2% 15,908,571 668,160,000 224 56 392,169 16,471,098 4% 34,118,703 1,432,985,526 180 56 205,653 8,637,426 2% 41,130,600 1,727,485,200 180 56 205,653 8,637,426 2% 41,130,600 1,727,485,200 180 56 205,653 8,637,426 2% 41,130,600 1,727,485,200 180 56 205,653 8,637,426 2% 41,130,600 1,727,485,200 180 56 205,653 8,637,426 2% 41,130,600 1,727,485,200 180 56 205,653 8,637,426 2% 41,130,600 1,727,485,200 286 56 584,232 24,537,744 6% 116,846,400 4,907,548,800 286 56 584,232 24,537,744 6% 116,846,400 4,907,548,800
Total 9,629,265 404,429,142 1,109,215,246 36,771,942,726
Total Throughput used for PTE Calculations (bbl/day) 3,038,946
MTE!PTE Annual Tank Turnovers<iJ
87 87 87 87 87 87 87 87 87 87 87 87 87 87 87 87 87 87 87 87 87 87 87 87 87 87 87 87 87 87 87 87 87 87
200 200 200 200 200 200 200 200
1. Facility-wide throughput capacity includes the Line 61, Line 5 and Line 67 pipeline projects permitted under permits 07-DCF-050, 08-DCF-082 and 08-DCF-102 and 08-DCF-313 and the proposed increases on Line 61 and Line 67 in the current permit application. 2. PTE calculations for tanks T01 through T34 were based on the maximum terminal throughput prior to this proposed project which was equal to approximately 87 turnovers per tank per year. The PTE for tanks T35 through T42 are based on a maximum number of 200 turnovers per year. As a result, the facility-wide tank throughput is conservatively higher than the potential throughput the terminal is physically capable of accommodating.
10of13 10/9/2012

Description of Activity:
Table 2-9 Enbridge Energy, Limited Partnership - Superior, WI Terminal
MTE/PTE Emission Calculations Sump Tank Emission Calculationsl'l
Sump tanks may be used for any of the following: a. To collect any material (e.g. drips) from equipment such as pumps that might be released during a malfunction or process upset b. To collect material from splll cleanups c. To collect crude oil from pigging operations and maintenance activities
Sump Sump Tank Tank Sump Tank
Emission Sump Tank Diameterf1l Length(2) Volume(3l Unit ID Description (ft) (ft) (gal)
Line 61 Pig Launcher Sump
ST01 Tank 8.0 26.04 8,000 Line 61 Station
ST02 Sump Tank 6.0 18.90 4,000
ST03 Line 13 Sum_[!_ Tank 6.0 18.90 4,000 Station 5 Sump
ST04 Tank 6.0 18.90 4,000 Station 6 Sump
ST05 Tank 6.0 18.90 4,000 Line 14/64 Sump
ST06 Tank 6.0 18.90 4,000
Notes: 1. Diameter from Enbridge drawings.
Maximum Maximum Annual Annual
Throughput Throughput (gal/yr) Notes
1,050,774 See Note 6
120,000 See Note 7
120,000 See Note 7
45,000 See Note 8
120,000 See Note 9
30,000 See Note 10
Annual Number of Tank
Pumping Events<4l
131
40
40
15
40
10
Standing Working Loss(S) loss(S)
(lb VOC/yr) {lb VOC/yr)
- 2,044
- 591
- 1,003
- 222
- 591
- 148 Total (lb VOC/yr)
Total (tpy)
Total Loss (lb VOC/yr)
2,044
591
1,003
222
591
148 ---4,599 2.30
2. Length was estimated so the calculated volume* is approximately equal to 4,000 gal, which is the volume of the tank specified in the drawing. *calculated volume= the volume of the tank at specified diameter and assuming the tank has flat ends 3. Tank volume from Enbridge drawings. 4. Number of times the sump tanks are emptied, assumes that the sump tanks are emptied once the liquid level reaches 75% of storage capacity. 5. Emissions are calculated with US EPA TANKS version 4.0.9d, using the horizontal fixed roof tank configuration. Since the tanks are underground, there are no standing losses. 6. Throughput is based on the assumption that the entire volume of the Line 61 pig launcher is emptied into the sump tank once per day. Refer to Table 2-10 Pigging Emissions worksheet for pig launcher trap dimensions. 7. Conservatively assumes that the tanks are emptied 40 times per year and that the level of the tank is at 75% of capacity when emptied. 8. In 2008, the sump tank ST04 was emptied 7 times. For maximum potential emissions, conservatively assumes that the tank is emptied 15 times per year and that the level of the tank is at 75°/o of capacity when emptied. 9. In 2008, the sump tank ST05 was emptied 19 times. For maximum potential emissions, conservatively assumes that the tank is emptied 40 times per year and that the level of the tank is at 75% of capacity when emptied. 1 O. In 2008, the sump tank ST06 was emptied 4 times. For maximum potential emissions, conservatively assumes that the tank is emptied 10 times per year and that the level of the tank is at 75% of capacity when emptied.
11of13 10/9/2012

Description of Activity:
Table 2-10 Enbridge Energy, Limited Partnership - Superior, WI Terminal
MTE/PTE Emission Calculations Pigging Equipment Emission Calculations11l
A pig is a device inserted into the pipeline used for either: a. Physical separation between different liquids being transported in pipelines b. Internal cleaning of pipelines c. Inspection of the condition of pipeline walls Sections of liquid service pipelines are drained in order to launch and receive pigs. After draining, the section is opened to the atmosphere, which can result in emissions from vapors in the volume opened to the atmosphere or evaporation of remaining liquid that clings to the pipe and pig.
Internal Length of Diameter of Pipeline Pig Trap Name Pipe
Emission Pipel2l Vented''' (ft) Unit ID (in)
PG01 Line 61 P19.: Launcher 42 40 Line 13 Pig Launcher and
PG02 Receiver 36 30 PG03 Line 67 Pk Receiver 36 30 PG04 Line 1 PJg_ Receiver 36 30 PG05 Line 2 P..!9._ Receiver 36 30 PG06 Line 3 PJg_ Receiver 36 30 PG07 Line 4 Pig Receiver 36 30 PG08 Line 5 P.!fl Launcher 36 30 PG09 Line 6a P_!g_ Launcher 36 30 PG10 Line 14/64 Pig Launcher 36 30
Notes:
Surface Area Clingage Inside of Density131
Factor(4l Pipe (lb/gal) (bbl/1000 ft2) (fl')
440 7.1 0.006
283 5.6 0.0015 283 7.1 0.006 283 7.1 0.006 283 7.1 0.006 283 7.1 0.006 283 7.1 0.006 283 7.1 0.006 283 7.1 0.006 283 7.1 0.006
Emissions per Number of Number of Pigging Event Events per Events per (lb VOC/event) Year Year Notes
0.79 365 See Note 7
0.10 10 See Note 6 0.51 5 See Note 6 0.51 24 See Note 5 0.51 24 See Note 5 0.51 24 See Note 5 0.51 24 See Note 5 0.51 24 See Note 5 0.51 24 See Note 5 0.51 24 See Note 5
Total Emissions (lb VOC!yr) Total Emissions (tpy)
1. Emissions are calculated using the clingage method, a portion of crude oil clings to the inside of the pigging launcher or receiver after it has been drained.
Maximum Annual
Emissions (lb VOC/year)
287.23
1.00 2.53
12.14 12.14 12.14 12.14 12.14 12.14 12.14
375.75 0.19
2. Conservatively assumes that each receiver or launcher (except for Line 61) is 36 inches in diameter and 30 feet of pipe is vented to the atmosphere. Line 61 assumes the line is 42 inches in diameter and 40 feet of pipe is vented to the atmosphere. 3. USEPA, AP-42, Fifth Edition Compilation of Air Pollutant Emission Factors, Volume 1: Stationary Point and Area Sources, Chapter 7.1, Organic Storage Tanks, Table 7.1-2, November 2006. 4. USEPA, AP-42, Fifth Edition Compilation of Air Pollutant Emission Factors, Volume 1: Stationary Point and Area Sources, Chapter 7.1, Organic Storage Tanks, Table 7.1-10, November 2006. The Line 13 pig launcher and receiver clingage factors assume to be equivalent to gasoline with a light rust shell condition and the other pigging equipment is in crude oil service with a light rust shell condition. 5. Conservatively assumes 24 pigging events per year. 6. Conservatively assumes 5 pigging events per year each for the Line 13 pig launcher, Line 13 pig receiver and the Line 67 pig receiver. 7. This launcher is capable of handling multiple pigs at one time. The launcher may be opened up to one time per day.
120113 10/9/2012

Emission Unit ID
T01 T02 T03 T04 T05 T06 T07 T08 T09 T10 T11 T12 T13 T14 T15 T16 T17 T18 T19 T20 T21 T22 T23 T24 T25 T26 T27 T28 T29 T30 T31 T32 T33 T34 T35 T36 T37 T38 T39 T40 T41 T42
ST01 ST02 ST03 ST04 ST05 ST06
Notes
Table 2-11 Enbridge Energy, Limited Partnership - Superior, WI Terminal
MTE/PTE Emission Calculations Green House Gas Emissions from Storage Tanks
Potential Tanks CH4 Emission Potential CH4 Potential C02
Throughput111 Factor<2> Potential CH 4 Equivalent
Emissions Emissions (tpy) Emissions(3,4l (MM gal/yr) (lb CH,IMMgal) (lb/yr) (CO,e tnvl
1,425.06 5.25 7,480.28 3.74 78.54 1,425.06 5.25 7,480.28 3.74 78.54
548.10 5.25 2,877.03 1.44 30.21 548.10 5.25 2,877.03 1.44 30.21 548.10 5.25 2,877.03 1.44 30.21 548.10 5.25 2,877.03 1.44 30.21 548.10 5.25 2,877.03 1.44 30.21 548.10 5.25 2,877.03 1.44 30.21 548.10 5.25 2,877.03 1.44 30.21 548.10 5.25 2,877.03 1.44 30.21 548.10 5.25 2,877.03 1.44 30.21 548.10 5.25 2,877.03 1.44 30.21 792.92 5.25 4,162.11 2.08 43.70 792.92 5.25 4,162.11 2.08 43.70 792.92 5.25 4,162.11 2.08 43.70 792.92 5.25 4,162.11 2.08 43.70 792.92 5.25 4,162.11 2.08 43.70 792.92 5.25 4,162.11 2.08 43.70 792.92 5.25 4,162.11 2.08 43.70 792.92 5.25 4,162.11 2.08 43.70 792.92 5.25 4,162.11 2.08 43.70 792.92 5.25 4,162.11 2.08 43.70 792.92 5.25 4,162.11 2.08 43.70 792.92 5.25 4,162.11 2.08 43.70 792.92 5.25 4,162.11 2.08 43.70 792.92 5.25 4,162.11 2.08 43.70 792.92 5.25 4,162.11 2.08 43.70 792.92 5.25 4,162.11 2.08 43.70 792.92 5.25 4,162.11 2.08 43.70 913.50 5.25 4,795.05 2.40 50.35 913.50 5.25 4,795.05 2.40 50.35 668.16 5.25 3,507.24 1.75 36.83 668.16 5.25 3,507.24 1.75 36.83
1,432.99 5.25 7,521.88 3.76 78.98 1,727.49 5.25 9,067.74 4.53 95.21 1,727.49 5.25 9,067.74 4.53 95.21 1,727.49 5.25 9,067.74 4.53 95.21 1,727.49 5.25 9,067.74 4.53 95.21 1,727.49 5.25 9,067.74 4.53 95.21 1,727.49 5.25 9,067.74 4.53 95.21 4,907.55 5.25 25,760.21 12.88 270.48 4,907.55 5.25 25,760.21 12.88 270.48
1.05 5.25 5.52 0.00 0.06 0.12 5.25 0.63 0.00 0.01 0.12 5.25 0.63 0.00 0.01 0.05 5.25 0.24 0.00 0.00 0.12 5.25 0.63 0.00 0.01 0.03 5.25 0.16 0.00 0.00
Total 2,567.75
1. Refer to Table 2-8 and Table 2-9 for tank throughputs. 2. Methane emission factor obtained from 40 CFR 98.253 {m)(1), equation Y-22. Original value of 0.1 metric ton/MMbbl converted to 5.25 lb/MMgal. 3. Global warming potential (GWP) obtained from Table A-1 to Subpart A of Part 98 - Global Warming Potentials. 4. C02e calculated by equation A-1 of 40 CFR 98.2, which states the total C02e is equal to the GWP factor for CH4 multiplied by the potential CH4 emissions. The global warming potential for CH 4 is 21.
13of13 101912012
Top Related