


Languages
Pages
Legal


EBOS Group Limited Interim Financial Results presentation for the Half Year ended 31 December 2016
Patrick Davies Chief Executive Officer John Cullity Chief Financial Officer
22 February 2017

2
Disclaimer
The information in this presentation was prepared by EBOS Group Ltd with due care and attention. However, the information is supplied in summary form and is therefore not necessarily complete, and no representation is made as to the accuracy, completeness or reliability of the information. In addition, neither the EBOS Group nor any of its subsidiaries, directors, employees, shareholders nor any other person shall have liability whatsoever to any person for any loss (including, without limitation, arising from any fault or negligence) arising from this presentation or any information supplied in connection with it. This presentation may contain forward-looking statements and projections. These reflect EBOS’ current expectations, based on what it thinks are reasonable assumptions. EBOS gives no warranty or representation as to its future financial performance or any future matter. Except as required by law or NZX or ASX listing rules, EBOS is not obliged to update this presentation after its release, even if things change materially. This presentation does not constitute financial advice. Further, this presentation is not and should not be construed as an offer to sell or a solicitation of an offer to buy EBOS Group securities and may not be relied upon in connection with any purchase of EBOS Group securities. This presentation contains a number of non-GAAP financial measures, including Gross Profit, Gross Operating Revenue, EBIT, EBITA, EBITDA, Underlying EBITDA, NPAT, Underlying NPAT, Underlying Earnings per Share, Free Cash Flow, Interest cover, Net Debt and Return on Capital Employed. Because they are not defined by GAAP or IFRS, EBOS’ calculation of these measures may differ from similarly titled measures presented by other companies and they should not be considered in isolation from, or construed as an alternative to, other financial measures determined in accordance with GAAP. Although EBOS believes they provide useful information in measuring the financial performance and condition of EBOS' business, readers are cautioned not to place undue reliance on these non-GAAP financial measures. The information contained in this presentation should be considered in conjunction with the consolidated financial statements for the period ended 31 December 2016. All currency amounts are in New Zealand dollars unless stated otherwise.
3
Group Financial Results 1 A-Frame automatic picking system, Symbion Keysborough facility,
Melbourne, Australia

4
H1 FY17 Summary Results¹
Revenue
$4.0b 17.2% (+20.6% Constant FX)
Group Financial Results
EBITDA
$119.9m NPAT
$68.8m 5.4% (+9.0% Constant FX) 7.2% (+10.9% Constant FX)
ROCE
16.0% Earnings per share
45.4c Dividend per share
30.0c 170 basis points 6.7% (+10.4% Constant FX) 15.4%
¹ EBITDA, NPAT and Earnings per share include $2.4m of transaction costs ($1.4m after tax and after non-controlling interests) incurred on the Terry White Chemmart merger completed 31 October 2016.
5
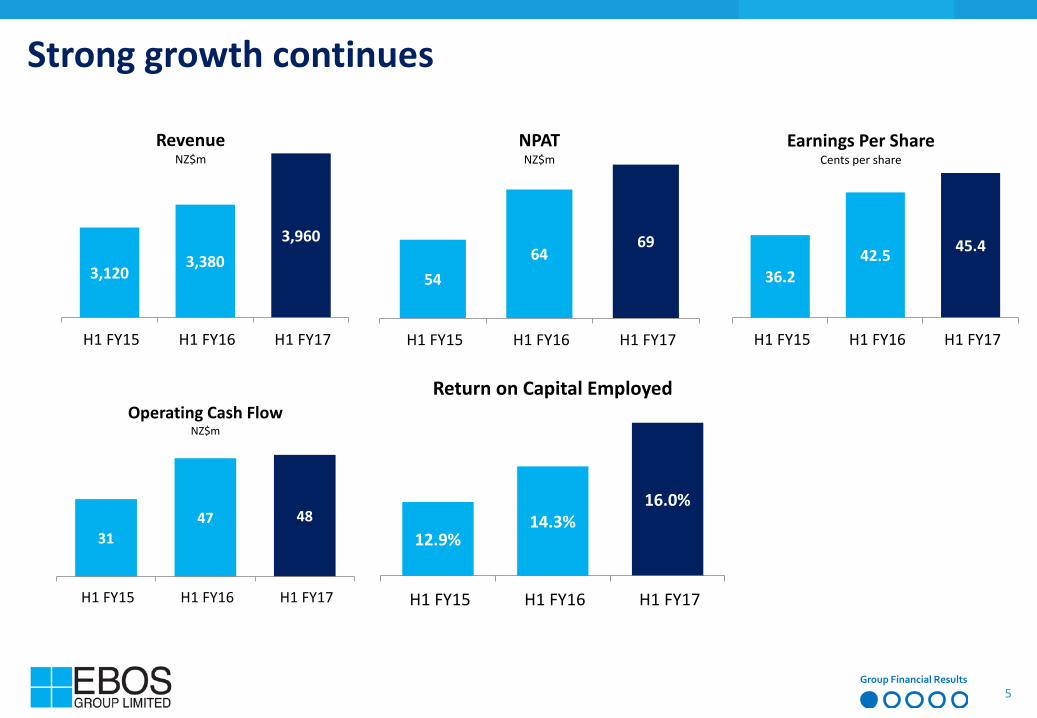
12.9%14.3%
16.0%
H1 FY15 H1 FY16 H1 FY17
Return on Capital Employed
3,1203,380
3,960
H1 FY15 H1 FY16 H1 FY17
RevenueNZ$m
5464
69
H1 FY15 H1 FY16 H1 FY17
NPATNZ$m
36.242.5 45.4
H1 FY15 H1 FY16 H1 FY17
Earnings Per ShareCents per share
Strong growth continues
Group Financial Results
3147 48
H1 FY15 H1 FY16 H1 FY17
Operating Cash FlowNZ$m

6
H1 H1 Constant FXNZ$m FY17 FY16 Var VarStatutory Results
Revenue 3,960.2 3,379.7 17.2% 20.6%
Gross Operating Revenue 364.1 333.7 9.1% 12.4%
EBITDA 119.9 113.7 5.4% 9.0%
EBIT 107.5 101.4 6.0% 9.6%
Net Finance Costs 8.9 9.7 7.7% 5.0%
Profit Before Tax 98.6 91.7 7.5% 11.3%
Net Profit After Tax1 68.8 64.2 7.2% 10.9%Statutory EPS - cps 45.4 42.5 6.7% 10.4%
Underlying EBITDA2 122.3 113.7 7.5% 11.1%
Underlying NPAT2 70.2 64.2 9.5% 13.2%
Underlying EPS - cps2 46.3 42.5 9.0% 12.7%
Net Debt 288.1 379.3
Net Debt : EBITDA 1.25x 1.80x
Strong first half financial performance
Group Financial Results
• First Half Group Revenue increase of $580m or 20.6% (constant FX): – Healthcare up 21.5%. – Animal Care up 5.9%.
• EBITDA increase of $6.1m or 9.0% (constant FX): – Healthcare up 10.6%. – Animal Care up 10.7%.
• NPAT increase of $4.6m or 10.9% (constant FX).
• Increased NZD:AUD cross rate negatively impacted NPAT by $2.1m for H1 FY17.
• Underlying EPS growth of 12.7% (constant FX).
• Solid cash flow performance with Net Debt / EBITDA ratio now at 1.25x.
Note 1: Net profit after tax and after non-controlling interests.
Note 2: Underlying EBITDA, NPAT and EPS exclude $2.4m of transaction costs ($1.4m after tax and after non-controlling interests) incurred on the Terry White Chemmart merger completed 31 October 2016.
7
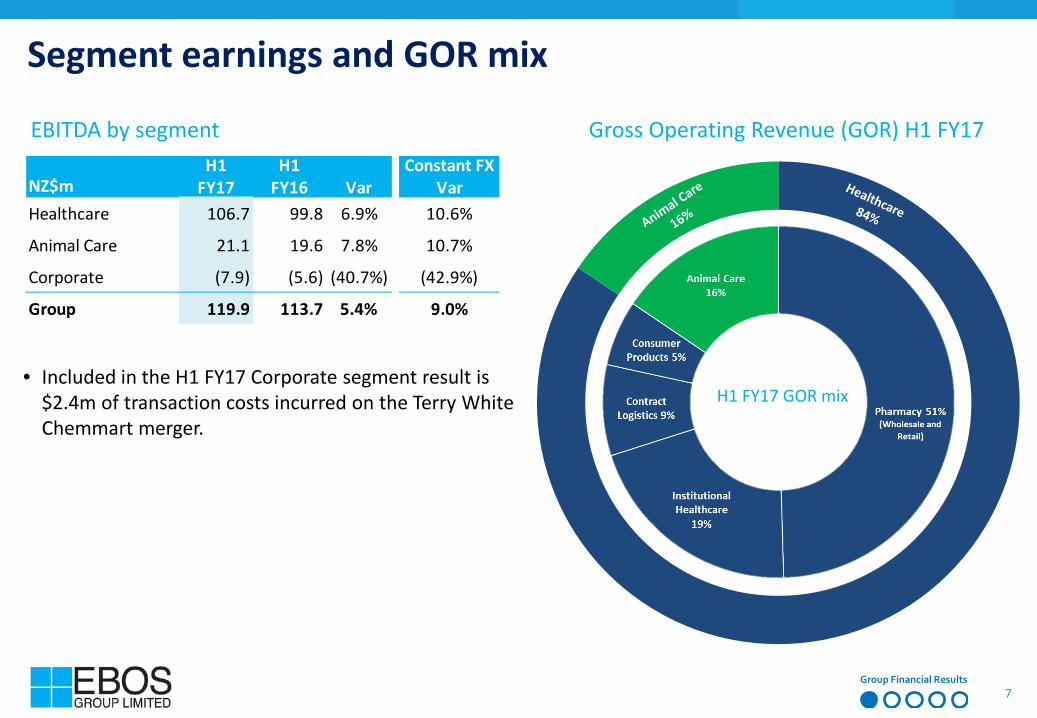
Segment earnings and GOR mix
EBITDA by segment Gross Operating Revenue (GOR) H1 FY17
H1 FY17 GOR mix
Group Financial Results
• Included in the H1 FY17 Corporate segment result is $2.4m of transaction costs incurred on the Terry White Chemmart merger.
H1 H1 Constant FXNZ$m FY17 FY16 Var VarHealthcare 106.7 99.8 6.9% 10.6%
Animal Care 21.1 19.6 7.8% 10.7%
Corporate (7.9) (5.6) (40.7%) (42.9%)
Group 119.9 113.7 5.4% 9.0%

8
Healthcare Results 2
Top left: TerryWhite Chemmart pharmacy in Melbourne. Top right: Selection of Red Seal toothpaste and tea products.
Bottom left: EBOS Healthcare, Auckland. Bottom right: ProPharma, Auckland

9
89100
107
H1 FY15 H1 FY16 H1 FY17
EBITDA NZ$m
Healthcare segment Strong trading performances across Australia and New Zealand
• Revenue increase of $575m or 21.5% (constant FX): – Australia up 26.8%. – New Zealand up 3.4%.
• EBITDA increase of $6.9m or 10.6% (constant FX): – Australia up 11.0%. – New Zealand up 6.3%.
Healthcare Results
H1 H1 Constant FXNZ$m FY17 FY16 Var Var
Healthcare segmentRevenue 3,744.1 3,169.3 18.1% 21.5%
EBITDA 106.7 99.8 6.9% 10.6%
EBIT 96.1 89.3 7.6% 11.3%
EBITDA% 2.85% 3.15% -30pts -30pts
Australia
Revenue 3,013.8 2,463.3 22.3% 26.8%
EBITDA 85.2 79.5 7.1% 11.0%
EBIT 75.7 70.2 7.8% 11.7%
EBITDA% 2.83% 3.23% -40pts -40pts
New Zealand
Revenue 730.2 706.0 3.4%
EBITDA 21.5 20.2 6.3%
EBIT 20.4 19.1 6.9%
EBITDA% 2.94% 2.86% 8pts

10
COMMUNITY PHARMACY
Healthcare segment – First Half Highlights
Healthcare Results
CONSUMER PRODUCTS
Note: Revenue includes Net Sales and Other Income. Gross Operating Revenue (GOR) includes Gross Profit and Other Income and excludes operating expenses.
• Pharmacy revenue in Australia grew by 15.8% (constant FX), attributable to new Hepatitis C medicine sales, albeit at lower gross profit margins, and the inclusion of Terry White Group revenue from November 2016.
• Prescription medicine sales growth in Australia (excluding Hepatitis C medicines) was flat due to the impact of PBS reforms.
• First half OTC sales declined marginally due to a decline in export demand.
• Continued focus on our cost base resulted in cost savings and improved productivity across our operations.
• The merger of Chemmart with Terry White Group was completed in October 2016 to create one of Australia’s largest retail pharmacy networks with approximately 500 stores.
• Consumer Products (excluding Red Seal) recorded revenue growth of 9.0%, mainly from a number of new agency agreements in New Zealand.
• Red Seal is performing in-line with expectations with like-for-like revenue growth of 8.4%. Strong revenue growth was recorded in teas, toothpaste and supplements in both domestic and international markets. – Sales to China increased by 24% on a like-for-like basis. – We are encouraged with revenue growth recorded in
other Asian markets, such as South Korea which recorded first half revenue growth of 98% to last year.
NZ$m H1 FY17 H1 FY16 Var%Revenue 2,144.2 1,902.6 12.7%GOR 180.4 164.7 9.5%GOR% 8.4% 8.7%
Constant FXNZ$m H1 FY17 H1 FY16 Var%Revenue 54.5 34.5 58.1%GOR 22.0 14.6 50.3%GOR% 40.3% 42.4%
Constant FX
11
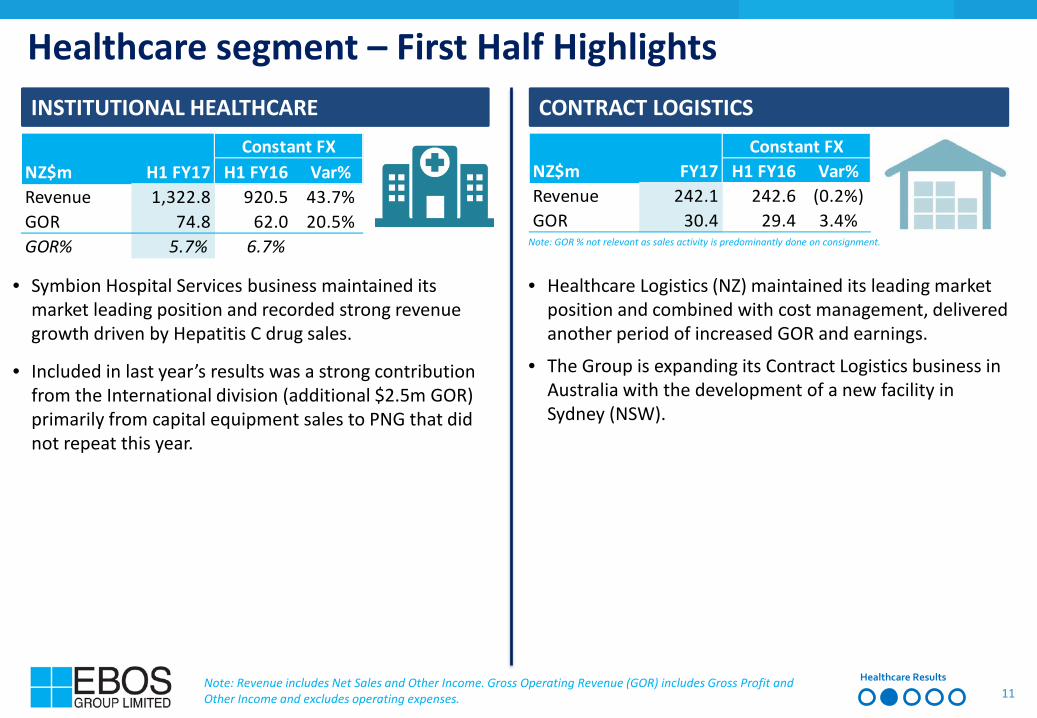
• Symbion Hospital Services business maintained its market leading position and recorded strong revenue growth driven by Hepatitis C drug sales.
• Included in last year’s results was a strong contribution from the International division (additional $2.5m GOR) primarily from capital equipment sales to PNG that did not repeat this year.
INSTITUTIONAL HEALTHCARE
Healthcare segment – First Half Highlights
Healthcare Results
CONTRACT LOGISTICS
Note: Revenue includes Net Sales and Other Income. Gross Operating Revenue (GOR) includes Gross Profit and Other Income and excludes operating expenses.
• Healthcare Logistics (NZ) maintained its leading market position and combined with cost management, delivered another period of increased GOR and earnings.
• The Group is expanding its Contract Logistics business in Australia with the development of a new facility in Sydney (NSW).
Note: GOR % not relevant as sales activity is predominantly done on consignment.
NZ$m H1 FY17 H1 FY16 Var%Revenue 1,322.8 920.5 43.7%GOR 74.8 62.0 20.5%GOR% 5.7% 6.7%
Constant FXNZ$m FY17 H1 FY16 Var%Revenue 242.1 242.6 (0.2%)GOR 30.4 29.4 3.4%
Constant FX

12
Animal Care Results 3 Selection of our Animal Care brands of BlackHawk and Vitapet and an
Animates store in Auckland.

13
16.819.6
21.1
H1 FY15 H1 FY16 H1 FY17
EBITDANZ$m
• Revenue increase of $5.7m or 5.9% (Constant FX), primarily from growth of branded products (including BlackHawk and Vitapet).
• EBITDA increase of $1.5m or 10.7% (constant FX) attributable to: – Revenue growth from our key branded products; – Improved Animates joint venture performance
with EBOS’ share of NPAT increasing $0.4m (39%) to last year.
Animal Care Results
Animal Care segment BlackHawk and Vitapet revenue growth key to H1 earnings performance
H1 H1 Constant FXNZ$m FY17 FY16 Var Var
Animal Care segmentRevenue 216.1 210.5 2.7% 5.9%
EBITDA 21.1 19.6 7.8% 10.7%
EBIT 19.3 17.7 9.1% 12.0%
EBITDA% 9.77% 9.31% 46pts 42pts

14
PRODUCTS & BRANDS
• BlackHawk, our premium pet food brand, continues to receive very strong support and is outperforming the market. Revenue grew 48% in H1 FY17 on last year, driven by an investment in marketing, additional ranging in pet specialty stores and new product launches.
• Vitapet recorded revenue growth of 10.6% (constant FX) driven by new product development, range expansion and marketing investment.
• Increased Animates profit due to revenue growth of 15%. During the half year, Animates opened five new retail stores and two veterinary clinics. The business now operates 37 retail stores and 10 veterinary clinics in New Zealand.
• Lyppard recorded steady revenue growth from its major customers (vet groups and pet stores). This market remains competitive and continues to consolidate which is placing pressure on gross margins.
Animal Care Results
Animal Care segment Half Year Performance Overview
RETAIL
VET WHOLESALE

15
Group Financial Information 4 EBOS Healthcare warehouse,
Auckland, New Zealand
16
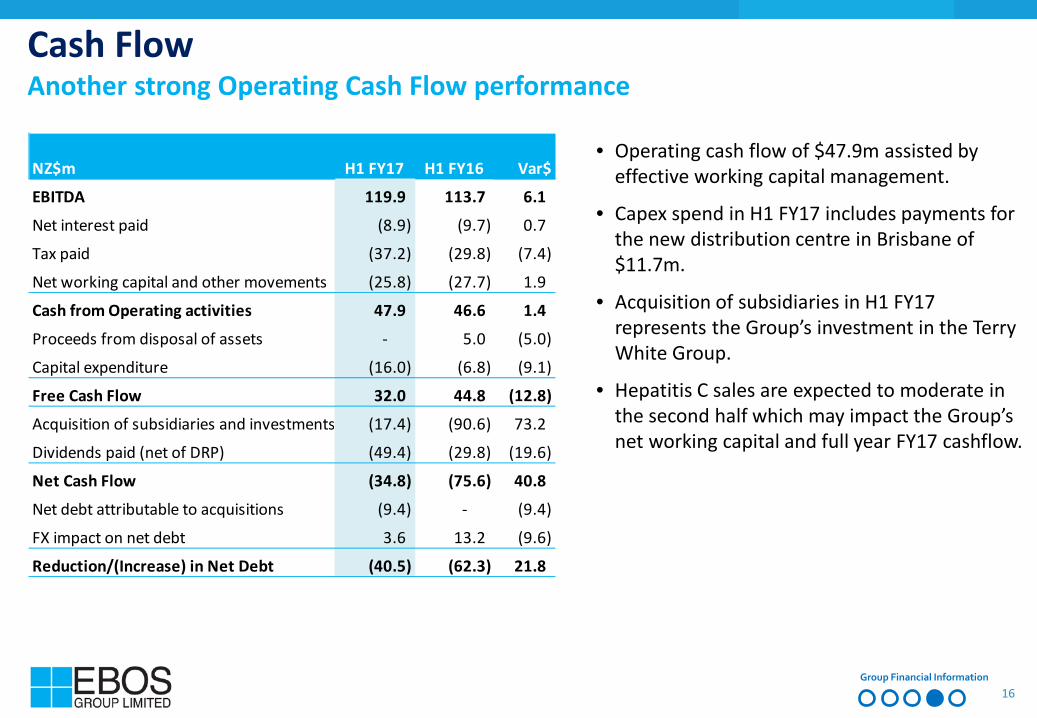
Cash Flow Another strong Operating Cash Flow performance
• Operating cash flow of $47.9m assisted by effective working capital management.
• Capex spend in H1 FY17 includes payments for the new distribution centre in Brisbane of $11.7m.
• Acquisition of subsidiaries in H1 FY17 represents the Group’s investment in the Terry White Group.
• Hepatitis C sales are expected to moderate in the second half which may impact the Group’s net working capital and full year FY17 cashflow.
Group Financial Information
NZ$m H1 FY17 H1 FY16 Var$
EBITDA 119.9 113.7 6.1
Net interest paid (8.9) (9.7) 0.7
Tax paid (37.2) (29.8) (7.4)
Net working capital and other movements (25.8) (27.7) 1.9
Cash from Operating activities 47.9 46.6 1.4
Proceeds from disposal of assets - 5.0 (5.0)
Capital expenditure (16.0) (6.8) (9.1)
Free Cash Flow 32.0 44.8 (12.8)
Acquisition of subsidiaries and investments (17.4) (90.6) 73.2
Dividends paid (net of DRP) (49.4) (29.8) (19.6)
Net Cash Flow (34.8) (75.6) 40.8
Net debt attributable to acquisitions (9.4) - (9.4)
FX impact on net debt 3.6 13.2 (9.6)
Reduction/(Increase) in Net Debt (40.5) (62.3) 21.8

17
• Working capital management discipline is a key focus of the Group.
• Cash conversion cycle of 17 days.
• Lower investment in Net Working Capital than December 2015 is predominantly due to the Group’s Hepatitis C medicine sales activity.
• Cash conversion days excludes the Group’s 3PL Hepatitis C business as stock is held on consignment.
Working Capital and Cash Conversion
Group Financial Information Note 1: December 2016 and June 2016 cash conversion days are adjusted for the Group’s 3PL debtors and creditors arising from its Hepatitis C business.
Note 2: June 2016 and December 2015 cash conversion days are adjusted for constant currency.
NZ$m Dec 2016 June 2016 Dec 2015Net Working CapitalTrade receivables 1,112.5 1,302.8 853.9Inventory 596.2 578.5 548.8Trade payables (1,318.2) (1,539.9) (941.1)Other (128.0) (98.9) (109.2)Total 262.5 242.6 352.3
Cash conversion days1,2
Debtor days 41 43 47 Inventory days 31 29 33 Creditor days 55 59 58 Cash conversion days 17 13 22
18
13.7%
16.3%14.3%
16.0%
FY15 FY16 H1 FY16 H1 FY17
ROCE
%
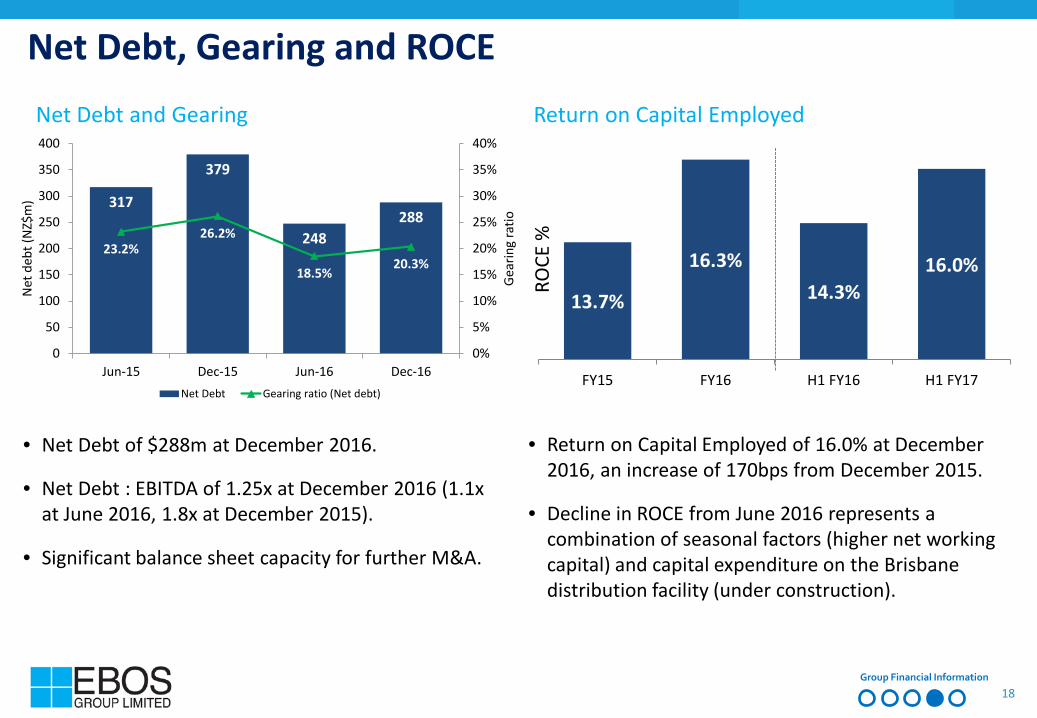
• Net Debt of $288m at December 2016.
• Net Debt : EBITDA of 1.25x at December 2016 (1.1x at June 2016, 1.8x at December 2015).
• Significant balance sheet capacity for further M&A.
Net Debt, Gearing and ROCE
Group Financial Information
Net Debt and Gearing
317
379
248288
23.2%26.2%
18.5%20.3%
0%
5%
10%
15%
20%
25%
30%
35%
40%
0
50
100
150
200
250
300
350
400
Jun-15 Dec-15 Jun-16 Dec-16
Gea
ring
ratio
Net
deb
t (N
Z$m
)
Net Debt Gearing ratio (Net debt)
Return on Capital Employed
• Return on Capital Employed of 16.0% at December 2016, an increase of 170bps from December 2015.
• Decline in ROCE from June 2016 represents a combination of seasonal factors (higher net working capital) and capital expenditure on the Brisbane distribution facility (under construction).
19
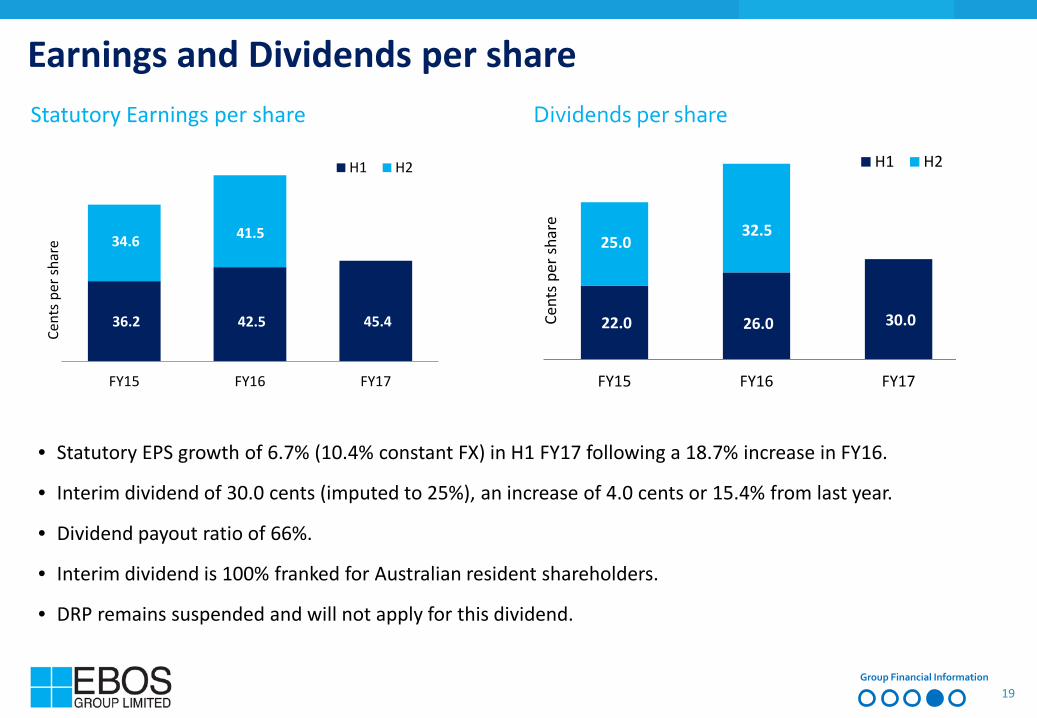
• Statutory EPS growth of 6.7% (10.4% constant FX) in H1 FY17 following a 18.7% increase in FY16.
• Interim dividend of 30.0 cents (imputed to 25%), an increase of 4.0 cents or 15.4% from last year.
• Dividend payout ratio of 66%.
• Interim dividend is 100% franked for Australian resident shareholders.
• DRP remains suspended and will not apply for this dividend.
Statutory Earnings per share Dividends per share
Group Financial Information
Earnings and Dividends per share
36.2 42.5 45.4
34.6 41.5
FY15 FY16 FY17
Cent
s per
shar
e
H1 H2
22.0 26.0 30.0
25.0 32.5
FY15 FY16 FY17
Cent
s per
shar
e
H1 H2
20 5 Summary and Outlook
Masterpet warehouse, Wellington, New Zealand
21
Underlying market dynamics remain positive across the business
Diversified earnings streams and customer base
Consistent EPS and dividend growth performance
Underpinned by a strong balance sheet, cash generation and successful history of M&A execution
Investing in infrastructure to allow for sustainable future growth
Increasing return on capital employed
Summary
Summary and Outlook
22
Outlook
• EBOS Group has recorded a positive start for the first half of the financial year across both its Healthcare and Animal Care divisions.
• In October 2016, we provided guidance of underlying, constant currency, net profit after tax growth in FY17 of between 7% to 10% compared to the prior year.
• EBOS Group now expects full year FY17 earnings to be at the upper end of this range.
Summary and Outlook

23
Supporting Information EBOS Group locations in
Australia and New Zealand

24
0.86
0.88
0.90
0.92
0.94
0.96
0.98
1.00
Jul-1
5
Oct
-15
Jan-
16
Apr-
16
Jul-1
6
Oct
-16
• 80% of the Group’s earnings (EBITDA) are generated in AUD.
• The average NZD:AUD FX rate for H1 FY17 increased by 3.3 cents from H1 FY16, negatively impacting the Group’s H1 FY17 EBITDA by approximately $3.7m.
• EBITDA sensitivity to a 1 cent movement in NZD:AUD exchange rate is approximately $2.0m per annum.
Foreign exchange Appreciation of the average NZD:AUD cross-rate by 3.3c to 0.951 negatively impacted EBITDA by $3.7m in H1 FY17
Revenue and EBITDA by currency
H1 FY16 average: 0.918c
NZD:AUD exchange rate – July 2015 to December 2016
Dec-
16
FY16 average: 0.921c H1 FY17 average: 0.951c
AUD Average AUD NZ GroupOperations NZD: AUD Operations Operations Consolidated
$m AUD translation NZD NZD NZDFY17Revenue 3,046.2 0.95 3,199.0 761.2 3,960.2 EBITDA 91.2 0.95 95.9 24.0 119.9 EBITDA% 2.99% 3.00% 3.15% 3.03%

25
NZ$m EBITDA NPAT EBITDA NPATStatutory result 119.9 68.8 113.7 64.2 Add backEBOS costs of the TWC/Chemmart merger 1.8 1.2 - - Terry White costs of the TWC/Chemmart merger 0.6 0.2 - -
2.4 1.4 - -
Underlying result 122.3 70.2 113.7 64.2
H1 FY17 H1 FY16
Reconciliation of statutory and underlying results
1
¹ Underlying EBITDA and Net Profit After Tax (attributable to the owners of the company) are both Non-GAAP measures which adjust for the effects of non-recurring items.

26
Glossary of terms and measures Except where noted, common terms and measures used in this document are based upon the following definitions:
Term Definition
Actual results Results translated into NZ dollars at the applicable actual monthly exchange rates ruling in each period. Debtor days Trade debtors at the end of period divided by Revenue for the period, multiplied by number of days in the period.
Inventory days Inventory at the end of period divided by Cost of Sales for the period, multiplied by number of days in the period.
Creditor days Trade creditors at the end of period divided by Cost of Sales for the period, multiplied by number of days in the period. Constant
FX/currency
Calculated by translating the prior period results into NZ dollars at the actual monthly exchange rates applicable in the current period.
Revenue Revenue from the sale of goods and the rendering of services. Gross Operating Revenue (GOR)
Revenue less cost of sales and the write-down of inventory.
EBIT Earnings before interest and tax. EBITDA Earnings before interest, tax, depreciation and amortisation.
Underlying EBITDA Earnings before interest, tax, depreciation, amortisation and transaction costs relating to the Terry White Chemmart merger. NPAT Net Profit After Tax attributable to the owners of the company.
Underlying NPAT Net Profit After Tax attributable to the owners of the company and before transaction costs relating to the Terry White Chemmart merger. Free Cash Flow Cash from operations less capital expenditure net of proceeds from disposals.
Earnings per share (EPS)
Net Profit after tax divided by the weighted average number of shares on issue during the period.
Underlying EPS Underlying NPAT divided by the weighted average number of shares on issue during the period. Net Debt : EBITDA Ratio of net debt at period end to the last 12 months EBITDA. Return on Capital Employed (ROCE)
Measured as underlying earnings before interest, tax and amortisation of finite life intangibles for 12 months divided by closing capital employed (including a pro-rata adjustment for entities acquired).

www.ebosgroup.com
Top Related