


![ARGUS: E–cient Scalable Continuous Query Optimization for ...jgc/publication/ARGUS_Efficient_Scalable_IDEAS_2006.pdfspace. In the MQO setting, [27] presents a global search strategy](https://static.fdocuments.us/doc/165x107/5f8f232505f36a562e02d2dc/argus-eacient-scalable-continuous-query-optimization-for-jgcpublicationargusefficientscalableideas2006pdf.jpg)


Languages
Pages
Legal


Introduction SPEERTO SPEERTO Extension Experimental Evaluation
Efficient Top-k Query Processing In HighlyDistributed Environment
Seminar on non traditional data management
Vinay Setty
Saarland University — Department of Computer Science
20/01/2009

Introduction SPEERTO SPEERTO Extension Experimental Evaluation
Contents
IntroductionSkylineK − Skyband and Top-k Queries
SPEERTOSystem OverviewThreshold-Based Top-k Algorithm
SPEERTO ExtensionParallel ProcessingReducing Skyline Cardinality
Experimental EvaluationExperimental SetupExperimental Results

Introduction SPEERTO SPEERTO Extension Experimental Evaluation
Find a hotel in Manhattan, cheap and near to the beach
Figure: Skyline of Manhattan

Introduction SPEERTO SPEERTO Extension Experimental Evaluation
Find a hotel in Manhattan, cheap and near to the beach
Figure: Skyline of Manhattan

Introduction SPEERTO SPEERTO Extension Experimental Evaluation
Top-k Queries
Exact best k results based on user-defined aggregate function
Example:User query: top-k hotels with aggregate function distance +price
Many centralized solutions are available
Challenge is to support highly distributed environments likeP2P
Existing solutions for P2P are for vertical data distribution

Introduction SPEERTO SPEERTO Extension Experimental Evaluation
Data representation for Top-k Queries
Given set of data objects O with |O| = n
The feature space is defined by the d scoring functions sjFeature space is d-dimensional
Each oi ∈ O is represented as a point p
p = {p[1], ..., p[d ]} where p[j ] = sj(oi ) (1 ≤ j ≤ d)

Introduction SPEERTO SPEERTO Extension Experimental Evaluation
Aggregation Function
User-defined increasingly monotone aggregate function f
Increasingly monotone: ∀i p[i ] ≤ p′[i ]⇒f (p) = f (p[1], ..., p[d ]) ≤ f (p′[1], ..., p′[d ]) = f (p′)Example: Weighted sum over all the features (used inSPEERTO)
Aggregated score, score(oi ) =∑d
j=1 wjsj(oj), wj : weight of sj

Introduction SPEERTO SPEERTO Extension Experimental Evaluation
SkylineGiven a d-dimensional feature space D and a set of objects OA point p ∈ O with p = {p[1], ..., p[d ]} dominates a pointq ∈ O, if on each dimension di ∈ D, p[i ] ≤ q[i ] and at leastone dimension with p[i ] < q[i ]The “Skyline” SKY ⊆ O is set of points that are notdominated by any other points
1 2 3 4 5 6 7 8 9
1 2 3 4 5 6 7 8
t5
t6
to
t1
t4
t2
t3
Distance
Price
Skyline

Introduction SPEERTO SPEERTO Extension Experimental Evaluation
Property of Skyline
Observation:
The top-1 object for any increasingly monotone function f belongsto the skyline set
Proof:
Assume q ∈ top − 1 and q /∈ SKYf is increasingly monotone ⇒ ∀di ∈ D, ∃p ∈ SKY and p[i ] ≤ q[i ]and at least one dj ∈ D, p[j ] < q[j ]This is a contradiction to our assumption that q is top-1

Introduction SPEERTO SPEERTO Extension Experimental Evaluation
K − SkybandTo answer Top-k query with k ≤ K Skyline is not sufficient
Definition:
K − Skyband is the set of points which are dominated by at mostK-1 points.
Special case: 1− Skyband is Skyline
Example: 3− Skyband
K-Skyband area (K=3)

Introduction SPEERTO SPEERTO Extension Experimental Evaluation
Top-k Skyline QueryGiven a linear top-K query defined by a vector wOnly direction of w matters, we can assume
∑di=1 wi = 1
In d-dimensional space, query boderline is d-1 dimensionalhyperplaneQuery processing is sweeping query boderline in feature space
Example: Top-k query in 2-dimensional feature space
K-Skyband area (K=3)
Query borderline0.5*x + 0.5*y = 2.5
w

Introduction SPEERTO SPEERTO Extension Experimental Evaluation
SPEERTO: System Overview
Top-k queries in P2P networks
Unstructured P2P network of Np peers
Special peers called ”super-peers”SPi (1 ≤ i ≤ Nsp) and Nsp << Np
Each super-peer maintains DEGp links to simple peers
Also, initially a super-peer is connected toDEGsp(DEGsp < DEGp) other super-peers
Later, at query time each super-peer can open connection toany other super-peer

Introduction SPEERTO SPEERTO Extension Experimental Evaluation
SPEERTO: System OverviewEach peer Pi holds ni d-dimensional points, denoted as setOi (1 ≤ i ≤ Np)
Total data set O =⋃
Oi with |O| = n =∑Np
i=1 ni
K-skyband from Np simple peers are merged and stored ateach super-peer SPi
Example:

Introduction SPEERTO SPEERTO Extension Experimental Evaluation
Skyline based routing
Skyline is used as preprocessing step
Each peer computes its K-skyband
Each super-peer merges all the K-skybands from its simplepeers to get KSKYi
This merged data serves as routing table for query routing
User query can be posed at any peer
Associated super-peer handles the query routing
Top-k queries with (k ≤ K ) are accurately answered

Introduction SPEERTO SPEERTO Extension Experimental Evaluation
Solution Approach
Naıve Solutions
Broadcast the Merged Skyband of a super-peer to othersuper-peersFlood the query to all super-peers and get the Top-k results
SPEERTO Approach
Broadcast only part of merged data: SkylineQuery only those peers which contain Top-k values

Introduction SPEERTO SPEERTO Extension Experimental Evaluation
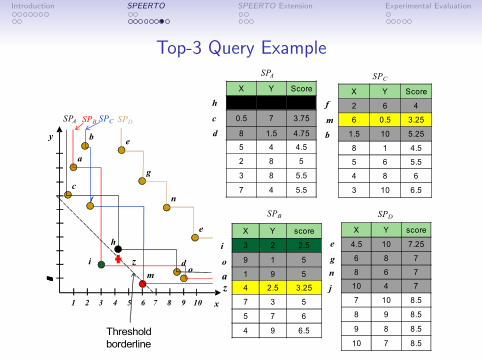
Threshold-Based Top-k
Each super-peer SPi assembles Nsp sets of skyline pointsSKYi , (1 ≤ i ≤ Nsp), also called as Routing Objects
A threshold value is defined as the score of the k-th point
In 2-dimensional space, query borderline is sweeped to gettop-k results
Example: A top-4 query with weights w = (0.5, 0.5)

Introduction SPEERTO SPEERTO Extension Experimental Evaluation
Threshold-based Top-k algorithm
list = KSKYqthreshold = min(list)
count=0
if count < k
next_obj = list.pop()
if next_objis a routing
object
temp = next_obj.query
list.append(temp)
return next_objcount++
threshold = min(list)
stopNo
No
Yes
Yes

Introduction SPEERTO SPEERTO Extension Experimental Evaluation
Top-3 Query Example
X Y Score
2 6 4
6 0.5 3.25
1.5 10 5.25
8 1 4.5
5 6 5.5
4 8 6
3 10 6.5
X Y Score
4 3 3.5
0.5 7 3.75
8 1.5 4.75
5 4 4.5
2 8 5
3 8 5.5
7 4 5.5
X Y score
3 2 2.5
9 1 5
1 9 5
4 2.5 3.25
7 3 5
5 7 6
4 9 6.5
X Y score
4.5 10 7.25
6 8 7
8 6 7
10 4 7
7 10 8.5
8 9 8.5
9 8 8.5
10 7 8.5
SPB
1 2 3 4 5 6 7 8 9 10
1 2 3 4 5 6 7 8 9 10
d
hi
y
x
a
b
o
e
SPA SPB
cf
g
e
m
n
SPDSPC
SPD
SPCSPA
h
c
ao
i
j
ng
e
bm
f
d

Introduction SPEERTO SPEERTO Extension Experimental Evaluation
Top-3 Query Example
X Y Score
2 6 4
6 0.5 3.25
1.5 10 5.25
8 1 4.5
5 6 5.5
4 8 6
3 10 6.5
X Y Score
4 3 3.5
0.5 7 3.75
8 1.5 4.75
5 4 4.5
2 8 5
3 8 5.5
7 4 5.5
X Y score
3 2 2.5
9 1 5
1 9 5
4 2.5 3.25
7 3 5
5 7 6
4 9 6.5
X Y score
4.5 10 7.25
6 8 7
8 6 7
10 4 7
7 10 8.5
8 9 8.5
9 8 8.5
10 7 8.5
SPB
1 2 3 4 5 6 7 8 9 10
1 2 3 4 5 6 7 8 9 10
d
h
i
y
x
a
b
o
e
SPA SPB
cf
g
e
m
n
SPDSPC
SPD
SPCSPA
h
c
ao
i
j
ng
e
bm
f
d
Query borderline0.5*x + 0.5*y = 2.5
Threshold borderline
z
z
Introduction SPEERTO SPEERTO Extension Experimental Evaluation
Top-3 Query Example
X Y Score
2 6 4
6 0.5 3.25
1.5 10 5.25
8 1 4.5
5 6 5.5
4 8 6
3 10 6.5
X Y Score
4 3 3.5
0.5 7 3.75
8 1.5 4.75
5 4 4.5
2 8 5
3 8 5.5
7 4 5.5
X Y score
3 2 2.5
9 1 5
1 9 5
4 2.5 3.25
7 3 5
5 7 6
4 9 6.5
X Y score
4.5 10 7.25
6 8 7
8 6 7
10 4 7
7 10 8.5
8 9 8.5
9 8 8.5
10 7 8.5
SPB
1 2 3 4 5 6 7 8 9 10
1 2 3 4 5 6 7 8 9 10
d
h
i
y
x
a
b
o
e
SPA SPB
cf
g
e
m
n
SPDSPC
SPD
SPCSPA
h
c
ao
i
j
ng
e
bm
f
d
Threshold borderline
z
z

Introduction SPEERTO SPEERTO Extension Experimental Evaluation
Correctness and Optimality of SPEERTO
Correctness
Use of skyline at each super-peer guarantees correct result
Number of queried super-peers
A super-peer SP is queried only if next best object o in sortedlist
o is next best match so there is at least one object in SPwhich is part of Top-k result
Data transfer
Only objects with score less than threshold value aretransferred

Introduction SPEERTO SPEERTO Extension Experimental Evaluation
SPEERTO Extensions
Parallel processing
Linear processing of object list is blocking
We can query more than one peers in an iteration
Results in inaccuracy of result
Reduced Skyline cardinality
|SKY | is very high
Solution is to find an approximation of the skyline
Approximate skyline is robust to data updates

Introduction SPEERTO SPEERTO Extension Experimental Evaluation
SPEERTO: Parallel Query processing
1 Compute mean score m = t−score(o1)Nr
, t - Threshold value,score(o1)- score of top-1 object, Nr - number of retrievedobjects
2 If next object o2 is routing object then computeNr2 = score(o2)−score(o1)
m
3 else if o2 is data object, then process super-peers found so far
4 If next object o3 is routing object then computeNr3 = score(o3)−score(o2)
m
5 repeat 1 to 4 until Nr2 + Nr3 > (k − c)
6 A new mean is computed m′ = m+m1+m23 , m2 = t−score(o2)
Nr2
and m3 = t−score(o1)Nr3
7 A new Threshold t′ is computed
8 Repeat until k objects are found

Introduction SPEERTO SPEERTO Extension Experimental Evaluation
Reducing skyline cardinality
Given an upper limit U, abstract the skyline aSKY with atmost U points (U < |SKY |)
each point p ∈ SKY is either dominated by or equal to atleast one point q ∈ aSKY
|aSKY | ≤ U < |SKY |It only slightly influences the routing power of the skyline
There are many ways to find aSKY

Introduction SPEERTO SPEERTO Extension Experimental Evaluation
How to Abstract The Skyline?Consider an example with q, p, m, k as skylineGiven an upper limit U = 3Suppose we decide to replace q, p with one point rTo ensure accuracy the super-peers will also be contactedbased on abstraction

Introduction SPEERTO SPEERTO Extension Experimental Evaluation
Heuristic to Abstract Skyline
1 Choose a point p with largest entropy valueE (p) = argmax∀t∈SKYi
(∑
1≤i≤d ln(p[i ] + 1))
2 Choose another point q with minimum distancedist = min1≤i≤d(|p[i ]− q[i ]|), ∀t ∈ SKYi
3 Then replace p and q with r withr [i ] = min(p[i ], q[i ]), (1 ≤ i ≤ d)
4 Iterate and terminate when U < |SKY |
Introduction SPEERTO SPEERTO Extension Experimental Evaluation
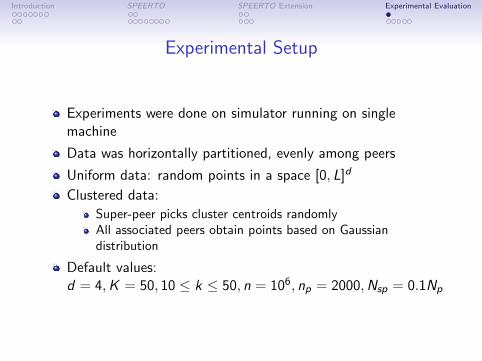
Experimental Setup
Experiments were done on simulator running on singlemachine
Data was horizontally partitioned, evenly among peers
Uniform data: random points in a space [0, L]d
Clustered data:
Super-peer picks cluster centroids randomlyAll associated peers obtain points based on Gaussiandistribution
Default values:d = 4, K = 50, 10 ≤ k ≤ 50, n = 106, np = 2000, Nsp = 0.1Np
Introduction SPEERTO SPEERTO Extension Experimental Evaluation
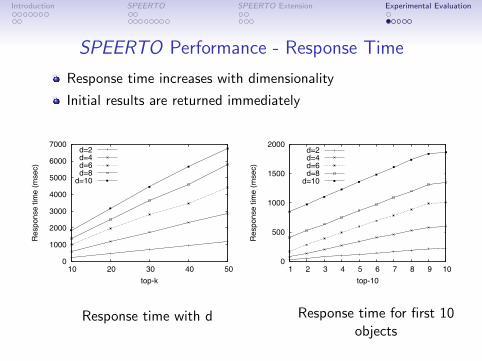
SPEERTO Performance - Response Time
Response time increases with dimensionality
Initial results are returned immediately
!"
!#"""
!$"""
!%"""
!&"""
!'"""
!("""
!)"""
!#" !$" !%" !&" !'"
*+,-./,+!012
+!32
,+45
0.-67
89$89&89(89:
89#"
(a) Response time with d
!"
!'""
!#"""
!#'""
!$"""
!#"!;!:!)!(!'!&!%!$!#
*+,-./,+!012
+!32
,+45
0.-6#"
89$89&89(89:
89#"
(b) Response time for first 10 objects
!"
!#"
!$"
!%"
!&"
!'"
!#" !$" !%" !&" !'"
<=2
>+?!.@!4./0A
40+
8!B
C,
0.-67
89$89&89(89:
89#"
(c) Number of contacted SPs
!"
!'
!#"
!#'
!$"
!'"!&"!%"!$"!#"
D2-?.
E+2
+/0!3F
5
0.-67
89$89&89(89:
89#"
(d) Gain in number of transferred objects
!::
!;"
!;$
!;&
!;(
!;:
!#""
!'"!&"!%"!$"!#"
C+?4
+/0A
G+!.
@!B
C,!H
10I!J
A1/
0.-67
89$89&89(89:
89#"
(e) Percentage of SPs with gain
!"
!'""
!#"""
!#'""
!$"""
!$'""
!%"""
!%'""
!&"""
!&'""
!'"!&"!%"!$"!#"
*+,-./,+!012
+!32
,+45
0.-67
/9#K/9#L'K
/9$K/9$L'K
(f) Scalability with cardinality
!"
!'""
!#"""
!#'""
!$"""
!$'""
!%"""
!'"!&"!%"!$"!#"
*+,-./,+!012
+!32
,+45
0.-67
<-9$"""<-9#""""<-9$""""
(g) Scalability with Np
!"
!#"
!$"
!%"
!&"
!'"
!#" !$" !%" !&" !'"
<=2
>+?!.@!4./0A
40+
8!B
C,
0.-67
<-9$"""<-9#""""<-9$""""
(h) Scalability with Np
!"
!#""
!$""
!%""
!&""
!'""
!(""
!#" !$" !%" !&" !'"
*+,-./,+!012
+!32
,+45
0.-67
89$89&89(89:
89#"
(i) Clustered dataset
Figure 7: Performance of SPEERTO (Nsp = 200, Np = 2000, K = 50)
super-peers (Figure 7(h)) remains practically the same fora given top-k query. In the next experiment, we study theperformance on clustered data. Figure 7(i) depicts the re-sponse time for clustered data distribution while varying thedimensionality of the dataset. The clustered dataset leadsto much smaller response time than the uniform distribu-tion, because only a few super-peers are contacted duringquery processing. Therefore, SPEERTO performs better forthe clustered dataset in terms of response time, contactedsuper-peers, and transferred data objects.
!"# $%&'! ()*+,*- .,/0 ! " #
In the next experiments we evaluate the effectiveness ofSPEERTO for top-k queries with k > K. We compare theactual top-k results with the ones retrieved from the K-skyband, by measuring the relative recall, i.e., the fraction ofthe produced top-k results that are in the true top-k results.
In Figure 8(a), we show the recall achieved for uniformdistribution and cardinality 0.5M, while varying d from 2 to4. The K parameter of the skyband is set to 10, which en-sures us the exact results at least for any top-10 query. We
evaluate the performance of our approach for 10 ≤ k ≤ 200.As expected recall decreases as k increases, but notice thatthe errors in the top-k list occur in the lower positioned ob-jects, which are less important to the user. The skyband sizeis manageable and less than 1% of the dataset in any case.For d = 2 the skyband contains less than 100 points, thusrecall decreases rapidly. For d = 4 the skyband size grows toless than 3500 data objects, and recall decreases less rapidly.Figure 8(a) shows that using the 10-skyband we can answertop-100 queries with recall around 40% for d = 2, while ford = 4 we can answer queries for higher k values with betterrecall. Experiments on clustered datasets resulted in similarrecall values (Figure 8(b)). By varying the cardinality wenoticed that recall (Figure 8(c)) and the skyband size (Fig-ure 8(d)) are hardly influenced, which makes our approachfeasible for large-scale systems.
In Figure 8(e) we vary K between 1 and 100 and evaluatethe recall on top-100 queries for different dimensionality val-ues. For K = 1 (which is the skyline set) we achieve recallof more than 90% for dimensionality 6 and 8, while the size
762
!"
!#"""
!$"""
!%"""
!&"""
!'"""
!("""
!)"""
!#" !$" !%" !&" !'"
*+,-./,+!012
+!32
,+45
0.-67
89$89&89(89:
89#"
(a) Response time with d
!"
!'""
!#"""
!#'""
!$"""
!#"!;!:!)!(!'!&!%!$!#
*+,-./,+!012
+!32
,+45
0.-6#"
89$89&89(89:
89#"
(b) Response time for first 10 objects
!"
!#"
!$"
!%"
!&"
!'"
!#" !$" !%" !&" !'"
<=2
>+?!.@!4./0A
40+
8!B
C,
0.-67
89$89&89(89:
89#"
(c) Number of contacted SPs
!"
!'
!#"
!#'
!$"
!'"!&"!%"!$"!#"
D2-?.
E+2
+/0!3F
5
0.-67
89$89&89(89:
89#"
(d) Gain in number of transferred objects
!::
!;"
!;$
!;&
!;(
!;:
!#""
!'"!&"!%"!$"!#"
C+?4
+/0A
G+!.
@!B
C,!H
10I!J
A1/
0.-67
89$89&89(89:
89#"
(e) Percentage of SPs with gain
!"
!'""
!#"""
!#'""
!$"""
!$'""
!%"""
!%'""
!&"""
!&'""
!'"!&"!%"!$"!#"
*+,-./,+!012
+!32
,+45
0.-67
/9#K/9#L'K
/9$K/9$L'K
(f) Scalability with cardinality
!"
!'""
!#"""
!#'""
!$"""
!$'""
!%"""
!'"!&"!%"!$"!#"
*+,-./,+!012
+!32
,+45
0.-67
<-9$"""<-9#""""<-9$""""
(g) Scalability with Np
!"
!#"
!$"
!%"
!&"
!'"
!#" !$" !%" !&" !'"
<=2
>+?!.@!4./0A
40+
8!B
C,
0.-67
<-9$"""<-9#""""<-9$""""
(h) Scalability with Np
!"
!#""
!$""
!%""
!&""
!'""
!(""
!#" !$" !%" !&" !'"
*+,-./,+!012
+!32
,+45
0.-67
89$89&89(89:
89#"
(i) Clustered dataset
Figure 7: Performance of SPEERTO (Nsp = 200, Np = 2000, K = 50)
super-peers (Figure 7(h)) remains practically the same fora given top-k query. In the next experiment, we study theperformance on clustered data. Figure 7(i) depicts the re-sponse time for clustered data distribution while varying thedimensionality of the dataset. The clustered dataset leadsto much smaller response time than the uniform distribu-tion, because only a few super-peers are contacted duringquery processing. Therefore, SPEERTO performs better forthe clustered dataset in terms of response time, contactedsuper-peers, and transferred data objects.
!"# $%&'! ()*+,*- .,/0 ! " #
In the next experiments we evaluate the effectiveness ofSPEERTO for top-k queries with k > K. We compare theactual top-k results with the ones retrieved from the K-skyband, by measuring the relative recall, i.e., the fraction ofthe produced top-k results that are in the true top-k results.
In Figure 8(a), we show the recall achieved for uniformdistribution and cardinality 0.5M, while varying d from 2 to4. The K parameter of the skyband is set to 10, which en-sures us the exact results at least for any top-10 query. We
evaluate the performance of our approach for 10 ≤ k ≤ 200.As expected recall decreases as k increases, but notice thatthe errors in the top-k list occur in the lower positioned ob-jects, which are less important to the user. The skyband sizeis manageable and less than 1% of the dataset in any case.For d = 2 the skyband contains less than 100 points, thusrecall decreases rapidly. For d = 4 the skyband size grows toless than 3500 data objects, and recall decreases less rapidly.Figure 8(a) shows that using the 10-skyband we can answertop-100 queries with recall around 40% for d = 2, while ford = 4 we can answer queries for higher k values with betterrecall. Experiments on clustered datasets resulted in similarrecall values (Figure 8(b)). By varying the cardinality wenoticed that recall (Figure 8(c)) and the skyband size (Fig-ure 8(d)) are hardly influenced, which makes our approachfeasible for large-scale systems.
In Figure 8(e) we vary K between 1 and 100 and evaluatethe recall on top-100 queries for different dimensionality val-ues. For K = 1 (which is the skyline set) we achieve recallof more than 90% for dimensionality 6 and 8, while the size
762
Response time with d Response time for first 10objects

Introduction SPEERTO SPEERTO Extension Experimental Evaluation
Effectiveness of Threshold Based Algorithm
Number of contacted super-peers increase slightly with d
Gain in number of transferred objects is around 21.9 for k=50
!"
!#"""
!$"""
!%"""
!&"""
!'"""
!("""
!)"""
!#" !$" !%" !&" !'"
*+,-./,+!012
+!32
,+45
0.-67
89$89&89(89:
89#"
(a) Response time with d
!"
!'""
!#"""
!#'""
!$"""
!#"!;!:!)!(!'!&!%!$!#
*+,-./,+!012
+!32
,+45
0.-6#"
89$89&89(89:
89#"
(b) Response time for first 10 objects
!"
!#"
!$"
!%"
!&"
!'"
!#" !$" !%" !&" !'"
<=2
>+?!.@!4./0A
40+
8!B
C,
0.-67
89$89&89(89:
89#"
(c) Number of contacted SPs
!"
!'
!#"
!#'
!$"
!'"!&"!%"!$"!#"
D2-?.
E+2
+/0!3F
5
0.-67
89$89&89(89:
89#"
(d) Gain in number of transferred objects
!::
!;"
!;$
!;&
!;(
!;:
!#""
!'"!&"!%"!$"!#"
C+?4
+/0A
G+!.
@!B
C,!H
10I!J
A1/
0.-67
89$89&89(89:
89#"
(e) Percentage of SPs with gain
!"
!'""
!#"""
!#'""
!$"""
!$'""
!%"""
!%'""
!&"""
!&'""
!'"!&"!%"!$"!#"
*+,-./,+!012
+!32
,+45
0.-67
/9#K/9#L'K
/9$K/9$L'K
(f) Scalability with cardinality
!"
!'""
!#"""
!#'""
!$"""
!$'""
!%"""
!'"!&"!%"!$"!#"
*+,-./,+!012
+!32
,+45
0.-67
<-9$"""<-9#""""<-9$""""
(g) Scalability with Np
!"
!#"
!$"
!%"
!&"
!'"
!#" !$" !%" !&" !'"
<=2
>+?!.@!4./0A
40+
8!B
C,
0.-67
<-9$"""<-9#""""<-9$""""
(h) Scalability with Np
!"
!#""
!$""
!%""
!&""
!'""
!(""
!#" !$" !%" !&" !'"
*+,-./,+!012
+!32
,+45
0.-67
89$89&89(89:
89#"
(i) Clustered dataset
Figure 7: Performance of SPEERTO (Nsp = 200, Np = 2000, K = 50)
super-peers (Figure 7(h)) remains practically the same fora given top-k query. In the next experiment, we study theperformance on clustered data. Figure 7(i) depicts the re-sponse time for clustered data distribution while varying thedimensionality of the dataset. The clustered dataset leadsto much smaller response time than the uniform distribu-tion, because only a few super-peers are contacted duringquery processing. Therefore, SPEERTO performs better forthe clustered dataset in terms of response time, contactedsuper-peers, and transferred data objects.
!"# $%&'! ()*+,*- .,/0 ! " #
In the next experiments we evaluate the effectiveness ofSPEERTO for top-k queries with k > K. We compare theactual top-k results with the ones retrieved from the K-skyband, by measuring the relative recall, i.e., the fraction ofthe produced top-k results that are in the true top-k results.
In Figure 8(a), we show the recall achieved for uniformdistribution and cardinality 0.5M, while varying d from 2 to4. The K parameter of the skyband is set to 10, which en-sures us the exact results at least for any top-10 query. We
evaluate the performance of our approach for 10 ≤ k ≤ 200.As expected recall decreases as k increases, but notice thatthe errors in the top-k list occur in the lower positioned ob-jects, which are less important to the user. The skyband sizeis manageable and less than 1% of the dataset in any case.For d = 2 the skyband contains less than 100 points, thusrecall decreases rapidly. For d = 4 the skyband size grows toless than 3500 data objects, and recall decreases less rapidly.Figure 8(a) shows that using the 10-skyband we can answertop-100 queries with recall around 40% for d = 2, while ford = 4 we can answer queries for higher k values with betterrecall. Experiments on clustered datasets resulted in similarrecall values (Figure 8(b)). By varying the cardinality wenoticed that recall (Figure 8(c)) and the skyband size (Fig-ure 8(d)) are hardly influenced, which makes our approachfeasible for large-scale systems.
In Figure 8(e) we vary K between 1 and 100 and evaluatethe recall on top-100 queries for different dimensionality val-ues. For K = 1 (which is the skyline set) we achieve recallof more than 90% for dimensionality 6 and 8, while the size
762
!"
!#"""
!$"""
!%"""
!&"""
!'"""
!("""
!)"""
!#" !$" !%" !&" !'"
*+,-./,+!012
+!32
,+45
0.-67
89$89&89(89:
89#"
(a) Response time with d
!"
!'""
!#"""
!#'""
!$"""
!#"!;!:!)!(!'!&!%!$!#
*+,-./,+!012
+!32
,+45
0.-6#"
89$89&89(89:
89#"
(b) Response time for first 10 objects
!"
!#"
!$"
!%"
!&"
!'"
!#" !$" !%" !&" !'"
<=2
>+?!.@!4./0A
40+
8!B
C,
0.-67
89$89&89(89:
89#"
(c) Number of contacted SPs
!"
!'
!#"
!#'
!$"
!'"!&"!%"!$"!#"
D2-?.
E+2
+/0!3F
5
0.-67
89$89&89(89:
89#"
(d) Gain in number of transferred objects
!::
!;"
!;$
!;&
!;(
!;:
!#""
!'"!&"!%"!$"!#"
C+?4
+/0A
G+!.
@!B
C,!H
10I!J
A1/
0.-67
89$89&89(89:
89#"
(e) Percentage of SPs with gain
!"
!'""
!#"""
!#'""
!$"""
!$'""
!%"""
!%'""
!&"""
!&'""
!'"!&"!%"!$"!#"
*+,-./,+!012
+!32
,+45
0.-67
/9#K/9#L'K
/9$K/9$L'K
(f) Scalability with cardinality
!"
!'""
!#"""
!#'""
!$"""
!$'""
!%"""
!'"!&"!%"!$"!#"
*+,-./,+!012
+!32
,+45
0.-67
<-9$"""<-9#""""<-9$""""
(g) Scalability with Np
!"
!#"
!$"
!%"
!&"
!'"
!#" !$" !%" !&" !'"
<=2
>+?!.@!4./0A
40+
8!B
C,
0.-67
<-9$"""<-9#""""<-9$""""
(h) Scalability with Np
!"
!#""
!$""
!%""
!&""
!'""
!(""
!#" !$" !%" !&" !'"
*+,-./,+!012
+!32
,+45
0.-67
89$89&89(89:
89#"
(i) Clustered dataset
Figure 7: Performance of SPEERTO (Nsp = 200, Np = 2000, K = 50)
super-peers (Figure 7(h)) remains practically the same fora given top-k query. In the next experiment, we study theperformance on clustered data. Figure 7(i) depicts the re-sponse time for clustered data distribution while varying thedimensionality of the dataset. The clustered dataset leadsto much smaller response time than the uniform distribu-tion, because only a few super-peers are contacted duringquery processing. Therefore, SPEERTO performs better forthe clustered dataset in terms of response time, contactedsuper-peers, and transferred data objects.
!"# $%&'! ()*+,*- .,/0 ! " #
In the next experiments we evaluate the effectiveness ofSPEERTO for top-k queries with k > K. We compare theactual top-k results with the ones retrieved from the K-skyband, by measuring the relative recall, i.e., the fraction ofthe produced top-k results that are in the true top-k results.
In Figure 8(a), we show the recall achieved for uniformdistribution and cardinality 0.5M, while varying d from 2 to4. The K parameter of the skyband is set to 10, which en-sures us the exact results at least for any top-10 query. We
evaluate the performance of our approach for 10 ≤ k ≤ 200.As expected recall decreases as k increases, but notice thatthe errors in the top-k list occur in the lower positioned ob-jects, which are less important to the user. The skyband sizeis manageable and less than 1% of the dataset in any case.For d = 2 the skyband contains less than 100 points, thusrecall decreases rapidly. For d = 4 the skyband size grows toless than 3500 data objects, and recall decreases less rapidly.Figure 8(a) shows that using the 10-skyband we can answertop-100 queries with recall around 40% for d = 2, while ford = 4 we can answer queries for higher k values with betterrecall. Experiments on clustered datasets resulted in similarrecall values (Figure 8(b)). By varying the cardinality wenoticed that recall (Figure 8(c)) and the skyband size (Fig-ure 8(d)) are hardly influenced, which makes our approachfeasible for large-scale systems.
In Figure 8(e) we vary K between 1 and 100 and evaluatethe recall on top-100 queries for different dimensionality val-ues. For K = 1 (which is the skyline set) we achieve recallof more than 90% for dimensionality 6 and 8, while the size
762
Number of contacted SPs Improvement in number ofobjects transferred

Introduction SPEERTO SPEERTO Extension Experimental Evaluation
Scalability With Data Cardinality and Response Rime WithClustered Data
For n = 1M to 2.5M response time slightly increases
SPEERTO performs better for clustered data
!"
!#"""
!$"""
!%"""
!&"""
!'"""
!("""
!)"""
!#" !$" !%" !&" !'"
*+,-./,+!012
+!32
,+45
0.-67
89$89&89(89:
89#"
(a) Response time with d
!"
!'""
!#"""
!#'""
!$"""
!#"!;!:!)!(!'!&!%!$!#
*+,-./,+!012
+!32
,+45
0.-6#"
89$89&89(89:
89#"
(b) Response time for first 10 objects
!"
!#"
!$"
!%"
!&"
!'"
!#" !$" !%" !&" !'"
<=2
>+?!.@!4./0A
40+
8!B
C,
0.-67
89$89&89(89:
89#"
(c) Number of contacted SPs
!"
!'
!#"
!#'
!$"
!'"!&"!%"!$"!#"
D2-?.
E+2
+/0!3F
5
0.-67
89$89&89(89:
89#"
(d) Gain in number of transferred objects
!::
!;"
!;$
!;&
!;(
!;:
!#""
!'"!&"!%"!$"!#"
C+?4
+/0A
G+!.
@!B
C,!H
10I!J
A1/
0.-67
89$89&89(89:
89#"
(e) Percentage of SPs with gain
!"
!'""
!#"""
!#'""
!$"""
!$'""
!%"""
!%'""
!&"""
!&'""
!'"!&"!%"!$"!#"
*+,-./,+!012
+!32
,+45
0.-67
/9#K/9#L'K
/9$K/9$L'K
(f) Scalability with cardinality
!"
!'""
!#"""
!#'""
!$"""
!$'""
!%"""
!'"!&"!%"!$"!#"
*+,-./,+!012
+!32
,+45
0.-67
<-9$"""<-9#""""<-9$""""
(g) Scalability with Np
!"
!#"
!$"
!%"
!&"
!'"
!#" !$" !%" !&" !'"
<=2
>+?!.@!4./0A
40+
8!B
C,
0.-67
<-9$"""<-9#""""<-9$""""
(h) Scalability with Np
!"
!#""
!$""
!%""
!&""
!'""
!(""
!#" !$" !%" !&" !'"
*+,-./,+!012
+!32
,+45
0.-67
89$89&89(89:
89#"
(i) Clustered dataset
Figure 7: Performance of SPEERTO (Nsp = 200, Np = 2000, K = 50)
super-peers (Figure 7(h)) remains practically the same fora given top-k query. In the next experiment, we study theperformance on clustered data. Figure 7(i) depicts the re-sponse time for clustered data distribution while varying thedimensionality of the dataset. The clustered dataset leadsto much smaller response time than the uniform distribu-tion, because only a few super-peers are contacted duringquery processing. Therefore, SPEERTO performs better forthe clustered dataset in terms of response time, contactedsuper-peers, and transferred data objects.
!"# $%&'! ()*+,*- .,/0 ! " #
In the next experiments we evaluate the effectiveness ofSPEERTO for top-k queries with k > K. We compare theactual top-k results with the ones retrieved from the K-skyband, by measuring the relative recall, i.e., the fraction ofthe produced top-k results that are in the true top-k results.
In Figure 8(a), we show the recall achieved for uniformdistribution and cardinality 0.5M, while varying d from 2 to4. The K parameter of the skyband is set to 10, which en-sures us the exact results at least for any top-10 query. We
evaluate the performance of our approach for 10 ≤ k ≤ 200.As expected recall decreases as k increases, but notice thatthe errors in the top-k list occur in the lower positioned ob-jects, which are less important to the user. The skyband sizeis manageable and less than 1% of the dataset in any case.For d = 2 the skyband contains less than 100 points, thusrecall decreases rapidly. For d = 4 the skyband size grows toless than 3500 data objects, and recall decreases less rapidly.Figure 8(a) shows that using the 10-skyband we can answertop-100 queries with recall around 40% for d = 2, while ford = 4 we can answer queries for higher k values with betterrecall. Experiments on clustered datasets resulted in similarrecall values (Figure 8(b)). By varying the cardinality wenoticed that recall (Figure 8(c)) and the skyband size (Fig-ure 8(d)) are hardly influenced, which makes our approachfeasible for large-scale systems.
In Figure 8(e) we vary K between 1 and 100 and evaluatethe recall on top-100 queries for different dimensionality val-ues. For K = 1 (which is the skyline set) we achieve recallof more than 90% for dimensionality 6 and 8, while the size
762
!"
!#"""
!$"""
!%"""
!&"""
!'"""
!("""
!)"""
!#" !$" !%" !&" !'"
*+,-./,+!012
+!32
,+45
0.-67
89$89&89(89:
89#"
(a) Response time with d
!"
!'""
!#"""
!#'""
!$"""
!#"!;!:!)!(!'!&!%!$!#
*+,-./,+!012
+!32
,+45
0.-6#"
89$89&89(89:
89#"
(b) Response time for first 10 objects
!"
!#"
!$"
!%"
!&"
!'"
!#" !$" !%" !&" !'"
<=2
>+?!.@!4./0A
40+
8!B
C,
0.-67
89$89&89(89:
89#"
(c) Number of contacted SPs
!"
!'
!#"
!#'
!$"
!'"!&"!%"!$"!#"
D2-?.
E+2
+/0!3F
5
0.-67
89$89&89(89:
89#"
(d) Gain in number of transferred objects
!::
!;"
!;$
!;&
!;(
!;:
!#""
!'"!&"!%"!$"!#"
C+?4
+/0A
G+!.
@!B
C,!H
10I!J
A1/
0.-67
89$89&89(89:
89#"
(e) Percentage of SPs with gain
!"
!'""
!#"""
!#'""
!$"""
!$'""
!%"""
!%'""
!&"""
!&'""
!'"!&"!%"!$"!#"
*+,-./,+!012
+!32
,+45
0.-67
/9#K/9#L'K
/9$K/9$L'K
(f) Scalability with cardinality
!"
!'""
!#"""
!#'""
!$"""
!$'""
!%"""
!'"!&"!%"!$"!#"
*+,-./,+!012
+!32
,+45
0.-67
<-9$"""<-9#""""<-9$""""
(g) Scalability with Np
!"
!#"
!$"
!%"
!&"
!'"
!#" !$" !%" !&" !'"
<=2
>+?!.@!4./0A
40+
8!B
C,
0.-67
<-9$"""<-9#""""<-9$""""
(h) Scalability with Np
!"
!#""
!$""
!%""
!&""
!'""
!(""
!#" !$" !%" !&" !'"
*+,-./,+!012
+!32
,+45
0.-67
89$89&89(89:
89#"
(i) Clustered dataset
Figure 7: Performance of SPEERTO (Nsp = 200, Np = 2000, K = 50)
super-peers (Figure 7(h)) remains practically the same fora given top-k query. In the next experiment, we study theperformance on clustered data. Figure 7(i) depicts the re-sponse time for clustered data distribution while varying thedimensionality of the dataset. The clustered dataset leadsto much smaller response time than the uniform distribu-tion, because only a few super-peers are contacted duringquery processing. Therefore, SPEERTO performs better forthe clustered dataset in terms of response time, contactedsuper-peers, and transferred data objects.
!"# $%&'! ()*+,*- .,/0 ! " #
In the next experiments we evaluate the effectiveness ofSPEERTO for top-k queries with k > K. We compare theactual top-k results with the ones retrieved from the K-skyband, by measuring the relative recall, i.e., the fraction ofthe produced top-k results that are in the true top-k results.
In Figure 8(a), we show the recall achieved for uniformdistribution and cardinality 0.5M, while varying d from 2 to4. The K parameter of the skyband is set to 10, which en-sures us the exact results at least for any top-10 query. We
evaluate the performance of our approach for 10 ≤ k ≤ 200.As expected recall decreases as k increases, but notice thatthe errors in the top-k list occur in the lower positioned ob-jects, which are less important to the user. The skyband sizeis manageable and less than 1% of the dataset in any case.For d = 2 the skyband contains less than 100 points, thusrecall decreases rapidly. For d = 4 the skyband size grows toless than 3500 data objects, and recall decreases less rapidly.Figure 8(a) shows that using the 10-skyband we can answertop-100 queries with recall around 40% for d = 2, while ford = 4 we can answer queries for higher k values with betterrecall. Experiments on clustered datasets resulted in similarrecall values (Figure 8(b)). By varying the cardinality wenoticed that recall (Figure 8(c)) and the skyband size (Fig-ure 8(d)) are hardly influenced, which makes our approachfeasible for large-scale systems.
In Figure 8(e) we vary K between 1 and 100 and evaluatethe recall on top-100 queries for different dimensionality val-ues. For K = 1 (which is the skyline set) we achieve recallof more than 90% for dimensionality 6 and 8, while the size
762
Scalability with cardinalityClustered dataset

Introduction SPEERTO SPEERTO Extension Experimental Evaluation
Top-k with k > K
Relative recall: |ReturnedTop−k∈TrueTop−k||TrueTop−k|
with K = 10, k = 100 and d = 2 relative recall is around 40%
Scalable for varying data even with k > K
0
0.2
0.4
0.6
0.8
1
0 50 100 150 200
Rec
all
top-k
d=2d=3d=4
0
0.2
0.4
0.6
0.8
1
50 100 150 200 250 300 350 400 450 500
Rec
all
n (x103)
d=2 k=50d=2 k=100d=3 k=50
d=3 k=100
Recall for uniform data Recall for varying data

Introduction SPEERTO SPEERTO Extension Experimental Evaluation
Performance With ExtensionsParallel variant: Response time is improved by 20%, with onlysmall increase in objects transferredAbstract variant: with d=2, 2% of dataset update and 50%abstraction, only 4% super-peers need to update skyline
15
20
25
30
35
10 20 30 40 50
Impr
ovem
ent (
%)
top-k
d=2d=4d=6d=8
d=10
0
20
40
60
80
100
2 4 6 8 10
Per
cent
age
of c
hang
e
Percentage of dataset updates
Abstract=50%, d=2Abstract=75%, d=2
Abstract=100%, d=2
Improvement in response timewith parallel version Data updates for d = 2

Introduction SPEERTO SPEERTO Extension Experimental Evaluation
Conclusions
A novel approach for answering top-k queries in a P2Pnetwork based on super-peer architecture
A threshold-based algorithm which forwards the top-k queryrequests among super-peers efficiently
A variant of SPEERTO that queries in parallel
An extension that restricts the cardinality of the skyline
SPEERTO scales well to bigger systems
SPEERTO performs considerably good even with k > K

Introduction SPEERTO SPEERTO Extension Experimental Evaluation
Thank You!

Introduction SPEERTO SPEERTO Extension Experimental Evaluation
References
Akrivi Vlachou, Christos Doulkeridis, Kjetil N, MichalisVazirgiannis: On efficient top-k query processing in highlydistributed environments. SIGMOD 2008, pp. 753-764
S. B orzs onyi, D. Kossmann, and K. Stocker. The skylineoperator. In Proceedings of IEEE Int. Conf. on DataEngineering (ICDE), pages 421-430, 2001.
D. Papadias, Y. Tao, G. Fu, and B. Seeger. Progressiveskyline computation in database systems. ACM Transactionson Database Systems, 30(1):41-82, 2005

Introduction SPEERTO SPEERTO Extension Experimental Evaluation
Backup slides

Introduction SPEERTO SPEERTO Extension Experimental Evaluation
Skyline based routing with Updates and Churn
Updates
Periodic updates of skyline suffices
Broadcast the skyline updates, when either the skyline hassignificantly changed or the validity time has expired.
K-skyband update at each super-peer is done more frequently
Churn
The skyline entry of the departed super-peer is removed at thequerying super-peer
When a super-peer joins the network, its skyline is broadcast
Churn of simple peers is handled by recomputing thesuper-peer K-skyband

Introduction SPEERTO SPEERTO Extension Experimental Evaluation
Top-k with k > K : More results
Clustered datasets result in similar recall values as uniformdata
By varying cardinality the skyband size is hardly inluenced
0
0.2
0.4
0.6
0.8
1
0 50 100 150 200
Rec
all
top-k
d=2d=3d=4
0
500
1000
1500
2000
2500
50 100 150 200 250 300 350 400 450 500
Siz
e of
sky
band
n (x103)
d=2d=3d=4
Recall for clustered data Size for varying n

Introduction SPEERTO SPEERTO Extension Experimental Evaluation
Top-k with k > K : More results
Recall values increase with dimensionality because the size ofthe K-skyband also increases
For d = 2 recall is low since the skyline consists of only 13points
0
0.2
0.4
0.6
0.8
1
1 10 50 100
K-skyband
reca
ll
d=2 d=4d=6 d=8
1
10
100
1000
10000
100000
1000000
1 10 50 100
K-skyband
size
of
skyb
and
(lo
g -
sca
le)
d=2 d=4d=6 d=8
Recall for varying K Size for varying K

Introduction SPEERTO SPEERTO Extension Experimental Evaluation
Abstract Skyline Performance
In abstract variant The number of transferred objectsincreases rapidly, since the threshold is not used
For d = 3 the number of modified super-peers increases, butagain the gain of abstraction is significant
0
5
10
15
20
25
30
10 20 30 40 50
Incr
ease
of t
rans
ferr
ed o
bjec
t (%
)
top-k
d=2d=4d=6d=8
d=10
0
20
40
60
80
100
2 4 6 8 10
Per
cent
age
of c
hang
e
Percentage of dataset updates
Abstract=50%, d=3Abstract=75%, d=3
Abstract=100%, d=3
Variant with abstract skyline Data updates for d = 3
Top Related