


Languages
Pages
Legal

DDYNAYNATTRACERACE R REFERENCEEFERENCE G GUIDEUIDE


TABLE OF CONTENT
1.1. DYNADYNATTRACERACE____________________________________________________________________________________________________________________________882.2. AARCHITECTURERCHITECTURE______________________________________________________________________________________________________________________99
2.1 K2.1 KNOWLEDGENOWLEDGESSENSORSENSORS__________________________________________________________________________________________________________992.2 2.2 DYNADYNATTRACERACE A AGENTSGENTS__________________________________________________________________________________________________________10102.3 2.3 DYNADYNATTRACERACE C COLLECTOROLLECTOR__________________________________________________________________________________________________10102.4 2.4 DYNADYNATTRACERACE S SERVERERVER__________________________________________________________________________________________________________10102.5 2.5 DYNADYNATTRACERACE R REPOSITORYEPOSITORY__________________________________________________________________________________________________11112.6 2.6 DYNADYNATTRACERACE C CLIENTLIENT__________________________________________________________________________________________________________11112.7 I2.7 INTEGRATIONSNTEGRATIONS API API____________________________________________________________________________________________________________1111
3.3. IINSTALLATIONNSTALLATION______________________________________________________________________________________________________________________1212
4.4. TTOOLOOL S STARTTART--UPUP ANDAND L LICENSEICENSE CONFIGURATIONCONFIGURATION________________________________________________________1515
4.14.1 SSTARTTART--UPUP____________________________________________________________________________________________________________________________15154.2 L4.2 LICENSEICENSE C CONFIGURATIONONFIGURATION__________________________________________________________________________________________________16164.3 A4.3 AGENTGENT INJECTIONINJECTION______________________________________________________________________________________________________________1717
5.5. UUNIQUENIQUE DYNADYNATTRACERACE KEYWORDSKEYWORDS____________________________________________________________________________________1818
5.1 P5.1 PUREURE P PATHATH________________________________________________________________________________________________________________________18185.2 5.2 DYNADYNATTRACERACE BYTEBYTE CODECODE INSTRUMENTATIONINSTRUMENTATION____________________________________________________________________20205.3 S5.3 SENSORSENSORS____________________________________________________________________________________________________________________________20205.4 D5.4 DISCOVERYISCOVERY R RUNUN________________________________________________________________________________________________________________2121
6.6. SSYSTEMYSTEM P PROFILEROFILE________________________________________________________________________________________________________________2222
7. D7. DASHBOARDASHBOARD ANDAND D DASHLETSASHLETS____________________________________________________________________________________________2626
7.1 D7.1 DASHBOARDASHBOARD______________________________________________________________________________________________________________________26267.2 D7.2 DASHLETSASHLETS__________________________________________________________________________________________________________________________27277.37.3 TTYPESYPES OFOF D DASHLETSASHLETS__________________________________________________________________________________________________________2727
8. M8. MEASURESEASURES ANDAND C CHARTINGHARTING________________________________________________________________________________________________3434
8.1 M8.1 MEASURESEASURES__________________________________________________________________________________________________________________________34348.2 C8.2 CHARTINGHARTING__________________________________________________________________________________________________________________________3434
9. S9. SESSIONSESSIONS______________________________________________________________________________________________________________________________3636
10. I10. INTEGRATIONNTEGRATION WITHWITH L LOADOADRRUNNERUNNER________________________________________________________________________________373711. M11. METHODETHOD I INSTRUMENTATIONNSTRUMENTATION__________________________________________________________________________________________383812. M12. MEMORYEMORY I INSTRUMENTATIONNSTRUMENTATION__________________________________________________________________________________________4040
1.dynaTraceAs IT has been forced to better align with business goals and application
complexity has increased, the requirements for Application Performance Management (APM) have dramatically changed. Now, application quality and IT efficiency are seen as major business components and differentiators.dynaTrace provides Continuous Application Performance Management for business-critical Java and .NET applications across the entire software lifecycle. It is used by over 100 industry-leading companies to monitor, diagnose, and prevent performance issues in development, test and production. dynaTrace provides a unique architecture, which enables it to fulfill these requirements.
Key aspects:• Pure Path Technology for true global transaction trace & capture • Integrated lifecycle approach to eliminate silos between development, test and
production to shift problem resolution earlier in lifecycle • Business transaction management paired with deep code-level diagnostics
always-on 24x7 in production (to go beyond application monitoring) • Open platform supported through a Community Portal to simplify integration with
existing ALM tools and to easily enhance dynaTrace’s out-of-the-box functionality • Smooth and effortless deployment, configuration and maintenance to achieve
the lowest total cost of ownership (TCO) and fastest time to value of any APM system
Benefits:• Minimize performance issues slipping into production • Isolate performance issues in live applications before they impact end-users • Reduce Mean-Time-To-Repair of production application issues by 90%, to bring
them back online quickly • Identify performance issues early in the lifecycle, before they become
significantly more expensive to fix. • Accelerate problem resolution by more than 10x • Minimize costs for managing application performance through an open platform
allowing tight integration to maximize automation, and through automatic adaptation to dynamically changing virtualized application clusters
• Minimize software/hardware purchase and maintenance costs through effective scalability tuning
• Identify performance issues early, avoiding disruptive fixes or late re-architectures causing significant delays
• Accelerate problem resolution by more than 10x: developers can spend more time developing features and functionality
• Eliminate and accelerate cycles between test and development
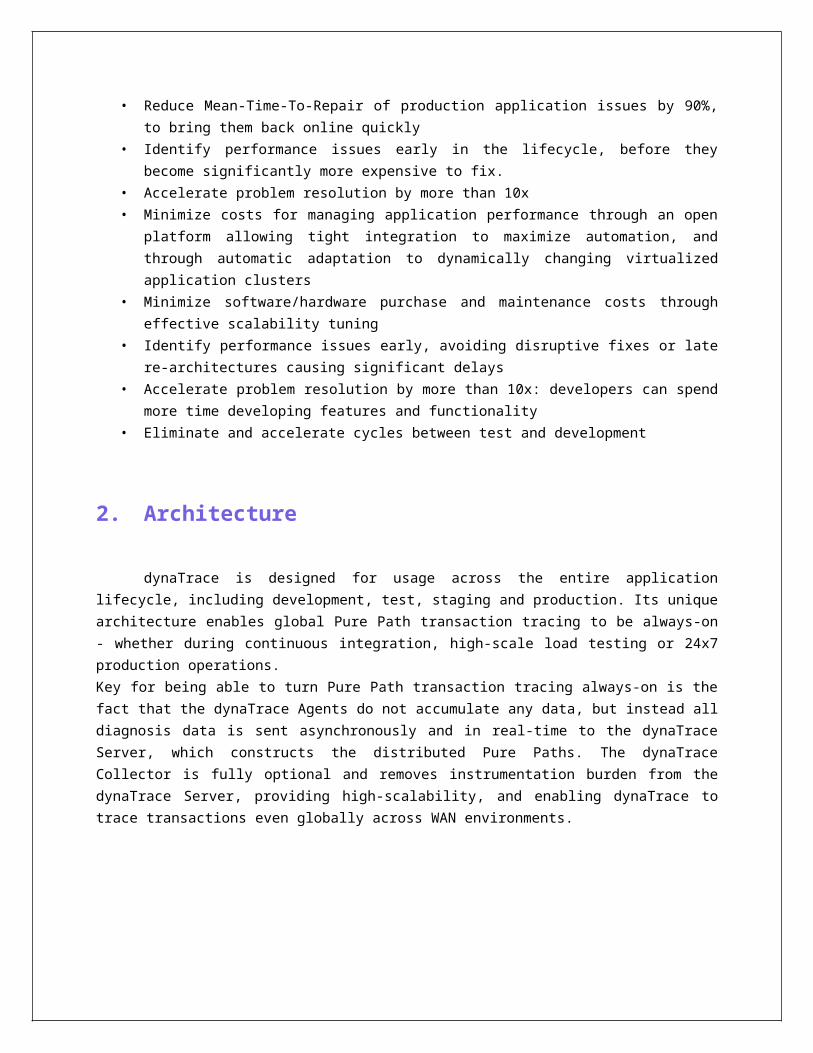
2.Architecture
dynaTrace is designed for usage across the entire application lifecycle, including development, test, staging and production. Its unique architecture enables global Pure Path transaction tracing to be always-on - whether during continuous integration, high-scale load testing or 24x7 production operations.Key for being able to turn Pure Path transaction tracing always-on is the fact that the dynaTrace Agents do not accumulate any data, but instead all diagnosis data is sent asynchronously and in real-time to the dynaTrace Server, which constructs the distributed Pure Paths. The dynaTrace Collector is fully optional and removes instrumentation burden from the dynaTrace Server, providing high-scalability, and enabling dynaTrace to trace transactions even globally across WAN environments.
2.1 KnowledgeSensors
KnowledgeSensors mark a transaction’s progress along its execution path and identify all transaction entry points (e.g., Java Servlet invocations) and method calls, as well as their sequence and nesting. For each transaction, the KnowledgeSensors record not only pure performance metrics (e.g., response times, CPU usage) of an execution path, but also contextual information (e.g., method arguments, return values, exceptions, log
events, IO usage, network traffic, objects created, SQL calls, remote calls, and synchronization delays) in order to enable precise root-cause analysis.In this way, KnowledgeSensors provide all the data included in Pure Paths. Plus, you can subscribe them also as dedicated performance monitors to allow time-based performance analysis. To support a smooth deployment and an easy administration, several KnowledgeSensors can be packaged into a single KnowledgeSensorPack.
2.2 dynaTrace Agents
The lightweight dynaTrace Agent injects the instrumented byte/IL-code (original code + KnowledgeSensors) into the target application automatically; no source code changes are required. The dynaTrace point and click auto-sensor assistant and visual class browser with auto-discovery help you to maximize visibility with minimum instrumentation and overhead. The level of detail for code-level transaction tracing can also be adjusted on-the-fly without restarting the target application using HotSensorPlacement. The dynaTrace Agent is also used to gather memory and thread dumps. Plus, it can be deployed and managed from a central location and requires only minimal system resources for sustained 24x7 operation. Finally, the dynaTrace Agents are capable of collecting dynamic monitoring data in-process from JVMs, CLRs and application servers via JMX, PerfMon and PMI.
2.3 dynaTrace Collector
The dynaTrace Collector instruments the target application through adding KnowledgeSensors into its byte/IL-code. It also reduces network payload and provides data security between the target application and the dynaTrace Server as it provides data compression and strong encryption (SSL/TLSv3). Thus, the Collector reduces memory and CPU usage on the dynaTrace server to collect all the diagnostics data. The dynaTrace Collector allows dynaTrace to efficiently scale from small application deployments to very large server clusters. It also enables global end-to-end transaction tracing across applications deployed over WAN environments, such as SOA applications or applications accessed through rich/fat clients deployed in e.g. remote branch offices.Additionally, the Collector also executes OSGi-based monitoring plugins (e.g., Unix, Windows, SNMP monitors) and forwards results to the dynaTrace server.
2.4 dynaTrace Server
The dynaTrace Server collects all diagnostics data including transaction traces, monitors and memory/thread dumps. The Server centrally creates the Pure Paths, which may span distributed JVMs/CLRs, and derives all aggregations from them, while preserving the atomic Pure Path information. This allows overhead on the target application to be sustained at a very low level of only 3-5% while providing deep application visibility on a transaction by transaction basis. This makes dynaTrace ideally suited for usage in load
test and 24x7 production environments, even in large clustered application environments.
2.5 dynaTrace Repository
The dynaTrace Repository stores historical performance data for forward- and backward-looking long range analysis.
2.6 dynaTrace Client
By providing an intuitive, platform-independent user interface, the dynaTrace Client guides IT employees through the processes of managing application performance. Team members can access dashboards, detailed diagnosis data and reports in real-time via context-sensitive menus that minimize GUI navigation steps. Interactive analysis of stored diagnosis data - including Pure Paths, memory dumps and monitors - enables developers to fully reconstruct application hotspots in their local development environment to quickly understand a problem’s root cause.
2.7 Integrations API
Open interfaces allow easy integration into existing environments, such as Continuous Integration, load testing, or enterprise management systems. Plus, you can easily extend dynaTrace with custom instrumentation sensors and OSGi-based open source plugins, such as monitors, actions or notifications, which you may download from our Community Portal. Simply customize and deploy them using the Rapid Plugin Development Environment.Using the CodeLink plugin you can accelerate final problem resolution by directly accessing the source-code of classes and methods you have identified as being a bottleneck in your favorite IDE (e.g., Eclipse) without hassle.
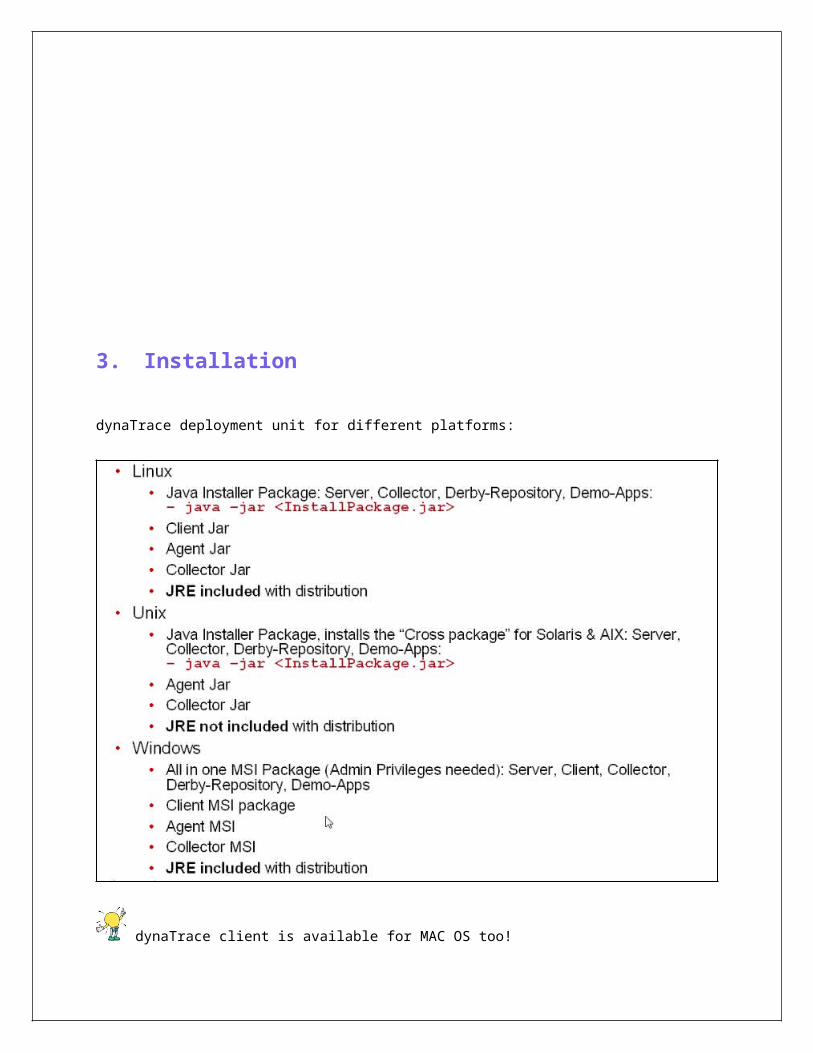
3.Installation
dynaTrace deployment unit for different platforms:
dynaTrace client is available for MAC OS too!
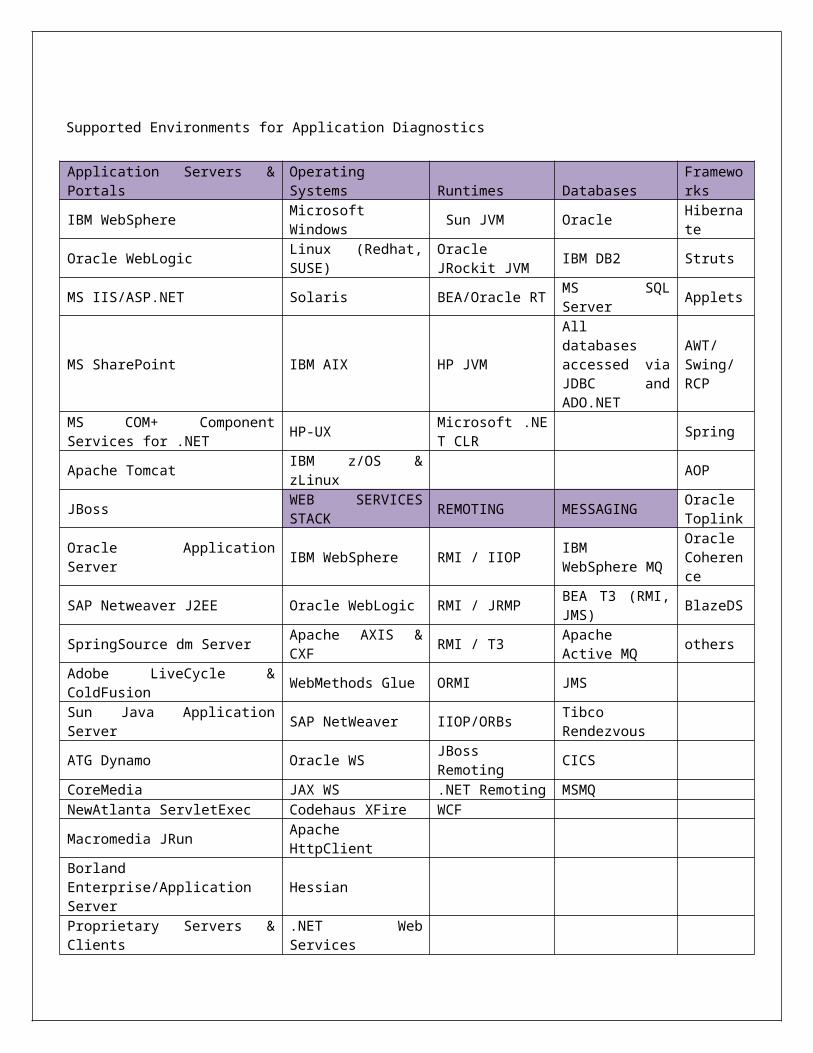
Supported Environments for Application Diagnostics
Application Servers & PortalsOperating Systems Runtimes Databases
Frameworks
IBM WebSphere Microsoft Windows Sun JVM Oracle Hibernate
Oracle WebLogic Linux (Redhat, SUSE)
Oracle JRockit JVM IBM DB2 Struts
MS IIS/ASP.NET Solaris BEA/Oracle RT MS SQL Server Applets MS SharePoint IBM AIX HP JVM All databases
accessed via JDBC and
AWT/Swing/RCP
ADO.NETMS COM+ Component Services for .NET HP-UX Microsoft .NET
CLR Spring Apache Tomcat IBM z/OS & zLinux AOP JBoss WEB SERVICES
STACK REMOTING MESSAGING Oracle Toplink
Oracle Application Server IBM WebSphere RMI / IIOP IBM WebSphere MQ
Oracle Coherence
SAP Netweaver J2EE Oracle WebLogic RMI / JRMP BEA T3 (RMI, JMS) BlazeDS
SpringSource dm Server Apache AXIS & CXF RMI / T3 Apache Active
MQ others Adobe LiveCycle & ColdFusion WebMethods Glue ORMI JMS
Sun Java Application Server SAP NetWeaver IIOP/ORBs Tibco Rendezvous
ATG Dynamo Oracle WS JBoss Remoting CICS CoreMedia JAX WS .NET Remoting MSMQ NewAtlanta ServletExec Codehaus XFire WCF Macromedia JRun Apache HttpClient Borland Enterprise/Application Server Hessian Proprietary Servers & Clients .NET Web Services
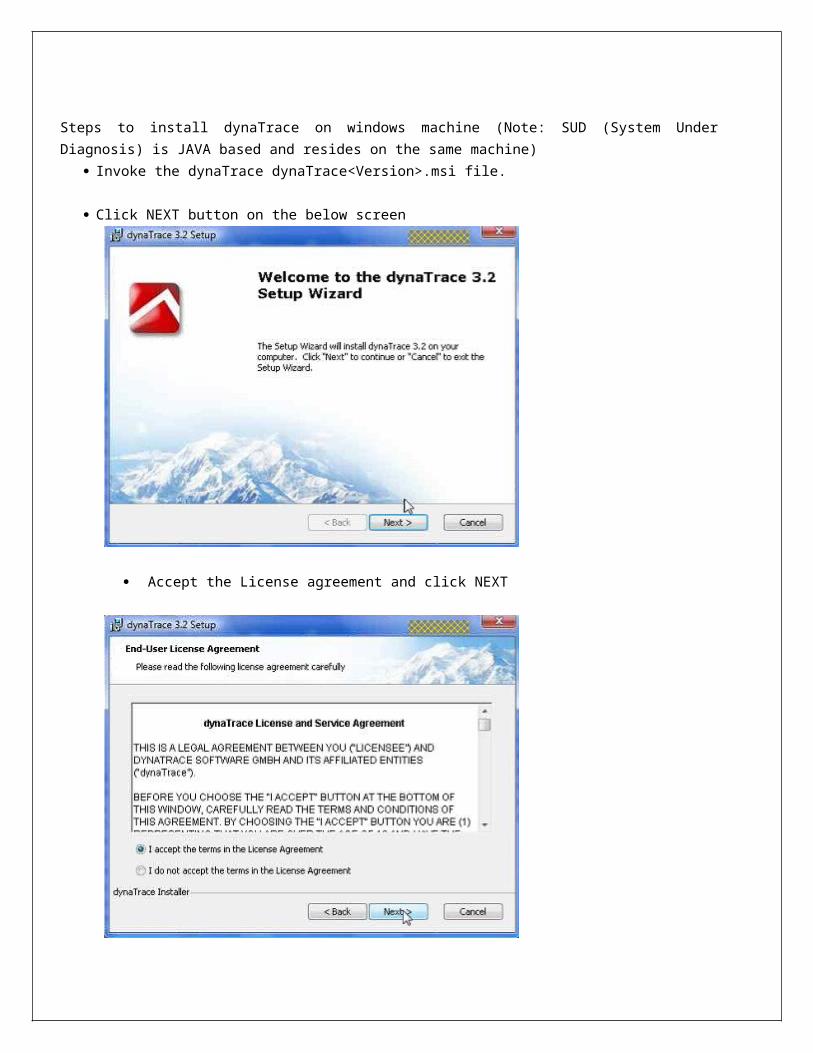
Steps to install dynaTrace on windows machine (Note: SUD (System Under Diagnosis) is JAVA based and resides on the same machine)
Invoke the dynaTrace dynaTrace<Version>.msi file.
Click NEXT button on the below screen
Accept the License agreement and click NEXT
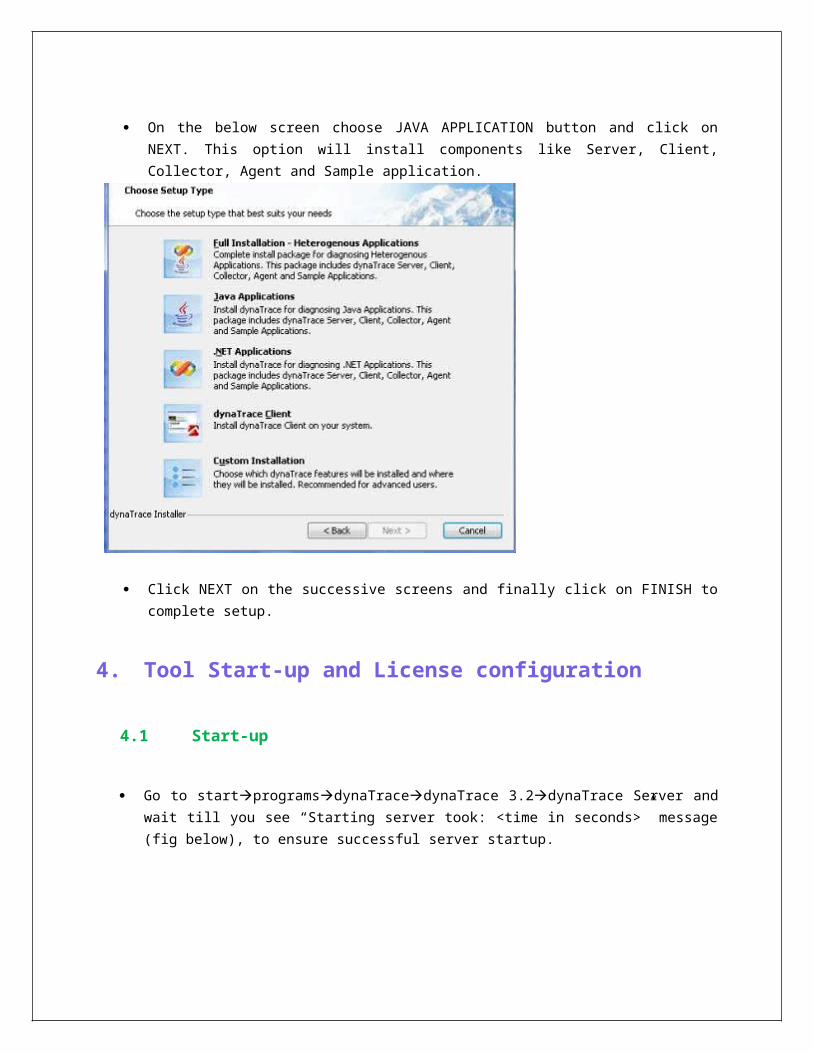
On the below screen choose JAVA APPLICATION button and click on NEXT. This option will install components like Server, Client, Collector, Agent and Sample application.
Click NEXT on the successive screens and finally click on FINISH to complete setup.
4.Tool Start-up and License configuration
4.1 Start-up
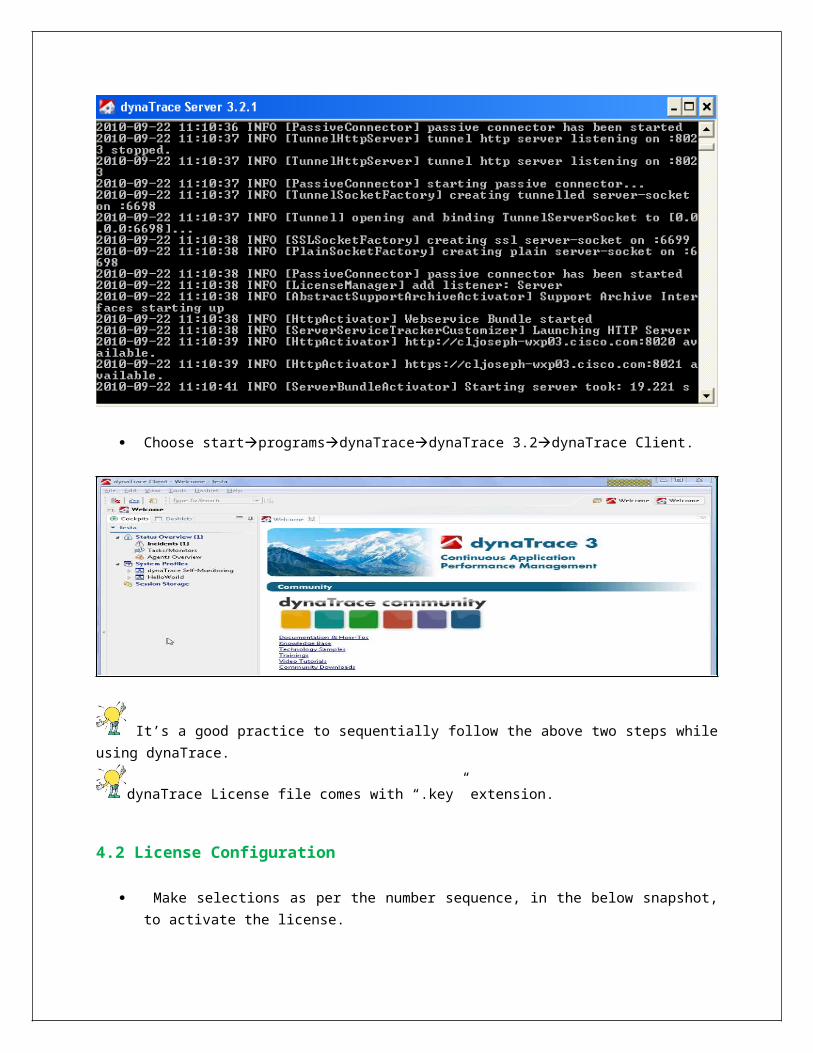
Go to startprogramsdynaTracedynaTrace 3.2dynaTrace Server and wait till you see “Starting server took: <time in seconds>” message (fig below), to ensure successful server startup.
Choose startprogramsdynaTracedynaTrace 3.2dynaTrace Client.
It’s a good practice to sequentially follow the above two steps while using dynaTrace.
dynaTrace License file comes with “.key” extension.
4.2 License Configuration
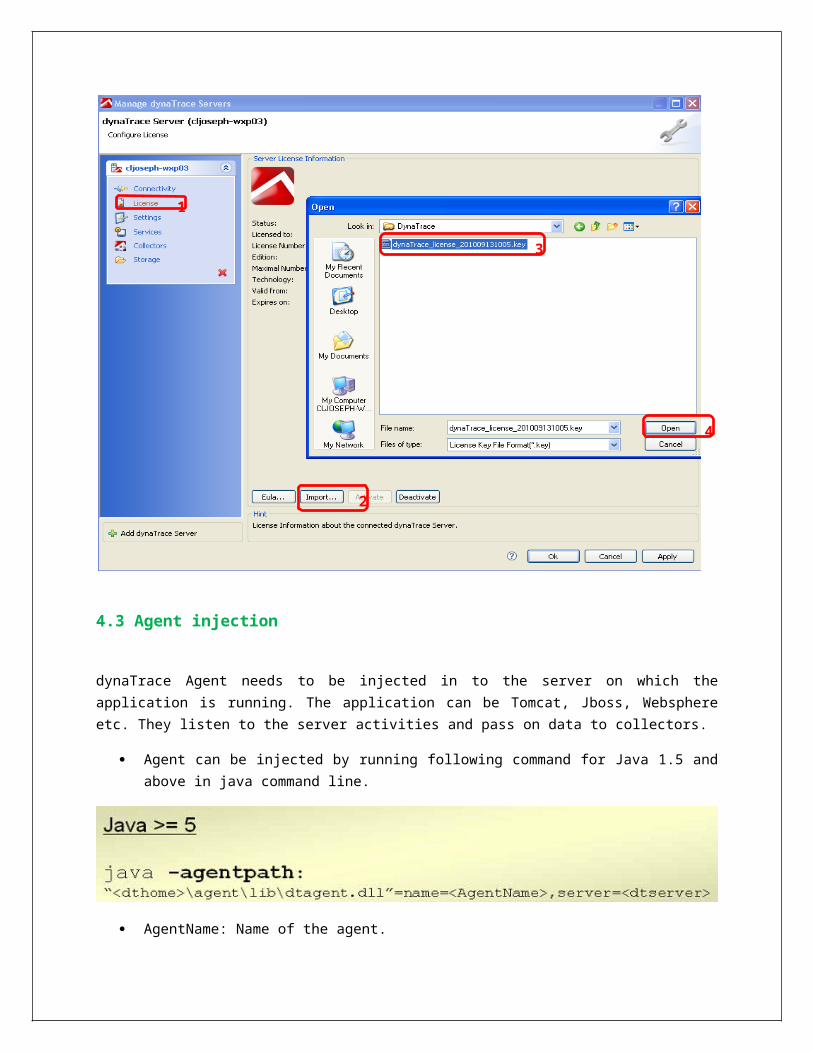
Make selections as per the number sequence, in the below snapshot, to activate the license.
4.3 Agent injection
dynaTrace Agent needs to be injected in to the server on which the application is running. The application can be Tomcat, Jboss, Websphere etc. They listen to the server activities and pass on data to collectors.
1
2
3
4
Agent can be injected by running following command for Java 1.5 and above in java command line.
AgentName: Name of the agent.
Server: Name of the server on which dynaTrace Server is installed.
Depending on the JVMs on which the application is hosted we need to add the Agents. E.g. If we have 2 JVMs we need to add two agents for proper monitoring of application performance.
Agents can be created and placed in Shared library, from where everyone can use them directly or modify them and then use.
5.Unique dynaTrace keywords
5.1 Pure Path
The core of dynaTrace is its unique PurePath transaction tracing technology. It makes transparent the inner workings of Java/.Net applications, visualizing application dependencies and models, automating issue documentation, eliminating the need for issue reproduction, as well as reducing problem isolation, diagnostics and resolution times to minutes.
It helps you find the answers you need to resolve performance problems that matter to the business quickly and reliably:
Assess the impact of a problem Isolate the component causing the problem Identify the root-cause of the problem
Problems are analyzed and diagnosed using either of the two transaction tracing methods:
Outside-In: From the end-user perspective (e.g., poor response time) down to the method-level
Inside-Out: From the code perspective (e.g., exception) up to the affected business transaction(s)
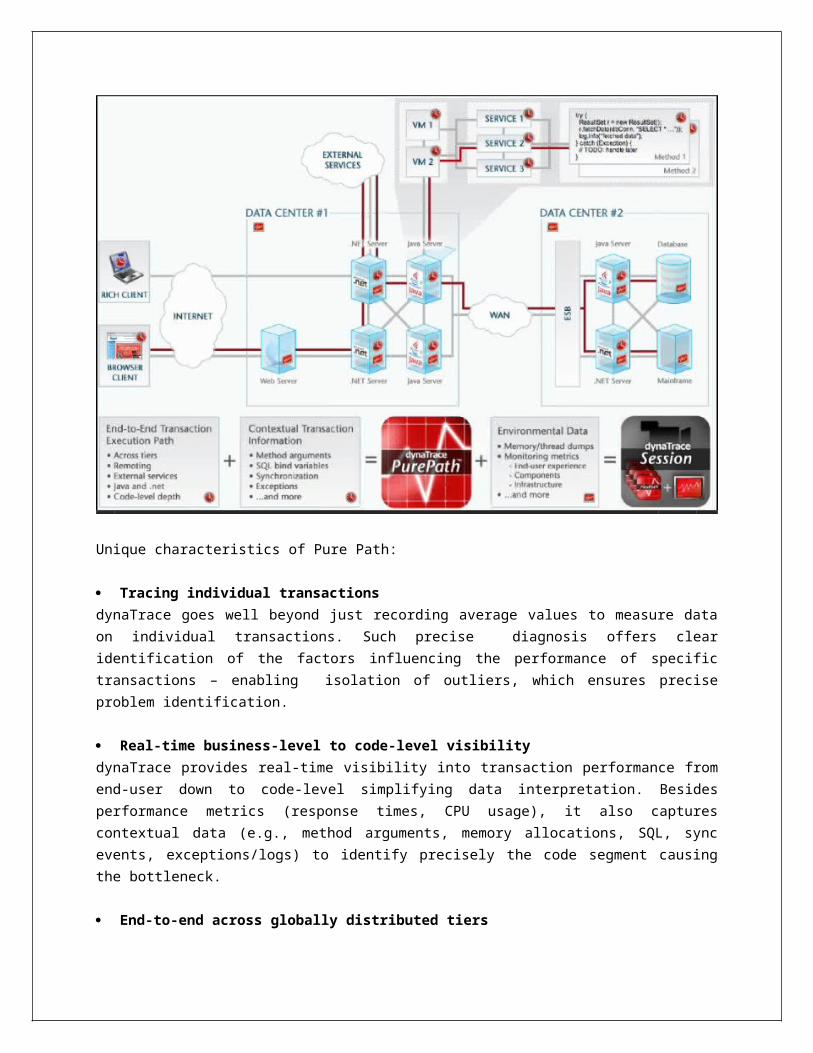
Unique characteristics of Pure Path:
Tracing individual transactionsdynaTrace goes well beyond just recording average values to measure data on individual transactions. Such precise diagnosis offers clear identification of the factors influencing the performance of specific transactions – enabling isolation of outliers, which ensures precise problem identification.
Real-time business-level to code-level visibilitydynaTrace provides real-time visibility into transaction performance from end-user down to code-level simplifying data interpretation. Besides performance metrics (response times, CPU usage), it also captures contextual data (e.g., method arguments, memory allocations, SQL, sync events, exceptions/logs) to identify precisely the code segment causing the bottleneck.
End-to-end across globally distributed tiersTrace transactions end-to-end, even across globally distributed servers/tiers, whether Java or .NET, starting even at rich clients.
Low overhead, small footprint on target servers
dynaTrace only instruments those methods that contribute to application performance and offloads data processing to the dynaTrace Collectors and Server. This not only enables flexible deployment, but also deep-dive diagnostics under production load levels paired with low overhead at 3-5% 24x7 always on. Shareable – provide interactive reports to engineers
Provide interactive code-level reports of problematic transactions to development without having to be a Java/.NET expert. Developers only need to analyze the data relevant to the case within a familiar format offline without having to reproduce the issue, whether they are working in-house, or at a remote location using the included dynaTrace Client or free Viewer.
5.2 dynaTrace byte code instrumentation
This is a concept where dynaTrace induces code into the application’s class files just before the class loader loads them. The code induced is a timing code which gives dynaTrace, details such as method invocation time, method exit time and time totally spent within the method. The agent shares these details with the collector which in turn passes the information on to dynaTrace server. Users view all the captured metrics through dynaTrace client.
5.3 Sensors
dynaTrace agents inject Sensors into the application which in turn are responsible for byte code instrumentation. Each Sensor consists of a set of Sensor rules and they are divided into:
Sensor Groups: Sensors that are stored and available only in a specific System Profile
Sensor Packs: Sensors that are deployed on a dynaTrace Server and available in all System Profiles on this dynaTrace Server. Sensor Packs are created and maintained by dynaTrace users
Knowledge Sensor Packs: Sensor Packs created and maintained by dynaTace software GmbH or by the dynaTrace community
5.3.1 Sensor Rules
They define the classes and methods that should be instrumented. Sensor Rules can be either:
Method Sensor Rules: these rules relate to the Java/.NET Method Sensor and collect method related information for PurePaths
Memory Sensor Rules: these rules relate to the Java/.NET Memory Sensor and collect object allocation information for PurePaths and Selective Memory Dumps
5.3.2 Method Sensor Rules
To diagnose performance issues deeper in the application, the Method Sensor Rule configuration is used to gather information about specific packages/namespaces, classes and methods.
Method Sensor Rules which are added to a Sensor Group are prioritized by their order, top down. As traffic passes through the Sensor Group the rule that matches first is the first and only one applied to that traffic.
It is recommended that only packages/namespaces, classes or methods which are really critical in terms of performance are added to a Sensor Group, otherwise there will be a surplus of non-essential information which has to be processed.
5.4 Discovery Run
This involves 3 steps:
1. Start the SUD2. Perform some transactions on that application.3. Restart the SUD
Using sensors we can enable dynaTrace to not only instrument main classes, but also instrument the derived classes that inherit from base classes. This technique can be used for classes whose inheritance details are known during compile time.
We perform ‘step 1’ to assure that instrumentation for all base and derived classes whose inheritance is know during compile time, ‘step 2’ to ensure runtime inheritance is built and ‘step 3’ to make sure that instrumentation is implemented for all the derived classes including the ones that are resolved during runtime. This is called Discovery Run.
The code below demonstrates inheritance that is known during runtime, discovery run is used to instrument such runtime logic.
class Base {
private int a;
void show(){System.out.println(“The value is”+a);}
}
class Derived extends Base {
private int b;
void show(){System.out.println(“The value is”+b);}
}
class Demo{
public static void main (String args[]){
//Here, we are creating an object ‘b’ of type ‘Base’ using the ‘Derived’ class type
// This can be done since class ‘Derived’ has all the properties of ‘Base’ including its own //properties through Inheritance, i.e. the contents of ‘Derived’ class is Super set to ‘Base’ class.
Base b = new Derived();
//During compile time, the object ‘b’ is referring to Base class version of ‘show()’ method
b.show();
// But at runtime, the Derived version of the method ‘show()’ will be executed hence, //the resolution of the object is not known at compile time, but is resolved at runtime
}}
6.System ProfileA System Profile is an XML file that stores a representation of a configuration for diagnosis of a specific System Under Diagnosis (SUD). System Profiles to visualize the
system tiers, including servers, clusters, and clients, as well as the granularity and location of sensor placements.
System Profiles enable users to: Control and repeat diagnostics Configurations. Check that all dynaTrace Agents are running. Visualize the system tiers, including servers, clusters, and clients together
with its running dynaTrace Agent. Create Sensors which include objects and methods to be instrumented
during the diagnosis. Create Measure Configurations Create Schedules Create Incident Rules Create Tasks Create Monitors Define different Configurations for one Agent Group (for example, one for
pre-production, one for production). dynaTrace allows you to switch between the Configurations at runtime.
Steps to create system profile:
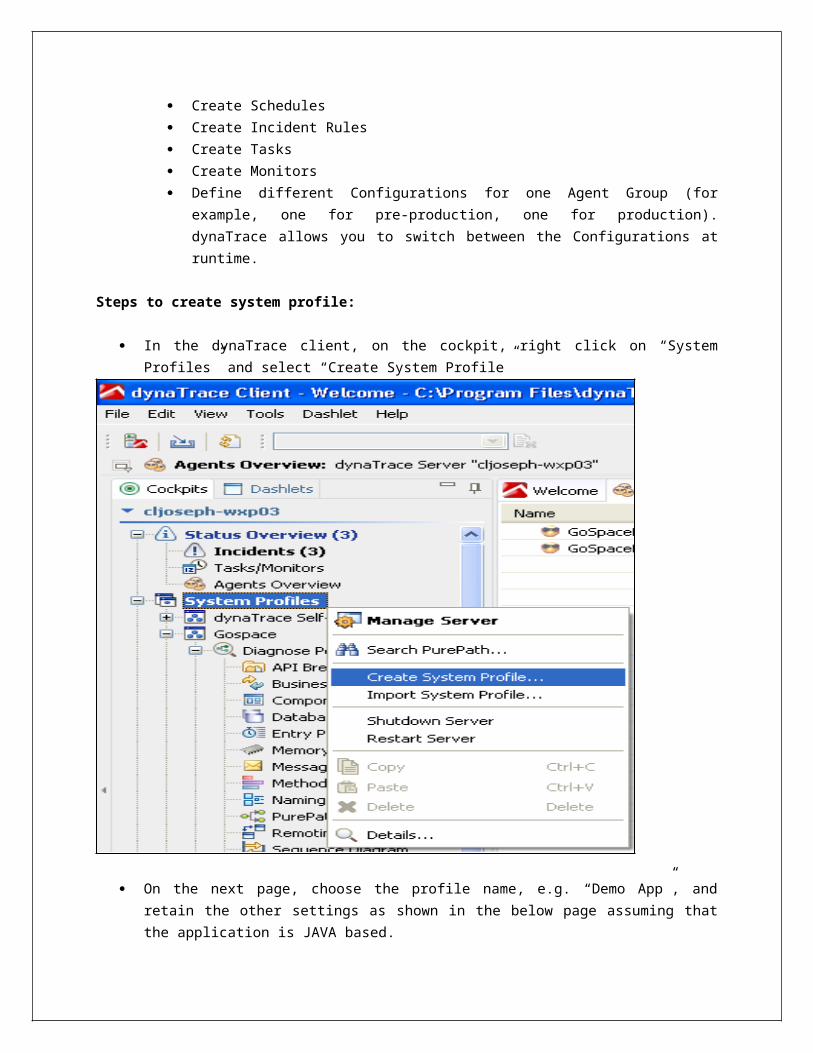
In the dynaTrace client, on the cockpit, right click on “System Profiles” and select “Create System Profile”
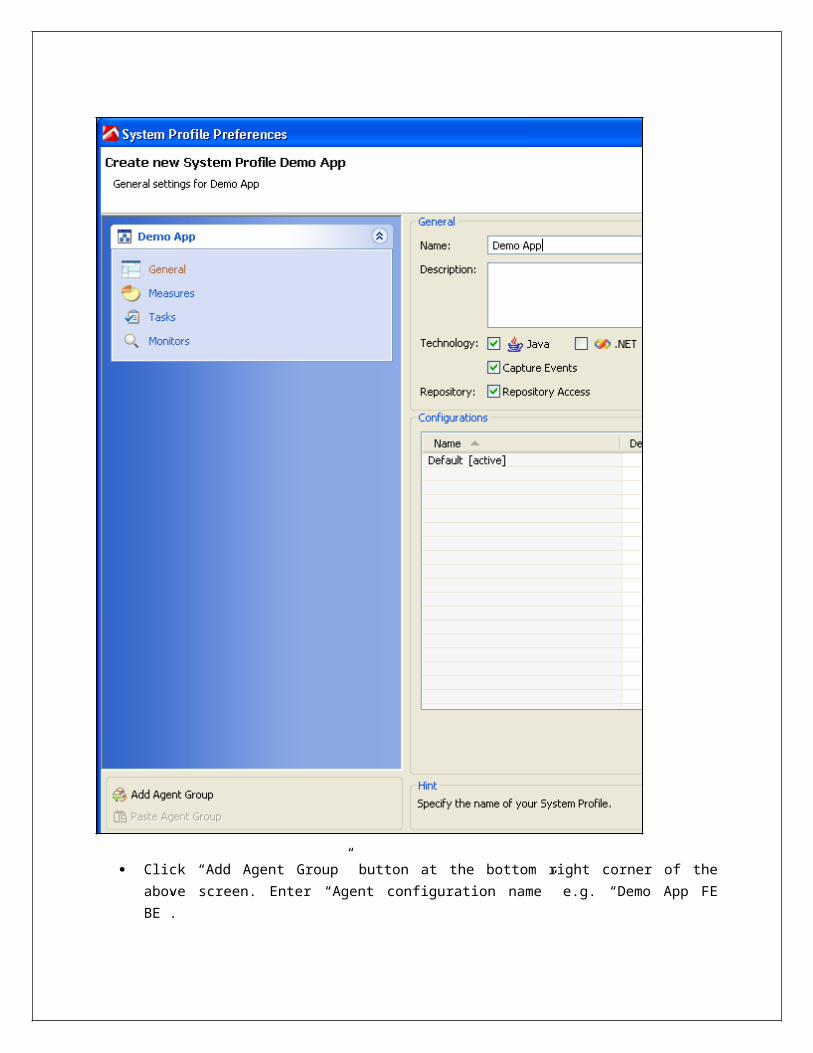
On the next page, choose the profile name, e.g. “Demo App”, and retain the other settings as shown in the below page assuming that the application is JAVA based.
Click “Add Agent Group” button at the bottom right corner of the above screen. Enter “Agent configuration name” e.g. “Demo App FE BE”.
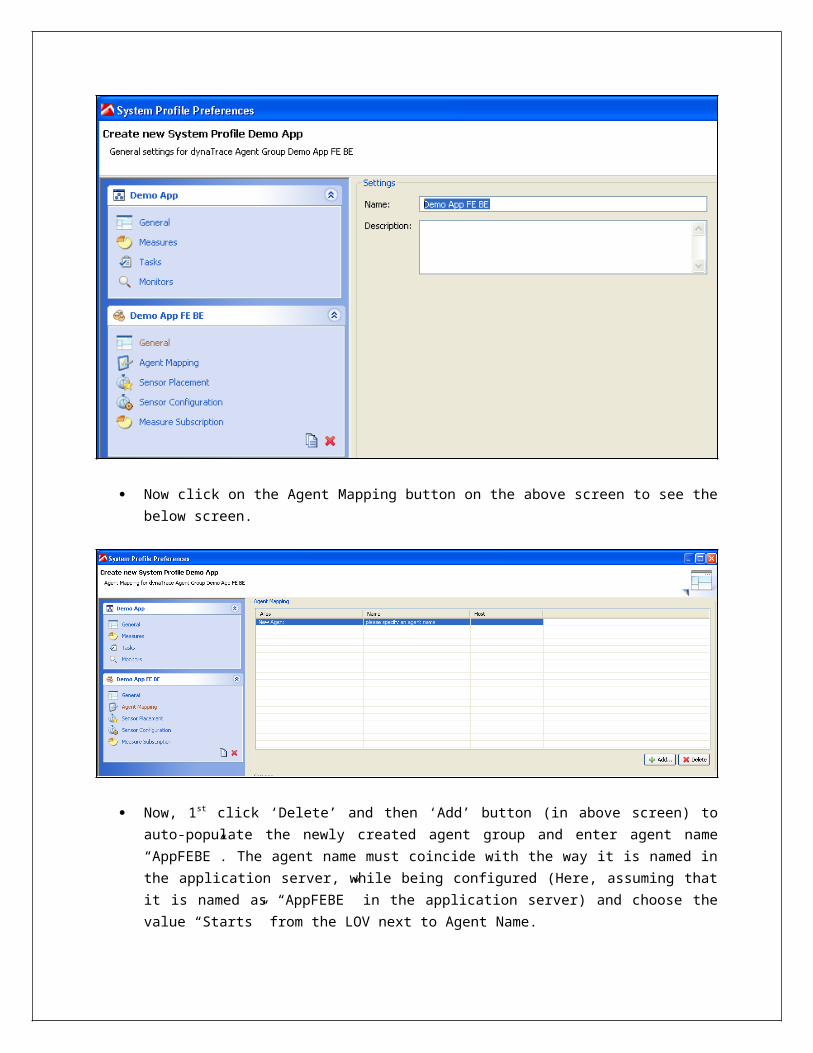
Now click on the Agent Mapping button on the above screen to see the below screen.
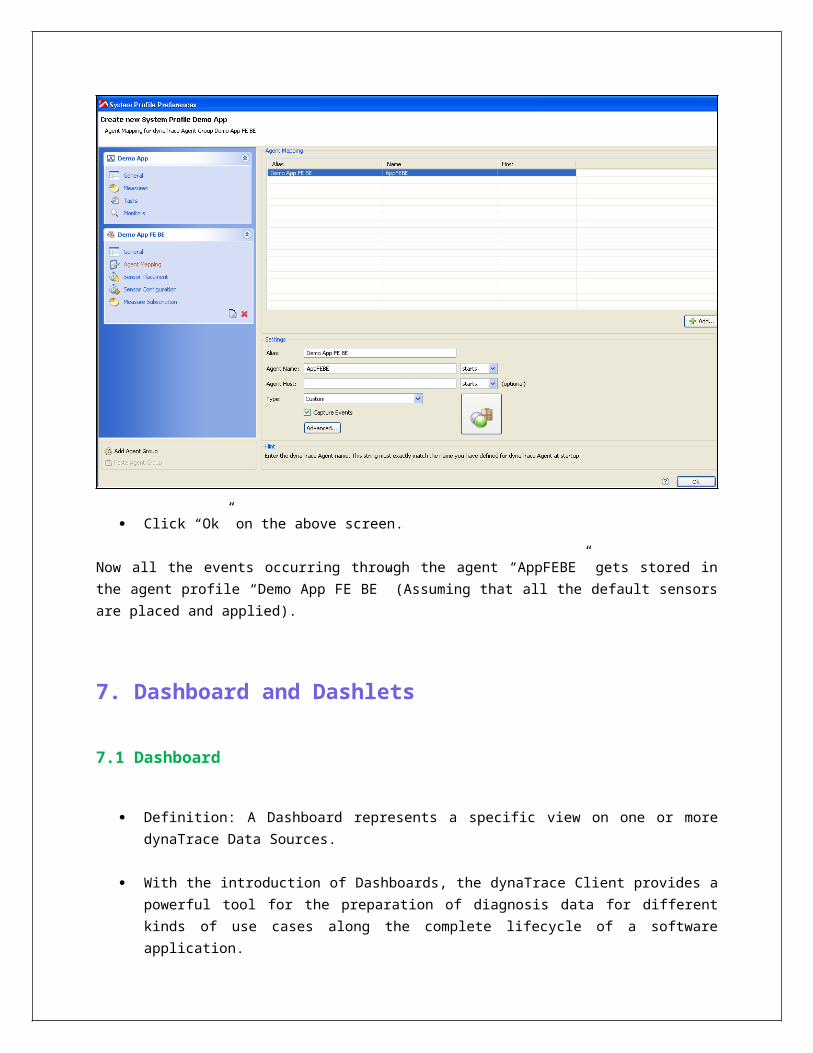
Now, 1st click ‘Delete’ and then ‘Add’ button (in above screen) to auto-populate the newly created agent group and enter agent name “AppFEBE”. The agent name must coincide with the way it is named in the application server, while being configured (Here, assuming that it is named as “AppFEBE” in the application server) and choose the value “Starts” from the LOV next to Agent Name.
Click “Ok” on the above screen.
Now all the events occurring through the agent “AppFEBE” gets stored in the agent profile “Demo App FE BE” (Assuming that all the default sensors are placed and applied).
7. Dashboard and Dashlets
7.1 Dashboard
Definition: A Dashboard represents a specific view on one or more dynaTrace Data Sources.
With the introduction of Dashboards, the dynaTrace Client provides a powerful tool for the preparation of diagnosis data for different kinds of use cases along the complete lifecycle of a software application.
dynaTrace Dashboards allow to filter, aggregate and annotate PurePath-related information for experts of different fields.
Dashboards help to document and reuse common diagnose practices and support the collaboration of departments.
We can store the dashboard both locally and on server
We can just build a dashboard and use any number of times by changing the source
7.2 Dashlets
The building blocks of a Dashboard are so-called Dashlets.
A Diagnose Dashlet defines a reusable and configurable view on one or more dynaTrace Sessions.
Dashlets inherit the properties of a dashboard but can be changed individually
We can just build a dashboard and use any number of times by changing the source.
We can drill down in the dashlets for more detailed analysis
7.3 Types of Dashlets
7.3.1 Performance Specific dashlets
API Breakdown
Business Transaction
Components
Database
Messaging
Methods
Naming Services
Pure paths
Sequence Diagram
Synchronization
Tagged Web Requests
Web Requests & Web Services
7.3.2 Event Specific dashlets
Exceptions
GUI Controls
Incidents
Logging
Runtime Suspensions
7.3.3 Runtime specific dashlets
Selective Memory
Threads
Total Memory
7.3.4 Important Dashlets
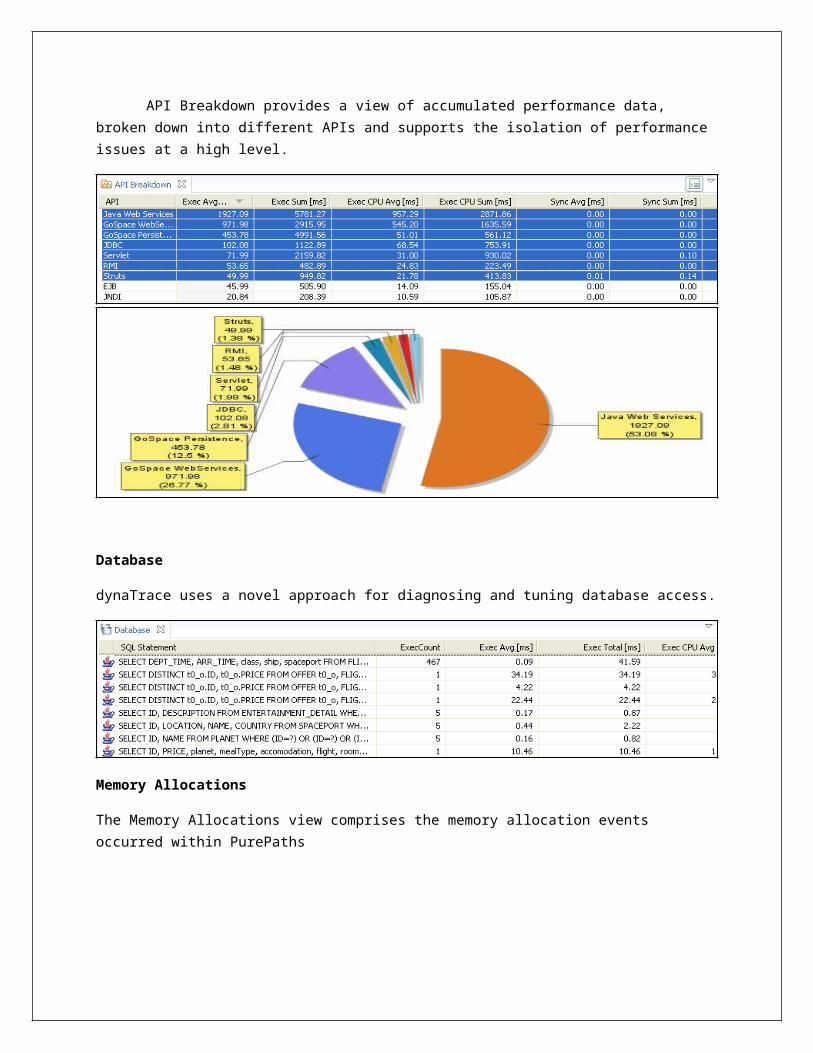
API Breakdown
API Breakdown provides a view of accumulated performance data, broken down into different APIs and supports the isolation of performance issues at a high level.
Database
dynaTrace uses a novel approach for diagnosing and tuning database access.
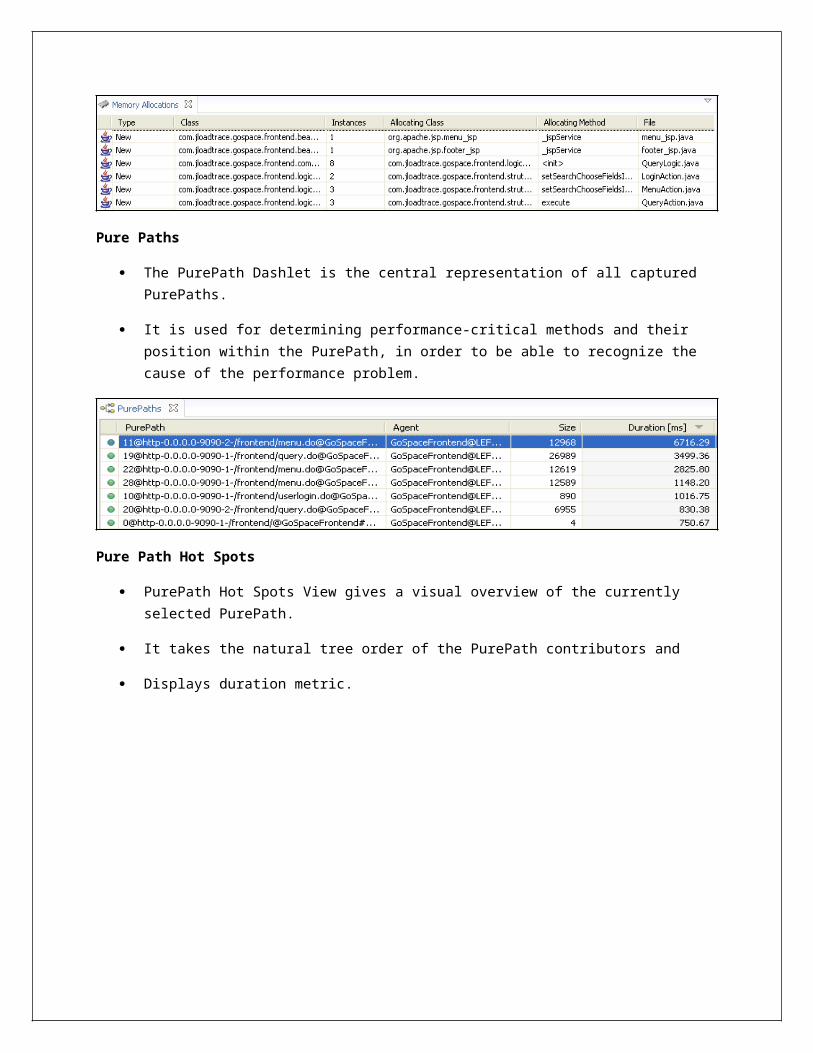
Memory Allocations
The Memory Allocations view comprises the memory allocation events occurred within PurePaths
Pure Paths
The PurePath Dashlet is the central representation of all captured PurePaths.
It is used for determining performance-critical methods and their position within the PurePath, in order to be able to recognize the cause of the performance problem.
Pure Path Hot Spots
PurePath Hot Spots View gives a visual overview of the currently selected PurePath.
It takes the natural tree order of the PurePath contributors and
Displays duration metric.
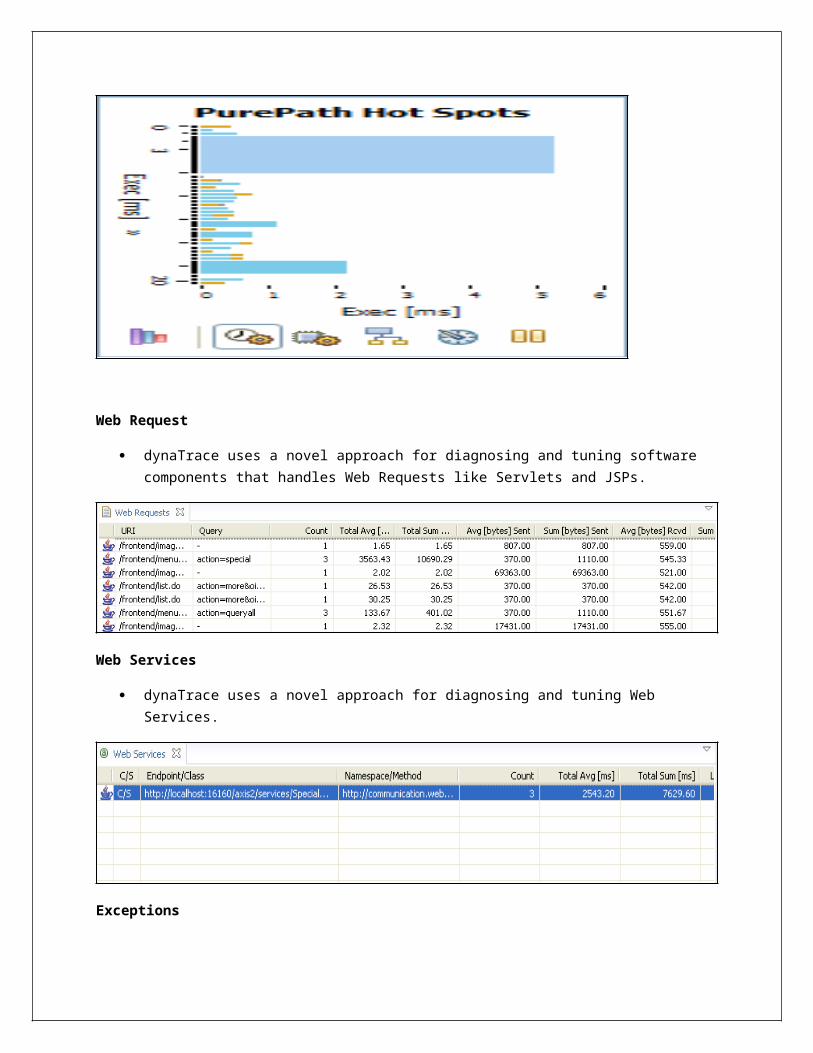
Web Request
dynaTrace uses a novel approach for diagnosing and tuning software components that handles Web Requests like Servlets and JSPs.
Web Services
dynaTrace uses a novel approach for diagnosing and tuning Web Services.
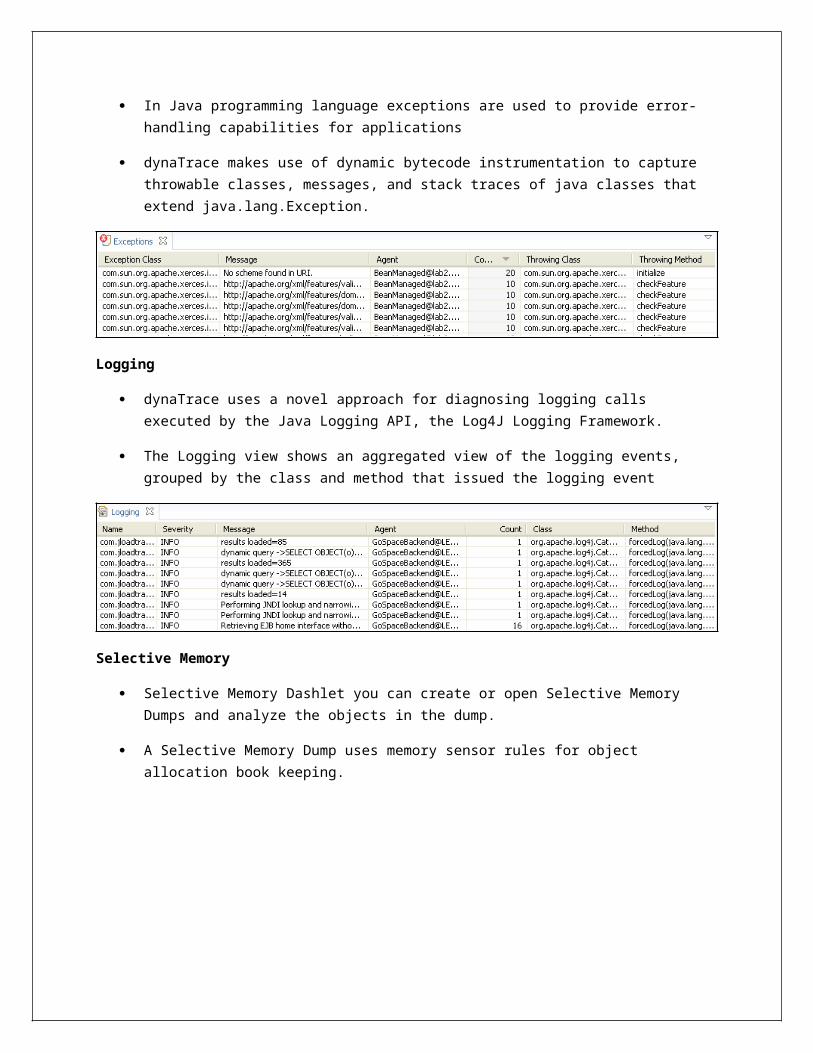
Exceptions
In Java programming language exceptions are used to provide error-handling capabilities for applications
dynaTrace makes use of dynamic bytecode instrumentation to capture throwable classes, messages, and stack traces of java classes that extend java.lang.Exception.
Logging
dynaTrace uses a novel approach for diagnosing logging calls executed by the Java Logging API, the Log4J Logging Framework.
The Logging view shows an aggregated view of the logging events, grouped by the class and method that issued the logging event
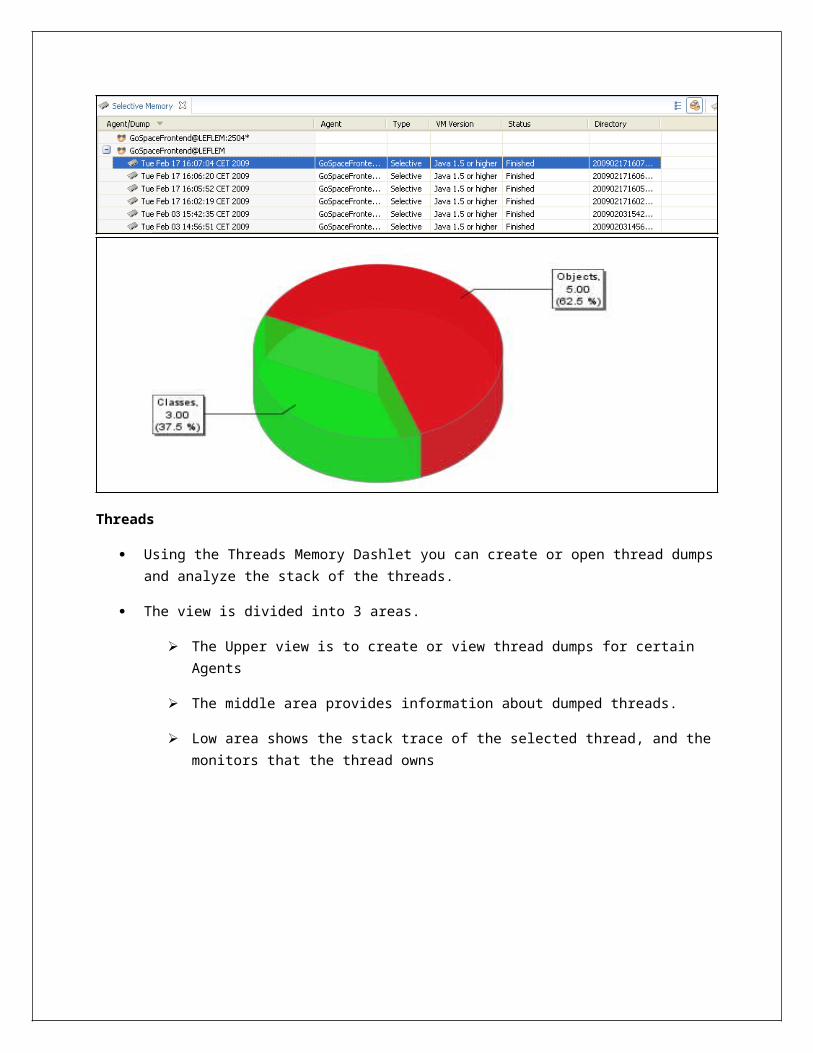
Selective Memory
Selective Memory Dashlet you can create or open Selective Memory Dumps and analyze the objects in the dump.
A Selective Memory Dump uses memory sensor rules for object allocation book keeping.
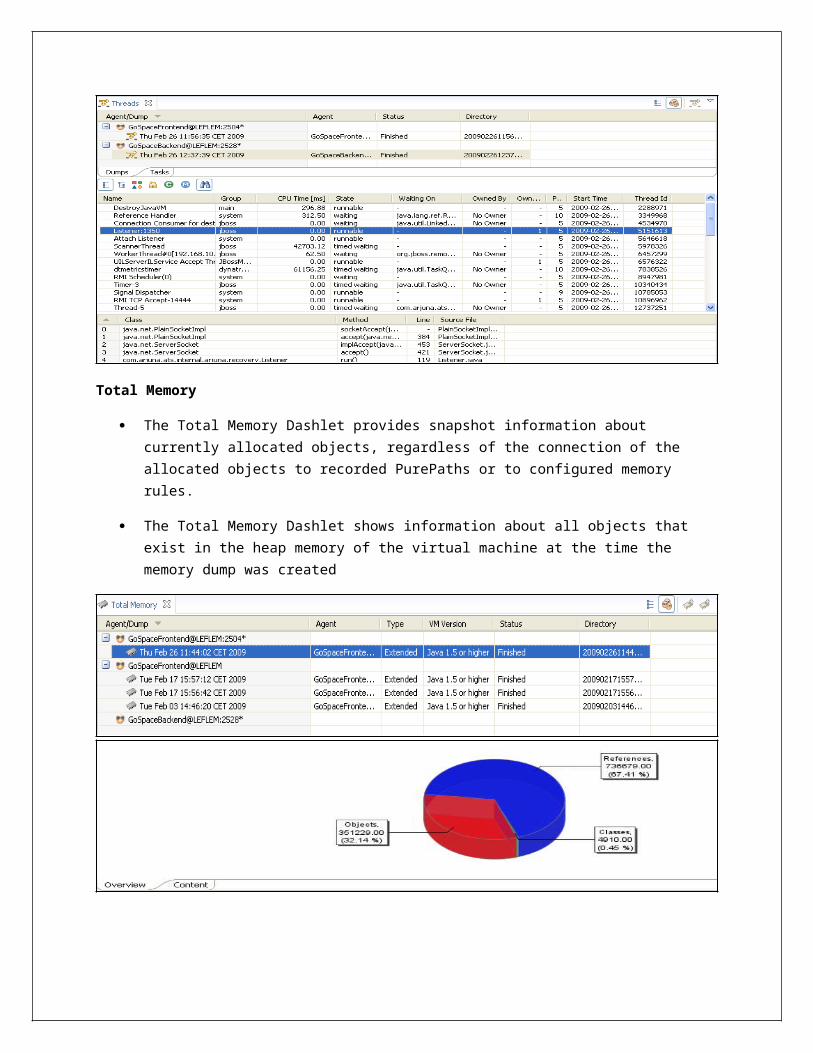
Threads
Using the Threads Memory Dashlet you can create or open thread dumps and analyze the stack of the threads.
The view is divided into 3 areas.
The Upper view is to create or view thread dumps for certain Agents
The middle area provides information about dumped threads.
Low area shows the stack trace of the selected thread, and the monitors that the thread owns
Total Memory
The Total Memory Dashlet provides snapshot information about currently allocated objects, regardless of the connection of the allocated objects to recorded PurePaths or to configured memory rules.
The Total Memory Dashlet shows information about all objects that exist in the heap memory of the virtual machine at the time the memory dump was created
8. Measures and Charting
8.1 Measures
SUBSCRIBE: Is a process of making a measures persistent in repository.
We can subscribe to system characteristics, layer/component response & CPU times, DB response times, JVM characteristics etc.
You must subscribe for doing the following things 1)charting 2)alerting 3)business transaction analysis
Dynamic measure gives us the privilege of adapting to any number of instances
We can set thresholds for all the measures.
There some default measures even if we don’t subscribe such as CPU usage, memory etc.
8.2 Charting
Charting templates provide an easy way to get a quick overview of an application.
The created templates contain preconfigured series suitable for most situations.
By default for each Agent Group an individual sub-chart within Chart Dashlet is created
We can chart any measure that has been subscribed
Steps to create a basic chart
Add a new chart dashlet
Go to dashboard Properties.
Go to General tab and change refresh setting to 10 sec (automatic option) to refresh chart every 10 sec.
Save the Dash board with a meaningful name.
Add Chart Dashlet to this Dashboard.
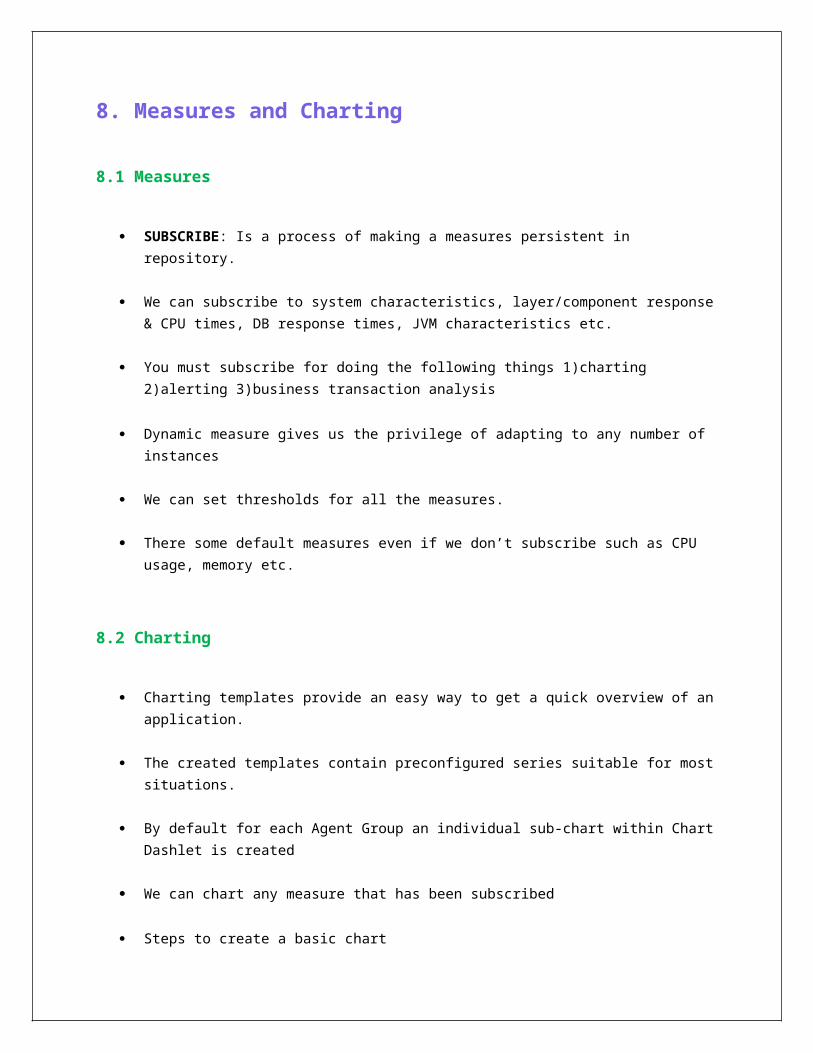
To add data to chart, right Click on the background of the chart and select Add Series option.
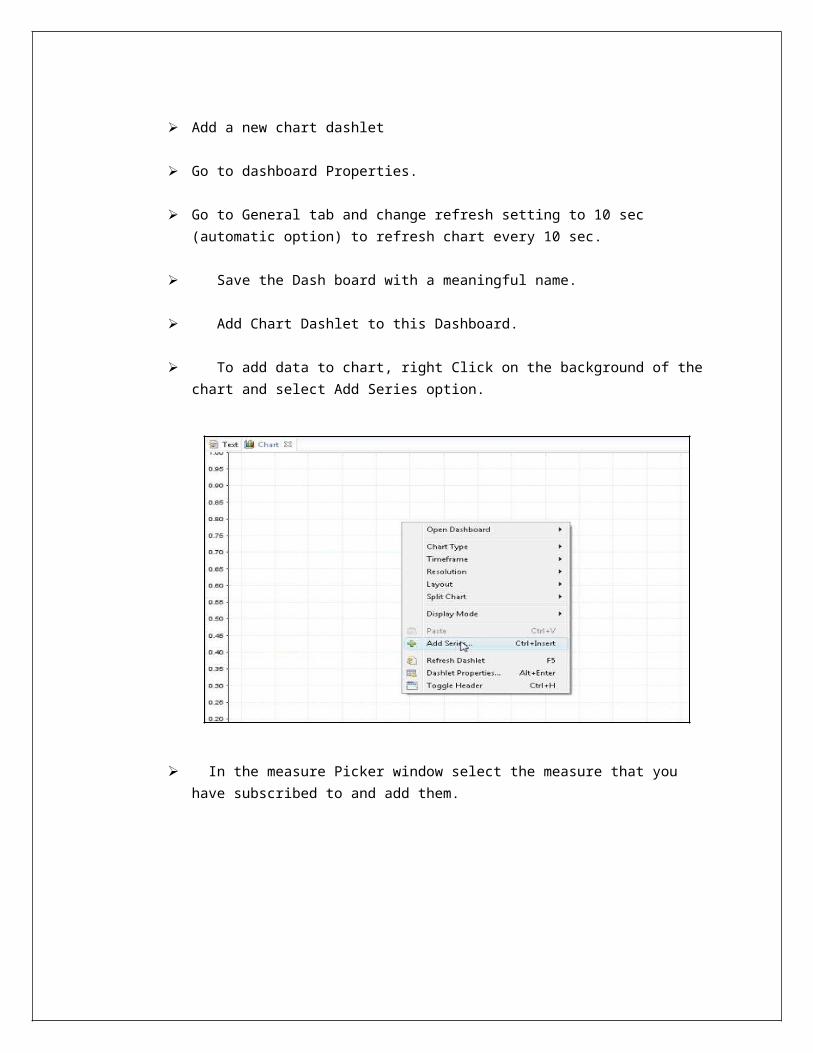
In the measure Picker window select the measure that you have subscribed to and add them.
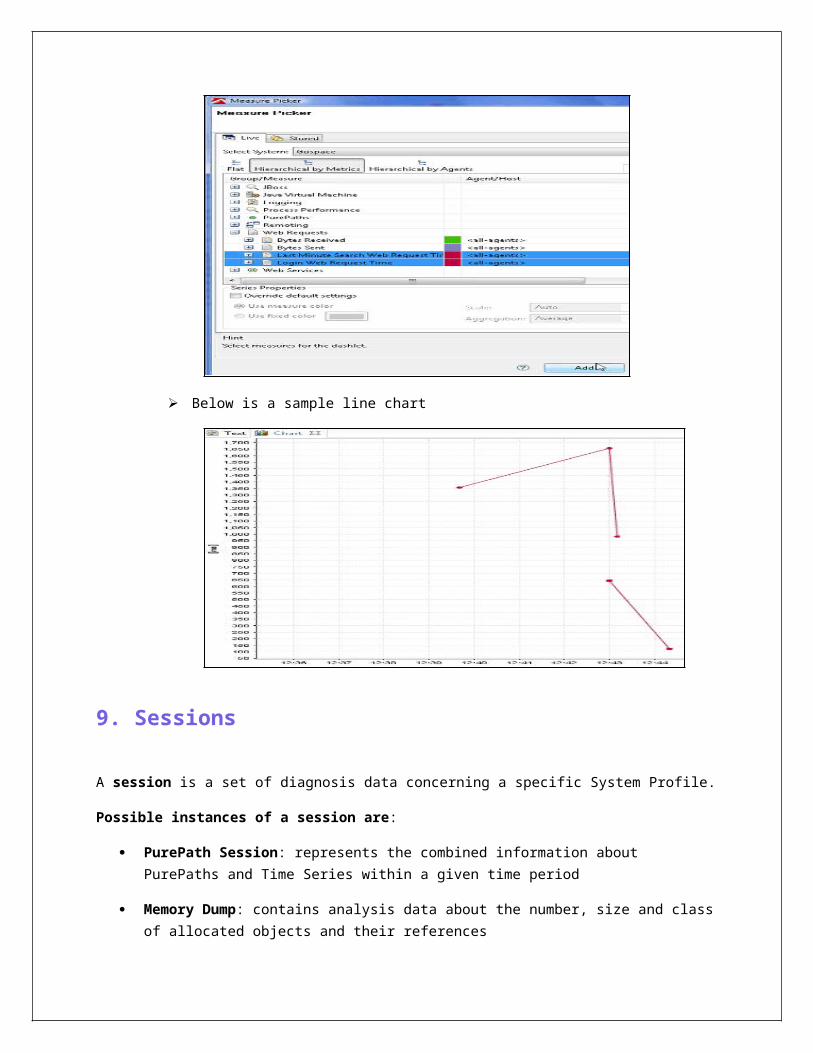
Below is a sample line chart
9. Sessions
A session is a set of diagnosis data concerning a specific System Profile.
Possible instances of a session are:
PurePath Session: represents the combined information about PurePaths and Time Series within a given time period
Memory Dump: contains analysis data about the number, size and class of allocated objects and their references
Thread Dump: is a collection of data for thread analysis including CPU time information
Types of Sessions
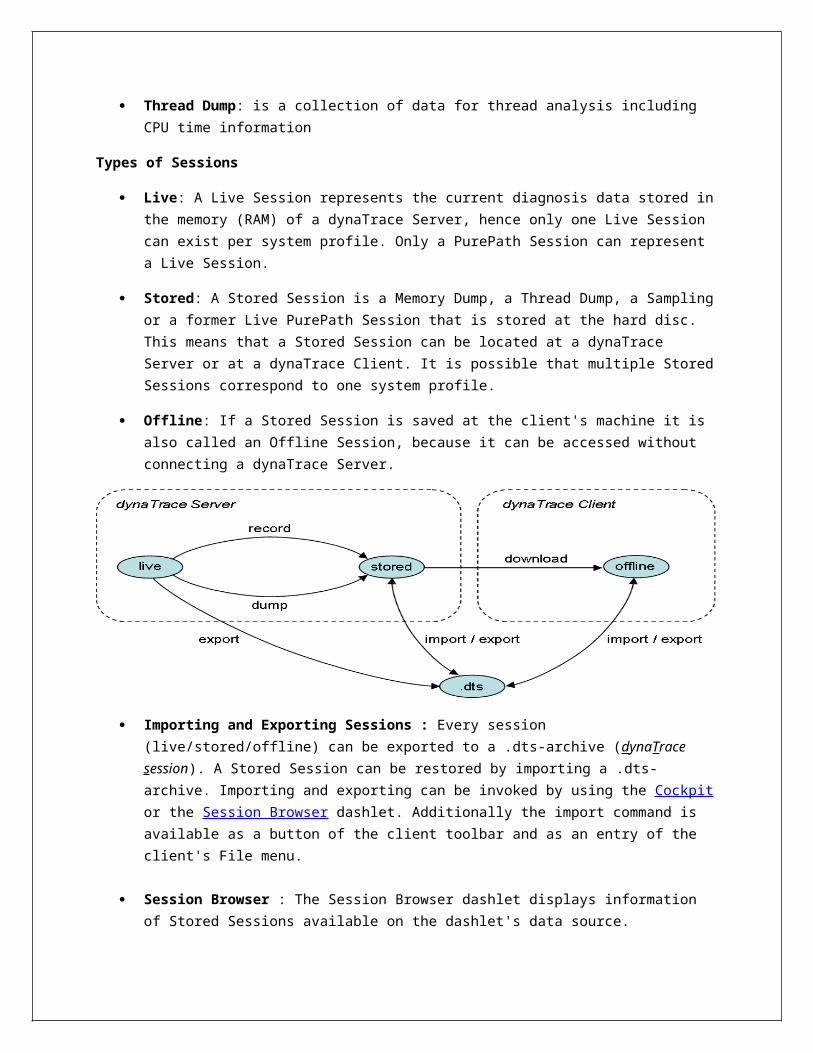
Live: A Live Session represents the current diagnosis data stored in the memory (RAM) of a dynaTrace Server, hence only one Live Session can exist per system profile. Only a PurePath Session can represent a Live Session.
Stored: A Stored Session is a Memory Dump, a Thread Dump, a Sampling or a former Live PurePath Session that is stored at the hard disc. This means that a Stored Session can be located at a dynaTrace Server or at a dynaTrace Client. It is possible that multiple Stored Sessions correspond to one system profile.
Offline: If a Stored Session is saved at the client's machine it is also called an Offline Session, because it can be accessed without connecting a dynaTrace Server.
Importing and Exporting Sessions : Every session (live/stored/offline) can be exported to a .dts-archive (dynaTrace session). A Stored Session can be restored by importing a .dts-archive. Importing and exporting can be invoked by using the Cockpit or the Session Browser dashlet. Additionally the import command is available as a button of the client toolbar and as an entry of the client's File menu.
Session Browser : The Session Browser dashlet displays information of Stored Sessions available on the dashlet's data source.
A Stored Session can be a PurePath Session, a Memory Dump, a Thread Dump or a Sampling that is stored on a dynaTrace Server or offline on the client
10. Integration with LoadRunner
dynaTrace integrates well with load testing and monitoring products, especially on the transactional/request level.The Tagged Web Requests view lists web requests originated from load testing systems integrated with dynaTrace. The integration of
dynaTrace with load testing systems enables to correlate generated web requests with the PurePaths.
Steps to Instrument LoadRunner scripts:
Access the Utility that modifies LR scripts into the format understood by dynaTrace (dTScriptConverter4LR)
Run the Utility by accessing ‘LoadRunnerConverter.cmd’
Browse for the script folder and click Open.
Select All Files and click Modify.
Go to script folder and check the scripts inside. All requests will have a dynaTrace header appended to them, as shown below:
11. Method InstrumentationMethod instrumentation is an art of choosing right methods to be instrumented.
We are using dynaTrace to find the root cause of issue and naturally wouldn’t want the tool to be an overhead. When method instrumentation is not done efficiently, it would cause over heads, hence, the entire purpose of using the tool is defeated. If we have intense knowledge of the application and code sections that could cause potential issues, then instrumentation would become a cake walk, but, if you are not aware, then below are the steps that would guide you to do method instrumentation.
Steps to create Method sensor packs and instrument the application:
Create your own sensor group using the class browser:
The Class Browser provides a convenient way to define Class Rules and Method Rules.
A tree view which reflects the package/namespace structure of the classes loaded by the SUD is created, which enables the selection of packages/namespaces, classes, interfaces and methods.
A Class Rule is generated for each selected tree node representing a package/namespace, class or interface, and a Method Rule is generated for each selected method node. This enables quick generation of multiple Class Rules and Method Rules.
Based upon a SUD´s loaded classes, which have been captured by a Discovery Run, the Class Browser provides the ability to select rules by simple mouse clicks.
If you are not sure about the specific classes/methods that are to be instrumented, you can choose a package, in the source code, under which you have a gut feeling that majority of the classes/methods, would be covered. This process is termed as ‘shotgunning’ where we deliberately over instrument the code and slowly exclude the methods/classes that need no instrumentation
Once custom sensors are added, they can be activated by HOT SENSOR PLACEMENT option (for JAVA 1.5 and above) or by restarting the application.
Once HOT SENSOR PLACEMENT or restart of the application is done, open the Pure Path dashlet available in the client.
Look for pure paths that have huge size (sort in DESC by size), and drill down into the methods.
Look for methods that are invoked many times (sort in DESC by count) but are doing very less in terms of response time and exclude them.
Exclusion/Inclusion of rules needs no HOT SENSOR PLACEMENT or restart of the application to take effect.
12. Memory Instrumentation
We perform memory instrumentation on application suffering from constant high memory usage or out of memory issues. The normal practice in order to diagnose memory issues is to take a heap dump. This dump takes a snapshot of the heap at that point in time. Java provides an API to take Heap dumps, but, they are very expensive since they freeze all the other activities happening in the application till their completion.
dynaTrace provides inbuilt memory packages that are not placed by default. Once these sensor packs are placed the application HAS TO BE RESTARTED and the concept of HOT SENSOR PLACEMENT doesn’t work here.
To overcome the over head issues in JAVA heap dump API, dynaTrace provides an easier and time saving utilities like:
Partial Heap Dump – This utility does not take the snap shot of all the objects in the heap, it only captures the ones that are essential, and hence, the application is not stalled for a long time.
12 Full Heap Dump – After analyzing all the partial heap dumps and locating the major bottleneck classes/packages, the full heap dump is taken to find the root cause. This heap dump is not as time consuming as the one provided by JAVA.
Steps to perform Memory instrumentation:
13 Run the application suffering with memory issues.14 Take 3-4 partial heap dumps to analyze the entities consuming enormous
memory(e.g. float array) 15 Now take a full heap dump and get the details of the classes/packages, of the
entity identified in the above step, involved in memory consumption.16 Instrument the classes/packages identified to be consuming more memory.17 Restart the application for the instrumentation to take effect.18 Find the root cause of the issue.
Top Related