


Languages
Pages
Legal


www.bciminerals.com.au
Corporate Presentation
21 March 2019
Driving the Mardie Project Towards Development

2
About BCI Minerals
▪ Based in Perth, Australia
▪ ASX listed as “BCI”
▪ Market cap of ~A$60M
▪ A$36M1 cash and zero debt
▪ Wroxby Pty Ltd - largest shareholder ~28%
▪ Key assets:
– Mardie Salt & Potash: 100% owned project
– Iron Valley Mine: royalty earnings
1. As at 31-Dec-18.
0
1
2
3
4
5
0.00
0.05
0.10
0.15
0.20
0.25
Jan-18 Apr-18 Jul-18 Oct-18 Jan-19
Vo
lum
e (
m)
Sh
are
Pri
ce (
A$
)
Share Price Volume

3
BCI has a track record of funding, developing and operating mining projects
BCI Project Development History
1. Nullagine Joint Venture – Iron Ore:
▪ Developed from greenfields and operated from 2010-2015
▪ BCI as manager with FMG as partner
▪ Dividends paid to shareholders: A$100M
2. Iron Valley – Iron Ore:
▪ Developed in partnership with Mineral Resources Ltd
▪ Operations from 2014 to current
▪ BCI royalty receipts to date: A$170M revenue and A$40M EBITDA
3. BCI is now focused on developing the
100% owned Mardie Salt & Potash Project

4
Mardie is a Tier 1 long life project that can supply the
Salt and Potash growth markets in Asia
The Mardie Opportunity
Salt as chemical
feedstock
Sulphate of Potash
as premium
fertiliser
Asian
Demand
Rapidly developing the 100% owned Mardie Project
will create substantial long-term value for all BCI stakeholders
MARDIE SALT &
POTASH PROJECT

5
▪ Salt (NaCl) = 40% sodium (Na) + 60% chlorine (Cl)
▪ >300Mtpa of Salt produced and consumed globally
▪ Salt production methods:
1. Solar evaporation of seawater or inland lakes
2. Mining of rock salt deposits via hard rock or solution
mining methods
Salt Facts
Source: Roskill 2017 Salt Market Report.
Industrial, 184Mt, 54%
De-icing, 40Mt, 12%Food,
30Mt, 9%
Other, 86Mt, 25%
Global Salt Applications
▪ Salt Applications:
1. Industrial / chemical / pharmaceutical: including
glass, PVC, paper, textiles, medicines, oils etc.
2. Water treatment: increases purity and removes
elements harmful to equipment
3. Food & Feed: preserves & flavours human food;
essential element of animal nutrition
4. De-icing: improves road transport safety in winter
▪ Salt Pricing:
– High-end chlor-alkali market requires high
purity premium salt as feedstock
– High purity salt of >99.5% NaCl has sold
at prices of US$40-75/t over last 10-years
– Most of high purity salt into Asia is
shipped from Australia, Mexico and India
6
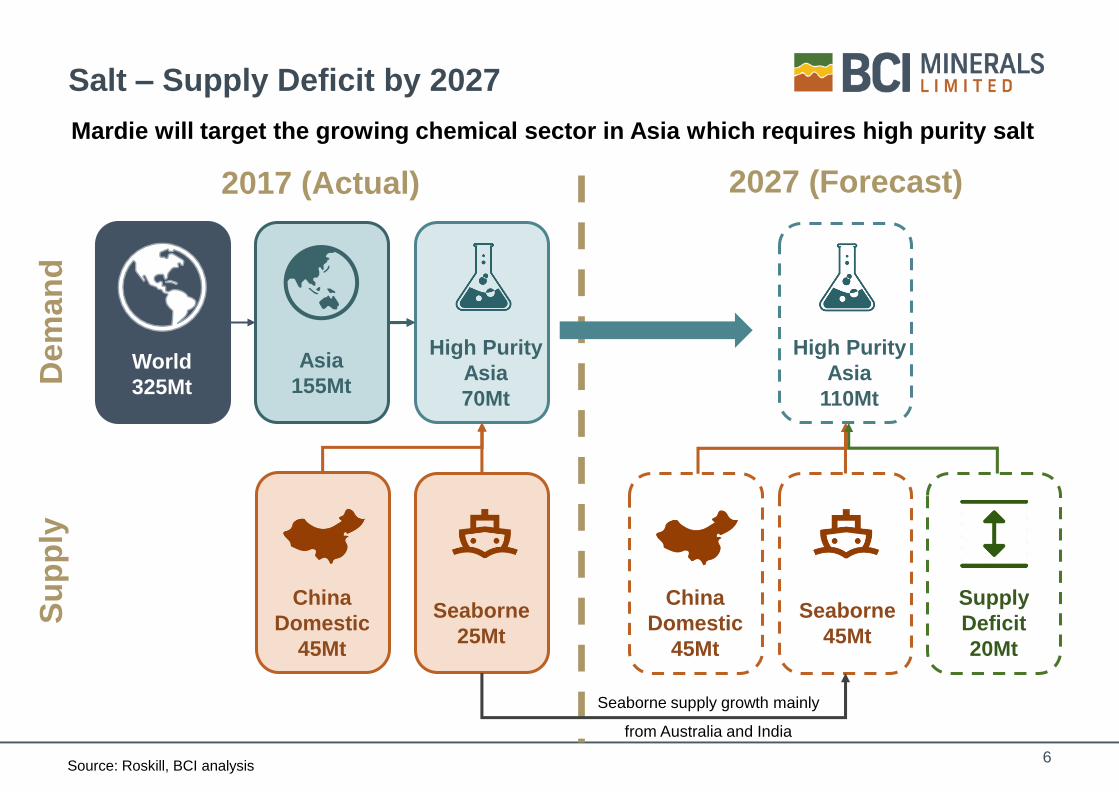
Mardie will target the growing chemical sector in Asia which requires high purity salt
Salt – Supply Deficit by 2027
Source: Roskill, BCI analysis
China
Domestic
45Mt
2017 (Actual)
Asia
155Mt World
325Mt
2027 (Forecast)
High Purity
Asia
70Mt
Seaborne
25Mt
High Purity
Asia
110Mt
China
Domestic
45Mt
Seaborne
45Mt
Supply
Deficit
20Mt
Dem
an
dS
up
ply
Seaborne supply growth mainly
from Australia and India

7
▪ Global agricultural industry depends on three
primary fertilisers – Nitrogen (N), Phosphate
(P) and Potassium (K)
▪ Potassium improves nutrient flow through
plants and increases resistance to diseases
▪ Two main types of potassium fertilisers:
– Muriate of Potash (MOP) – KCl
– Sulphate of Potash (SOP) – K2SO4
▪ SOP is a premium fertiliser used on higher value
crops (fruits, berries, vegetables)
▪ SOP (~US$500/t) has large price premium over
MOP (~US$300/t)
▪ SOP has a strong long-term demand outlook
MOP (KCl),
58MtSOP, 7Mt
Global Potash Market (Product Tonnes)
Other, 3Mt
Source: Integer Research 2017, BCI analysis.
Needing more and
better quality food
Crop yield
increase required
Reducing
arable land
Increasing Asian
middle class
SOP DEMAND DRIVERS
✓
✓
✓
✓
Sulphate of Potash (SOP) Facts

8
▪ Mardie will produce from an inexhaustible seawater
resource:
– Salt as primary product; and
– SOP as by-product
▪ Five large existing evaporative Salt operations in the
Pilbara region of WA
– Ideal climatic conditions
– Total production capacity of 14Mtpa
– Up to 5 decades old
▪ No existing SOP production in Australia with all
planned projects based on extraction of brines from
inland salt lakes
Australian Salt & SOP Landscape
900km
1,000km
800km

9
▪ Vast area of mudflats with impermeable
clay soils (130km2 / 13,000ha)
▪ Site layout designed 3-5km inland to limit
disturbance of coastal ecosystem
▪ 6 pumps with 10,000l/s total capacity
▪ 8 large ponds and 36 crystallisers over a
20km x 5km area (100km2 / 10,000ha)
▪ Salt Plant and SOP Plant with modern
technology
▪ Salt export jetty to reach >3m water depth
▪ Transhipping to large vessels anchored
offshore
Mardie Project Layout
Village
Concentrator
Ponds
Seawater
Pump Station
SOP Plant
Artist’s Impression
Salt
Crystallisers
Export Jetty
P1
5km
N
P2
P3
P4
P5
P6
P7P8
SOP
Crystallisers
Salt Plant

10
Approvals & Tenure Well Defined
▪ Mining Act tenure on competitive terms with other WA salt projects
▪ Government support secured for export facility at Mardie – leases to be negotiated
▪ Significant surveys completed and no material issues identified
▪ Environmental approvals on track for late 2019 (EPA endorsed timeline)
Tenure
Environmental
▪ Land use agreements (allowing production) secured with Native Title claim groups
▪ Heritage surveys for majority of project area successfully completed
Heritage

11
▪ NPV10: A$335M
▪ EBITDA: A$102M/a
▪ IRR: 20%
▪ A$335M
▪ Salt: A$20/t
▪ SOP: A$250/t
▪ Salt: 3.5Mtpa
▪ SOP: 75ktpa
Attractive PFS Economics to Improve in DFS
Production
Capex
Opex(FOB all-in cash
cost basis)
Financials2
1. Refer to BCI’s PFS release dated 1 June 2018. All material assumptions and technical parameters underpinning the production
target and forecast financial information continue to apply and have not materially changed. DFS numbers are aspirational aims
2. Financials based on a 30-year operating life; pre-tax basis; salt price of US$30/t FOB; SOP price of US$500/t FOB; AUD
exchange rate of 0.75; ocean freight cost of US$13/t to Asia
▪ A$400M
▪ Salt: 4.0Mtpa
▪ SOP: 100ktpa
▪ Salt: A$16/t
▪ SOP: A$250/t
▪ NPV10: A$450M
▪ EBITDA: A$130M/a
▪ IRR: 25%
PFS1 DFS OBJECTIVES1

12
A
u
s
Mardie’s Competitive Positioning
▪ Mexican salt into Asia is setting the marginal price
▪ Australia has ~US$15/t ocean freight cost
advantage to Mexico
▪ Mardie will be cost competitive with existing
Australian operations
▪ 3Mt of MOP converted to SOP through the
chemical Mannheim process at high cost - this
underpins SOP pricing
▪ Mardie SOP is a by-product, with large % of
capex & opex “sunk” against salt production
▪ Inland brine SOP projects ~1,000km further to
port than Mardie (~US$50/t additional transport
cost),
Mardie
Aus
Mexico
India
25
40
45 Mt0 Mt
Mardie
China
(salt lakes)
China
(Mannheim)200
400
0 Mt 8 Mt
Ma
nn
he
im
co
st
Marginal
Cost / PriceMarginal Cost/Price
AusAus
Ca
sh
Co
sts
(U
S$
/t C
IF A
sia
)
Cas
h C
os
ts (
US
$/t
CIF
As
ia)
Fre
igh
t
diffe
rentia
l
High Purity Salt Cost Curve – Seaborne to Asia (2027) Simplified SOP Cost Curve – Global (2027)
5 Mt
Aus
38 Mt
Aus

13
Proposed Development Strategy
Project
Phases
DFS + Approvals + Early Works
FEEDSalt Ponds + CrystallisersConstruction
Salt Plant + Port Construction
Ramp up
SOP Cryst SOP Plant Construction
2019 2020 2021 2022 2023
FID
BCI Owners Team
Specialist Packages:
Pond / Plants / Port designs; Shipping ops model;Market modelling
Lead DFS Engineer
(GR Engineering)
BCI Owners Team
Ponds (rates contract)
Plants (EPCs)
Port (EPC)
Other (BOO etc)
EPCM Engineer

14
BCI is Well Funded to FID in Early 2020
Project
Phases
Project
Expenditure $25M $100M $300M
DFS + Approvals + Early Works
FEEDSalt Ponds / CrystallisersConstruction
Salt Plant + Port Construction Ramp up
SOP Cryst.Construct.
SOP Plant Construction
2019 2020 2021 2022 2023
Cash
($36M)
+
Iron Valley
royalty
($6M-$12M/a)
FID
Sources of
Funds
Cash
+
Iron Valley royalty
+
Asset sales
+
Equity / Debt / BOO

15
1. Market: Strong market outlook for salt & SOP
2. Project: Tier 1 asset – ideal location, long life, large scale & low costs
3. Sustainability: Inexhaustible seawater resource and production
utilising ~95% solar and wind energy
4. Company: BCI has a positive development track record and is well
funded and supported to accelerate Mardie’s development
Mardie – Unique Project Opportunity

16
Important Notices
This presentation has been prepared by BCI Minerals Limited ABN 21 120 646 924 (“BCI”).
This document contains background information about BCI current at the date of this presentation. The presentation is in summary form, has not been
independently verified and does not purport to be all inclusive or complete nor does it contain all the information that a prospective investor may require in
evaluating a possible investment in BCI or its assets. Some of the diagrams and pictures in the presentation are artistic representations only and should not
be construed as BCI assets or having any meaning for interpretation reasons.
Recipients should conduct their own investigations and perform their own analysis in order to satisfy themselves as to the accuracy and completeness of the
information, statements and opinions contained in this presentation.
This presentation is for information purposes only. Neither this presentation nor the information contained in it constitutes an offer, invitation, solicitation or
recommendation in relation to the purchase or sale of securities in any jurisdiction. This document is not a prospectus and does not contain all of the
information which would be required to be disclosed in a prospectus. This presentation may not be distributed in any jurisdiction except in accordance with
the legal requirements applicable in such jurisdiction. Recipients should inform themselves of the restrictions that apply in their own jurisdiction. A failure to
do so may result in a violation of securities laws in such jurisdiction.
This presentation does not constitute investment advice and has been prepared without taking into account the recipient's investment objectives, financial
circumstances or particular needs and the opinions and recommendations in this presentation are not intended to represent recommendations of particular
investments to particular persons. Recipients should seek their own professional, legal, tax, business and/or financial advice when deciding if an investment
is appropriate. All securities transactions involve risks, which include (among others) the risk of adverse or unanticipated market, financial or political
developments. To the fullest extent permitted by law, BCI and its related bodies corporate, its directors, officers, employees and representatives (including its
agents and advisers), disclaim all liability, take no responsibility for any part of this presentation, or for any errors in or omissions from this presentation
arising out of negligence or otherwise and do not make any representation or warranty, express or implied, as to the currency, accuracy, reliability or
completeness of any information, statements, opinions, estimates, forecasts, conclusions or other representations contained in this presentation. This
presentation may include forward-looking statements. These forward-looking statements are not historical facts but rather are based on BCI’s current
expectations, estimates and assumptions about the industry in which BCI operates, and beliefs and assumptions regarding BCI’s future performance. Words
such as “anticipates”, “expects”, “intends”, “plans”, “believes”, “seeks”, “estimates”, “potential” and similar expressions are intended to identify forward-looking
statements. Forward-looking statements are only predictions and are not guaranteed, and they are subject to known and unknown risks, uncertainties and
assumptions, some of which are outside the control of BCI. Past performance is not necessarily a guide to future performance and no representation or
warranty is made as to the likelihood of achievement or reasonableness of any forward-looking statements or other forecast. Actual values, results or events
may be materially different to those expressed or implied in this presentation. Given these uncertainties, recipients are cautioned not to place reliance on
forward looking statements. Any forward looking statements in this presentation speak only at the date of issue of this presentation. Subject to any continuing
obligations under applicable law and the ASX Listing Rules, BCI does not undertake any obligation to update or revise any information or any of the forward
looking statements in this presentation or any changes in events, conditions or circumstances on which any such forward looking statement is based.

17
Driving Mardie Rapidly
Towards Development

Appendix A:
Additional Corporate & Project Information

19
Corporate Information
Capital Structure
Ordinary Shares 397.6M
Share Price (20-Mar-19) $0.155
Market Capitalisation $61.6M
Cash (31-Dec-18) $36.6M
Debt (31-Dec-18) Nil
Share Price and Volume
0
1
2
3
4
5
0.00
0.05
0.10
0.15
0.20
0.25
Jan-18 Apr-18 Jul-18 Oct-18 Jan-19
Vo
lum
e (
m)
Sh
are
Pri
ce (
A$
)
Share Price Volume
Shareholding and Trading
Wroxby Pty Ltd 27.6%
Top 20 Shareholders ~50%
Number of Shareholders ~7,000
Ave Daily Volume (Last 6 Months) ~500,000
Board Management
Brian O’Donnell(Non-Exec Chairman)
Simon Hodge(Chief Financial Officer)
Alwyn Vorster(Managing Director)
Tony Chamberlain(Project Director)
Jennifer Bloom(Non-Exec Director)
Michael Klvac(GM Corporate Affairs)
Michael Blakiston(Non-Exec Director)
Stephanie Majteles(General Counsel)

20
Board and Management
Brian O’Donnell
Non-Executive Chairman
➢ Director, Finance and Investments
for Australian Capital Equity group
➢ Numerous current and previous
board positions on ASX-listed and
private companies
Alwyn Vorster
Managing Director
➢ Geology, Mining and MBA degrees
➢ Kumba; Rio Tinto; Iron Ore
Holdings
➢ Experience across geology, mining,
marketing, project studies and
corporate management
Tony Chamberlain
Project Director
➢ Chemistry/Metallurgy degrees
(PhD)
➢ WMC; BHP; Vimy
➢ Feasibility study, construction,
project funding and operational
Jennifer Bloom
Non-Executive Director
➢ Extensive business background
with experience in governance
and approvals
➢ Senior positions in both the
private and public sector
Simon Hodge
Chief Financial Officer
➢ Finance degree
➢ JP Morgan; Poynton & Partners;
Quickflix
➢ Corporate finance and investment
banking
Michael Klvac
General Manager – Corporate Affairs
➢ Science and Economics
degrees
➢ BHP; Iron Ore Holdings
➢ Environmental approvals;
Native Title and Stakeholder
management
Michael Blakiston
Non-Executive Director
➢ Partner in Gilbert + Tobin’s
Energy + Resources group
➢ Has served on numerous ASX
and not-for-profit boards
Stephanie Majteles
General Counsel
➢ Resources lawyer
➢ Freehills; Rio Tinto
➢ Mining law, State Agreements &
approvals, procurement
21
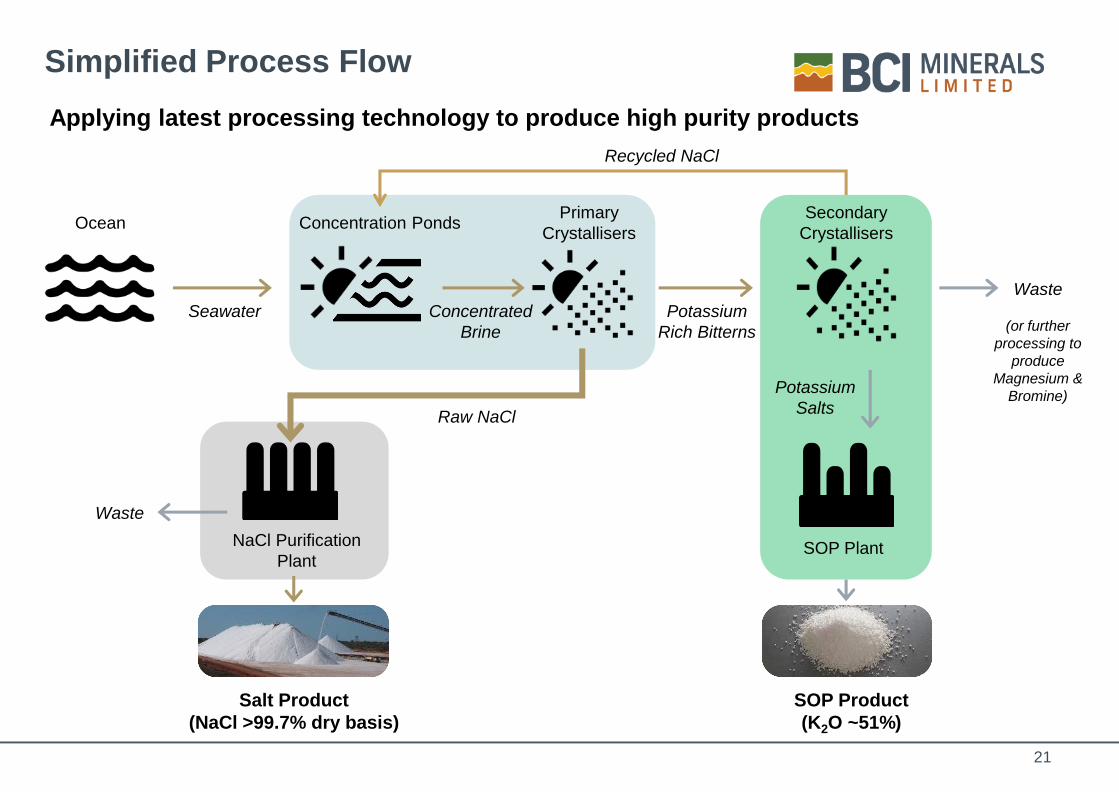
Simplified Process Flow
Seawater
Concentration PondsPrimary
Crystallisers
Raw NaCl
NaCl Purification
Plant
SOP Product
(K2O ~51%)
Salt Product
(NaCl >99.7% dry basis)
SOP Plant
Potassium
Rich Bitterns
Waste
(or further
processing to
produce
Magnesium &
Bromine)
Waste
Concentrated
Brine
Ocean
Potassium
Salts
Recycled NaCl
Secondary
Crystallisers
Applying latest processing technology to produce high purity products

22
Final investment decision targeted by Q1-20, allowing first salt sales by late 2022
Mardie Timeline
Activities2019 2020
Q1 Q2 Q3 Q4 Q1 Q2
Environmental Surveys & Approvals
Mardie Port – Gov’t Endorsement
Mardie Port – Leases
Pond, Crystalliser & Plant Design
Port Design
DFS Report
Offtake & Funding
Early Construction Works
Final Investment Decision (FID)
Construction & Commissioning

23
▪ Quarterly earnings for BCI via royalty agreement
with Mineral Resources Ltd (MIN)
– BCI EBITDA of A$3M in H1 FY19, A$6M in FY18
and A$18M in FY17
▪ 95Mt Reserves; 6-8Mtpa iron ore operation; 50%
lump production; potential mine life of ~13 years
▪ Average ore grade: Lump 60% Fe; Fines 58% Fe
▪ Upside for BCI from MIN’s Bulk Ore Shuttle
System (BOSS)1
– Lightweight, narrow gauge rail system with fully
autonomous operation
– Lower opex improves financial viability
– Potential construction start in 2H CY19
– Potential to double production rates to 15Mtpa
(higher royalty payment to BCI)
1. Refer to MIN’s FY19 Half-Year Results Presentation (21-Feb-19) for further details
Iron Valley Mine – Royalty Earnings
Iron Valley Operation
Artist’s Impression of BOSS

Appendix B:
Salt Information

25
Salt and SOP
Project Locations

26
▪ Salt (NaCl) is 40% sodium (Na) and 60% chlorine (Cl)
▪ Essential for many aspects of modern living
▪ >300Mtpa of Salt produced and consumed globally
▪ Salt is extracted via two main methods:
1. Solar evaporation of seawater or inland lakes
2. Mining of rock salt deposits via hard rock or solution
mining methods
▪ High purity salt of >99.5% NaCl has attracted prices
of US$40-75/t in the high-end chemical market
What is Salt?
China, 90Mt
India, 32Mt
Other Asia, 19Mt
Europe, 81Mt
North America, 65Mt
South America,
23Mt
Australia, 10MtAfrica, 6Mt
Global Salt Production
Source: Roskill 2017 Salt Market Report.

27
Salt Uses
Salt is an essential feedstock for thousands of products
Industrial, 184Mt, 54%
De-icing, 40Mt, 12%
Food, 30Mt, 9%
Other, 86Mt, 25%
Global Salt Market
▪ Industrial/chemical/pharmaceutical: including
glass, PVC, paper, textiles, medicines, oils etc.
▪ Water treatment: increases purity and removes
elements harmful to equipment
▪ Food & Feed: preserves & flavours human food;
essential element of animal nutrition
▪ De-icing: improves road transport safety in winter
Source: Roskill 2017 Salt Market Report.
Mard
ie T
arg
et
Mark
ets
1000s
GlassConstructionPaper
FoodP
ain
ts
Ceramics
Soaps &
Disinfectants
Water
Treatment1000s of
End Uses
Min
era
l
Oils
Aluminium
& Metals
Text
ile
Dyes
Pharma-
ceuticals
De-ic
ing
28
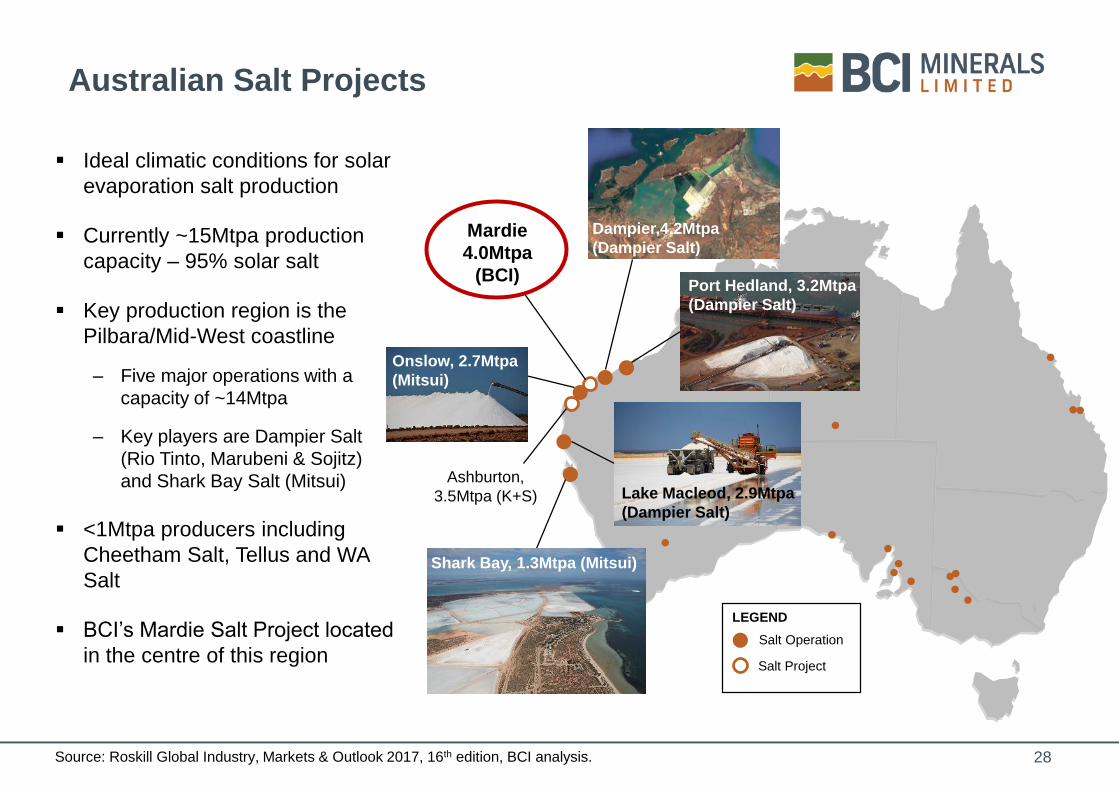
Australian Salt Projects
Source: Roskill Global Industry, Markets & Outlook 2017, 16th edition, BCI analysis.
▪ Ideal climatic conditions for solar
evaporation salt production
▪ Currently ~15Mtpa production
capacity – 95% solar salt
▪ Key production region is the
Pilbara/Mid-West coastline
– Five major operations with a
capacity of ~14Mtpa
– Key players are Dampier Salt
(Rio Tinto, Marubeni & Sojitz)
and Shark Bay Salt (Mitsui)
▪ <1Mtpa producers including
Cheetham Salt, Tellus and WA
Salt
▪ BCI’s Mardie Salt Project located
in the centre of this region
Ashburton,
3.5Mtpa (K+S)
Salt Operation
Salt Project
LEGEND
Shark Bay, 1.3Mtpa (Mitsui)
Lake Macleod, 2.9Mtpa
(Dampier Salt)
Port Hedland, 3.2Mtpa
(Dampier Salt)
Dampier,4.2Mtpa
(Dampier Salt)
Onslow, 2.7Mtpa
(Mitsui)
Mardie
4.0Mtpa
(BCI)

29
WA Salt Operations

30
Mardie Salt Product and Target Markets
Mardie’s salt will be a high-purity product ideal for use in the Asian chemical industry
Target Salt Product Specs
NaCl >99.7%
Ca <0.04%
Mg <0.02%
SO4 <0.12%
▪ Chlor-alkali industry requires high purity salt
▪ High purity salt demand in the Asian chemical
industry forecast to increase from 70Mtpa to
110Mtpa over the next decade
▪ Mardie’s location, climate and evaporation &
processing flowsheet ideal for producing high
purity salt

31
Mardie will target the growing chemical sector in Asia which requires high purity salt
Salt – Supply Deficit by 2027
Source: Roskill, BCI analysis
China
Domestic
45Mt
2017 (Actual)
Asia
155Mt World
325Mt
2027 (Forecast)
High Purity
Asia
70Mt
Seaborne
25Mt
High Purity
Asia
110Mt
China
Domestic
45Mt
Seaborne
45Mt
Supply
Deficit
20Mt
Dem
an
dS
up
ply
Seaborne supply growth mainly
from Australia and India

32
Supply deficit of ~20Mtpa forecast in next decade (~5 Mardie sized projects)
Positive Dynamics in Asian High Purity Salt Market
Increasing demand
for consumer &
industrial products
Urbanisation
reducing Chinese
salt fields
Limited new salt
development
projects
SALT DEMAND DRIVERS
SALT SUPPLY DRIVERS
Increasing Asian
middle class
+ • Price range of US$33/t to US$70/t (CIF) over last decade
• Current market segment value: US$2.8 billion per year
• 2027 market segment value: US$4.5 billion per year
Source: Roskill 2017 Salt Market Report, BCI analysis.
✓ ✓
✓ ✓
40Mtpa
New
Asian
Demand
by 20275Mtpa
15Mtpa
Potential
Salt
Supply
Deficit by
2027
20Mtpa
70Mtpa
Asian
Demand
2017
0
50
125
Mtp
a
New Salt
Projects by
2027 (incl.
Mardie)
Latent
Supply
Capacity
25Mtpa
Seaborne
Supply
2017
45Mtpa
China
Domestic
Supply
2017
25
100
75
33
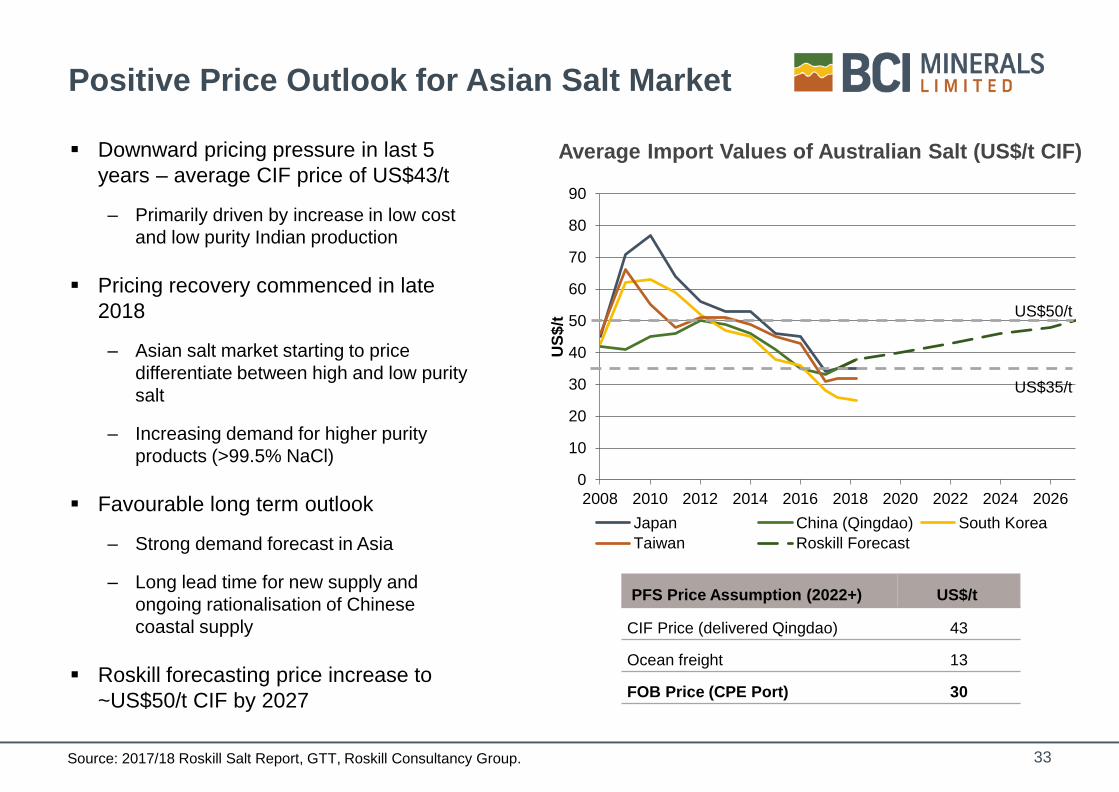
Positive Price Outlook for Asian Salt Market
Source: 2017/18 Roskill Salt Report, GTT, Roskill Consultancy Group.
Average Import Values of Australian Salt (US$/t CIF)
PFS Price Assumption (2022+) US$/t
CIF Price (delivered Qingdao) 43
Ocean freight 13
FOB Price (CPE Port) 30
▪ Downward pricing pressure in last 5
years – average CIF price of US$43/t
– Primarily driven by increase in low cost
and low purity Indian production
▪ Pricing recovery commenced in late
2018
– Asian salt market starting to price
differentiate between high and low purity
salt
– Increasing demand for higher purity
products (>99.5% NaCl)
▪ Favourable long term outlook
– Strong demand forecast in Asia
– Long lead time for new supply and
ongoing rationalisation of Chinese
coastal supply
▪ Roskill forecasting price increase to
~US$50/t CIF by 2027
0
10
20
30
40
50
60
70
80
90
2008 2010 2012 2014 2016 2018 2020 2022 2024 2026
US
$/t
Japan China (Qingdao) South Korea
Taiwan Roskill Forecast
US$50/t
US$35/t
Appendix C:
SOP Information

35
Key Plant Nutrients
▪ Nitrogen – from Urea fertilisers
▪ Phosphorus – from Phosphate
fertilisers
▪ Potassium – from MOP and
SOP
▪ Magnesium and Sulphur – from
Magnesium Sulphate fertiliser
36
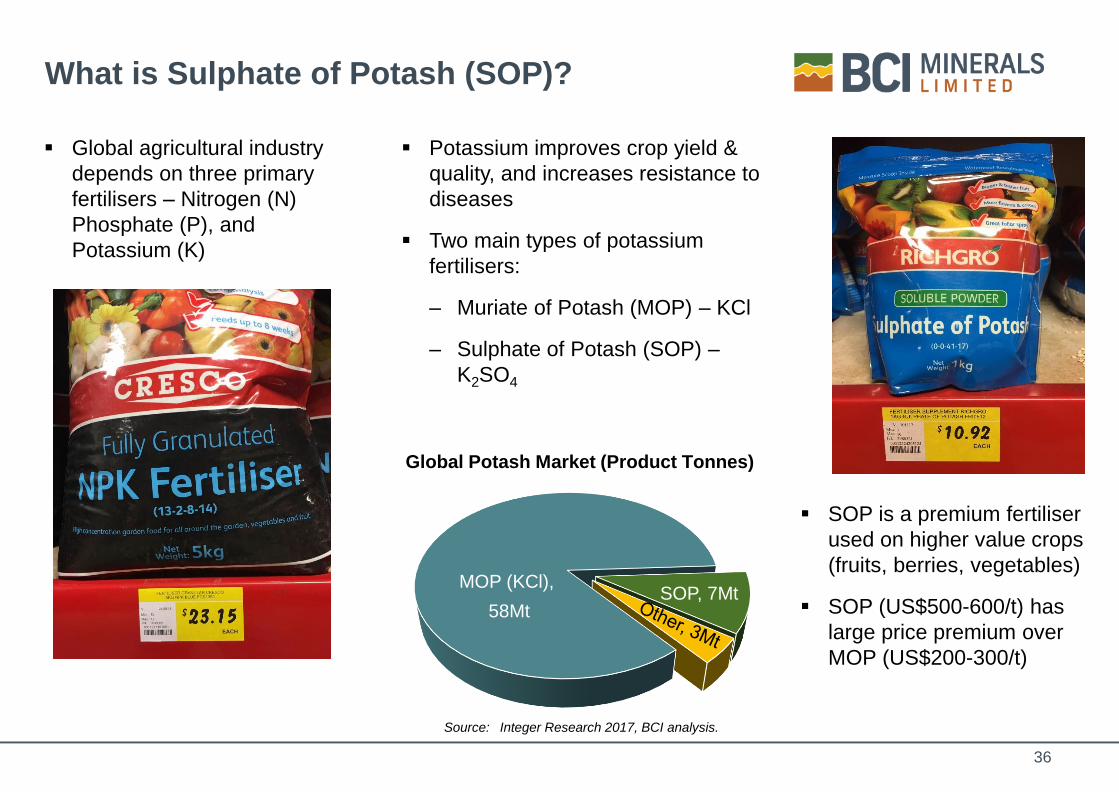
▪ Global agricultural industry
depends on three primary
fertilisers – Nitrogen (N)
Phosphate (P), and
Potassium (K)
What is Sulphate of Potash (SOP)?
▪ SOP is a premium fertiliser
used on higher value crops
(fruits, berries, vegetables)
▪ SOP (US$500-600/t) has
large price premium over
MOP (US$200-300/t)
▪ Potassium improves crop yield &
quality, and increases resistance to
diseases
▪ Two main types of potassium
fertilisers:
– Muriate of Potash (MOP) – KCl
– Sulphate of Potash (SOP) –
K2SO4
MOP (KCl),
58MtSOP, 7Mt
Global Potash Market (Product Tonnes)
Source: Integer Research 2017, BCI analysis.

37
Crop Value Index
For high value crops, a small yield increase from using quality fertiliser (i.e. SOP)
delivers high financial benefits
Cro
p V
alu
e Index
(Cro
p R
evenue / F
ert
iliser
Cost)
Global Harvested Area
High value / low volume
Significant price premium for high quality
+US$1,200/ha from 2% yield increase
Low value / high volume
Limited price premium for quality
Nutrient use efficiency is key
+US$1,200/ha from 50% yield increase

38
Needing more and
better quality food
More food needed from less land…………
Positive SOP Market Dynamics
Australian SOP
projects far inland
Crop yield
increase required
Reducing
arable land
Increasing Asian
middle class
No existing
Australian
production
SOP DEMAND DRIVERS
SOP SUPPLY DRIVERS
• Price range of US$450/t to US$1,000/t over last decade
• Current SOP market value: US$4 billion per year
• Future SOP market value: US$5 billion per year
Source: BCI analysis.
✓
✓
✓
✓
✓ ✓
7Mtpa
SOP
Demand
2017
Likely
New SOP
Projects7Mtpa
SOP
Supply
2017
New SOP
Demand
Potential
SOP Supply
Deficit
+
increases need for premium quality fertilisers

39
SOP Price Forecast
FOB US$/t
5-yr Historical Average 544
5-yr Forecast Average 2018-22 526
5-yr Forecast Average 2023-27 541
BCI Price Assumption (PFS) 500
Source: Integer Research
SOP Price (US$/t FOB Taiwan)
0
100
200
300
400
500
600
700
2013
2014
2015
2016
2017
2018
2019
2020
2021
2022
2023
2024
2025
2026
2027
Price 5-Yr Average Integer Research Forecast
5-Yr Average
(US$544/t)
5-Yr Average
Forecast
5-Yr Average
Forecast
BCI targeting SOP specs of >51% K2O and <1.5% Cl
T +61 8 6311 3400
W www.bciminerals.com.au
Level 1, 15
Rheola St West
Perth WA 6005
GPO Box 2811
West Perth WA 6872
Top Related