


Languages
Pages
Legal

DR. RAJEEV DHAWANDIRECTOR
Post Shutdown: What to Expect?
Presented at the CoreNet Global Summit at MGM Grand Hotel in Las Vegas, Nevada • October 21, 2013
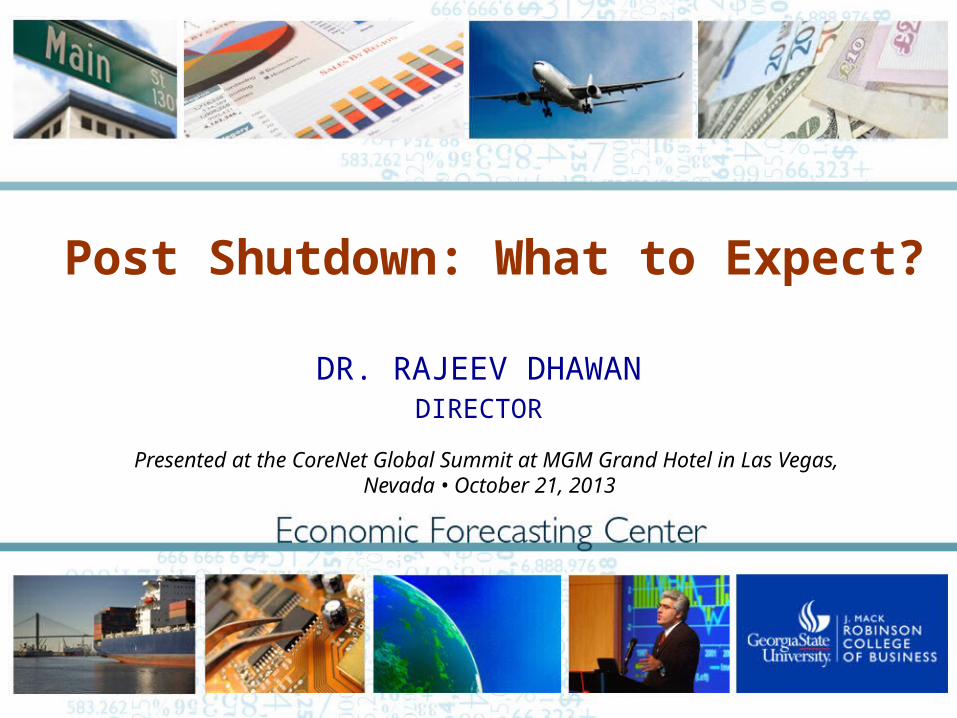
What Do You Do After a Big Battle?

The Fallout
Source: The New York Times – October 17, 2013
John McCainArizona Senator (R)
I knew it was going to end.
I’m trying to forget it.
Lisa MurkowskiAlaska Senator (R)It has been the best two weeks
for the Democratic Party in recent times because they were out of the spotlight and didn’t have to showcase their ideas.
Lindsey GrahamSouth Carolina Senator (R)

The Fallout From the Compromise?
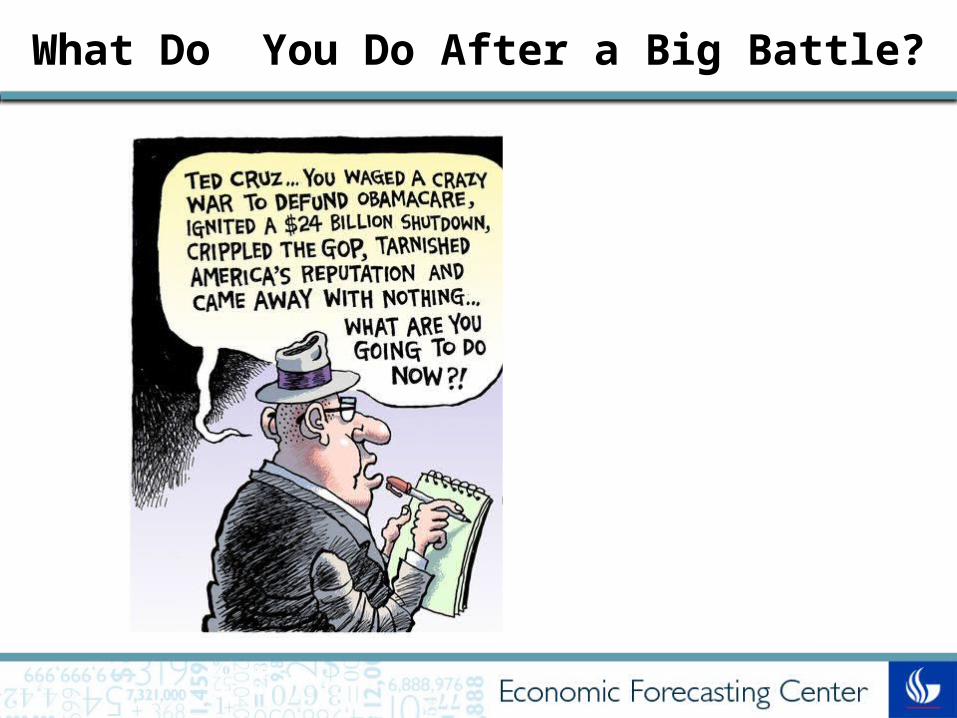
Who Had Seen it Coming?
Source: The New York Times – September 28, 2013
Tom CoburnOklahoma Senator (R)
“The only time you shut down the government is when you shut it down and refuse to open it until you accomplish what you want. We’ll fold like hotcakes.”
“If it has to happen for the American people to get what’s best, defunding Obamacare, so be it. Our credit rating’s going to go down, but it went down before. Did the apocalypse come?Source: The New York Times – October 6, 2013

Source: The New York Times ─ October 20, 2013
How Did the House Vote to End the Shutdown?
IdeologyDistrict Characteristics Vote on Compromise
Median Income
Average District Size (sq. miles) Yes No
Democratic Core 55K <1000 192 0
Defund Democrat 57K 2000+ 8 0
Republican Moderates 61K 2000+ 19 1
G.O.P. Leadership 58K 3500+ 32 12
Defund Moderates 50K 6000+ 17 44
Tea Party Affiliates 56K 3500+ 10 16
Shutdown Strategy 52K 6000+ 5 33
Tea Party Core 52K 4500+ 4 38

How Will the Congress Behave in Future?
Groundhog Day Growth Prospects

1. How are the financial and labor markets impacted by this political dysfunction?
2. What does dysfunction do to key economic drivers: vehicle sales, housing starts and corporate confidence?
3. What happens to long-bond yields that then impact the housing market?
4. How’s the release valve aka ROW especially China and emerging markets doing?
Roadmap to Analysis

D.C. Discord and World Image We suffer from a huge image problem. From being world powerhouse No.1 military-wise, but also business-wise we are now a patient who suffers from various diseases, with doctors who can’t really treat him. Because…they debate whether he is sick or dead.
Martin RichenhagenAGCO Chairman & CEO
Source: The Atlanta Journal-Constitution – October 20, 2013
I was in the (U.K.) two week ago and it was the first week of the government being closed. I was talking to an individual. Tongue in cheek, this is what the person said: “Is this really what the leaders of the free world do?”
Marty FlanaganInvesco President & CEO
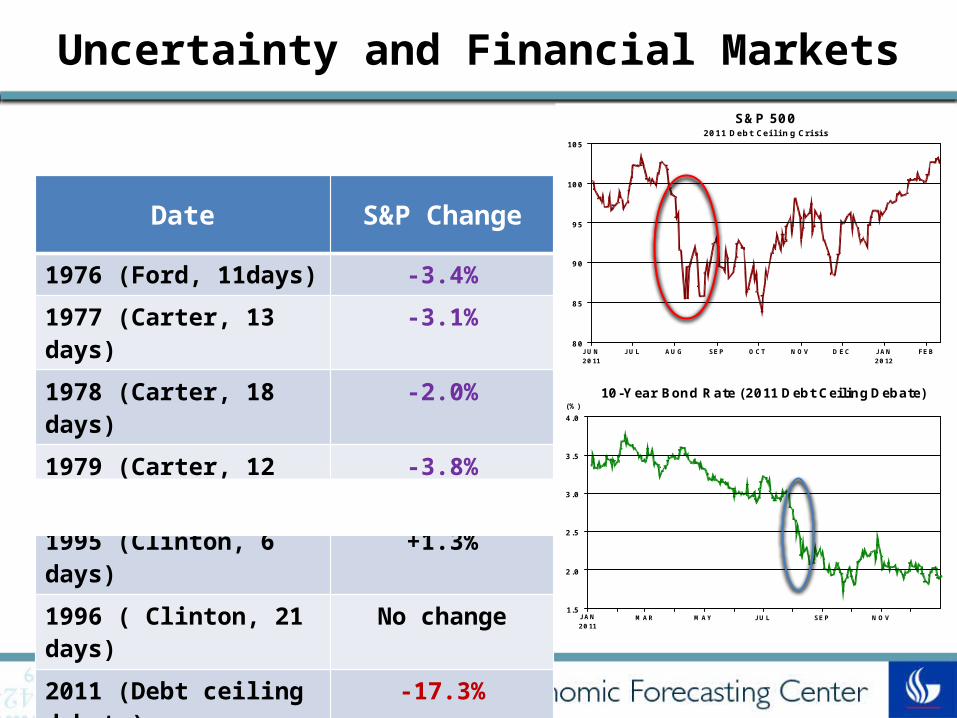
Uncertainty and Financial Markets
FEBJANDECNOVOCTSEPAUGJULJUN20122011
105
100
95
90
85
80
S&P 5002011 Debt Ceiling Crisis
Date S&P Change
1976 (Ford, 11days) -3.4%
1977 (Carter, 13 days) -3.1%
1978 (Carter, 18 days) -2.0%
1979 (Carter, 12 days) -3.8%
1995 (Clinton, 6 days) +1.3%
1996 ( Clinton, 21 days) No change
2011 (Debt ceiling debate) -17.3%
NOVSEPJULMAYMARJAN2011
4.0
3.5
3.0
2.5
2.0
1.5
(%)10-Year Bond Rate (2011 Debt Ceiling Debate)
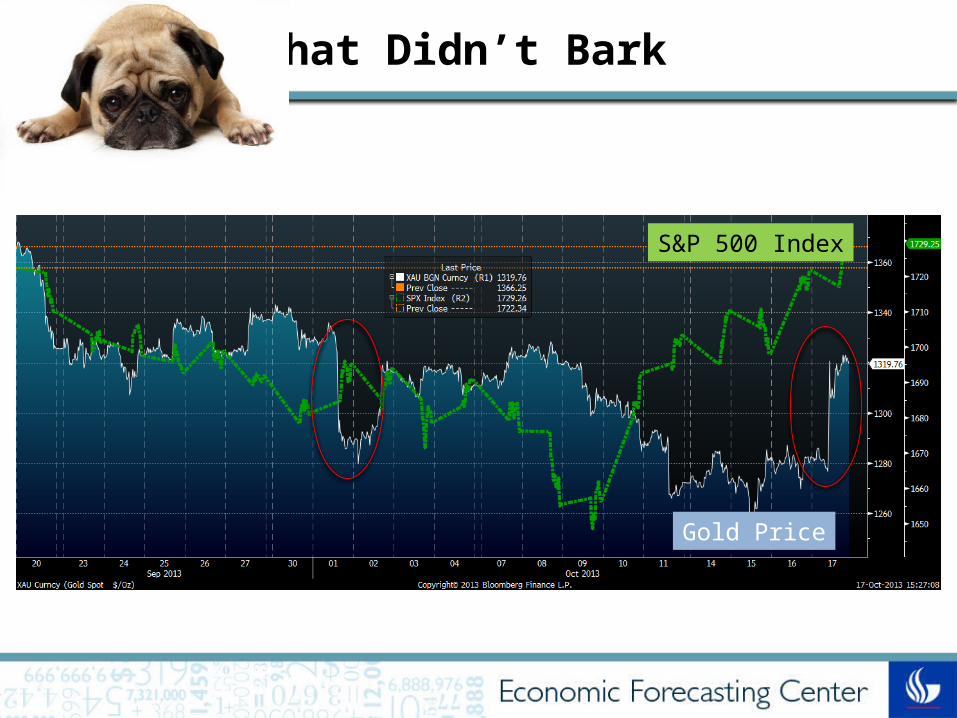
The Dog That Didn’t Bark
Gold Price
S&P 500 Index

The Cat That Meowed
1 Month T-Bill Rate
3 Month T-Bill Rate
6 Month T-Bill Rate
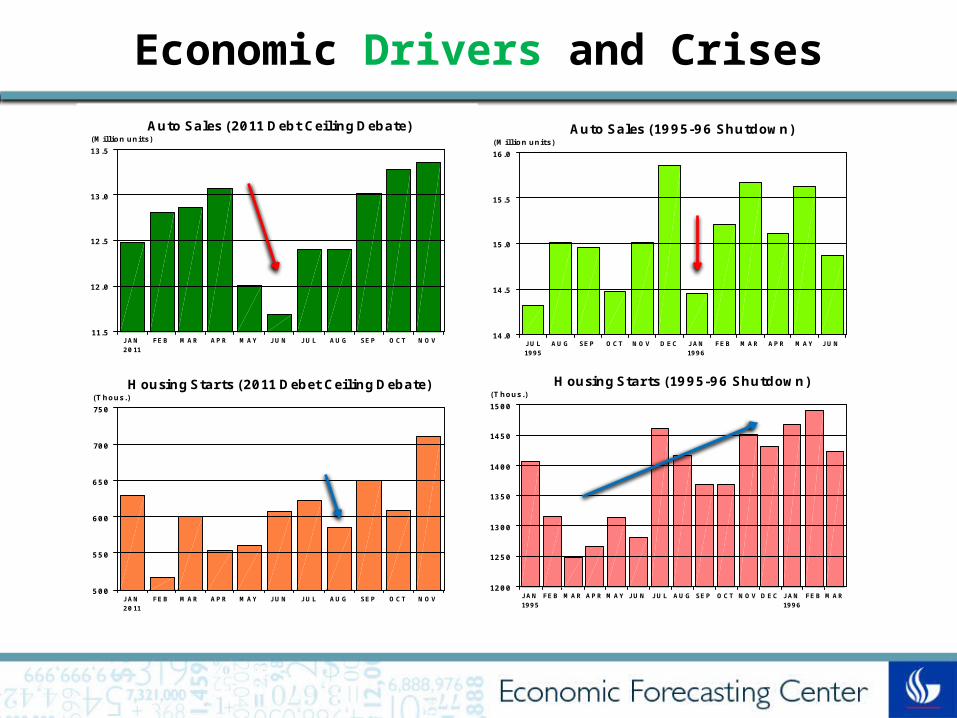
Economic Drivers and Crises
JUNMAYAPRMARFEBJANDECNOVOCTSEPAUGJUL19961995
16.0
15.5
15.0
14.5
14.0
(Million units)Auto Sales (1995-96 Shutdown)
NOVOCTSEPAUGJULJUNMAYAPRMARFEBJAN2011
13.5
13.0
12.5
12.0
11.5
(Million units)Auto Sales (2011 Debt Ceiling Debate)
NOVOCTSEPAUGJULJUNMAYAPRMARFEBJAN2011
750
700
650
600
550
500
(Thous.)Housing Starts (2011 Debet Ceiling Debate)
MARFEBJANDECNOVOCTSEPAUGJULJUNMAYAPRMARFEBJAN19961995
1500
1450
1400
1350
1300
1250
1200
(Thous.)Housing Starts (1995-96 Shutdown)
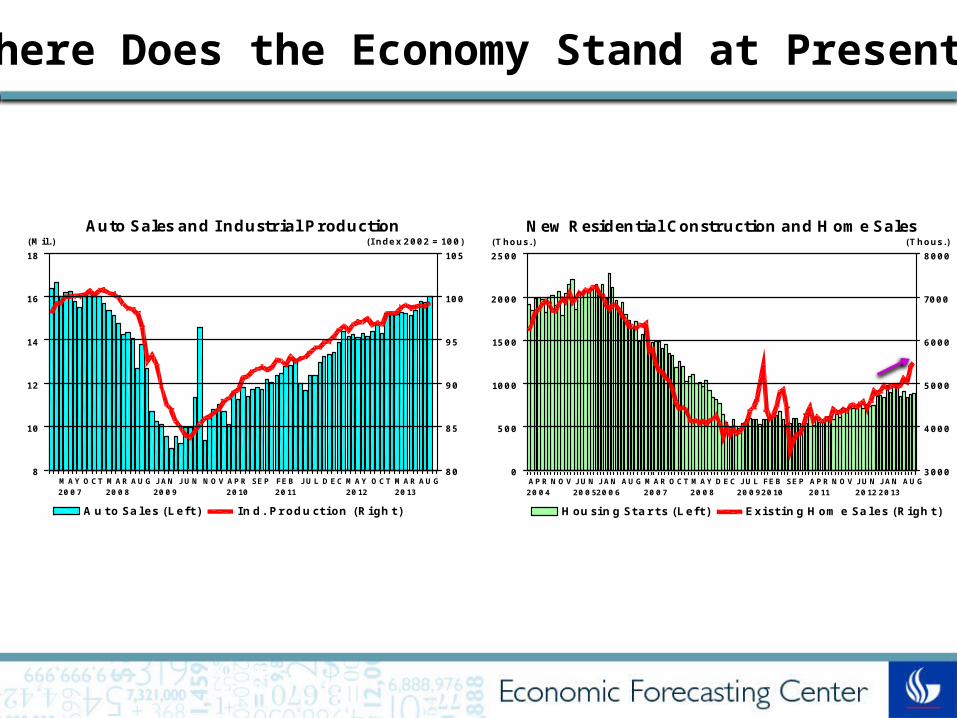
AUGJANJUNNOVAPRSEPFEBJULDECMAYOCTMARAUGJANJUNNOVAPR2013201220112010200920082007200620052004
2500
2000
1500
1000
500
0
8000
7000
6000
5000
4000
3000
(Thous.) (Thous.)New Residential Construction and Home Sales
Housing Starts (Left) Existing Home Sales (Right)
Where Does the Economy Stand at Present?
AUGMAROCTMAYDECJULFEBSEPAPRNOVJUNJANAUGMAROCTMAY2013201220112010200920082007
18
16
14
12
10
8
105
100
95
90
85
80
(Mil.) (Index 2002 = 100)Auto Sales and Industrial Production
Auto Sales (Left) Ind. Production (Right)
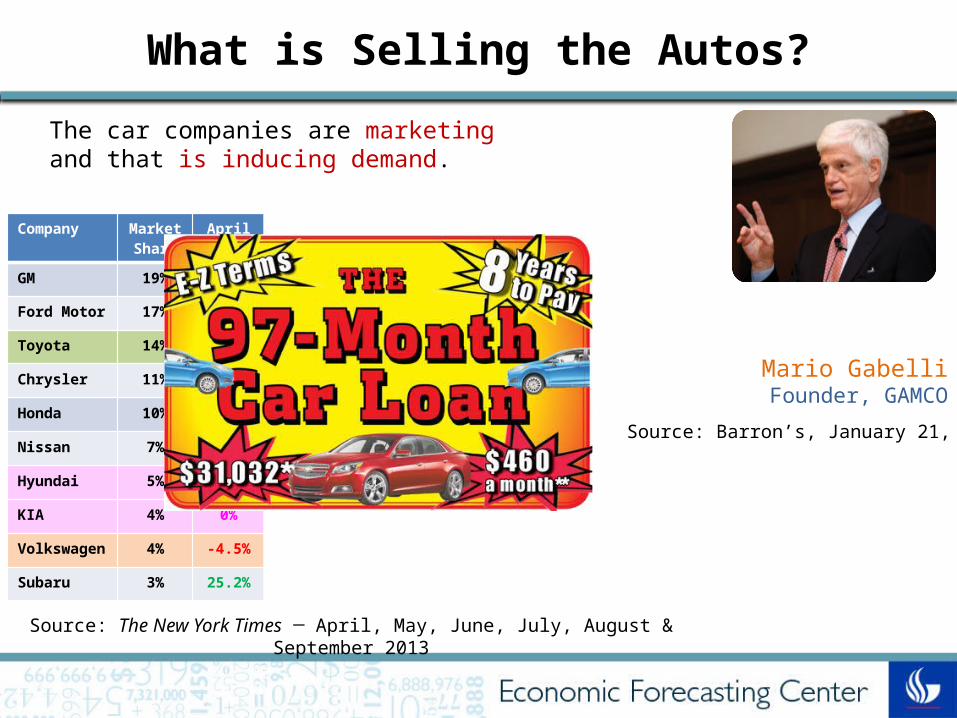
Company Market
Share
April May June July Aug. Sept.
GM 19% 11.4% 3.1% 6.5% 16.3% 14.7% -11.0%
Ford Motor
17% 18.0% 14.1% 13.4% 11.3% 12.0% 5.7%
Toyota 14% -1.1% 2.5% 9.8% 17.3% 22.8% -4.3%
Chrysler 11% 11.0% 11.0% 8.2% 11.1% 11.5% 0.7%
Honda 10% 7.4% 4.5% 9.7% 20.9% 26.7% -9.9%
Nissan 7% 23.2% 24.7% 12.9% 10.9% 22.3% -5.5%
Hyundai 5% 1.7% 2.0% 1.9% 6.4% 8.2% -8.2%
KIA 4% 0% 1.1% -1.5% 1.9% 4.0% 4.0%
Volkswagen
4% -4.5% 2.2% -0.3% 0.3% 3.6% -7.4%
Subaru 3% 25.2% 34.2% 41.6% 42.9% 45.1% 14.7%
What is Selling the Autos?
Source: Barron’s, January 21, 2013
The car companies are marketing and that is inducing demand.
Mario GabelliFounder, GAMCO
Source: The New York Times ─ April, May, June, July, August & September 2013

What is a Housing Multiplier?

Joe Blair and his wife sold their Vail-area home last fall for about $30,000 less than they'd paid for it in 2005. After several months of searching, they paid about $600,000 for a new home in the area in July. Despite trading up to a larger home to accommodate their three young children, the Blairs held on to their old furniture. Their one splurge, Mr. Blair said,
was on new patio furniture he found at Home Depot for 60% off. If not for the sale, Mr. Blair said, "we'd be hitting the garage sales."
Source: The Wall Street Journal– September 26, 2013
The Un-American Consumer?
AUGMAYFEBNOVAUGMAYFEBNOVAUGMAYFEBNOVAUGMAYFEB2013201220112010
6
5
4
3
2
1
0
-1
(% change from a year ago)Electronics, Furniture & Gen. Merchandise stores

AUGMAROCTMAYDECJULFEBSEPAPRNOVJUNJANAUGMAROCTMAYDECJUL20132012201120102009200820072006
8
7
6
5
4
3
2
6
4
2
0
-2
-4
-6
(%, Smoothed) (%, Smoothed)Personal Savings Rate and Consumption
Savings Rate (Left) Consumption Growth (Right)
Income and Consumption Disconnect
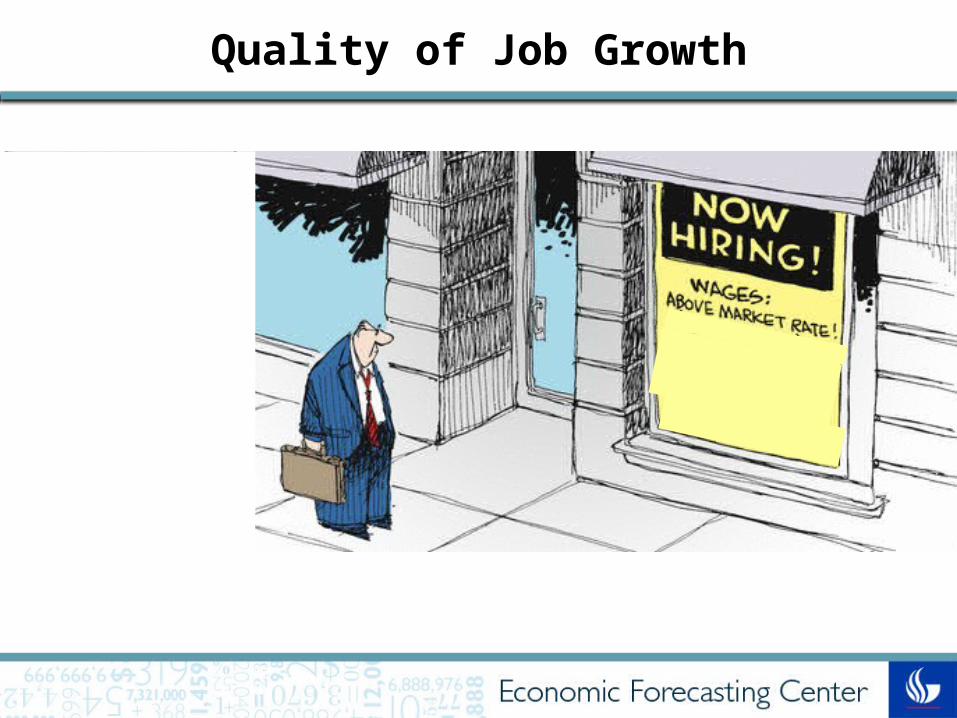
Quality of Job Growth
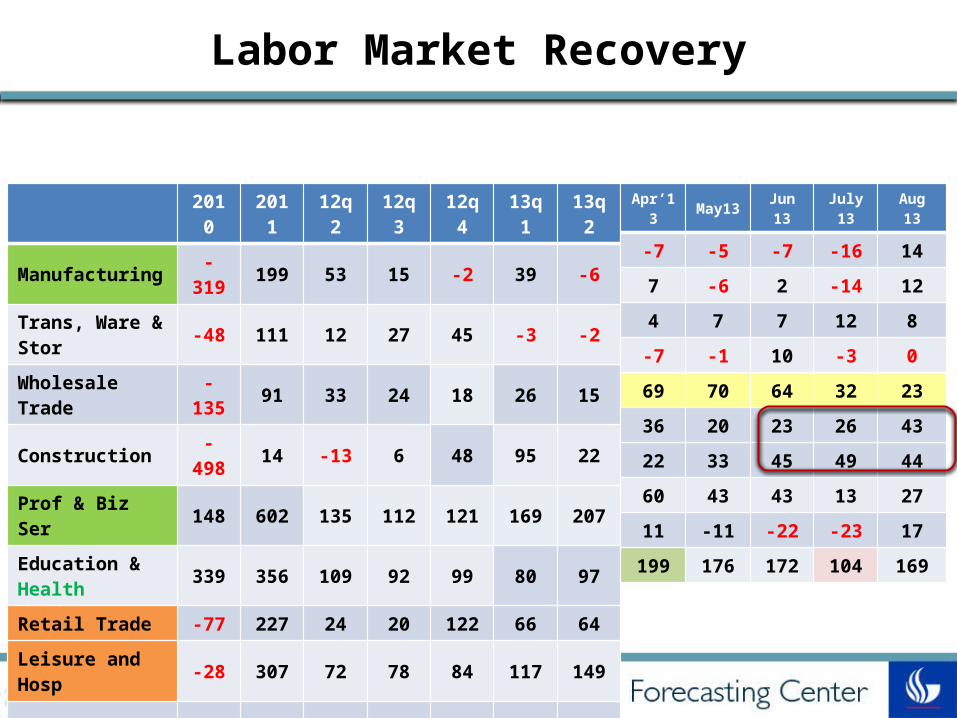
Labor Market Recovery
2010 2011 12q2 12q3 12q4 13q1 13q2Manufacturing -319 199 53 15 -2 39 -6Trans, Ware & Stor -48 111 12 27 45 -3 -2Wholesale Trade -135 91 33 24 18 26 15Construction -498 14 -13 6 48 95 22Prof & Biz Ser 148 602 135 112 121 169 207Education & Health 339 356 109 92 99 80 97Retail Trade -77 227 24 20 122 66 64Leisure and Hosp -28 307 72 78 84 117 149Government -62 -400 -23 2 -40 -18 -3Total Nonfarm -948 1,589 451 409 545 645 584
Apr’13 May13 Jun 13 July 13 Aug 13
-7 -5 -7 -16 147 -6 2 -14 124 7 7 12 8-7 -1 10 -3 069 70 64 32 2336 20 23 26 4322 33 45 49 4460 43 43 13 2711 -11 -22 -23 17
199 176 172 104 169

Uncertainty and Labor Market Recovery
Source: FRBSF Economic Letter ─ July 22, 2013
.. heightened uncertainty about economic policy during the recovery made businesses more reluctant to hire workers. They reduce recruiting efforts by raising hiring standards,…..interview candidates multiple times and end up deciding to postpone hiring altogether.
Sylvain Leduc Zheng Liu
Economists, Federal Reserve Bank of San Francisco
..without policy uncertainty, the unemployment rate in late 2012 would have been close to 6.5%, instead of the reported 7.8%.
20132011200920072005200320011999199719951993199119891987198519831981
7.0
6.5
6.0
5.5
5.0
4.5
4.0
3.5
(%)
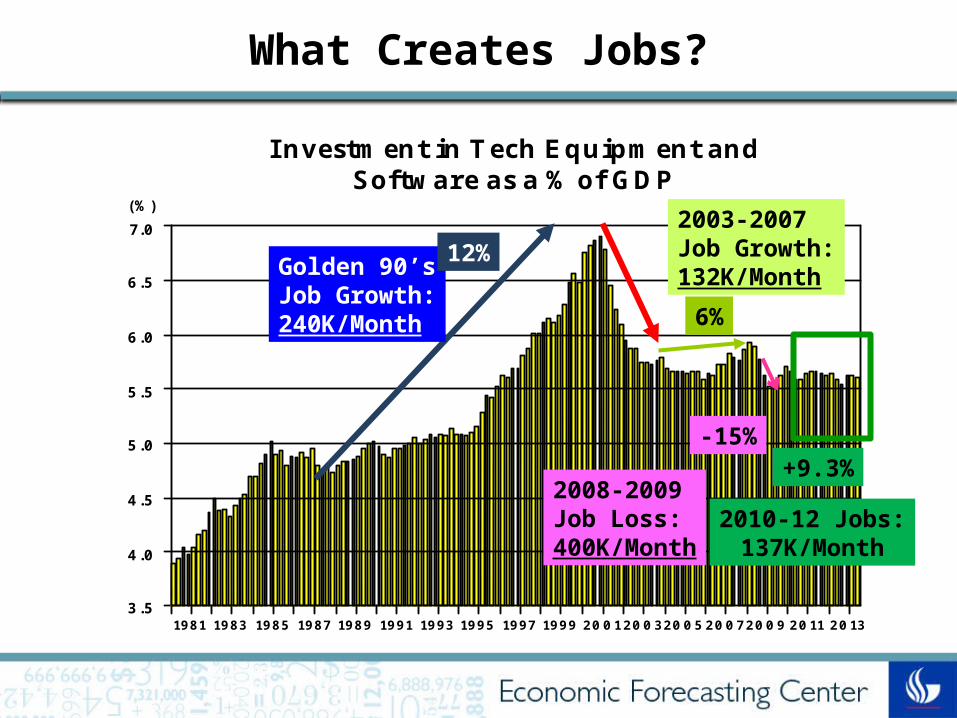
Investment in Tech Equipment andSoftware as a % of GDP
Golden 90’sJob Growth:240K/Month
2003-2007Job Growth:132K/Month
12%
6%
-15%
2008-2009Job Loss:400K/Month
+9.3%
2010-12 Jobs:137K/Month
What Creates Jobs?

Rajeev Dhawan Professor & DirectorEconomic Forecasting CenterGeorgia State University
Harold Vasquez Research Specialist
Economic Forecasting Center
Georgia State University
Source: U.S. Employment Growth and Tech Investment: A New Link
By Rajeev Dhawan & Harold Vasquez, 2010
The improvements in CEO’s perceptions about the future increases TECH investment spending. TECH investment significantly increases employment growth via durable goods ORDERS channel.
Employment growth
(Job additions)
CEO:1% CEO 0.034% TECH1% CEO 0.11% ORDERS
TECH: 1% TECH 0.059% EMP:
ORDERS:1% ORDERS 0.45% TECH
Job Growth and Tech Investment

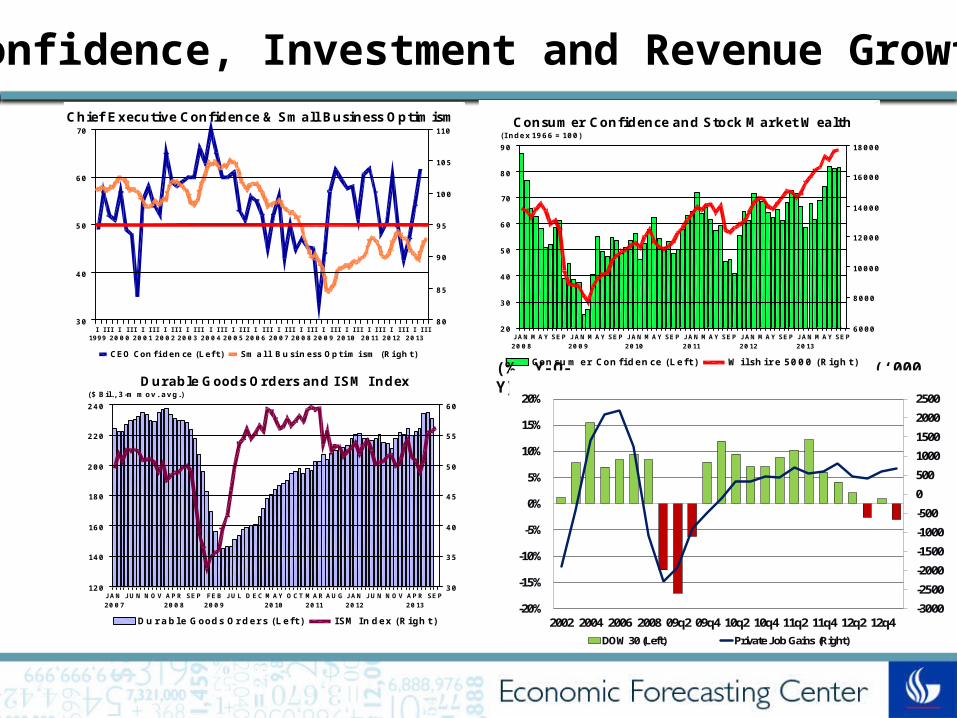
Confidence, Investment and Revenue Growth
IIIIIIIIIIIIIIIIIIIIIIIIIIIIIIIIIIIIIIIIIIIIIIIIIIIIIIIIIIII201320122011201020092008200720062005200420032002200120001999
70
60
50
40
30
110
105
100
95
90
85
80
Chief Executive Confidence & Small Business Optimism
CEO Confidence (Left) Small Business Optimism (Right)SEPMAYJANSEPMAYJANSEPMAYJANSEPMAYJANSEPMAYJANSEPMAYJAN
201320122011201020092008
90
80
70
60
50
40
30
20
18000
16000
14000
12000
10000
8000
6000
(Index 1966 = 100)Consumer Confidence and Stock Market Wealth
Consumer Confidence (Left) Wilshire 5000 (Right)

Economic Drivers and Crises
DECOCTAUGJUNAPRFEBDECOCTAUGJUNAPRFEB20122011
75
70
65
60
55
50
45
40
35
(Index: 1966 = 100)Consumer Confidence (2011 Debt Ceiling Debate)
IIIIIIIVIIIIIIIVIIIIIIIVIIIIIIIVIIIIIIIVIIIIII201320122011201020092008
65
60
55
50
45
40
35
30
96
94
92
90
88
86
84
82
80
Chief Executive Confidence & Small Business Optimism2011 Debt Ceiling Debate
CEO Confidence (Left) Small Business Optimism (Right)
IVIIIIIIIVIIIIII19961995
54
52
50
48
46
102.5
102.0
101.5
101.0
100.5
100.0
99.5
99.0
98.5
Chief Executive Confidence & Small Business Optimism1995-96 Shutdown
CEO Confidence (Left) Small Business Optimism (Right)
NOVSEPJULMAYMARJANNOVSEPJULMAYMARJAN19961995
115
110
105
100
95
90
85
(Index: 1966 = 100)Consumer Confidence (1995-96 Shutdown)

Corporate Demand is Sending Mixed Signals
Most important to the U.S., enterprise business is up 9% and commercial grew at 12%. Those are good numbers.
John ChambersCisco CEO
But the top five only grew 1%.
Source: USA Today – August 19, 2013
Areas of concern: Asia-Pacific/Japan, which has been our fastest-growing region, actually went down 3%. And emerging markets a quarter ago were growing at 13% for us, (but) they only grew 8% this quarter.
-3000-2500-2000-1500-1000-50005001000150020002500
-20%
-15%
-10%
-5%
0%
5%
10%
15%
20%
2002 2004 2006 2008 09q2 09q4 10q2 10q4 11q2 11q4 12q2 12q4DOW 30 (Left) Private Job Gains (Right)
Confidence, Investment and Revenue Growth
IIIIIIIIIIIIIIIIIIIIIIIIIIIIIIIIIIIIIIIIIIIIIIIIIIIIIIIIIIII201320122011201020092008200720062005200420032002200120001999
70
60
50
40
30
110
105
100
95
90
85
80
Chief Executive Confidence & Small Business Optimism
CEO Confidence (Left) Small Business Optimism (Right)SEPMAYJANSEPMAYJANSEPMAYJANSEPMAYJANSEPMAYJANSEPMAYJAN
201320122011201020092008
90
80
70
60
50
40
30
20
18000
16000
14000
12000
10000
8000
6000
(Index 1966 = 100)Consumer Confidence and Stock Market Wealth
Consumer Confidence (Left) Wilshire 5000 (Right)
Dow30 Revenue Growth and Job Gains(‘000 Jobs)(%, Y-O-Y)
Q1 Growth -3.0%
SEPAPRNOVJUNJANAUGMAROCTMAYDECJULFEBSEPAPRNOVJUNJAN2013201220112010200920082007
240
220
200
180
160
140
120
60
55
50
45
40
35
30
($ Bil., 3-m mov. avg.)Durable Goods Orders and ISM Index
Durable Goods Orders (Left) ISM Index (Right)

Corporate Revenues
(%, Y-O-Y)
Global in Reach(%, Y-O-Y)
Domestic in Scope

Richer North Europe Poorer South Europe
Don’t Judge a Book by its Cover

Top Exporters Exports (billions Euros)France 89.6United States 65.6Netherlands 63.0United Kingdom 58.7Italy 58.6China 53.8Austria 52.2Belgium 45.0Switzerland 41.7Poland 37.7Spain 34.2Czech Republic 26.7Russia 26.3Sweden 19.4Turkey 16.2
Top Importers Imports (billions Euros)China 77.2Netherlands 67.2France 60.7United States 45.2Italy 42.0United Kingdom 37.9Belgium 33.3Austria 33.0Switzerland 32.5Russia 31.8Czech Republic 28.7Poland 27.6Japan 22.5Spain 22.0Norway 17.2
Germany’s Top Trading Partners in 2010
Source: German Federal Statistical Office

Source: The Wall Street Journal ─ April 10 &11, 2013
Who is Europe’s Poorest?
CountryMedian
Household Wealth (000’s)
Homeownership Rates
(%)
Small-Business Ownership Rates (%)
Debt to GDP Ratio
2008 2013(f)
Cyprus 267 77 20 63 93*
Spain 183 83 14 41 96
Italy 174 69 18 105 128
France 116 55 9 66 93
Greece 102 72 10 108 176
Austria 76 48 9 - -
Portugal 75 72 8 68 124
Germany 51 44 9 67 81

Stanley Fischer on China’s Importance
Stanley FischerFormer Bank of Israel Governor
Source: Business Week Bloomberg − August 22, 2013
The Chinese economy of today is twice the size it was 10 years ago.
When its growth declines to 7 percent, 7.5, it’s adding more to global demand than it did when it was growing at 10 percent 10 years ago, because 7.5 percent of a big pie has been growing. So it’s still a very, very important contributor.
Country(In order by GDP)
% of Exports to CHINA
Japan 19.7
Brazil 17.0
Australia 29.4
South Korea 24.4
Iran 21.4
Taiwan 28.1
South Africa 12.7
Thailand 12.0
Malaysia 13.1
Source: Time – June 17, 2013
OCTSEPAUGJULJUNMAYAPRMARFEBJANDECNOVOCT20132012
25
20
15
10
5
0
-5
-10
(%)
CurrenciesPercentage change since October 2012
Australian Dollar
Malaysian Ringgit
Dollar Appreciating
Dollar Depreciating
Brazilian Real

Why the Fed Did Not Taper?
I don’t recall stating that we would do any particular thing in this meeting.
Ben BernankeChairman, Federal Reserve
We can’t let market expectations dictate our policy actions.
201320122011201020092008
1.20
1.00
0.80
0.60
0.40
Dow 30
QE2QE1 QE3
Source: The New York Times ─ September 28, 2013

China
India
Japan
S. Korea
Hong Kong
Brazil
Mexico
Germany
UK
US
-30% -20% -10% 0% 10% 20% 30% 40% 50% 60%
Since June 24May 22-June 24Jan-May 22
Global Stock Markets at a Glance


Source: Beyond.com survey of 6,361 job seekers and veteran HR professionals in April and May
The Great DivideHow Millennials see themselves in the
workplace and how they’re seen:
Themselves
65%
35%
82%
14%
86%
People-savvy
Tech-savvy
Loyalty
Fun-loving
Hard working
HR Opinion
14%
86%
1%
39%
11%20132012201120102009200820072006200520042003200220012000
90
80
70
60
50
40
30
(%)U.S. Labor-Force Participation Rate
16 to 24
55 and older
25 to 54

Job Growth to Reach 7% Rate by End of 2013?
Scenario A: Labor Force PR is 63.4%
Source: Federal Reserve Bank of Atlanta Website: Jobs Calculator, August 2013
Scenario B: Labor Force PR is 62.4%

SEPAUGJULJUNMAYAPRMARFEBJANDECNOVOCTSEPAUGJUL20132012
115
110
105
100
95
90
85
80
($/bbl)Crude Oil
Are Oil Prices Rising or Falling?
May-11 Sep-11 Jan-12 May-12 Sep-12 Jan-13 May-13 Sep-1370
80
90
100
110
120
130
Crude Oil PriceWTI LLSBrent
$/Bbl$/Bbl

GDP (%)
Cons. (%)
10-Year rate (%)
Invest.(%)
ΔI(bil.)
Govt.(%)
Vehicle Sales(mil.)
Housing Starts (mil.)
Jobs (‘000/m)
13 IV 1.0 1.3 2.9 2.1 57.6 -2.0 15.3 0.825 105‘14 I 1.7 2.0 3.2 3.7 36.7 -0.8 14.7 0.936 155
II 1.5 1.8 3.3 2.6 20.0 -0.9 14.6 0.899 104III 1.6 1.7 3.6 2.0 17.4 -0.9 14.5 0.928 83IV 1.8 1.6 4.2 1.2 18.5 -1.6 14.5 0.896 63
15 I 2.4 1.9 3.8 3.8 23.6 -0.4 14.5 0.990 124II 2.6 2.1 3.9 4.2 35.9 -1.4 14.5 1.022 155
III 3.0 2.4 4.0 5.0 43.5 -1.4 14.6 1.146 188IV 3.2 2.4 4.1 6.2 53.1 -1.1 14.8 1.253 206
Future Growth Prospects (Base Scenario)
2014 annual GDP growth is
only 1.6%

Home Price Recovery
20132012201120102009200820072006200520042003
100
80
60
40
20
0
-20
-40
(%)Home Price Change Since 2003: NORTHWEST
San Francisco
Los Angeles
Portland
Seattle
20132012201120102009200820072006200520042003
30
20
10
0
-10
-20
-30
-40
Home Price Change Since 2003: SOUTHEASTCharlotte
Denver
Atlanta
Dallas

Source: Zillow.com– August, 2013
Home Price Appreciation
2012 2013 2014 2015 2016 201770
80
90
100
110
120
130
140
150
MedianHighLowEFC
Year Growth
2013 15.0%
2014 2.0%
2015 5.5%
2016 12.0%
2017 4.0%
EFC Aug. 13 Forecast
Year Growth
2013 12.5%
2014 -1.0%
2015 2.5%
2016 15.0%
2017 4.0%
EFC Oct. 13 Forecast

1. Repeated budget/debt-ceiling negotiations can affect foreign lenders confidence in our treasury bonds that can also wreck the stock market, thereby tanking both corporate and consumer confidence.
2. China fails to jumpstart its growth making recovery prospects for emerging economies dim.
3. Mideast erupts in flames (Syria/Iran) that causes Brent crude price to touch $150/barrel.
4. Federal Reserve botches tapering in 2015 i.e. it is too quick, causing mortgage rates to shoot to 7.0% which abruptly cools the housing market (prices, resales & starts).
5. Emerging Food price inflation (oil prices are still too high) in developing countries causes them to do populist actions.
Threats to Growth in 2014 and Beyond

20 years ago we had Johnny Cash, Bob Hope and Steve Jobs. Now we have no Cash, no Hope and no Jobs.
Please, don’t let Kevin Bacon die.
Bill Murray Warns…

Special Thanks to the Center’s
Carl R. Zwerner Chair of Family
Owned Businesses
Executive Sponsors
Sponsors
Top Related