


Languages
Pages
Legal

Staten Island Chamber of Commercein
partnershipwith
Commercial District Needs Assessment
DOWNTOWNSTATEN ISLAND
Background
Located on the New York Harbor Downtown Staten Island is home to a variety of civic cultural and transportation amenities and is the gateway to the borough Downtown Staten Island consists of several distinct towns that are linked by the Bay Street corridor which follows the northeast coastline of Staten Island The Bay Street commercial corridor is anchored at the north by the Staten Island Ferry Terminal at Richmond Terrace and runs south to Townsend Avenue through the neighborhoods of St George Tompkinsville and Stapleton
St George the area surrounding the Staten Island Ferry Terminal is Staten Islandrsquos civic center with courthouses and municipal offices serving as the centerpieces of the neighborhood St George also offers a wide array of cultural and entertainment options for Staten Islanders and visitors including the home of the Staten Island Yankees the St George Theatre and the Staten Island Museum Bay Street acts as St Georgersquos central boulevard with multiple traffic lanes and landscaped street medians Because of the topography of St George residential and commercial buildings that are located upland allow for sweeping views of the Staten Island waterfront and New York harbor from Bay Street
Tompkinsville which abuts St George to the south was once the home of a Naval Frontier Base and to this day maintains a charming commercial node at Tompkinsville Park where Bay Street meets Victory Boulevard Tompkinsville is demographically and culturally diverse with an eclectic mix of cuisines art and entertainment venues making it a prime location for the ongoing revitalization of vacant lots and shops that front Bay Street
Stapleton which adjoins Tompkinsville to the south surrounds one of the boroughrsquos oldest parks Tappen Park giving it a distinctive ldquovillage centerrdquo feel Once one of Staten Islandrsquos foremost shopping areas Stapletonrsquos building stock consists primarily of low-rise mixed-use buildings with ground floor retail To this day these attributes continue to make Stapleton a traditionally-scaled walkable shopping district that is both accessible to a changing waterfront and home to a growing blend of vibrant ldquomom amp poprdquo shops and multicultural cuisines
Neighborhood Demographics
Downtown Staten Island is demographically and socioeconomically diverse with approximately 25700 residents The arearsquos foreign-born population is 28 which is higher than Staten Island as a whole (21) Tompkinsville is home to one of the largest Sri Lankan communities in the United States and also has a significant African community Downtown Staten Islandrsquos cultural diversity can be seen in the unique and vibrant restaurants and shops on and around Bay Street
Future Opportunities
With 70000 daily passengers riding the Staten Island Ferry Downtown Staten Island is the gateway to Staten Island for both visitors and residents Recently more than $1 billion has been invested in major development projects throughout Downtown Staten Island including the New York Wheel and Empire Outlets and these projects will further position Bay Street as the civic business and cultural hub for Staten Island Despite a high 21 retail vacancy rate and the need for commercial revitalization projects both long-standing small businesses and new businesses on Bay Street are positioned to leverage these new community investments and serve a growing population in the years to come
ABOUT DOWNTOWN STATEN ISLAND
The Neighborhood 360deg program was created by the NYC Department of Small Business Services to identify develop and launch commercial revitalization projects in partnership with local stakeholders Through proactive planning and targeted investments Neighborhood 360deg supports projects that strengthen and revitalize the streets small businesses and community-based organizations that anchor New York City neighborhoods
The Neighborhood 360deg Commercial District Needs Assessment (CDNA) highlights a neighborhoodrsquos existing business landscape and consumer characteristics
This CDNA features the Bay Street commercial corridor in Downtown Staten Island and was conducted in partnership with the Staten Island Chamber of Commerce between November 2015 and March 2016
Key issues and opportunities identified through this assessment will help prioritize SBS-supported local investments and serve as an informational and marketing resource for the neighborhood
In This Report
Existing conditions business data and qualitative depictions of the neighborhood were gathered from more than 235 surveys and 20 stakeholder meetings with neighborhood merchants shoppers workers property owners and residents
Jump to
Key FindingsBusiness InventoryWhat Merchants SayBusiness Outlook What Shoppers SayPhysical EnvironmentData Appendix
4-56
7-89
1011
12-15
See more on page 13
See more on page 5
2 Neighborhood 360deg Commercial District Needs Assessment
NEIGHBORHOOD CONTEXT
Downtown Staten Island
Neighborhood Events
Staten Island Chamber of Commerce
North Shore Business Association
Staten Island Downtown Alliance
Historic Tappen Park Community Partnership
Staten Island Economic Development Corporation
North Shore Restaurant Crawl
Staten Island Arts LUMEN Festival
Illuminate Stapleton
Celebrate Stapleton
St George Day Festival
Staten Island Black Heritage Family Day
Merchant amp Business Groups
Current amp Planned Developments
Staten Island Yankees
Staten Island ArtsCulture Lounge
Staten IslandMuseum
St George Theatre
National Lighthouse Museum
Flagship Brewery
5050 Skatepark
4
2
NYC Business Solutions CenterWorkforce1 Career Center
Borough Hall
St George Library
StapletonLibrary
1
3
Launchpads amp CSI Tech IncubatorOffice at 76 Bay
SIEDC North Shore Incubator
Techbox
Staten Island ArtistBuilding Corporation
Regus(2019)
Staten IslandMakerSpace
Empire Outlets
New York Wheel
Lighthouse Point
Urby
5
6
7
8
Staten Island Ferry Terminal
VICTORY BLVD
JERS
EY S
T
HO
WA
RD
AV
ST P
AU
LS A
V
FRO
NT ST
RICHMOND TER
BROAD ST
BA
Y ST
CEBRA AV
CORSON AV
CANAL ST
BEACH ST
HANNAH ST
WRIGHT ST
WAVE ST
BA
Y ST
LD
CLINTON ST
HYATT ST
BAY STTAR
GEE
ST
TOM
PKINS AV
VANDERBILT AV
TOWNSEND AV
TappenPark
StapletonPlayground
New Stapleton Waterfront Park
Lyons PoolRecreation Center
Tompkinsville Park
0 02 0401 Miles
St George
Tompkinsville
Stapleton
Clifton
Notable Places
Points of Interest
Bay Street Corridor
Staten Island Railway Stations
Public Facilities
Current amp Planned Developments
Incubators amp Co-Working Spaces
Arts amp Entertainment
5
2
3 4
Staten Island Borough Hall
Staten Island MakerSpace
New York Wheel
Lighthouse Point
St George Theatre
Empire Outlets
Urby
National Lighthouse Museum
1
6
7 8
3Downtown Staten Island
Strengths Prominent waterfront location with expanded public access
points and views of New York Harbor
Multi-modal transportation hub including the Staten Island Ferry with 70000 daily passengers and the Staten Island Railway with 7300+ weekday passengers
Historic heart of Staten Island with unique town centers
Many long-standing small businesses and relatively affordable commercial spaces
Civic center of Staten Island with significant daytime worker population
Diverse ethnic and cultural communities
Growing concentration of co-working and incubator spaces that foster entrepreneurship
Staten Islandrsquos center for arts entertainment and creative activities
Numerous active neighborhood and small business organizations
Challenges High storefront vacancy rate along the corridor (21)
Vacant lots are noticeable eyesores that break up the continuity of the corridor
Litter and sidewalk cleanliness are visible issues throughout Bay Street
Staten Island Railway stations have poor lighting and uninviting entrances
Local parks and other public spaces are underutilized
Poor perception of neighborhood safety especially at night
High proportion of storefronts are in need of physical improvements
Inadequate wayfinding signage prevents visitors from exploring beyond the ferry terminal
Staten Island Arts LUMEN Festival St George mural
Tompkinsville Illuminate Stapleton
KEY FINDINGS amp OPPORTUNITIES
Neighborhood 360deg Commercial District Needs Assessment4
Downtown Staten Island
Opportunities Leverage significant local demand for new retail
goods and services by filling vacant storefronts
Market Downtown Staten Island as a home for a broad mix of retail offerings and as a destination for entertainment cultural and creative activities
Clean beautify and maintain streets and sidewalks along Bay Street
Encourage community connections between upland communities Bay Street and the waterfront
Promote shop amp buy local campaigns to better connect new developments with existing small businesses
Connect local entrepreneurs and merchants to business support services
Make Bay Street more welcoming and vibrant during the day and night by activating vacant spaces and revitalizing local public spaces including Tappen Parkrsquos Village Hall
Enhance accessibility and character of Staten Island Railway stations in Tompkinsville and Stapleton
Improve storefront conditions along Bay Street
Build capacity of community-based organizations that serve Downtown Staten Island
Staten Island Black Heritage Family Day 5050 Skatepark
Stapleton San Rasa Sri Lankan Restaurant
Whatrsquos NextTo address these key findings and opportunities Neighborhood 360deg Grants will be made available by SBS to not-for-profit organizations
For more information visit nycgovneighborhood360
5
21Storefront Vacancy
232Total Number of Storefronts
BUSINESS LANDSCAPE BAY STREET
Business Inventory
Storefront amp Retail Mix
Flagship Brewery Harley-Davidson of Staten IslandWestern Beef
2
1
1
3
4
4
5
5
6
6
67
8
8
10
11
13
16
16
17
35
48
Hotels
Cash Advance amp Money Transfer Services
Gym amp Recreation
Gas Stations
Dry Cleaning amp Laundry Services
Commercial Banks
Other Miscellaneous Store Retailers
Health amp Personal Care Stores
General Merchandise Stores
Clothing amp Jewelry Stores
HVAC Plumbing amp Manufacturing
Medical Services
Houses of Worship
Supermarkets Food amp Liquor Stores
Furniture amp Electronics Stores
Delis Bodegas
Automotive Repair amp Dealers
Public Administration amp Social Services
Professional Services amp Real Estate Offices
Hair Nail amp Beauty Salons
Restaurants amp Bars
Vacant
Bay Street Storefront Vacancy by Neighborhood
St George 24
Tompkinsville 11
Stapleton 24
Business inventory and retail mix data were gathered by the Staten Island Chamber of Commerce through a comprehensive area inventory of storefront businesses located along the Bay Street corridor between Richmond Terrace and Townsend Avenue (November 2015 to March 2016)
Note In 2015 New York Cityrsquos 69 Business Improvement Districts reported an average ground floor vacancy rate of 83 and median ground floor vacancy rate of 56 (SBS BIDs Trends Report 2015)
6 Neighborhood 360deg Commercial District Needs Assessment
What changes need to occur onaround Bay Street to attract more visitorsshoppers
Cleaner streets reduced litter and area beautification
Safety improvements including improved lighting
New stores to provide a better retail mix attract more customers and provide basic neighborhood goods and services
Improved infrastructure
Reduce traffic and improve parking options
Source Based on 67 merchant surveys conducted by the Staten Island Chamber of Commerce in Winter 2016
What Wersquove Heard from Bay Street Merchants
How many years have you been in business here
Do you own or rent your property
67Rent
21Own
12No Response
Over the past year has your business improved stayed the same or decreased
34Improved
42Stayed the Same
3Decreased
21NA or No Responsese
How many employees do you have
0
3
6
9
12
15
21+11-206-103-50-2
2422 21 21
12
Years in Business
Bus
ines
ses
Total Employees
Bus
ines
ses
0
5
10
15
20
16+11-156-103-51-20
10
26
34
14
9 7
What kinds of resources would help you grow your business
Marketing support 34
Financing 22
Space improvements 18
New equipment 10
Other services 16
14Mean
7Median
3Mode
6 businesses surveyed have been in the neighborhood for more than 35 years
Merchant Responses
7Downtown Staten Island
BUSINESS LANDSCAPE BAY STREET
What Wersquove Heard from Bay Street Merchants
ldquoCleaner streets and better securityrdquo
ldquoMore people More storesrdquo
ldquoChange the verbiage on the ferry to draw the people to explore the islandrdquo
ldquoLess traffic and more lighting at night to make people feel saferdquo
ldquoSome of the faccedilades of the buildings could use sprucing uprdquo
ldquoClean the area up Prevent littering Install more trash cans Focus on quality of life issuesrdquo
ldquoBetter street lightingrdquo
ldquoThings to bring people to the areardquo
ldquoParking and good traffic flowrdquo
ldquoMore marketing And give people reasons to come hererdquo
What changes need to occur to bring more people to your shop or use your services
What do you like about the commercial corridor
ldquoAbility to attract quality clientsrdquo
What do businesses need
ldquoOnly real downtown shoppingrdquo
ldquoAccessibility to St George Manhattan and Verrazano Bridgerdquo
ldquoItrsquos neighborhood-ish Walkable Mixture of work and playrdquo
ldquoRents are still reasonable and close to the ferryrdquo
ldquoGood transportation nice peoplerdquo
ldquoThe people in the community are wonderful and diverserdquo
ldquoThe waterfront view and the camaraderie with fellow business ownersrdquo
How is this area different from other shopping districts
ldquoUnique neighborhood poised on the windowsill of the greatest city in the worldrdquo
ldquoItrsquos walkable Itrsquos accessible via public transitrdquo
ldquoThere is a lot of room to growrdquo
ldquoHeart of old Staten Islandrdquo
ldquoBetter infrastructure More bus servicerdquo
ldquoOld world charmrdquo
8 Neighborhood 360deg Commercial District Needs Assessment
$460M
$405M
$228M
$204M
$201M
$143M
$143M
$112M
$91M
$81M
$57M
$52M
$48M
$41M
$32M
$28M
$24M
$24M
$13M
$10M
-$10M
-$27M
$820000
$500000
-$500000
-$580000
Jewelry Luggage amp Leather Goods Stores
Limited-Service Eating Places
Furniture Stores
Drinking Places (Alcoholic Beverages)
Used Merchandise Stores
Book Periodical amp Music Stores
Florists
Special Food Services
Office Supplies Stationery amp Gift Stores
Lawn Garden Equipment amp Supply Stores
Full-Service Restaurants
Beer Wine amp Liquor Stores
Sporting Goods Hobby amp Musical Instrument Stores
Shoe Stores
Home Furnishings Stores
Auto Parts Accessories amp Tire Stores
Specialty Food Stores
Building Material amp Supplies Dealers
Other Miscellaneous Store Retailers
Health amp Personal Care Stores
Other General Merchandise Stores
Electronics amp Appliance Stores
Gasoline Stations
Clothing Stores
Department Stores (Excluding Leased Departments)
Grocery Stores
BUSINESS OUTLOOK
Retail Leakage amp Surplus
Local businesses make
$2900Meach year in retail sales
Every year
$2982Mis spent outside
the neighborhood
Residents spend
$5882Meach year in
goods and services
Retail leakage and surplus is the difference between estimated spending by local residents on retail goods and estimated sales by local retail businesses Retail leakage occurs when consumer demand exceeds retail supply in a designated trade area On the chart a positive value indicates leakage of retail sales and represents net consumer spending that is being captured by retailers outside of the trade area Retail surplus occurs when retail supply exceeds consumer demand in a designated trade area On the chart a negative value indicates a surplus of retail sales and may signify a market where retailers are drawing customers from outside the trade area
LeakageSurplus $0
Downtown Staten Island Retail Opportunity
Source ESRI and Infogroup August 2016 does not include projected expenditures from Empire Outlets or other current and planned developments
9Downtown Staten Island
Downtown Staten Island Staten Island NYC
109 22 29Downtown Staten Island Staten Island NYC
171 93 105
$0
$1ndash$10
$11ndash$25
$26ndash$50
$51ndash$99
$100
Car
Walk
Bus
Bike
Staten Island Railway
Taxi
49
28
18
2
2
1
How do you usually travel to get to Bay Street
What additional types of businesses would you like to see on Bay Street
Healthy food options fresh produce specialty food stores bakery
Restaurants coffee shop cafeacute
Clothing shoe stores
Familykid-friendly activities and businesses
Arts entertainment movie theater
Business Trends
How much do you typically spend when shopping on Bay Street
How often do you visit Bay Street to go shopping
What Wersquove Heard from Shoppers
Daily
2 to 4 times a week
Once a week
Twice a month
Once a month
3 to 6 times a year
Not regularly
Never
13
5
13
36
13
20
9
31
18
13
8
2
18
1
Source Based on 168 consumer surveys conducted by the Staten Island Chamber of Commerce in Winter 2016
Source Division of Tax Policy NYC Department of Finance
BUSINESS OUTLOOK
Change in Total Business Sales 2008-2015 Change in Median Sales by Business 2008-2015
0
$20M
$40M
$60M
$80M
$120M
$100M
$52
1678
66
$58
4319
30
$94
209
009
$94
822
167
$111
518
448
$110
256
522
$109
090
144
$107
375
085
2009 2010 2011 2012 2013 2014 201520080
$10K
$20K
$3OK
$40K
$50K
$60K
2009 2010 2011 2012 2013 2014 20152008
$211
32
$19
076
$20
222
$23
840
$26
868
$470
72
$573
23
$519
69
Downtown Staten Island Median Sales by BusinessDowntown Staten Island Total Business Sales
Year Year
Sal
es V
olum
e
Sal
es V
olum
e
10 Neighborhood 360deg Commercial District Needs Assessment
PHYSICAL ENVIRONMENT
BAY ST
BA
Y ST
VICTORY BLVD
VANDERBILT AV
BROAD ST
FRO
NT ST
CLINTON ST
St George
Tompkinsville
Stapleton
Storefront Conditions
0 01 02 03 Miles
0 01 02 03 Miles
An analysis of 213 properties along Bay Street reveals that 45 of storefronts are in poor condition 24 are in average condition and 31 are in good condition
Litter and sidewalk cleanliness are visible issues throughout Bay Street especially in and around tree pits
The numerous vacant storefronts break up the continuity of the corridor and deprive the neighborhood of street activity and lighting in the evening
There is a large variation in the age and quality of the building stock in the area
Long-standing businesses across the corridor are models of well-maintained and visually appealing storefronts
The Staten Island Railway train yard and facilities create a disjointed streetscape between Tompkinsville and Stapleton
The corridor lacks the necessary street furniture amenities public art installations and district signage that can enliven the pedestrian experience and collectively promote the neighborhood
Bay Street Storefronts
Bay Street and Victory Boulevard
Vacant Storefronts Bay Street Litter
SIR Stapleton Station
Village Hall in Tappen Park
Poor Condition (45)
Average Condition (24)
Good Condition (31)
Vacant Lots
Vacant Storefronts
Parks amp Open Space
Streetscape Observations
11Downtown Staten Island
Study Area Boundaries
DATA APPENDIX
CANAL ST
BAY ST
BA
Y ST
RICHMOND TER
VANDERBILT AV
VICTORY BLVD
JERS
EY S
T
VAN
DU
ZER
ST
HYLAN BLVD
St George
Tompkinsville
Stapleton
Clifton
0 03 06015 Miles
Population Density (per square mile)
19522 Downtown Staten Island
Staten Island
New York City
7943
27027
Total Population
25698 Downtown Staten Island
Staten Island
New York City
470223
8268999
Average Household Size
27 Downtown Staten Island
Staten Island
New York City
28
26
Area Demographics
Commuting Patterns
0 01 02 03 Miles
Car Ownership
54 Downtown Staten Island
Staten Island
New York City
83
45
3797 Work in Downtown SI live elsewhere
357 Live amp Work in Downtown SI
9256 Live in Downtown SI work elsewhere
3797 9256 357Work Live
Assessed Commercial Corridor
Primary data on Bay Street storefront businesses presented on pg 6-8 was gathered along the Bay Street corridor between Richmond Terrace and Townsend Avenue
Trade Area
Retail leakage surplus and retail opportunity data on pg 9 correspond to the 075 mile trade area
Downtown Staten Island Context Area
Demographic and employment data on pg 12-13 correspond to the Downtown Staten Island neighborhood context area
12 Neighborhood 360deg Commercial District Needs Assessment
Foreign-Born Population
28 Downtown SI
Staten Island
New York City
21
37
Median Age
324 Downtown SI
Staten Island
New York City
388
356
Local Residentsrsquo Employment
Educational Services Health Care Social Assistance
Retail Trade
Accommodation Food Services Arts Entertainment
Other
Professional Scientific amp Technical Services
Construction
Finance Insurance Real Estate
Public Administration
Transportation Warehousing Utilities
Manufacturing
Jobs Located in Downtown Staten Island
Educational Services Health Care Social Assistance
Other
Public Administration
Retail Trade
Construction
Professional Scientific amp Technical Services
Accommodation Food Services Arts Entertainment
Finance Insurance Real Estate
Transportation Warehousing Utilities
Manufacturing
28
12
12
11
10
8
6
5
5
3
44
13
9
9
6
6
6
4
2
1
Race Background Downtown SI SI NYC Downtown SI SI NYC
Downtown SI SI NYC
Under 5 Years
5ndash14 Years
15ndash24 Years
25ndash44 Years
45ndash64 Years
65+ Years
Population Age
8
13
15
30
24
8
6
13
14
26
28
13
7
11
14
31
25
12
Educational Attainment
Income
Median Household Income
$42896 Downtown SI
Staten Island
New York City
$72569
$52259
Pop Below Poverty Line
28 Downtown SI
Staten Island
New York City
12
20
Employment
Unemployment
96 Downtown SI
Staten Island
New York City
79
106
Population in Labor Force
61 Downtown SI
Staten Island
New York City
60
63
DATA APPENDIX
Local Jobs and Employment
Sources US Census Bureau 2009-2013 American Community Survey and 2014 OntheMap Application
Area Demographics
Note As of June 2016 unemployment rates for Staten Island and New York City are both at 51 (NYSDOL) updated neighborhood-level data for Downtown Staten Island (Downtown SI) is not available
Hispanic or Latino (of any race)
White alone
Black or African American alone
Asian alone
Native Hawaiian and Other Pacific Islander
American Indian and Alaska Native alone
Some other race alone
Two or more races
33
20
38
6
0
0
1
2
17
64
10
8
0
0
0
1
29
33
23
13
0
0
1
1
12th Grade or Less No Diploma
High School Graduate
Some College No Degree
Associatersquos Degree
Bachelorrsquos Degree
Graduate or Professional Degree
23
29
17
6
15
10
12
32
19
7
18
12
20
25
15
6
20
14
13Downtown Staten Island
Downtown Staten Island Transportation
74
76 86
51 74 76
52
61 6
2 66
91
92
78
46 48 62 66
91 92 96 98
46
96
42
90 94
40 44
84
40 42 44 46 48 51 52 61 62 66 74 76 78 81 84 86 90 9192 94 96 98
78
8184
8652
VICTORY BLVD
JERS
EY S
T
HO
WA
RD
AV
ST P
AU
LS A
V
FRO
NT ST
RICHMOND TER
BROAD ST
WESTERVELT AV
BA
Y ST
CEBRA AV
CORSON AV
CANAL ST
BEACH STWRIGHT ST
BA
Y ST
LD
CLINTON ST
BAY ST
VAN
DU
ZER
ST
TAR
GEE
ST
TOM
PKINS AV
VANDERBILT AV
TOWNSEND AV
St George
Tompkinsville
Stapleton
Clifton
Staten Island Ferry Terminal
Pier 1 DockNYC Staten Island Ferry
70000 Daily passengers
220 M Annual passengers
Staten Island Railway
6612 Average weekday trips at the St George Station (2015)
731 Average weekday trips at the Tompkinsville Station (2015)
Pedestrian Counts Staten Island Ferry Terminal Entrance at Richmond Terrace (2016)
1090 Weekday Morning Pedestrians
1660 Weekeday Afternoon Pedestrians
996 Weekend Pedestrians
Victory Boulevard Between Bay Street and Van Duzer Street at Tompkinsville Park (2016)
579 Weekday Morning Pedestrians
693 Weekday Afternoon Pedestrians
471 Weekend Pedestrians
Vehicular Traffic
15941 Average daily vehicles on Bay Street between Richmond Terrace and Hannah Street (2014)
13224 Average daily vehicles on Bay Street and Canal Street (2014)
6040 Average daily vehicles on Front Street and Water Street (2014)
13691 Average daily vehicles on Victory Boulevard and Corson Avenue (2014)
7366 Average daily vehicles on Canal Street between Water Street and Broad Street (2014)
Bus Routes
Downtown Staten Island Transportation Routes
Staten Island Ferry Staten Island Railway Bicycle Lanes
Sources MTA 2015 NYC DOT May 2016 NYS DOT 2014 Annual Average Daily Traffic data
Bus Routes
22 MTA Bus Routes
0 02 0401 Miles
0 02 0401 Miles
14 Neighborhood 360deg Commercial District Needs Assessment
DATA APPENDIX
Existing Plans amp Studies Future Culture Connecting Staten Islandrsquos Waterfront Staten Island Arts and the Design Trust for Public Space 2016 (in progress)
Staten Island North Shore Transportation Improvement Strategy NYC Economic Development Corporation and NYC Department of Transportation 2016 (in progress)
North Shore 2030 NYC Economic Development Corporation and NYC Department of City Planning 2011
Downtown Staten Island Urban Design Plan Downtown Staten Island Council 2008
A Historic Opportunity Spurring Community and Economic Development in Stapleton SI Bank amp Trust Foundation and Independence Community Foundation 2006
SourcesESRI and Infogroup Inc August 2016 ESRI Retail MarketPlace Profile
Infogroup Inc 2016 From ReferenceUSA database
Metropolitan Transportation Authority 2015 Average Weekday Subway Ridership
NYS Department of Labor June 2016 Unemployment Rate Rankings by County
NYS Department of Transportation 2014 Annual Average Daily Traffic using Traffic Data Viewer
NYC Department of Finance Division of Tax Policy using data from NYS Department of Taxation and Finance Business sales are reported by tax year which runs from March 1st to February 28th Sales data are compiled from sales tax returns which are rolled up by tax filer within a year excluding returns with negative sales amounts For each year each tax filer is reported according to the address listed on their latest return Large outliers were removed
NYC Department of Small Business Services Fiscal Year 2015 Business Improvement Districts Trends Report
NYC Department of Transportation May 2016 Bi-Annual Pedestrian Counts
US Census Bureau 2014 OnTheMap Application Longitudinal-Employer Household Dynamics Program (LEHD) Commuting Pattern data is representative of LEHD Origin-Destination Employment Statistics for the second quarter of 2014 LEHD data is based on different administrative sources primarily Unemployment Insurance (UI) earnings data and the Quarterly Census of Employment and Wages (QCEW) and other censusessurveys In this context only the highest paying job that is held over two consecutive quarters by an individual worker is counted toward worker flows in to out of and within the context area
US Census Bureau American Community Survey 2013 American Community Survey 4-Year Estimates using NYC Census FactFinder Staten Island Census Tracts 3 7 9 11 17 21 27 29
Photo Credits copy NYC amp Company Jen Davis Julienne Schaer Tagger Yancey IV Office of Borough President James Oddo LUMEN 2013 presented by Staten Island Arts photo courtesy of Glen DiCrocco The New York Wheel BFC Partners - Empire Outlets Ironstate Development - Urby Triangle Equities - Lighthouse Point 5050 Skatepark Chris Marshall Historic Tappen Park Community Partnership Staten Island Black Heritage Family Day NYC SBS Andrew Marcus
New York Wheel 630-foot-tall observation wheel that will be the tallest in the world Opening 2018 Includes 5 acres of public open space
Lighthouse Point Mixed-use waterfront project that includes a 12-story residential building Opening 2019 Includes 85000 square feet of retail space 1 acre of waterfront public open
space and 32000 square feet of co-working space
Empire Outlets New York Cityrsquos first outlet mall Opening 2017 Includes 390000 square feet of retailfood options
Urby Mixed-use waterfront project with 900 residential units located on former
US Naval Base Opening 2016 Includes 35000 square feet of ground floor retail 300 parking spaces and a
public waterfront esplanade
Stapleton Rewards amp Celebrate Stapleton Avenue NYC placemaking grant of $30000 awarded to Historic Tappen Park Community Partnership 2016
Illuminate Stapleton Neighborhood Challenge placemaking grant of $70000 awarded to Historic Tappen Park Community Partnership 2015
Stapleton Village Merchants Association Avenue NYC capacity building grant of $20000 awarded to Historic Tappen Park Community Partnership 2014
Stapleton Village Merchants Association Avenue NYC merchant organizing grant of $10000 awarded to Historic Tappen Park Community Partnership 2013
Stapleton 10304 Brand Campaign Avenue NYC placemaking grant of $15000 awarded to Historic Tappen Park Community Partnership 2013
Current amp Planned Developments
Recent SBS Investments in the Neighborhood
15Downtown Staten Island
We would like to recognize and thank the following individuals and organizations for their contributions to the development of the Bay Street Commercial District Needs Assessment
Staten Island Borough President James OddoNYC Council Member Deborah RoseStaten Island Community Board 1Staten Island Chamber of CommerceBay Street Corridor Local Advisory CommitteeNorth Shore Business AssociationStaten Island Downtown AllianceHistoric Tappen Park Community PartnershipStaten Island ArtsStaten Island Economic Development CorporationLocal Initiatives Support Corporation (LISC)Bay Street MerchantsDowntown Staten Island Shoppers and Residents
The NYC Department of Small Business Services helps unlock economic potential and create economic security for all New Yorkers by connecting New Yorkers to good jobs creating stronger businesses and building a fairer economy in neighborhoods across the five boroughs
ACKNOWLEDGMENTS
ABOUT SBS
nycgovneighborhood360
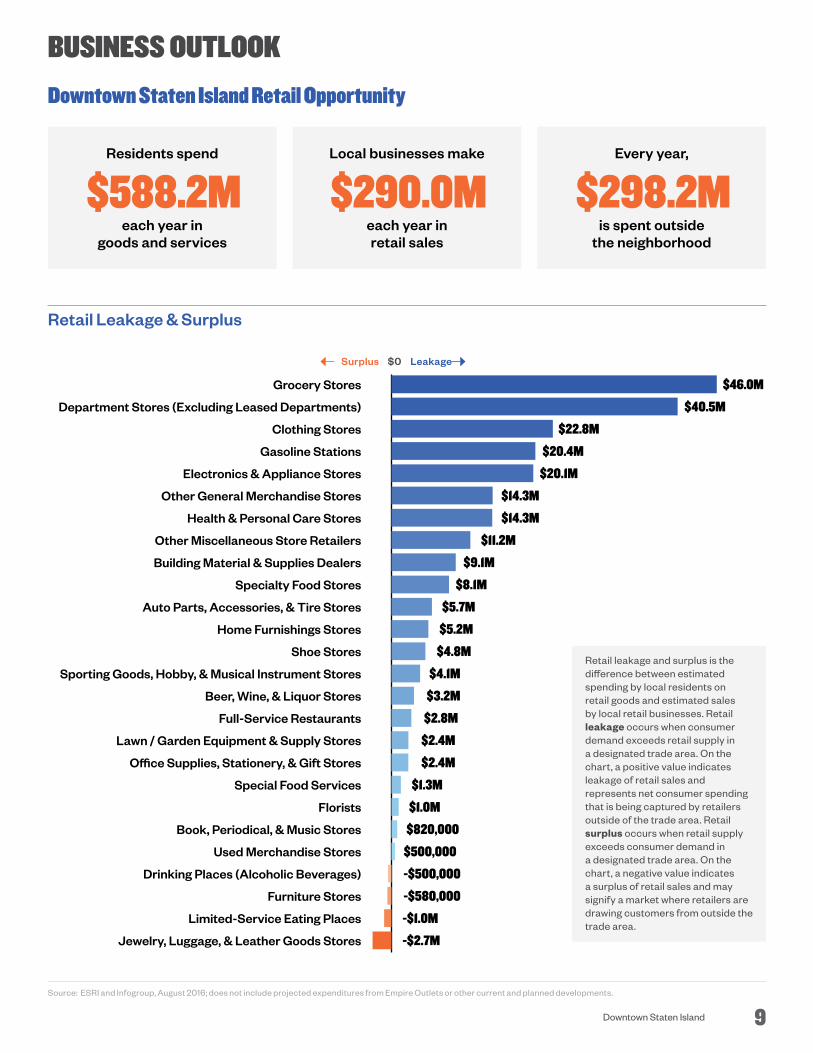
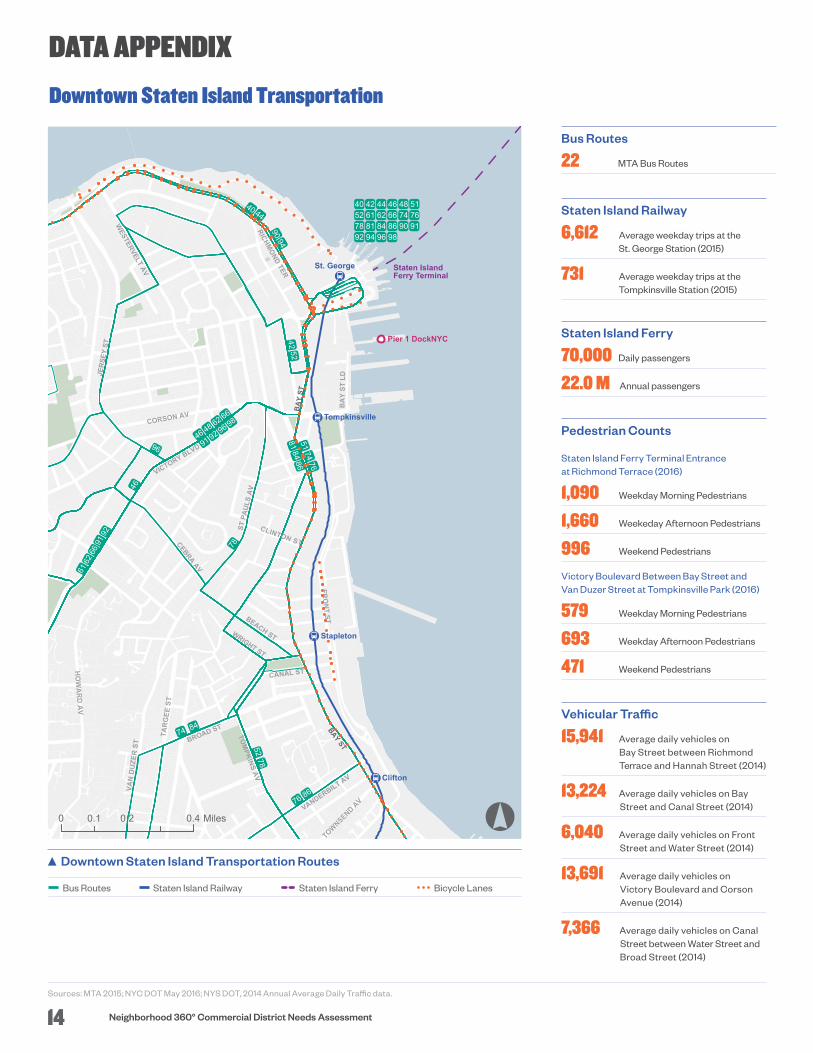
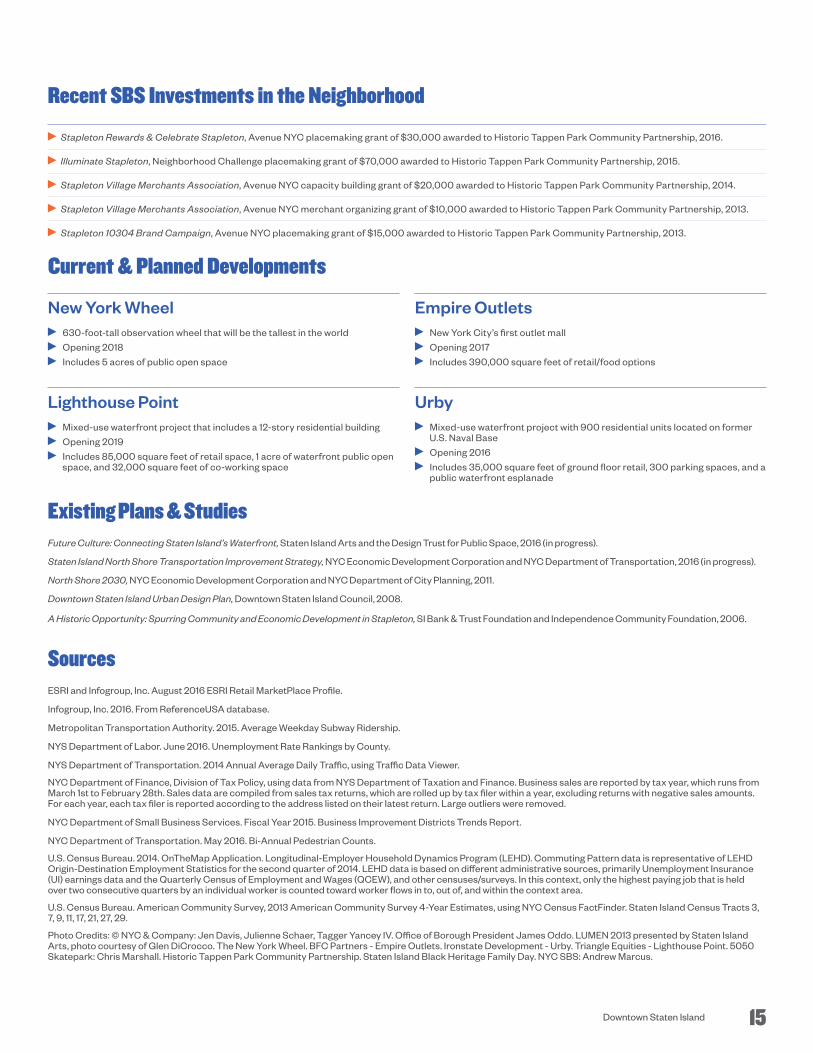
Top Related