


Languages
Pages
Legal

DMD #43208
1
Title page
Conclusive Identification of the Oxybutynin-hydrolyzing Enzyme in Human
Liver
Yuichiro Sato, Aiji Miyashita, Takafumi Iwatsubo, and Takashi Usui
Drug Metabolism Research Laboratories, Drug Discovery Research, Astellas Pharma
Inc., Osaka, Japan
DMD Fast Forward. Published on January 31, 2012 as doi:10.1124/dmd.111.043208
Copyright 2012 by the American Society for Pharmacology and Experimental Therapeutics.
This article has not been copyedited and formatted. The final version may differ from this version.DMD Fast Forward. Published on January 31, 2012 as DOI: 10.1124/dmd.111.043208
at ASPE
T Journals on M
arch 16, 2019dm
d.aspetjournals.orgD
ownloaded from
DMD #43208
2
Running title page
Running title: CES1 as the principal enzyme for oxybutynin hydrolysis
Corresponding author: Yuichiro Sato
Drug Metabolism Research Laboratories
Drug Discovery Research
Astellas Pharma Inc.
2-1-6 Kashima, Yodogawa-ku, Osaka 532-8514 Japan
Phone: +81-6-6210-6970; Fax: +81-6-6390-1090
E-mail: [email protected]
Text pages: 23
Tables: 1
Figures: 5
References: 28
Words in Abstract: 165
Words in Introduction: 469
Words in Discussion: 1117
Non-standard abbreviations used in this paper:
BNPP, bis-(p-nitrophenyl) phosphate; CES, carboxylesterase; CPGA,
2-cyclohexyl-2-phenylglycolic acid; HLC, human liver cytosol; HLM, human liver
microsomes; NDGA, nordihydroguaiaretic acid.
This article has not been copyedited and formatted. The final version may differ from this version.DMD Fast Forward. Published on January 31, 2012 as DOI: 10.1124/dmd.111.043208
at ASPE
T Journals on M
arch 16, 2019dm
d.aspetjournals.orgD
ownloaded from

DMD #43208
3
Abstract
The aim of this study was to conclusively determine the enzyme responsible for the
hydrolysis of oxybutynin in human liver. Hydrolysis in human liver microsomes
(HLMs) and cytosol (HLC) followed Michaelis-Menten kinetics with similar Km
values. In recombinant human carboxylesterase (CES)-expressing microsomes, CES1
was much more efficient than CES2 and yielded a Km value more comparable to that
found in HLMs or HLC than did CES2. A correlation analysis using a set of individual
HLMs in which both CESs acted independently showed that the hydrolysis rate of
oxybutynin correlated significantly with a CES1 marker reaction, clopidogrel
hydrolysis, but not with a CES2 marker reaction, CPT-11 hydrolysis. Chemical
inhibition studies using bis-(p-nitrophenyl) phosphate, clopidogrel,
nordihydroguaiaretic acid, procainamide, physostigmine, and loperamide revealed that
the effects of these compounds in HLMs, HLC, and recombinant CES1-expressing
microsomes were similar, while those in CES2-expressing microsomes were clearly
different. These results strongly suggest that CES1, rather than CES2, is the principal
enzyme responsible for the hydrolysis of oxybutynin in human liver.
This article has not been copyedited and formatted. The final version may differ from this version.DMD Fast Forward. Published on January 31, 2012 as DOI: 10.1124/dmd.111.043208
at ASPE
T Journals on M
arch 16, 2019dm
d.aspetjournals.orgD
ownloaded from

DMD #43208
4
Introduction
Oxybutynin hydrochloride is an antimuscarinic agent administered for overactive
bladder (Appell et al., 2003; Guay, 2003), and is primarily metabolized in humans via
cytochrome P450 3A4, which yields a dealkylated, pharmacologically active form,
N-desethyloxybutynin (Mizushima et al., 2007). It is also hydrolyzed to a
pharmacologically inactive metabolite, 2-cyclohexyl-2-phenylglycolic acid (CPGA)
(Abramov and Sand, 2004) (Fig. 1).
Carboxylesterases (CESs, EC 3.1.1.1) belong to the esterase superfamily
involved in the hydrolysis of ester-bearing molecules like oxybutynin (Hosokawa et
al., 1995; Hosokawa et al., 2007; Hosokawa, 2008). Two CES isozymes, CES1 and
CES2, are expressed in both the microsomal and cytosolic fractions of human liver
(Imai, 2006; Ross and Crow, 2007), and each has been implicated as the
oxybutynin-hydrolyzing enzyme in separate studies. Takai et al. investigated the
hydrolytic activity of purified CES proteins on various drugs (Takai et al., 1997) and
demonstrated that oxybutynin was hydrolyzed by CES2 (pI 4.5) with Km and Vmax
values of 1.1 mM and 0.36 µmol/min/mg, respectively. Meanwhile, hydrolysis by
CES1 (pI 5.3) was below the detection limit (1.0 nmol/min/mg). In contrast, Takahashi
et al. investigated the hydrolysis kinetics of oxybutynin in human liver microsomes
(HLMs) and cytosol (HLC), and reported Km values between 75 and 120 µM
(Takahashi et al., 2008). They performed a correlation analysis using imidapril as a
marker substrate for CES1 activity, and results showed a significant correlation
between the formation of imidaprilat and CPGA, indicating that CES1 likely
hydrolyzes oxybutynin as well as imidapril. They also reported preliminary data
suggesting that the formation of CPGA was inhibited by bis-(p-nitrophenyl) phosphate
This article has not been copyedited and formatted. The final version may differ from this version.DMD Fast Forward. Published on January 31, 2012 as DOI: 10.1124/dmd.111.043208
at ASPE
T Journals on M
arch 16, 2019dm
d.aspetjournals.orgD
ownloaded from
DMD #43208
5
(BNPP), a well-known CES inhibitor (Heymann and Krisch, 1967; Eng et al., 2010),
but not by loperamide, a CES2 inhibitor (Rivory et al., 1996; Quinney et al., 2005),
although no concrete data regarding the potency of inhibition was given.
Although the hydrolytic potential of CES proteins can be examined using
purified protein assays, Km values should be compared with those in HLMs and HLC
to assess involvement of CESs in human liver tissue fractions. Additionally, when
using a correlation analysis, one cannot define the contribution of each isozyme unless
it can be shown that their activities are independent from each other. To resolve this
controversy, and identify the oxybutynin-hydrolyzing enzyme in human liver, we
performed systematic in vitro experiments. First, we investigated kinetics for
oxybutynin hydrolysis in HLMs, HLC, and recombinant human CES-expressing
microsomes. Then, adopting clopidogrel and irinotecan (CPT-11) as marker substrates
for CES1 and CES2 respectively, we conducted a correlation analysis using a set of 16
individual HLMs. Finally, chemical inhibition studies in human liver tissue fractions
and recombinant CESs were conducted using BNPP and several other potential CES
inhibitors (clopidogrel, nordihydroguaiaretic acid (NDGA), procainamide,
physostigmine (eserine) and loperamide) (Schegg and Welch, 1984; Rivory et al.,
1996; Quinney et al., 2005; Shi et al., 2006; Takahashi et al., 2009).
This article has not been copyedited and formatted. The final version may differ from this version.DMD Fast Forward. Published on January 31, 2012 as DOI: 10.1124/dmd.111.043208
at ASPE
T Journals on M
arch 16, 2019dm
d.aspetjournals.orgD
ownloaded from
DMD #43208
6
Materials and Methods
Chemicals and Reagents
Oxybutynin hydrochloride, clopidogrel carboxylic acid, clopidogrel-d4 carboxylic acid
(internal standard for clopidogrel carboxylic acid quantitation), CPT-11 hydrochloride
trihydrate, and SN-38 were purchased from Toronto Research Chemicals (Toronto, ON,
Canada). CPGA was obtained from Wako Pure Chemicals (Osaka, Japan). Benzilic
acid (internal standard for CPGA quantitation), camptothecin (internal standard for
SN-38 quantitation), NDGA, eserine, procainamide, and loperamide were purchased
from Sigma (St. Louis, MO, USA). Clopidogrel monosulfate was obtained from LKT
Laboratories, Inc. (St. Paul, MN, USA). BNPP was obtained from Nacalai Tesque, Inc.
(Osaka, Japan). Pooled and individual HLMs (Reaction Phenotyping Kit® ver. 7) and
pooled HLC were purchased from XenoTech LLC (Kansas City, KS, USA).
Recombinant human CES1 (CES1-b/CES1A1)- and CES2-expressing microsomes
(prepared from baculovirus-infected High Five® insect cells) were obtained from BD
Gentest (Woburn, MA, USA) (Wang et al., 2011). All other chemicals and reagents
used were commercially available, and guaranteed of purity.
Hydrolysis Assays
The assays were performed according to Tang et al. (Tang et al., 2006). Briefly,
hydrolysis of oxybutynin was carried out at 37 °C in 100 μL of 0.05 mol/L Tris-HCl
buffer (pH 7.6). After pre-incubation at 37 °C for 5 min, the reaction was initiated by
adding an oxybutynin solution prepared using the same buffer. In chemical inhibition
studies, the inhibitor solution prepared using the same buffer was added just prior to
the pre-incubation step. Some inhibitor solutions were prepared by dissolving with
This article has not been copyedited and formatted. The final version may differ from this version.DMD Fast Forward. Published on January 31, 2012 as DOI: 10.1124/dmd.111.043208
at ASPE
T Journals on M
arch 16, 2019dm
d.aspetjournals.orgD
ownloaded from
DMD #43208
7
DMSO before diluting with the buffer solution. In these cases, the final DMSO
concentration in the reaction mixture was 0.2%, which was confirmed to have no effect
on the hydrolysis of oxybutynin. The reaction was terminated by adding 150 μL
acetonitrile (ACN) with 1% (v/v) formic acid containing internal standard (IS) for
subsequent HPLC analysis. After centrifugation at 1870 × g for 10 min at 4 °C, the
supernatant was mixed with the HPLC mobile phase. All assays were performed in
duplicate.
Bioanalysis
The formation of hydrolysates, CPGA, clopidogrel carboxylate and SN-38 was
determined using HPLC tandem mass spectrometry. The system comprised a
Prominence HPLC system (Shimadzu, Kyoto, Japan) with a Synergi Fusion-RP 100A
50 × 2.00 mm, 2.5-micron, column (Phenomenex, Torrance, CA, USA) and a
QTRAP® 5500 (Applied Biosystems/MDS Sciex, Foster City, CA, USA). The HPLC
mobile phase was a combination of 0.1% formic acid (A) and ACN (B). Samples were
injected onto the column at a flow rate of 0.4 mL/min. The gradient program was
30%-80% B in 3 min, 80%-30% B in 3.1 min and 30% B in 6 min for CPGA, and
15%-60% B in 3 min, 60%-15% B in 3.1 min, and 15% B in 6 min for clopidogrel
carboxylate and SN-38. The sample rack and column temperatures were maintained at
10 and 45 °C, respectively. Quantitation of CPGA was performed in negative ion
multiple reaction monitoring (MRM) mode by applying the following precursor to
product transitions: CPGA m/z 233→189, and benzilic acid (IS) m/z 227→183.
Quantitation of clopidogrel carboxylate and SN-38 was performed in positive ion
MRM mode by applying the following precursors to the product transitions:
This article has not been copyedited and formatted. The final version may differ from this version.DMD Fast Forward. Published on January 31, 2012 as DOI: 10.1124/dmd.111.043208
at ASPE
T Journals on M
arch 16, 2019dm
d.aspetjournals.orgD
ownloaded from

DMD #43208
8
clopidogrel carboxylate m/z 308→198, d4-clopidogrel carboxylate (IS) m/z 312→202,
SN-38 m/z 393→349, and camptothecin (IS) m/z 349→305. The data were processed
using Analyst 1.5.1 software (Applied Biosystems/MDS Sciex).
Kinetics Studies
Hydrolysis kinetics studies were conducted in pooled HLMs, HLC and recombinant
CES-expressing microsomes with oxybutynin concentrations of 2.5 to 250 μM.
Investigation of higher concentrations was not feasible due to limitations of solubility.
The final protein concentrations for HLMs, HLC, CES1 and CES2 were 0.05, 0.1, 0.05,
and 0.1 mg/mL, respectively. The reaction time was 15 min. CPGA concentration was
measured as noted above. Hydrolysis rate versus substrate concentration data were
fitted to a single component Michaelis-Menten equation using GraphPad Prism
software ver. 5.03 (GraphPad Software, San Diego, CA, USA) to estimate Km and Vmax.
The intrinsic clearance (CLint) was calculated by dividing Vmax by Km.
Correlation Analysis
The hydrolysis rates of clopidogrel (5 μM), CPT-11 (1 and 100 μM), and oxybutynin
(10 μM) were investigated in 16 individual HLMs. Their final microsomal protein
concentrations were 0.02, 0.25, and 0.05 mg/mL, and their reaction times were 20, 30,
and 15 min, respectively. The independence of CES1 and CES2 activity was
investigated via linear regression analysis of the hydrolysis rates of clopidogrel and
CPT-11. Linear regression analysis of hydrolysis rates of oxybutynin and these CES
marker substrates (clopidogrel and CPT-11 [1 μM]) was also performed. GraphPad
Prism software ver. 5.03 was used for linear regression analysis and to calculate the
This article has not been copyedited and formatted. The final version may differ from this version.DMD Fast Forward. Published on January 31, 2012 as DOI: 10.1124/dmd.111.043208
at ASPE
T Journals on M
arch 16, 2019dm
d.aspetjournals.orgD
ownloaded from
DMD #43208
9
coefficients of determination (r2) and p values. A p value < 0.05 was considered
significant.
Chemical Inhibition
Formation of CPGA was investigated in pooled HLMs, HLC, and recombinant
CES-expressing microsomes in the presence of BNPP (10 μM), clopidogrel (5 and 50
μM), NDGA (10 and 100 μM), procainamide (30 and 300 μM), eserine (2 and 20 μM),
and loperamide (5 and 50 μM). The substrate concentration was 10 μM. The final
protein concentrations for HLMs, HLC, CES1 and CES2 were 0.05, 0.2, 0.05, and 0.1
mg/mL, respectively. The reaction time was 30 min. The relative hydrolytic activity
was calculated by normalizing with respect to the amount of CPGA formed in the
inhibitor-free sample.
This article has not been copyedited and formatted. The final version may differ from this version.DMD Fast Forward. Published on January 31, 2012 as DOI: 10.1124/dmd.111.043208
at ASPE
T Journals on M
arch 16, 2019dm
d.aspetjournals.orgD
ownloaded from

DMD #43208
10
Results
Kinetics Studies
The formation of CPGA in HLMs and HLC showed single component
Michaelis-Menten kinetics as indicated by the Eadie-Hofstee plots (Fig. 2, A and B).
Kinetics parameters are summarized in Table 1. In HLMs, Km, Vmax, and CLint were 22
μM, 130 pmol/min/mg protein, and 5.9 µL/min/mg protein, respectively, and in HLC,
values were 13 μM, 110 pmol/min/mg protein, and 8.2 µL/min/mg protein,
respectively. The formation of CPGA in recombinant CES1-expressing microsomes
also followed Michaelis-Menten kinetics (Fig. 2C) with Km, Vmax, and CLint values of
17 μM, 310 pmol/min/mg protein, and 18 µL/min/mg protein, respectively. Hydrolysis
by recombinant CES2 was extremely low, and formation of CPGA at an oxybutynin
concentration of 2.5 μM was below the detection limit (1 ng/mL). Thus, fitting was
conducted using data from 5 to 250 μM (6 points) (Fig. 2D), and yielded Km, Vmax and
CLint values of 62 μM, 32 pmol/min/mg protein and 0.51 µL/min/mg protein,
respectively.
Correlation Analysis
While clopidogrel is a CES1-specific substrate (Tang et al., 2006), CPT-11 is a dual
CES substrate whose hydrolysis is catalyzed by both CES1 and CES2 at high substrate
concentrations but is hydrolyzed predominantly by CES2 at low concentrations (Slatter
et al., 1997). Therefore, hydrolysis rates of CPT-11 at different concentrations were
measured to ensure that we could assess CES1 and CES2 activity independently. The
hydrolysis rates of clopidogrel (5 μM) in 16 individual HLMs varied 18-fold (0.50 to
9.2 nmol/min/mg protein). The hydrolysis rates of CPT-11 at 1 and 100 μM in the
This article has not been copyedited and formatted. The final version may differ from this version.DMD Fast Forward. Published on January 31, 2012 as DOI: 10.1124/dmd.111.043208
at ASPE
T Journals on M
arch 16, 2019dm
d.aspetjournals.orgD
ownloaded from
DMD #43208
11
same set of HLMs varied 7- and 6-fold (0.041 to 0.28 pmol/min/mg protein and 0.48 to
2.9 pmol/min/mg protein), respectively. Linear regression analysis revealed that at a
high concentration of CPT-11 (100 μM), hydrolysis rates of clopidogrel and CPT-11
were significantly correlated (r2 = 0.4044; p = 0.0081; Fig. 3B), but at a low level of
CPT-11 (1 μM), this correlation disappeared (r2 < 0.0001; p = 0.9494; Fig. 3A). This
indicates that at 1 μM, CPT-11 can be treated as CES2-specific. Oxybutynin (10 μM)
hydrolysis levels in the same set of HLMs varied 12-fold (24 to 290 pmol/min/mg
protein). As shown in Fig. 4A, an excellent correlation was observed between the
hydrolysis rates of oxybutynin and clopidogrel (r2 = 0.8396; p < 0.0001), but not
between oxybutynin and CPT-11 (1 μM) (r2 = 0.01589; p = 0.6418; Fig. 4B).
Chemical Inhibition
Results are illustrated in Fig. 5. The hydrolysis of oxybutynin (10 μM) was inhibited
by more than 96% in the presence of BNPP (10 μM) in all cases. At 5 μM, clopidogrel
inhibited hydrolysis by less than 11% in all cases. At 50 μM, hydrolytic activity
decreased by more than 84% in HLMs, HLC, and CES1-expressing microsomes, but
only decreased by 53% in CES2-expressing microsomes. In the presence of NDGA (10
μM), activities in HLMs, HLC, and CES1-expressing microsomes decreased by 77%
to 87%, while that in CES2-expressing microsomes was reduced only by 29%. With an
elevated concentrations of NDGA (100 μM), hydrolysis in HLMs, HLC, and
CES1-expressing microsomes dropped by more than 97%, while that in
CES2-expressing microsomes fell to 24%. Procainamide, at both 30 and 300 μM,
inhibited hydrolysis less than 14% in all cases. Eserine at both 2 and 20 μM blocked
less than 17% of activity in HLMs, HLC, and CES1-expressing microsomes but more
This article has not been copyedited and formatted. The final version may differ from this version.DMD Fast Forward. Published on January 31, 2012 as DOI: 10.1124/dmd.111.043208
at ASPE
T Journals on M
arch 16, 2019dm
d.aspetjournals.orgD
ownloaded from

DMD #43208
12
than 74% in CES2-expressing microsomes. In the presence of loperamide (5 μM),
hydrolysis in HLMs, HLC, and CES1-expressing microsomes was inhibited less than
12%, while inhibition in CES2-expressing microsomes was higher, at 58%. At
elevated concentrations of loperamide (50 μM), inhibition in HLMs, HLC, and
CES1-expressing microsomes increased to between 36% and 47%, and that in
CES2-expressing microsomes increased to 80%.
This article has not been copyedited and formatted. The final version may differ from this version.DMD Fast Forward. Published on January 31, 2012 as DOI: 10.1124/dmd.111.043208
at ASPE
T Journals on M
arch 16, 2019dm
d.aspetjournals.orgD
ownloaded from
DMD #43208
13
Discussion
Two previous studies involving the CES isozyme responsible for the hydrolysis of
oxybutynin in human liver have yielded contradictory results, with one demonstrating
that CES1 was responsible while the other cited CES2. However, results in the present
study conclusively demonstrated through systematic in vitro examinations that the
isozyme in question was CES1.
As a first step, we investigated the hydrolysis kinetics in pooled HLMs and
HLC along with kinetics in recombinant human CES-expressing microsomes.
Hydrolysis of oxybutynin in HLMs and HLC followed single component
Michaelis-Menten kinetics, with lower Km values (22 and 13 μM, respectively)
compared with reported values (75 to 120 μM) (Takahashi et al., 2008). Although the
precise reason for this discrepancy remains unknown, it might be due to differences in
reaction conditions, as the reaction mixture prepared by Takahashi et al. used 100 mM
potassium phosphate buffer (pH 7.4). Despite these conflicting findings, clinically
relevant concentrations of oxybutynin are indeed likely to be much lower than any Km
values, based on its maximum plasma concentration in clinical doses (less than 151
ng/mL [0.4 μM]) and plasma protein binding rate (>99%) (Guay, 2003). The Vmax and
CLint values in the present study were similar in HLMs and HLC, which might be
surprising given that expression of CESs in HLMs has been reported to be higher than
in HLC (Ross and Crow, 2007). However, values in the present study might be
possible because Vmax values were within ranges reported previously (Takahashi et al.,
2008).
Between the recombinant CESs, the Km value of CES1 (17 μM) was more
comparable to those found in HLMs and HLC than that for CES2 (62 μM). Further,
This article has not been copyedited and formatted. The final version may differ from this version.DMD Fast Forward. Published on January 31, 2012 as DOI: 10.1124/dmd.111.043208
at ASPE
T Journals on M
arch 16, 2019dm
d.aspetjournals.orgD
ownloaded from
DMD #43208
14
assuming that expression levels of recombinant CES1 and CES2 are similar, Vmax and
CLint values indicate that CES1 is more potent than CES2 in hydrolyzing oxybutynin.
In HLMs, protein expression of CES1 has been reported to be markedly higher than of
CES2 (1070 and 23.0 pmol/mg microsomal protein, respectively) (Godin et al., 2007;
Ross and Crow, 2007). Taken together, these results suggest the contribution of CES1
to the hydrolysis of oxybutynin in HLMs to be much higher than that of CES2.
To test this hypothesis, we performed a correlation analysis using a set of 16
individual HLMs. In some previous studies, statistically significant correlations were
observed between the CES marker activity and the activity of the test substance
(Yamaori et al., 2006; Takahashi et al., 2008; Hagihara et al., 2009). However, to
conclude whether CES1 or CES2 is involved in HLMs, the independence of the
different CES isozyme activities must be established in advance. Therefore, we
investigated the independence of CES1 and CES2 activities using clopidogrel and
CPT-11 as respective marker substrates. Clopidogrel is exclusively hydrolyzed to its
carboxylate by CES1 (Hagihara et al., 2009; Farid et al., 2010), with a Km of 58 μM in
HLMs (Tang et al., 2006). CPT-11 is hydrolyzed to SN-38 (Satoh et al., 1994; Haaz et
al., 1997), and catalyzed predominantly by CES2 at low concentrations (under 5 μM)
in HLMs (Slatter et al., 1997; Xu et al., 2002; Takahashi et al., 2009).
In the present study, regression analysis showed an insignificant correlation
between the hydrolysis rates of clopidogrel at 5 μM and CPT-11 at 1 μM (Fig. 3A),
indicating that use of a correlation analysis to differentiate between CES1 and CES2
activity is feasible. Further, the significant correlation observed between the hydrolysis
rates of clopidogrel and CPT-11 at 100 μM indicates not only the superior contribution
of CES1 to the hydrolysis of CPT-11 at 100 μM, but also the importance of the
This article has not been copyedited and formatted. The final version may differ from this version.DMD Fast Forward. Published on January 31, 2012 as DOI: 10.1124/dmd.111.043208
at ASPE
T Journals on M
arch 16, 2019dm
d.aspetjournals.orgD
ownloaded from

DMD #43208
15
CPT-11 concentration when used as a CES2 marker substrate (Fig. 3B). In the same
individual HLMs, the hydrolysis of oxybutynin correlated well with the hydrolysis rate
of clopidogrel but poorly with that of CPT-11 at 1 μM (Fig. 4), clearly suggesting that
the major isozyme responsible for oxybutynin hydrolysis in HLMs is CES1, not CES2.
Finally, chemical inhibition studies were conducted in HLMs, HLC, and
recombinant CESs using 6 compounds (BNPP, clopidogrel, NDGA, procainamide,
eserine and loperamide) (Fig. 5). BNPP is a well-known irreversible, non-selective
CES inhibitor (Heymann and Krisch, 1967; Eng et al., 2010). The hydrolysis of
oxybutynin by recombinant CESs was completely inhibited in the presence of BNPP
(10 μM). At the same concentration, hydrolysis in HLMs and HLC was almost entirely
inhibited, suggesting a predominant contribution of CESs to the hydrolysis of
oxybutynin in human liver tissue fractions. Clopidogrel has been reported to be a
potential CES1 inhibitor. The hydrolysis of oseltamivir (50 μM), another
CES1-specific substrate with a Km value of 180 μM, is greatly inhibited in the presence
of clopidogrel (50 μM) by as much as 90% in CES1-transfected 293T cells (Shi et al.,
2006). NDGA and procainamide have been reported to be reversible CES1 inhibitors
with Ki values ranging from 2.9 to 13 μM and 29 to 35 μM, respectively (Takahashi et
al., 2009). In the present study, the hydrolysis of oxybutynin in both human liver tissue
fractions and recombinant CES1 was strongly inhibited by clopidogrel (50 μM) and
NDGA (10 and 100 μM). In contrast, these compounds could not inhibit
CES2-mediated hydrolysis to the same degree. No obvious inhibition by procainamide
(30 and 300 μM) was observed in any fractions. We also investigated the effects of
procainamide on the hydrolysis of clopidogrel in HLMs and recombinant CES1,
This article has not been copyedited and formatted. The final version may differ from this version.DMD Fast Forward. Published on January 31, 2012 as DOI: 10.1124/dmd.111.043208
at ASPE
T Journals on M
arch 16, 2019dm
d.aspetjournals.orgD
ownloaded from
DMD #43208
16
finding less than 3% inhibition (data not shown). Thus, whether or not procainamide is
a useful CES1 inhibitor remains unknown.
Eserine and loperamide are known to be potent reversible CES2 inhibitors
with Ki values ranging from 0.20 to 1.6 μM (Takahashi et al., 2009) and 1.5 μM
(Quinney et al., 2005), respectively. Although both eserine and loperamide also inhibit
CES1, the effects of these inhibitors on CES2 are more potent (Quinney et al., 2005;
Takahashi et al., 2009). In the present study, the hydrolysis of oxybutynin by CES2
was strongly inhibited by eserine (2 and 20 μM) and loperamide (5 and 50 μM), but
inhibition was modest in the other fractions. Taken together, results from our present
studies show that the effects of these chemicals on oxybutynin hydrolysis in HLMs,
HLC, and recombinant CES1 were comparable but differed from findings in
CES2-expressing microsomes.
Here, we examined the enzymes potentially responsible for the hydrolysis of
oxybutynin in human liver. Kinetic studies showed comparable Km values between
human liver tissue fractions and recombinant CES1. The hydrolysis rates of
oxybutynin in HLMs correlated well with a CES1-marker activity but poorly with that
of CES2. Chemical inhibition studies showed similar effects on oxybutynin hydrolysis
in human liver tissue fractions and recombinant CES1, but effects in CES2-expressing
microsomes differed substantially. In conclusion, these results conclusively
demonstrate that CES1 is the principal oxybutynin hydrolyzing-enzyme in human
liver.
This article has not been copyedited and formatted. The final version may differ from this version.DMD Fast Forward. Published on January 31, 2012 as DOI: 10.1124/dmd.111.043208
at ASPE
T Journals on M
arch 16, 2019dm
d.aspetjournals.orgD
ownloaded from
DMD #43208
17
Authorship contributions
Participated in research design: Sato and Miyashita
Conducted experiments: Sato
Contributed new reagents or analytic tools: Sato
Performed data analysis: Sato
Wrote or contributed to the writing of the manuscript: Sato, Miyashita, Iwatsubo, and
Usui
This article has not been copyedited and formatted. The final version may differ from this version.DMD Fast Forward. Published on January 31, 2012 as DOI: 10.1124/dmd.111.043208
at ASPE
T Journals on M
arch 16, 2019dm
d.aspetjournals.orgD
ownloaded from
DMD #43208
18
References
Abramov Y and Sand PK (2004) Oxybutynin for treatment of urge urinary
incontinence and overactive bladder: an updated review. Expert Opin
Pharmacother 5:2351-2359.
Appell RA, Chancellor MB, Zobrist RH, Thomas H and Sanders SW (2003)
Pharmacokinetics, metabolism, and saliva output during transdermal and
extended-release oral oxybutynin administration in healthy subjects. Mayo Clin
Proc 78:696-702.
Eng H, Niosi M, McDonald TS, Wolford A, Chen Y, Simila ST, Bauman JN, Warmus
J and Kalgutkar AS (2010) Utility of the carboxylesterase inhibitor
bis-para-nitrophenylphosphate (BNPP) in the plasma unbound fraction
determination for a hydrolytically unstable amide derivative and agonist of the
TGR5 receptor. Xenobiotica 40:369-380.
Farid NA, Kurihara A and Wrighton SA (2010) Metabolism and disposition of the
thienopyridine antiplatelet drugs ticlopidine, clopidogrel, and prasugrel in
humans. J Clin Pharmacol 50:126-142.
Godin SJ, Crow JA, Scollon EJ, Hughes MF, DeVito MJ and Ross MK (2007)
Identification of rat and human cytochrome p450 isoforms and a rat serum
esterase that metabolize the pyrethroid insecticides deltamethrin and
esfenvalerate. Drug Metab Dispos 35:1664-1671.
Guay DR (2003) Clinical pharmacokinetics of drugs used to treat urge incontinence.
Clin Pharmacokinet 42:1243-1285.
Haaz MC, Rivory LP, Riche C and Robert J (1997) The transformation of irinotecan
(CPT-11) to its active metabolite SN-38 by human liver microsomes.
Differential hydrolysis for the lactone and carboxylate forms. Naunyn
Schmiedebergs Arch Pharmacol 356:257-262.
Hagihara K, Kazui M, Kurihara A, Yoshiike M, Honda K, Okazaki O, Farid NA and
Ikeda T (2009) A possible mechanism for the differences in efficiency and
variability of active metabolite formation from thienopyridine antiplatelet
agents, prasugrel and clopidogrel. Drug Metab Dispos 37:2145-2152.
Heymann E and Krisch K (1967) [Phosphoric acid-bis-(p-nitro-phenylester), a new
inhibitor of microsomal carboxylesterases]. Hoppe Seylers Z Physiol Chem
348:609-619.
Hosokawa M (2008) Structure and catalytic properties of carboxylesterase isozymes
involved in metabolic activation of prodrugs. Molecules 13:412-431.
This article has not been copyedited and formatted. The final version may differ from this version.DMD Fast Forward. Published on January 31, 2012 as DOI: 10.1124/dmd.111.043208
at ASPE
T Journals on M
arch 16, 2019dm
d.aspetjournals.orgD
ownloaded from
DMD #43208
19
Hosokawa M, Endo T, Fujisawa M, Hara S, Iwata N, Sato Y and Satoh T (1995)
Interindividual variation in carboxylesterase levels in human liver microsomes.
Drug Metab Dispos 23:1022-1027.
Hosokawa M, Furihata T, Yaginuma Y, Yamamoto N, Koyano N, Fujii A, Nagahara Y,
Satoh T and Chiba K (2007) Genomic structure and transcriptional regulation
of the rat, mouse, and human carboxylesterase genes. Drug Metab Rev 39:1-15.
Imai T (2006) Human carboxylesterase isozymes: catalytic properties and rational drug
design. Drug Metab Pharmacokinet 21:173-185.
Mizushima H, Takanaka K, Abe K, Fukazawa I and Ishizuka H (2007) Stereoselective
pharmacokinetics of oxybutynin and N-desethyloxybutynin in vitro and in vivo.
Xenobiotica 37:59-73.
Quinney SK, Sanghani SP, Davis WI, Hurley TD, Sun Z, Murry DJ and Bosron WF
(2005) Hydrolysis of capecitabine to 5'-deoxy-5-fluorocytidine by human
carboxylesterases and inhibition by loperamide. J Pharmacol Exp Ther
313:1011-1016.
Rivory LP, Bowles MR, Robert J and Pond SM (1996) Conversion of irinotecan
(CPT-11) to its active metabolite, 7-ethyl-10-hydroxycamptothecin (SN-38), by
human liver carboxylesterase. Biochem Pharmacol 52:1103-1111.
Ross MK and Crow JA (2007) Human carboxylesterases and their role in xenobiotic
and endobiotic metabolism. J Biochem Mol Toxicol 21:187-196.
Satoh T, Hosokawa M, Atsumi R, Suzuki W, Hakusui H and Nagai E (1994)
Metabolic activation of CPT-11, 7-ethyl-10-[4-(1-piperidino)-1-
piperidino]carbonyloxycamptothecin, a novel antitumor agent, by
carboxylesterase. Biol Pharm Bull 17:662-664.
Schegg KM and Welch W, Jr. (1984) The effect of nordihydroguaiaretic acid and
related lignans on formyltetrahydrofolate synthetase and carboxylesterase.
Biochim Biophys Acta 788:167-180.
Shi D, Yang J, Yang D, LeCluyse EL, Black C, You L, Akhlaghi F and Yan B (2006)
Anti-influenza prodrug oseltamivir is activated by carboxylesterase human
carboxylesterase 1, and the activation is inhibited by antiplatelet agent
clopidogrel. J Pharmacol Exp Ther 319:1477-1484.
Slatter JG, Su P, Sams JP, Schaaf LJ and Wienkers LC (1997) Bioactivation of the
anticancer agent CPT-11 to SN-38 by human hepatic microsomal
carboxylesterases and the in vitro assessment of potential drug interactions.
Drug Metab Dispos 25:1157-1164.
Takahashi S, Katoh M, Saitoh T, Nakajima M and Yokoi T (2008) Allosteric kinetics
of human carboxylesterase 1: species differences and interindividual variability.
J Pharm Sci 97:5434-5445.
This article has not been copyedited and formatted. The final version may differ from this version.DMD Fast Forward. Published on January 31, 2012 as DOI: 10.1124/dmd.111.043208
at ASPE
T Journals on M
arch 16, 2019dm
d.aspetjournals.orgD
ownloaded from

DMD #43208
20
Takahashi S, Katoh M, Saitoh T, Nakajima M and Yokoi T (2009) Different inhibitory
effects in rat and human carboxylesterases. Drug Metab Dispos 37:956-961.
Takai S, Matsuda A, Usami Y, Adachi T, Sugiyama T, Katagiri Y, Tatematsu M and
Hirano K (1997) Hydrolytic profile for ester- or amide-linkage by
carboxylesterases pI 5.3 and 4.5 from human liver. Biol Pharm Bull
20:869-873.
Tang M, Mukundan M, Yang J, Charpentier N, LeCluyse EL, Black C, Yang D, Shi D
and Yan B (2006) Antiplatelet agents aspirin and clopidogrel are hydrolyzed by
distinct carboxylesterases, and clopidogrel is transesterificated in the presence
of ethyl alcohol. J Pharmacol Exp Ther 319:1467-1476.
Wang J, Williams ET, Bourgea J, Wong YN and Patten CJ (2011) Characterization of
recombinant human carboxylesterases: fluorescein diacetate as a probe
substrate for human carboxylesterase 2. Drug Metab Dispos 39:1329-1333.
Xu G, Zhang W, Ma MK and McLeod HL (2002) Human carboxylesterase 2 is
commonly expressed in tumor tissue and is correlated with activation of
irinotecan. Clin Cancer Res 8:2605-2611.
Yamaori S, Fujiyama N, Kushihara M, Funahashi T, Kimura T, Yamamoto I, Sone T,
Isobe M, Ohshima T, Matsumura K, Oda M and Watanabe K (2006)
Involvement of human blood arylesterases and liver microsomal
carboxylesterases in nafamostat hydrolysis. Drug Metab Pharmacokinet
21:147-155.
This article has not been copyedited and formatted. The final version may differ from this version.DMD Fast Forward. Published on January 31, 2012 as DOI: 10.1124/dmd.111.043208
at ASPE
T Journals on M
arch 16, 2019dm
d.aspetjournals.orgD
ownloaded from
DMD #43208
21
Footnotes
All authors are currently employed at Drug Metabolism Research Laboratories, Drug
Discovery Research, Astellas Pharma Inc. 2-1-6 Kashima, Yodogawa-ku, Osaka
532-8514 Japan
This article has not been copyedited and formatted. The final version may differ from this version.DMD Fast Forward. Published on January 31, 2012 as DOI: 10.1124/dmd.111.043208
at ASPE
T Journals on M
arch 16, 2019dm
d.aspetjournals.orgD
ownloaded from
DMD #43208
22
Figure Legends
Fig. 1. Chemical structures of oxybutynin and 2-cyclohexyl-2-phenylglycolic acid
(CPGA).
Fig. 2. Hydrolysis kinetics of oxybutynin in HLMs (A), HLC (B), recombinant CES1
(C) and CES2 (D) microsomes. The Eadie-Hofstee plots are presented in the inset.
Fig. 3. Correlation between the hydrolysis rates of clopidogrel and CPT-11 in HLMs.
Linear regression analysis of the hydrolysis rates of clopidogrel (5 μM) vs. CPT-11
(1 μM) (A) and CPT-11 (100 μM) (B).
Fig. 4. Correlation between the hydrolysis rates of oxybutynin and CES marker
substrates in HLMs. Linear regression analysis of the hydrolysis rates of oxybutynin
(10 μM) vs. clopidogrel (5 μM) (A) and CPT-11 (1 μM) (B).
Fig. 5. Inhibitory effects of BNPP (10 μM), clopidogrel (5 and 50 μM), NDGA (10 and
100 μM), procainamide (30 and 300 μM), eserine (2 and 20 μM), and loperamide (5
and 50 μM) on the hydrolysis of oxybutynin (10 μM) in human liver tissue fractions
and recombinant CESs.
This article has not been copyedited and formatted. The final version may differ from this version.DMD Fast Forward. Published on January 31, 2012 as DOI: 10.1124/dmd.111.043208
at ASPE
T Journals on M
arch 16, 2019dm
d.aspetjournals.orgD
ownloaded from

DMD #43208
23
TABLE 1. Kinetics parameters of oxybutynin hydrolysis in HLMs, HLC, and
recombinant human CESs
Km
(μM)
Vmax
(pmol/min/mg
protein)
CLint
(μL/min/mg
protein)
HLM 22 130 5.9
HLC 13 110 8.2
CES1 17 310 18
CES2 62 32 0.51
This article has not been copyedited and formatted. The final version may differ from this version.DMD Fast Forward. Published on January 31, 2012 as DOI: 10.1124/dmd.111.043208
at ASPE
T Journals on M
arch 16, 2019dm
d.aspetjournals.orgD
ownloaded from

Fig. 1
OHO
O
NOH
OH
OOH
N
oxybutynin 2-cyclohexyl-2-phenylglycolic acid (CPGA)
H2O
This article has not been copyedited and formatted. The final version may differ from this version.DMD Fast Forward. Published on January 31, 2012 as DOI: 10.1124/dmd.111.043208
at ASPE
T Journals on M
arch 16, 2019dm
d.aspetjournals.orgD
ownloaded from

Fig. 2
A
C
B
D
This article has not been copyedited and formatted. The final version may differ from this version.DMD Fast Forward. Published on January 31, 2012 as DOI: 10.1124/dmd.111.043208
at ASPE
T Journals on M
arch 16, 2019dm
d.aspetjournals.orgD
ownloaded from

Fig. 3
A B
This article has not been copyedited and formatted. The final version may differ from this version.DMD Fast Forward. Published on January 31, 2012 as DOI: 10.1124/dmd.111.043208
at ASPE
T Journals on M
arch 16, 2019dm
d.aspetjournals.orgD
ownloaded from
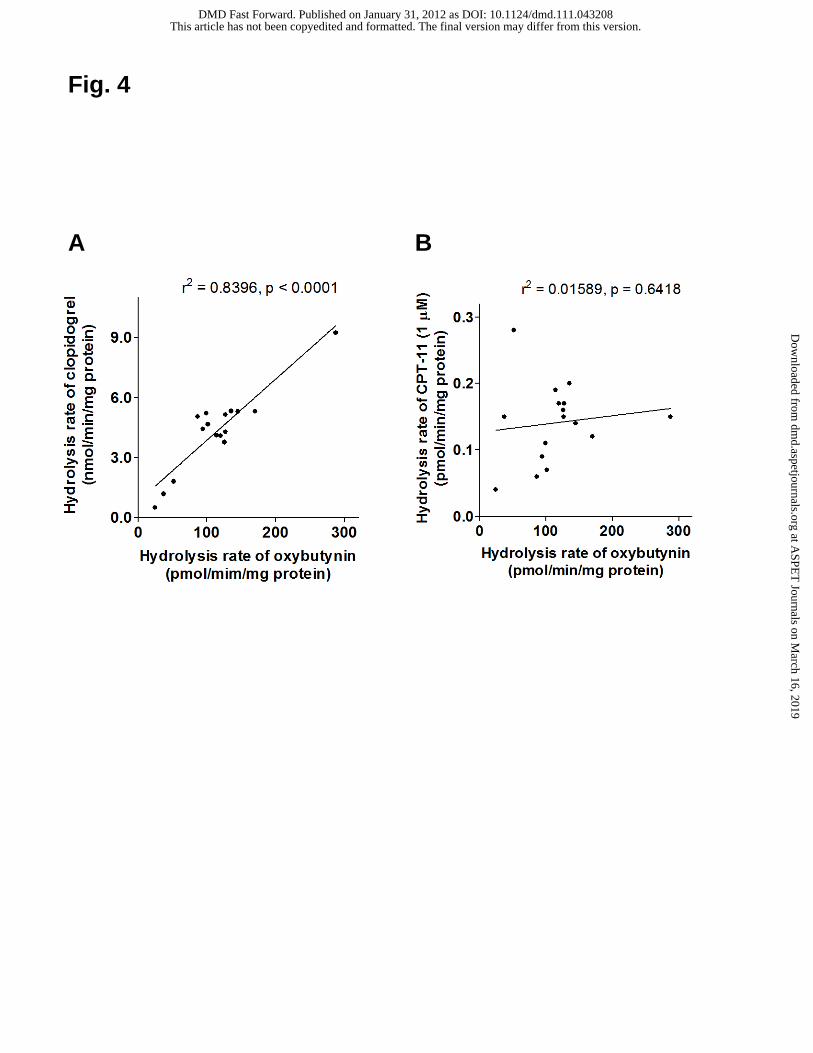
Fig. 4
A B
This article has not been copyedited and formatted. The final version may differ from this version.DMD Fast Forward. Published on January 31, 2012 as DOI: 10.1124/dmd.111.043208
at ASPE
T Journals on M
arch 16, 2019dm
d.aspetjournals.orgD
ownloaded from
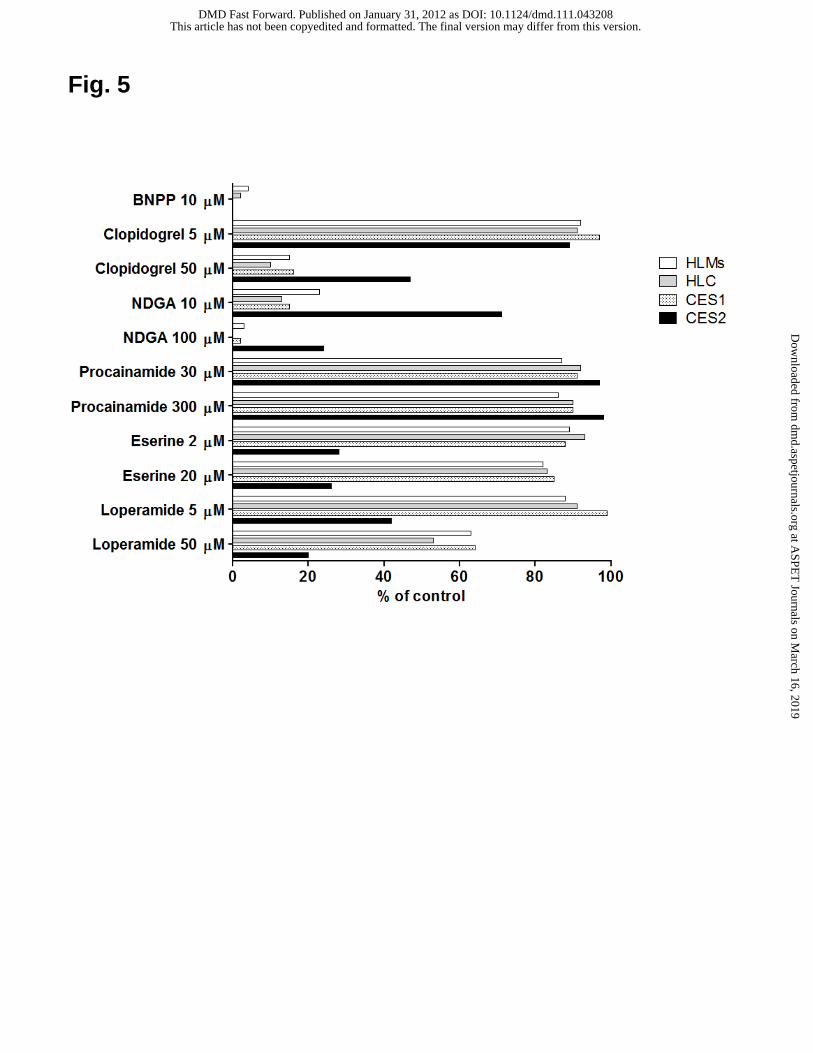
Fig. 5
This article has not been copyedited and formatted. The final version may differ from this version.DMD Fast Forward. Published on January 31, 2012 as DOI: 10.1124/dmd.111.043208
at ASPE
T Journals on M
arch 16, 2019dm
d.aspetjournals.orgD
ownloaded from
Top Related