


Languages
Pages
Legal


THE BOARDMAN LAKE WATERSHED STUDY GRAND TRAVERSE COUNTY, MICHIGAN
December 2003
The Watershed Center Grand Traverse Bay, Ball Environmental Associates
and Great Lakes Environmental Center
Funding provided by:
Coastal Zone Management Act, administered by the Office of Ocean and Coastal
Resource Management, National Oceanic and Atmospheric Administration and
Michigan Coastal Management Program, administered by the Department of Environmental Quality, Environmental Science and Services Division
and Cone Drive Operations, Inc.
2
Table of Contents EXECUTIVE SUMMARY...............................................................................................5
INTRODUCTION AND STUDY AREA ............................................................................6
PROJECT TASKS .........................................................................................................7
COMMERCIAL HISTORY IN THE WATERSHED ..............................................................8
GEOGRAPHIC LOCATION AND SIZE .............................................................................9
PROJECT GOALS.......................................................................................................11
PREVIOUS STUDIES ..................................................................................................12
BOARDMAN RIVER NATURAL RIVER PLAN .......................................12
BOARDMAN RIVER WATERSHED REPORT..........................................12
BOARDMAN RIVER RESTORATION AND PROTECTION PLAN...............13
MDEQ SEDIMENT CONTAMINATION SURVEY REPORT .......................13
GREAT LAKES ENVIRONMENTAL CENTER SEDIMENT REPORT...........15
GRAND TRAVERSE BAY WATERSHED PROTECTION PLAN..........................................17
METHODS ........................................................................................................18
BOARDMAN LAKE WATERSHED BOUNDARY DELINEATION...............18
HISTORICAL AERIAL PHOTOGRAPHY................................................18
LAND USE SURVEY ..........................................................................19
HISTORIC WETLAND LOSS................................................................21
IMPERVIOUS SURFACE ANALYSIS.....................................................21
AVIAN AND HERPETOLOGICAL SURVEYS .........................................23
AQUATIC MACROPHYTE ASSESSMENT..............................................24
BENTHIC MACROINVERTEBRATE ASSESSMENT ................................25
SURFACE WATER ASSESSMENT ........................................................26
RESULTS ........................................................................................................30
LAND USE SURVEY ..........................................................................30
HISTORIC WETLAND LOSS................................................................30
IMPERVIOUS SURFACE ANALYSIS.....................................................30
AVIAN AND HERPETOLOGIAL SURVEYS............................................31
AQUATIC MACROPHYTTE ASSESSMENT............................................33
BENTHIC MACROINVERTEBRATE ASSESSMENT ................................35
SURFACE WATER ASSESSMENT ........................................................36
3
FINDINGS AND RECOMMENDATIONS ........................................................................37
List of Tables TABLE 1 MDNR HERPTELOGICAL SURVEY RESULTS, BOARDMAN LAKE
WATERSHED
TABLE 2 AQUATIC PLANT SPECIES LIST
TABLE 3 BENTHIC MACROINVERTEBRATE SAMPLING RESULTS
TABLE 4 SEDIMENT ANALYSIS RESULTS
TABLE 5 MACROPHYTE AND MACROINVERTEBRATE, SITES 2-4
TABLE 6 NUTRIENT SAMPLING RESULTS
TABLE 7 MICHIGAN 10 METALS SAMPLING RESULTS
TABLE 8 SURFACE WATER ASSESSMENT SAMPLING LOCATIONS/ANALYSIS PARAMETERS
List of Figures FIGURE 1 BOARDMAN LAKE WATERSHED STUDY AREA MAP
FIGURE 2 1961 AERIAL PHOTO MOSAIC
FIGURE 3 2003 DIGITAL ORTHOPHOTO
FIGURE 4 (A-B) SOUTH AIRPORT ROAD WETLAND LOSS ANALYSIS
FIGURE 5 (A-B) IMPERVIOUS SURFACE ANALYSIS MAP
FIGURE 6 AQUATIC MACROPHYTE AND BENTHIC MACROINVERTEBRATE SAMPLING SITE LOCATIONS
FIGURE 7 MACROPHYTE SURVEY SAMPLING SITE LOCATIONS FOR TRANSECTS 1-12
FIGURE 8 (A-D) SURFACE WATER ASSESSMENT LOCATIONS
List of Appendices APPENDIX A BOARDMAN LAKE WATERSHED LAND USE/LAND COVER MAP
APPENDIX B BOARDMAN RIVER REPORTS
BOARDMAN RIVER WATERSHED REPORT, SEPTEMBER 1991
BOARDMAN RIVER RESTORATION AND PROTECTION PROJECT, 1999
BOARDMAN RIVER NATURAL RIVER PLAN, 1976 AND 2002
4
MDEQ SEDIMENT CONTAMINATION SURVEY REPORT
GREAT LAKES ENVIRONMENTAL CENTER SEDIMENT REPORT
APPENDIX C ENVIRONMENTAL DATA RESOURCES, INC. RADIUS MAP REPORTS
APPENDIX D MDEQ FOIA LETTER
APPENDIX E BOARDMAN LAKE/RIVER AVIAN AND HERPETOLOGICAL SPECIES LISTS
APPENDIX F BOARDMAN LAKE/RIVER GPS LOCATION DESCRIPTIONS
APPENDIX G BOARDMAN LAKE/RIVER CONTAMINATION SITES MAP/DESCRIPTIONS
APPENDIX H AQUATIC MACROPHYTE SURVEY DATA SUMMARY
APPENDIX I BENTHIC MACROINVERTEBRATE SURVEY DATA SUMMARY

5
Executive Summary The physical, biological, and built infrastructure resources of the Boardman Lake
watershed were identified and evaluated for potential impacts to the long term water
quality of Boardman Lake and the lower reaches of the Boardman River. This study is
intended to complement previous and ongoing watershed management plans within the
region. This study has found:
• Twenty-nine (29) contamination sites existing within the watershed were
determined to represent potential threats to Boardman Lake or Boardman
River.
• Impervious surfaces within the Boardman Lake watershed are currently
over 2.5 times the threshold known to result in degraded water quality.
• Nutrient loading, bacterial contamination, heavy metal concentrations,
and/or thermal pollution were documented within six tributaries to
Boardman River, at seven stormwater culverts along the Boardman River
and within one location on Boardman Lake.
• Aesthetic impact has occurred along the banks of Boardman Lake adjacent
to the former Boot Lake Dump, and along the Boardman River at the
former Keystone dump.
• Nutrient and bacterial pollution exist at two storm water culverts within
the City of Traverse City.
• An area lacking life within the bottomland of Boardman Lake exists
within an area east of the ends of Thirteenth and Fourteenth Streets.
• Two sediment contamination “hot spots” exist within Boardman River
bottomlands.
Finally, it is recommended that further investigation and remedial measures be
considered and undertaken in accordance with these findings. It is recommended that:
• Land use planning and regulation be encouraged to explore the application
of “low impact development” storm water treatment techniques.
6
• Natural and biological resources of the watershed should be further
monitored and understood to promote and protect the regions economy.
• Education efforts should promote the essential link between land use and
water quality protection and improvement
Introduction and Study Area Located in northwest lower Michigan, the Grand Traverse Bay is one of premier tourist
and outdoor recreation areas in the State of Michigan. From the crystal clear waters of
Lake Michigan and scenic shoreline to the small town atmosphere of Traverse City and
surrounding communities, residents of the region enjoy a high quality of life while
attempting to balance growth and prosperity. As local units of government plan for
development and the rehabilitation and increased recreational use of the shores of
Boardman Lake, the Watershed Center of Grand Traverse Bay in association with Cone
Drive/Textron Corporation and State of Michigan Coastal Zone Management (CZM)
Program within the Water Division (formerly Surface Water Quality Division), Michigan
Department of Environmental Quality (MDEQ) to plan for maintenance, improvement,
and restoration of water quality and increased public use and enjoyment of Boardman
Lake and River north of Boardman Lake.
As Grand Traverse County grows, the continued protection to the area’s natural and
biological resources is an important issue to be addressed. Following the construction of
South Airport Road, the southern portion of Boardman Lake, the inlet of the Boardman
River into Boardman Lake, and surrounding wetlands have been significantly altered,
potentially negatively impacting water quality in this area. Historic industrial uses and
current expansion of service and other industry along South Airport, Cass, Barlow, and
Keystone Roads poses challenges for continued development as balanced with
environmental protection.
Boardman Lake exists within the political boundaries of the City of Traverse City and the
Charter Township of Garfield (hereafter referred to as Garfield Township). Boardman
River south to Sabin Dam, which is the southern most boundary for this study, exists
7
entirely within Garfield Township. Boardman Lake has a total area of 314 acres. As
determined for this study, the Boardman Lake watershed consists of 4,594 acres or 16
square miles, making it the third largest subwatershed within the greater Grand Traverse
Bay Watershed. Boardman River is the major tributary into the Boardman Lake,
followed by Miller and Jack Creeks. Because of the nature of historic industry,
commercial enterprises and agricultural lands in the greater Grand Traverse region, water
quality of the Boardman Lake watershed will likely be influenced by cooperation of local
municipalities through land use planning, and state and federal environmental programs,
including development and cleanup activities.
Project Tasks
This Boardman Lake watershed report project consisted of the investigation of historic
and current land uses, infrastructure systems, and existing water quality and natural and
biological resources. The main goal of this report is to gain baseline knowledge of
potential impacts to Boardman Lake from current and historic land use practices within
the watershed. Specifically, the study included the following essential elements within
the Boardman Lake watershed:
An assessment of historic and current land use practices within the watershed and
their effect on water quality.
An assessment of historic wetland loss.
A delineation of stormwater sewer infrastructure, and assessment of stormwater
contributions to Boardman Lake and Boardman River.
A determination of impervious surface percentage.
A delineation of the Boardman Lake watershed boundaries from Sabin Dam
north, based on storm drain infrastructure in the City of Traverse City and area
hydrology.
The development of a series Geographic Information Systems (GIS) map layers
to support quantifying, analyzing, and illustrating environmental trends and
conditions.
8
An assessment of water quality through monitoring nutrients and bacteria from
tributary and principal storm water discharges.
An assessment of baseline water quality parameters.
An assessment of the watershed’s natural and biological resources, including
benthic macroinvertebrates and aquatic macrophytes, and a review of existing
baseline data on the biological condition.
Conducting public meetings to facilitate the involvement of the general public on
the process and progress of the management plan.
Commercial History in the Watershed Industry along Boardman Lake and Boardman River dates back to the early 1900s, and
can be described as manufacturing and light industry.1 The logging industry was the
primary influence in the Grand Traverse region from the 1850s to the early 1900s.
However, with the growing number of agricultural businesses, particularly in the fruit
trade, a variety of manufacturing firms established along these waterways, ranging from
cigar and candy production to farm implements and even car and truck manufaturing.
Probably the most notable was the Traverse City Iron Works, located along the south
banks of Boardman River between Union and Cass Streets and founded in 1874 by
William Holdsworth. Traverse City Iron Works produced many of specialty saw and
shingle mill machinery for the local sawmills and lumber camps. The firm was renowned
nationwide for the first production of the frost-proof fire hydrant.
At the Boardman River outlet from Boardman Lake sat the Oval Wood Dish Company
that, around the turn of the century, produced thin wooden containers for retail meat and
dairy products. The Oval Wood Dish Company also made wire-end dishes, wash boards,
clothes pins, and various lumber products. These products were distributed nationwide
until about 1918, when the company relocated to Tupperville, New York.
1 Melkind, M. 1982. Currents of the Boardman. Grand Traverse Historical Society, Traverse City, Michigan. 147 p.
9
Two vehicle factories operated in the early 1800s along the Boardman Lake producing
drays (a low heavy cart); mill carts; wagons; and an annual manufacture of four hundred
sets of sleighs. Petertyls, located on North Union Street, made carriages, buggies and
wagons, and sleighs in the early 1800s.
On the site of the current governmental building in Traverse City, sat the R.W. Round
and Son foundry. This facility was built around 1900 to manufacture heavy castings for
building columns and door sills. Other manufacturers formerly located on either the
Grand Traverse Bay or Boardman River included Parsons Company, Maxbauer and
Northern Creameries, Murray’s Boats, Darrow’s Marina, Cherry Growers, Traverse City
Canning, and Morgan McCool. While most of these manufacturers have left the area,
their legacy as well as that of the current industry continues, and the imprint of some of
their production currently exists in the soils and water of the Boardman Lake watershed.
Beginning in the 1960’s, the Grand Traverse region was increasingly viewed as a
growing tourist and recreational destination. One of the goals of this report was to
identify, evaluate, and determine potential impacts to the water quality of the lower
Boardman watershed from current as well as historic land uses.
Geographic Location and Size For purposes of this study, the Boardman Lake watershed boundaries were delineated.
Watershed boundaries to the north are determined by the City of Traverse City’s storm
drain infrastructure. Boundaries to the east and west are determined topographically as
interpreted by U.S. Geologic Survey (USGS) topographic maps. Watershed boundaries
to the south include the watersheds of Jack’s and Miller Creeks. Please refer to Figure 1
for a map of the boundaries of the Boardman Lake watershed. Due to geographic
coverage of previous studies, Sabin Dam was chosen as the southern most reference point
for the southern boundary.
The Boardman Lake watershed is located in Grand Traverse County, and discharges into
the West Arm of Grand Traverse Bay. It is approximately 7.2 square miles or 4,953.8
acres in size. Nearly eleven (11) miles of river and tributary stream are encompassed in
10
the watershed, and a maximum elevation consists of 1,004 feet above mean sea level, and
424 feet above Lake Michigan level. The Boardman Lake subwatershed is a small part of
the larger Boardman River watershed encompassing 283.8 square miles, and the larger
Grand Traverse Bay watershed that drains nearly 973 square miles of land and spans six
counties and 55 separate units of government.
The municipalities of the City of Traverse City and the Garfield Township exist as the
political entities with jurisdiction over land use and development within the Boardman
Lake watershed boundaries. Boardman Lake watershed can be characterized as primarily
urban.
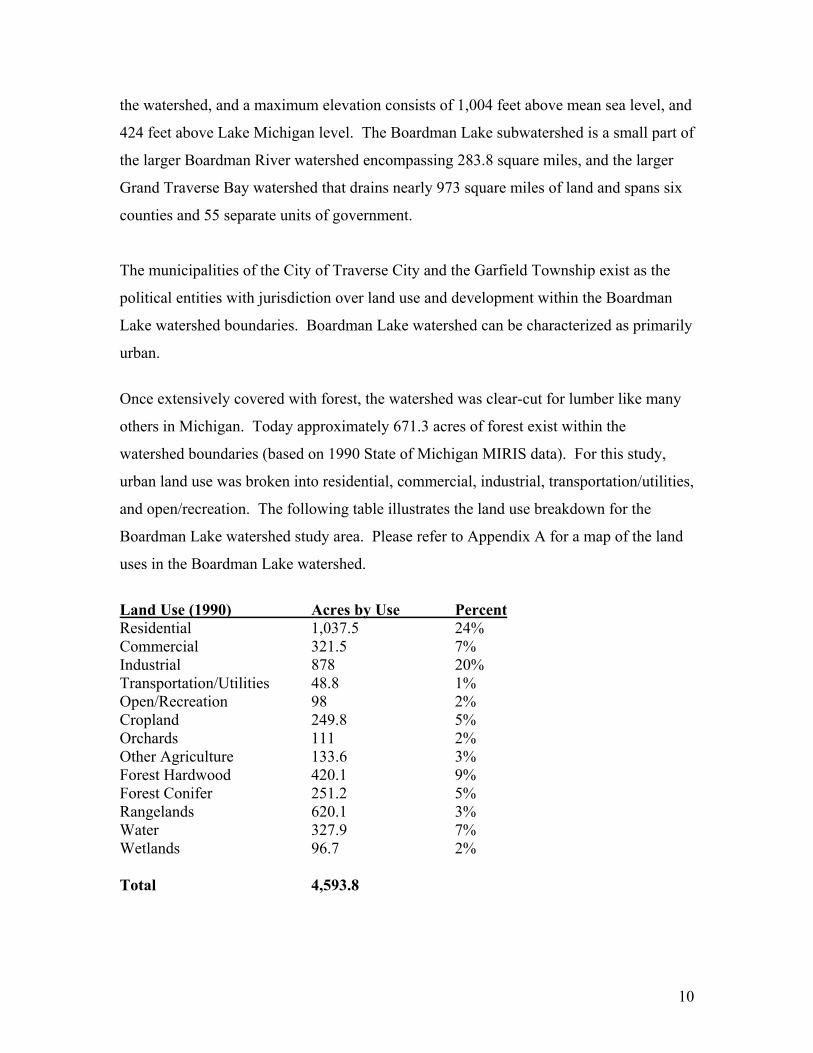
Once extensively covered with forest, the watershed was clear-cut for lumber like many
others in Michigan. Today approximately 671.3 acres of forest exist within the
watershed boundaries (based on 1990 State of Michigan MIRIS data). For this study,
urban land use was broken into residential, commercial, industrial, transportation/utilities,
and open/recreation. The following table illustrates the land use breakdown for the
Boardman Lake watershed study area. Please refer to Appendix A for a map of the land
uses in the Boardman Lake watershed.
Land Use (1990) Acres by Use Percent Residential 1,037.5 24% Commercial 321.5 7% Industrial 878 20% Transportation/Utilities 48.8 1% Open/Recreation 98 2% Cropland 249.8 5% Orchards 111 2% Other Agriculture 133.6 3% Forest Hardwood 420.1 9% Forest Conifer 251.2 5% Rangelands 620.1 3% Water 327.9 7% Wetlands 96.7 2% Total 4,593.8

11
Project Goals Previous studies of the natural and biological resources of Boardman waterways have
primarily focused on Boardman River upstream of Sabin Dam, while little previous study
has focused solely on the Boardman Lake. Goals of this project were to gain baseline
information on the natural and biological resources of the Boardman Lake, to determine
potential sites of environmental contamination that may impact Boardman Lake, and to
make recommendations on further study and/or restoration efforts. The GIS component
of this study focused first on delineating the Boardman Lake watershed from Sabin Dam
to the mouth of the Boardman River at Grand Traverse Bay. In addition, GIS goals were
concentrated on determining percentage wetland loss in a portion of the watershed, and
the determination of the existing impervious surface percentage within the delineated
boundaries of the watershed.
This study also focused on the assessment of nutrients, Escherichia coli (E. coli), and
heavy metals within Boardman Lake and Boardman River. Total phosphorus, total
nitrogen, heavy metals, and E. coli concentrations were determined in surface water
samples. Watersheds with significant agricultural and urban development, or with mixes
of these uses, often experience concentrations of nutrients and/or bacteria. E. coli found
in streams is likely closely linked to land use within urban areas from animal and/or
human wastes. Local and regional management of fertilizer and pesticide use and land
use development, and stormwater management planning can go a long way toward
improving water quality conditions. Concentration of nutrients vary considerably from
season to season and following storm events. Samples from Traverse City stormwater
outfalls were collected during rain events. This also assured that the culverts and storm
drains would have a consistent flow of water for sampling. Heavy metal concentrations
were a concern given the extent of stormwater runoff entering the watershed from
Boardman River at the northern end of the urban areas within the City of Traverse City.
Another project goal included gaining baseline knowledge of macrophyte and benthic
macroinvertebrate populations in the Boardman Lake watershed. The presence (or
absence) of macrophytes (aquatic plants) and macroinvertebrates (aquatic organisms

12
lacking a backbone) are good biological measures of the health of aquatic systems. Some
macroinvertebrate species are more tolerant of degraded environments, while others are
extremely sensitive to changes in water quality.
In terms of terrestrial wildlife, the goals of this project were not to collect new data, but
to compile, and summarize existing data. The Grand Traverse Audubon Club (GTAC)
was consulted for all avian surveys conducted in the watershed. Data from frog and toad
surveys conducted each spring by the Michigan Department of Natural Resources
(MDNR) were acquired from the MDNR Nongame Division for the years 1996-2002.
Various studies assessing the natural resources of Boardman River have also been
conducted (Refer to Appendix B for copies of previous studies). The most notable of
these are the Boardman River Natural River Plan of 1976, the Boardman River
Watershed Report of 1991, and the Boardman River Restoration and Protection Project of
1999.
Previous Studies
Boardman River Natural River Plan The Boardman River Natural River Plan was prepared by the MDNR, and revised and
submitted February 1976. The Boardman River Natural River Plan provides a physical
description of the river and surrounding areas, reviews the values of the river and factors
affecting its future nature and use, and provides a plan for the protection of the river’s
natural qualities and to guide its future use. While this document consists of valuable
recommendations, it is a nontechnical document that does not address specific water
quality parameters and/or potential impacts from non-point source pollution.
Boardman River Watershed Report
The Boardman River Watershed Report was prepared by the Grand Traverse and
Kalkaska Soil and Water Conservation Districts in 1991. This report focuses on the
Boardman River from the headwaters to the mouth at Grand Traverse Bay. Its purpose
were to inventory the water quality problems within the watershed, and to propose an
action plan for dealing with the problems that pose the greatest threat to maintaining the

13
state-designated uses of the Boardman River. This report identifies the types and
locations of those human activities which contribute to the sedimentation of the
Boardman and its tributaries. Best management practices for each of those sites are
recommended, all of which are sensitive to the upper Boardman River’s designation as a
“natural river and a blue ribbon” trout stream.
Boardman River Restoration and Protection Plan
The Boardman River Restoration and Protection Project Plan was submitted in July 1999
by the Grand Traverse Conservation District. This report focuses primarily on the
impacts of sedimentation to the river and improving the Boardman River’s productivity
as a blue ribbon trout stream.
MDEQ Sediment Contamination Survey Report
The MDEQ has been conducting sediment contamination surveys on the Boardman Lake
since 1997. MDEQ in conjunction with the U.S. Environmental Protection Agency (U.S.
EPA) began sediment sampling in 1997. Sediment sampling on Boardman Lake has
focused on numerous commercial, industrial, and municipal sites along the lakeshore.
Some of these facilities have discharged wastewater directly to surface waters, while
others had nearby waste disposal locations or waste lagoons. These agencies undertook
Boardman Lake sediment contamination analysis to determine the potential for impact
from point and nonpoint sources. Sediment samples were collected from 17 locations
along Boardman Lake using the U.S. EPA Great Lakes National Program Office research
vessel and a sediment coring unit. U.S. EPA Ecological Screening Levels (ESLs) were
used as guidelines for chemical analysis. Chemical levels at some locations exceeded
severe effect levels (SELs) and lowest effect levels (LELs) for certain types of inorganic
chemicals. The following is a summary of the findings of aquatic toxicity from the report
(refer to Appendix B for a copy of the report including a map of sampling locations):
“From a potential aquatic toxicity standpoint and based on sediment quality
guidelines, the most significant chemical results were associated with stations 70,
71, 51, 52 and 60 (locations described below).
14
At Station 70, about 200 yards downstream of the Traverse City Wastewater
Treatment Plant outfall, the SEL was exceeded for copper and LELs exceeded for
arsenic, iron, manganese, mercury, and several purgeable aromatic hydrocarbons
(PAHs).
The SEL was exceeded for pyrene (a PAH) at Station 71 which is located a short
distance upstream from the former Traverse City Iron Works foundry site. LELs
were also exceeded for arsenic, copper, manganese, mercury, and several PAHs at
Station 71. Station 71 also had the greatest number of PAH compounds present
when compared to other stations.
At Station 72 downstream of the former foundry, SELs were exceeded for copper,
iron, lead, mercury, zinc, and PAHs fluoranthene, phenanthrene, and pyrene.
LELs at Station 72 were exceeded for arsenic, cadmium, chromium, manganese
and two PAHs.
Solvent/metal degreasing type compounds or their breakdown products were
found at Stations 51 and 52 in the vicinity of the former Stromberg/Carlson (S/C)
and Cone Drive/Textron sites. These compounds included trans-1,2-
Dichloroethene, cis-1,2-Dichloroethene, trichloroethylene, perchloroethylene, and
vinyl chloride. Although sediment quality guidelines are not available for these
volatile organic compounds, their presence in sediments can often be due to
contaminated groundwater venting to the surface water.
At Station 60, cyanide was found at an elevated level when compared to the
statewide cyanide mean of 0.18 mg/kg for sediment samples collected from
waterbodies where good to excellent aquatic biological communities were found
to be present from an additional study.2 Additionally, at Station 60, cadmium,
chromium, copper, iron, and manganese exceeded SELs, while nickel, lead, zinc,
2 Jones, R. 1999. Reference site sediment chemistry report for wadeable streams, 1994, 1997, and 1998. Michigan Department of Environmental Quality, Water Division. Report No. MI/DEQ/SWQ-99/060.
15
and several PAHs were present at concentrations above LELs. Based on field
notes, the water at Station 60 was 64 feet deep, which was the deepest of all
stations and likely represents a major sediment depositional area. Consequently,
although the source(s) of the contaminants found at Station 60 is not known,
chemicals discharged to the lake above this point may be settling out in the
vicinity of Station 60.
Bioaccumulative chemicals of concern, such as polychlorinated biphenyls (PCBs)
and pesticides such as DDT and others that can cause human health impacts by
transference through the food chain, were not detected in sediments collected
during the survey. Mercury was detected at three stations in a localized area at
the downstream end of the lake. Two of the mercury concentrations slightly
exceeded the mean mercury sediment value reported by Evans et al. (1991)3 for
lakes with municipal and/or industrial discharging points.”
Stations 51 and 52 were located near the Cone Drive/Textron facility. Station 60 was
located parallel to Fourteenth Street. Stations 70 and 71 were located just upstream from
the outlet of Boardman Lake and the Traverse City Wastewater Treatment Plant.
Great Lakes Environmental Center Sediment Report
As part of the effort, a follow-up study (to the MDEQ report) was conducted in June
2002 by Great Lakes Environmental Center (GLEC). This study involved the collection
and analysis of surficial sediment samples from areas in the vicinity of Stations 60, 70,
and 71 from the 1997 MDEQ study. Sediment samples of these locations were analyzed
to determine the level of contamination for the chemicals of concern identified within the
1997 study. The toxicity of a subset of the samples from each location was determined
by GLEC utilizing 10-day whole sediment toxicity tests with an amphipod, Hyalella
azteca, and an insect, Chironomous tentans.
3 Evans, E., M. Wilson, and W. Creal. 1990. Assessment of mercury contamination in selected Michigan lakes. In Michigan Department of Environmental Quality Sediment Contamination Survey, Boardman Lake. Report No. MI/DEQ/SWQ-01/073.
16
The following is a summary of GLEC’s results of chemical analyses at the three stations
on Boardman Lake.
“(E)levated concentrations of contaminants in the sediments in the Boardman
Lake and River exist at the sampled locations, and…..sediments in some area are
toxic to sediment dwelling freshwater organisms. At Station 60 cadmium,
chromium, copper, cyanide, nickel and zinc were found at higher concentrations
in 1997 than in this study. However, the cyanide concentration exceeded the
statewide mean of 0.18 mg/kg for sediment samples collected from waterbodies
where good to excellent biological communities were present. The PAH
concentrations from Station 60 were much higher in this study than in the 1997
study. Phenanthrene, fluoranthene, pyrene, chrysene, and benzo(a)pyrene were
found above the probable effect concentrations in most sediment samples.
For all the PAHs analyzed in sediment samples from Station 60, either the
reporting limit (RL) or the measured concentration exceeded the U.S. EPA
Ecological Data Quality Limits (EDQLs), with the exception of
benzo(b)fluoranthene. At Station 70, copper and mercury were detected at
concentrations greater than the threshold effect concentration (TEC). Copper
exceeded the TEC in five of the nine samples, and mercury exceeded the TEC in
six of the nine samples. For all the PAHs analyzed in sediment samples from
Stations 70 and 71, either the RL or the measured concentration exceeded the U.S.
EPA EDQL, with the exception of benzo(b)fluoranthene.
The results of this study indicate that there are elevated concentrations of
contaminants in the sediments in the Boardman Lake and River at the sampled
locations, and that the sediments in some areas are toxic to sediment dwelling
freshwater organisms.”
The Boardman Lake watershed project was initiated to understand the inputs of
potentially harmful organic and inorganic substances to Boardman Lake and watershed.

17
The review of historic industrial sites along the lake and river was conducted to help
direct sampling efforts to likely point and non-point sources contamination. The project
is to result in a report of findings and recommendations for further study, sampling, and
restoration.
Grand Traverse Bay Watershed Plan In 2001, The Watershed Center Grand Traverse Bay received a Watershed Management
Planning Grant for the Grand Traverse Bay Watershed Plan from the U.S. EPA and the
MDEQ. These funds were authorized by Section 319 of the Federal Clean Water Act,
and were used to develop a Watershed Protection Plan for the Grand Traverse Bay
watershed.
Work on the Grand Traverse Bay Watershed Protection Plan project began in September
2001. The MDEQ Water Division is providing oversight for the project, and the plan, as
of the end of December 2003, is complete and approved.
The Grand Traverse Bay Watershed Protection Plan provides a description of the
watershed (including such topics as bodies of water, population, land use, municipalities,
and recreational activities), summarizes each of the nine subwatersheds to Grand
Traverse Bay, and outlines current water quality levels in the bay. Within the two-year
development phase of the watershed protection plan, water quality threats were
identified, and implementation efforts to improve these areas were researched, developed,
and prioritized.
This plan is intended for use by regional environmental and conservation non-profit
groups, lake associations, local governments and other government agencies, volunteer
groups, and others and provides recommendations to protect the Grand Traverse Bay
watershed. This report will be considered an appendix to the Grand Traverse Bay
Protection Plan, and is intended to guide its implementation within the Boardman Lake
subwatershed.
18
Methods
Boardman Lake Watershed Boundary Delineation For the purposes of this study, the Boardman Lake watershed study area was delineated
by building on existing USGS and MDEQ basin/sub-basin boundaries, and further
delineating the boundaries by analyzing topography and storm drain infrastructure. The
northern boundaries of the watershed within the limits of City of Traverse City were
determined by drawing a boundary line using the MDEQ draft sub-basin boundary and
rectifying in accordance with the City’s storm drain infrastructure. Storm drain lines
could be considered the most accurate determinant of runoff in the urban area. The
eastern boundary delineation follows the USGS sub-basin boundary, and the western
boundary follows the MDEQ draft sub-basin boundary. Sabin Dam was selected as the
southern extent of the watershed boundary. Vertical Mapper® 3.2 was then used to build
and analyze a terrain model from the USGS 10 meter Digital Elevation Model, and to
describe slope breaks on a line from Sabin dam to the east and west boundaries. This
map produced the southern boundary of the study area.
Historical Aerial Photography Historical aerial photography provides a means to measure land use/land cover trends as
well as physical changes in land and water features. In order to facilitate this part of the
study assignment, a series of 23 aerial photographs from 1961 of the Boardman Lake area
were obtained from the City of Traverse City Engineering Department. These black and
white photo panels were then scanned on a large format scanner. The digital images were
then registered to earth coordinates, and tiled into one master mosaic to facilitate spatial
comparisons to current features in (2003 photos). The 1961 aerials are not “corrected”
orthophotos, so a rubber-sheeting technique was used to obtain the best possible match
between photo panels. Each 1961 photo was cropped and rotated to a simulated
longitudinal. The photos were then registered to earth coordinates in MapInfo
Professional 7.0. The Grand Traverse County parcel layer and the 1997 digital
orthophotos (DOQs) were used as the reference layers to register the aerial photographs,
19
with a resultant best approximation to a NAD 83 international feet Michigan Central zone
datum.
Land Use Survey Ball Environmental Associates (BEA) undertook a review of the MDEQ files for
Boardman Lake and Boardman River north of Sabin Dam. Prior to this file review, an
Environmental Data Resources, Inc. (EDR) report was generated for the upper Boardman
River between Cass and Keystone Roads, and the Boardman Lake area between Cass and
Barlow Roads. The EDR report presents search results from available environmental
records form the following sources:
National Priority List
Proposed National Priority List
Comprehensive Environmental Response, and Liability Information System
CERCLIS No Further Remediation Action Planned List
Corrective Action Report
Resource Conservation and Recovery Information System
Emergency Notification Response System
Underground Storage Tank Facility List
Superfund Consent Decrees
Records of Decision
National Priority List Deletions
Facility Index System/Facility Identification Initiative Program Summary Report
Hazardous Materials Information Reporting System
Material Licensing Tracking System
Mines Master Index File
Federal Superfund Liens
PCB Activity Database System
RCRA Administrative Action Tracking System
Toxic Chemical Release Inventory System
Toxic Substance Control Act List
Section 7 Tracking System

20
Federal Insecticide, Fungicide, and Rodenticide Act/Toxic Substance Control Act
Tracking System
Aboveground Storage Tanks
Former Manufactured Gas and Coal Sites
State and Hazardous Waste Sites
Solid Waste Facilities and Landfill Sites
Leaking Underground Storage Tanks
Baseline Environmental Assessments
The EDR search reviews environmental databases for a one-mile radius around the site of
interest. A map is provided in the report showing the target property and any sites of
environmental concern that result from the database search. It also provides a detailed
description of each site including the name of the company, owner phone number, source
of contamination, and other relevant information to further track the individual sites.
Also included in this report, is a summary of sites that due to poor or inadequate address
information, were not able to be mapped by EDR. Please refer to Appendix C for a copy
of the EDR reports.
The MDEQ contamination Internet database was used to determine the sites of
environmental contamination. Michigan Part 201 sites, leaking underground storage
tanks, and historic landfill databases were queried for Grand Traverse County and cross-
referenced with an Internet map provider for location in the Boardman Lake watershed.
A Freedom of Information Act (FOIA) letter was sent to the Environmental Response
and the Storage Tank Divisions (now both referred to as the Redevelopment and
Remediation Division), and the Waste Management Division (now referred to as the
Waste and Hazardous Materials Division) at the Cadillac District office requesting a file
review session. Please refer to Appendix D for a copy of the FOIA letter and list of
environmental sites of concern. Per the FOIA, BEA reviewed the relevant files at the
Cadillac District office, on October 30, 2002 and December 16, 2002. For each file
reviewed, BEA recorded the location of the site, groundwater flow from the site, the
primary contaminants of concern observed at the site, any historic sampling conducted
21
and results if indicated concentrations above residential cleanup standards, and the
current status of the site.
In October 2002, aerial photographs from 1961 were copied from the Grand Traverse
County GIS and Planning office. Aerial photos were copied for the entire Boardman
Lake watershed. Each photo was assessed for areas of contamination, and to interpret
historic wetland fills along the banks of the river and lake. Areas of soil disturbance or
environmental concern were marked and cross-referenced with the sites from the survey
of historic land uses. New areas of concern as identified were further investigated. Areas
of concern were assigned a label and mapped.
Land use and land cover were determined for the Boardman Lake watershed study area.
The Grand Traverse County 1990 land use map was used analyze land use and produce a
thematic map to describe land cover in the study area.
Historic Wetland Loss
Wetland loss in the area of South Airport Road and the Boardman River was documented
comparing 1961 and 2003 aerial photographs. In order to analyze wetland acreage
change between 1961 and 2003, a study area of just under 420 acres was selected within
the Boardman Lake watershed.
MDEQ, Michigan Resource Information System (MIRIS) data were used in conjunction
with 1961 aerial photos to develop a map of wetlands in 1961. A new 2003 wetland layer
was created through aerial interpretation of the 2003 DOQ maps, and inference of field
knowledge to better describe actual 2003 wetlands. Comparison of wetlands in 1961 and
2003 resulted in a percent wetland loss between those years.
Impervious Surface Analysis
This study sought to determine changes in impervious surface, such as roads, roof tops,
parking and other paved areas, etc. within the Boardman Lake watershed. To derive
meaningful results required developing an estimation procedure, based on established
principles for impervious surface research. A literature search found several references

22
to impervious surface determination methods. The most comprehensive reference found
was a study sponsored by the Maryland Biological Stream Survey.4 This study discusses
thresholds of area impermeability that result in degraded water quality (e.g., 10% or less
imperviousness for sensitive streams), as well as GIS methods for determining wide-area
permeability.
The most accurate way to determine surface permeability involves interpreting and
digitizing every impervious feature found in high resolution aerial imagery. This type of
effort would exceed this study’s goals, and would arguably exceed the level of detail
needed to support this ecological and hydrological evaluation. In order to analyze and
describe permeability in the study area, select areas were analyzed, and permeability
coefficients (percentages) were established that could be repeated in similar areas. A grid
of 245 1,000-foot square cells was overlain on DOQs within the study area. Each cell
was then visually inspected and either “scored” as 0% impervious - 100% permeable (no
visible man-made features) or reserved for detailed interpretation and digitizing or to
receive an applied coefficient. A total of 45 cells were given a zero score, including any
cells with 100% open water. The remaining cells were selected by “type,” i.e.,
downtown blocks, city residential, industrial, or rural residential. The next step in the
analysis involved detailed interpretation and digitizing of either the impervious features
or the permeable areas in a series of “reference” cells. If open water was present as a
portion of the cell, the water’s square footage was determined and subtracted from the
impervious calculation so that only the land portions of the area were measured for
permeability. A total of 56 reference cells or 23% of the study area received a detailed
interpretative analysis. These 56 cells then provided a reference for applying a general
visual inspection a coefficient to the remaining 144 “visual” cells that had not been
assigned an initial zero value. The visual scoring method’s accuracy was supported by
creating a visual estimate for each of the 56 analyzed cells prior to interpretation and
digitizing and then comparing assumptions to results. Visually scored cells also tended to
be like or homogenous to the reference cell. For example, cells from downtown blocks
4 Stranko, S. and B. Rodney. 2001. Habitat quality and biological integrity assessment of freshwater streams in the St. Mary’s River watershed. Maryland Department of Natural Resources, CBWP-MANTA-EA-01-2.

23
or residential neighborhoods could have very little visual variance from the reference cell
used to score that visual cell.
The formula used to calculate permeability coefficient for reference cells is (areas in
square feet):
Total Cell Area – Total Open Water Area = Total Land Area / Impervious
Surface Area (or Permeable Area) = % Impervious Area
Avian and Herpetological Surveys
Existing data from avian and herpetological surveys was compiled and used as baseline
data within the Boardman Lake watershed. Bird survey data from 1995 to 2003 was
provided GTAC, as stated previously. Surveys were conducted year-round, during
daylight hours.
Herpetological data for the Boardman Lake watershed was provided from MDNR,
Nongame Wildlife Division. Frog/toad surveys were initiated in 1988 to increase
knowledge of frog and toad abundance and distribution in Michigan at a time when frogs,
toads, and other amphibians have been shown to be declining worldwide.
In 1996, a statewide system of permanent survey routes was developed. Each route
consists of ten wetland sites, which are visited three times during spring and summer by
volunteer observers. At each site, the observer identifies the species present based on
calls and makes an estimate of their abundance. For the Boardman Lake watershed,
specific section numbers and associated routes were compiled from the MDNR survey
data. Species composition and abundance was recorded for only those sections in the
Boardman Lake watershed for years 1992 to 2002.
For existing avian surveys, data was compiled for the following areas for the associated
years:

24
Grand Traverse Education Reserve: 1995-2000
Between YMCA and Sabin Dam: 1996-2003
General Vicinity of Boardman Lake: 1987-1988, 1997-1999
Refer to Appendix E for species lists from the GTAC bird surveys. These lists represent
the compilation of many years of surveys. For ease of analysis for this study, only the
species composition was documented, not abundance of each species.
Aquatic Macrophyte Assessment
Aquatic macrophyte surveys were conducted at thirty (30) select locations along twelve
(12) transects on Boardman Lake. GLEC’s survey method is based on American Public
Health Association (APHA),5 previous GLEC macrophyte studies, and survey techniques
described in MDEQ procedures, published journal articles, and MSU publications.
A late summer/early fall survey was conducted during September 20036 to provide
reliable preliminary information on the late season plant species at the time of maximum
plant growth. At each study site, a survey transect was established perpendicular to the
shore. The number of intervals sampled along any given transect was based on
characteristics of the lake bottom and the extent of the plant growth for each area. For
example, a transect which crosses a steep drop-off may only have one or two sampling
sites along a transect because of the steep characteristics of the lake bottom while a
shallow area may have three or four sampling sites along a single transect. At each
sampling site a weighted rake with a retrieving line (i.e., a rake tow) was used to obtain
plants from all four sides of the boat (bow, stern, starboard, and port). There were twelve
(12) transects with thirty (30) sampling sites. Therefore, 120 rake tows were used to
characterize the aquatic vegetation of Boardman Lake. In addition to these rake tows,
observation were made by direct observation of the lake bottom. Relative densities were
determined based on the quantity of plants obtained by each rake retrieval, by the number
5 APHA, 2000. Standard Methods for the Examination of Water and Wastewater, Method 10040 C. Macrophyton-Vegetation Mapping. 6 Sample site 13 was collected on November 15, 2003.

25
of retrievals for which a particular species was present, as well as by direct observations
of the lake bottom when possible. Aquatic plant density ratings were assigned for each
sampling site using the following criteria:
Density Rake Method
(Lake Bottom Not Visible) Direct Observation (Lake Bottom Visible)
Dense Species fills the rake in all four casts 70 percent or greater coverage Heavy Species found mixed with other plants in all four
casts of the rake 30-70 percent coverage
Moderate Species found in three of the four rake casts 10-30 percent coverage Sparse Species found in two of the four rake casts 3-10 percent coverage Found Species found in one of the four rake casts 1 percent or less coverage Each transect was identified by shoreline landmarks and/or geographic information
systems (GPS) coordinates. Plant species collected were identified and recorded in the
field or at GLEC’s laboratory. Voucher specimens are archived at GLEC and at the
University of Michigan Herbarium. To insure maximum visibility, the surveys were
conducted on a sunny to partly sunny day with low wind, between the hours of 10:00
a.m. and 3:00 p.m. Secchi disk transparency and water temperature measurements were
taken during the survey, and a brief description of the shoreline vegetation was noted on
the data forms. The transect data was then used to compile a species list.
Benthic Macroinvertebrate Assessment Benthic macroinvertebrate sampling at the stream sites was conducted according to
MDEQ’s Procedure #51.7 Procedure #51 has been developed by MDEQ to provide a
more standardized evaluation of the biological conditions and water quality trends in
streams statewide. It provides for an analysis of the fish community, the benthic
macroinvertebrate community, and habitat quality. In this project only the latter two
components were evaluated.
7 Michigan Department of Environmental Quality, Water Division (formerly the Surface Water Quality Division). 1997. GLEAS Procedure #51 Survey Protocols for Wadeable Rivers. Chapter 25A in Schneider, James C. (ed.) 2000. Manual of fisheries survey methods II: with periodic updates. Michigan Department of Natural Resources, Fisheries Special Report 25, Ann Arbor.

26
Procedure #51 calls for streams to be scored according to a set of selected measurements
or “metrics.” A total of nine benthic macroinvertebrate metrics and nine habitat metrices
are applied to wadeable streams in Michigan.
The scores for each metric are added together resulting in a single score for each
component evaluated. The final scores are then compared to sites in the same ecoregion
within the state that have been determined as “excellent” by MDEQ biologists. These
excellent sites are used as comparative measures to which the biological and physical
parameters of all other streams are assessed.
Macroinvertebrate sampling was conducted during September of 2003, within the
recommended sampling time of June 1 and September 30 at time of low or moderate
flow. A 100-organism sub-sample was obtained from each stream site, and was
identified to the family level. Following the protocol, the macroinvertebrate community
was scored in comparison to reference sites in the same ecoregion. The stream habitats
were also scored according to MDEQ Procedure #51.
For Boardman Lake sampling sites, an Eckman dredge was used to collect sediment
samples from the edge of the macrophyte growth areas in the lake. Samples were then
sieved in the field to retain the benthic macroinvertebrates. The organisms were
identified to genus level when possible. MDEQ does not have an established protocol for
the lake habitats and the benthic scoring keys from the wadeable streams protocol are not
applicable to the lake sites. Consequently, no metrices were applied to the samples
collected in the Boardman Lake. The benthic samples were used to generally
characterize the benthic fauna of Boardman Lake. The data include a spreadsheet of the
organisms listed and enumerated by family for the tributary and river sites and to genus
for the lake sites.
Surface Water Assessment
Based on the review of MDEQ documents, a complete survey of the properties along the
river and lake within the study area was conducted. Locations of every tributary,

27
culvert/storm drain, and potential sampling site was documented with a GPS instrument.
Refer to Appendix F for descriptions of each GPS location.
A surface water assessment of Boardman Lake and Boardman River was conducted to
determine inputs of phosphorous, nitrogen, heavy metals, and E. coli bacteria. Surface
water inputs were observed during the initial shoreline assessment form Sabin Dam to the
mouth of Grand Traverse Bay. Surface water was collected from tributaries, culverts,
storm drains and other inputs entering Boardman Lake and Boardman River within the
study area. All surface water samples were collected as grab samples using EPA Method
SW-846 protocol. All samples were collected by BEA. Tributary samples were
collected at the mouth where the tributary entered the river on July 23, 2003.
Temperature, pH, and any other relevant observations were noted at each sampling point
during the sampling event. These samples were collected in 250 ml glass and/or plastic
bottles provided by GLEC. Each sample was submitted to GLEC laboratory under chain
of custody, and analyzed for E. coli, total nitrogen, and total phosphorous. Surface water
samples were collected from waters above pore water or “hyporheic zones” along the
former Keystone dump, former Boot Lake dump, and the Lear Corporation. Samples at
South Airport Road were collected from road runoff to Boardman River during a storm
event. Samples were collected and analyzed for Michigan 10 metals, total phosphorous,
and total nitrogen. Surface water from three culverts and storm drains was also collected
on July 23, 2003. Surface water from eight culverts and storm drains was collected
during a heavy rain event on October 3, 2003. A sample of surface water was also
collected from the Boardman River mouth at Grand Traverse Bay on July 23, 2003.
Surface water samples were collected in 500 ml plastic jars and analyzed for Michigan 10
metals at SOS Laboratory in Traverse City. All other samples were analyzed at GLEC.
E. coli colonies per 100 ml were compared to two U.S. EPA total body contact water
quality standards for bacteria and is summarized in the following paragraph:8
8 U.S. EPA report # 821-R-97-004. 2000. Improved Enumeration Methods for Recreational Water Quality Indicators: Enterococci and Escherichia coli. U.S. EPA Office of Water, Office of Science and Technology, Health and Ecological Criteria Division, Washington D.C.

28
“All waters of the state protected for total body contact recreation shall not
contain more than 130 E. coli per 100 milliliters, as a 30-day geometric mean.
Compliance shall based on the geometric mean of all individual samples taken
during 5 or more sampling events representatively spread over a 30-day period.
Each sampling event shall consist of 3 or more samples taken at representative
locations within a defined sampling area. At no time shall waters of the state
protected for total body contact recreation contain more that a maximum of 300 E.
Coli per 100 milliliters. Compliance shall be based on the geometric mean of 3 or
more samples taken during the same sampling event at representative locations
within a defined sampling area.”
Total nitrogen and total phosphorus concentrations were compared to the U.S. EPA
Ambient Water Quality Criteria Recommendations for rivers and streams in Nutrient
Ecoregion VII.9 Several different U.S. EPA databases were consulted for comparison
values for total phosphorous. From a study conducted in 1993, the North and South
Branches of the Boardman River and Jack’s Creek indicated phosphorous levels between
0 and 20 ug/L with a mean value of 8.85 ug/L (source: U.S. EPA Nutrient Criteria
Database). From various studies on the Boardman River from 1967 to 1993, total
phosphorous levels ranged between 0 and 340 ug/L with a mean of 86.0 ug/L (source:
U.S. EPA Legacy STORET database).
According to the MDNR state designated uses for the Boardman River:
“The Boardman River is to be protected for recreation – total body contact
(i.e., swimming); intolerant fish – cold water species; industrial water
supply; agricultural and commercial water supply and other uses.”
9 U.S. EPA report # 822-B-00-018. 2000. Ambient Water Quality Criteria Recommendations and Information Supporting the Development of State and Tribal Nutrient Criteria for Rivers and Streams in Nutrient Ecoregion VII. U.S. EPA Office of Water, Office of Science and Technology, Health and Ecological Criteria Division, Washington D.C.

29
Based on these designated uses, criteria for surface water protection is based on Rule
323.1057 Water Quality Values of Part 4 Water Quality Standards from the Water
Division of MDEQ.10 The following values were compared to the sample result
concentrations for Michigan 10 metals.
Human Non-cancer Value (HNV): “means the maximum ambient water
concentration of a substance at which adverse non-cancer effects are not
likely to occur in the human population from lifetime exposure through
either drinking the water, consuming the fish from the water, and
conducting water-related recreation activities.”
Aquatic Maximum Value (AMV): “means the highest concentration of a
material in the ambient water column to which an aquatic community can
be exposed briefly without resulting in unacceptable effects.”
Final Chronic Value (FCV): “means the level of a substance or a mixture
of substance that does not allow injurious or debilitating effects in an
aquatic organism resulting from repeated long-term exposure to a
substance relative to the organism’s lifespan.”
Final Acute Value (FAV): “means the level of a chemical or mixture of
chemicals that does not allow the mortality or other specified response of
aquatic organisms to exceed 50% when exposed for 96 hours, except
where a shorter time period is appropriate for certain species.”
Wildlife Value (WV): “means the maximum ambient water concentration
of a substance at which adverse effects are not likely to result in
population-level impacts to mammalian and avian wildlife populations
from lifetime exposure through drinking water and aquatic food supply.”
10 Administrative Rules, Part 4. Water Quality Standards, promulgated pursuant to Part 31 of the Natural Resources Environmental Protection Act, 1994 PA 451, as amended.
30
Results
Land Use Survey A total of forty-three (43) sites of environmental concern were identified and evaluated
within the Boardman Lake watershed from MDEQ Part 201, Leaking Underground
Storage Tank, Waste Management and general county files. Please refer to Appendix G
for a complete list and a mapped description of each site. The current status of each site
was assessed and recorded. Twenty-nine (29) sites were determined to currently
represent potential threats to Boardman Lake and/or Boardman River (indicated by two
asterisks after the heading name in Appendix G), and thirteen (13) sites were “closed”
according to MDEQ standards. Based on this assessment, many sites have undergone or
are currently undergoing soil or groundwater monitoring (13 sites), soil excavation (14
sites), or both.
Historic Wetland Loss
The GIS analysis of wetland loss focused on the area of South Airport Road and the
Boardman River. The 1961 digitized aerial photographs were aligned in a mosaic and
compared to 2003 aerial photographs for wetland loss analysis. Refer to Figure 2 for a
map of the 1961 aerial photo mosaic and Figure 3 for a map of the 2003 digital
orthophoto. This analysis determined that in 1961 there were approximately 126 acres
of functional wetlands in this area, while 80 acres existed at the time of this study. The
wetland analysis demonstrated an approximate loss of 46 acres, or 36% of wetlands lost
during this period. Refer to Figure 4 for the wetland loss analysis.
Impervious Surface Analysis
A total of 45 cells were given a score of zero, and 56 reference cells or 23% of the study
area received a detailed impervious surface analysis. The remaining 144 cells were
visually inspected and given a permeability coefficient based on the initial analysis of the
56 cells. Of the total 245 cells analyzed, impervious surface for the Boardman Lake
watershed was determined to be 24.7%. Refer to Figure 5 for the results of the
impervious surface analysis.
31
Avian and Herpetological Surveys A total of seventy (70) bird species were observed from the YMCA property to Sabin
Dam between 1996 and 2003, and 85 bird species were observed between 1995 and 2000
at the Grand Traverse Nature Reserve. Refer to Appendix E for a complete species list
for both sites.
Herpetological surveys were compiled for six routes in the Boardman Lake watershed,
within Grand Traverse County. Data was compiled for years 1996-2002 for only those
sections that fall within the delineated Boardman Lake watershed from the Grand
Traverse County data set (of Zone 2 from the statewide dataset). Sections 2, 3, 10, and
11 of the City of Traverse City and sections 14, 15, 20, 22, 23, 27, and 28 of Garfield
Township include the area of the Boardman Lake watershed where the MDNR surveys
were conducted. The following wetland types were surveyed in the Boardman Lake
Watershed:
Vernal Pond A small body of standing water that forms in the spring from
meltwater and are often dry by mid-summer or may even be dry
before the end of the spring growing season. Many vernal ponds
occur in depressions in agricultural areas, but may also be found in
woodlots. Wetland vegetation may become established but are
usually dominated by annuals.
Wet Meadow Wet meadows usually look much like a fallow field except that
they are dominated by water-loving grasses and sedges. They will
contain nearly 100% vegetative cover with very little or no open
water. Any surface water present is temporary or seasonal and
only during the growing season in the spring. Wet meadows often
form a transition zone between aquatic communities and uplands
with soils that are often saturated and mucky.

32
Bog or Fen Bogs are found on saturated, acid peat soils that are low in
nutrients. They support low shrubs, herbs and a few tree species
on a mat of sphagnum moss. Some bogs are totally overgrown and
some consist of open water surrounded by floating vegetation.
Acid-tolerant plants found in and around bogs include woody
plants such as Labrador tea, poison sumac, tamarack, and black
spruce. Many species of orchids prefer bog habitats, as do insect-
eating sundews and pitcher plants. Bogs are usually only found in
the northern part of Michigan.
Fens are similar to bogs except that the soils are more alkaline
because they result form water passing through calcareous
deposits. Fens have a higher plant diversity that bogs due to higher
nutrient levels. Fens can be found in the southern part of
Michigan.
Marsh Marshes have standing water from less than an inch up to 3 feet
deep. The amount of water can fluctuate seasonally or from year
to year. They are dominated by soft-stemmed emergent plants
such as cattails and rushes. Vegetative cover is usually around
50%. In Michigan, marshes can be found at the edge of some
rivers and lakes, in lowlands and depressions, and in swales
between sand dunes.
Wooded Swamp Wooded swamps are aptly named because they are dominated by
woody plants such as shrubs and/or trees. The soil is saturated
throughout the growing season. Some may become dry during the
summer months. In Michigan, trees and shrubs found in wooded
swamps include red and silver maple, cedar, balsam, willow, alder,
black ash, elm and dogwood. They often occur along streams or
on floodplains, in flat uplands or shallow lake basins.

33
Pond Ponds are bodies of water that are less than 20 acres in size and do
not dry up during summer months. There is little emergent
vegetation but some floating vegetation may occur around the
edges.
Northern spring peeper numbers were the highest for all species which is consistent with
statewide occurrences. The western chorus frog showed a statistically significant
increase over the last eight years statewide.11 According to this study’s results, the
western chorus frog showed a general increase from 1999 to 2001 (a range of 3 to 16
occurrences) and a drop again in 2002 (only 9 occurrences). Both the northern leopard
frog and the eastern American toad showed statewide declines from 1996 to 2002,
although not significant. Both species occurrences in the Boardman Lake watershed
showed stable numbers. However, these findings suggest that the northern leopard frog
was “rare.” Refer to Table 1 for a table of species and occurrences in the Boardman Lake
watershed.
Based on the 1990 land use analysis for the Boardman Lake watershed and available
aerial photographs, non-residential and commercial land is found primarily in the
southern portion of the study area. Of the 4,594 acres in the Boardman Lake Watershed,
only 420 acres are upland hardwood, 251 are conifer forest, and 97 acres are wetland and
would be considered undeveloped and thereby available for wildlife.
Aquatic Macrophyte Assessment
Thirteen (13) transects, which included a total of thirty-four (34) sampling sites, were
sampled for aquatic plants. Eleven (11) different species of submerged and floating
leaved aquatic plants, and four species of green algae were identified during the survey
(Refer to Table 2). No threatened or endangered aquatic plants were observed in
Boardman Lake during this survey. An exotic plant species, Xanthium stromarium
(cocklebur), was identified in a disturbed area near the newly constructed boat launch on
11 According to statewide trend analysis from survey data (1996-2002): www.michigan.gov/dnr
34
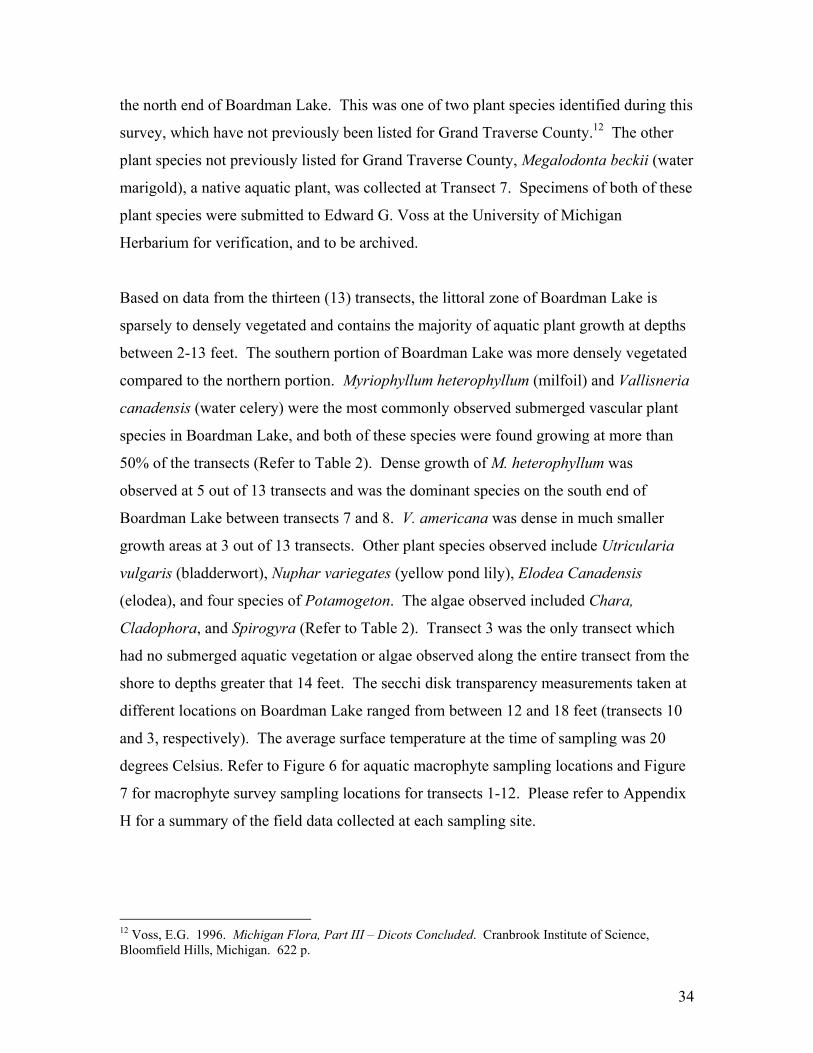
the north end of Boardman Lake. This was one of two plant species identified during this
survey, which have not previously been listed for Grand Traverse County.12 The other
plant species not previously listed for Grand Traverse County, Megalodonta beckii (water
marigold), a native aquatic plant, was collected at Transect 7. Specimens of both of these
plant species were submitted to Edward G. Voss at the University of Michigan
Herbarium for verification, and to be archived.
Based on data from the thirteen (13) transects, the littoral zone of Boardman Lake is
sparsely to densely vegetated and contains the majority of aquatic plant growth at depths
between 2-13 feet. The southern portion of Boardman Lake was more densely vegetated
compared to the northern portion. Myriophyllum heterophyllum (milfoil) and Vallisneria
canadensis (water celery) were the most commonly observed submerged vascular plant
species in Boardman Lake, and both of these species were found growing at more than
50% of the transects (Refer to Table 2). Dense growth of M. heterophyllum was
observed at 5 out of 13 transects and was the dominant species on the south end of
Boardman Lake between transects 7 and 8. V. americana was dense in much smaller
growth areas at 3 out of 13 transects. Other plant species observed include Utricularia
vulgaris (bladderwort), Nuphar variegates (yellow pond lily), Elodea Canadensis
(elodea), and four species of Potamogeton. The algae observed included Chara,
Cladophora, and Spirogyra (Refer to Table 2). Transect 3 was the only transect which
had no submerged aquatic vegetation or algae observed along the entire transect from the
shore to depths greater that 14 feet. The secchi disk transparency measurements taken at
different locations on Boardman Lake ranged from between 12 and 18 feet (transects 10
and 3, respectively). The average surface temperature at the time of sampling was 20
degrees Celsius. Refer to Figure 6 for aquatic macrophyte sampling locations and Figure
7 for macrophyte survey sampling locations for transects 1-12. Please refer to Appendix
H for a summary of the field data collected at each sampling site.
12 Voss, E.G. 1996. Michigan Flora, Part III – Dicots Concluded. Cranbrook Institute of Science, Bloomfield Hills, Michigan. 622 p.

35
Benthic Macroinvertebrate Assessment Benthic scores for the benthic macroinvertebrate survey sites on the Boardman River and
tributaries ranged from –6 to 0 (Table 3). The lowest scores was reported for site R2
which is located on the Boardman River upstream of Eighth Street. As indicated in the
table this result should be interpreted with caution as Procedure #51 is designed for
wadeable streams and the Boardman River is not wadeable at this location. The other
survey sites which qualify as wadeable streams scored between –1 to 0, and range from
“neutral” to “acceptable tending towards poor,” according to the scoring key. The habitat
scores for the wadeable sites ranged from 110-137, which is considered “good” according
to Procedure #51. Please refer to Appendix I for a list of benthic organisms observed at
each of the Boardman River survey sites.
Benthic macroinvertebrate samples from the Boardman Lake were collected at five of the
macrophyte sampling locations (transects 2, 3, 4, 5, and 13) and on the same day during
September of 2003. Three sample sites were located on the east side of Boardman Lake
and two on its west side (Refer to Figure 6). The majority of the organisms collected
during the benthic macroinvertebrate survey of Boardman Lake were zebra mussels
(Dreissena polymorpha), a non-native invasive clam. This species accounted for 53-77
percent of the organisms collected at four of the five sampling sites on Boardman Lake.
Sample site #3 was the only site where no zebra mussels were observed. However, this
site was also the only site where the 100-organism sub-sample could not be collected; a
total of six organisms were collected while expending the same sampling effort as at the
other sites. A list of benthic macroinvertebrates organisms observed at each of the five
sites is provided in Appendix I. Refer to Table 4 for a summary of macrophyte and
benthic macroinvertebrate data, and zebra mussel data for sites 2-5.
The sediment grain size analysis conducted at transects 2, 3, 4, 5, and 13 indicate the
sediment at sample site 3 and 13 are different from the other three sites. The sediment
sample collected at transect 3 had a much lower percentage of fine sediment (4%) and a
much higher percentage of gravel (71%). Sample 13 had a large percentage of fines
(76%) with little sand or gravel when compared to the other three samples collected. The

36
remaining three samples analyzed (2, 4, and 5) had 21-26% fines, 5-15% gravel, 59-73%
sand (Refer to Table 5). Sampling locations for the benthic surveys are provided in
Figure 6.
Surface Water Quality Assessment
Surface water from thirteen (13) tributaries, three culverts and storm drains, and the
mouth at Grand Traverse Bay were sampled and tested for E. coli, total phosphorus, and
total nitrogen. Surface water from two sites on Boardman Lake (Lear Corporation and
former Boot Lake Dump) and one from Boardman River (former Keystone Dump) were
sampled and tested for total phosphorus and nitrogen only. Surface water from seven
culverts and storm drains were sampled and analyzed for total phosphorous only. Four
tributaries (TR-1, TR-2, TR-6, and TR-11) and one culvert (C-5) were found to be above
MDEQ standards for E. coli colonies per 100 ml water13. TR-11 is the Kid’s Creek
tributary entering Boardman River near the Front Street bridge. Given the very high
concentration (1203 colonies/100 ml) from C-5, interpretation of the comparison of the
values is warranted. No samples were above U.S. EPA Ambient Water Quality Criteria
for total nitrogen. Six tributaries (TR-1, TR-6, TR-7, TR-8, TR-10, and TR-11), eight
culverts (C-5, C-BF, C-6, C-8, C-9, C-11, C-18, and C-SA) and surface water from the
mouth of Grand Traverse Bay exceeded the U.S. EPA Nutrient Criteria range of values
for total phosphorous. Again, C-5 was very high showing a total phosphorous
concentration of 482 ug/L. Refer to Table 6 for analytical results.
Surface water from six culverts, three sites along Boardman Lake and the mouth at Grand
Traverse Bay were sampled and analyzed for Michigan 10 metals including, Arsenic,
Barium, Cadmium, Chromium, Copper, Lead, Mercury, Selenium, Silver, and Zinc. No
sample concentrations exceeded the MDEQ Rule 57 Water Quality Standards for human
non-cancer or wildlife values. Only four (4) sample locations came up above the non-
detect level, but were still well below the state standards. Surface water sampled at the
Lear Corporation (LC) resulted in a barium concentration (0.96 mg/L) exceeding the final
13 These results need to be viewed with caution given that we collected only one (1) sample during a one-day sampling event (see Methods section).

37
chronic value (FCV) (0.781 mg/L) for aquatic life in Boardman Lake as defined by Rule
57. Refer to Table 7 for analytical results for Michigan 10 metals. Please refer to Table
8 for a complete list of surface water assessment sample locations, chemicals analyzed,
and other notes and Figure 8 for a surface water assessment map.
Findings and Recommendations
The Boardman Lake watershed was delineated, and determined to comprise 7.2 square
miles or 4,953.9 acres. The Boardman Lake watershed, if considered originating at Sabin
Dam, is entirely within the City of Traverse City and Garfield Township. The watershed
boundary is defined by the flow direction and ultimate discharge location of storm water
drains within the City of Traverse City.
A land use survey was completed by a review of historic aerial photographs and the
review of MDEQ Part 201, Hazardous and Solid Waste, Leaking Underground Storage
Tank, and general county file sites (refer to Appendix G). This list represents a
comprehensive review of MDEQ files relating to potential threats to water quality within
the Boardman Lake watershed. This evaluation is intended to guide further monitoring,
remediation, restoration, and redevelopment within the watershed. Given that these files
were evaluated during the summer of 2002, it is recommended that this review be
updated prior to any future land use decision-making.
This study indicated a 46 acre or 36% wetland loss in the area of South Airport Road and
Boardman River. “Impervious” or paved surfaces within the Boardman Lake watershed
were calculated as 24.7 percent. Water quality degradation is known to occur within
watersheds within the Midwest U.S. at approximately 10 percent impervious cover. Of
the nearly 112 avian species observed from Sabin Dam to South Airport Road,
approximately 42 species depend on wetland habitat either for nesting or forage, or both.
Herpetological surveys indicate findings consistent with statewide and nationwide trends
of a general decline in species occurrence.

38
Eleven (11) macrophyte species were surveyed in Boardman Lake, likely indicative of a
moderately diverse aquatic plant community. Nichols (1998) reports the number of
different species per lake on a statewide basis for the State of Wisconsin ranged from 1 to
44, with a median value of 13 and an upper quartile value of 20 species.14 The
macrophyte survey documents the plant growth zone of Boardman Lake exists at depths
between 2 and 14 feet. The littoral zone within Boardman Lake is similar to that found in
many inland lakes of the Midwest of the U.S. Secchi disk transparency readings
surveyed were in the range of 12 to18 feet in water depth, as would be expected for an
area inland lake with good water quality.
No exotic aquatic plant species were observed during this survey of Boardman Lake.
This is important to note, given that two heavily used public accesses exist on the lake.
Public access sites are often common sources of invasive aquatic plant species.15
The south end of Boardman Lake has very dense plant growth, with Myriophyllum
heterophyllum being the dominant species. This plant species provides excellent habitat
for small aquatic invertebrates, therefore good fish habitat. Plant growth in the shallow,
soft sediments of the south end of the lake should be expected. However, dense plant
growth (areas of 70 percent or more plant coverage) was observed across the south end of
Boardman Lake. These findings are indicative of high nutrient levels in the surface water
and/or sediments. Therefore, it is likely that Boardman Lake is receiving, or has
received, high nutrient inputs from the Boardman River upstream from South Airport
Road. Surface water tributaries and groundwater are often significant sources of
nutrients to lakes. The southern end of Boardman Lake consists of a delta or “alluvial
fan,” most likely a collecting sink of sediment and nutrients from the entire upper
Boardman River watershed. This upstream portion of the Boardman River has also been
extensively dredged, likely historically contributing a large quantity of sediment to
Boardman Lake. 14 Nichols, S.A. 1998. Floristic quality assessment of Wisconsin lake plant communities with example applications. Lake and Reservoir Management. 15(2):133-141. 15 Michigan State University. 2000. A citizen’s guide for the identification, mapping and management of the common rooted aquatic plants of Michigan lakes. Department of Fish and Wildlife, Michigan State University.

39
Results from the benthic macroinvertebrate study, and from direct observation, indicate
that the macroinvertebrate population of Boardman Lake is largely dominated by the
zebra mussel, an invasive exotic species. Although, a variety of different
macroinvertebrates were identified at some sites with Boardman Lake, 60-77 percent of
the organisms collected were zebra mussels. Sample site R2 (in the same vicinity as sites
70 and 71 of the MDEQ and GLEC sediment studies) received a very low benthic score
(-6), and possessed the highest number of zebra mussels than any other site. From the
MDEQ 1997 report, river bottom sediment at site 70 (approximately 200 yards
downstream from the outfall of the Traverse City Wastewater Treatment Plant) evidenced
copper, arsenic, iron, manganese, mercury, and several polynuclear aromatic
hydrocarbons above U.S. EPA ESLs (or ecological screening levels). At site 71
concentrations of arsenic, copper, manganese, mercury, and several petroleum
constituents exceeded the U.S. EPA ESLs.16
Boardman lake sediments collected at five sites included many old shell fragments of
various native mollusk species, while few live mollusks (other than the exotic zebra
mussel) were found. This suggests that native mollusks are being or have been out-
competed by zebra mussels. The only site found without zebra mussels was sample site 3
(see Figure 7). Interestingly, this was also the only site where no macrophyte or algal
growth was observed, and very few benthic organisms were found to be present (refer to
Table 4). This zone consists of a distinct area roughly 330 feet in radius around site 3.
Further, sediment at site 3 was primarily gravel, in contrast to the other three sample sites
which were mostly sand and silts/fines (refer to Table 5). The predominance of gravel at
this location could account for the lack of plant and benthic macroinvertebrate species,
but does not explain the lack of zebra mussels which tend to prefer hard substrates.
Perhaps nutrient levels within sediments are also low in this area, however no plants or
other filter-feeding organisms were found within the water column above this area. The
sediment in this area also possessed numerous mollusk shell fragments, as was observed
16 This finding should be interpreted with caution given that site R2 is located within a section of the Boardman River that is deeper than the criteria for a wadeable stream found within MDEQ Procedure #51.

40
in other parts of Boardman Lake. These shell fragments could have been deposited by
littoral zone currents, or could be the remains of former native mollusk communities.
This area of concern is in the vicinity of a former industrial site with heavy metals,
solvents, and petroleum constituents in soils known to be above MDEQ residential soil
cleanup criteria. Although the gravel substrate and low nutrient levels might explain the
lack of organisms observed at site 3, these conditions should be further investigated.
The results of the macroinvertebrate study within the Boardman River and its tributaries
document the presence of “satisfactory” to “poor” benthic communities, with
corresponding habitat ratings of “good.” No “excellent” macroinvertebrate ratings were
found within rivers and streams studied in the Boardman watershed, which might be an
expected result from an area draining approximately 7.2 square miles of primarily
developed land area. It is noteworthy to compare these stream scores to sites further
upstream in the Boardman River watershed sampled by the Grand Traverse Conservation
District during June of 2003. According to Grand Traverse Conservation District
researchers, the upstream sites scored considerably higher than the sites near Boardman
Lake.
The results of surface water quality assessment undertaken as a part of this study indicate
nutrient loading, as phosphorous pollution, at six tributaries (unnamed Boardman River
tributaries TR-1, TR-6 TR-7, T-8, TR-10 at YMCA, and TR-11 at Kid’s Creek), and
eight stormwater outfalls or “culverts” discharging to the Boardman River within the City
of Traverse City identified as C-5, C-BF, C-6, C-8, C-9, C-11, C-18, and C-SA at South
Airport Road. See Table 6 for locations of coded tributaries and culverts. Surface water
analyses indicate moderate bacterial pollution as indicated by E. coli levels at four
tributaries (upstream unnamed tributaries TR-1, TR-2, TR-6, and TR-11 at Kid’s Creek),
and very high bacteria levels at culvert C-5. C-5 is located within the southeast bank of
the Cass Street bridge over the Boardman River near the dam in Traverse City. Heavy
metals were analyzed from roof top runoff to the Boardman River in downtown Traverse
City, and from surface waters above the groundwater-surface water interface along
Boardman Lake near select sites. These results indicate the presence of barium, only, in

41
concentrations of concern in open waters along the Boardman Lake shoreline near the
Lear Corporation. Finally, very warm water (96.8 degrees Fahrenheit or 36.0 degrees
Celsius) was observed discharging to the lower Boardman River from an outfall (C-44) at
the southeast corner of the Cass River bridge near Grandview Parkway.
Recommendations
Based on these findings, it is recommended that:
• Of the total 43 sites of environmental contamination identified within the
watershed, 29 sites or 67 percent were determined to currently represent
potential threats to Boardman Lake or Boardman River. It is
recommended that sites with existing or potential contamination be
investigated, remediated, and/or redeveloped in compliance with state
and/or federal regulations.
• Historic wetland loss has occurred within the Boardman Lake watershed.
It is recommended future wetland loss be avoided, minimized, and
effectively mitigated in accordance with state and federal law to protect
and enhance the water quality of Boardman Lake and Boardman River.
• Impervious surfaces within the Boardman Lake watershed are currently
over 2.5 times the threshold known to result in degraded water quality. It
is strongly encouraged that innovative storm water management and land
use development practices be implemented within the watershed to protect
and enhance water quality.
• Nutrient loading, bacterial contamination, heavy metal concentrations,
and/or thermal pollution were documented within five tributaries to
Boardman River between Sabin Dam and Boardman Lake, at Kid’s
Creek’s outlet to the Boardman River, at seven stormwater culverts along
the Boardman River within the City of Traverse City, and within open

42
waters off the Lear Corporation property on Boardman Lake. It is
recommended that these locations be further evaluated to determine the
source(s) and nature of water quality problems, and encourage the
implementation of corrective measures.
• Aesthetic impact has occurred along the banks of Boardman Lake adjacent
to the former Boot Lake Dump, and along the Boardman River at the
former Keystone dump. It is recommended that these locations be further
evaluated to determine the source(s) and nature of water quality problems,
and encourage the implementation of corrective measures.
• Land uses/practices should be studied within areas contributing storm
water to culverts referred to in this study as C-5 and C-44. The results of
these investigations should be addressed by corrective actions (such as
animal husbandry, improved catchment maintenance, reduced fertilizer
use, elimination of cooling water discharge, increased use of low impact
development storm water treatment technologies, etc.). Ongoing
education efforts should be initiated to reduce and minimize nutrient
loading, bacterial contamination, and thermal pollution to the receiving
waters of Boardman River.
• An area lacking plant, animal, and insect life within the “benthic” or
bottomland of Boardman Lake (referred to as site 3) was found within an
area east of the ends of Thirteenth and Fourteenth Streets. This area
should be further surveyed and investigated, including historic shoreline
land use, to attempt to determine the nature, cause, and extent of this
phenomenon.
• Previous studies have documented sediment contamination “hot spots”
within Boardman River bottomlands at two locations downstream of the
outlet of Boardman Lake (MDEQ Sediment Contamination Survey, 1997,

43
sites 70 and 71). These locations should be further investigated to
determine the feasibility of remedial actions, and considered within future
land use or river restoration plan, if any.
• Land use planning and regulation within watershed municipalities are
encouraged to explore the application of “low impact development”
techniques such as roof top treatment, rain gardens and infiltration
structures within built areas to manage, minimize, and effectively treat
storm water runoff before it enters the waters of Boardman Lake or
Boardman River. Great opportunity exists to employ these cost effective,
low technology storm water control practices within the watershed.
• Tires, drums, various scrap metal, wooden pallets, bricks/ceramics, and
other debris should be removed from the Boardman River adjacent to the
former Grand Traverse Auto, Keystone Road dump, former Firestone
building, and the southern end (especially southeastern sections) of
Boardman Lake.
• An overall education program should be initiated and sustained to promote
shoreline buffer retention and replacement, minimize vegetation removal
and mowing to the waters edge, eliminate the dumping of grass clippings
and/or solid wastes into the waters of Boardman Lake and Boardman
River.

Table 1. Boardman Lake Watershed Herpetological Survey Species List and Occurances*
Year &Common # Observed
Species Name 1996 1997 1998 1999 2000 2001 2002 TotalPseudacris triseriata triseriata Western Chorus Frog 9 7 5 3 12 16 9 61Pseudacris crucifer crucifer Northern Spring Peeper 38 44 41 39 28 35 29 254Rana sylvatica Wood Frog 8 7 6 2 0 3 2 28Hyla versicolor, H. chrysoscelis Gray Tree Frog 16 7 8 13 11 23 14 92Rana pipiens Northern Leopard Frog 1 1 0 1 2 0 0 5Bufo americanus americanus Eastern American Toad 6 14 17 13 8 14 10 82Rana clamitans melanota Green Frog 5 11 12 16 7 6 9 66Rana catesbeiana Bull Frog 0 0 0 0 5 0 0 5
Total 83 91 89 87 73 97 73 593
* This is a composite list from approximately 6 routes (and at least 60 stations) in 11 Sections within the Boardman Lake Watershedboundary delineated for this study.

Table 2. List of Aquatic Plants Identified During September 2003 Survey of Boardman Lake
Scientific Name Common Name Ecological
Tolerance Location (Transect #)
Chara spp. (2 different species observed)
stonewort NTT 6, 8
Chladophora sp. green algae NTT 12
Spirogyra sp. filamentous green algae
PT 8, 9
Elodea canadensis elodea TT 6, 7, 8, 9,13
Megalodonta beckii var. beckii
Beck’s water-marigold NTT 7
Myriophyllum heterophyllum variable leaf milfoil 1,4,5,6,7,8,9,10,12 13
Nuphar variegatus yellow pond lily 1, 10
Potamogeton amplifolius large-leaf pondweed 4, 6, 12, 13
Potamogeton praelongus white-stem pondweed NTT 9
Potamogeton richardsonii clasping-leaf pondweed DT 7
Potamogeton zosterformis flat-stem pondweed NTT collected between 7 & 8
Stuckenia pectinata sago pondweed collected between 7 & 8
Utricularia vulgaris great bladderwort TT 4
Vallisneria americana water celery 1,2,4,5,6,9,11,12
bolded = dense growth PT = Pollution Tolerant DT=Tolerant of Disturbance TT= Turbidity Tolerant, NTT= Not Turbidity Tolerant Refer to Figure 6 for sample locations.
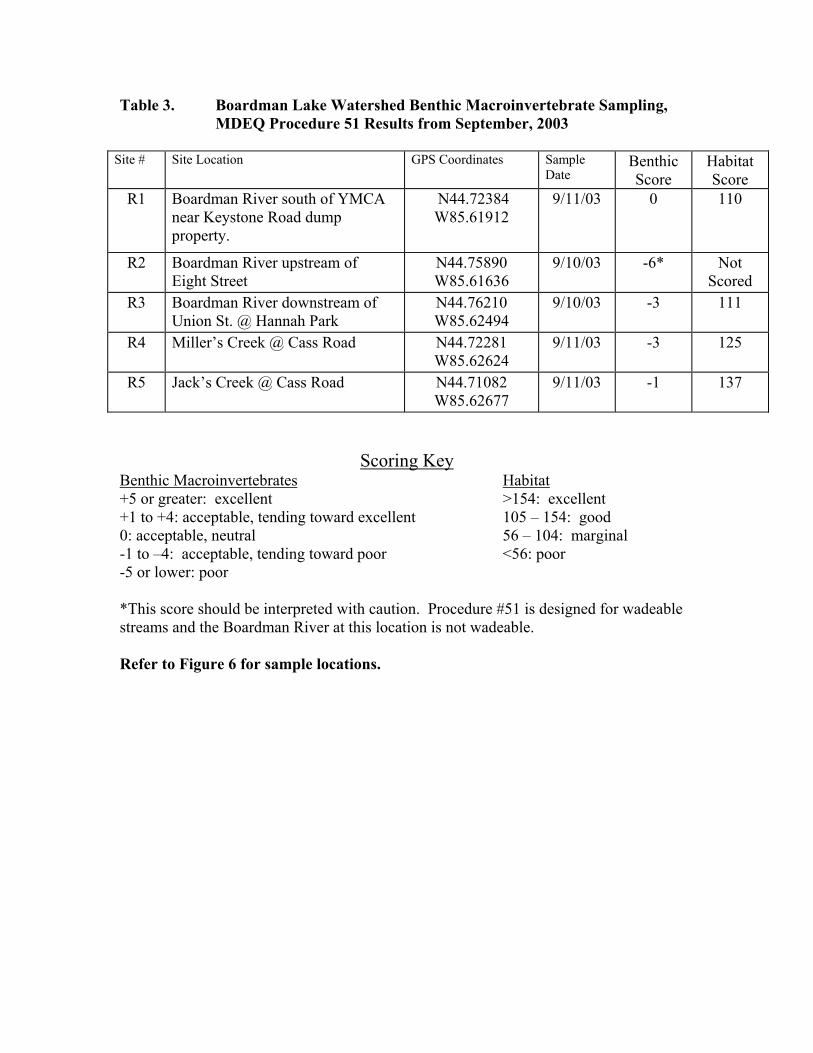
Table 3. Boardman Lake Watershed Benthic Macroinvertebrate Sampling, MDEQ Procedure 51 Results from September, 2003
Site # Site Location GPS Coordinates Sample
Date Benthic Score
Habitat Score
R1 Boardman River south of YMCA near Keystone Road dump property.
N44.72384 W85.61912
9/11/03 0 110
R2 Boardman River upstream of Eight Street
N44.75890 W85.61636
9/10/03 -6* Not Scored
R3 Boardman River downstream of Union St. @ Hannah Park
N44.76210 W85.62494
9/10/03 -3 111
R4 Miller’s Creek @ Cass Road N44.72281 W85.62624
9/11/03 -3 125
R5 Jack’s Creek @ Cass Road N44.71082 W85.62677
9/11/03 -1 137
Scoring Key Benthic Macroinvertebrates Habitat +5 or greater: excellent >154: excellent +1 to +4: acceptable, tending toward excellent 105 – 154: good 0: acceptable, neutral 56 – 104: marginal -1 to –4: acceptable, tending toward poor <56: poor -5 or lower: poor *This score should be interpreted with caution. Procedure #51 is designed for wadeable streams and the Boardman River at this location is not wadeable. Refer to Figure 6 for sample locations.

Table 4. Summary of Macrophyte and Benthic Macroinvertebrate Data for Boardman Lake Sample Sites 2-4. Site Identification
# of Different Plant Species
# of Benthic Macroinvertebrate Taxa
% Zebra Mussels
2 2 (dense growth) 16 60
3 0 4* 0
4 4 (dense growth) 8 77
5 2 (dense growth) 11 69
5 3 (dense growth) 16 52
Table 5. Sediment Grain Size Percentage for Boardman Lake Sediment Samples
Collected September/November, 2003 Sediment Grain Size SITE
2
SITE
3
SITE
4
SITE
5
SITE
13 fines >0.063 mm 23 4 26 21 76
sand 0.063-0.125 mm 7 1 8 7 8
sand 0.125-0.25 mm 13 3 16 18 10
sand 0.25-0.5 mm 28 11 18 18 5
sand 0.5-2.0 mm 25 10 17 18 1
gravel > 2.0 mm 5 71 15 17 0
* Equal sampling effort was extended but only 6 organisms were found at this site. Refer to Figure 6 for sample locations.

Table 6. Boardman Lake and River Sample Results for E. Coli, Total Phosphorous, and Total Nitrogen.
N-NO2/NO3 TKN E. coli DateTotal P Nitrogren Nitrogren (colonies/ Collected
Sample ID (ug/L)** (mg/L)^ (mg/L)^^ 100mL)***
TR-1 34.1 0.37 <0.3* 225 7/23/2003TR-1 34.1 0.37 <0.3* 7/23/2003TR-2 6.5 1.1 1.6 167 7/23/2003TR-2 7.7 1.1 7/23/2003TR-3 9.1 2.2 0.3 24 7/23/2003TR-4 18.6 0.31 0.34 81 7/23/2003TR-4a 18.9 0.2 0.38 27 7/23/2003TR-5 13.6 0.21 <0.3* 61 7/23/2003TR-5a 15.1 0.35 <0.3* 29 7/23/2003TR-6 25 0.03 <0.3* 187 7/23/2003TR-7 21.3 0.9 0.37 54 7/23/2003TR-7 21 0.9 7/23/2003TR-7 22.3 0.9 7/23/2003TR-8 61.8 0.18 0.89 68 7/23/2003 TR=TributaryTR-10 21.2 0.14 0.42 84 7/23/2003 C=CulvertTR-11 21.4 0.6 <0.3* 579 7/23/2003 C-BF=Culvert at Boardman and FrontC-5 482 1.9 0.52 1203 7/23/2003 B-M=Boardman MouthC-44 8.9 0.25 <0.3* 0 7/23/2003 KD=Keystone Road DumpC-BF 21.4 0.25 <0.3* 0 7/23/2003 BL=Boot Lake DumpBM 24 0.5 0.36 65 7/23/2003 LC=Lear CorporationKD 1.9 0.54 0.58 7/23/2003 SA=South Airport at Boardman RiverBL 7 0.34 0.36 9/18/2003 P=PhosphorousBL 6.5 0.31 9/18/2003BL 7.6 9/18/2003LC 8.1 0.34 <0.3* 9/18/2003LC 0.34 9/18/2003LC 0.33 9/18/2003C-6 103 10/3/2003C-8 142 10/3/2003C-9 39.8 10/3/2003C-11 234 10/3/2003C-18 38.3 10/3/2003C-51 10/3/2003SA 56.7 10/3/2003
* Analyte was non-detect** US EPA Nutrient Criteria range for Boardman River= 0-20 ug/L^ US EPA Ambient Water Quality Criteria Recommendations for surface water in Region 5 and report a range of average values = 0.003-7.33 mg/L^^ US EPA Ambient Water Quality Criteria Recommendations for surface water in Region 5 and report a range of average values = 0.05-3.6 mg/L*** Compared to MDEQ Standards of 130 E.Coli per 100 ml, as a 30 day geometric mean, and a 300 E. Coli per 100ml, as a geometric mean of 3 or more samples taken during the same sampling event.Bold = above relevant water quality standardsRefer to Figure 8 for sample locations.

Table 7. Boardman Lake and River Sample Results for Michigan 10 Metals as compared to MDEQRule 57 Surface Water Quality Values
MI 10 Heavy Sample ID (mg/L) HNV* WV** FCV^ AMV^^ FAV^*^Metals C-44 BM C-BF KD LC BL C-18 C-39 C-51 SA Non-Drink (mg/L) (mg/L) (mg/L) (mg/L)
Arsenic ND ND ND ND ND ND 0.003 ND ND ND 0.28 NA 0.15 0.34 0.68Barium ND ND ND ND 0.96 ND ND ND ND ND 160 NA 0.781 2.23 4.46Cadmium ND ND ND ND ND ND ND ND ND ND 0.13 NA 0.0034 0.0077 0.0154Chromium ND ND ND ND ND ND ND ND ND 0.008 9.4 NA 0.116 0.89 1.78Copper ND ND ND ND ND ND ND ND ND ND 64 NA 0.0142 0.0225 0.045Lead ND ND ND ND ND ND ND ND ND ND 0.19 NA 0.0185 0.164 0.329Mercury ND ND ND ND ND ND ND ND ND ND 1.80E-06 1.30E-06 0.0008 0.0014 0.0028Selenium ND ND ND ND ND ND ND ND ND ND 2.7 NA 0.005 0.062 0.12Silver ND ND ND ND ND ND ND ND ND ND 11 NA 0.00006 0.00054 0.0011Zinc ND ND ND ND ND ND ND 0.05 ND ND 22 NA 0.187 0.185 0.371Date Collected 7/23/2003 7/23/2003 7/23/2003 7/23/2003 9/18/2003 9/18/2003 10/3/2003 10/3/2003 10/3/2003 10/3/2003
ND = non-detectNA = not available*HNV = Human Non-cancer Value for Rule 57 Surface Water Quality Values, Surface Water Quality Division, MDEQ**WV = Wildlife value only calculated for bioaccumulative chemicals of concern according to MDEQ ^FCV = Final chronic value^^AMV = Acute maximum value^*^FAV = Final acute value***Note: Human Cancer Value (HCV) was not applicable for any of the 10 Michigan Heavy Metals of, concern, therefore was not included in thistable.Bold = above relevant water quality standardsTR=TributaryC=CulvertC-BF=Culvert at Boardman and FrontB-M=Boardman MouthKD=Keystone Road DumpBL=Boot Lake DumpLC=Lear CorporationSA=South Airport at Boardman RiverP=PhosphorousRefer to Figure 8 for sample locations and the body of text for further explaination of the MDEQ Rule 57 Water Quality Values
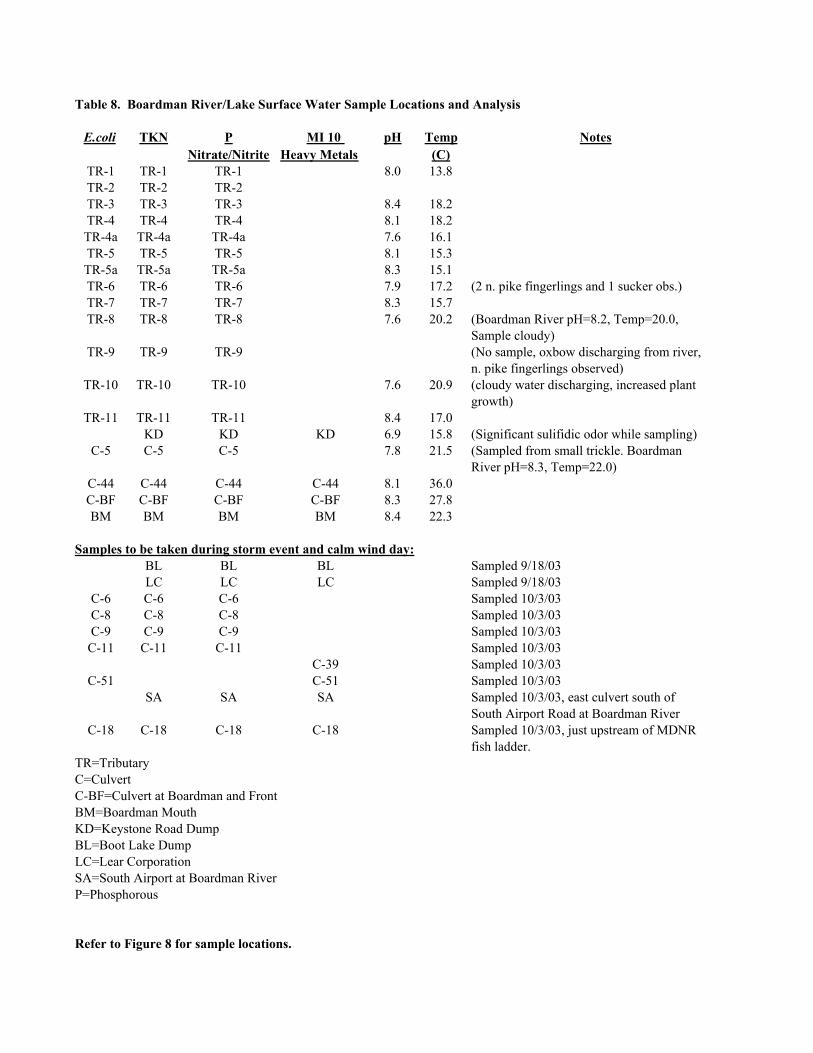
Table 8. Boardman River/Lake Surface Water Sample Locations and Analysis
E.coli TKN P MI 10 pH Temp NotesNitrate/Nitrite Heavy Metals (C)
TR-1 TR-1 TR-1 8.0 13.8TR-2 TR-2 TR-2TR-3 TR-3 TR-3 8.4 18.2TR-4 TR-4 TR-4 8.1 18.2TR-4a TR-4a TR-4a 7.6 16.1TR-5 TR-5 TR-5 8.1 15.3TR-5a TR-5a TR-5a 8.3 15.1TR-6 TR-6 TR-6 7.9 17.2 (2 n. pike fingerlings and 1 sucker obs.)TR-7 TR-7 TR-7 8.3 15.7TR-8 TR-8 TR-8 7.6 20.2 (Boardman River pH=8.2, Temp=20.0,
Sample cloudy)TR-9 TR-9 TR-9 (No sample, oxbow discharging from river,
n. pike fingerlings observed)TR-10 TR-10 TR-10 7.6 20.9 (cloudy water discharging, increased plant
growth)TR-11 TR-11 TR-11 8.4 17.0
KD KD KD 6.9 15.8 (Significant sulifidic odor while sampling)C-5 C-5 C-5 7.8 21.5 (Sampled from small trickle. Boardman
River pH=8.3, Temp=22.0)C-44 C-44 C-44 C-44 8.1 36.0C-BF C-BF C-BF C-BF 8.3 27.8BM BM BM BM 8.4 22.3
Samples to be taken during storm event and calm wind day:BL BL BL Sampled 9/18/03LC LC LC Sampled 9/18/03
C-6 C-6 C-6 Sampled 10/3/03C-8 C-8 C-8 Sampled 10/3/03C-9 C-9 C-9 Sampled 10/3/03
C-11 C-11 C-11 Sampled 10/3/03C-39 Sampled 10/3/03
C-51 C-51 Sampled 10/3/03SA SA SA Sampled 10/3/03, east culvert south of
South Airport Road at Boardman RiverC-18 C-18 C-18 C-18 Sampled 10/3/03, just upstream of MDNR
fish ladder.TR=TributaryC=CulvertC-BF=Culvert at Boardman and FrontBM=Boardman MouthKD=Keystone Road DumpBL=Boot Lake DumpLC=Lear CorporationSA=South Airport at Boardman RiverP=Phosphorous
Refer to Figure 8 for sample locations.

$
,
,
#
+
+
0 0.5 1
miles
Traverse City
Boar
dman
Riv
er
Boardman Lake
Sabin Pond
Board
man Pon
d
Garfield Township
Jack
s Cree
k
Miller C
reek
Kids
Cre
ek
Robbins Cree
k
37
31
31
Figure 1. The Boardman Lake Watershed Area
G.T. County Natural Education Reserve
Wetlands
Boardman Lake Watershed Area4,954 Acres
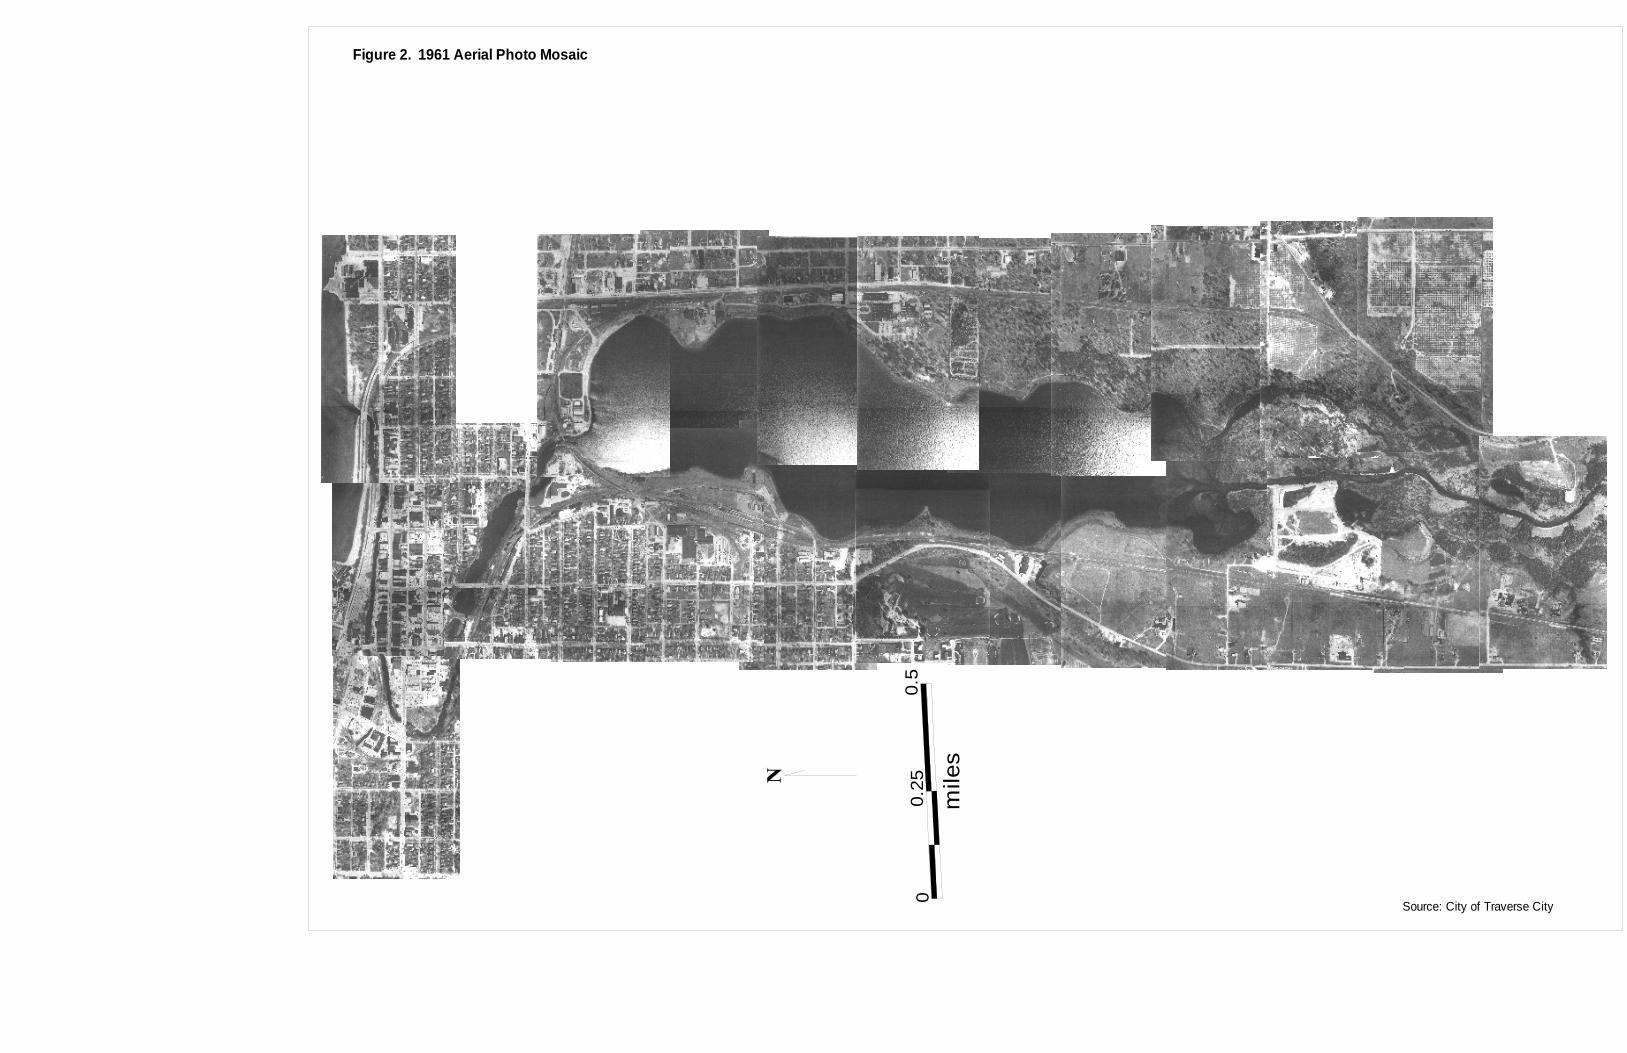
00.
25
mile
s
0.5
Figure 2. 1961 Aerial Photo Mosaic
Source: City of Traverse City

Figure 3. 2003 Digital Orthophoto
Source: Grand Traverse County
f
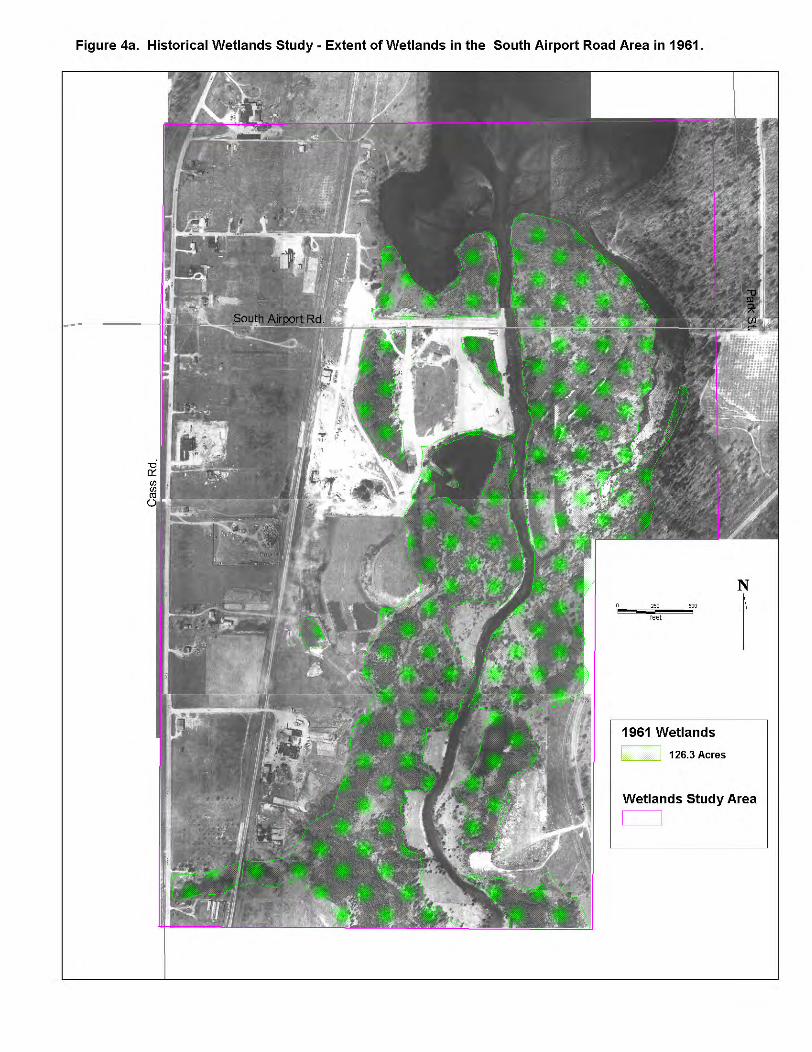


23
8
12
43
3030
42
49
1114
45
5535
17
36
3440
53
47
28 41
22
71
55
3
4
0
0
0
0
3
0
0
0
0
5
7.5
5
9
35
0
0
0
6
0
9.4
10
2
35
25
38
20
6
11
9.7
4.5
1
3
50
18
12
1
0
0.6
0
0
95
25
9
7
0.5
0
0
0
0
40
96
19
0
8
2.5
0.5
0.5
0.5
0
73
40
18
0
9
5
5
5
5
40
31
0
0
9
0
0
0
0
30
28
29
12
10
25
50
40
50
14
30
1
1
1
0.5
0
0
0
0
2
3
5
8
8
8
9.6
11
11
12
58
70
58
0
2
6
9
4
65
50
15
9
55
55
55
55
55
40
22
65
64
55
50
40
12
20
0
15
66
55
55
55
55
45
45
14
15
30
45
40
67
90
64
55
45
8
30
30
33
35
60
77
60
43
27
12
0
0
0
0
0
30
10
60
55
55
56
0
0
0
0
0
30
35
12
55
48
26
26
30
27
30
55
60
50
50
30
30
42
42
33
33
50
18
40
30
32
30
24
27
50
45
20
30
30
23
28
35
0
27
50
45
30
Figure 5a. Impervious Surface Study Analysis - Percent Impervious Surface In Study Cell Areas
Grand Traverse County 2003 DOQGLEC 12/19/03
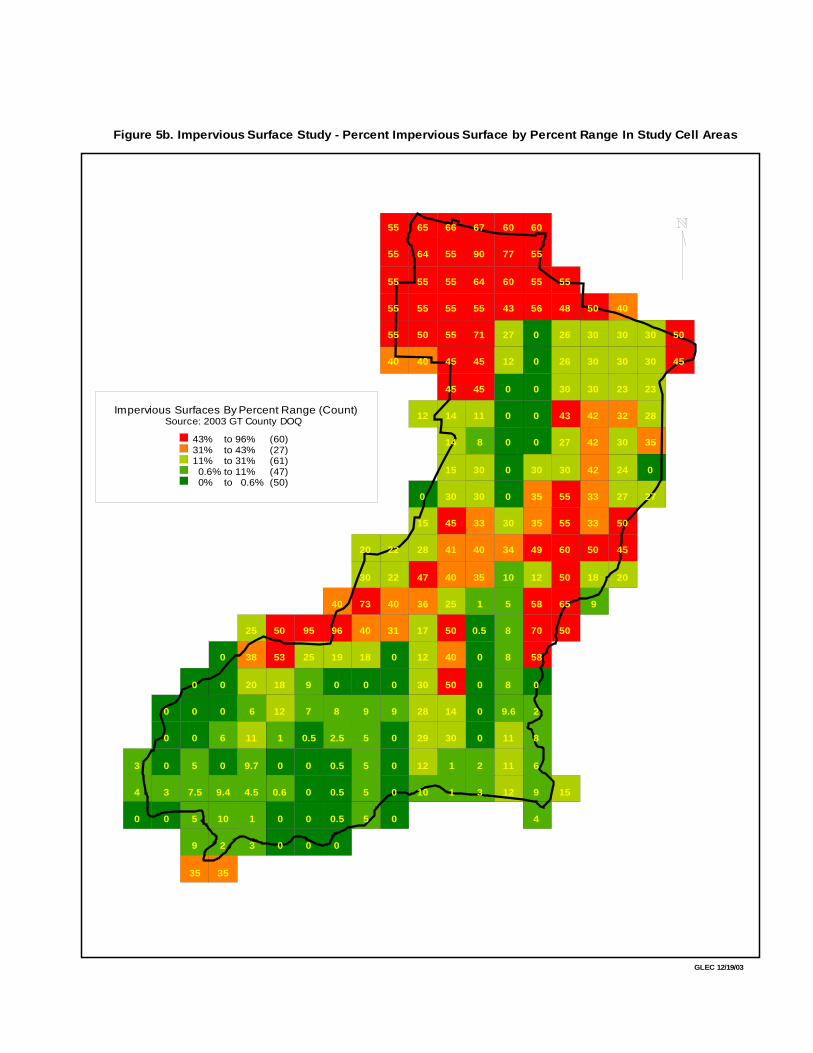
3
4
0
0
0
0
3
0
0
0
0
5
7.5
5
9
35
0
0
0
6
0
9.4
10
2
35
25
38
20
6
11
9.7
4.5
1
3
50
53
18
12
1
0
0.6
0
0
95
25
9
7
0.5
0
0
0
0
40
96
19
0
8
2.5
0.5
0.5
0.5
0
73
40
18
0
9
5
5
5
5
40
31
0
0
9
0
0
0
0
36
17
12
30
28
29
12
10
25
50
40
50
14
30
1
1
1
0.5
0
0
0
0
2
3
5
8
8
8
9.6
11
11
12
58
70
58
0
2
8
6
9
4
65
50
15
9
55
55
55
55
55
40
22
22
65
64
55
55
50
40
12
20
0
15
28
47
66
55
55
55
55
45
45
14
14
15
30
45
41
40
67
90
64
55
71
45
45
11
8
30
30
33
40
35
60
77
60
43
27
12
0
0
0
0
0
30
34
10
60
55
55
56
0
0
0
0
0
30
35
35
49
12
55
48
26
26
30
43
27
30
55
55
60
50
50
30
30
30
42
42
42
33
33
50
18
40
30
30
23
32
30
24
27
50
45
20
30
30
23
28
35
0
27
50
45
30
Figure 5b. Impervious Surface Study - Percent Impervious Surface by Percent Range In Study Cell Areas
Impervious Surfaces By Percent Range (Count)Source: 2003 GT County DOQ
43% to 96% (60)31% to 43% (27)11% to 31% (61)0.6% to 11% (47)0% to 0.6% (50)
GLEC 12/19/03

$
,
$
,
#
+
#
+
0 0.5 1
miles
Traverse City
Boar
dman
Riv
er
Boardman Lake
Sabin Pond
Garfield Township
Jack
s Cree
k
Kids
Cre
ek
Miller C
reek
Robbins Cree
k
R1
R2
R4
R3
3 4
52
R537
31
72
31
1
6
78
9
1011
12
13
Figure 6. Sampling Site Locations for the Aquatic Macrophyte and Benthic Macroinvertebrate Survey of Boardman Lake - September, 2003
Macrophyte and Macroinvertebrate Sam pling Locations
Macroinvertebrate Sam pling Locations
Macrophyte Sam pling Locations
Boardman Lake Watershed Boundary

-50
-60
-70
flow
-30
-40
flow
-5
-20
-10
1,0001,0001,0001,0001,0001,0001,0001,0001,000 2,0002,0002,0002,0002,0002,0002,0002,0002,000
feetfeetfeetfeetfeetfeetfeetfeetfeet
000000000
9a9a9a9a9a9a9a9a9a
13a13a13a13a13a13a13a13a13a9b9b9b9b9b9b9b9b9b
13b13b13b13b13b13b13b13b13b13c13c13c13c13c13c13c13c13c
13d13d13d13d13d13d13d13d13d
3b3b3b3b3b3b3b3b3b3a3a3a3a3a3a3a3a3a
5c5c5c5c5c5c5c5c5c5b5b5b5b5b5b5b5b5b
5a5a5a5a5a5a5a5a5a
6c6c6c6c6c6c6c6c6c6a6a6a6a6a6a6a6a6a6b6b6b6b6b6b6b6b6b
11c11c11c11c11c11c11c11c11c
11b11b11b11b11b11b11b11b11b10b10b10b10b10b10b10b10b10b
11a11a11a11a11a11a11a11a11a
10a10a10a10a10a10a10a10a10a
4c4c4c4c4c4c4c4c4c 4b4b4b4b4b4b4b4b4b4a4a4a4a4a4a4a4a4a
2b2b2b2b2b2b2b2b2b2a2a2a2a2a2a2a2a2a
777777777
1a1a1a1a1a1a1a1a1a
1b1b1b1b1b1b1b1b1b
1c1c1c1c1c1c1c1c1c 1d1d1d1d1d1d1d1d1d
12a12a12a12a12a12a12a12a12a12b12b12b12b12b12b12b12b12b
12d12d12d12d12d12d12d12d12d
12c12c12c12c12c12c12c12c12c
888888888
Figure 7. Sampling Site Locations for Transects 1-12; Macrophyte Survey Data - September, 2003
Plants and Zebra Mussels Not Present
Littoral Zone
Boardman Lake Watershed Boundary
Floating Leaved Aquatic Plants
Submergent Vegetation
0 to 5 foot depth5 to 10 foot depth
DenseNo vegetationSparse to Moderate
Bathymetry in FeetSource: MUCC 1938
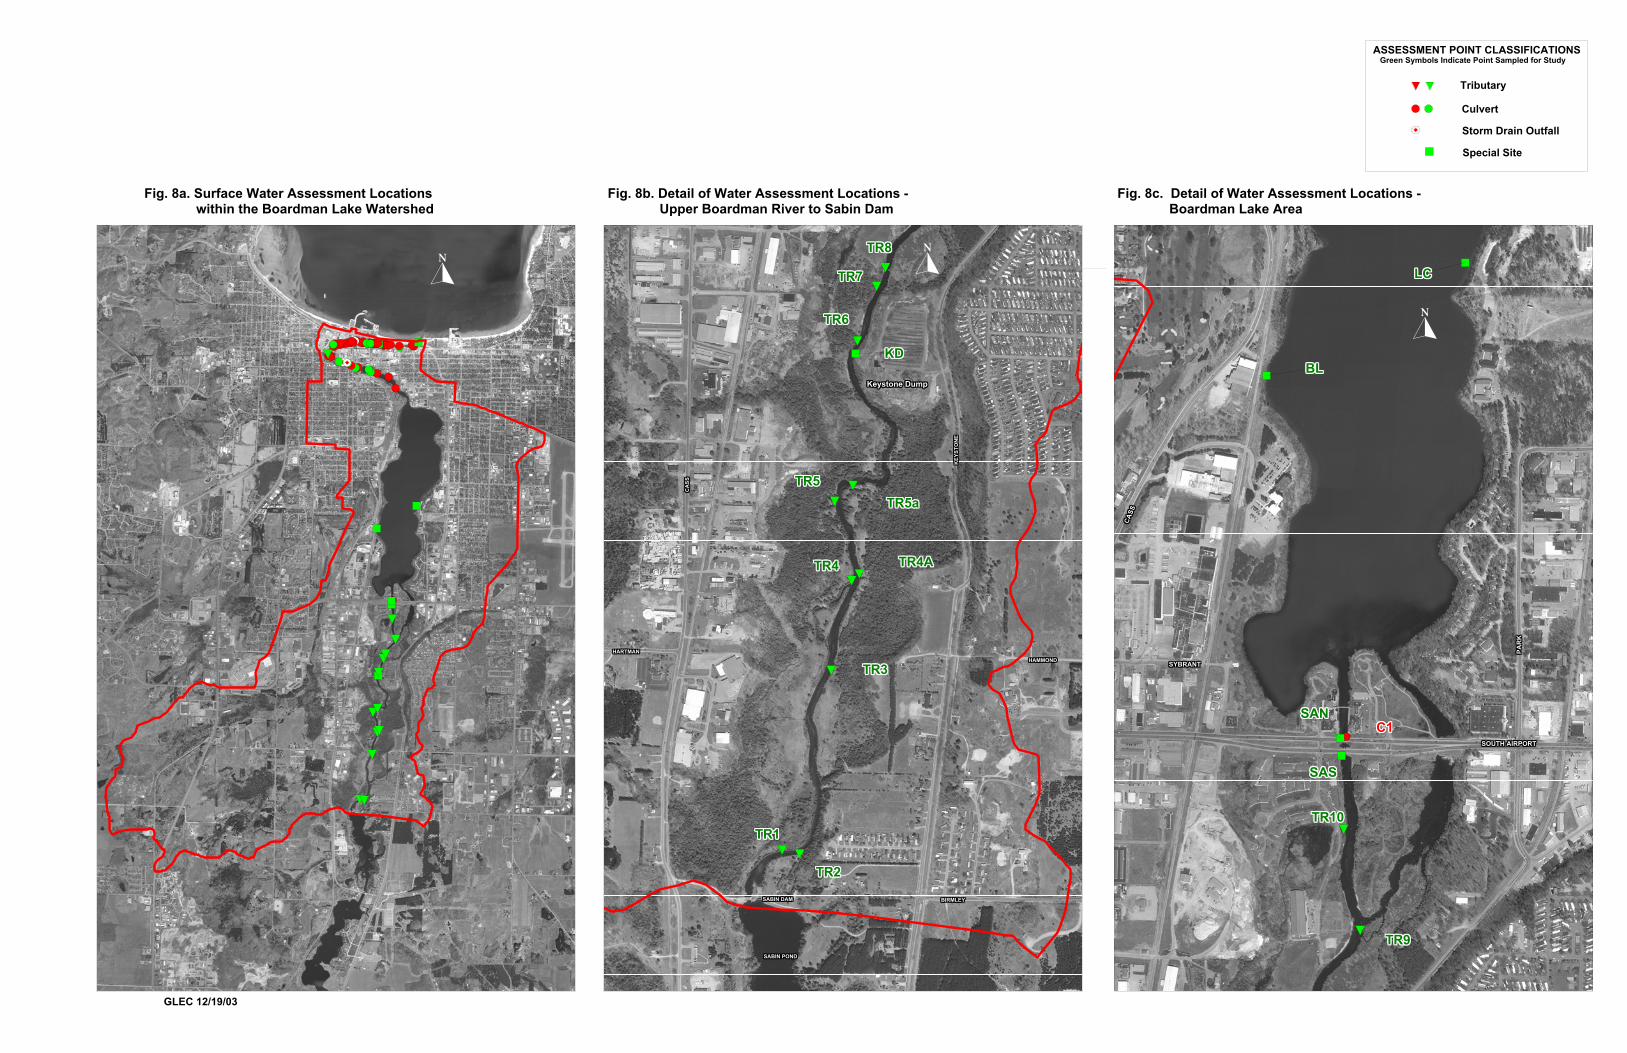
HAMMOND HAMMOND HAMMOND HAMMOND HAMMOND HAMMOND HAMMOND HAMMOND HAMMOND
BIRMLEYBIRMLEYBIRMLEYBIRMLEYBIRMLEYBIRMLEYBIRMLEYBIRMLEYBIRMLEY
KEY
STO
NE
KEY
STO
NE
KEY
STO
NE
KEY
STO
NE
KEY
STO
NE
KEY
STO
NE
KEY
STO
NE
KEY
STO
NE
KEY
STO
NE
CA
SSC
ASS
CA
SSC
ASS
CA
SSC
ASS
CA
SSC
ASS
CA
SS
SABIN DAMSABIN DAMSABIN DAMSABIN DAMSABIN DAMSABIN DAMSABIN DAMSABIN DAMSABIN DAM
SABIN PONDSABIN PONDSABIN PONDSABIN PONDSABIN PONDSABIN PONDSABIN PONDSABIN PONDSABIN POND
HARTMANHARTMANHARTMANHARTMANHARTMANHARTMANHARTMANHARTMANHARTMAN
TR3TR3TR3TR3TR3TR3TR3TR3TR3
TR4ATR4ATR4ATR4ATR4ATR4ATR4ATR4ATR4ATR4TR4TR4TR4TR4TR4TR4TR4TR4
TR5aTR5aTR5aTR5aTR5aTR5aTR5aTR5aTR5aTR5TR5TR5TR5TR5TR5TR5TR5TR5
TR7TR7TR7TR7TR7TR7TR7TR7TR7
TR8TR8TR8TR8TR8TR8TR8TR8TR8
TR6TR6TR6TR6TR6TR6TR6TR6TR6
KDKDKDKDKDKDKDKDKD
TR2TR2TR2TR2TR2TR2TR2TR2TR2
TR1TR1TR1TR1TR1TR1TR1TR1TR1
SOUTH AIRPORTSOUTH AIRPORTSOUTH AIRPORTSOUTH AIRPORTSOUTH AIRPORTSOUTH AIRPORTSOUTH AIRPORTSOUTH AIRPORTSOUTH AIRPORT
PAR
K
PAR
K
PAR
K
PAR
K
PAR
K
PAR
K
PAR
K
PAR
K
PAR
K
SYBRANTSYBRANTSYBRANTSYBRANTSYBRANTSYBRANTSYBRANTSYBRANTSYBRANT
CASS
CASS
CASS
CASS
CASS
CASS
CASS
CASS
CASS
SASSASSASSASSASSASSASSASSAS
SANSANSANSANSANSANSANSANSANC1C1C1C1C1C1C1C1C1
LCLCLCLCLCLCLCLCLC
BLBLBLBLBLBLBLBLBL
TR9TR9TR9TR9TR9TR9TR9TR9TR9
TR10TR10TR10TR10TR10TR10TR10TR10TR10
Fig. 8a. Surface Water Assessment Locations within the Boardman Lake Watershed
Fig. 8b. Detail of Water Assessment Locations - Upper Boardman River to Sabin Dam
Fig. 8c. Detail of Water Assessment Locations - Boardman Lake Area
Keystone DumpKeystone DumpKeystone DumpKeystone DumpKeystone DumpKeystone DumpKeystone DumpKeystone DumpKeystone Dump
ASSESSMENT POINT CLASSIFICATIONS
Tributary
Culvert
Storm Drain Outfall
Special Site
Green Symbols Indicate Point Sampled for Study
GLEC 12/19/03

BO
AR
DM
AN
BO
AR
DM
AN
BO
AR
DM
AN
BO
AR
DM
AN
BO
AR
DM
AN
BO
AR
DM
AN
BO
AR
DM
AN
BO
AR
DM
AN
BO
AR
DM
AN
WEL
LIN
GTO
NW
ELLI
NG
TON
WEL
LIN
GTO
NW
ELLI
NG
TON
WEL
LIN
GTO
NW
ELLI
NG
TON
WEL
LIN
GTO
NW
ELLI
NG
TON
WEL
LIN
GTO
N
WASHINGTONWASHINGTONWASHINGTONWASHINGTONWASHINGTONWASHINGTONWASHINGTONWASHINGTONWASHINGTON
EIGHTHEIGHTHEIGHTHEIGHTHEIGHTHEIGHTHEIGHTHEIGHTHEIGHTH
WEBSTERWEBSTERWEBSTERWEBSTERWEBSTERWEBSTERWEBSTERWEBSTERWEBSTER
PAR
KPA
RK
PAR
KPA
RK
PAR
KPA
RK
PAR
KPA
RK
PAR
K
STATESTATESTATESTATESTATESTATESTATESTATESTATE
GRANDVIEW PARKWAY
GRANDVIEW PARKWAY
GRANDVIEW PARKWAY
GRANDVIEW PARKWAY
GRANDVIEW PARKWAY
GRANDVIEW PARKWAY
GRANDVIEW PARKWAY
GRANDVIEW PARKWAY
GRANDVIEW PARKWAY
CA
SS
CA
SS
CA
SS
CA
SS
CA
SS
CA
SS
CA
SS
CA
SS
CA
SS
FRONT FRONT FRONT FRONT FRONT FRONT FRONT FRONT FRONT
UN
ION
UN
ION
UN
ION
UN
ION
UN
ION
UN
ION
UN
ION
UN
ION
UN
ION
LAKELAKELAKELAKELAKELAKELAKELAKELAKE
SIXTHSIXTHSIXTHSIXTHSIXTHSIXTHSIXTHSIXTHSIXTH
SEVENTHSEVENTHSEVENTHSEVENTHSEVENTHSEVENTHSEVENTHSEVENTHSEVENTH
0 250 500
feet
C9C9C9C9C9C9C9C9C9
C5C5C5C5C5C5C5C5C5
C6C6C6C6C6C6C6C6C6
C8C8C8C8C8C8C8C8C8
C11C11C11C11C11C11C11C11C11
CBFCBFCBFCBFCBFCBFCBFCBFCBF
C51C51C51C51C51C51C51C51C51
C58C58C58C58C58C58C58C58C58
C49C49C49C49C49C49C49C49C49
C48C48C48C48C48C48C48C48C48C47C47C47C47C47C47C47C47C47
C57C57C57C57C57C57C57C57C57
C50C50C50C50C50C50C50C50C50
C52C52C52C52C52C52C52C52C52
C53C53C53C53C53C53C53C53C53
C44C44C44C44C44C44C44C44C44
C39C39C39C39C39C39C39C39C39C43C43C43C43C43C43C43C43C43
C38C38C38C38C38C38C38C38C38
C35C35C35C35C35C35C35C35C35 C40C40C40C40C40C40C40C40C40 C42C42C42C42C42C42C42C42C42
C37C37C37C37C37C37C37C37C37
C41C41C41C41C41C41C41C41C41
C45C45C45C45C45C45C45C45C45
C36C36C36C36C36C36C36C36C36C33C33C33C33C33C33C33C33C33 C34C34C34C34C34C34C34C34C34
C32C32C32C32C32C32C32C32C32
C31C31C31C31C31C31C31C31C31C30C30C30C30C30C30C30C30C30
SO3SO3SO3SO3SO3SO3SO3SO3SO3
C46C46C46C46C46C46C46C46C46
C18C18C18C18C18C18C18C18C18
TR11TR11TR11TR11TR11TR11TR11TR11TR11
C19C19C19C19C19C19C19C19C19 C20C20C20C20C20C20C20C20C20
C21C21C21C21C21C21C21C21C21
C17C17C17C17C17C17C17C17C17
C22C22C22C22C22C22C22C22C22
C22AC22AC22AC22AC22AC22AC22AC22AC22AC23C23C23C23C23C23C23C23C23
SO2SO2SO2SO2SO2SO2SO2SO2SO2
SO1SO1SO1SO1SO1SO1SO1SO1SO1
C59C59C59C59C59C59C59C59C59
C54C54C54C54C54C54C54C54C54
C55C55C55C55C55C55C55C55C55
C56C56C56C56C56C56C56C56C56
C27C27C27C27C27C27C27C27C27
C28C28C28C28C28C28C28C28C28
C14C14C14C14C14C14C14C14C14
C15C15C15C15C15C15C15C15C15
C13C13C13C13C13C13C13C13C13
C12C12C12C12C12C12C12C12C12
C16C16C16C16C16C16C16C16C16
BMBMBMBMBMBMBMBMBMC60C60C60C60C60C60C60C60C60
C62C62C62C62C62C62C62C62C62
C61C61C61C61C61C61C61C61C61C68C68C68C68C68C68C68C68C68
C64C64C64C64C64C64C64C64C64
C66C66C66C66C66C66C66C66C66C67C67C67C67C67C67C67C67C67
C7C7C7C7C7C7C7C7C7
C10C10C10C10C10C10C10C10C10
C24C24C24C24C24C24C24C24C24 C25C25C25C25C25C25C25C25C25 C26C26C26C26C26C26C26C26C26 C29C29C29C29C29C29C29C29C29
C2C2C2C2C2C2C2C2C2
C3C3C3C3C3C3C3C3C3
C4C4C4C4C4C4C4C4C4
Figure 8d. Boardman River Sampling Locations in Downtown Traverse City Area - July-August 2003
Boardman MouthBoardman MouthBoardman MouthBoardman MouthBoardman MouthBoardman MouthBoardman MouthBoardman MouthBoardman Mouth
ASSESSMENT POINT CLASSIFICATIONS
Tributary
Culvert
Green Symbols Indicate Point Sampled for Study
Storm Drain Outfall

APPENDIX A BOARDMAN LAKE WATERSHED
LAND USE/LAND COVER MAP
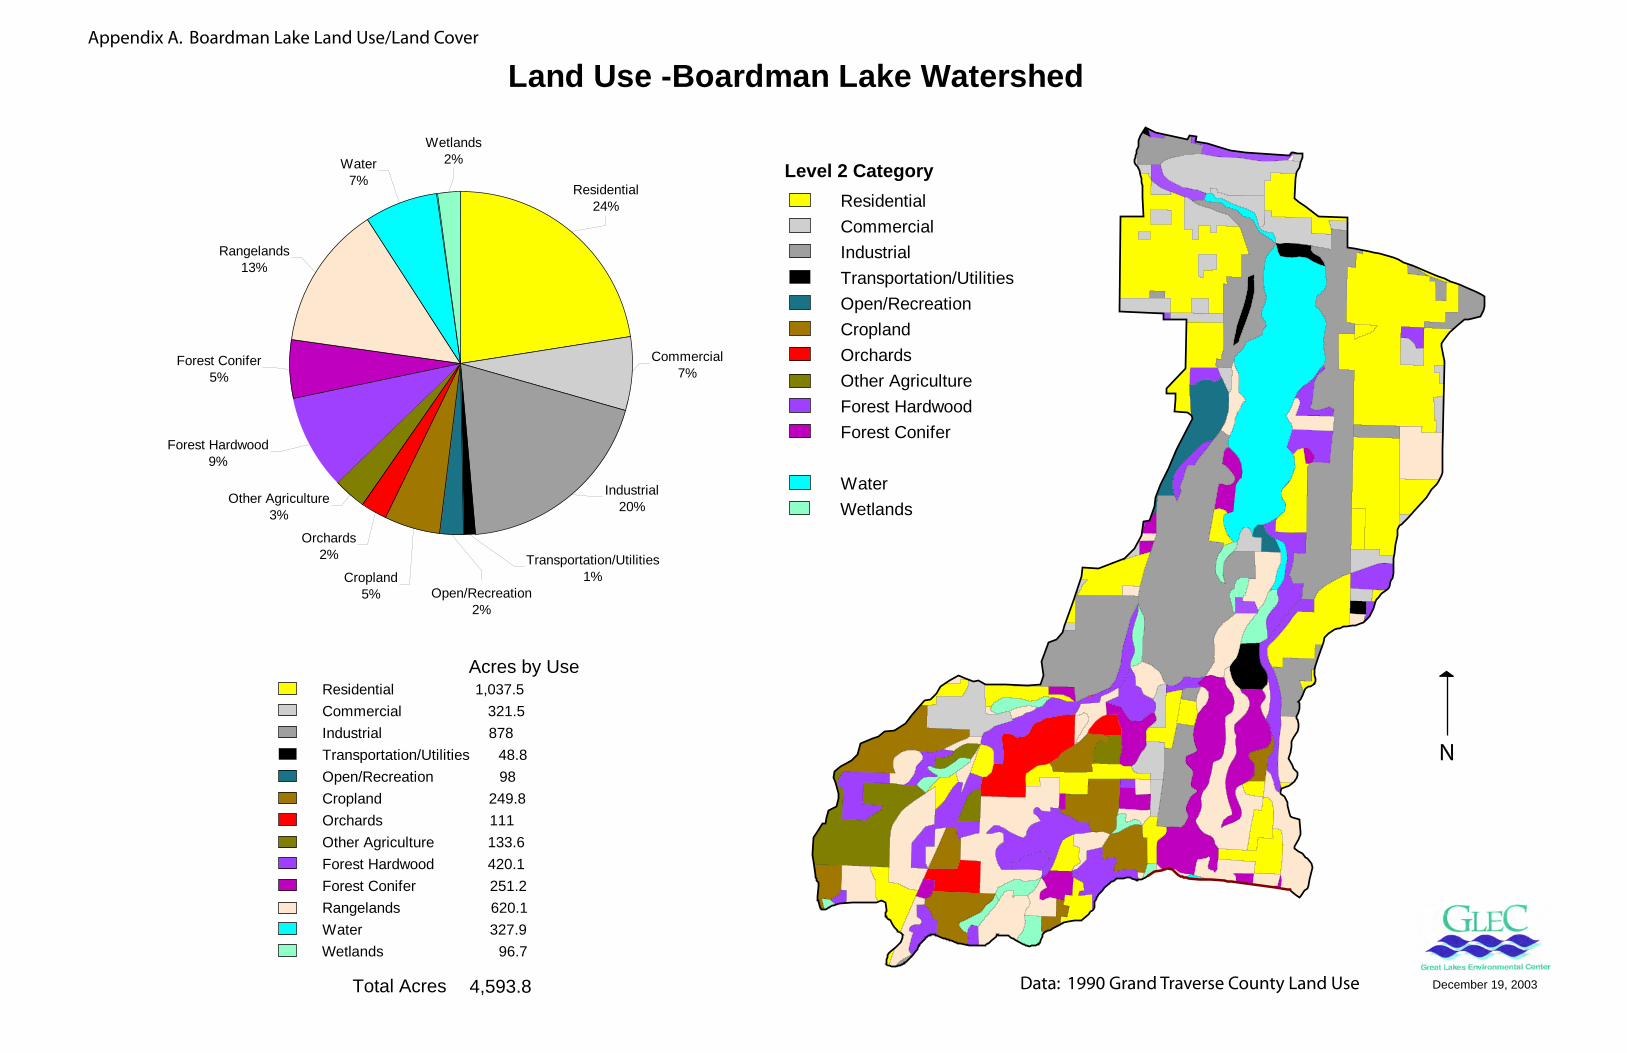
Land Use -Boardman Lake Watershed
Cropland5%
Orchards2%
Other Agriculture3%
Open/Recreation2%
Transportation/Utilities1%
Forest Hardwood9%
Forest Conifer5%
Rangelands13%
Water7%
Wetlands2%
Residential24%
Commercial7%
Industrial20%
ResidentialCommercialIndustrialTransportation/UtilitiesOpen/RecreationCroplandOrchardsOther AgricultureForest HardwoodForest ConiferRangelandsWaterWetlands
Residential 1,037.5 Commercial 321.5Industrial 878Transportation/Utilities 48.8Open/Recreation 98Cropland 249.8Orchards 111Other Agriculture 133.6Forest Hardwood 420.1Forest Conifer 251.2 Rangelands 620.1Water 327.9Wetlands 96.7
Level 2 Category
Acres by Use
Total Acres 4,593.8 December 19, 2003Data: 1990 Grand Traverse County Land Use
Appendix A. Boardman Lake Land Use/Land Cover
N

APPENDIX B BOARDMAN RIVER REPORTS
NOTE: Hardcopies of these reports are available at the
Watershed Center Grand Traverse Bay office.
Please call 231-935-1514 for more information.

BOARDMAN RIVER WATERSHED REPORT
September 1991

BOARDMAN RIVER RESTORATION AND PROTECTION
PROJECT July 1999
BOARDMAN RIVER NATURAL RIVER
PLAN February 1976,
Revised March 2002

MDEQ SEDIMENT CONTAMINATION SURVEY REPORT
1997

GLEC SEDIMENT REPORT 2002

APPENDIX C EDR REPORTS
NOTE: Hardcopy of this report is available at the
Watershed Center Grand Traverse Bay office.
Please call 231-935-1514 for more information.

APPENDIX D MDEQ FOIA LETTER

BALLENVIRONMENTALASSOCIATES
October 24, 2002 ATTN: Jan Funkey FOIA Officer Michigan Department of Environmental Quality 1732 M-32 West Gaylord, MI 49735 RE: FOIA request for the following files from ERD, WMD, STD and Baseline
Environmental Assessment for Grand Traverse County. Per the Freedom of Information Act, I would like to request the review of the below files on a tentative date of October 30 and 31, 2002 at 9 a.m. Please let me know if this date will work for your office. Site Name Site ID# MDEQ Division Boardman Lake Canning Co 28000002 ERD Front St. Area-Traverse City 28000007 ERD United Technologies Automotive 28000059 ERD Keystone (Barlow Rd) Dump 28000063 WMD Meach Cleaners 28000064 ERD MDOT Boardman Yard 28000071 ERD Randy’s Olde Town Shell 28000088 ERD Cherryland Asphalt 28000113 ERD Former Coal Gassification-Hall St 28000115 ERD Former Mavety Oil 28000163 ERD Crains Fabric Care (Former) 28000193 ERD Traverse City Iron Works 28000201 ERD One Hour Martinizing 28000207 ERD Woodmere Barrels 28000210 ERD Kellogg Wholesale Bld. Supply 00021798 STD Bible Baptist Church 00035077 STD True Fit Tressers 50001203 STD Tower Automotive 00038680 STD Dingeman Advertising 50000494 STD Stromberg Carlson Products 28000072 ERD Forest Lane GW Contamination 28000062 ERD Grand Traverse Road Comm. 28000034 ERD Post Property 28000115 ERD
BALL ENVIRONMENTAL ASSOCIATES, L.L.C. 232 E. Front St., Suite 7 Traverse City, Michigan 49684 ph: 231.933.8400 fx:231.933.8406 [email protected]

Former Nottke Trucking Baseline Environmental Assessment Traverse City DNR ? STD Boardman West Property Baseline Environmental Assessment US Coast Guard Station ? ERD Flaska Properties Baseline Environmental Assessment Cherry Capital Airport Spills 28000004 ERD No. 1 Cab Co. 28000085 STD Amoco #0188 28000086 STD Aunt Barb’s Day Care 28000087 STD Bill Marsh Crysler 28000167 STD Blarney Castle 8th St 28000100 STD Carpenter Enterprises LTD 28000112 STD Cornillie Peninsula Concrete 28000164 STD Crandall’s Service 28000173 STD Frank Tazak Estate 28000125 STD Grand Traverse Auto 28000131 STD Grand Traverse County Civic Center 28000132 STD Grand Traverse County, Boardman 28000138 STD Juniors Discount Tire 28000189 STD Marathon Oil Co-Randolph 28000105 STD Michigan National Bank 28000043 STD Overhead Door Co. 28000138 STD River Front Plaza 28000161 STD Ron’s Service 28000074 STD Schmuckal Oil Co. 28000079 STD Schamehorn Shell 28000090 STD Tire Factory, Inc. 28000145 STD Twin Bay Freight District 28000092 STD Van Brocklin Shell 28000098 STD Wares Auto Sales 28000162 STD Woodland Oil Total Station 28000078 STD Woodland Oil Shop and Go 28000080 STD Vencle Kauer Trust 28000106 STD If you have any questions regarding this request please contact me a (231)933-8400 or [email protected]. Thank you. Sincerely, Ball Environmental Associates, L.L.C. Natasha Lapinski Biologist/Project Manager File
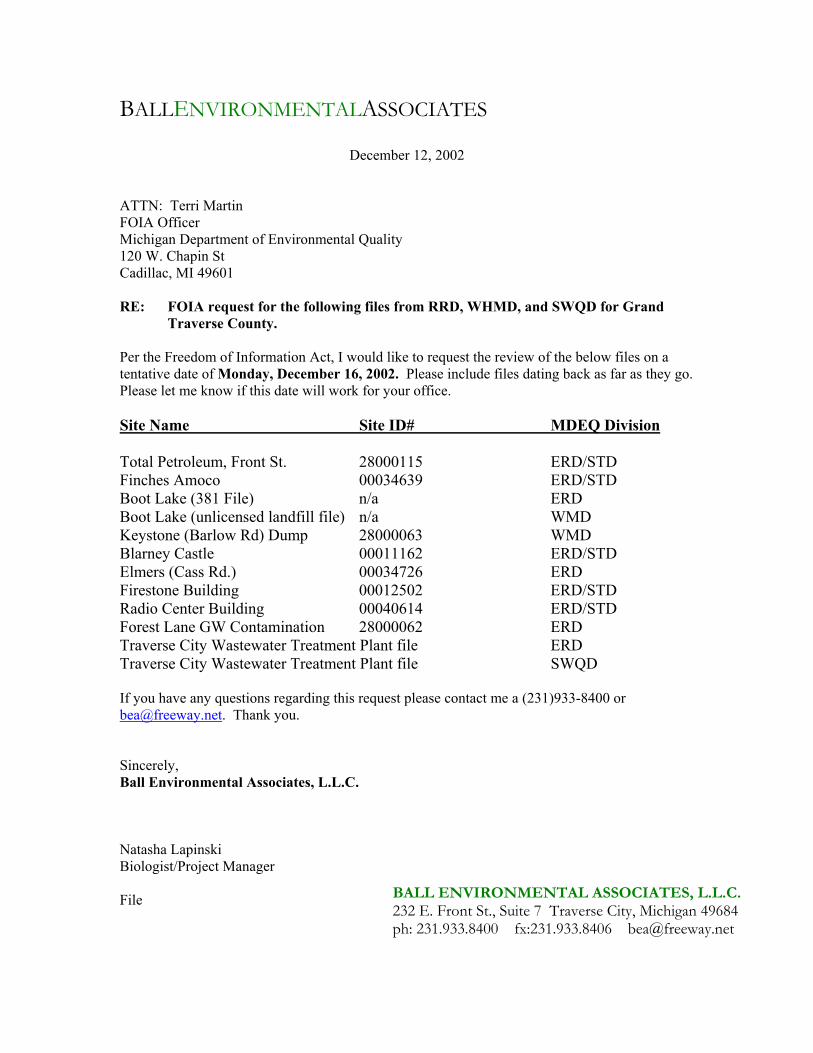
BALLENVIRONMENTALASSOCIATES
December 12, 2002 ATTN: Terri Martin FOIA Officer Michigan Department of Environmental Quality 120 W. Chapin St Cadillac, MI 49601 RE: FOIA request for the following files from RRD, WHMD, and SWQD for Grand
Traverse County. Per the Freedom of Information Act, I would like to request the review of the below files on a tentative date of Monday, December 16, 2002. Please include files dating back as far as they go. Please let me know if this date will work for your office. Site Name Site ID# MDEQ Division Total Petroleum, Front St. 28000115 ERD/STD Finches Amoco 00034639 ERD/STD Boot Lake (381 File) n/a ERD Boot Lake (unlicensed landfill file) n/a WMD Keystone (Barlow Rd) Dump 28000063 WMD Blarney Castle 00011162 ERD/STD Elmers (Cass Rd.) 00034726 ERD Firestone Building 00012502 ERD/STD Radio Center Building 00040614 ERD/STD Forest Lane GW Contamination 28000062 ERD Traverse City Wastewater Treatment Plant file ERD Traverse City Wastewater Treatment Plant file SWQD If you have any questions regarding this request please contact me a (231)933-8400 or [email protected]. Thank you. Sincerely, Ball Environmental Associates, L.L.C. Natasha Lapinski Biologist/Project Manager File
BALL ENVIRONMENTAL ASSOCIATES, L.L.C. 232 E. Front St., Suite 7 Traverse City, Michigan 49684 ph: 231.933.8400 fx:231.933.8406 [email protected]

APPENDIX E BOARDMAN LAKE/RIVER AVIAN
SPECIES LISTS
NOTE: Hardcopy of this report is available at the
Watershed Center Grand Traverse Bay office.
Please call 231-935-1514 for more information.
APPENDIX F BOARDMAN LAKE/RIVER
GPS LOCATION DESCRIPTIONS

1
Boardman River/Lake Tributary, Outfall and Sampling GPS Points On June 18, 2003 Ball Environmental Associates used Global positioning Systems (GPS) equipment to document the locations of every tributary, culvert, and outfall entering the Boardman River/Lake from Sabin Dam north to the mouth on Grand Traverse Bay. The following are summaries of each GPS location, including code and description. TR-1 Tributary entering the west side of the river immediately north of Sabin Dam. The substrate consists of sand and gravel bottom. TR-2 Small, cold, clear and fast moving tributary with a gravel bottom entering the east side of the river immediately north of Sabin Dam. TR-3 Slow moving tributary on east side of the river approximately 0.5 miles north of Sabin Dam. Substrate consists of a silty bottom. TR-4 Wide and slow moving tributary enter the river approximately 0.6 miles north of Sabin Dam. Substrate consists of a thick silty bottom. TR-4a Clear, cold and narrow tributary on east side of river just north of TR-4. TR-5 Narrow, slow-moving tributary entering the west side of the river approximately 0.7 miles north of Sabin Dam. KD Keystone Dump. A 55-gallon drum was observed in river approximately 10 feet from shore on the east side. Obvious oxidation/reduction staining was observed along the shore on the sand and rocks representing leachate from the dump. TR-6 Clear and cold fast moving tributary approximately 6 inches deep entering the west side of river. Located approximately 0.1 miles north of Keystone Dump contamination plume. TR-7 Clear, cold, deep and fast moving tributary entering the river on the west side at Sabin School. TR-8 Small, deep and slow moving tributary approximately 4 inches deep and entering the west side of the river along YMCA property. Severe erosion is occurring along the YMCA property shoreline requiring some type of bank stabilization mechanism. Substrate consists of a silt bottom. TR-9 Slow moving tributary approximately 4 feet wide and 8 inches deep entering the east side of the river across from YMCA property. The substrate consists of a silt/sand bottom.
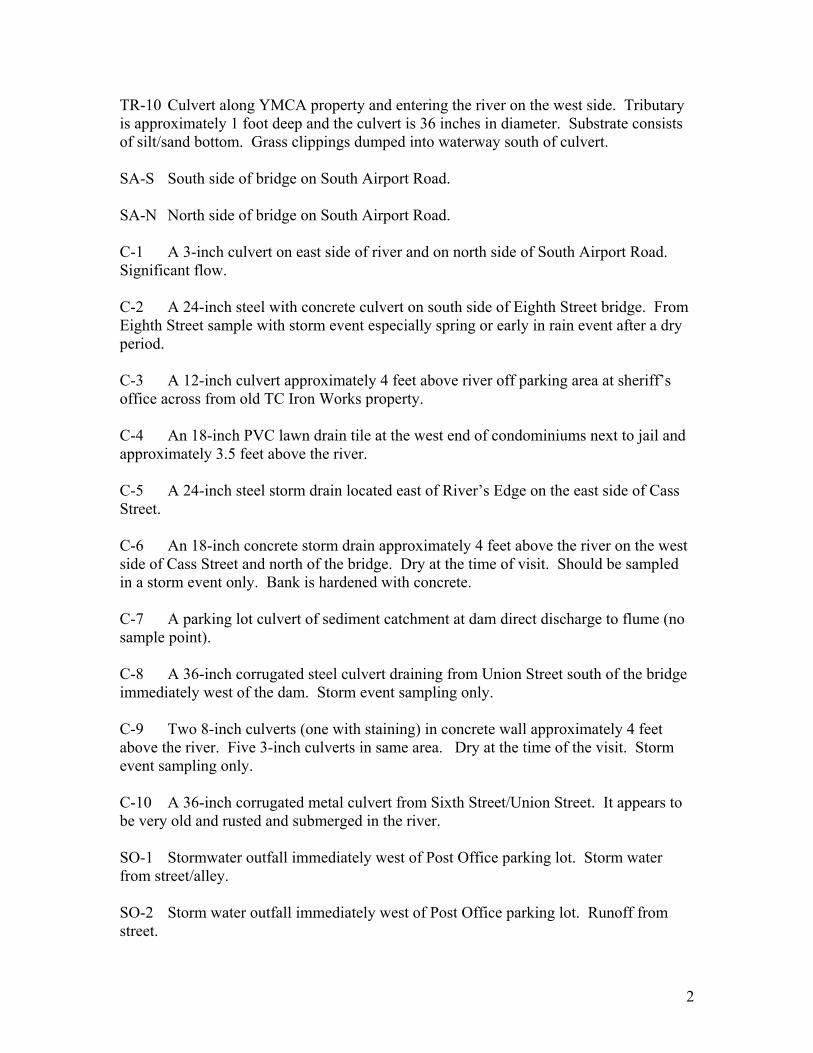
2
TR-10 Culvert along YMCA property and entering the river on the west side. Tributary is approximately 1 foot deep and the culvert is 36 inches in diameter. Substrate consists of silt/sand bottom. Grass clippings dumped into waterway south of culvert. SA-S South side of bridge on South Airport Road. SA-N North side of bridge on South Airport Road. C-1 A 3-inch culvert on east side of river and on north side of South Airport Road. Significant flow. C-2 A 24-inch steel with concrete culvert on south side of Eighth Street bridge. From Eighth Street sample with storm event especially spring or early in rain event after a dry period. C-3 A 12-inch culvert approximately 4 feet above river off parking area at sheriff’s office across from old TC Iron Works property. C-4 An 18-inch PVC lawn drain tile at the west end of condominiums next to jail and approximately 3.5 feet above the river. C-5 A 24-inch steel storm drain located east of River’s Edge on the east side of Cass Street. C-6 An 18-inch concrete storm drain approximately 4 feet above the river on the west side of Cass Street and north of the bridge. Dry at the time of visit. Should be sampled in a storm event only. Bank is hardened with concrete. C-7 A parking lot culvert of sediment catchment at dam direct discharge to flume (no sample point). C-8 A 36-inch corrugated steel culvert draining from Union Street south of the bridge immediately west of the dam. Storm event sampling only. C-9 Two 8-inch culverts (one with staining) in concrete wall approximately 4 feet above the river. Five 3-inch culverts in same area. Dry at the time of the visit. Storm event sampling only. C-10 A 36-inch corrugated metal culvert from Sixth Street/Union Street. It appears to be very old and rusted and submerged in the river. SO-1 Stormwater outfall immediately west of Post Office parking lot. Storm water from street/alley. SO-2 Storm water outfall immediately west of Post Office parking lot. Runoff from street.
3
C-11 A 36-inch corrugated steel culvert located at Park and Sixth Street approximately 3 feet above the river. Storm even sampling only. Observed 3 large sea lampreys in river at this location. C-12 A storm drain hardened with concrete and with a screen. Evidence of flow during spring and summer 2003, approximately 4 feet above the river and has a concrete flow structure to the river. Located at apartments across from Traverse City State Bank. C-13 A 12-inch corrugated steel lawn drain tile at apartments across from Traverse City State Bank. C-14 *First observation of zebra mussels. City-owned, 36-inch corrugated steel, dry culvert on the south side of Front and Wadsworth Streets. Located approximately 2 feet above the river. C-15 Lawn drain at apartment. One foot above river, 12-inch corrugated steel. Signs of old dump (metal, glass, car parts). TR-11 Kid’s Creek tributary. Could be relandscaped and utilized as a community asset, such as a park. C-16 City-owned, new 12-inch corrugated steel outfall at northeast corner of Front at bridge and at TC State Bank building. Approximately 2.5 feet above the river. C-17 Two 4-inch PVC lawn and roof drain at TC State Bank. Approximately 4 feet above the river and dry. C-18 A 4-inch wet PVC parking lot drain located at MDNR fish ladder. C-19 A 12-inch storm water outlet located at MDNR fish ladder building. C-20 An old 48-inch corrugated steel culvert a half-inch above the river located in the city drains area at the transfer station south to river. C-21 A new 8-inch PVC roof/lawn drain at north side of TC State Bank building approximately 4 feet above the river and dry. C-22 A 12-inch and 10 inch old steel drain pipes approximately 1.5 feet above the river and dry. Located on the north side of the river across from J&S Hamburg drain in the Hall Street area. C-22a A 24-inch city drain at J&S Hamburg next to overflow parking structure to the east.

4
C-23 Old steel 6-inch pipe from former Grand Traverse Auto, source unknown, dry however distinct, strong paint odor exists. Two 55-gallon and two 40-gallon drums were observed in center of river bed. Also observed tires, bottles and other various items. C-24 Old steel 40-inch and an old ceramic 4 inch located at former Grand Traverse Auto. A 50-gallon drum was observed. C-25 One new 10-inch block poly corrugated drain, one (1) new 6-inch PVC. Roof drain? Source unknown? Dry at time of visit. One 10-inch at 2 feet above river, one 6-inch at 3.0 feet above river. C-26 One dry 24-inch catchment at Old Kent Building parking lot. C-27 Four culverts at Old Kent Building (1 running, 3 dry). Ornate brick work observed in river at river edge from old building façade. C-28 One 8-inch dry culvert from OKB drive thru? At north side of the river. C-29 Old 24-inch ceramic beneath Union Street bridge, south side. Also, new 24-inch concrete at southeast corner of bridge behind ski shop, dry 6 feet above river. C-30 One 4-inch and one 8-inch old steel culvert along north bank from farmer’s market parking lot, dry. SO-3 Spillway at west side farmer’s market parking C-31 New 8-inch concrete with metal spillway form farmer’s market parking lot, dry, 2.5 feet above river. C-32 One old ceramic 6-inch culvert behind former Ray’s Coffee at 3.5 feet above river, one new 8-inch PVC at 6 feet above river, one 8-inch concrete east of foot bridge at 5.5 feet above river. C-33 One 16-inch concrete culvert in concrete wall at park area behind Andrew Kan at 4 feet above river, dry on south side. C-34 One 10-inch PVC culvert 4 feet above river at parking area on concrete wall behind Fetish and Shag retail stores. C-35 One 6-nch concrete culvert in concrete wall 5 feet above river, dry, behind Vintagy in parking lot. C-36 One 8-nch PVC culvert wet behind Osiris Bead Shop parking lot, 4 feet above river. C-37 One 6-8-inch concrete culvert in concrete wall immediately south of C-36.

5
C-38 One 18-inch concrete culvert in concrete wall, dry, in parking area behind Captain’s Quarters. C-39 One 18-inch concrete culvert, running fast, immediately east of C-38. C-40 One 8-inch PVC, wet behind Mackinac Brewery. C-41 One 18-inch corrugated metal on north side at farmer’s market parking area, 3.5 feet above river, dry. C-42 Several 20-inch concrete drains at Cass Street bridge north side of river in southeast corner of farmer’s market parking lot, 2 feet above river, dry. C-43 Two 24-inch (1 and 3 feet above river) corrugated metal culverts from Front and Cass, south side of Cass bridge, both dry. C-44 Two 8-inch PVC culverts running fast from roof top of Old NW Bank building, south side of river. C-45 One 8-inch PVC culvert, dry 4 feet above river behind Nutcracker in concrete wall along alley on south side of river. C-46 One 10-inch ceramic tile culvert on south side of river, dry, 2 feet above river, from rooftop, behind Cherry Stop in alley. C-47 One 6-inch ceramic rooftop drain on south side, 3 feet above, dry, behind south side of river behind Toy Harbor in steel barrier. C-48 One 18-inch concrete culvert, dry, at southeast corner of foot bridge, dry, south side of river, behind Backcountry Outfitters, city stormwater drain. C-49 One 6-inch ceramic rooftop drain, dry, 2 feet above river. C-50 One 8-inch ceramic rooftop drain at State Theater in steel wall, dry, 3 feet above river. C-51 One 6-inch steel culvert, running, from rooftop of Horizon Books. C-52 One 18-inch ceramic culvert, dry, at Horizon Books, 2 feet above river. Had conversation with Horizon employee, he commented on a sewer/waste odor that occurs each night around 10 pm. C-53 One 6-inch old steel rooftop drain from former Firestone building, 2 feet above river. A 55-gallon drum and other various garbage observed.

6
C-54 One 4-inch old pipe from former Firestone building, on south side of river, dry, 2 feet above river. C-55 One 6-inch steel pipe at former Firestone building, dry, near Park Street, 2 feet above river. C-56 One 18-inch concrete beneath Park Street bridge, south side of river, dry. C-57 One 12-inch concrete culvert on north side of river from parking lot east of Chamber of Commerce, 2 feet above the river. C-58 An unknown culvert to river from parking area east of Chamber of Commerce building. C-59 An unknown culvert to the river from parking area east of Chamber of Commerce. C-60 One 16-inch concrete culvert from City of Traverse City parking lot, east of foot bridge, and east of Chamber of Commerce building. C-61 Four drains below Park Street Bridge C-62 Park Street bridge. Southeast corner at the law offices C-BF One 36-inch culvert at the base of Boardman Avenue (with Front Street), south side of river, running constantly, already sampled. C-64 One 24-inch concrete culvert at deck of TC public park, south side of river, between Paesano’s and Real Estate One office (old culvert: on east side) C-65 Under bridge of Grandview Parkway, 8 drains to river from bridge surface, four on each side. C-66 One 18-inch steel culvert, 2 feet above the river from Grandview Parkway/M37 Highway. C-67 One 12-inch, dry, PVC culvert, 1 foot above the river just off public parking lot at the boat launch. C-68 One 24-inch corrugated steel culvert, 3.0 feet above river, dry. C-BM One 8-inch steel culvert, 11 feet above the river, off parking area at west end of boat launch.

APPENDIX G BOARDMAN LAKE/RIVER CONTAMINATION SITES
MAP/DESCRIPTIONS

0.5
miles0.5
miles00 11
Traverse City
Boar
dman
Riv
er
Boardman Lake
Sabin Pond
Garfield Township
Kids
Cre
ek
Miller C
reek
Jacks Creek
Robbins Cree
k
37
31
72
31
Boardman Lake Watershed Boundary
NREPA Contamination Sites
Appendix G. Boardman Lake/RIver Contamination Sites Map
1
Part 201, NREPA Listed Sites Boardman Lake Watershed Protection Plan
December 2003
Key * MDEQ file was deemed incomplete, therefore site location and available file information only are summarized. ** Current site status is “active” meaning the site is uncontrolled and site investigation and/or remediation are on-going. These sites are deemed to represent known or potential threats to the waters of the Boardman Lake watershed.
Stromberg Carlson Products, Inc. ** In December of 1966 Stromberg Carlson Products, Inc. purchased the southern portion of the property from Elsie Thirlby of Thirlby automotive parts. Beginning in 1952 and for a period no later than 1966, Thirlby leased the southern portion of the property to Parsons Corporation. Parsons Corporation manufactured large metal parts for airplanes and helicopters. Thirlby in turn purchased the southern property form Michigan Tractor and Machinery Co. in October of 1952. The Michigan Tractor and Machinery Company purchased the southern property in May 1946 from Ben H. and Frieda Koenig, who had purchased this portion of the property in January of 1946 from Maude and James Smith. From 1970s through mid-1990s metal recreational vehicle accessories were manufactured at the site. In a 1988 MDEQ inspection of the facility the existence of environmental compliance problems at two locations, at a door along the east wall and at an overhead door at the end of an abandoned alley at the northeast central part of the facility. A 1988 complaint prompted the Traverse City Fire Department inspection which included the photographing of drums and small spill areas in two locations at the exterior of the Stromberg Carlson facility. Drums were photographed at the door along the east wall of the building and immediately west of an overhead door at the end of an abandoned alley and east of the former paint room. According to the pictures, the drums were labeled flammable. In 1990 two areas of soil were excavated. One hundred and sixty-six (160) cubic yards of soil were removed, characterized and properly disposed. Soil samples were collected to verify the success of soil removal along the facility’s eastern wall at a door exiting the welding/press room and at a loading area in the midsection of the building at the end of a vacated alley. Soils were reported by the MDEQ to have been impacted at this location due to the improper storage of paint products and/or wastes. Closure soil samples indicated the proper removal of contaminants to within the Michigan Environmental Response Act, Act 307 of 1982, as amended, Type A criteria. Stromberg Carlson Products, Inc. submitted a closure report to the MDEQ in December of 1993 and received a “clean closure” letter related to this location on January 25, 1994 from the MDEQ Cadillac District Quality Review Board. A Baseline Environmental Assessment was submitted to the MDEQ on September 10, 1996 from Lancz Warehouse Storage and on January 11, 2000 from Kerry Lane Development. The current status of the site is contamination from lead, arsenic, barium, silver, iron, selenium, Xylene isomers, and perchlorethylene (PCE) above MDEQ, Part 201, Residential Drinking Water Protection Criteria.
2
Forest Lane Subdivisions The Forest Lane Subdivision encompasses the area between the Cherryland Mall, Leewall Terrace Mobile Home Park, Gladewood Place and the Forest Lane Subdivision. The site is north of South Airport Road and west of Garfield Road in Traverse City, Michigan. Following the July 1988 report of severe taste and odor problems with water from a residential well at 964 South Forest Lane, local health officials sampled al the residential wells in the area. Most residents in the area were utilizing private water systems with shallow drinking water wells set between 40 and 50 feet. In 1989, Part 201 (formerly known as Act 307) funds were used to complete municipal water extensions to nearly 50 residences. In January of 1991, approximately 30 residential wells were determined by local health officials and the MDEQ to still be contaminated with various purgeable aromatic hydrocarbons. The MDEQ undertook an extensive hydrogeological investigation in the area following the replacement of private wells with connection to municipal supplies, however, the source(s) of groundwater contaminants remain undetermined. The following were identified by the MDEQ as potential sources: the Cherryland Mall, K-Mart, gas stations, auto dealers, a laundromat, and the Jiffy Lube. Four phases of MDEQ remedial investigation failed to identify a source, and monitor well abandonment was completed in 1995. Subsequently, the MDEQ investigation was terminated. Cone Drive/Textron Cone Drive/Textron was identified by the MDEQ in 1984 as a site of potential environmental contamination through the Preliminary Assessment of Michigan locations for the inclusion on the federal CERCLIS, pursuant to the Comprehensive Environmental Response, Compensation and Liability Act, 42 U.S.C. 9601, et. seq. Complaints were received by the MDEQ of the presence of petroleum sheen on the Boardman Lake along, proximate or adjacent to the Cone Drive/Textron facility, a former CSX Transportation (formerly Chesapeake and Ohio Railroad Yard) maintenance facility and a former Michigan Department of Transportation maintenance facility (known as the MDOT Boardman Yard). Cone Drive/Textron undertook an investigation and installed a groundwater inception trench, with the MDEQ oversight and approval, to prevent the migration of contaminants into Boardman Lake. Additional potentially responsible parties have undertaken investigations determining the presence of arsenic and volatile organic hydrocarbons above state standards for groundwater and soil. Due to the potential for numerous sources of contaminants, the MDEQ undertook hydrogeological investigations including a May 16, 1994 Interim Assessment and an Integrated Assessment Report of September 27, 1994. At the time of this report, all parties were moving cooperatively toward signing an agreement with the State of Michigan to implement site remediation. In 2001, Northern Michigan Environmental Action Council (NMEAC) and the City of Traverse City filed a lawsuit against Cone Drive/Textron for failure and lack of process in cleaning up the contamination that was ultimately ending up in Boardman Lake. In 2002, an Administrative Order by Consent (AOC) was signed by MDEQ and Cone Drive/Textron to implement a remediation plan. Late in 2001 and early 2002, an ozone sparging system was installed by Global Remediation Technologies in an
3
attempt to removed the contaminants from the soil and groundwater along the lake edge and to prevent further movement of contamination into the lake through groundwater. In April of 2002, an amended AOC was issued requiring Cone Drive/Textron to implement the January 2002 Revised Surface Water Interim Response Plan and the January 7, 2002 Pump and Treat Plan in order to cease discharges of venting groundwater to Boardman Lake above Mixing Zone adjusted groundwater-surface water interface (GSI) criteria. Currently, Cone Drive/Textron complied with the requests of NMEAC and the City of Traverse City, and the ozone sparge system/monitoring is ongoing. Currently the pump and treat system has achieved its goals. Negotiations with MDEQ are underway to implement an overall remedial investigation of the up-gradient plume on the property. Lake bottom sediment sampling was conducted in Summer 2003, and analyses determined that sediments were not impacted from the groundwater contamination plumes entry or “venting” into Boardman Lake. MDOT Boardman Yard ** The MDOT Boardman Yard is comprised of 16.5 acres that were historically used for a number of rail-related operations. Cone Drive/Textron is located to the west of the site, with CSX Transportation (railroad real estate company) located to the east. From a 1992 Hydrogeological Investigation Report the following compounds were found in the soil along the railroad: solvents trichloroethylene (TCE), PCE, 1,1,1-trichloroethane, chloroform, dichloroethylene, perchloroethylene, 1,1,1-trichloroethylene, and vinyl chloride; petroleum constituents benzene, toluene, ethylbenzene and xylene isomers (BTEXs); polynuclear aromatics (PNAs), anthracene, pyrene, fluorene, perylene, and fluoranthene; and heavy metals arsenic, barium, selenium, and zinc. According to a September 1993 report, the location possessed a coal rail yard and diesel engine repair shop for most of the 20th century. Monitor wells at the site indicated petroleum and chlorinated solvents in the groundwater. The groundwater flow is east-northeasterly toward the Boardman Lake. In 1994, an Inland Lakes and Streams permit was issued by the MDEQ to dredge and install an interception trench to intercept and collect free product. In a 1995 investigation to determine source areas of contamination, two key areas were identified: the diesel locomotive refueling area and the engine repair building. In 1999, a Site Investigation and Remediation Report identified metals and polynuclear aromatics in the surface soil exceeding MDEQ Direct Human Contact criteria on the CSX Transportation property. This led to extensive soil excavation at the site in 2000 and in April 2000 in which MDEQ warranted no further response actions or a Remedial Action Plan, further stating the remaining environmental contamination issues could be addressed in a brownfield redevelopment effort. In August 2000, CSX Transportation sold the property to Boardman Banks, Inc. In September 2001, a Baseline Environmental Assessment was completed by Boardman Banks. Soil samples were collected and found detectible concentrations of volatile organic compounds (VOCs), polynuclear aromatics, pesticides and metals, while benzene, total xylenes, benzo(a)pyrene, flouranthene, naphthalene, phenanthrene, arsenic and selenium exceeded the Part 201 Generic Residential Cleanup Criteria. Groundwater sampling results indicated aluminum levels above Generic Residential Cleanup Criteria. In October of 2001 with the proposed Lake Ridge Condominium development pending, a Due Care Analysis was conducted and

4
revealed the presence of lead, arsenic and benzo(a)pyrene in the soil at levels exceeding the Part 201 Residential and Commercial I Drinking Water Criteria. Phase I of the Lake Ridge Condominiums have been occupied at the site, and Phase II is under construction at the time of this review. Meach Cleaners and Laundry, Inc. ** Meach Cleaners is a laundry and dry cleaning service located at 725 East Eighth Street. According to MDEQ files, the site was placed on the Part 201 (the then Part 307 list) February 5, 1991. Groundwater contamination has been documented at this site from two possible sources: an UST system and improper storage; and disposal of dry cleaning solvents. The contaminant of concern is tetrachloroethene. The owner stated that the UST had been removed in approximately 1992 and the contamination is continuing. MDEQ Cadillac District staff have stated that groundwater flow is in a northerly direction, and has been documented to exist as far north as Webster Street. The groundwater plume is migrating north and has reached Grand Traverse Bay (2,100 feet to the north). A request was made December 1993 by the consultant to Meach Cleaners to monitor the plume only, rather than undertake active remediation. In response, a March 22, 1994 MDEQ memo from the Water Division to the Remediation and Redevelopment Division (RRD) stated that this alternative was unacceptable. In 1994, low levels of TCE, bromoform, chloroform, methylene and chloride were detected. Meach Cleaners submitted a closure report with groundwater restrictions. SWQ approved a proposal to allow the groundwater to vent without requiring further monitoring in 1997. A remedial Action Plan was submitted to the MDEQ in 1999 stating the need to rescreen the wells in order to determine approximate depth of the groundwater plume. Ongoing groundwater monitoring continues at the site as of this report. Coal Gasification Plant ** A former coal gasification plant is located at 145 Hull Street. Groundwater flow is documented to be north towards Grand Traverse Bay. An old creosote pit existed at the rear of the building and former above ground storage tanks (ASTs) are known to have overflowed at the site. An underground storage tank (UST) was installed in approximately 1964 as a portion as a portion of a former coal gasification plant. In 1991, Northern Michigan Diesel Service confirmed a leaking underground storage tank system (LUST) release of diesel fuel and waste oil causing an approximate nine-foot deep groundwater and soil contamination plume consisting of BTEX, cyanide, styrene, phenols, polynuclear aromatics, and creosote. Other potentially responsible parties include, the Candle Factory located at 301 West Grandview Parkway and Red Mill. In 1993, the Candle Factory removed approximately 500 yards of contaminated soil. A Baseline Environmental Assessment (BEA) was conducted for Bazin, Inc. auto repair and maintenance in December 1997. Two to four inches of tar was discovered in Spring 2000 at the Harbor View Development and a twelve (12) foot cistern was removed as a consequence. In December 2001, a closure report was completed for the soils and the groundwater contamination was the only remaining issue. Currently, redevelopment/brownfield funds are being used for the Michigan Mill Park Development

5
Area. A former oil/water separator was found during the demolition of the Bazin Auto facility in preparation for site redevelopment. Traverse City Canning Company Traverse City Canning Company is defunct, but the facility remains at 3710 South Cass Road. The facility was a seasonal fruit and vegetable processing and packing operation, that went bankrupt in May 1980. The Traverse City Canning Co. intermittently operated one sewage lagoon and a spray irrigation system to treat organic process wastes discharged under permit to Boardman Lake. The wastewater treatment system of irrigation was implemented on the Northwest Michigan College University Center site along Boardman Lake. The outlet existed above the Eighth Street bridge and often discharged process water at 400 gallons per minute (gpm). In the 1960’s, cherry parts and whole cherries were often documented discharging into Boardman River. In 1964, high levels of fecal coliform were documented in the River and in 1975, a fungus growth and slime was reported on the surface of the Boardman River near the discharge outlet. Groundwater flow at the site is east-northeasterly. Chef Pierre purchased the facility in 1982, and changed its process to that of cake production - eliminating the need for surface water discharges. The wastewater lagoon was phased out at that time and the sludge was removed. A hydrogeological investigation undertaken in 1983 found waste materials in the aquifer adjacent to and downgradient of the sewage lagoon. The study recommended monitoring but no remediation. In 1991, counsel for Chef Pierre requested the removal of both location from the Part 201 list of sites of environmental contamination, absent the iron precipitation in Boardman Lake. A letter was written by the MDEQ in 1991 in agreement with the proposed delisting. The site remains inactive. Traverse City Wastewater Treatment Facility Historically, the Wastewater Treatment Facility has operated according to MDEQ standards. In September, 1998 a spill of ferric chloride solution potentially impacted groundwater and soils. A 4,000-gallon leaking tank was removed and a ground pump was installed to clean up the spill. The solution was detected in the soil to the water table to approximately 10 feet below ground surface. In 2001 a mercury minimization program was implemented given the detection of the metal in the influent from several industries the facility services. Following the implementation of this program, no mercury was detected in the effluent since 2001. A pretreatment program was also implemented to determine and identify any industrial discharges in the influent. Each year between 1986 and 1990, the wastewater treatment facility had effluent violations with the following reasons cited: 1) high strength industrial wastes entering the system, 2) solids handling deficiencies in the system, 3) various equipment failures, 4) inconsistent process control procedures for biological oxygen demand (BOD), total dissolved solids (TSS), and phosphorous. In April 1994, it was determined the Bay Street and Coast Guard Station pumping stations were not

6
meeting the State’s requirements for design and safety. In 1994, polychlorinated byphenols (PCBs) were detected in the influent. This prompted the City of Traverse City to suggest that the MDEQ National Pollutant Discharge Elimination System (NPDES) permit application address this concern in the future. In 1999 and September 2000, sewer overflow occurred into the Boardman River further causing subsequent beach closings following major rain events. In June 2000, the facility effluent exceeded NPDES permit limit for phosphorous. The possible cause being from a faulty pretreatment influent from Sara Lee Bakery was determined. According to the City of Traverse City population assessments and future projections, the current treatment plant is operating beyond capacity limit and a new facility is scheduled for construction approximately 4.5 miles upstream from the current site. The new facility assures a decrease loading of Total Suspended Solids, BOD, nitrogen ammonia, and phosphorous to the Boardman River. In December 2002, the current wastewater treatment facility is operating in compliance with the current MDEQ NPDES permit. During 2002 and 2003 the plant was being upgrade to implement tertiary treatment, beyond state and federal treatment requirements. Front Street Area ** The Front Street Area site is located at Front and Park Streets along the 300 block of Front Street. At 302 East Front Street, during a sewer replacement project in February 1985, contaminated soil was detected at the water table approximately six feet below ground surface. Subsequent soil and groundwater analysis indicates the presence of gasoline components. In March 1985, the MDEQ requested the potentially responsible parties to develop a work plan to define and resolve the contamination problem. The previous owner of the site continues to refute responsibility. The current owner, Midwest Broadcasting Company, purchased the property from Amoco Oil in 1974, and shortly thereafter removed the UST systems. According to the MDEQ status report dated March 19, 1985, conversations with city officials indicated at least six former gasoline stations and automobile shops existed within a 100-yard radius of the site including: 301 and 302 East Front Street, 314 and 315 East Front Street, 317 East Front Street, and 325 East Front Street. Further, there have been numerous reports of oil seeps into the Boardman River in this area during the 1960s and 1970s. Groundwater flow direction is estimated to be northwest toward Boardman River and Grand Traverse Bay. On May 22, 1985, approximately 58 cubic yards of soil bearing a fuel odor was removed. The excavating company representatives described a fresh fuel oil smell. An excavated area measuring approximately 30 feet by 20 feet was located on the north side of Front Street between Park Street and Boardman Avenue. Correspondence dated May 28, 1985 from the MDEQ, recommended the site be placed on the Part 201 list. The sewer replacement was completed in mid-1985. In July 1991, a complaint was received by the MDEQ regarding an UST system which was removed in 1990 at 311 East Front Street. The complaint stated that the removal resulted in a petroleum odor at the Boardman River. A MDEQ activity report stated that contamination was found in different locations in this area. The MDEQ site compliance file remains open.

7
One Hour Martinizing ** One Hour Martinizing is located at 115 Pine Street and is being operated as a dry cleaning facility. A hydrogeological investigation revealed the presence of PCE contamination in the groundwater at the water table following a release in 2001. Cis-1,2-dichloroethane was detected at 240 ug/L and exceeding the MDEQ Part 201 criteria for Generic Residential Drinking Water Standards. Benzene and 1,2,4-trimethylbenzene were also detected above these standards and are believed to be migrating onto One Hour Martinizing property from a former gas station property to the south. According to a report submitted to the MDEQ, very low vertical gradients within groundwater and density differences of compounds indicates no migrating contamination plume exists at this site. A letter from MDEQ, dated September 18, 2002, requests further delineation of the extent of the contamination and remediation of the site and that the current work plan submitted on behalf of One Hour Martinizing is inadequate. The MDEQ site file remains open. Traverse City Iron Works */** Traverse City Iron Works was formerly located along the Boardman River, between Eighth Street and Union Street in Traverse City. Historically, the Traverse City Iron Works operated as an iron processing plant. Regular dumping of core/mold sand, slag, and iron cuttings occurred around foundry buildings north of the railroad tracks along the Boardman River. Soil sampling was conducted in 1994 at and beneath old foundry buildings, evidencing elevated levels of heavy metals and polynuclear aromatics. Groundwater flow at the site is documented to be northeasterly toward Boardman River. 1998 soil analysis evidenced heavy metals in concentrations twenty times above MDEQ criteria. Metals within site soils include arsenic, barium, chromium, copper, lead and zinc. Additionally, (bis)1,2-ethylhexyl phthalate, and benzo(b)fluoranthene exceed GSI criteria. In 1998 and as a part of site redevelopment, a slope stabilization/containment wall was installed along the Boardman River’s edge to prevent contamination from entering into the Boardman River. A 1998 hydrogeological investigation report revealed the presence of elevated levels of arsenic, lead, and PNAs in soil and lead in the groundwater. Nine samples of river sediment were also collected and analyzed, documenting elevated levels of arsenic and lead. Response activities included river slope stabilization, UST removal, removal of impacted soil and debris, the further elimination of contamination during site redevelopment, establishing engineering controls of contaminant migration, property deed restrictions, and a monitoring plan. During October of 1999, a site redevelopment work plan was approved by the MDEQ, and site redevelopment was approved with the inclusion of impervious barriers (such as concrete building slabs, asphalt parking areas, curbs and gutters, sidewalks, and clean cover/landscaping). According to a 2002 soil investigation, the following were detected in the soil above MDEQ Part 201, GSI criteria: chromium, mercury, selenium, fluoranthene, and phenanthene. All samples were collected from a proposed storm water infiltration basin location.

8
Cherryland Asphalt ** This facility produces asphalt at 2200 Cass Road. 1989 MDEQ investigations documented that Cherryland Asphalt dumped demolition waste material in adjacent wetlands and uplands between the years of 1980 and 1989. Waste dumped in wetlands along the Boardman River was referred for wetland violation enforcement to the MDEQ Geological and Land Management Division (GLMD). Solid waste, oil, ash, demolition waste, construction waste, cars and buses, drums, USTs, and floor drains to wetlands were discovered by the MDEQ at the site in 1989. A 1993 study of the site was completed by Cherryland Asphalt. Three notice letters from MDEQ were sent to Cherryland Asphalt between 1992 and 1997, requesting a site remediation/action plan for the recognized environmental contamination. Enforcement actions were recommended by the MDEQ in 1998, however no action had taken place at the time of this report. Crain Fabric Care ** Crain Fabric Care is located on the corner of Park Drive and South Airport Road. In 1991, a leaking 55-gallon drum was excavated at the site, revealing elevated levels of BTEX, PCE and TCE in the groundwater at twenty-three (23) feet below ground surface (b.g.s.), and flowing west-northwesterly. In April 1993, the site owner declared bankruptcy. The petroleum constituent toluene was also detected in the soils at and beneath the former UST. In 1997, trihalomethanes (THMs) were also detected in groundwater. In 2000 PCE was documented in groundwater at the site at 5 to 8 ug/L. During May of 2002, groundwater samples indicated PCE up to 4 ug/L. Groundwater at the site exists at 22 to 24 feet b.g.s., flowing to the northwest. The MDEQ began enforcement actions in July 1997. State costs as of 1997 have totaled nearly $100,000 to replace residential drinking water wells allegedly contaminated by this release. Lear Corporation** The Lear Corporation is located at 10010 Woodmere, manufacturing auto and truck parts. In 1924, the property was an electroplating facility known as Setwell Company. Two undescribed waste water lagoons were located along the western side of the Setwell property, periodically receiving untreated waste water. In 1973, the property was purchased by Essex Wire Corporation, and in 1974 United Technologies Automotive (UTA) became the owners and operators of the facility. At the time of purchase by UTA, groundwater downgradient of the lagoons was known to be contaminated with elevated levels of cyanide, nickel, and zinc. In 1989, an incident occurred in which paint waste containing lead and zinc was discovered discharging from beneath the parking lot. Soils within this area was excavated and disposed off-site. To date three contaminated groundwater plumes have been documented on-site, migrating and discharging to Boardman Lake. Groundwater contamination plumes at the site originate from a former catch basin near the rear parking lot, from the lagoon/pit area, and at the southern extent of the property. Low levels of volatile organic compounds including PCE were discovered within the southern groundwater plume. Groundwater flow at the site is documented to be northwest toward Boardman Lake. In June of 1981 the MDEQ
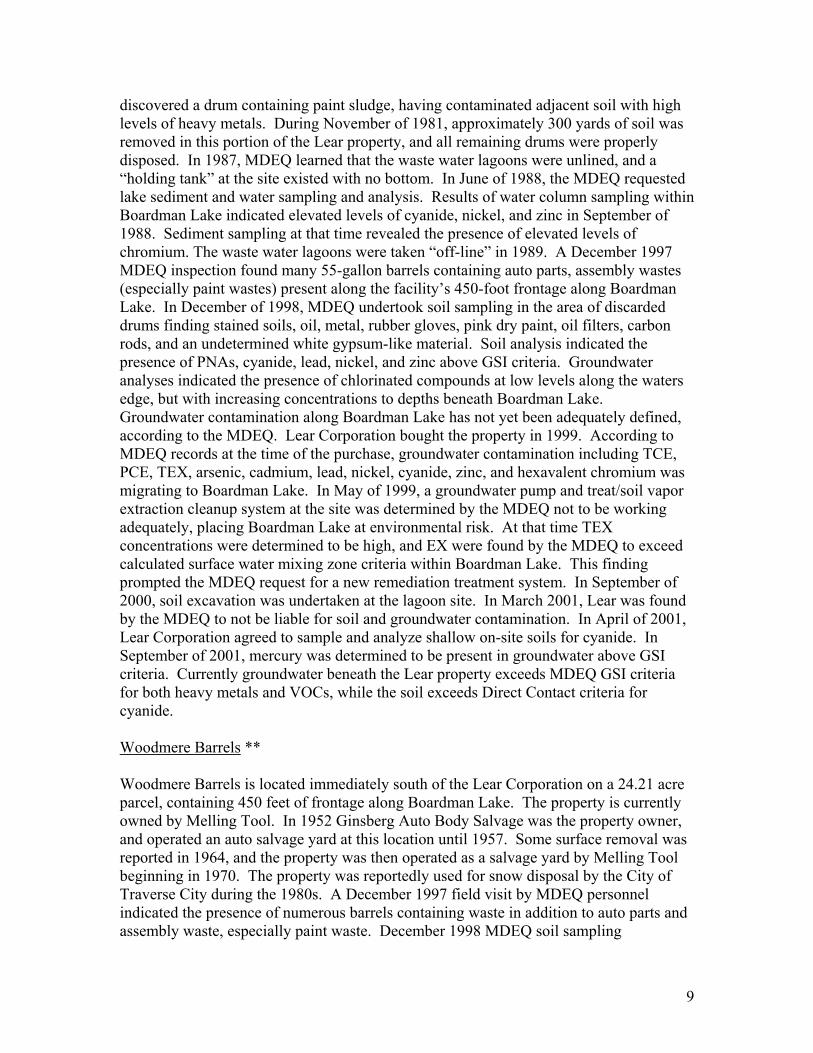
9
discovered a drum containing paint sludge, having contaminated adjacent soil with high levels of heavy metals. During November of 1981, approximately 300 yards of soil was removed in this portion of the Lear property, and all remaining drums were properly disposed. In 1987, MDEQ learned that the waste water lagoons were unlined, and a “holding tank” at the site existed with no bottom. In June of 1988, the MDEQ requested lake sediment and water sampling and analysis. Results of water column sampling within Boardman Lake indicated elevated levels of cyanide, nickel, and zinc in September of 1988. Sediment sampling at that time revealed the presence of elevated levels of chromium. The waste water lagoons were taken “off-line” in 1989. A December 1997 MDEQ inspection found many 55-gallon barrels containing auto parts, assembly wastes (especially paint wastes) present along the facility’s 450-foot frontage along Boardman Lake. In December of 1998, MDEQ undertook soil sampling in the area of discarded drums finding stained soils, oil, metal, rubber gloves, pink dry paint, oil filters, carbon rods, and an undetermined white gypsum-like material. Soil analysis indicated the presence of PNAs, cyanide, lead, nickel, and zinc above GSI criteria. Groundwater analyses indicated the presence of chlorinated compounds at low levels along the waters edge, but with increasing concentrations to depths beneath Boardman Lake. Groundwater contamination along Boardman Lake has not yet been adequately defined, according to the MDEQ. Lear Corporation bought the property in 1999. According to MDEQ records at the time of the purchase, groundwater contamination including TCE, PCE, TEX, arsenic, cadmium, lead, nickel, cyanide, zinc, and hexavalent chromium was migrating to Boardman Lake. In May of 1999, a groundwater pump and treat/soil vapor extraction cleanup system at the site was determined by the MDEQ not to be working adequately, placing Boardman Lake at environmental risk. At that time TEX concentrations were determined to be high, and EX were found by the MDEQ to exceed calculated surface water mixing zone criteria within Boardman Lake. This finding prompted the MDEQ request for a new remediation treatment system. In September of 2000, soil excavation was undertaken at the lagoon site. In March 2001, Lear was found by the MDEQ to not be liable for soil and groundwater contamination. In April of 2001, Lear Corporation agreed to sample and analyze shallow on-site soils for cyanide. In September of 2001, mercury was determined to be present in groundwater above GSI criteria. Currently groundwater beneath the Lear property exceeds MDEQ GSI criteria for both heavy metals and VOCs, while the soil exceeds Direct Contact criteria for cyanide. Woodmere Barrels ** Woodmere Barrels is located immediately south of the Lear Corporation on a 24.21 acre parcel, containing 450 feet of frontage along Boardman Lake. The property is currently owned by Melling Tool. In 1952 Ginsberg Auto Body Salvage was the property owner, and operated an auto salvage yard at this location until 1957. Some surface removal was reported in 1964, and the property was then operated as a salvage yard by Melling Tool beginning in 1970. The property was reportedly used for snow disposal by the City of Traverse City during the 1980s. A December 1997 field visit by MDEQ personnel indicated the presence of numerous barrels containing waste in addition to auto parts and assembly waste, especially paint waste. December 1998 MDEQ soil sampling

10
documented soils stained with oils, glues, paints, a white gypsum-like material, barrels, various metal, rubber, oil filters, and carbon rods. Soil sampling and analyses by the MDEQ confirmed the presence of PNAs, cadmium, lead, nickel, and zinc above MDEQ GSI criteria. A possible migration of contamination from the Lear property was suspected. Between 1980 and 2000 arsenic, barium, cadmium, chromium, copper, lead, selenium, mercury, and zinc were all detected above MDEQ residential soil clean up criteria at the site. Additionally, groundwater evidenced contamination with TCE and PCE at relatively low levels, but above generic residential drinking water criteria. Importantly, solvent concentrations in groundwater were reported to increase with depth, though the vertical extent of groundwater contamination was not defined. Soil removal was reportedly undertaken at the site in June of 2000. Reportedly, additional soil removal and sampling was undertaken by the MDEQ in 2001 along the fence at the northern property boundary with Lear. Phase I and II and Baseline Environmental Assessments were undertaken in July of 2001 by potential purchaser, Traverse City Light and Power. This report indicated the September 2001 discovery of mercury in groundwater at the site above GSI criteria. Recent data within the MDEQ file indicate that additional soil removal was completed in 2002, and that arsenic, barium, cadmium, chromium, cyanide, copper, lead, selenium, mercury and zinc exist at the site above MDEQ residential soil criteria. Lastly, most recent groundwater investigation document the presence of TCE, PCE, barium, cadmium, chromium, copper, lead, mercury, and zinc above MDEQ groundwater cleanup criteria. It is noted that hexavalent chromium has not been determined to be absent from the site. The site has been redeveloped into a 110 unit multi-family residential and an 100 unit unassisted senior living center. Former Keystone Road Dump ** Keystone Road dump is located along Keystone Road approximately one mile south of South Airport Road, within a 100-year floodplain of the Boardman River. Owned by the City of Traverse City, the 27-acre dump was operated as a licensed landfill since 1966. In March 1971, the City of Traverse City was cited by the MDEQ for violations for placing refuse too close to the Boardman River, and for an extensive rodent infestation. In January of 1972 the dump was ordered closed by the MDEQ due to violations of proper daily covering. The MDEQ stated in February of 1974 that the dump had not been properly covered or maintained to prevent leakage to the Boardman River. In February of 1975 the MDEQ notified the City of Traverse City in writing that the Keystone Road Dump was filled to capacity, operating as an unlicensed landfill, and likely polluting the Boardman River. The dump was again ordered closed in March 1975, after additional notification of violations. According to MDEQ correspondence, potential impacts to the Boardman River were identified and groundwater monitor wells were installed between the dump and the river in June of 1984. A hydrogeological investigation conducted in December of 1984 evidenced high levels of sodium, bicarbonates, and chlorides within on-site groundwater monitor well, MW-3. During February of 1992, the MDEQ noted the presence of landfill leachate in an on-site drain with elevated levels of chloride, chemical oxygen demand (COD), and alkalinity as compared to the ambient water chemistry of the Boardman River. In February 1992, increased levels of arsenic, barium, chloride, copper, zinc, mercury, and BTEX were

11
detected in the groundwater, however all were below MDEQ standards. PCE, benzene, and xylenes were also detected in high concentrations. During the summer of 1992, mercury was also detected in the groundwater. In March 1995, zinc was also detected above MDEQ groundwater criteria. Groundwater monitoring ended in 1996, and according to internal MDEQ correspondence, the dump has never been capped or closed with the required post-closure monitoring. In March 1, 1996 the City of Traverse City notified the MDEQ that no environmental investigation or remediation was completed or planned, and the expressed the desire to use the property for recreation. May 13, 2002, iron bacteria were noted by the MDEQ in seeps and springs downgradient of the landfill. Some wetland filling was evident and MDEQ file notes, “several seeps all along entire site, several 100 yards…” While the landfill has never been capped or officially closed, MDEQ waste management staff have recommended listing of the location as a site of environmental contamination, and expressed concern regarding potential nitrate contamination of groundwater from composting practices. In May 2002, the MDEQ considered the site a candidate for escalated enforcement actions. Former Boot Lake Dump ** The former Boot Lake dump is located south of 2662 Cass Road along Boardman Lake, just beyond Traverse City’s southern limit. The site is a former dump, owned by the City of Traverse City. From 1920 to 1930 the site was a part of the Traverse City Country Club, and was maintained as a part of its golf course. The property was deeded to the City of Traverse City in 1950, and was a city-owned and operated dump site from the 1950s to 1978. Kellogg Wholesale Supply bought the property in 1960. J&A Properties, formerly Kellogg Wholesale Supply recently performed a BEA for two parcels associated with the former dump. Parcel 1 includes two warehouse buildings, and Parcel 2 is comprised of the unregulated landfill. The former dump is documented as being a former lake filled with solid and other wastes. In the 1960s and 1970s, the dump was used for disposal of leaves, rubbish, snow, and waste soil. In the 1960s, potable water at Kellogg Wholesale Supply evidenced contamination. A deeper well was drilled to a depth of approximately 97 to 102 below ground surface, below a clay layer. Subsequently, lead was detected in soil, and silver and zinc were documented in the groundwater. During 2001, a Grand Traverse County plan sparked a discussion regarding the potential of brownfield funding for cleanup and redevelopment. Currently the site is being used by J&A Properties for storage, retail and office space. Radio Centre of Traverse City, Inc.* Radio Centre of Traverse City is located at 314 East Front Street, and was a former filling station and a print shop. While a filling station, the site contained 10 former petroleum USTs. Photo development chemicals were subsequently detected in on-site soil. The following chemicals of concern were detected above MDEQ residential generic cleanup soil criteria: naphthalene, benzo(a)pyrene, 2-methylnaphthalene, acenapthylene, phenanthrene, benzo(a)anthracene, dibenzo(a,h)anthracene, silver, mercury, cadmium, chromium, benzene, and fluoranthene. Lead and silver were detected in the groundwater.

12
Radio Centre of Traverse City, Inc. purchased the property in 2000 under a BEA. Groundwater flow has been documented to be directly north to the Boardman River. Nottke Trucking* A BEA was conducted at this location documenting the presence of the heavy metals cadmium, total chromium, total lead, and zinc in soil above Part 201 soil leaching to residential drinking water criteria. No further information was available. Site location requires verification. Leaking Underground Storage Tanks Former Amoco #0188 ** The former Amoco station #0188, is located at 206 South Union Street in Traverse City. In September 1988, a limited soil investigation was conducted. The results from the soil samples collected at the site indicated elevated concentrations of purgeable aromatic hydrocarbons (BTEXs). A confirmed release from UST systems was reported to the MDEQ on December 8, 1988. Upon further investigation it was determined that groundwater had also been impacted by the release from UST systems. Free phase petroleum product was further discovered upon groundwater at and beneath the site and was remediated. Preliminary reports suggest that groundwater flow is west-southwesterly. Concentrations of BTEXs and methyl tertiary-butyl ether (MTBE) exist at this location in excess of the MERA Type B soil and groundwater cleanup criteria. The MDEQ suspects that the contaminated groundwater has migrated off-site and is venting into the Boardman River. Consequently, the MDEQ recommended an aggressive approach be undertaken for the definition of the impacted soil and groundwater to prevent any further migration of the groundwater to the surrounding properties and the Boardman River. In 2003 the site was redeveloped for commercial use in accordance with MDEQ regulations and brownfield redevelopment procedures River Front Plaza River Front Plaza is located at 315 and 317 East Front Street. This site is also known as contamination area #2 of the Front Street Area. A hydrogeological investigation undertaken in 1989 indicated that hydrocarbon contamination existed at the site. A diesel fuel UST release occurred in 1992. According to MDEQ reports, impacted soil was excavated in 1993. According to a report to MDEQ in 1994, groundwater containing polynuclear aromatics, BTEX constituents and dissolved lead is not migrating from the site above Residential GSI levels in accordance with Act 307 Type B Default GSI Criteria. Groundwater flow is to the northeast. Six USTs were removed from the ground following the release the site was officially closed in 1994.

13
Ware’s Auto Sales Ware’s Auto Sales is located at 720 East Eighth Street. In 1991 six UST systems were located during an environmental site assessment at this location. A confirmed release was reported to the Michigan State Police/Fire Marshall Division (MSP/FMD) upon the removal of a 5,000-gallon unleaded gasoline UST in front of Ware’s Auto Sale office. Subsequent hydrogeological investigations indicated the presence of lead in the soils at the site’s former auto body shop, however potential groundwater contamination was determined not to be present. Soil removal occurred at the site and currently unrestricted residential use has been approved by MDEQ following site closure in 1995. Aunt Barb’s Day Care ** Aunt Barb’s is located at 601 East Eighth Street, and is currently operated as a day care/learning center facility. From 1962 to 1982 the property was leased by Murphy Oil USA, Inc. and operated as a retail gasoline and automobile service station known as Murphy Oil Station #1563. UST systems have reportedly not been in operation at this facility since 1982 and have been removed. Following a September 1990 complaint at the day care of stained soils, a hydrogeological investigation was undertaken at this location and it was determined that regulated substances exist below state standards within soils at this location, but BTEX concentrations exist in the groundwater above the MDEQ criteria. Groundwater flow has been determined to be in the northeasterly direction. An audit of the project by the MDEQ has requested the installation of additional groundwater monitoring wells to determine the extent of off-site migration of contaminants. In 1995, this work was proposed to the MDEQ, and owner/operators were awaiting work plan review and approval. On June 21, 1994, a Consent Decree and Agreement was signed by all potentially responsible parties and to undertake a cleanup in accordance with state regulations. Currently the groundwater monitoring continues, and the facility has not been approved for closure. Tower Automotive* Tower Automotive is located at 1677 Park Drive, and has operated as a general automotive repair facility. According to a 2000 Soil Investigation Report, PCE and petroleum constituents above Part 201 soil leaching to residential drinking water criteria were detected in the soils following a 2000 overflow of an UST. All stained soils were excavated and backfilled. According to a MDEQ report, the site was approved for closure August 18, 2000. No. 1 Cab Company ** The No. 1 Cab Company, formerly Cherry Capital Cab, is located at 747 East Eighth Street. In 1956, the site converted from residential to the Rengo Brothers Gas Station and Car Wash. On April 27, 1987 four UST systems, owned by Blarney Castle Oil Company, were removed from the site. The UST systems were comprised of a 12,000-gallon and three 4,000-gallon tanks containing gasoline. Historically, the No. 1 Cab

14
Company property was occupied by a car wash and a Phillip’s 66 gasoline retail and automobile service station. In response to citizen complaints concerning the site, on March 22, 1991 the MDEQ requested further site investigation. Blarney Castle Oil Company began hydrogeological investigation, however additional work was requested by the MDEQ. The MDEQ requested an update of project activities by April of 1995, or else the state threatened to undertake enforcement actions. Groundwater is known to exist at approximately twenty-six (26) feet below ground surface. Soil and groundwater investigations in 1999 revealed the presence of BTEX, naphthalene, and lead in the soil and groundwater. A BEA was completed on the property in December 1999, and affirmed by the MDEQ in April 2000. Contamination at the site has not been addressed or defined satisfactorily. Only UST and contaminated soil source removal have been undertaken to date at the site. Randy’s Old Towne Service ** Randy’s Old Town Service Station is located at the southeast corner of Union Street and Eighth Street in Traverse City. Groundwater from the site is documented to migrate to the north. A gasoline spill occurred at the site in 1983 and was cleaned up. In 1990, a 130 gallon gasoline spill occurred, sending gasoline north along Union Street. BTEX constituents have been documented to exist in the soil. Approximately 120 yards of contaminated soil was removed at three locations to attempt to remediate the site in November 1990. Overhead Door Overhead Door is located at 530 Wellington Street. A 1995 leaking UST revealed the presence of BTEX constituents in the groundwater. A BTEX contaminated groundwater plume extends onto to Wellington Street. Soil excavation activities occurred and the site was closed in 1995. Cornille Concrete (formerly Peninsula Corporation) ** Cornille Concrete is located at 2900 Cass Road. Releases were confirmed from five USTs in 1991, releasing waste oil, diesel, and gasoline. Soil excavation occurred for approximately 300 yards of soil removed. Groundwater was documented to flow to the northeast. The groundwater plume was known to be impacted with TEX and PNAs, below MDEQ cleanup criteria at the time. However, benzene was detected in groundwater above MDEQ criteria. A 1995 closure report was submitted, however no official closure occurred by MDEQ. Jr. Discount Tire Jr. Discount Tire is located at 602 East Eighth Street. A gasoline UST release occurred in 1992, and remedial investigations were undertaken in January and April of 1993. Non-detect levels of BTEX, PNAs, and lead were documented. The site was closed in 1994.
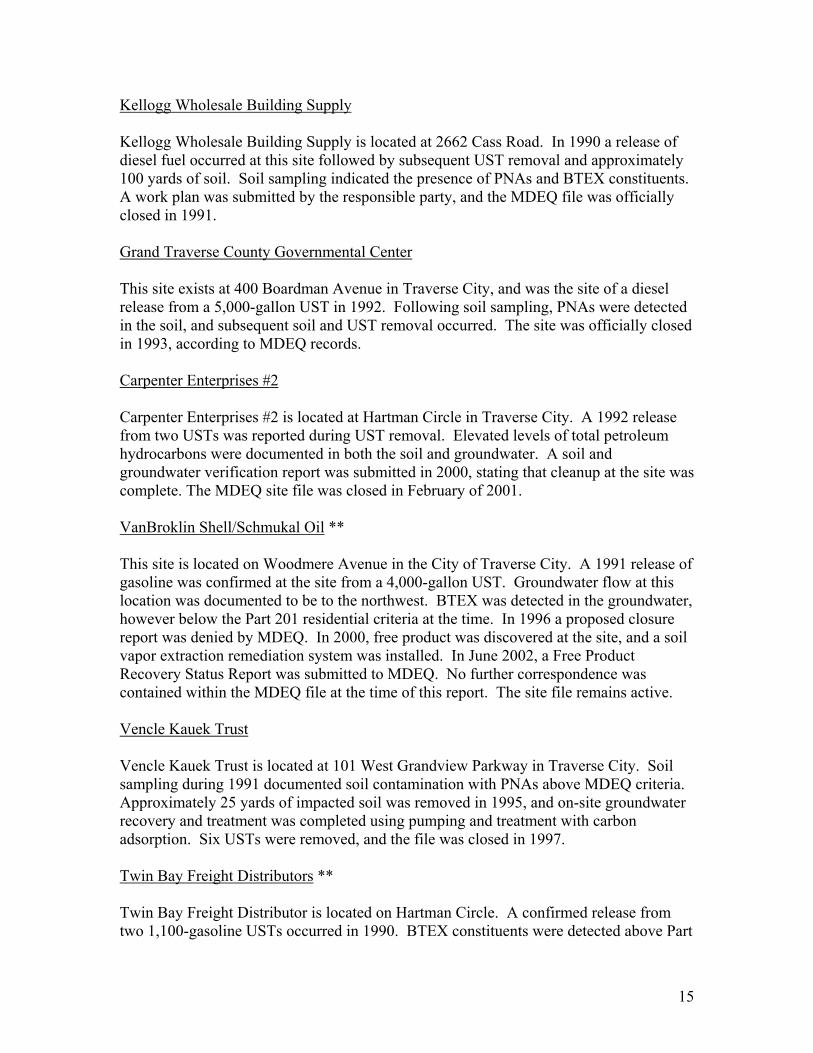
15
Kellogg Wholesale Building Supply Kellogg Wholesale Building Supply is located at 2662 Cass Road. In 1990 a release of diesel fuel occurred at this site followed by subsequent UST removal and approximately 100 yards of soil. Soil sampling indicated the presence of PNAs and BTEX constituents. A work plan was submitted by the responsible party, and the MDEQ file was officially closed in 1991. Grand Traverse County Governmental Center This site exists at 400 Boardman Avenue in Traverse City, and was the site of a diesel release from a 5,000-gallon UST in 1992. Following soil sampling, PNAs were detected in the soil, and subsequent soil and UST removal occurred. The site was officially closed in 1993, according to MDEQ records. Carpenter Enterprises #2 Carpenter Enterprises #2 is located at Hartman Circle in Traverse City. A 1992 release from two USTs was reported during UST removal. Elevated levels of total petroleum hydrocarbons were documented in both the soil and groundwater. A soil and groundwater verification report was submitted in 2000, stating that cleanup at the site was complete. The MDEQ site file was closed in February of 2001. VanBroklin Shell/Schmukal Oil ** This site is located on Woodmere Avenue in the City of Traverse City. A 1991 release of gasoline was confirmed at the site from a 4,000-gallon UST. Groundwater flow at this location was documented to be to the northwest. BTEX was detected in the groundwater, however below the Part 201 residential criteria at the time. In 1996 a proposed closure report was denied by MDEQ. In 2000, free product was discovered at the site, and a soil vapor extraction remediation system was installed. In June 2002, a Free Product Recovery Status Report was submitted to MDEQ. No further correspondence was contained within the MDEQ file at the time of this report. The site file remains active. Vencle Kauek Trust Vencle Kauek Trust is located at 101 West Grandview Parkway in Traverse City. Soil sampling during 1991 documented soil contamination with PNAs above MDEQ criteria. Approximately 25 yards of impacted soil was removed in 1995, and on-site groundwater recovery and treatment was completed using pumping and treatment with carbon adsorption. Six USTs were removed, and the file was closed in 1997. Twin Bay Freight Distributors ** Twin Bay Freight Distributor is located on Hartman Circle. A confirmed release from two 1,100-gasoline USTs occurred in 1990. BTEX constituents were detected above Part

16
201 generic criteria for soil and groundwater. According to MDEQ records, no closure report was submitted, and the last correspondence was in March 1996. The site file remains open. Tire Factory ** The Tire Factory is located at 1100 South Garfield in Traverse City. A release was confirmed from an UST system in 1991, and sampling indicated BTEX contamination in groundwater at the site. An In-situ bioremediation system was installed and operated to cleanup soil and groundwater at the site. During 1996, the MDEQ requested a closure report from the owner of property. Currently the Tire Factory is trying to reach an agreement with its insurance company over remediation and investigation costs. The MDEQ file remains open. Woodland Oil ** Woodland Oil is located at 501 East Eighth Street in Traverse City. Three gasoline USTs were removed from the site in March 2001. Groundwater is documented at 15 feet b.g.s., and flowing to the northeast. A contaminated groundwater plume exists flowing to Washington Street, containing BTEXM, trimethylbenzenes, lead, naphthalene, and phenanthrene. The MDEQ file remains open. Grand Traverse Auto ** Grand Traverse Auto was historically located along Front Street between Pine and Union Streets in downtown Traverse City. A confirmed release from an UST containing waste oil occurred in December 1992, as indicated by the presence of a waste oil sheen on the Boardman River. In September of 1996, groundwater contamination with BTEX and lead was determined to exist in a plume flowing to the Boardman River, and a mixing zone determination was completed. In June of 1997, according to MDEQ records, land use restrictions were placed on the site, and monitoring is ongoing. Ron’s Service ** Ron’s Service Station was located at 1114 South Union Street, currently the location of a Crystal Flash gas station. A release was discovered in the early 1990s contaminating the groundwater and soil with TEX, trimethylbenzenes, and naphthalene. Groundwater flow is documented to be west-northwesterly. Free product was discovered at twenty-four (24) feet b.g.s, and soil was removed to a depth of 22-24 feet. Recovery wells for free product and a granular activated carbon treatment system were installed to treat contaminated groundwater before discharge to an onsite drainfield. Cite cleanup was ongoing at the time of this report.

17
Eighth Street Blarney Castle ** Blarney Castle is located on 444 Eighth Street, at the intersection of Eighth and Wellington Streets. In June of 1999, a groundwater contamination plume containing BTEX constituents was documented to be migrating north-northeasterly, and is known to extend to Webster Street. Groundwater is at 12 feet b.g.s. The MDEQ file remains open. Crandall’s Service ** Crandall’s Service Station site was located on the corner of Union and Eighth Streets. An August 1991 gasoline spill was discovered, and a confirmed release waste oil and gasoline occurred in April 1992. Soils were documented to be contaminated with TEX, lead, and PCBs. Groundwater flow was documented to be to the northeast towards the Boardman River. A surface water mixing zone determination was requested in September of 1996. Limited closure status was approved following a restrictive covenant and a City of Traverse City ordinance in January of 2002. A May 2002 MDEQ audit states that the extent of groundwater and soil contamination remain undefined, and more groundwater investigation was expected during for the summer of 2002. The MDEQ file remains open, but site closure is believed to be imminent. Schmukal Oil Bulk Plant ** Schmukal Oil Bulk Plant is located at 1516 Barlow Street in Traverse City. Groundwater is documented at 30 feet b.g.s., and flowing northwest to west. Gasoline and diesel UST released were reported in June of 1990. Groundwater contamination includes Xylenes, trimethylbenzenes, 2-methylnaphthalene, and naphthalene. Free product was detected at the site in 1992, and was cleaned up during 1996. According to MDEQ records, the extent of the groundwater contamination plume has not need adequately defined. Free product was rediscovered in June 2001. The MDEQ site file remains open. Tezak Trust The Tezak Trust is located at 1026 Hannah Street in Traverse City. A LUST was reported to the MDEQ in 1991 due to the documentation of soil contamination above MDEQ criteria for BTEX and lead. Groundwater flow was documented to be to the northwest. Corrective actions were taken, and were completed in 1993. Following a May 1994 MDEQ audit, the site was removed form the Part 201 list, and site closure was approved by the MDEQ.
APPENDIX H AQUATIC MACROPHYTE SURVEY DATA SUMMARY
NOTE: Hardcopy of this report is available at the
Watershed Center Grand Traverse Bay office.
Please call 231-935-1514 for more information.

APPENDIX I BENTHIC MACROINVERTEBRATE
SURVEY DATA SUMMARY

Macroinvertebrate Samples Sample Date 9/8/2003 9/8/2003 9/8/2003 9/8/2003 11/5/2003Boardman Lake Sites Squares in sample 40 40 40 40 40Collected September 2003 squares sorted for sub-sample 23 40 23 14 14 with dredge Sample I.D. #2 #3 #4 #5 #13Class Order Family Genus/SpeciesOligochaeta Tubificida Tubficidae Immatures w/o hair chaetae 2 1 4 1Oligochaeta Tubificida Tubificidae Immatures with hair chaetae 2Oligochaeta Tubificida Tubificidae fragments (1) (1)Crustacea Amphipoda Gammaridae Crangonyx 6 2 14 4Crustacea Amphipoda Gammaridae Gammarus 2Crustacea Amphipoda Talitridae Hyalella azteca 1 5Crustacea Isopoda Asellidae Caecidotea 3 4 2 5Crustacea Isopoda Asellidae Lirceus 1Gastropoda Limnophila Ancylidae unid. genus 1Gastropoda Mesogastropoda Pleuroceridae unid. genus 1Pelycopoda Veneroida Dreissenidae Dreissena polymorpha 59 77 73 53Pelycopoda Veneroida Sphaeriidae Pisidium 1 1Insecta Ephemeroptera Heptageniidae Stenonema femoratum 1Insecta Megaloptera Sialidae Sialis 1 2Insecta Trichoptera Phryganeidae Agrypnia 1Insecta Trichoptera Polycentropodidae Cernotina 1Insecta Diptera Chironomidae Apedilum 1Insecta Diptera Chironomidae Chironomus 11 1 6 1 1Insecta Diptera Chironomidae Clinotanypus 3 6 2Insecta Diptera Chironomidae Dicrotendipes 2 1 3 18Insecta Diptera Chironomidae Einfeldia 1 4 2Insecta Diptera Chironomidae Orthocladinae (pupa) 1Insecta Diptera Chironomidae Paracladopelma 2Insecta Diptera Chironomidae Paratanytarsus 4Insecta Diptera Chironomidae Polypedilum 1Insecta Diptera Chironomidae Procladius 2 1 2 1 1Insecta Diptera Chironomidae Psectrocladius 2 1Insecta Diptera Chironomidae Tribelos 1
Total 99 6 100 106 102
Page 1 of 1
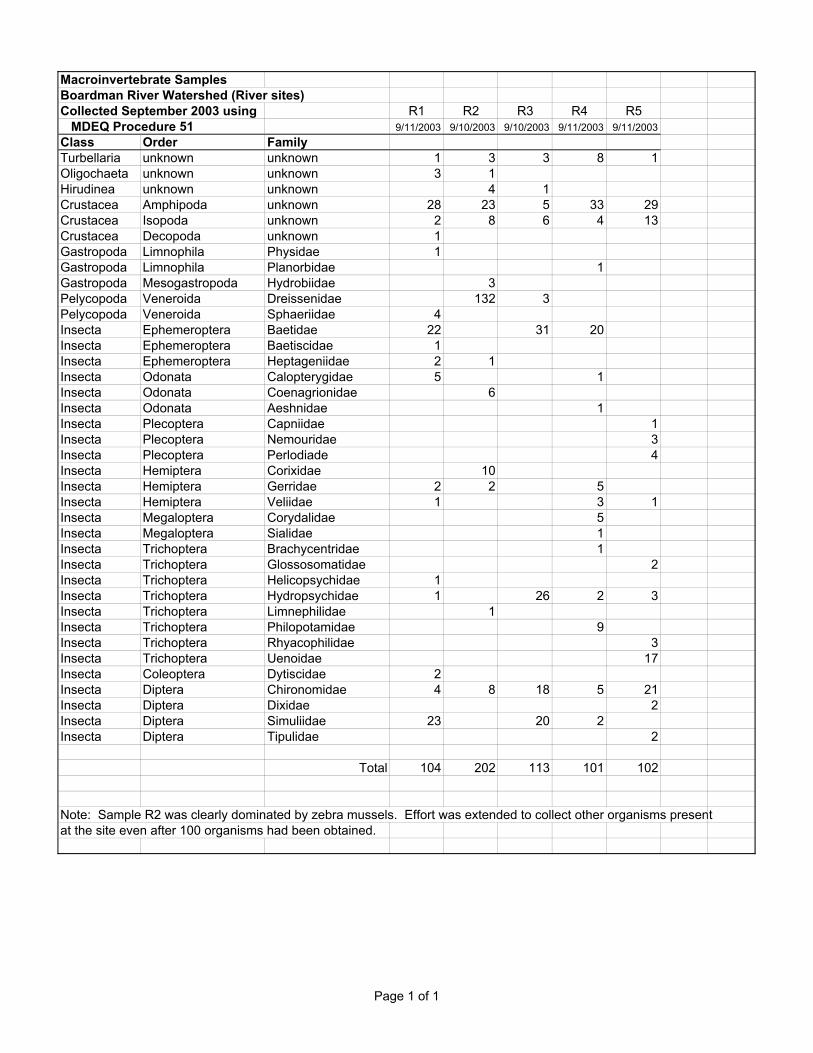
Macroinvertebrate SamplesBoardman River Watershed (River sites)Collected September 2003 using R1 R2 R3 R4 R5 MDEQ Procedure 51 9/11/2003 9/10/2003 9/10/2003 9/11/2003 9/11/2003Class Order FamilyTurbellaria unknown unknown 1 3 3 8 1Oligochaeta unknown unknown 3 1Hirudinea unknown unknown 4 1Crustacea Amphipoda unknown 28 23 5 33 29Crustacea Isopoda unknown 2 8 6 4 13Crustacea Decopoda unknown 1Gastropoda Limnophila Physidae 1Gastropoda Limnophila Planorbidae 1Gastropoda Mesogastropoda Hydrobiidae 3Pelycopoda Veneroida Dreissenidae 132 3Pelycopoda Veneroida Sphaeriidae 4Insecta Ephemeroptera Baetidae 22 31 20Insecta Ephemeroptera Baetiscidae 1Insecta Ephemeroptera Heptageniidae 2 1Insecta Odonata Calopterygidae 5 1Insecta Odonata Coenagrionidae 6Insecta Odonata Aeshnidae 1Insecta Plecoptera Capniidae 1Insecta Plecoptera Nemouridae 3Insecta Plecoptera Perlodiade 4Insecta Hemiptera Corixidae 10Insecta Hemiptera Gerridae 2 2 5Insecta Hemiptera Veliidae 1 3 1Insecta Megaloptera Corydalidae 5Insecta Megaloptera Sialidae 1Insecta Trichoptera Brachycentridae 1Insecta Trichoptera Glossosomatidae 2Insecta Trichoptera Helicopsychidae 1Insecta Trichoptera Hydropsychidae 1 26 2 3Insecta Trichoptera Limnephilidae 1Insecta Trichoptera Philopotamidae 9Insecta Trichoptera Rhyacophilidae 3Insecta Trichoptera Uenoidae 17Insecta Coleoptera Dytiscidae 2Insecta Diptera Chironomidae 4 8 18 5 21Insecta Diptera Dixidae 2Insecta Diptera Simuliidae 23 20 2Insecta Diptera Tipulidae 2
Total 104 202 113 101 102
Note: Sample R2 was clearly dominated by zebra mussels. Effort was extended to collect other organisms present at the site even after 100 organisms had been obtained.
Page 1 of 1