


Languages
Pages
Legal

Do bond issuers shop for a better credit rating?
Thomas Mählmann
Department of Banking, University of Cologne
Albertus-Magnus-Platz
50923 Koeln/Germany
Tel: (0049)+221-4702628
Fax: (0049)+221-4702305

Do bond issuers shop for a better credit rating?
Abstract
By utilizing a large sample of US bond issuers with ratings from Moody's, S&P, and Fitch,
this paper analyses whether observed differences in average rating levels between the third agency
Fitch and the mandatory agencies Moody's and S&P are due to issuers seeking only an additional
rating if it is expected to give a more favorable picture of credit quality. In contrast to previous
research, we also ask why some issuers possibly do expect to obtain an upwardly biased credit
risk assessment from Fitch. The analysis reveals strong evidence of rating shopping behavior. In
addition, issuers having an added incentive to press Fitch for a better rating are more likely to
solicit a third rating. Finally, by comparing Fitch's rating class default probabilities estimated for
issuers with and without an observed Fitch rating, we �nd that the default risks associated with a
particular rating class are signi�cantly increased for the �rst group.
Key words: Credit ratings; Credit risk, Default probabilities, Prudential regulation
JEL classi�cation codes: G10, G14, G18
1

1 Introduction
Rating agencies play a key role in the infrastructure of the modern �nancial system. By reduc-
ing information costs, they dramatically enhance both static and dynamic market ef�ciency, the
results of which are widely spread among �nancial intermediaries and end-users of the �nancial
system. They therefore generate positive externalities and, in effect, constitute public goods whose
bene�ts cannot be internalized by the agencies themselves due to the nature of rating production
and distribution. The only �pressure point� the agencies have (as the revenue basis for a viable
business) is the ability to charge fees to issuers, thereby making themselves subject to a sinister
form of moral hazard since every agency has an inducement to assign issuers high-quality ratings,
because issuers are, at �rst sight, free to decide on which agency they will select and pay for their
risk assessments. In addition to reputational concerns, this incentive is partially offset by the spe-
ci�c nature of the US rating market, which is highly concentrated and can be characterized by a
�two-rating norm�, ie, to access a broad investor pool, issuers are implicitly required to obtain rat-
ings from both major agencies, Moody's and Standard and Poor's (�S&P�). Thus, the two-rating
norm and their earned reputation in �nancial markets protects these two agencies to some degree
against competition from �third�, smaller agencies like FitchRatings (�Fitch�) and makes them
less susceptible to issuer pressure for upwardly biased risk assessments.1
In this sense, it is not surprising that these two entrenched agencies often argue against an
extended use of credit ratings in regulation (see Cantor, 2001; Griep and De Stefano, 2001). For
example, in Moody's of�cial response to the second consultative paper issued by the Basel Com-
mittee on Banking Supervision, Cantor (2001) points out that by using external ratings as a tool for
determining bank's capital requirements, the standardized approach to credit risk fundamentally
changes the nature of the rating agency's product. Issuers would pay rating fees, not to facilitate
access to capital markets, but to purchase a privileged status for their securities from the regulation
authority. As a result, approved rating agencies will have a product to sell regardless of its quality
and its credibility, and issuers could be attracted to engage in �rating shopping�, that is to solicit
additional ratings from smaller agencies, not protected by the two-rating norm or �nancial market
reputation, if and only if they are expected to be favorable compared to the existing ratings from1To re�ect to two-rating norm and to follow the literature (Cantor and Packer, 1997), we will call Moody's and
S&P �mandatory� agencies and Fitch an �optional� or �third� agency.
2

Moody's and S&P.
Many researchers (eg, Cantor and Packer, 1997; Jewell and Livingston, 1999; Feinberg, Sh-
elor and Jiang, 2004) have documented that third agencies on average assign higher ratings than
Moody's and S&P. Cantor and Packer (1997) argue that these observed differences in average rat-
ings re�ect differences in rating scales, ie, third agencies have higher rating scales. Even if it is true
that smaller agencies are less able to withstand issuer pressure to assign non-justi�ed superior risk
assessments, and an issuer's inclination to shop for the highest rating is increased by their use in
regulation, rating shopping behavior might still provide valuable information to the market. This
will be the case when some issuers are misjudged by Moody's and S&P and the third agencies are
able to correct for these valuation errors.
Therefore, a �nal judgement whether rating shopping is costly or bene�cial requires an assess-
ment of the sources that drive issuer's expectations regarding third ratings. If third agencies are
accurate and correct errors resulting from laxity of the major agencies, issuers feeling their default
risk being overestimated by Moody's and S&P will request a third rating to make up for the in-
formational de�ciencies in the �rst and second rating. This is the �laxity hypothesis�, implying
that rating shopping is a natural reaction to some de�ciencies in quality caused by inattention of
Moody's and S&P.2 On the other hand, according to the �adverse incentives hypothesis� issuers
expect higher third ratings because they can credible threat to solicit these ratings only if they are
biased upwards. If this is the case and issuer's pressure on third agencies promotes aggressive
rating practices, rating shopping will undermine any regulatory regime based on such ratings.
This paper empirically investigates whether issuers shop for better credit ratings, and, if they
do, what are their underlying reasons for expecting third ratings to be favorable: Mandatory rating
agency's laxity or adverse incentives of optional agencies. We use a large sample of 15,709 US
bond issuers with ratings from both, Moody's and S&P, over the period from 1999 to 2004. Be-
sides, 3,268 issuers also have a third rating from Fitch. To test for rating shopping and which of
the two alternative hypotheses dominates, an econometric model is introduced, that includes three
submodels: A model for predicting expected Fitch's ratings, a model for the decision to obtain a2The laxity hypothesis is consistent with survey evidence provided by Baker and Mansi (2002). Of the 20.2%
of issuers reporting to hire three or more agencies, 48% do so to resolve a split rating, follwed by 40% to get better
coverage than provided by the agencies already hired. That is, issuers use multiple ratings to increase the probability
of a true evaluation emerging, which, in turn, could ensure the best possible interest rate for their bonds.
3

rating from Fitch, and �nally, a model to derive Fitch's rating class default probability distribution
separately for issuers with and without an observed Fitch rating.
Our empirical results indicate that issuers do indeed shop for better credit ratings from Fitch
and that this behavior is driven by lower than average standards applied by Fitch to particular US
issuers having both mandatory ratings. These results are robust to alternative speci�cations of the
different submodels. The observed higher average ratings from Fitch, documented in previous
studies and also found in this paper, are therefore not the result of higher overall rating scales, but
of Fitch's strategically lowering of standards for selected issuers.
The remainder of the paper is organized as follows. Section 2 discusses the two-rating norm
and develops the alternative hypotheses why some issuers expect to obtain higher ratings from
third agencies. The econometric model is introduced in Section 3, and Section 4 presents the data
set and the variables used for specifying the different submodels. Section 5 shows the results, and
Section 6 concludes.
2 Rating shopping and the two-rating norm
The structure of the US corporate credit rating market can be characterized by a two-rating norm,
where the two ratings are those of Moody's and S&P, which have a combined market share in
excess of 80%, while Fitch's market share is approximately 14% (see Wiggins, 2001). In fact,
Fitch has much of its relative competitive strength outside the US, for example, Fitch is arguably
Europe's leading rating agency with a high coverage of European corporate bonds. There are
several forces which might have caused the two-rating norm to come about.
In particular, the US government surely helped create this rating agency duopoly, both by its re-
strictions on entry, which limited supply of Nationally Recognized Statistical Rating Organization
(NRSRO) ratings, and its use of NRSRO ratings in various regulatory schemes, which increased
demand for those ratings.3 But the government doesn't have the ability to readily destroy the3As a reaction to Enron, WorldCom, and other debacles, the rating agency regulatory regime is being revisited
as part of an effort to capture the increment between rating agency performance in a market with high market con-
centration and high barriers to entry, and rating agency performance in a more open market. The current regulatory
regime requires or encourages various entities - broker-dealers, banks, money-market funds, insurance companies,
trust companies, pension funds, and many others - to purchase �nancial instruments rated investment grade. But the
favorable regulatory treatment is available only if the agency issuing the rating is designated by the Securities and
4

oligopoly; use of NRSRO ratings and in particular, Moody's and S&P ratings, has simply become
too entrenched. Consider a typical purchaser of rated bonds, such as a money management �rm
with clients on whose behalf it is investing. The individuals making the day-to-day investment
decisions have guidelines, practices and �form� documents, all providing for purchase of debt in-
struments rated by S&P and Moody's, from which they don't have reason to deviate. Just as the
buyer of debt securities has no obvious incentive to violate the two-rating norm, neither does the
buyer of the rating - the issuer of the debt securities and its CEO. Rating agencies' fees, while per-
haps supracompetitive, pale in comparison to the size of most rated debt offerings. A CEO may be
second-guessed if he does not get two ratings and the offering is disappointing. A downside for not
abiding by the norm is far more likely than any upside from �outing it. Probably most importantly,
the second rating may very well pay for itself in the form of more advantageous �nancing rates.
Moreover, the smaller market share of Fitch re�ects not only less intrinsic demand for their
ratings but also their longstanding policy of rating bonds only on the request of the issuer, whereas
Moody's and S&P both have a policy of rating all taxable corporate bonds publicly issued in the
US. Should the two-rating norm show some sign of eroding, Moody's and S&P can reinforce it by
threatening to issue ratings the issuer has not solicited, using only the information publicly avail-
able. The implicit threat is always that without an issuer's active participation in (and payment for)
the rating, the issuer will not be given an opportunity to rebut any negative inferences that might
be made from the public information. However, because of reputational costs, rating agencies are
limited in their ability to use unsolicited ratings strategically.
But why do issuers occasionally deviate from the two rating norm and use (Fitch as) a third
rating? There are at least two major bene�ts from obtaining an additional rating. First, the potential
to lower the market-required interest rate on new debt issues. This assumes that the third rating has
an impact on bond yields which might be especially likely when there is great uncertainty about
the default risk of the �rm (eg, for �rms with split ratings from Moody's and S&P, or with high
leverage). A growing body of literature supports the assumption that ratings and rating changes do
impart some new information, not publicly available to the investor (see, eg, Hand, Holthausen and
Leftwich, 1992; Goh and Ederington, 1993; Kliger and Sarig, 2000). In addition, several papers
have investigated the effect of a second rating on bond yields, focusing exclusively on ratings from
Exchange Commission (SEC) as a NRSRO. Since February 24, 2003, there are four NRSROs - Moody's, S&P, Fitch,
and Dominion Bond Rating Service Limited.
5

Moody's and S&P. However, these papers have failed to reach a consensus on how the market
prices bonds with split ratings. Billingsley et al. (1985), Liu and Moore (1987) and Perry, Liu and
Evans (1988) all �nd that the market prices bonds with split ratings as if only the lower of the two
ratings conveys information. Thus there is no evidence of a cost based incentive for �rms to seek
additional ratings.
In contrast, Hsueh and Kidwell (1988) and Reiter and Zeibart (1991) �nd that the market prices
the bonds as if only the higher of the two ratings conveys information. Furthermore, Jewell and
Livingston (1998) show that when �rms receive a split rating from Moody's and S&P, the market
considers an average of the two ratings when determining default spreads for bonds. Thus the
market places some value on both ratings which indicates a powerful cost based incentive to seek a
second rating. Whereas these studies have been con�ned to ratings from Moody's and S&P, Jewell
and Livingston (1999, 2000) �nd that the ratings of two smaller agencies - Duff & Phelps and
Fitch - also have explanatory power for bond yields. However, in these papers, rating levels may
proxy for (publicly known) omitted variables which affect yield spreads. To avoid this problem of
�rm-speci�c omitted variables, future studies should examine the impact of Fitch's rating changes
on security prices.
Irrespective of how the market views a third rating, the new capital-adequacy standards for
banks (Basel II) provide a distinct cost based incentive for third ratings. To see this, recall that
the standardized approach of Basel II uses external ratings to determine risk weights for capital
charges. In order to prevent banks from �cherry picking� among the assessments of different
rating agencies, the Basel Committee has developed a series of guidelines on multiple assessments
(see Basel Committee on Banking Supervision, 2005, §96-98). These guidelines state that a bank
working with two agencies whose assessments map into different risk weights must use the higher
risk weight. When the bank works with three or more agencies whose assessments lead to different
risk-weights, the guidelines require the bank to use the higher of the two lowest risk weights.
Consider the following situation: A �rm gets a A from S&P and a Baa1 fromMoody's, the relevant
risk weight is therefore 100%. By obtaining a AA- or above from Fitch, the risk weight will
decrease to 50%.
There are further regulatory bene�ts of optional ratings (see Cantor and Packer, 1997). Since
some bond investors are constrained by regulation to purchase bonds with a particular rating or
higher, a third rating may increase the �rm's chances of meeting the regulatory standard and
6

thereby raising the liquidity and marketability of the instruments being rated. However, the fa-
vorable regulatory treatment only applies if the third agency has an NRSRO status.4
Certainly, all of the above bene�ts depend on third ratings giving a more favorable picture
of credit quality, ie, optional ratings may be sought predominantly by �rms that have reason to
expect they can improve upon their mandatory ratings, a practice commonly referred to as �rating
shopping�.5 These reasons may basically come from two sources: Laxity and adverse incentives.
Laxity, ie, de�ciencies in quality re�ecting inattention, may cause the mandatory agencies to
overlook and misinterpret some information, or to generally accept at face value whatever �rm
of�cials chose to tell them and not to ask probing questions. This implies that �rms would have
an incentive to seek additional ratings if they believed that an error in judgement caused them to
receive an inaccurately low rating, or conversely that an error in judgement could cause them to
receive an inaccurately high rating from the next rater (see Baker and Mansi, 2002).6
But why wouldn't mandatory rating agencies deliver the best product possible? Rather than
shirking on quality, the monopolist (or oligopolist) can simply raise the price. However, agencies
might not be able to raise prices any further (White, 2002). Another possibility is that the rating
agencies, having obtained privileged positions courtesy of the government, have adopted some of
the pathologies of government bureaucracies. Yet another possibility relates to how rating agencies
adapted to the sophistication in �nancial markets which began increasing exponentially in the4In addition, there may be a signaling reason for obtaining a third rating. If an issuer obtains no ratings, or only one
rating (especially from Fitch), the issuer could be signaling that it has something to hide, something it thinks the major
agency or agencies whose rating(s) weren`t sought might ferret out. In contrast, by subjecting itself to the scrutiny of
three agencies, an issuer will be sending a stronger signal to the extent rating agencies are perceived to be able to catch
whatever the issuer might be trying to hide.5In the past, Fitch itself argued that its ratings have often been sought when there is a strong expectation by
issuers of improving upon Moody's and S&P's ratings. In a letter to issuers in October 1995, Fitch explained the
planned introduction of a new policy to rate many issuers on an unsolicited basis as part of a strategy to �change the
misperception that our ratings are higher than those of our competitors, which has resulted from our previous policy
of only rating upon request of the issuer� (High Yield Report, 1995).6The laxity argument has been frequently used to characterize rating agency performance in anticipating major
debacles like Enron and WorldCom. For example, Joseph Lieberman, Chairman of the Senate Governmental Affairs
Committee, a Committee that produced a report on Enron, criticised Moody's and S&P as �dismally lax� (see Senate
Committee on Governmental Affairs, Financial Oversight of Enron: The SEC and Private-Sector Watchdogs, Press
Release Oct. 7, 2002).
7
1970s and 1980s. The omission of a suf�cient investment to keep pace with this development
might result in the rating agencies level of �nancial sophistication not rising with the level of
things about which they had to become sophisticated, and about which others had increasingly
become sophisticated. However, even if some of the reasons for laxity also apply to Fitch, its
much lower market share forces Fitch to compete more aggressively. Providing accurate ratings
for issuers feeling misjudged by the greater agencies might therefore be a valuable way to carve
out a niche for itself.
If the present state of affairs results in lesser effort being expended by the mandatory rating
agencies and hence, lower quality information, the issuer may also be paying too much in that it
has to get a (costly) third rating to make up for possible informational de�ciencies in the �rst and
second rating.
Adverse incentives, ie, the willingness to give more favorable ratings, may result from the well
known con�ict of interest inherent in the rating agencies business model. When �rms pay for their
own ratings, rating agencies might be tempted to accommodate the preferences of their customers
and give in�ated ratings.
Cantor and Packer (1996, 1997) argue that differences in average ratings between mandatory
and optional agencies result from more lenient standards applied by the optional agencies. How-
ever, there are strong arguments against optional agencies using higher rating scales. If additional
ratings are consistently in�ated, the market would not believe the rating and the yield on the bond
should not be affected. Issuers would no longer believe they could lower their funding costs by
obtaining a third rating. Furthermore, higher rating scales do not correspond with the empirical ob-
servation that average default rates associated with letter grades broadly agree between Moody's,
S&P, and Fitch, ie, the differences are in all cases smaller than one standard deviation (see Table
1). Finally, if optional agencies provide in�ated ratings and the market values these ratings, why
do we not observe a higher percentage of �rms requesting such a rating? These points suggest that
the optional agency is unlikely to apply lower standards to each and every issuer, but that some
issuers might be more able than others to pressure agencies into giving them higher ratings. For
example, an optional agency is presumably more susceptible to pressure from a double-rated issuer
than from an currently unrated issuer who needs at least one rating. The former can credible threat
to solicit the third rating if and only if it is higher than the mandatory ratings.7
7Furthermore, there are price and related non-price terms that might increase an unrated issuer's inclination to
8
By applying lower standards to particular issuers, agencies risk their reputation for indepen-
dence. Focusing on downgrades, not rating levels, Covitz and Harrison (2003) found that reputa-
tion incentives dominate the behavior of the mandatory agencies, ie, Moody's and S&P's do not in
general act in the interest of issuers and delay rating downgrades. Indeed, because of the two-rating
norm, Moody's and S&P might be more able than optional agencies to withstand the pressure is-
suers might exert to obtain higher ratings. The issuers' threats to go elsewhere simply are less
credible. That being said, there remains at least the potential for an Arthur Andersen-style con�ict,
insofar as rating agencies are increasingly offering ancillary services. For example, prior to being
issued a public rating, issuers can purchase an �indicative� or private rating, along with �advice�
regarding how the issuer might improve its rating. The provision of ancillary services might give
rating agencies an incentive to compromise their ratings just as it apparently gave accounting �rms
the incentive to compromise their audits. Issuers can exploit this incentive by threatening to give
the rating agencies less ancillary business unless they get the desired ratings.
In addition to laxity and adverse incentives, the organizational structure of the optional agen-
cies' rating process may support rating shopping behavior. For example, a �rm may be told its
likely rating assignment by the optional agency before it is required to commit fully to the new
agency's rating process. Or, the rating agency allows issuing �rms to stop the release of a rating
before it becomes public if the �rm is not satis�ed for some reason.8 As a result, if the requested
rating is favorable, the issuer publicizes it; if the requested rating is unfavorable, the rating is not
released. Thus requesting a third rating is similar to buying an option on a rating. Furthermore,
incentives for rating shopping, especially for issuers of collateralised debt obligations (CDOs),
may also come from differences in the rating basis applied by the major agencies. By exploiting
the well known fact that Moody's ratings are based on the concept of expected loss, while S&P
and Fitch base their ratings on probabilities of default, Peretyatkin and Perraudin (2002) show that
there exists signi�cant scope for rating shopping by CDO issuers.
It is important to note that the identi�cation of rating shopping behavior alone does not imply
that third ratings are biased. They may very well be accurate and valuable if they correct manda-
solicit a rating only from an optional agency. Anecdotal evidence exists (see Jewell and Livingston, 1999) that Fitch
is cheaper and easier to deal with during the rating process, than are Moody's and S&P.8Jewell and Livingston (1999) report that Fitch has applied such a policy. They suppose that the average observed
rating from Fitch is likely to be signi�cantly higher than the �true� average rating from this agency.
9

tory agency laxity. In the following section, we present an econometric model that is capable of
testing for issuer rating shopping and whether this behavior is motivated either by mandatory rating
agency's laxity or adverse incentives of optional agencies.
3 The econometric model
Our model contains three submodels: One model for predicting expected optional ratings for is-
suers having both mandatory ratings, one model for the decision to obtain an optional rating, and
one model to derive the optional rating's default probability distribution separately for issuers with
and without observed optional ratings.
To start, let the ordinal scaled variable Xit denote the optional rating class of issuer i at the
beginning of the one-year period t, ie, xit = c; c = 1; : : : ; C, for class c.9 To allow for the fact that
optional ratings become public only if the issuer requests and publishes such a rating, the binary
variable Rit takes the value 1 if Xit is observed and 0 otherwise. In addition, we let the binary
variable Yit denote the default indicator for issuer i and time interval t, ie,
yit =
8<: 1; if issuer i defaults within the time interval t,
0; otherwise(1)
We further introduce a random vector Zit = (Zit1; : : : ; Zits)p of s control variables that are al-
ways observed, for all issuers and time periods. For example, Zit could include the industry sector
of the issuer or rating information from the mandatory agencies. We �rst model the distribution
P (XitjZit; �) of the optional ratings, given some explanatory variables, using an ordered probit
model
Ait = �pZit + "it: (2)
More precisely, the probability of observing outcome Xit = c corresponds to the probability
that the unobserved continuous variable Ait, representing the optional agency's assessment of the9In the empirical part of this paper, ratings are transformed by assigning numerical values to letter grades [AAA
(Aaa)=1, AA (Aa)=2, and so on]. In addition, since the agencies have different letter ranges in the C category, we
truncated each agency's ratings from below B=6 to equal 7.
10

creditworthiness of issuer i, is within the range of the cut-points �c�1 and �c estimated for this
outcome:
P (Xit = cjZit = zit; �) = P (�c�1 < Ait � �c)
= ���c � �pzit
�� �
��c�1 � �pzit
�: (3)
The standard normal error term "it re�ects unobserved components of the third rating for issuer
i, ie, public and private information on i that is not included in Zit. As argued above, the index Ait
might be in�uenced not only by credit risk factors but also by variables that measure the exposure
of the optional agency to pressure from issuer i. According to the adverse incentives point of view,
issuers that can exert more pressure on the agency will likely obtain in�ated ratings.
Next, the model P (RitjYit; Xit; Zit; �) for the decision to obtain a third rating is considered.
Since we want to test for rating shopping behavior, ie, that the probability of obtaining a third
rating depends on the rating itself, or more precisely, on the difference between the third and the
mandatory ratings, Xit (or some function of Xit) has to be included as explanatory variable. We
assume that the distribution of Rit given (yit; xit; zit) is Bernoulli so that a binary logit model can
be applied:
P (Rit = 1jYit = yit; Xit = xit; Zit = zit; �) =exp
��pdit
�1 + exp
��pdit
� ; (4)
where dit is some function of�yit; xit; z
pit
�p: Finally, we have to estimate the discrete distri-
bution P (YitjXit = c); c = 1; : : : C: In general, there are two methods available for estimating
default probabilities of rating grades: The classical multinomial/cohort technique and several vari-
ants of the continuous-time/duration estimation method (see Lando and Skødeberg, 2002; Jafry
and Schuermann, 2004; Hanson and Schuermann, 2006). Since the duration approach assumes
- contrary to overwhelming evidence (see, eg, Altman and Kao, 1992) - that the rating transition
process follows a Markov chain, we apply the cohort method which also imposes fewer data re-
quirements.10 In simple terms, the cohort approach just takes observed issuer-weighted default
rates as default probability (DP) estimates for each grade c, ie,10The duration approach requires that agency ratings are continuously monitored, a assumption that is questionable
given the existence of watchlists and the staleness in ratings (Amato and Fur�ne, 2004). See Mählmann (2006) for an
estimation approach relaxing this assumption.
11
bPc = bP (Yit = 1jXit = c) =Xt2T
Xi2N(c;t)
YitNc: (5)
Here N(c; t) denotes the subset of issuers with rating c at the beginning of year t; Nct is the
number of obligors in N(c; t), and T = ft1; : : : ; t�g is a set of � successive one-year time periods.
ThusNc =P
t2T Nct gives the total number of issuers that start a year with rating c. However, the
cohort estimates can also be obtained by using a binary logit model of the form
P (Yit = 1jXit = c; �) =exp (�0 + �cX
cit)
1 + exp (�0 + �cXcit); c = 1; : : : ; C � 1; (6)
where �c denotes the coef�cient for the dummy Xcit corresponding to rating class c, ie, the
binary variable Xcit takes the value 1 if Xit = c and 0 otherwise. Now, b�c and bPc are related by
b�c = log264 bPc(1� bPc)bPC(1� bPC)
375 ; c = 1; : : : ; C � 1; (7)
and for the reference category C
b�0 = log24 bPC�1� bPC�
35 (8)
That is, the distribution P (YitjXit = c) can be estimated by using a binary logit model with
C � 1 rating class dummy variables and transforming the coef�cient vector b� = (b�0; b�1; : : : ;b�C�1) according to (7) and (8).Our overall model contains three sets of parameters: �; �; and �: To estimate these pa-
rameters, we apply a likelihood-based method that involves specifying the joint distribution of
(Rit; Yit; XitjZit) and partitioning this distribution as discussed above. The complete data density
of (Rit; Yit; XitjZit) for issuer i in t is then given by:
P (rit; yit; xitjzit; �; �; �) = P (ritjyit; xit; zit; �)P (yitjzit; xit; �)P (xitjzit; �); (9)
where P (Ritjyit; xit; zit; �) is the model of an issuer's decision to obtain a third rating, P (Yitjzit;
xit; �) is the default probability model and P (Xitjzit; �) is the distribution of the incompletely ob-
served rating variableXit; given the realization of the always observed covariates Zit = zit in t for
12
issuer i:11 To obtain maximum likelihood (ML) estimates for � = (� p; �p; �p)p; the complete data
log-likelihood function can be written as
l(�) =Xt2T
Xi2N(t)
lit(�; yit; xit; rit; zit) =Xt2T
Xi2N(t)
log [P (ritjyit; xit; zit; �)]
+ log [P (yitjzit; xit; �)] + log [P (xitjzit; �)] ; (10)
where lit(�; yit; xit; rit; zit) is the contribution to the complete data log-likelihood for issuer i
in t and N(t) is the set of all US issuers with Moody's and S&P ratings at the start of t. Since the
optional ratingXit is missing for a large number of issuers and years, we cannot simply maximize
(10). Instead, the conditional expectation of the complete data likelihood with respect to the con-
ditional distribution of the missing data, given the observed data, has to be maximized. Ibrahim,
Lipsitz and Chen (1999) show how this can be done using the expectation maximization (EM)
algorithm. This algorithm, introduced by Dempster, Laird and Rubin (1977), formalizes an ad hoc
idea for handling missing data: (1) replace missing values by estimated values, (2) estimate para-
meters, (3) re-estimate the missing values assuming that the new parameter estimates are correct,
(4) re-estimate parameters; and so forth, iterating until convergence. Having derived ML estimates
for the coef�cients we can go on to test for rating shopping and its driving forces.12
Rating shopping behavior is simply tested by including the variable DIFF= Xit�min(Moody's;
S&P), that measures the difference in letter units between the third and the best mandatory rating,
into model (4). Note that DIFF<0 if the optional rating signals lower default risk than both manda-
tory ratings. Thus a negative coef�cient for this variable implies that the more favorable the third
rating, the higher the probability that it is actually observed, ie, issuers shop for better ratings.
What kind of testable implications can be derived from the laxity and the adverse incentives
hypotheses? First, note that P (Yit = 1jXit = c) can be decomposed as follows:
P (Yit = 1jXit = c)
= P (Yit = 1jXit = c; Rit = 1) � w + P (Yit = 1jXit = c; Rit = 0) � (1� w): (11)11Note that equation (9) uses a general formulation of the model. However, we do not estimate default probability
distributions for varying values of Zit.12Standard errors can be computed either analytically, using the method of Louis (1982), or by applying the non-
parametric bootstrap technique.
13
Here P (Yit = 1jXit = c; Rit = 1) is the probability of observing obligor i defaulting within
the interval t given that i is rated c by the optional agency at the beginning of t. Similarly, w =
P (Rit = 1jXit = c) speci�es the probability that issuers with an expected third rating of category
c do decide to solicit it. Since P (Yit = 1jXit = c) and w are produced by maximizing (10),13 and
P (Yit = 1jXit = c; Rit = 1) can be consistently estimated by its sample analog using (5), we can
derive an estimate for P (Yit = 1jXit = c; Rit = 0), ie, the expected rating class default probability
distribution for issuers that do not obtain a third rating.
Now, the adverse incentives point of view that observed third ratings are on average in�ated
implies that the two distributions P (Yit = 1jXit = c; Rit = 0) and P (Yit = 1jXit = c; Rit = 1)
are signi�cantly different. More precisely, the default risks associated with the high quality letter
grades should be signi�cantly increased for the sample of observed ratings (ie, Rit = 1) compared
to the sample with missing third ratings (ie, Rit = 0). In contrast, the laxity argument indicates
that third ratings are accurate on average, irrespective of whether they are made public or not.
According to this view, differences between both distributions are random and should be related to
estimation error, ie, differences are not signi�cant.
4 Data and variables
Issuer ratings were obtained from the Financial Times Credit Ratings International (FT-CRI) data-
base, that presents agency ratings on a consistent basis since it reports only the ratings that agencies
have assigned to each �rm's most representative long-term security, typically its long-term senior
unsecured or senior subordinated debt. Our sample of US issuers rated jointly by Moody's and
S&P is drawn from FT-CRI's �rst issues in 1999, 2000, 2001, 2002, 2003, and 2004, that report
ratings valid as at January 1 of each year, respectively. Because of possible misreporting by the
rating agencies and typographical errors, we cross-checked FT-CRI's ratings against alternative
sources of information, including Bloomberg and ratings directly obtained from Moody's, S&P,
and Fitch.
Default data is taken from the annual default reports of Moody's and S&P. Possibly due to13To estimate P (Rit = 1jXit = c); we use a simpli�ed version of model (4), containing only C � 1 rating class
dummy variables. The speci�cations of the two other models (3) and (6) are left unchanged.
14

some slight differences in default de�nitions14, there are few cases with only one agency reporting
a default. Thus, to be consistent, merely Moody's reported defaults are considered. However,
the general results of this study are not affected by using S&P's defaults instead. Following the
convention in the literature (eg, Cantor and Packer, 1997), the different letter rating scales of the
three agencies are mapped to a single numeric scale, with better ratings corresponding to lower
numbers: Aaa=AAA=1, Aa=AA=2, ..., Caa/C=CCC/C=7. By comparing annual default rates of
letter grades across agencies, shown in Table 1, the applied mapping procedure seems to be the
most appropriate.
The overall data set contains information on 15,709 issuer ratings over the period 1999-2004,
including 379 defaults. Since a single �rm can contribute ratings for several years, the actual
number of �rms in the sample is smaller than 15,709. Table 2 presents descriptive statistics for
the data. The proportion of �rms rated by Fitch varies across different categories of �rms and
increases steadily over time, reaching its maximum in 2004. As can be seen, Fitch is more likely
to rate utilities and �nancial �rms than insurance or other industrial �rms. The strong raise in
the number of banks rated by Fitch (from 42% in 2000 to 77% in 2001) can be explained by the
acquisition of Duff & Phelps Credit Rating in April 2000 followed by the acquisition later that
year of the rating business of Thomson BankWatch. In addition, a �rm is more likely to get a third
rating if its mandatory ratings are investment grade and is less likely to solicit a Fitch rating if it
subsequently defaults within a one-year period. Table 2 also indicates that the average difference
between the ratings of Fitch and those of Moody's and S&P varies across �rm categories, with
Fitch giving on average the highest ratings most of the time. Interestingly, Fitch seems to rate
banks after 2000 more conservatively than Moody's, but less conservatively than S&P.
To analyze this point in more detail, Table 3 presents information on the distribution of rating
differences. The results for the bank subsample support the presumption that Fitch has tightened its
credit standards after 2000 compared to Moody's, but S&P still rates banks more conservatively.15
14For example, S&P, unlike Moody's, does not regard as a default when an interest payment, missed on the due
date, is made within the grace period. And Moody's does not disclose defaults by issuers with an unsolicited rating.15A comparison (not shown) between the two mandatory agencies indicates that, while Moody's rates higher 10.1%
(lower: 21.8%) of the time in the overall sample, the numbers are reversed for the bank subsample with Moody's
ratings being higher 28.0% (lower: 7.3%) of the time relative to S&P's ratings. In contrast, using data on new bonds
issued between 1983 and 1993, Morgan (2002) �nds that splits among mandatory raters tend to be lopsided irrespective
of the sector considered, ie, Moody's tends to be more conservative than S&P.
15

For instance, while none of 111 banks got a rating from Fitch lower than the corresponding rating
from Moody's in 2000, this proportion increased to 17.13% in 2001. Overall, Table 3 is consistent
with previous studies (Cantor and Packer, 1996, 1997; Jewell and Livingston, 1999; Feinberg,
Shelor and Jiang, 2004) revealing that Fitch gives systematically higher ratings on jointly rated
issues/issuers than Moody's and S&P.
Table 4 presents the average distribution, calculated over the six-year period 1999-2004, of
default events across rating classes separately for each agency. For example, of the 2,074 �rms
that started a year in Moody's grade Ba (class 5), 27 subsequently defaulted within 12 months,
yielding an average annual default rate of 1.3%. Whereas for Moody's and S&P the calculated
default rates lie within one standard deviation of the values reported by the agencies itself (see
Table 1), we can detect great discrepancies between our and the of�cial default rates for Fitch's
grades A, BBB, BB, and B (ie, classes 3-6). More precisely, our data suggests that the default
risks associated with these grades are higher for US �rms rated jointly by Moody's and S&P, than
for the universe of �rms rated by Fitch. This might indicate that Fitch does apply lower standards
to �rms having mandatory ratings than to the average �rm it rates. Alternatively, the differences
might be due to the small number of 47 observed defaults.
In order to more formally test the existence of adverse incentives on the side of Fitch, our
econometric model, including the three submodels, has to be speci�ed. Recall that we only have
to worry about models (3) and (4), because the speci�cation of the default model (6) is given
by C � 1 rating class dummy variables. First, we will discuss the variables chosen for the third
rating prediction model. Since it is well known that mandatory ratings and credit risk are highly
correlated (see, eg, West, 1973; Liu and Takor, 1984; Ederington, Yawitz and Roberts, 1987), the
average of the issuer's ratings from Moody's and S&P is included as the sole measure of default
risk. However, as argued above, third ratings may not only be driven by default risk, but also by
adverse incentives of the optional agency. So we consider additional variables that try to capture
this possible component of third ratings.
It could be argued that in�ated ratings are more dif�cult to identify in situations with greater
market uncertainty about the true default risk of an issuer. Thus, an issuer's ex ante uncertainty
and the optional agency's readiness to apply lower standards should be positively correlated. To
test this argument, the model contains a variable that measures the absolute difference, in rating
letters, between the two mandatory ratings of each issuer.
16
As outlined above, solicitation of a third rating might be motivated by the hope to pass impor-
tant regulatory cutoff ratings, such as the investment grade cutoff. Thus, an issuer with manda-
tory ratings marginally below investment grade may have an added incentive to press the optional
agency harder for a more favorable rating. To account for regulatory sources of increased issuer
pressure, two dummy variables are included. The �rst dummy takes on a value of 1 if the issuer's
ratings from Moody's and S&P are Ba1 and BB+, respectively. The second dummy equals 1 if
the mandatory ratings fall into different quality categories assigned by the National Association
of Insurance Commissioners (NAIC) Securities Valuation Of�ce to bonds held by an insurance
company. As argued by Cantor and Packer (1996, 1997), a third rating may be especially valuable
for issuers with mandatory ratings that touch two NAIC quality categories.
As a way to carve out a niche for itself and to secure its survival in the long term, the optional
agency might follow a strategy to compete more aggressively in speci�c industry sectors, countries,
or new markets. Hence, the agency might be more ready to lower its standards in these particular
market segments.16 To test for this kind of strategic behavior, we constructed indicator variables
that identify issuer sectors - industrial, �nance, insurance, or utilities. However, if misjudgements
by mandatory agencies, resulting from laxity, are not randomly distributed over industries and the
third agency has a reputation for expertise analyzing risk in particular industries, signi�cant sector
dummies do not indicate varying credit standards, but correct the average mandatory rating for
valuation errors. Finally, by including time dummies, we can analyze whether the optional agency
increased or decreased its standards over time.17
All of the variables discussed above are also used to model an issuer's decision to obtain a third
rating (see Cantor and Packer, 1997, who provide a rationale for including these variables). In addi-16There is some evidence supporting this argument. For example, in (at least) one part of the structured �nance
market, private label mortgage securities, Fitch was able for a time to become the second agency used, paired with
Moody's, when it entered the market requiring credit enhancement levels appreciably lower than those required by
S&P (see Cantor and Packer, 1995).17Studying credit ratings from S&P for the period 1978-1995, using an ordered probit regression, Blume, Lim and
MacKinlay (1998) �nd that annual intercepts have been drifting down, a result they interpret as consistent with rating
agencies tightening of credit standards. Amato and Fur�ne (2004) and Jorion, Shi and Zhang (2005) show that this
�nding is not robust to a more complete model speci�cation that controls for other effects on ratings, especially for
systematic changes in sample compositions and secular trends in risk measures. Note that this criticism most likely
does not apply to our model since the chosen measure of risk, the average mandatory rating, should not, by de�nition,
show a trend in its meaning.
17

tion, the basic speci�cation contains the variable DIFF to test for rating shopping and the indicator
variable Y to control for possibly different behavior of defaulted and non-defaulted issuers.
5 Results
5.1 Do issuers shop for a better rating?
Our �rst research question was to examine whether issuers that do expect a favorable third rating
are more likely to solicit this rating. Table 5 shows estimated coef�cient vectors for three different
speci�cations of the model for an issuer's decision to obtain a third rating from Fitch.18 In all
three models, the coef�cient for the variable DIFF is negative and statistically signi�cant at the
1% level, implying that the decision to obtain a third rating from Fitch depends on the rating
itself, ie, the more favorable the expected Fitch rating (the more negative DIFF), the higher the
chance that it is actually observed. Whereas defaulted issuers are more likely to have requested a
third rating, the negative coef�cients on all three average mandatory ratings variables signal that,
ceteris paribus, issuers, having obtained low-quality ratings fromMoody's and S&P, do deter from
being scrutinized again. A possible explanation, put forward by Cantor and Packer (1997), is that
investors in the below-investment-grade-market are suf�ciently sophisticated not to rely intensively
on ratings.
Consistent with �ndings in Cantor and Packer (1997) and Baker and Mansi (2002), the higher
the uncertainty about default risk, as proxied by the absolute rating difference, the more likely are
third ratings, intended to resolve this uncertainty. Of the regulatory variables, only the NAIC split
shows a signi�cant positive coef�cient, indicating that a third rating is particularly valuable for
issuers with Moody's and S&P ratings that straddle two NAIC quality grades. All three models
contain industry and time dummies, re�ecting the speci�c sample proportions. To analyze rating
shopping behavior further, speci�cation (b) includes four industry interaction terms. What we
can see is that, compared to the reference category banks, the rating shopping effect is somewhat18All estimates of standard errors in this paper rely on the non-parametric, ordinary bootstrap. Suppose the data
set has N (= 15; 709) observations. Then the bootstrap procedure draws, with replacement, N observations from
the original data set to create one bootstrap sample. Based on this sample, all models are reestimated. By doing this
repeatedly, sayB = 1; 000 times, each time drawing a new random sample and reestimating, the bootstrap distribution
of the estimates is obtained.
18
smaller within the utilities and insurance sector, ie, the same value of DIFF is associated with a
lower value for P (R = 1), ceteris paribus. In addition, the annual interactions in model (c) show
a slight, but signi�cant reduction of the rating shopping effect after 2000.
To test the sensitivity of our results to the de�nition of the rating shopping variable, DIFF is
replaced by dummy variables for the letter rating categories of Fitch. Since there are no observed
defaults for categories AAA and AA, these are lumped together with grade A in the new mapped
grade AAA-A, resulting in a reduction of the rating scale from seven to �ve grades. Whereas
DIFF employs a relative de�nition of rating shopping, dummy variables de�ne rating shopping
in absolute terms, ie, are low-risk third ratings more likely to be observed than high-risk ratings,
irrespective of the difference to the mandatory ratings. Speci�cation (d) in Table 6 shows the
results for the most simple model that includes only the four rating dummies RAT1-3 (for grades
AAA to A), RAT4 (for BBB), RAT5 (for BB), and RAT6 (for B), with CCC-C being the reference
category, ie, speci�cation (d) simply models P (Rit = 1jXit = c) without additional covariates. In
short, the coef�cients indicate that the better the rating, the higher the probability for the rating the
be solicited.
The richer speci�cation (e) includes time and industry dummies, and the �ve variables already
discussed in connection with the models in Table 5. It is noteworthy that the two variables average
mandatory rating and absolute rating difference changed their signs, indicating now that the lower
the ratings assigned by the mandatory agencies and the greater the agreement between them, the
higher the probability of a third rating. This change of implications is presumably due to the
fact that DIFF already controls for some of the information contained in the mandatory ratings.
For example, it seems likely that low mandatory ratings are associated with high probabilities of
soliciting third ratings, but also with more negative values of DIFF, ie, more favorable third ratings.
The positive direct effect of the average mandatory rating on P (R = 1) is then incorporated into
the negative coef�cient for DIFF.
Table 7 reports ordered probit estimates for the Fitch rating prediction model. As expected, the
average mandatory rating has a positive coef�cient, suggesting that third and mandatory ratings are
highly correlated. Of the variables intended to measure the degree of issuer pressure that might be
brought to bear on the third agency, only the marginally below investment grade dummy is statisti-
cally signi�cant. Its negative coef�cient is in alignment with our expectations, ie, issuers rated Ba1
and BB+ by Moody's and S&P, respectively, are more likely to obtain high-quality grades from
19

Fitch, probably because of regulatory motivated issuer pressure. The industry dummies show that,
for a given level of default risk inherent in the mandatory ratings, banks have a higher and indus-
trial �rms a lower chance of receiving favorable Fitch ratings, compared to utilities. The downward
trend in the annual intercept indicates that the rating distribution shifted towards the better grades
over the years, ie, the sample average rating is higher for the more recent years. This might imply
a systematic lowering of rating standards by Fitch in order to gain market share. However, it is
important to note that since the rating prediction model is estimated using all 15,709 issuers, and
not only the subsample of 3,268 issuers with observed Fitch ratings, this result is not driven by the
increase in the percentage of banks rated by Fitch after 2000 (see Table 2). Except for a rising, but
still small number of insurance �rms, Table 2 presents no evidence for systematic changes in the
industry composition of the overall sample.
5.2 What drives rating shopping: Laxity or lower standards?
According to the adverse incentives hypothesis, there are basically two groups of issuers: Issuers,
that expect to obtain in�ated third ratings and issuers expecting accurate third credit assessments
that do not signal a lower default risk than the mandatory ratings. Since only the �rst group will so-
licit a rating, the observed rating class default probability distribution should indicate the increased
default risk associated with high-quality ratings when compared to the distribution estimated for
the second group of issuers with accurate, but unobserved ratings. Recall from equation (11) that
the differences between Fitch's rating class default probabilities estimated for issuers with and
without an observed Fitch rating can be written as
P (Yit = 1jXit = c; Rit = 1)� P (Yit = 1jXit = c; Rit = 0)
=P (Yit = 1jXit = c; Rit = 1)� P (Yit = 1jXit = c)
1� P (Rit = 1jXit = c); (12)
illustrating that three separate distributions have to be calculated. The conditional distribution
P (Rit = 1jXit = c); that issuers with an expected third rating of category c do decide to publish
it, can be derived from model (d) in Table 6. The corresponding values are: 0.275 (c =AAA-A),
0.260 (c =BBB), 0.164 (c =BB), 0.043 (c =B), and 0.022 (c =CCC-C), ie, the probability of
soliciting the rating increases with the credit quality it signals.19 Furthermore, the observed default19For example, the solicitation probability for ratings of quality AAA-A is given by adding up the constant
20

probability distribution P (Yit = 1jXit = c; Rit = 1) can simply be estimated by using Fitch's
average default rates in Table 4. Finally, the unconditional distribution P (YitjXit = c) can be
derived by transforming the coef�cient vector b� = (b�0; b�1; : : : ; b�C�1) according to (7) and (8).Inserting the estimated values for the three distributions into the right hand side of equation (12)
gives the default probability differences for the �ve rating grades shown in Panel B of Table 8.
The positive values for the observed differences imply that the default risks associated with
each rating grade are higher for issuers requesting and publishing a rating than for issuers hav-
ing their rating unobserved. To test whether both distributions are statistically distinguishable, the
bootstrap distribution of the differences is calculated utilizing a non-parametric bootstrap experi-
ment with 1,000 replications. The resulting 99% con�dence intervals indicate that the differences
are signi�cant for the grades BBB, BB, and B, but not for the grades at both ends of the rating
scale. In sum, Table 8 strongly supports the adverse incentives point of view that rating shopping
is motivated by lower standards applied by Fitch to particular issuers. This is consistent with ev-
idence given in Baker and Mansi (2002) that both, issuers and investors, consider Moody's and
S&P ratings to be more accurate than Fitch's, indicating the lower reputational capital Fitch is
jeopardizing by exploiting con�icts of interest.
Since the estimates for � (and thus for P (YitjXit = c)) can vary depending on the models used
for P (RitjYit; Xit; Zit; �) and P (XitjZit; �) in maximizing the log-likelihood (10), we have to
carefully check the sensitivity of our results. However, the default probability differences obtained
by varying the speci�cations for the Fitch rating prediction model and the model of an issuer's
decision to solicit a Fitch rating are very similar to the numbers shown in Table 8. In any case, we
got signi�cantly higher default risks for grades BBB, BB, and B from the subsample of observed
ratings.20
6 Conclusion
The two major rating agencies, Moody's and S&P, have historically neither advocated nor en-
couraged the use of ratings in regulation. One of there main arguments is that by certifying the
and the coef�cent for RAT1-3, and applying the logit transformation, ie, P (Rit = 1jXit =AAA-A) = 1=(1 +
exp(�(�3:783 + 2:812))):20Detailed results are available from the author upon request.
21

risk assessments of all recognized rating agencies as being of similar quality, thus turning ratings
into a commodity, regulators will force smaller rating agencies without a strong market reputa-
tion to compete on the basis of price and level of the ratings assigned. Given the driving forces
behind rating shopping identi�ed in this paper, it is hard to characterize the mandatory agency's
pronouncements in this regard as completely self-serving.
At �rst sight, the results presented here seem to be in contrast with the existence of Fitch as
a major incumbent credit rating �rm, that has persisted and prospered for a long time. However,
the prudential regulation of �nancial institutions in the US has forced those institutions to make
use of ratings in their purchase and holding decisions with respect to bonds. Thus the entrenched
rating agencies have likely received an arti�cial lift in their business from this regulation. On the
other hand, the de facto ban on new NRSRO designations by the SEC has a strong supply-limiting
effect. In this sense, our analysis indicates that the current presence of Fitch as one of the three
major players in the US rating market is not an automatic assurance that Fitch continues to meet a
market test, but is rather the product of two intertwined forces: The strong regulatory restrictions
on supply that have tended to favor incumbents over entrants, and the substantial regulation-driven
demand for rating services from agencies holding an NRSRO designation.
22
7 ReferencesAltman, E.I., Kao, D.L., 1992. Rating drift of high yield bonds. J. Fix. Inc. March, 15-20.
Amato, J.D., Fur�ne, C.H., 2004. Are credit ratings procyclical? J. Banking Finance 28, 2641-2677.
Baker, H.K., Mansi, S.A., 2002: Assessing credit rating agencies by bond issuers and institutionalinvestors. J. Business Finance Accounting 29, 1367-1398.
Basel Committee on Banking Supervision, 2005. International convergence of capital measure-ment and capital standards: A revised framework. November 2005, Basel.
Billingsley, R.S., Lamy, R.E., Marr, M.W., Thompson, G.R., 1985. Split ratings and bond reof-fering yields. Finan. Manage. 14, 59-65.
Blume, M.E., Lim, F., MacKinlay, A.C., 1998. The declining credit quality of U.S. corporatedebt: Myth or reality? J. Finance 53, 1389-1413.
Cantor, R., 2001. Moody's investors service response to the consultative paper issued by theBasel Committee on Bank Supervision �A new capital adequacy framework�. J. BankingFinance 25, 171-185.
Cantor, R., Packer, F., 1995. The credit rating industry. J. Fix. Inc. December, 10-34.
Cantor, R., Packer, F., 1996. Multiple ratings and credit standards: Differences of opinion in thecredit rating industry. Fed. Reserve Bank New York Staff Rep. 12, 1-43.
Cantor, R., Packer, F., 1997. Differences of opinion and selection bias in the credit rating industry.J. Banking Finance 21, 1395-1417.
Covitz, D.M., Harrison, P., 2003. Testing con�icts of interest at bond ratings agencies with marketanticipation: Evidence that reputation incentives dominate. Working paper, Fed. ReserveBoard, Washington, DC.
Dempster, A.P., Laird, N.M., Rubin, D.B., 1977. Maximum likelihood from incomplete data viathe EM algorithm. J. Roy. Statistical Society B 39, 1-38.
Ederington, L.H., Yawitz, J.B., Roberts, B.E., 1987. The informational content of bond ratings.J. Finan. Res. 10, 211-226.
Feinberg, M., Shelor, R., Jiang, J., 2004. The effect of solicitation and independence on corporatebond ratings. J. Business Finance Accounting 31, 1327-1352.
FitchRatings, 2005. FitchRatings global corporate �nance 2004 transition and default study. May2005.
Goh, J.C., Ederington, L.H., 1993. Is a bond rating downgrade bad news, good news, or no newsfor stockholders? J. Finance 48, 2001-2008.
Griep, C., De Stefano, M., 2001. Standard & Poor's of�cial response to the Basel Committee'sproposal. J. Banking Finance 25, 149-169.
Hand, J., Holthausen, R., Leftwich, R., 1992. The effect of bond rating agency announcementson bond and stock prices. J. Finance 47, 733-752.
23

Hanson, S., Schuermann, T., 2006. Con�dence intervals for probabilities of default. J. BankingFinance. In press.
Hsueh, P.L., Kidwell, D.S., 1988. Bond ratings: Are two better than one? Finan. Manage. 17,46-53.
High Yield Report, 1995. Fitch gets aggressive with unsolicited ratings. 30 October 1995.
Ibrahim, J.G., Lipsitz, S.R., Chen, M.H., 1999. Missing covariates in generalized linear modelswhen the missing data mechanism is non-ignorable. J. Roy. Statistical Society B 61, 173�190.
Jafry, Y., Schuermann, T., 2004. Measurement, estimation and comparison of credit migrationmatrices. J. Banking Finance 28, 2603-2639.
Jewell, J., Livingston, M., 1998. Split ratings, bond yields, and underwriter spreads. J. Finan.Res. 21, 185-204.
Jewell, J., Livingston, M., 1999. A comparison of bond ratings from Moody's, S&P, and Fitch.Finan. Markets, Inst. Instruments 8, 1-45.
Jewell, J., Livingston, M., 2000. The impact of a third credit rating on the pricing of bonds. J.Fix. Inc. December, 69-85.
Jorion, P., Shi, C., Zhang, S., 2005. Tightening credit standards: Fact or �ction? Working paper,University of California at Irvine.
Kliger, D., Sarig, O., 2000. The information value of bond ratings. J. Finance 55, 2879-2902.
Lando, D., Skødeberg, T.M., 2002. Analyzing rating transitions and rating drift with continuousobservations. J. Banking Finance 26, 423-444.
Liu, P., Moore, W.T., 1987. The impact of split bond ratings on risk premia. Finan. Rev. 22,71-85.
Liu, P., Thakor, A.V., 1984. Interest yields, credit ratings, and economic characteristics of statebonds: An empirical analysis. J. Money, Credit, Banking 16, 344-351.
Louis, T.A., 1982. Finding the observed information matrix when using the EM algorithm. J.Roy. Statistical Society B 44, 226-233.
Mählmann, T., 2006. Estimation of rating class transition probabilities with incomplete data. J.Banking Finance. In press.
Moody's Investors Service, 2005. Default and recovery rates of corporate bond issuers, 1920-2004. January 2005.
Morgan, D.P., 2002. Rating banks: Risk and uncertainty in an opaque industry. Amer. Econ.Rev. 92, 874-888.
Peretyatkin, V.M., Perraudin, W., 2002. Expected loss and probability of default approaches torating collateralised debt obligations and the scope for �ratings shopping�. In: Ong, M.K.(Ed.), Credit Ratings - Methodologies, Rationale and Default Risk. Risk Books, London,pp. 495-506.
24
Perry, L.G., Liu, P., Evans, D.A., 1988. Modi�ed bond ratings: Further evidence of the effect ofsplit ratings on corporate bond yields. J. Business Finance Accounting 15, 231-241.
Reiter, S.A., Zeibert, D.A., 1991. Bond yields, ratings, and �nancial information: Evidence frompublic utility issues. Finan. Rev. 26, 45-73.
Standard & Poor's, 2006. Annual 2005 global corporate default study and rating transitions.January 2006.
West, R.R., 1973. Bond ratings, bond yields, and �nancial regulation: Some �ndings. J. LawEcon. 16, 159-168.
White, L.J., 2002. An analysis of the credit rating industry. In: Ong, M.K. (Ed.), Credit Ratings- Methodologies, Rationale and Default Risk. Risk Books, London, pp. 86-102.
Wiggins, J., 2001. A chance to step into the light. Fin. Times December 9, 2001.
25
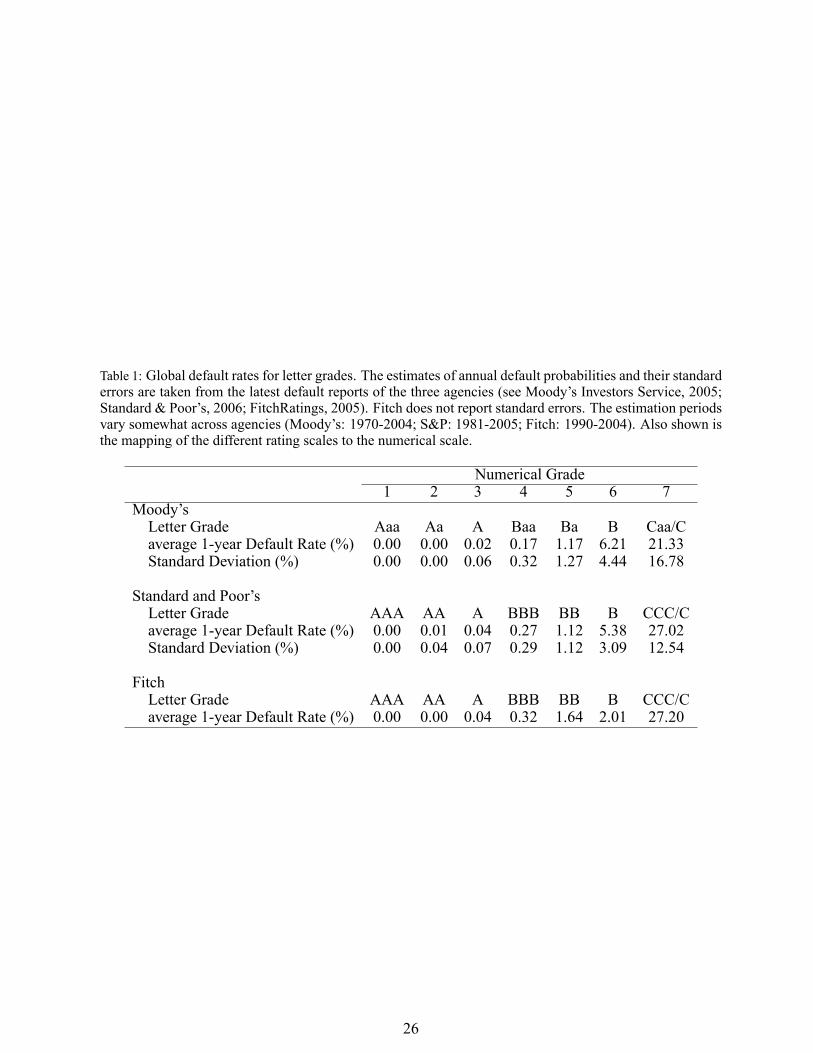
Table 1: Global default rates for letter grades. The estimates of annual default probabilities and their standarderrors are taken from the latest default reports of the three agencies (see Moody's Investors Service, 2005;Standard & Poor's, 2006; FitchRatings, 2005). Fitch does not report standard errors. The estimation periodsvary somewhat across agencies (Moody's: 1970-2004; S&P: 1981-2005; Fitch: 1990-2004). Also shown isthe mapping of the different rating scales to the numerical scale.
Numerical Grade1 2 3 4 5 6 7
Moody'sLetter Grade Aaa Aa A Baa Ba B Caa/Caverage 1-year Default Rate (%) 0.00 0.00 0.02 0.17 1.17 6.21 21.33Standard Deviation (%) 0.00 0.00 0.06 0.32 1.27 4.44 16.78
Standard and Poor'sLetter Grade AAA AA A BBB BB B CCC/Caverage 1-year Default Rate (%) 0.00 0.01 0.04 0.27 1.12 5.38 27.02Standard Deviation (%) 0.00 0.04 0.07 0.29 1.12 3.09 12.54
FitchLetter Grade AAA AA A BBB BB B CCC/Caverage 1-year Default Rate (%) 0.00 0.00 0.04 0.32 1.64 2.01 27.20
26

Table 2: Summary statistics for 15,709 �rms rated by Moody's and S&P. � corresponds to the averagedifference in rating letters calculated for jointly rated �rms only. For example, the difference between Aand AA corresponds to a one-unit rating differential. Positive numbers indicate that Fitch rates higher onaverage than Moody's or S&P. A �rm is de�ned as investment grade if both ratings from Moody's and S&Pare at least Baa3 (BBB-). A �rm is de�ned as split-rated if it is assigned different letter ratings by Moody'sand S&P.
Year All Firms Sector Investment Split DefaultedUtilities Banks Insurance Other Other Grade Rated Firms
Finance Industrial
1999No. of �rms 2,327 262 312 116 278 1,359 1,445 785 54% rated by Fitch 15.47 33.21 34.29 8.62 25.18 6.33 21.04 8.92 3.70�Moody's - Fitch 0.13 0.00 0.12 0.40 0.20 0.20 0.08 0.31 0.00� S&P - Fitch 0.14 -0.01 0.19 0.30 0.20 0.17 0.11 0.36 0.00
2000No. of �rms 2,462 246 263 248 280 1,425 1,534 774 66% rated by Fitch 14.70 34.15 42.21 3.63 24.29 6.32 19.56 10.98 4.55�Moody's - Fitch 0.20 0.10 0.20 0.56 0.26 0.23 0.15 0.56 0.00� S&P - Fitch 0.12 -0.07 0.20 0.44 0.21 0.12 0.12 0.22 -0.33
2001No. of �rms 2,600 260 235 303 306 1,496 1,619 807 99% rated by Fitch 18.65 33.85 77.02 3.96 30.72 7.35 24.52 18.22 14.14�Moody's - Fitch 0.11 0.09 -0.01 0.33 0.22 0.22 0.04 0.13 0.21� S&P - Fitch 0.12 -0.03 0.16 0.25 0.17 0.12 0.12 0.15 0.21
2002No. of �rms 2,718 280 236 359 293 1,550 1,712 878 78% rated by Fitch 18.54 31.07 75.42 3.62 33.11 8.32 24.71 16.74 20.51�Moody's - Fitch 0.09 0.05 -0.06 0.31 0.11 0.27 -0.02 0.11 0.81� S&P - Fitch 0.13 -0.01 0.16 0.31 0.13 0.15 0.11 0.25 0.56
2003No. of �rms 2,766 288 207 420 308 1,543 1,686 879 51% rated by Fitch 27.66 54.86 75.36 9.52 40.58 18.54 35.77 26.51 21.57�Moody's - Fitch 0.10 0.08 -0.07 0.13 0.09 0.20 0.03 0.12 0.27� S&P - Fitch 0.10 0.18 0.17 0.03 0.12 0.00 0.12 0.12 -0.09
2004No. of �rms 2,836 292 206 450 305 1,583 1,675 880 31% rated by Fitch 27.93 53.42 73.30 9.78 44.59 19.27 37.25 26.82 3.23�Moody's - Fitch 0.10 0.12 -0.11 0.09 0.05 0.20 0.02 0.13 0.00� S&P - Fitch 0.10 0.22 0.17 0.09 0.09 0.00 0.11 0.13 0.00
1999-2004No. of �rms 15,709 1,628 1,459 1,896 1,770 8,956 9.671 5,003 379% rated by Fitch 20.80 40.54 60.59 6.75 33.33 11.23 27.41 18.35 12.40�Moody's - Fitch 0.11 0.08 -0.01 0.20 0.14 0.21 0.04 0.18 0.40� S&P - Fitch 0.11 0.08 0.17 0.15 0.14 0.06 0.12 0.18 0.21
27
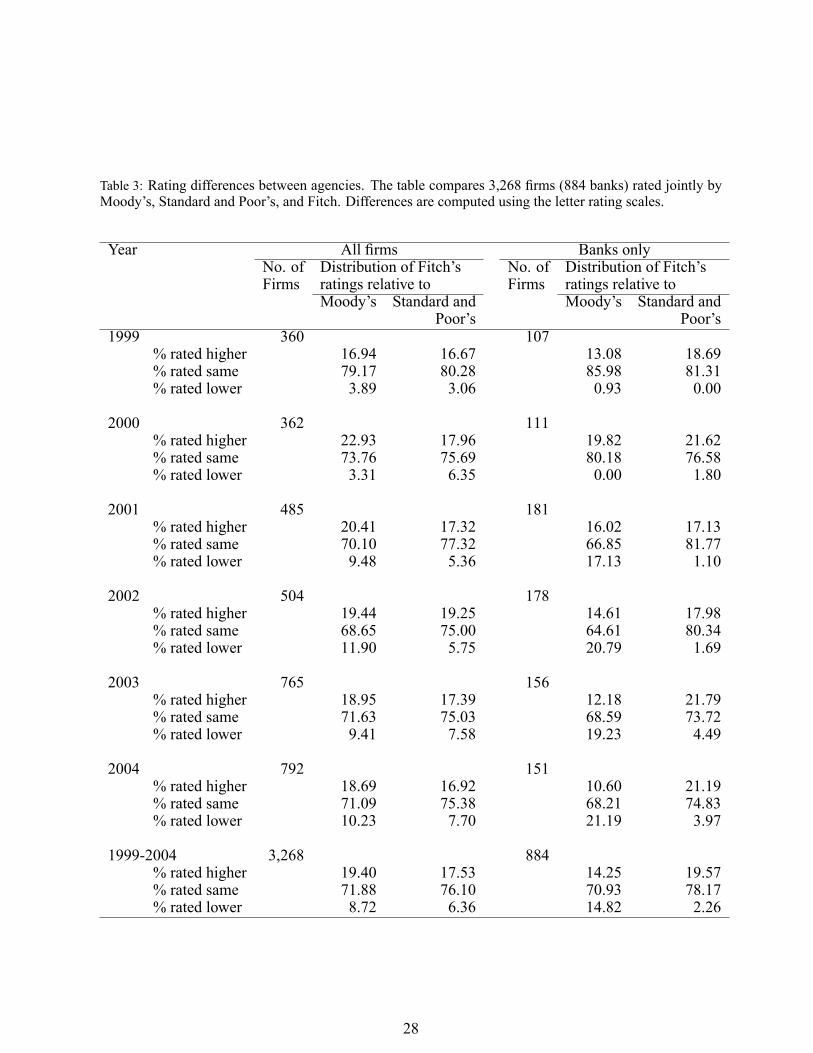
Table 3: Rating differences between agencies. The table compares 3,268 �rms (884 banks) rated jointly byMoody's, Standard and Poor's, and Fitch. Differences are computed using the letter rating scales.
Year All �rms Banks onlyNo. of Distribution of Fitch's No. of Distribution of Fitch'sFirms ratings relative to Firms ratings relative to
Moody's Standard and Moody's Standard andPoor's Poor's
1999 360 107% rated higher 16.94 16.67 13.08 18.69% rated same 79.17 80.28 85.98 81.31% rated lower 3.89 3.06 0.93 0.00
2000 362 111% rated higher 22.93 17.96 19.82 21.62% rated same 73.76 75.69 80.18 76.58% rated lower 3.31 6.35 0.00 1.80
2001 485 181% rated higher 20.41 17.32 16.02 17.13% rated same 70.10 77.32 66.85 81.77% rated lower 9.48 5.36 17.13 1.10
2002 504 178% rated higher 19.44 19.25 14.61 17.98% rated same 68.65 75.00 64.61 80.34% rated lower 11.90 5.75 20.79 1.69
2003 765 156% rated higher 18.95 17.39 12.18 21.79% rated same 71.63 75.03 68.59 73.72% rated lower 9.41 7.58 19.23 4.49
2004 792 151% rated higher 18.69 16.92 10.60 21.19% rated same 71.09 75.38 68.21 74.83% rated lower 10.23 7.70 21.19 3.97
1999-2004 3,268 884% rated higher 19.40 17.53 14.25 19.57% rated same 71.88 76.10 70.93 78.17% rated lower 8.72 6.36 14.82 2.26
28

Table4:Averageriskdistribution(1999-2004).Themappingoftheratingagency'sletterscalestothenumericalscaleisasshowninTable1.Information
concerningissuerdefaultsisobtainedfromtheannualdefaultreportsofMoody's.
Risk
Moody's
StandardandPoor's
Fitch
Class
Defaults
Non-defaults
Total
Defaults
Non-defaults
Total
Defaults
Non-defaults
Total
No.
%No.
%No.
%No.
%No.
%No.
%No.
%No.
%No.
%1
00.00
276
100.00
276
100
00.00
386
100.00
386
100
00.00
45100.00
45100
20
0.00
2,073
100.00
2,073
100
00.00
1,772
100.00
1,772
100
00.00
559
100.00
559
100
33
0.08
3,868
99.92
3,871
100
30.07
4,175
99.93
4,178
100
30.24
1,254
99.76
1,257
100
414
0.39
3,582
99.61
3,596
100
180.46
3,911
99.54
3,929
100
90.94
951
99.06
960
100
527
1.30
2,047
98.70
2,074
100
381.54
2,424
98.46
2,462
100
165.73
263
94.27
279
100
6127
4.61
2,628
95.39
2,755
100
200
7.91
2,329
92.09
2,529
100
107.75
119
92.25
129
100
7208
19.55
856
80.45
1,064
100
120
26.49
333
73.51
453
100
923.08
3076.92
39100
Total379
2.41
15,330
97.59
15,709
100
379
2.41
15,330
97.59
15,709
100
471.44
3,221
98.56
3,268
100
29
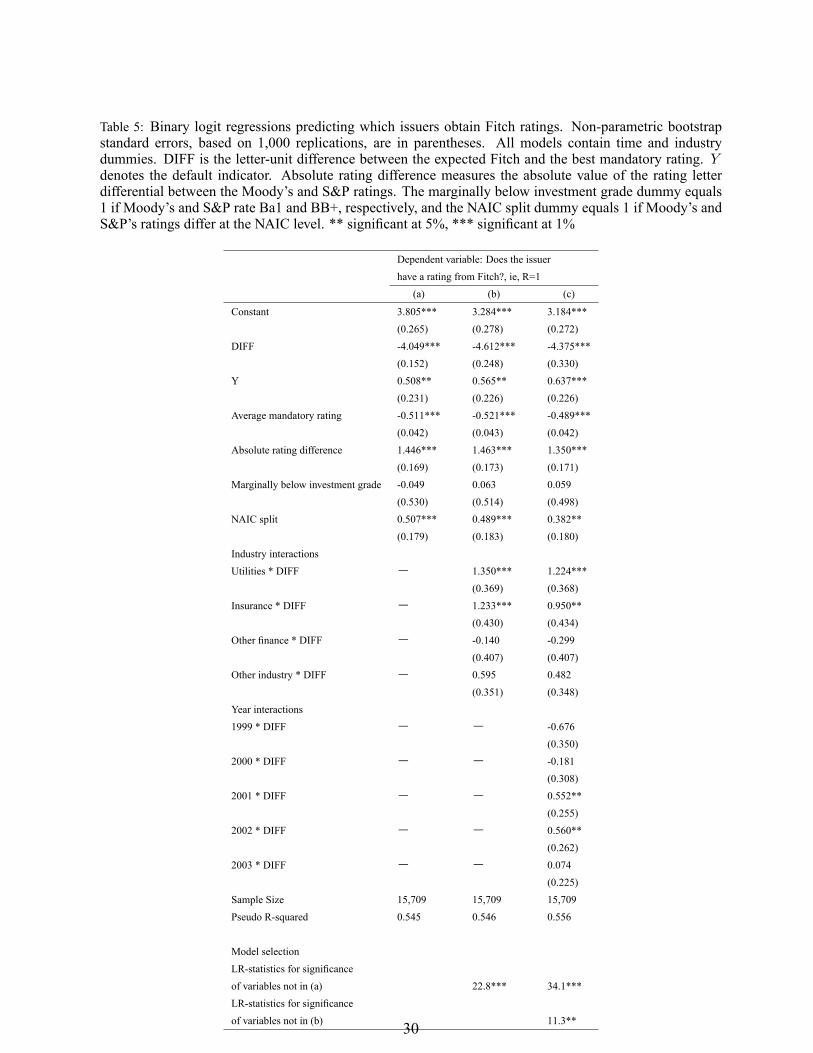
Table 5: Binary logit regressions predicting which issuers obtain Fitch ratings. Non-parametric bootstrapstandard errors, based on 1,000 replications, are in parentheses. All models contain time and industrydummies. DIFF is the letter-unit difference between the expected Fitch and the best mandatory rating. Ydenotes the default indicator. Absolute rating difference measures the absolute value of the rating letterdifferential between the Moody's and S&P ratings. The marginally below investment grade dummy equals1 if Moody's and S&P rate Ba1 and BB+, respectively, and the NAIC split dummy equals 1 if Moody's andS&P's ratings differ at the NAIC level. ** signi�cant at 5%, *** signi�cant at 1%
Dependent variable: Does the issuerhave a rating from Fitch?, ie, R=1(a) (b) (c)
Constant 3.805*** 3.284*** 3.184***(0.265) (0.278) (0.272)
DIFF -4.049*** -4.612*** -4.375***(0.152) (0.248) (0.330)
Y 0.508** 0.565** 0.637***(0.231) (0.226) (0.226)
Average mandatory rating -0.511*** -0.521*** -0.489***(0.042) (0.043) (0.042)
Absolute rating difference 1.446*** 1.463*** 1.350***(0.169) (0.173) (0.171)
Marginally below investment grade -0.049 0.063 0.059(0.530) (0.514) (0.498)
NAIC split 0.507*** 0.489*** 0.382**(0.179) (0.183) (0.180)
Industry interactionsUtilities * DIFF � 1.350*** 1.224***
(0.369) (0.368)Insurance * DIFF � 1.233*** 0.950**
(0.430) (0.434)Other �nance * DIFF � -0.140 -0.299
(0.407) (0.407)Other industry * DIFF � 0.595 0.482
(0.351) (0.348)Year interactions1999 * DIFF � � -0.676
(0.350)2000 * DIFF � � -0.181
(0.308)2001 * DIFF � � 0.552**
(0.255)2002 * DIFF � � 0.560**
(0.262)2003 * DIFF � � 0.074
(0.225)Sample Size 15,709 15,709 15,709Pseudo R-squared 0.545 0.546 0.556
Model selectionLR-statistics for signi�canceof variables not in (a) 22.8*** 34.1***LR-statistics for signi�canceof variables not in (b) 11.3**30

Table 6: Alternative speci�cation of the third rating decision model. RAT1-3, RAT4, RAT5, and RAT6are dummies for Fitch's expected ratings, ie, RAT1-3 corresponds to the numerical grades 1 to 3 (AAA toA), RAT4 to grade 4 (BBB), etc. The other variables are as de�ned in Table 5. The reference categoryfor the industry dummies is the utilities sector. Non-parametric bootstrap standard errors, based on 1,000replications, are in parentheses.
Dependent variable: Does the �rmhave a rating from Fitch?, ie, R=1
(d) (e)
Constant -3.783*** -6.485***(0.322) (0.608)
RAT1-3 2.812*** 5.314***(0.326) (0.450)
RAT4 2.735*** 4.606***(0.330) (0.430)
RAT5 2.154*** 4.031***(0.345) (0.427)
RAT6 0.676 2.451***(0.369) (0.442)
Y � 1.857***(0.226)
Average mandatory rating � 0.608***(0.055)
Absolute rating difference � -0.444***(0.124)
Marginally below investment grade � 0.041(0.323)
NAIC split � 0.179(0.143)
Industry dummiesBanks � 1.073***
(0.219)Insurance � -2.503***
(0.256)Other �nance � -0.259
(0.175)Other industry � -1.462***
(0.164)Year dummies1999 � -1.421***
(0.130)2000 � -1.331***
(0.126)2001 � -0.878***
(0.118)2002 � -0.855***
(0.117)2003 � -0.072
(0.100)Sample Size 15,709 15,709Pseudo R-squared 0.111 0.255
31

Table 7: Ordered probit regression for the expected Fitch rating. For de�nitions of the independent variablessee Table 5. Non-parametric bootstrap standard errors, based on 1,000 replications, are in parentheses.
Dependent variable: Expected ratingfrom Fitch, ie, X 2 f1; 2; 3; 4; 5; 6; 7g
Average mandatory rating 1.510***(0.013)
Absolute rating difference 0.004(0.059)
Marginally below investment grade -0.473***(0.143)
NAIC split -0.042(0.070)
Industry dummiesBanks -0.411***
(0.069)Insurance 0.262
(0.135)Other �nance 0.047
(0.065)Other industry 0.548***
(0.063)Year dummies1999 0.507***
(0.049)2000 0.335***
(0.047)2001 0.087**
(0.044)2002 0.093**
(0.045)2003 -0.018
(0.045)Sample Size 15,709Pseudo R-squared 0.324
32

Table8:BootstrappeddifferencesbetweenFitch'sratingclassdefaultrisksestimatedfrom
�rmswith(ie,R
=1)andwithout(ie,R
=0)anobserved
Fitchrating.Thenumberofnon-parametricbootstrapreplicationsis1,000.ThelettergradesAAA,AA,A
arelumpedtogetherinthemappedclass
AAA-A.P(Y=1jX=c;R=1)iscalculatedusingequation(5),P(R=1jX=c)canbeobtainedfrommodel(d)ofTable6,andP(Y=1jX=c)
resultsfrommaximizing(10),usingthebestspeci�cationforthethirdratingdecisionmodel(ie,model(c)inTable5)andtheratingpredictionmodelin
Table7.InsertingtheseestimatesforP(Y
=1jX=c;R=1);P(R=1jX=c);andP(Y
=1jX=c)inequation(11),givestheshownvaluesfor
P(Y=1jX=c;R=0):Bootstrapstandarderrorsareinparentheses.
Fitch'sletterratings
AAA-A
BBB
BB
BCCC-C
PanelA:Pointestimatesofdefaultprobabilities(%)
1)P(Y=1jX=c;R=1)
0.1612
0.9375
5.7348
7.7519
23.0769
(0.0894)
(0.2987)
(1.4566)
(2.3995)
(6.8913)
2)P(Y=1jX=c;R=0)
0.0323
0.0200
0.1602
0.4370
9.5149
(0.0182)
(0.0204)
(0.1257)
(0.1538)
(0.7678)
PanelB:Bootstrappeddifferencesbetween1)and2)
Observeddifference
0.1289
0.9175
5.5746
7.3149
13.5620
(0.0715)
(0.2973)
(1.4720)
(2.2695)
(6.9742)
95%Con�denceinterval
>-0.0001;0.2756
0.2439;1.8132
2.4608;10.0467
1.9360;14.8257
-3.7191;29.8553
99%Con�denceinterval
>-0.0001;0.3269
0.4124;1.5548
3.1039;8.9803
3.1837;12.0817
-1.0287;25.9828
33
Top Related