


Languages
Pages
Legal


Women of Color in STEM Education and Employment
Joan Burrelli
CEOSE Mini-symposium on Women of Color in STEMOctober 27, 2009
National Science FoundationDivision of Science Resources Statistics
www.nsf.gov/statistics
Division of Science Resources Statistics
National Science Foundation

National Science FoundationDivision of Science Resources Statistics
Who do we mean by women of color?
• Asian, Black, Hispanic, and American Indian/Alaska Native women are all women of color.
• Asian women are not underrepresented in STEM.
• Black, Hispanic, and American Indian/Alaska Native women are underrepresented in STEM.
2

National Science FoundationDivision of Science Resources Statistics
What do we mean by underrepresentation?
• Generally, underrepresented minorities are those groups whose representation in STEM is less than their representation in the population as a whole.
• Blacks, Hispanics, and American Indians/Alaska Natives are underrepresented in STEM because they are a smaller percentage of STEM graduates and of STEM occupations than they are of the U.S. population.
3
National Science FoundationDivision of Science Resources Statistics
What do we mean by underrepresentation? – cont.
• Asians, as a group, are not underrepresented in STEM because they are a larger percentage of STEM graduates and of STEM occupations than they are of the U.S. population.
• Subgroups of Hispanics and Asians may vary in STEM representation.
4

National Science FoundationDivision of Science Resources Statistics
Resident population of the United States, by race/ethnicity and sex: 2007
White women35%
Black men6%
Black women6%
Hispanic men8%
White men32% Other women
1%
Other men1%
Hispanic women7%
Asian women2%
Asian men2%
Note: Other includes American Indians/Alaska Natives, Native Hawaiians/other Pacific Islanders and multiple race/ethnicity.Source: Bureau of the Census, Current Population Survey, July 2007.
5
National Science FoundationDivision of Science Resources Statistics
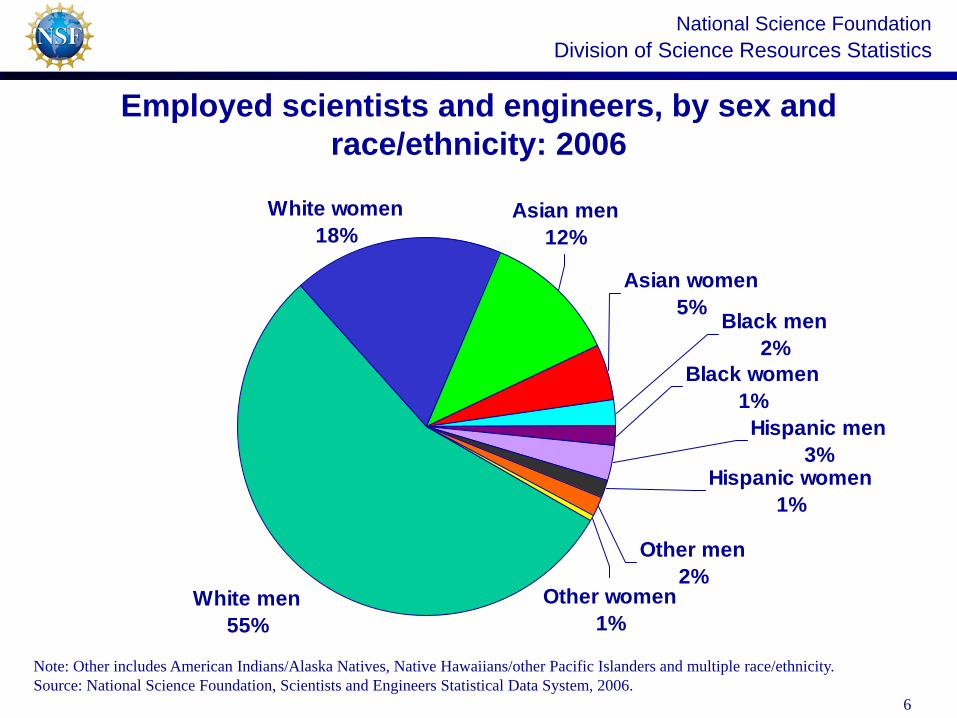
Employed scientists and engineers, by sex and race/ethnicity: 2006
White men55%
White women18%
Asian men12%
Black women1%
Hispanic men3%
Black men2%
Asian women5%
Hispanic women1%
Other men2%
Other women1%
Note: Other includes American Indians/Alaska Natives, Native Hawaiians/other Pacific Islanders and multiple race/ethnicity.Source: National Science Foundation, Scientists and Engineers Statistical Data System, 2006.
6

National Science FoundationDivision of Science Resources Statistics
Doctoral science and engineering faculty, by sex and race/ethnicity: 2006
White men 59%
Other women0%
Other men1%
Hispanic women 1%
Asian women 3%
Black men 2%
Hispanic men 2%
Black women 1%
Asian men 9%
White women 22%
Note: Other includes American Indians/Alaska Natives, Native Hawaiians/other Pacific Islanders and multiple race/ethnicity.Source: National Science Foundation, Survey of Doctorate Recipients, 2006. 7

National Science FoundationDivision of Science Resources Statistics
Why are women of color in a double bind?
• Like underrepresented minority men, underrepresented minority women are less likely than White or Asian men and women to graduate from high school, go to college, or earn bachelor’s degrees.
• Like White women, underrepresented minority women are less likely than men to earn degrees in or be employed in STEM fields.
8
National Science FoundationDivision of Science Resources Statistics
What are the differences in educational attainment?
• Blacks and Hispanics are less likely than Whites to graduate from high school, to enroll in college, and to graduate from college.
• Within each racial/ethnic group, women have higher levels of educational attainment than men.
• Black and Hispanic women have higher levels of educational attainment than Black and Hispanic men but lower levels of educational attainment than White or Asian men or women.
9

National Science FoundationDivision of Science Resources Statistics
What are the differences in education attainment – cont.
• For Hispanics, country of birth makes a difference. Close to half of the Hispanic population ages 25-29 were born outside the U.S. Those born outside the U.S. have much lower educational attainment than those born in the U.S. Those born in the U.S. have levels of educational attainment similar to Blacks.
• Almost 70% of Asians 25-29 were born outside the U.S. Both those born outside the U.S. and those born inside the U.S. have higher educational attainment than all other racial/ethnic groups.
10
National Science FoundationDivision of Science Resources Statistics
What are the differences in STEM education?
• Underrepresented minority women earn higher percentages of bachelor’s degrees in all fields, in STEM, and in non-STEM fields than underrepresented minority men.
• Asian and White women earn higher percentages of bachelor’s degrees in all fields and in non-STEM fields but lower percentages of bachelor’s in STEM fields than Asian and White men.
11

National Science FoundationDivision of Science Resources Statistics
Racial/ethnic and gender shares of bachelor’s degrees, by field: 2007
0
10
20
30
40
50
60
URMwomen
URM men Asianwomen
Asianmen
Whitewomen
Whitemen
Percent
All fields
STEM
Non-STEM
12
URM = underrepresented minority. Notes: Underrepresented minority includes Blacks, Hispanics, and American Indians/Alaska Natives. Asian includes Pacific Islander. Racial/ethnic groups refer to U.S. citizens and permanent residents only.Source: National Center for Education Statistics, IPEDS Completions Survey, 2007.
National Science FoundationDivision of Science Resources Statistics
What are the differences in STEM education? –cont.
• Underrepresented minority women and men earn a lower percentage of STEM doctorates than they do of STEM bachelor’s recipients.
13

National Science FoundationDivision of Science Resources Statistics
Racial/ethnic and gender shares of doctoral degrees to U.S. citizens and permanent residents, by field: 2007
0
10
20
30
40
50
60
URMwomen
URM men Asianwomen
Asianmen
Whitewomen
Whitemen
Percent
All fields
STEM
Education
Health
Other non-STEM
URM = underrepresented minority. Notes: Underrepresented minority includes Blacks, Hispanics, and American Indians/Alaska Natives. Asian includes Pacific Islander. Racial/ethnic groups refer to U.S. citizens and permanent residents only.Source: National Center for Education Statistics, IPEDS Completions Survey, 2007. 14
National Science FoundationDivision of Science Resources Statistics
What are the differences in STEM fields?
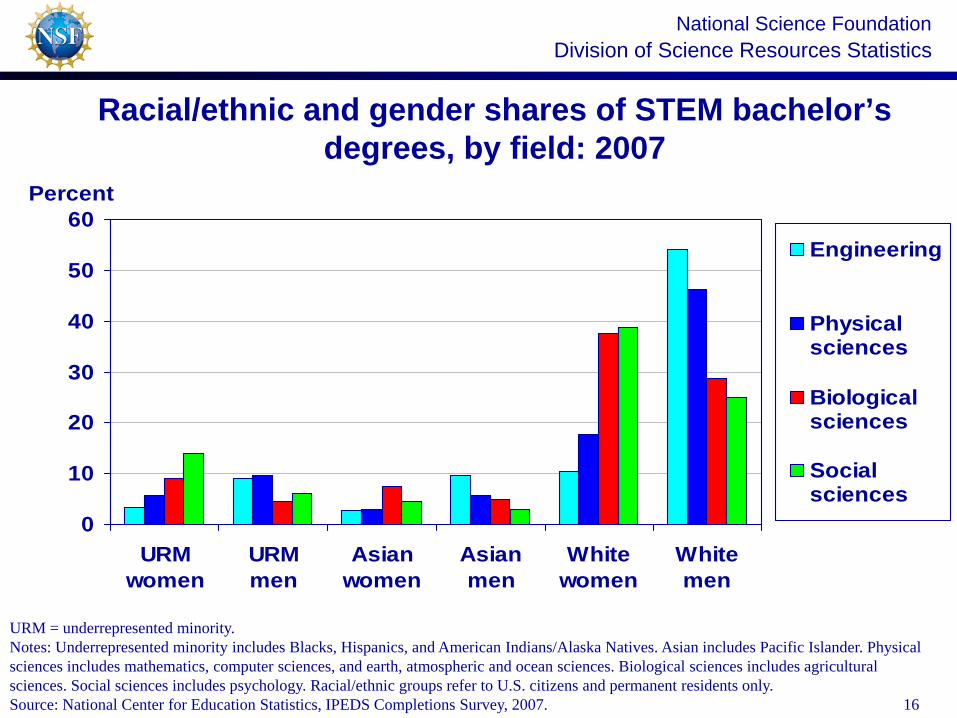
• Within all racial/ethnic groups, men earn a higher percentage of engineering and physical sciences bachelor’s and doctoral degrees than women.
• Within all racial/ethnic groups, women earn a higher percentage of biological and social sciences bachelor’s than men and a higher percentage of social sciences doctoral degrees than men.
15
National Science FoundationDivision of Science Resources Statistics
Racial/ethnic and gender shares of STEM bachelor’s degrees, by field: 2007
0
10
20
30
40
50
60
URMwomen
URMmen
Asianwomen
Asianmen
Whitewomen
Whitemen
Percent
Engineering
Physicalsciences
Biologicalsciences
Socialsciences
16
URM = underrepresented minority. Notes: Underrepresented minority includes Blacks, Hispanics, and American Indians/Alaska Natives. Asian includes Pacific Islander. Physical sciences includes mathematics, computer sciences, and earth, atmospheric and ocean sciences. Biological sciences includes agricultural sciences. Social sciences includes psychology. Racial/ethnic groups refer to U.S. citizens and permanent residents only.Source: National Center for Education Statistics, IPEDS Completions Survey, 2007.

National Science FoundationDivision of Science Resources Statistics
Racial/ethnic and gender shares of STEM doctoral degrees to U.S. citizens and permanent residents, by field: 2007
0
10
20
30
40
50
60
URMwomen
URM men Asianwomen
Asian men Whitewomen
White men
Percent
Engineering
Physicalsciences
Biologicalsciences
Socialsciences
URM = underrepresented minority. Notes: Underrepresented minority includes Blacks, Hispanics, and American Indians/Alaska Natives. Physical sciences includes mathematics, computer sciences, and earth, atmospheric and ocean sciences. Biological sciences includes agricultural sciences. Social sciences includes psychology. Source: National Center for Education Statistics, IPEDS Completions Survey, 2007. 17

National Science FoundationDivision of Science Resources Statistics
What are the trends in STEM degree awards?
• The number of STEM bachelor’s degrees awarded to men and women of almost all racial/ethnic groups has increased since 1977.
• The number of STEM bachelor’s degrees awarded to American Indian/Alaska Native men has remained fairly stable over time.
• Within each racial/ethnic group except White, women earned more STEM bachelor’s degrees than men in 2007.
18

National Science FoundationDivision of Science Resources Statistics
Bachelor’s degrees awarded in STEM fields to U.S. citizens and permanent residents, by sex: 1977–2007
0
50000
100000
150000
200000
250000
1977 1982 1987 1992 1997 2002 2007
NumberWhite male
White female
Black women
Asian men
Asian women
HispanicwomenHispanic men
Black men
AmericanIndian menAmericanIndian women
19
Note: Asian includes Pacific Islander. American Indian includes Alaska Native. Data not available for 1978, 1980, 1982-84, 1986, 1989, and 1999.Source: National Center for Education Statistics, IPEDS Completions Survey, 1977-2007.

National Science FoundationDivision of Science Resources Statistics
Bachelor’s degrees awarded in STEM fields to minority U.S. citizens and permanent residents, by sex: 1977–2007
0
5000
10000
15000
20000
25000
30000
1977 1982 1987 1992 1997 2002 2007
Number
Black women
Asian men
Asian women
HispanicwomenHispanic men
Black men
AmericanIndian menAmericanIndian women
20
Note: Asian includes Pacific Islander. American Indian includes Alaska Native. Data not available for 1978, 1980, 1982-84, 1986, 1989, and 1999.Source: National Center for Education Statistics, IPEDS Completions Survey, 1977-2007.
National Science FoundationDivision of Science Resources Statistics
Doctoral degrees awarded in STEM fields to U.S. citizens and permanent residents, by sex: 1977–2007
0
2000
4000
6000
8000
10000
12000
1977 1982 1987 1992 1997 2002 2007
NumberWhite male
White female
Asian men
Asian women
Hispanic men
Hispanic women
Black men
Black women
American IndianwomenAmerican Indianmen
21
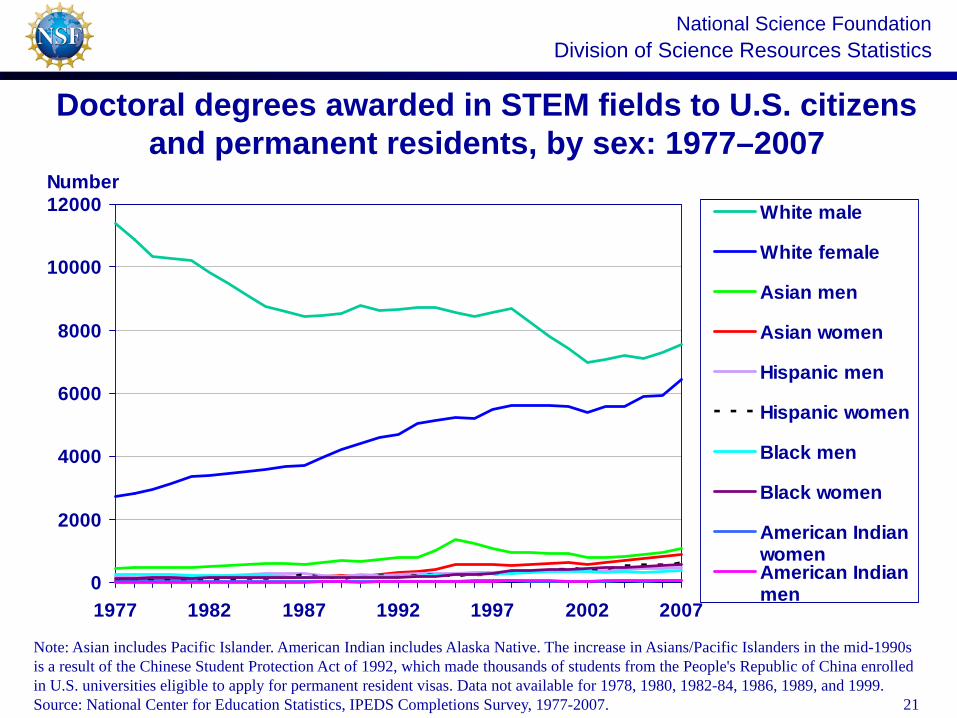
Note: Asian includes Pacific Islander. American Indian includes Alaska Native. The increase in Asians/Pacific Islanders in the mid-1990s is a result of the Chinese Student Protection Act of 1992, which made thousands of students from the People's Republic of China enrolled in U.S. universities eligible to apply for permanent resident visas. Data not available for 1978, 1980, 1982-84, 1986, 1989, and 1999.Source: National Center for Education Statistics, IPEDS Completions Survey, 1977-2007.

National Science FoundationDivision of Science Resources Statistics
Doctoral degrees awarded in STEM fields to minority U.S. citizens and permanent residents, by sex: 1977–2007
0
200
400
600
800
1000
1200
1400
1600
1977 1982 1987 1992 1997 2002 2007
Number
Asian men
Asian women
Hispanic men
Hispanic women
Black men
Black women
American IndianwomenAmerican Indianmen
22
Note: Asian includes Pacific Islander. American Indian includes Alaska Native. The increase in Asians/Pacific Islanders in the mid-1990s is a result of the Chinese Student Protection Act of 1992, which made thousands of students from the People's Republic of China enrolled in U.S. universities eligible to apply for permanent resident visas. Data not available for 1978, 1980, 1982-84, 1986, 1989, and 1999.Source: National Center for Education Statistics, IPEDS Completions Survey, 1977-2007.

National Science FoundationDivision of Science Resources Statistics
Physics and biological sciences doctorates earned by women, by race/ethnicity: 1995–2007
23
Notes: Underrepresented minority includes Blacks, Hispanics, and American Indians/Alaska Natives. Asian includes Pacific Islander. Data not available for 1999. Racial/ethnic groups refer to U.S. citizens and permanent residents only.Source: National Center for Education Statistics, IPEDS Completions Survey, 2003-07.
Physics URM women
Physics Asian women
Biological sciences URM
women
Biological sciences Asian
women1995 4 26 73 1721996 3 21 89 1901997 2 22 117 2011998 6 19 128 1702000 4 10 137 2002001 8 12 138 1902002 9 6 144 1842003 9 15 160 2162004 6 7 197 2412005 6 14 222 2582006 8 15 218 2412007 9 14 234 299

National Science FoundationDivision of Science Resources Statistics
Where do women and men of color go to school?
• Like underrepresented men, a lower percentage of underrepresented women than of White men and women enroll in public or private 4 year colleges, and a higher percentage attend 2 year colleges and 2- or 4-year for profit institutions.
• A lower percentage of Asian men and women than of White men and women attend private 4 year colleges, and a higher percentage attend 2 year colleges.
24

National Science FoundationDivision of Science Resources Statistics
Undergraduate enrollment, by sex, race/ethnicity, and level and control of academic institution: Fall 2007
05
101520253035404550
URMwomen
URM men Asianwomen
Asianmen
Whitewomen
Whitemen
Percent
Public 4yearPrivate 4year2 year
For profit
25
URM = underrepresented minority. Notes: Underrepresented minority includes Blacks, Hispanics, and American Indians/Alaska Natives. Asian includes Pacific Islander.Source: National Center for Education Statistics, IPEDS Fall Enrollment Survey 2007.

National Science FoundationDivision of Science Resources Statistics
Top bachelor’s granting schools
• The top bachelor’s granting schools differ for each racial/ethnic group.
• Within each racial/ethnic group, the top schools for men and women are mostly the same schools.
• For Hispanic men and women, the top bachelor’s granting schools are largely in Puerto Rico, California, Texas, and Florida—states with large populations of Hispanics.
26

National Science FoundationDivision of Science Resources Statistics
Top bachelor’s granting schools – cont.
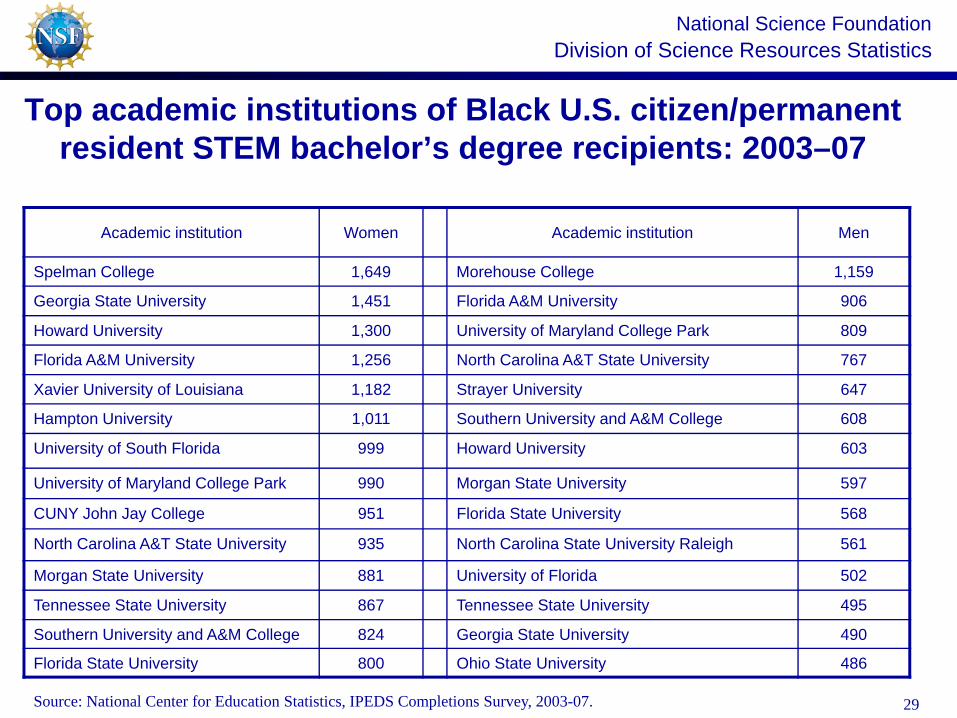
• For Black men and women, the top bachelor’s granting schools are largely Historically Black Colleges and Universities.
• For American Indians/Alaska natives, the top bachelor’s granting schools are largely in Oklahoma, Arizona and other states with large American Indian/Alaska Native population. One is a tribal college.
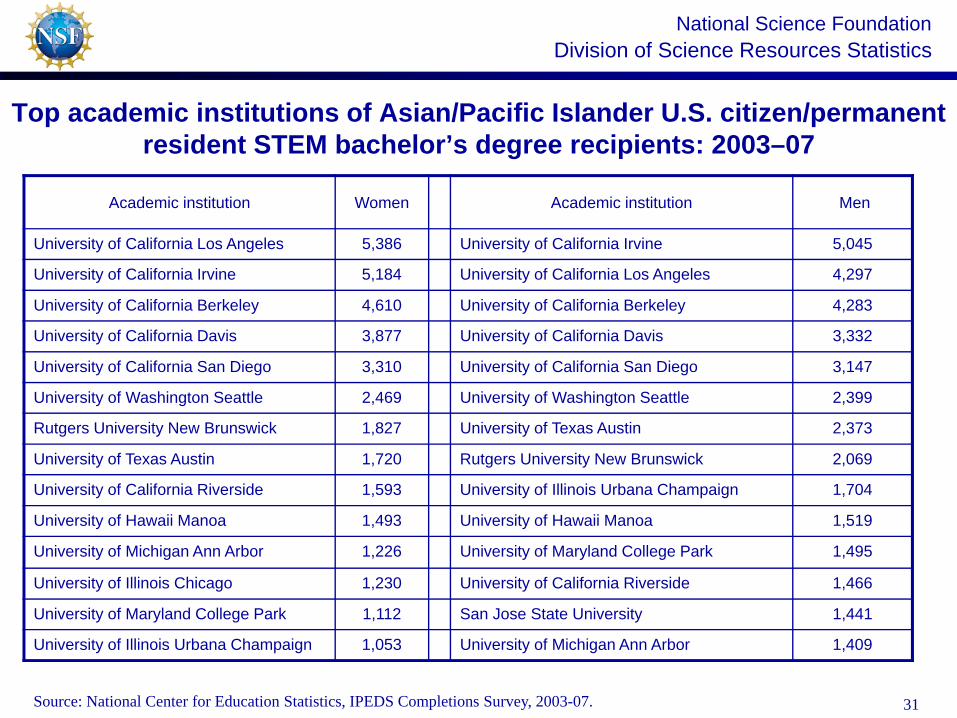
• For Asians, the top bachelor’s granting schools are largely in the University of California system.
27

National Science FoundationDivision of Science Resources Statistics
Top academic institutions of Hispanic U.S. citizen/permanent resident STEM bachelor’s degree recipients: 2003–07
Academic institution Women Academic institution Men
University of Puerto Rico Mayaguez 2,818 University of Puerto Rico Mayaguez 2,934
University of Puerto Rico Rio Piedras 2,254 Florida International University 1,739
Florida International University 2,147 University of Texas Austin 1,433
University of California Los Angeles 2,093 Universidad Politecnica de Puerto Rico 1,377
California State University Northridge 1,341 University of California Los Angeles 1,316
University of California Santa Barbara 1,291 University of Florida 1,155
University of Texas San Antonio 1,276 University of Puerto Rico Rio Piedras 1,110
University of California Irvine 1,247 University of Texas El Paso 1,025
California State University Fullerton 1,194 University of Texas San Antonio 1,022
San Diego State University 1,193 San Diego State University 956
University of California Riverside 1,178 Texas A&M University 886
University of Texas Austin 1,162 University of Texas Pan American 878
University of California Davis 1,079 University of California Irvine 854
University of Florida 1,069 California State University Northridge 811
28Source: National Center for Education Statistics, IPEDS Completions Survey, 2003-07.
National Science FoundationDivision of Science Resources Statistics
Top academic institutions of Black U.S. citizen/permanent resident STEM bachelor’s degree recipients: 2003–07
Academic institution Women Academic institution Men
Spelman College 1,649 Morehouse College 1,159
Georgia State University 1,451 Florida A&M University 906
Howard University 1,300 University of Maryland College Park 809
Florida A&M University 1,256 North Carolina A&T State University 767
Xavier University of Louisiana 1,182 Strayer University 647
Hampton University 1,011 Southern University and A&M College 608
University of South Florida 999 Howard University 603
University of Maryland College Park 990 Morgan State University 597
CUNY John Jay College 951 Florida State University 568
North Carolina A&T State University 935 North Carolina State University Raleigh 561
Morgan State University 881 University of Florida 502
Tennessee State University 867 Tennessee State University 495
Southern University and A&M College 824 Georgia State University 490
Florida State University 800 Ohio State University 486
29Source: National Center for Education Statistics, IPEDS Completions Survey, 2003-07.

National Science FoundationDivision of Science Resources Statistics
Top academic institutions of American Indian/Alaska Native U.S. citizen/permanent resident STEM bachelor’s degree recipients: 2003–07
Academic institution Women Academic institution Men
University of Oklahoma Norman 238 Oklahoma State University 246
Oklahoma State University 224 University of Oklahoma Norman 242
University of North Carolina Pembroke 179 Northeastern State University 122
Northeastern State University 164 DeVry University Pomona CA 91
Fort Lewis College 139 University of Washington Seattle 91
University of New Mexico 137 University of New Mexico 90
Arizona State University Tempe 133 George Mason University 85
University of Washington Seattle 118 Southeastern Oklahoma State University 78
George Mason University 111 Haskell Indian Nations University 75
University of Arizona 111 Arizona State University Tempe 74
Southeastern Oklahoma State University 99 University of Arizona 69
Northern Arizona University 96 Northern Arizona University 67
East Central University 85 University of North Carolina Pembroke 67
University of California Davis 85 Fort Lewis College 61
University of Michigan Ann Arbor 61
30Source: National Center for Education Statistics, IPEDS Completions Survey, 2003-07.
National Science FoundationDivision of Science Resources Statistics
Top academic institutions of Asian/Pacific Islander U.S. citizen/permanent resident STEM bachelor’s degree recipients: 2003–07
Academic institution Women Academic institution Men
University of California Los Angeles 5,386 University of California Irvine 5,045
University of California Irvine 5,184 University of California Los Angeles 4,297
University of California Berkeley 4,610 University of California Berkeley 4,283
University of California Davis 3,877 University of California Davis 3,332
University of California San Diego 3,310 University of California San Diego 3,147
University of Washington Seattle 2,469 University of Washington Seattle 2,399
Rutgers University New Brunswick 1,827 University of Texas Austin 2,373
University of Texas Austin 1,720 Rutgers University New Brunswick 2,069
University of California Riverside 1,593 University of Illinois Urbana Champaign 1,704
University of Hawaii Manoa 1,493 University of Hawaii Manoa 1,519
University of Michigan Ann Arbor 1,226 University of Maryland College Park 1,495
University of Illinois Chicago 1,230 University of California Riverside 1,466
University of Maryland College Park 1,112 San Jose State University 1,441
University of Illinois Urbana Champaign 1,053 University of Michigan Ann Arbor 1,409
31Source: National Center for Education Statistics, IPEDS Completions Survey, 2003-07.

National Science FoundationDivision of Science Resources Statistics
What are the demographic characteristics of women of color in STEM employment?
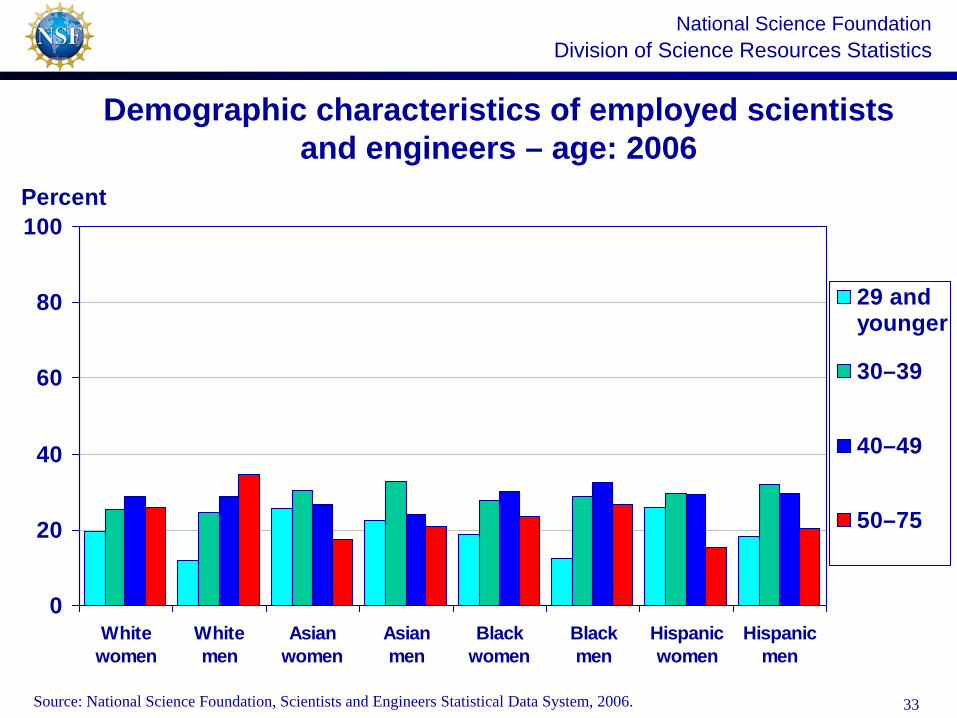
• Within each racial/ethnic group, women are younger, on average, than men.
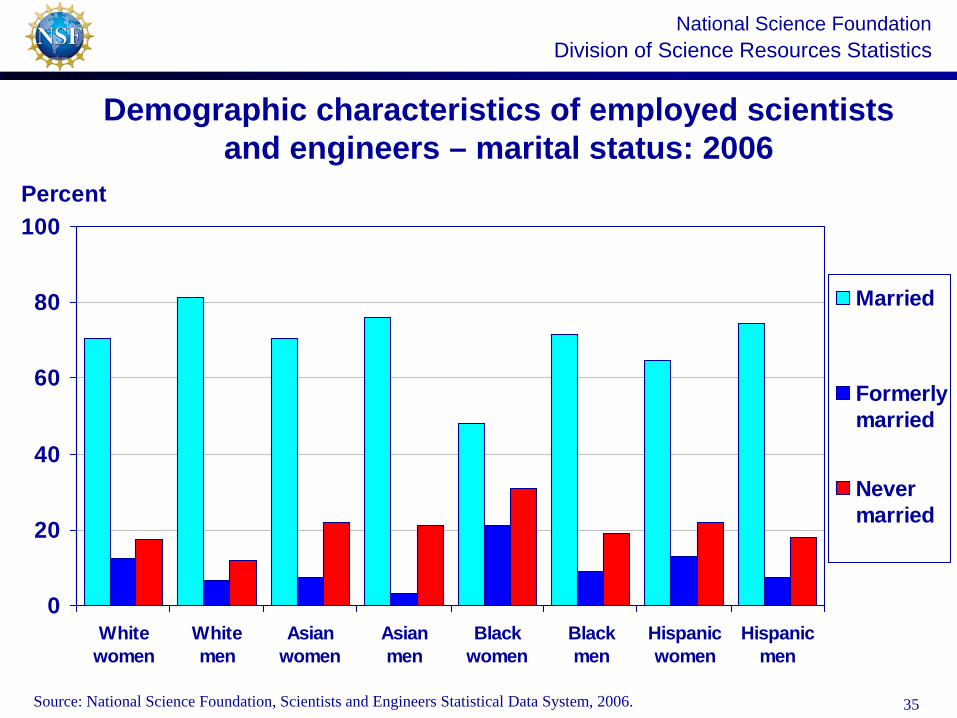
• Within each racial/ethnic group, women are less likely than men to be married.
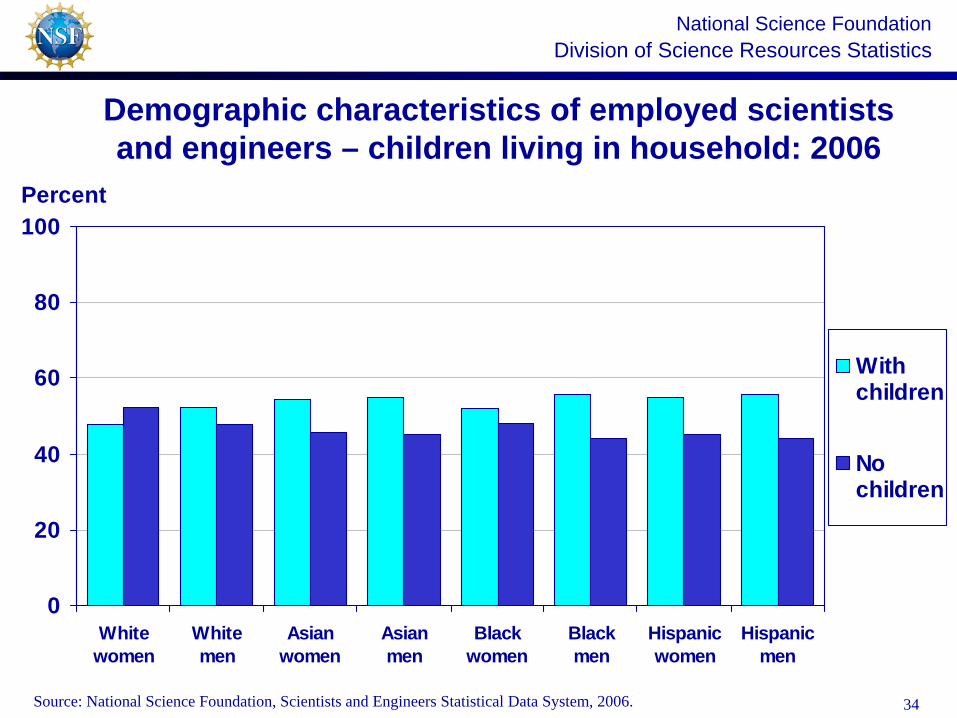
• Within each racial/ethnic group, women are less likely than men to have children living in the household.
32
National Science FoundationDivision of Science Resources Statistics
Demographic characteristics of employed scientists and engineers – age: 2006
0
20
40
60
80
100
Whitewomen
Whitemen
Asianwomen
Asianmen
Blackwomen
Blackmen
Hispanicwomen
Hispanicmen
Percent
29 andyounger
30–39
40–49
50–75
Source: National Science Foundation, Scientists and Engineers Statistical Data System, 2006. 33
National Science FoundationDivision of Science Resources Statistics
Demographic characteristics of employed scientists and engineers – children living in household: 2006
0
20
40
60
80
100
Whitewomen
Whitemen
Asianwomen
Asianmen
Blackwomen
Blackmen
Hispanicwomen
Hispanicmen
Percent
Withchildren
Nochildren
34Source: National Science Foundation, Scientists and Engineers Statistical Data System, 2006.
National Science FoundationDivision of Science Resources Statistics
Demographic characteristics of employed scientists and engineers – marital status: 2006
0
20
40
60
80
100
Whitewomen
Whitemen
Asianwomen
Asianmen
Blackwomen
Blackmen
Hispanicwomen
Hispanicmen
Percent
Married
Formerlymarried
Nevermarried
35Source: National Science Foundation, Scientists and Engineers Statistical Data System, 2006.

National Science FoundationDivision of Science Resources Statistics
What are the employment characteristics of women of color in STEM?
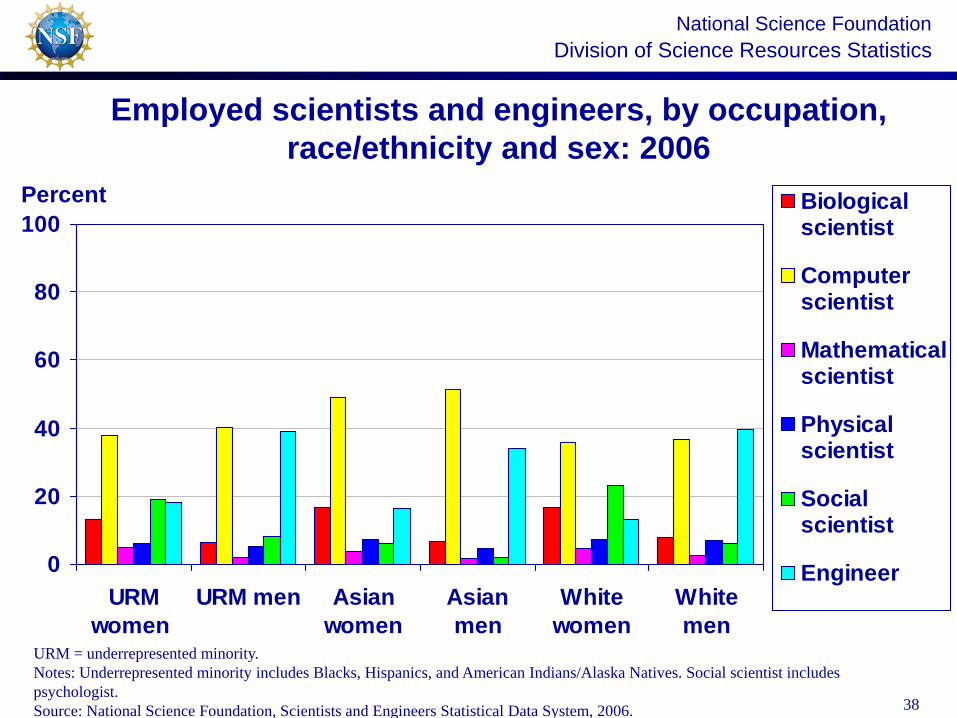
• Within all racial/ethnic groups, lower percentages of women scientists and engineers are engineers, computer scientists or physical scientists.
• Within all racial/ethnic groups, higher percentages of women scientists and engineers are biological scientists, mathematicians, and social and behavioral scientists.
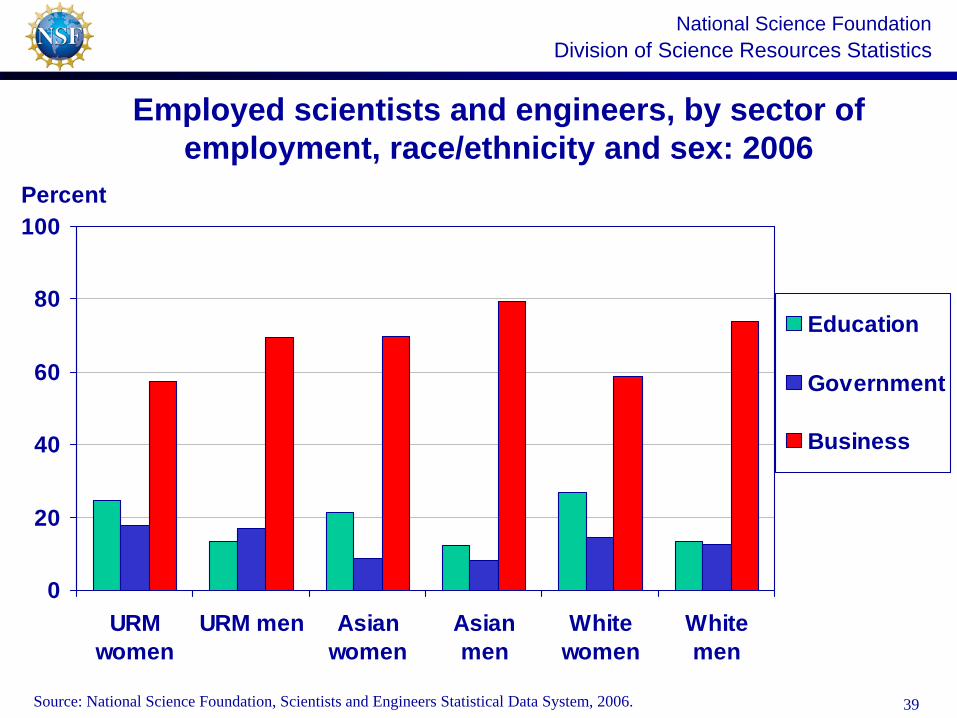
• Within all racial/ethnic groups, a higher percentage of women than of men are employed in the education sector and a lower percentage of men than of women are in business/industry.
36
National Science FoundationDivision of Science Resources Statistics
What are the employment characteristics of women of color in STEM? – cont.
• A higher percentage of Asian men and women than of other groups are employed in business/industry and a lower percentage are employed in government.
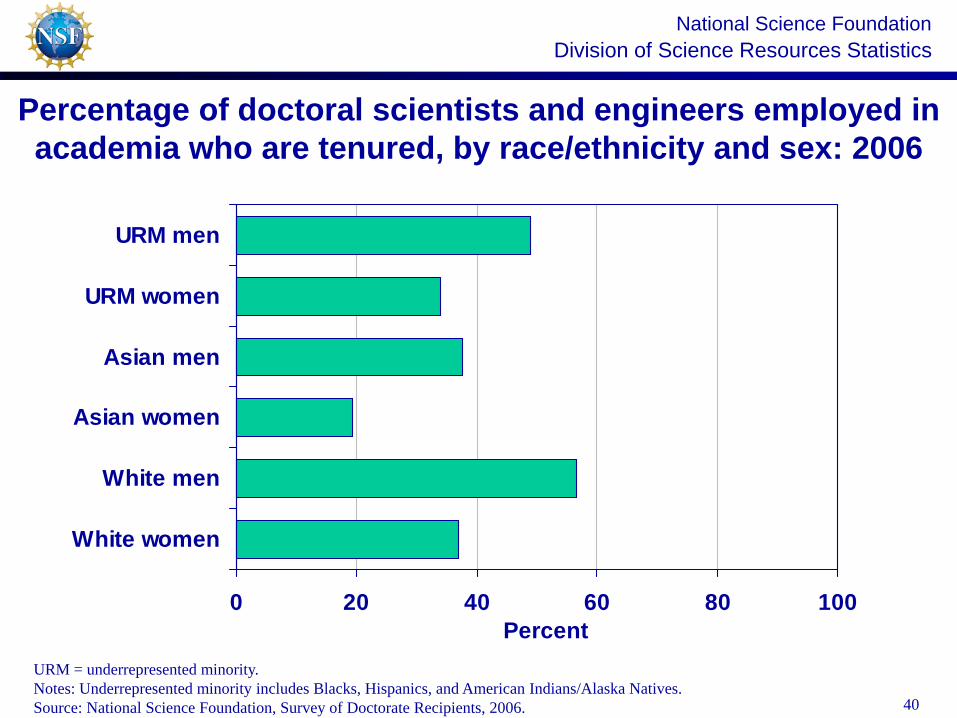
• Within each racial/ethnic group, lower percentages of women than of men are tenured or full professors.
• Asian women have the lowest percentage tenured or full professors.
37
National Science FoundationDivision of Science Resources Statistics
Employed scientists and engineers, by occupation, race/ethnicity and sex: 2006
0
20
40
60
80
100
URMwomen
URM men Asianwomen
Asianmen
Whitewomen
Whitemen
Percent Biologicalscientist
Computerscientist
Mathematicalscientist
Physicalscientist
Socialscientist
Engineer
38
URM = underrepresented minority. Notes: Underrepresented minority includes Blacks, Hispanics, and American Indians/Alaska Natives. Social scientist includes psychologist.Source: National Science Foundation, Scientists and Engineers Statistical Data System, 2006.
National Science FoundationDivision of Science Resources Statistics
Employed scientists and engineers, by sector of employment, race/ethnicity and sex: 2006
0
20
40
60
80
100
URMwomen
URM men Asianwomen
Asianmen
Whitewomen
Whitemen
Percent
Education
Government
Business
39Source: National Science Foundation, Scientists and Engineers Statistical Data System, 2006.
National Science FoundationDivision of Science Resources Statistics
Percentage of doctoral scientists and engineers employed in academia who are tenured, by race/ethnicity and sex: 2006
0 20 40 60 80 100
White women
White men
Asian women
Asian men
URM women
URM men
Percent
40
URM = underrepresented minority. Notes: Underrepresented minority includes Blacks, Hispanics, and American Indians/Alaska Natives. Source: National Science Foundation, Survey of Doctorate Recipients, 2006.

National Science FoundationDivision of Science Resources Statistics
Percentage of doctoral scientists and engineers employed in academia who are on the tenure track, by
race/ethnicity and sex: 2006
0 20 40 60 80 100
White women
White men
Asian women
Asian men
URM women
URM men
Percent
41
URM = underrepresented minority. Notes: Underrepresented minority includes Blacks, Hispanics, and American Indians/Alaska Natives. Source: National Science Foundation, Survey of Doctorate Recipients, 2006.

National Science FoundationDivision of Science Resources Statistics
Percentage of doctoral scientists and engineers employed in academia who are full professors, by race/ethnicity and sex:
2006
0 20 40 60 80 100
White women
White men
Asian women
Asian men
URM women
URM men
Percent
42
URM = underrepresented minority. Notes: Underrepresented minority includes Blacks, Hispanics, and American Indians/Alaska Natives. Source: National Science Foundation, Survey of Doctorate Recipients, 2006.

National Science FoundationDivision of Science Resources Statistics
Percent of employed scientists and engineers with disabilities, by race/ethnicity and sex: 2006
0 4 8 12 16 20
White women
White men
Asian women
Asian men
Black women
Black men
Hispanic women
Hispanic men
American Indian women
American Indian men
Percent
43Source: National Science Foundation, Scientists and Engineers Statistical Data System, 2006.

National Science FoundationDivision of Science Resources Statistics
What are the trends in STEM employment of women of color?
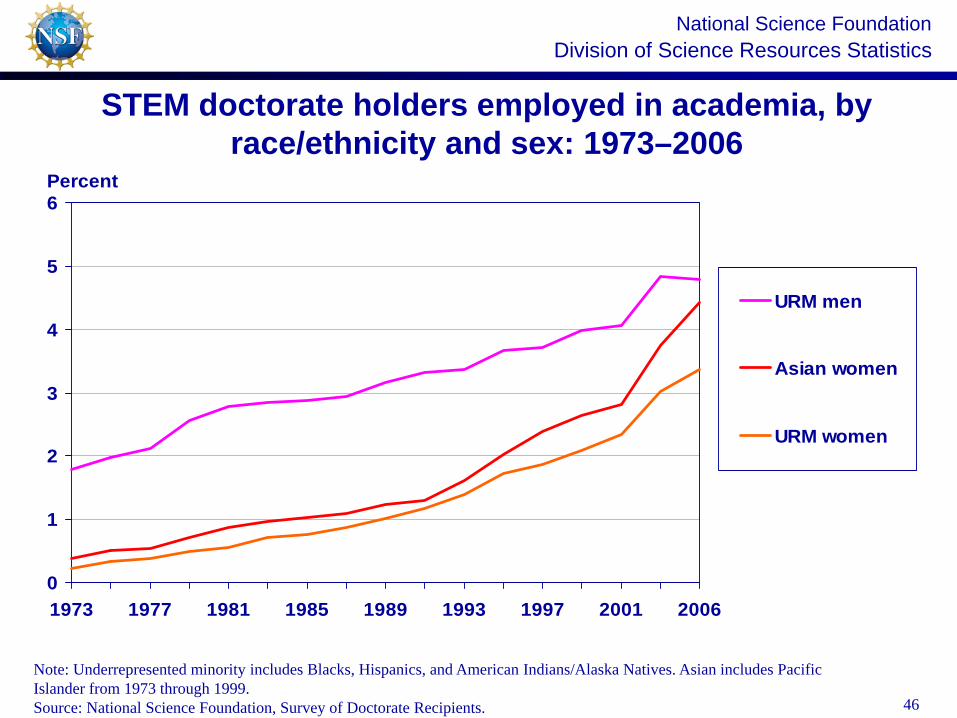
• Underrepresented minority women are an increasing (although tiny) percentage of STEM doctorate holders in academia.
• White men are a declining percentage of STEM doctorate holders in academia.
• Asian men and White women have made the most gains in STEM academic employment.
44

National Science FoundationDivision of Science Resources Statistics
STEM doctorate holders employed in academia, by race/ethnicity and sex: 1973–2006
0
20
40
60
80
100
1973 1977 1981 1985 1989 1993 1997 2001 2006
Percent
White men
White women
Asian men
URM men
Asian women
URM women
45
Notes: Underrepresented minority includes Blacks, Hispanics, and American Indians/Alaska Natives. Asian includes Pacific Islander from 1973 through 1999.Source: National Science Foundation, Survey of Doctorate Recipients.
National Science FoundationDivision of Science Resources Statistics
STEM doctorate holders employed in academia, by race/ethnicity and sex: 1973–2006
0
1
2
3
4
5
6
1973 1977 1981 1985 1989 1993 1997 2001 2006
Percent
URM men
Asian women
URM women
46
Note: Underrepresented minority includes Blacks, Hispanics, and American Indians/Alaska Natives. Asian includes Pacific Islander from 1973 through 1999. Source: National Science Foundation, Survey of Doctorate Recipients.

National Science FoundationDivision of Science Resources Statistics
Summary
• Access to education, educational attainment, and types of colleges attended are defined primarily by race/ethnicity.
• Field of study and employment characteristics are defined primarily by gender.
• Some progress has been made since the 1970s in education and employment, although representation in STEM remains small.
47
National Science FoundationDivision of Science Resources Statistics
Women, Minorities, and Persons with Disabilities in Science and Engineering: 2009
Women, Minorities, and Persons with Disabilities in Science and Engineering is a report that provides information about the participation of women, minorities, and persons with disabilities in science and engineering education and employment.
Information on the site is organized by topic and group. Links to additional data sources and reports are provided. This site is updated as new information becomes available.
A formal report is issued every two years and is sent to Congress. The latest report is 2009.
http://www.nsf.gov/statistics/wmpd 48
Top Related