


Languages
Pages
Legal

Evaluation of pre-processing techniques for the analysis and
recognition of invoice documents
PA van Zyl
22290680
Dissertation submitted in partial fulfilment of the requirements for the degree Magister Scientiae in Computer Science at the
Potchefstroom Campus of the North-West University
Supervisor: Prof HM Huisman
Co-supervisor: Prof GR Drevin
November 2015

i
ACKNOWLEDGEMENTS
I would like to thank Prof Magda Huisman for her continuous guidance and inspiration throughout
my years at the university. I would not have been able to make it this far without her. I would also
like to thank Prof Gunther Drevin for his input, ideas, and wisdom that allowed me to successfully
conduct experiments that yielded meaningful results. Lastly, I would like to thank all the Computer
Science lecturers at the NWU for educating me and providing me with an environment in which I
could learn and grow to prepare myself for the world.
The financial assistance of the National Research Foundation (NRF) towards the work done in
this research is hereby acknowledged. Opinions expressed and conclusions arrived at are those
of the author and are not necessarily to be attributed to the NRF.

ii
ABSTRACT
The automatic extraction and handling of information contained on invoice documents holds major
benefits for many businesses as this could save many resources, which would otherwise have
been spent on manual extraction. Document Analysis and Recognition (DAR) is a process, which
makes use of Optical Character Recognition (OCR) for the recognition and analysis of the
contents of physical documents in order to digitally extract and process the information. It consists
of four steps, namely pre-processing, layout analysis, text recognition, and post-processing.
Pre-processing is used to improve the overall quality of a document image in order to prepare it
for the steps that follow. Techniques used for pre-processing have a direct influence on the
resulting OCR accuracy as any small deficiencies that pass through this stage are dragged along
the rest of the OCR process and ultimately recognized incorrectly. A significant contribution can
be made to the relevant research areas and business communities by revealing which pre-
processing techniques are the most effective for the analysis and recognition of invoice
documents.
In order to approach this problem, an exploratory study was first conducted. Case studies were
used during which owners and CEOs of five DAR-related companies were interviewed.
Transcriptions and content analysis of these semi-structured interviews allowed prevalent themes
to emerge from the data.
The second study was an experimental investigation. The experiments conducted involved taking
a number of invoice document images, performing various pre-processing techniques on the
images, and measuring the effect of the techniques on the recognition rates. By acquiring the
recognition rates of the different techniques, it was possible to quantitatively compare the
techniques with each other.
It was revealed that many businesses in the DAR industry make use of the same business
process. Much was learnt about the DAR-related software used in the industry, how Intelligent
Character Recognition (ICR) should be approached, and what the best scanning practices are. It
was also discovered that the use of paper-based information and the need for the electronic
processing thereof is increasing, thereby securing the future of the industry. Regarding the
efficiency of pre-processing techniques, it was successfully revealed that some techniques do
perform better than others. In addition, many findings were made regarding the functioning of
some of the techniques used for the experiments.

iii
SAMEVATTING
Die outomatiese onttrekking en hantering van inligting op faktuurdokumente hou groot voordele
in vir baie besighede omdat dit hulpbronne kan spaar wat andersins vir data-onttrekking gebruik
sou word. Dokumentanalise en Herkenning (DAR) is 'n proses wat gebruik maak van Optiese
Karakterherkenning (OCR) vir die herkenning en ontleding van inhoud op dokumente sodat die
inligting daarop digitaal onttrek en verwerk kan word. Die proses bestaan uit vier stappe, naamlik
voorverwerking, uitleganalise, teksherkenning, en na-verwerking.
Voorverwerking word gebruik om die algehele gehalte van ’n dokumentbeeld te verbeter om dit
voor te berei vir die stappe wat volg. Tegnieke wat gebruik word vir die voorverwerking het 'n
direkte invloed op die OCR-akkuraatheid omdat enige klein tekortkominkie wat in hierdie stap
ontstaan, saamgesleep word deur die res van die OCR-proses en uiteindelik verkeerd herken
word. 'n Beduidende bydrae kan aan die relevante navorsings-gebiede en sakegemeenskappe
gelewer word deur die voorverwerkingstegnieke wat die doeltreffendste is vir die analise en
herkenning van faktuurdokumente te identifiseer.
Om hierdie probleem te benader is ’n verkennende studie uitgevoer. Daar is gebruik gemaak van
gevallestudies waartydens ʼn aantal onderhoude met mense in die DAR-bedryf gevoer is.
Transkripsies en inhoudontleding van hierdie semi-gestruktureerde onderhoude het gelei tot die
ontdekking van algemene temas in die data.
Vervolgens is ’n eksperimentele ondersoek uitgevoer. Gedurende die eksperimente wat uitgevoer
is, is 'n aantal van die faktuurdokumentbeelde geneem en verskeie voorverwerkingstegnieke is
op die beelde toegepas. Die invloed van die tegnieke is toe geneem deur na die
herkenningresultate te kyk. Deur die verkryging van die herkenningresultate van die verskillende
tegnieke, was dit moontlik om die tegnieke kwantitatief met mekaar te vergelyk.
Daar is ontdek dat baie besighede in die DAR-bedryf van dieselfde besigheidsprosesse gebruik
maak. Daar is baie geleer oor die DAR-verwante sagteware wat in die bedryf gebruik word, hoe
Intelligente Karakterherkenning (ICR) benader moet word, en wat die beste praktyke rakende
skandering is. Daar is ook ontdek dat die gebruik van papiergebaseerde inligting en die behoefte
aan die elektroniese verwerking daarvan aan die toeneem is. Ten opsigte van die doeltreffendheid
van voor-verwerkingstegnieke, is daar suksesvol getoon dat sommige tegnieke beter presteer as
ander. Daar is ook baie bevindinge gemaak ten opsigte van die funksionering van 'n paar van die
tegnieke wat vir die eksperimente gebruik word.

iv
KEY TERMS
OCR Optical Character Recognition. The identification and digitization of
printed characters on a document image. See Section 2.2, p. 7.
ICR Intelligent Character Recognition. The identification and digitization
of handwritten characters on a document image. See Section 2.2, p. 7.
DAR Document Analysis and Recognition. The automatic extraction and
processing of information presented on paper. See Section 2.3, p. 11.
Pre-processing The first step in the DAR process; pre-processing aims to improve
image quality for better recognition results. See Section 2.3.1, p. 11.
Noise reduction A pre-processing step, which attempts to remove noisy pixels from an
image. See Section 2.3.1.2, p. 13.
Binarization
A pre-processing step, which converts a greyscale image into a bi-level
representation in order to separate the foreground from the background.
See Section 2.3.1.3, p. 14.
Exploratory study
The first study of this research, which is used to gather more information
before beginning with the experimental investigation. See Chapter 4, p.
40.
Experimental
investigation
The second study of this research, which consists of experiments that
compare the performance of pre-processing techniques. See Chapter
5, p. 47.
Ground truth text The actual text that is contained in the original, unaltered document
images. See Section 5.6, p. 60.
v
TABLE OF CONTENTS
ACKNOWLEDGEMENTS .......................................................................................................... I
ABSTRACT ........................................................................................................................... II
SAMEVATTING ....................................................................................................................... III
KEY TERMS .......................................................................................................................... IV
TABLE OF CONTENTS ............................................................................................................ V
LIST OF TABLES ..................................................................................................................... X
LIST OF FIGURES .................................................................................................................. XII
CHAPTER 1 – INTRODUCTION ............................................................................................... 1
1.1 Introduction ...................................................................................................... 1
1.2 Problem statement ........................................................................................... 1
1.3 Research objectives ......................................................................................... 3
1.4 Summary ........................................................................................................... 4
CHAPTER 2 – LITERATURE REVIEW ..................................................................................... 6
2.1 Introduction ...................................................................................................... 6
2.2 Optical Character Recognition ........................................................................ 7
2.2.1 History of OCR ................................................................................................... 9
2.2.2 Development of new techniques ......................................................................... 9
2.2.3 Applications ...................................................................................................... 10
2.2.4 Recent trends and movements ......................................................................... 10

vi
2.3 Document Analysis and Recognition ............................................................ 11
2.3.1 Pre-processing ................................................................................................. 11
2.3.2 Layout analysis ................................................................................................. 14
2.3.3 Text recognition ................................................................................................ 16
2.3.4 Post-processing ................................................................................................ 18
2.4 Techniques ..................................................................................................... 19
2.4.1 Noise reduction ................................................................................................. 19
2.4.2 Binarization ....................................................................................................... 22
2.5 Summary ......................................................................................................... 26
CHAPTER 3 – RESEARCH METHOD .................................................................................... 27
3.1 Introduction .................................................................................................... 27
3.2 Purpose ........................................................................................................... 28
3.3 Paradigm ......................................................................................................... 28
3.4 Participants ..................................................................................................... 32
3.5 Process ........................................................................................................... 33
3.5.1 Process followed during the exploratory study .................................................. 33
3.5.2 Process followed during the experimental investigation .................................... 36
3.6 Products and presentation ............................................................................ 37
3.7 Summary ......................................................................................................... 38
CHAPTER 4 – CURRENT STATE OF DAR IN SOUTH AFRICA ........................................... 40
4.1 Introduction .................................................................................................... 40
4.2 Case studies ................................................................................................... 40

vii
4.2.1 Interview details ................................................................................................ 40
4.2.2 Participants ....................................................................................................... 41
4.3 Findings .......................................................................................................... 42
4.3.1 Business process ............................................................................................. 42
4.3.2 Software used................................................................................................... 43
4.3.3 Intelligent Character Recognition (ICR) ............................................................ 44
4.3.4 Scanners .......................................................................................................... 44
4.3.5 The future of the industry .................................................................................. 44
4.4 Discussion ...................................................................................................... 45
4.5 Summary ......................................................................................................... 45
CHAPTER 5 – EXPERIMENTAL INVESTIGATION ................................................................ 47
5.1 Introduction .................................................................................................... 47
5.2 Acquisition of images .................................................................................... 48
5.3 Degradation of images ................................................................................... 50
5.4 Coding of techniques ..................................................................................... 52
5.5 Character recognition .................................................................................... 58
5.6 Acquisition of ground truth text .................................................................... 60
5.7 Development of comparison software .......................................................... 61
5.8 Comparisons................................................................................................... 63
5.9 Summary ......................................................................................................... 64
CHAPTER 6 – EXPERIMENT RESULTS AND DISCUSSION ................................................ 66
6.1 Introduction .................................................................................................... 66

viii
6.2 Characters ....................................................................................................... 66
6.3 Phrases ........................................................................................................... 70
6.4 Numbers .......................................................................................................... 71
6.5 Averages ......................................................................................................... 72
6.6 Document Performance ................................................................................. 76
6.7 Unaltered document performance ................................................................. 76
6.8 Summary ......................................................................................................... 78
CHAPTER 7 – CONCLUSIONS .............................................................................................. 79
7.1 Introduction and thesis summary ................................................................. 79
7.2 Summary of findings ...................................................................................... 80
7.3 Summary of contributions ............................................................................. 82
7.4 Suggestions for further research .................................................................. 83
7.5 Conclusions .................................................................................................... 83
REFERENCE LIST ................................................................................................................. 85
ANNEXURE A – RESULTS .................................................................................................... 90
1. Control Invoice 1 ............................................................................................ 90
2. Control Invoice 2 ............................................................................................ 91
3. Control Invoice 3 ............................................................................................ 92
4. Real Invoice 1 .................................................................................................. 93
5. Real Invoice 2 .................................................................................................. 94
6. Real Invoice 3 .................................................................................................. 95
7. Noisy Invoice 1 ............................................................................................... 96

ix
8. Noisy Invoice 2 ............................................................................................... 97
9. Noisy Invoice 3 ............................................................................................... 98
10. Noisy Invoice 4 ............................................................................................... 99
ANNEXURE B – ANALYSIS ................................................................................................. 100
1. Characters ..................................................................................................... 101
2. Phrases ......................................................................................................... 102
3. Numbers ........................................................................................................ 103
4. Averages ....................................................................................................... 104
5. Document performance ............................................................................... 105
6. Unaltered document performance ............................................................... 106
7. Box plot ......................................................................................................... 107
ANNEXURE C – IMAGES USED FOR EXPERIMENTS ....................................................... 108
PLAGIARISM REPORT ........................................................................................................ 118
PROOF OF LANGUAGE EDITING ....................................................................................... 119
x
LIST OF TABLES
Table 2-1 Properties of text in images (Jung et al., 2004:980) ................................................. 16
Table 2-2 Dictionary support application .................................................................................. 19
Table 4-1 Participating companies .......................................................................................... 41
Table 6-1 Results summary ..................................................................................................... 78
Table A-1 Control Invoice 1 results .......................................................................................... 90
Table A-2 Control Invoice 2 results .......................................................................................... 91
Table A-3 Control Invoice 3 results .......................................................................................... 92
Table A-4 Real Invoice 1 results .............................................................................................. 93
Table A-5 Real Invoice 2 results .............................................................................................. 94
Table A-6 Real Invoice 3 results .............................................................................................. 95
Table A-7 Noisy Invoice 1 results ............................................................................................ 96
Table A-8 Noisy Invoice 2 results ............................................................................................ 97
Table A-9 Noisy Invoice 3 results ............................................................................................ 98
Table A-10 Noisy Invoice 4 results .......................................................................................... 99
Table B-1 Average by characters recognized – Noise reduction ............................................ 101
Table B-2 Average by characters recognized – Binarization .................................................. 101
Table B-3 Average by phrases recognized - Noise reduction ................................................ 102
Table B-4 Average by phrases recognized - Binarization ...................................................... 102
Table B-5 Average by numbers recognized - Noise reduction ............................................... 103
Table B-6 Average by numbers recognized - Binarization ..................................................... 103
Table B-7 Total average - Noise reduction ............................................................................ 104
Table B-8 Total average - Binarization .................................................................................. 104

xi
Table B-9 Document performance - Noise reduction ............................................................. 105
Table B-10 Document performance - Binarization ................................................................. 105
Table B-11 Unaltered document performance ....................................................................... 106
Table B-12 Average box plot statistics ................................................................................... 107
xii
LIST OF FIGURES
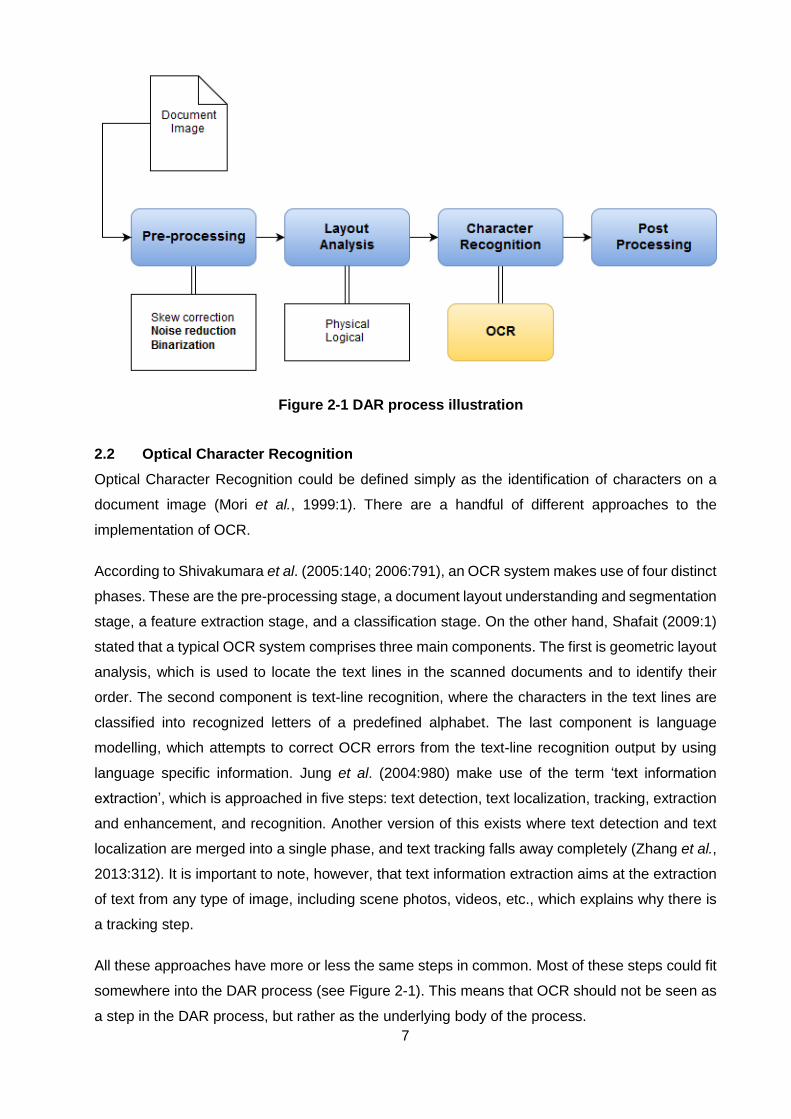
Figure 2-1 DAR process illustration ........................................................................................... 7
Figure 2-2 Median filter example (Gonzalez & Woods, 2006:157) ........................................... 20
Figure 2-3 Smoothing filter mask ............................................................................................. 20
Figure 2-4 Averaging filter example (Gonzalez & Woods, 2006:157) ....................................... 20
Figure 2-5 Weighted smoothing filter mask .............................................................................. 21
Figure 2-6 Sigma influence on peak ........................................................................................ 21
Figure 2-7 Application of global threshold (Gonzalez & Woods, 2006:743).............................. 23
Figure 2-8 Application of Otsu's method (Gonzalez & Woods, 2006:748) ................................ 25
Figure 3-1 Mixed methods research ........................................................................................ 30
Figure 3-2 Research studies.................................................................................................... 30
Figure 3-3 Research method summary ................................................................................... 39
Figure 5-1 Experimental process overview .............................................................................. 48
Figure 5-2 Control invoices ...................................................................................................... 49
Figure 5-3 Real invoices .......................................................................................................... 49
Figure 5-4 Noisy invoices' format ............................................................................................. 50
Figure 5-5 Effects of various noise types on image ................................................................. 51
Figure 5-6 MATLAB technique template .................................................................................. 52
Figure 5-7 Selection of text regions ......................................................................................... 58
Figure 5-8 Text recognition using ABBYY FineReader ............................................................ 59
Figure 5-9 Resulting OCR text ................................................................................................. 59
Figure 5-10 Binarization of noisy image ................................................................................... 60
Figure 5-11 Control Invoice 1 ground truth text ........................................................................ 61

xiii
Figure 5-12 Comparison application UI ................................................................................... 63
Figure 5-13 Comparison application results ............................................................................. 64
Figure 6-1 Precision and recall (Wikipedia, 2015) .................................................................... 67
Figure 6-2 Average by recognition type ................................................................................... 68
Figure 6-3 Image with no filter ................................................................................................. 69
Figure 6-4 Application of median filter 3x3 ............................................................................... 69
Figure 6-5 Application of average filter 3x3 .............................................................................. 69
Figure 6-6 Application of global threshold 128 ......................................................................... 70
Figure 6-7 Global threshold 128 resulting text ......................................................................... 70
Figure 6-8 Application of weighted smoothing filter 2 ............................................................... 71
Figure 6-9 Application of weighted smoothing filter 3 ............................................................... 71
Figure 6-10 Application of Gaussian filter 5x5 s1 ..................................................................... 71
Figure 6-11 Median filter 5x5 ................................................................................................... 72
Figure 6-12 Gaussian filter 10x10 s2 ....................................................................................... 72
Figure 6-13 Effects of median filter 3x3 ................................................................................... 73
Figure 6-14 Effects of median filter 5x5 ................................................................................... 73
Figure 6-15 Text from Control Invoice 1 .................................................................................. 73
Figure 6-16 Text from Control Invoice 2 .................................................................................. 73
Figure 6-17 Text from Control Invoice 3 .................................................................................. 74
Figure 6-18 Application of global threshold 128 on low intensity text ....................................... 74
Figure 6-19 Technique total average ....................................................................................... 75
Figure 6-20 Average accuracy box plot ................................................................................... 75
Figure 6-21 Document recognition average ............................................................................. 76

xiv
Figure 6-22 Unaltered document performance ........................................................................ 77
Figure 6-23 Noiseless image Control Invoice 2 ....................................................................... 77
Figure 6-24 Added noise in Noisy Invoice 1 ............................................................................. 77
Figure 6-25 Noisy part of Real Invoice 2 .................................................................................. 78
Figure B-1 Cell colour scale .................................................................................................. 100
1
CHAPTER 1 – INTRODUCTION
1.1 Introduction
The automatic extraction and handling of information contained on invoice documents holds major
benefits for many businesses as this could save many resources, which would otherwise have
been spent on manual extraction. The use of paper documents in the office is ineffective as
documents are frequently copied, updated, written upon, and degraded. Electronic documents,
on the other hand, always contain the updated information, are simultaneously available to all
their users, and do not waste paper or space (Stoliński & Bieniecki, 2011:1). It is clear that
digitization of information contained on paper documents is a good idea, but the implementation
thereof is regrettably not as straight forward (Gatos et al., 2014:131).
High quality documents that have been printed with a decent printer on good quality paper, have
the potential to obtain higher than 99% recognition accuracy (Stoliński & Bieniecki, 2011:1).
Documents used within businesses are unfortunately rarely of high quality, as they are often
affected by degradation caused by age, photocopying, faxing, mark-up, etc. Techniques used
during the pre-processing phase of the Document Analysis and Recognition (DAR) process
attempt to remedy as many of these quality shortcomings as possible in order to improve the
resulting recognition accuracy. These techniques are referred to as image enhancement
techniques, and they have applications in many areas, such as medicine, space exploration,
automated industry inspection, authentication, etc. (Vidyasaraswathi & Hanumantharaju,
2015:48).
Marinai (2008:1) points out that there are studies that reveal how paper is still being used as a
medium for information, and its use is actually increasing. In addition, there are some application
areas where paper is actually the favoured medium for knowledge work. This includes authoring
work, reviewing documents, planning or organization, collaborative activities, and organizational
communication (Sellen & Harper, 2003:3).
The rest of this chapter will be used to provide a problem statement in Section 1.2, and to state
the research objectives, approach, and contributions in Section 1.3.
1.2 Problem statement
Document Analysis and Recognition is the complete process of analysing and recognizing the
components of physical documents in order to digitally extract the information (Marinai, 2008:1).
The DAR process starts off with a scanned document image, and consists of the following four
phases (Marinai, 2008:4):
2
1. Pre-processing – The overall quality of the image is improved and the image is prepared for
the processes to follow.
2. Layout analysis – The components of the document image are identified and classified.
3. Text recognition – This involves the conversion of the document image’s text into a machine-
understandable format. A process called Optical Character Recognition (OCR) is used for
this.
4. Post-processing – The results of the recognition are verified based on the contextual
information.
Techniques used for pre-processing have a direct influence on OCR accuracy (Khurshid et al.,
2009:72; Robertson et al., 2014:167). It is also believed that these techniques could be the main
source of various errors (Neves et al., 2013:107; Patvardhan et al., 2012:60). The reason for this
is that any small deficiencies that pass through this stage, are dragged along the rest of the OCR
process. For instance, noise speckles that are not removed during the pre-processing phase will
move along to the text recognition phase and will mistakenly be identified as text. It is clear that
pre-processing techniques are important, and the improvement thereof might lead to higher
recognition rates on poor quality documents (Shivakumara et al., 2005:140).
Organizations, such as DIBCO (Document Image Binarization COntest), DISEC (Document
Image Skew Estimation Contest), and the ICDAR Table Detection and Structure Recognition
Competition host contests in which participants compete to determine who is able to provide the
most accurate pre-processing (binarization and skew estimation) and layout analysis (table
detection and structure recognition) techniques.
There are many studies that attempt to compare pre-processing techniques with one another
(Gupta et al., 2007:389; He et al., 2005:538; Shivakumara & Kumar, 2006:791), but according to
the author none which do so specifically for invoice processing. This is surprising because of the
large quantity of invoice processing software, which makes use of these techniques. This includes
software, such as ABBYY FlexiCapture, EMC Captiva InputAccel, and PSI:Capture.
Vamyakas et al. (2008:525) point out the importance of having effective systems for processing
documents because of the abundance of documents that exists in the world today, be it modern
or historical. There is clearly a great need for the recognition and processing of scanned images.
Using only manual data extractors for the processing of hundreds of thousands of documents
seems nearly impossible when considering the logistics thereof.
3
In this study, the most effective pre-processing techniques to be used for the optimal recognition
accuracy of invoice documents will be identified. This study will, however, be limited to noise
reduction and binarization techniques, since these are two of the main pre-processing technique
categories that directly affect the final recognition accuracy. The research will be done by
comparing pre-existing techniques with one another and then measuring how the techniques
affected the resulting recognition accuracy.
1.3 Research objectives
The main objective of this research is to compare various pre-processing techniques with one
another in order to determine the most effective techniques to be used for invoice processing. In
order to do this, the following objectives must be achieved:
1. Understand the functioning of the current DAR industry in South Africa.
2. Identify the different techniques used for pre-processing and establish how they work.
3. Determine what makes invoice documents unique from other documents.
4. Set up a platform in which different techniques can be compared to one another in respect of
recognition accuracy, specifically for the recognition of invoices.
5. Compare different techniques with one another in order to determine the optimal results.
6. Analyse and review the results of the comparisons.
7. Suggest techniques that would provide optimal recognition accuracy.
In order to achieve the research objectives, two studies will be conducted, namely an exploratory
study, and an experimental investigation. The exploratory study will consist of case studies during
which companies that are involved in the DAR industry in South Africa will be interviewed in order
to gather background information on the topic. This study is discussed in detail in Chapter 4. Once
this is done, the experimental investigation will commence. Experiments will be conducted to
determine which pre-processing techniques are the most effective. Chapters 5 and 6 will be used
to discuss this process and the findings.
An academic and practical contribution will be made by achieving the desired objectives. On an
academic level, the creation of an experiment method that could be used to compare the
techniques could be used for future experiments. This method could be expanded upon in order
to compare other techniques on different types of image. This study will also reveal the pre-
processing techniques with the best performance on invoice documents. Explanations of the

4
results will reveal valuable insights into how these techniques work and why they work the way
they do when applied to typical invoice documents.
For practical use, understanding the functioning of the DAR industry in South Africa could allow
aspiring businesses to adjust their practices according to the knowledge gained. Furthermore,
businesses could make use of the information regarding the most effective techniques in order to
attempt to improve their recognition accuracy. Being able to find the optimal techniques for invoice
processing will allow businesses to extract invoice data into their systems more accurately. This
will save businesses time and money by allowing them to reallocate manual data capturers to
other important tasks. Businesses could also learn more about the functioning of these pre-
processing techniques, and apply the knowledge to their own DAR systems for better results.
1.4 Summary
In this chapter, it was revealed that automatic information extraction from invoice documents is
something from which most businesses could benefit. The DAR process is used for this purpose,
however there are many difficulties. One of the most prominent difficulties that makes DAR on
invoice documents difficult is the poor quality of documents most businesses have to deal with.
Fortunately, the pre-processing phase of the DAR process is capable of enhancing the quality of
document images. Two main types of pre-processing techniques that have a direct influence on
the recognition accuracy are noise reduction, and binarization. During this study, various
techniques will be compared to each other in order to determine which noise reduction techniques
and which binarization techniques are the most effective.
The rest of this dissertation is broken down into the following chapters:
Chapter 2 – Literature review: The existing literature on the topic is revealed and discussed.
This chapter will elaborate on OCR technologies, its history, recent trends and movements,
and its applications. This chapter will also provide an in-depth explanation of DAR and all its
phases; pre-processing, layout analysis, text recognition, and post-processing. Lastly, the
functioning of the techniques to be used in this study will be discussed.
Chapter 3 – Research method: This chapter will be used to explain the research approach
taken for this study. This includes a look at the philosophical paradigms, research strategies,
data-gathering techniques, and data-analysis techniques.
Chapter 4 – Current state of DAR in South Africa: An exploratory study, which focuses on
the DAR industry in South Africa, is revealed and discussed in this chapter.
Chapter 5 – Experimental investigation: The technical details concerning the execution of
the experiments for this research study are explained.

5
Chapter 6 – Results and discussion: The results retrieved from the experiments are
analysed and discussed.
Chapter 7 – Conclusion: The final conclusions regarding the research studies are drawn and
recommendations for future work are made.

6
CHAPTER 2 – LITERATURE REVIEW
2.1 Introduction
In the business world of today, information is one of the most important assets. Documents are
used to store a collection of information. The two main mediums for preserving information in
documents are physical paper-based documents and digital documents. Digital documents, which
were brought on by the advent of personal computers, are still relatively new to the world. Physical
documents, such as books, manuscripts, newspapers, etc. have, however, existed for a very long
time.
Documents that are electronically created could easily be printed in order to convert them to
physical documents, but the conversion of physical documents into machine-understandable
digital documents is a whole different process (Shafait, 2009:1). There is a great need for the
effective conversion of physical documents to electronic documents in the commercial world
(Gupta et al., 2006:58). Two main reasons for this are the preservation of historic documents, and
the analysis and processing of physical documents into information systems (He et al., 2005:538).
Figure 2-1 could be used to guide the reader through this chapter. The following section will be
used to discuss OCR, as it is basically the driving force behind the DAR process. The history of
OCR will be discussed in Section 2.2.1, followed by the development of new technologies in
Section 2.2.2, applications of OCR in Section 2.2.3, and then recent trends and movements in
Section 2.2.4. Once the basic concepts of OCR have been discussed and understood, the DAR
process will be addressed. This is done in Section 2.3, where the pre-processing, layout analysis,
text recognition, and post-processing phases are discussed in Sections 2.3.1 - 2.3.4, respectively.
Lastly, the functioning of the techniques to be used for the experimental investigation are
explained in Section 2.4, with all the noise reduction techniques in Section 2.4.1 and all the
binarization techniques in Section 2.4.2.
7
Figure 2-1 DAR process illustration
2.2 Optical Character Recognition
Optical Character Recognition could be defined simply as the identification of characters on a
document image (Mori et al., 1999:1). There are a handful of different approaches to the
implementation of OCR.
According to Shivakumara et al. (2005:140; 2006:791), an OCR system makes use of four distinct
phases. These are the pre-processing stage, a document layout understanding and segmentation
stage, a feature extraction stage, and a classification stage. On the other hand, Shafait (2009:1)
stated that a typical OCR system comprises three main components. The first is geometric layout
analysis, which is used to locate the text lines in the scanned documents and to identify their
order. The second component is text-line recognition, where the characters in the text lines are
classified into recognized letters of a predefined alphabet. The last component is language
modelling, which attempts to correct OCR errors from the text-line recognition output by using
language specific information. Jung et al. (2004:980) make use of the term ‘text information
extraction’, which is approached in five steps: text detection, text localization, tracking, extraction
and enhancement, and recognition. Another version of this exists where text detection and text
localization are merged into a single phase, and text tracking falls away completely (Zhang et al.,
2013:312). It is important to note, however, that text information extraction aims at the extraction
of text from any type of image, including scene photos, videos, etc., which explains why there is
a tracking step.
All these approaches have more or less the same steps in common. Most of these steps could fit
somewhere into the DAR process (see Figure 2-1). This means that OCR should not be seen as
a step in the DAR process, but rather as the underlying body of the process.

8
Another important topic that relates to OCR is Intelligent Character Recognition (ICR). ICR could
be seen as handwriting recognition, and split up into two categories: off-line and on-line categories
(Zagoris et al., 2010:873).
On-line handwriting recognition makes use of techniques that automatically capture and process
the characters as they are being written (Plamondon & Srihari, 2000:67). This is done by using a
digitizer or an instrumented stylus, which records information about position, velocity, or
acceleration over time.
Off-line handwriting recognition is the optical recognition of handwritten text. An off-line
handwriting recognition system follows more or less the same process as a normal OCR system
(Plamondon & Srihari, 2000:72). The document image is first handed into a pre-processing
module for enhancement, after which it is imported into the segmentation model where each
character is segmented. Segmented characters are then sent into the recognition module for
identification, and the recognized characters are then sent to the post-processing module to be
verified based on its context. The text is then ready to be displayed and used as computer-
understandable text (Zagoris et al., 2010:872).
On-line recognition usually makes use of tablet PCs as input with real-time acquisition and
processing of the written text, whereas scanners are normally used for off-line systems (Marinai,
2008:8).
There are a couple of issues regarding the recognition of handwritten text, which include the
following (Zagoris et al., 2010:872):
The quality of scanned images may not be optimal, which means that pre-processing steps
need to be taken in order to enhance the quality.
Recognition of handwritten text could be challenging because of characters that are
intertwined.
Each person has his/her own unique writing style.
The absence of standard alphabets and the frequent use of unknown fonts make it difficult to
develop a system that is able to recognize historical handwritten text (Vamvakas et al.,
2008:525).
ICR is very challenging due to the cursive and unconstrained nature of handwritten text
(Choudhary et al., 2013:89).

9
The experiments of the study will focus solely on printed text, therefore ICR will not be
implemented. The exploratory study, found in Chapter 4, does, however, investigate the use of
ICR.
2.2.1 History of OCR
When pattern recognition was still in its infancy, most of the people involved were interested in
OCR (Mori et al., 1992:1029). It is stated that in 1929 G.Tauschek obtained a patent on OCR as
the ‘Reading Machine’ in Germany, and in 1933 P.W. Handel obtained a patent in the USA as a
‘Statistical Machine’. These were the first concepts of OCR (Mori et al., 1992:1030). This concept
would remain impossible at the time because of the lack of technology to support it, until the
availability of transistor computers in the 1950s.
In 1956 Kelner and Glauberman made use of a magnetic shift register in order to project two-
dimensional information into one-dimensional information (Mori et al., 1992:1030). This means
that only one line of characters could be scanned at a time by moving either the scanner or the
paper (Cheriet et al., 2007:2). This allowed them to apply template-matching methods by taking
the total sum of the differences between sampled and corresponding values measured.
In 1962 W.J. Hannan created a very sophisticated technology which made use of both electronics
and optical techniques. The machine was successful and Hannan reported that the program could
use the mask-matching technique to accurately recognize the complete English and Russian
fonts (Mori et al., 1992:1031).
New fonts, named OCRA and OCRB, were designed in the 1970s specifically for the purpose of
OCR. The fonts were designed by the American National Standards Institute (ANSI) and the
European Computer Manufacturers Association (ECMA), respectively (Cheriet et al., 2007:2).
These fonts allowed for much higher OCR accuracy rates as opposed to OCR techniques applied
to other fonts and entirely transformed the data-input industry (Schantz, 1982:4).
2.2.2 Development of new techniques
As the research on OCR evolved over the years, people started demanding advances on
handwriting recognition in order to be able to process large quantities of data from various sources
(Cheriet et al., 2007:3). This included addresses written on envelopes, amounts written on checks,
names, identity numbers, values written on invoices and forms, etc.
The advancement of handwriting recognition technology came a relatively long time after normal
OCR on specified fonts (Cheriet et al., 2007:3). This means that handwriting recognition solutions
from the 1970s through to the 1980s made use of characters that had to be written in specific
10
shapes on allocated spaces in order for them to be understood by machines (Cheriet et al.,
2007:3).
2.2.3 Applications
Currently there is a considerable number of practical applications for OCR in the world. Some of
these applications are document analysis, vehicle license plate extraction, technical paper
analysis, object-oriented data compression, translators, video content analysers, industrial part
identification, and so on (Jung et al., 2004:977).
OCR applications can be divided into the following two categories (Marinai, 2008:2):
Business-oriented application – As previously mentioned, the use of paper is prevalent for
the purpose of storing information (Sellen & Harper, 2003:245), as many organizations today
rely heavily on the flow of information. A typical business application is automatic check
processing, which involves text and number recognition as well as signature verification. Other
applications are information extraction from forms and invoices, and automatic document
organization through use of page classification.
User-centred application – User-centred applications put more focus on software tools and
general purpose solutions for the individual. These applications include general purpose OCR
software, recognition of printed music scores, analysis of drawings, such as maps, mobile
device document processing systems, and improved access to digital libraries of historical
documents and academic articles.
2.2.4 Recent trends and movements
With the recent surge in companies requiring better and more accurate OCR technologies there
is a great need for research and progress in the field (Gatos et al., 2014:131). The International
Association for Pattern Recognition (IAPR) is a non-profit organization that aims to develop and
promote pattern recognition and its related branches of engineering and science in order to
stimulate research, development, and the application thereof. Some of the IAPR’s international
conferences and workshops are solely devoted to the rapid advancement of recognition
techniques (Cheriet et al., 2007:3). The most popular ones that relate to this study, are as follows:
ICPR - International Conference on Pattern Recognition: A biennial conference during
which the latest findings on various subjects of pattern recognition are presented. This
includes various techniques, applications, comparisons, optimization methods, etc.
ICDAR – International Conference of Document Analysis and Recognition: This
conference presents the latest research on OCR technologies for the application on
11
Document Analysis and Recognition, with the most prominent subject areas as binarization,
character segmentation, deskewing, noise reduction, ICR techniques, classification systems,
and feature extraction improvement.
DAS - International Workshop on Document Analysis Systems: A biennial conference
that addresses trending research on document analysis systems. The most discussed topics
at DAS include data extraction, document and text classification, document processing
systems, AI applications for OCR, and real-time analysis.
ICFHR- International Conference on Frontiers in Handwriting Recognition: A conference
during which research on various subdisciplines of handwriting recognition and the
implementation thereof is presented. This includes areas of research in on-line and off-line
handwriting recognition, pen-based interface systems, form processing, handwritten-based
digital libraries, and web document access and retrieval.
2.3 Document Analysis and Recognition
Shafait (2009:1) defines the term document image analysis as: “The field of converting paper
documents into an editable electronic representation by performing OCR”. Marinai (2008:1)
provides a full definition as follows: “DAR aims at the automatic extraction of information
presented on paper and initially addressed to human comprehension. The desired output of DAR
systems is usually in a suitable symbolic representation that can subsequently be processed by
computers".
For this study, these two definitions can be combined so that Document Analysis and Recognition
could effectively be seen as the automatic extraction and processing of information presented on
paper. The aim of a DAR system is to extract relevant data from the input that could then be
processed and utilized by a computer program.
DAR involves the use of several classes of science, including image processing, pattern
recognition, natural language processing, artificial intelligence, and database systems (Marinai,
2008:1).
The rest of this section will be used to discuss all the steps of the DAR process as illustrated in
Figure 2-1, p. 7.
2.3.1 Pre-processing
The pre-processing step aims to improve image quality for better recognition results. This is also
known as image enhancement. This step normally includes the following tasks:

12
Geometrical transformations – Deskewing of the image. This will be discussed in
subsection 2.3.1.1, p. 12.
Filtering – There are three main filtering operations applied to the input image. These are
o Noise reduction – Remove grainy, unwanted, salt-and-pepper-like textures from image.
This will be discussed in subsection 2.3.1.2, p. 13.
o Signal enhancement – Improve overall quality of image.
o Binarization – Convert the image from RGB or greyscale to a binary image. This is usually
accomplished by using a thresholding algorithm, which separates the background from
the foreground. This will be discussed in subsection 2.3.1.3, p. 14.
Object boundary detection – Detect object boundaries by making use of methods, such as
the Hough transform.
Thinning – Used to obtain skeletal remnants of objects, which preserves the connectivity
while getting rid of unwanted foreground components.
In a 1974 study, which attempted to compare OCR algorithms by use of simulation, Himmel and
Peasner (1974:239) stated that the purpose of the pre-processing step is to remove noise, fill in
broken strokes, and to handle text-size variation. By comparing this to the purpose of relatively
modern OCR pre-processing steps, it is clear that the pre-processing phase has evolved in order
to attempt to optimize the efficiency of OCR.
The following techniques form part of the pre-processing phase:
2.3.1.1 Skew correction
Skew correction, also known as deskewing or skew detection, is the process that detects the
deviation of the document image’s orientation angle from the horizontal direction (Shafait,
2009:4). This is normally because the document to be scanned is placed on the scanner
incorrectly (Ishitani, 1993:49). Liolios et al. (2002:253) add to this by saying that it could also be
because the document could be stretched in a non-uniform manner due to the inconsistent motor
speed of a scanning or copy machine.
A skew document image will have an adverse effect on document analysis, document
understanding, and character segmentation (Ishitani, 1993:49). This is backed up by
Shivakumara et al. (2006:791) who claim that most of the OCR stages will be ineffective when

13
applied to a skew document image. This led to the development of a couple of skew detection
techniques.
Skew correction is important for several reasons (Bloomberg et al., 1995:303). Firstly, it improves
text recognition accuracy by making text easier to understand by character recognition systems.
Secondly, it simplifies interpretation of page layout by making text lines and text columns easier
to identify. It also improves baseline determination, and the overall visual appearance of the
document.
For a skew correction system to be effective, it should be able to operate quickly regardless of
the content of the image. It should consistently deskew images accurately with less than 0.1°
error. In addition, segmentation of the image should not be necessary, skews should be able to
be adjusted locally or globally, and a confidence measure or probable error estimate should be
produced. Lastly, graphics within the image should not affect the results (Bloomberg et al.,
1995:302).
2.3.1.2 Noise reduction
Noise reduction is the process, which attempts to remove noisy pixels from a document image,
which were caused by the scanning or binarization process (Shafait, 2009:4). Many types of noise
could occur after the binarization of an image (Dassanayake et al., 2013:2). Some of the noise
types dealt with in this study are
Gaussian: Gaussian noise is statistical noise which is additive in nature. This noise has a
probability density function (PDF) which makes use of the Gaussian distribution. The PDF of
a Gaussian random variable, 𝓏, is given by:
𝑝(𝓏) =1
√2𝜋𝜎𝑒−(𝓏−𝜇)2/2𝜎2
( 1 )
Where 𝓏 is the intensity, 𝜇 is the average of 𝓏, and 𝜎 is the standard deviation (Gonzalez &
Woods, 2006:314).
Poisson: Poisson noise, or shot noise, is a type of digital noise that results when the amount
of energy carrying particles in an optical device is so little that it noticeably fluctuates
measurements (Patidar & Nagawat, 2010:47). Poisson noise is generated from the image
data instead of being added artificially. The noise generated has a root mean square value
proportional to the square root intensity of the image. Poisson noise corrupts the image by
various proportions based on the input pixel values (Verma & Ali, 2013:618).

14
Salt-and-pepper: This is also known as impulse noise. It consists of black and white dots that
appear randomly throughout the image. This type of noise can be caused by dust particles in
the scanner or by overheated components that are malfunctioning (Verma & Ali, 2013:617).
Speckle: Speckle noise is caused by the coherent processing of backscattered signals from
multiple distributed targets (Verma & Ali, 2013:618). Speckle noise is multiplicatively added
to an image using the following equation:
𝐽 = 𝐼 + 𝑛 ∗ 𝐼 ( 2 )
Where 𝐼 is the original image, and 𝑛 is uniformly distributed random noise with 0 mean and a
specified variance v.
The descriptions of various noise reduction methods that are used during this study are further
discussed in Section 2.4.1, p. 19.
2.3.1.3 Binarization
Binarization is the process of converting a greyscale document image into a bi-level
representation, i.e. from where each pixel is represented by a greyscale value of 0 to 255, it is
now represented by either a 0 or a 1 (Shafait, 2009:4). Binarization is one of the main processes
in OCR and it should fundamentally provide the user with the foreground text in black, and the
noisy background in white (Khurshid et al., 2009:72). Like most image processing methods, some
binarization methods might work better for some types of document while they provide inaccurate
results for other types.
The descriptions of various binarization methods that are used during this study are further
discussed in Section 2.4.2, p. 22.
2.3.2 Layout analysis
Also referred to as object segmentation, this component deals with the identification of objects
within an input document. This is done by making use of word segmentation with methods, such
as morphological processing and connected components clustering. Morphological processing
deals with the extraction of useful components within an image. Connected components
clustering is a morphological processing technique where all the pixels of the same type that are
connected to each other are grouped together.
Layout analysis is performed to categorize objects within the document image into homogeneous
content regions with their own meanings (Marinai, 2008:6). Gupta et al. (2006:58) state that
document layout analysis is said to be the most crucial step in the DAR process, and define it as

15
“the function of separating text, graphics, and images, and then extracting isolated text blocks
(layout objects) such as titles, paraphrase, headers, footers, and captions“.
In order to build a comprehensive layout analysis system, the following should be taken into
consideration (Ishitani, 1997:45):
Pages could contain a combination of text, mathematical expressions, images, graphics,
charts, and tables.
Text within a page may be any language, font style, or character size. A combination of this
can also occur.
A document can contain both horizontal and vertical text areas.
Documents have a complicated and irregular layout structure.
The extraction of information in text from documents with various formats is very challenging
because the documents do not have precisely the same formats. Templates are generally format
specific and systems are not really designed to allow the users to generate and input their own
templates easily. In addition this normally requires a great deal of labour (Gupta et al., 2006:58).
There are two steps to layout analysis, namely physical layout analysis and logical layout analysis.
Physical layout analysis is concerned with the identification of the geometric page structure, and
logical layout analysis is concerned with the assignment of labels and meaning to regions
identified during the physical layout analysis (Marinai, 2008:6).
2.3.2.1 Physical layout analysis
Two main categories of image processing techniques are used for the physical layout analysis of
a document. These are as follows (Marinai, 2008:6):
1. Pixel classification – For each pixel in the image, a label is given based on the pixel’s colour
and that of its neighbouring pixels. The regions are then extracted one by one by removing
small elements which could be seen as noise, merging similar neighbouring regions, and then
identifying connected components in the resulting image.
2. Region-based segmentation – There are two approaches to region-based segmentation;
top-down and bottom-up. Top-down approaches work by segmenting the document from its
largest components down to its smaller subcomponents. Bottom-up approaches work by
merging small objects within the image based on the positioning of their connected
components.

16
2.3.2.2 Logical layout analysis
As previously stated, logical layout analysis is concerned with assigning labels and meanings to
regions identified during physical layout analysis. Features that have to be considered during this
phase are the size of regions, mutual positions, and textual information, such as predominant
font, character size, and spacing (Marinai, 2008:7).
According to Nagy et al. (1992:10), physical layout analysis and logical layout analysis can be
performed at the same time. This works by assigning regions labels and meanings right after they
are identified. In contrast, Marinai (2008:7) claims that this is not feasible because most of the
time the classes can only be defined after analysing regions’ positions in relation to the other
objects in the page, or after analysing the content.
2.3.3 Text recognition
This step is essentially known as the OCR phase. It is concerned with the conversion of printed
or handwritten text to a machine-understandable format, usually ASCII or Unicode (Marinai,
2008:8).
The text recognition process can be broken down into two main categories, namely segmentation,
also known as text extraction, being the steps taken in order to accurately segment text
characters, and classification, in which a feature extraction model and a supervised classifier is
used for the classification of sets of characters.
2.3.3.1 Segmentation
Choudhary et al. (2013:88) claim that character segmentation is the most important step in the
OCR process and that the algorithm selected for the segmentation of characters has a major
influence on the accuracy of the system. This is the process that identifies text lines in a document
image in relation to the columnar structure (Shafait et al., 2006:368). Image enhancement pre-
processing methods could also be included in this step (Marinai, 2008:8).
The properties of text in images are tabulated below in Table 2-1.
Table 2-1 Properties of text in images (Jung et al., 2004:980)
Property Variants or sub-classes
Geometry
Size Regularity in size of text
Horizontal/vertical
Alignment Straight line with skew (implies vertical direction)
Curves
Inter-character distance 3D perspective distortion
Aggregation of characters with uniform distance

17
Colour
Grey
Colour (monochrome, polychrome)
Static
Motion
Linear movement
2D rigid constrained movement
3D rigid constrained movement
Free movement
Edge Strong edges (contrast) at text boundaries
Compression Un-compressed image
JPEG, MPEG-compressed image
Zhang et al. (2013:310) back these properties up by stating that natural scene images can vary
greatly in respect of font size, text alignment and geometric distortion, colours of characters,
definition of edges, and perspective distortion as a result of the angle at which the image is
captured.
Text could appear in a large variety of scenes, and a comprehensive text extraction system would
be able to recognize text in all of them (Jung et al., 2004:977). These would include single-column
text documents, two-column text documents, electrical drawings with text, multi-colour document
images, images with captioned text, and scene text images.
According to Zhang et al. (2013:312), there are four main method types used for detection and
localization. These are
1. Edge-based method – Edges could be used for the detection of characters. This is normally
done by using edge detection on an image, followed by morphological operations in order to
extract the text from the image and to remove all the unwanted pixels. A common problem
with edge-based methods, however, is that it is difficult to accurately detect edges that are
under a shadow or highlighted. Ye et al. (2007:504) proposed an edge-based extraction
technique that makes use of colour image filtering methods where the rims would initially be
detected and then the contents would be analysed.
2. Texture-based method – This approach is based on the assumption that the text within the
image comprises distinct textual properties that separate themselves from the rest of the
image. Texture analysis methods such as Gaussian filtering, wavelet decomposition, Fourier
transform, discrete cosine transform, and local binary pattern are used. The problem with this
approach is that its speed is somewhat slow and its accuracy is dependent to the text
alignment orientation.
3. Connected component-based method – This is a bottom-up approach where each pixel is
connected to its neighbours of the same type in order to form components of the same type
of pixel until all the regions in the image are identified. A geometrical analysis is sometimes

18
used later in order to identify the text components and to group them into localized text
regions. Zagoris et al. (2010:873) explains how words are segmented by using the connected
components of the pixels in the text image by getting rid of all the connected components that
are smaller than a predetermined size. This also filters out accents, noise, and punctuation
marks. Alternatively, after this is done, the connected components are expanded and merged
in order to form words.
4. Stroke-based method – Strokes are a basic element of text strings that make available
concrete features for text detection in natural scenes. Text can be shown as a mixture of
stroke components with various orientations, and features of text can be extracted from
combinations and distributions of the stroke components.
Many researchers have also developed new approaches that make use of a combination of
methods.
2.3.3.2 Classification
The methods used for classification include template matching, structural analysis, and feature
analysis. It is said that classification methods can be divided into the following two categories (Liu
& Fujisawa, 2008:140):
Feature-vector-based methods – These methods are prevalent for the off-line recognition
of characters because of their ease of implementation and minimal computational difficulty.
Structural methods – This method could easily extract a feature vector from a document
image, but it struggles with the extraction of components or strokes.
2.3.4 Post-processing
Post-processing is used to check the results of the classification on the basis of contextual
information. Contextual processing is used to evaluate the results of the recognized sets based
on contextual information such as domain-specific dictionaries.
Liu and Fujisawa (2008:144) proposed some statistical techniques which, when applied to the
patterns recognised, could be used to reject characters with low confidence. These techniques
are elaborate density estimation, one-class classification, hybrid statistical/discriminative learning,
and multiple classifier combination. Two other techniques frequently used for post-processing
are:
1. Dictionary support – Words that contain characters that could be represented by more than
one character code are run through the dictionary and the correct word is provided. The
19
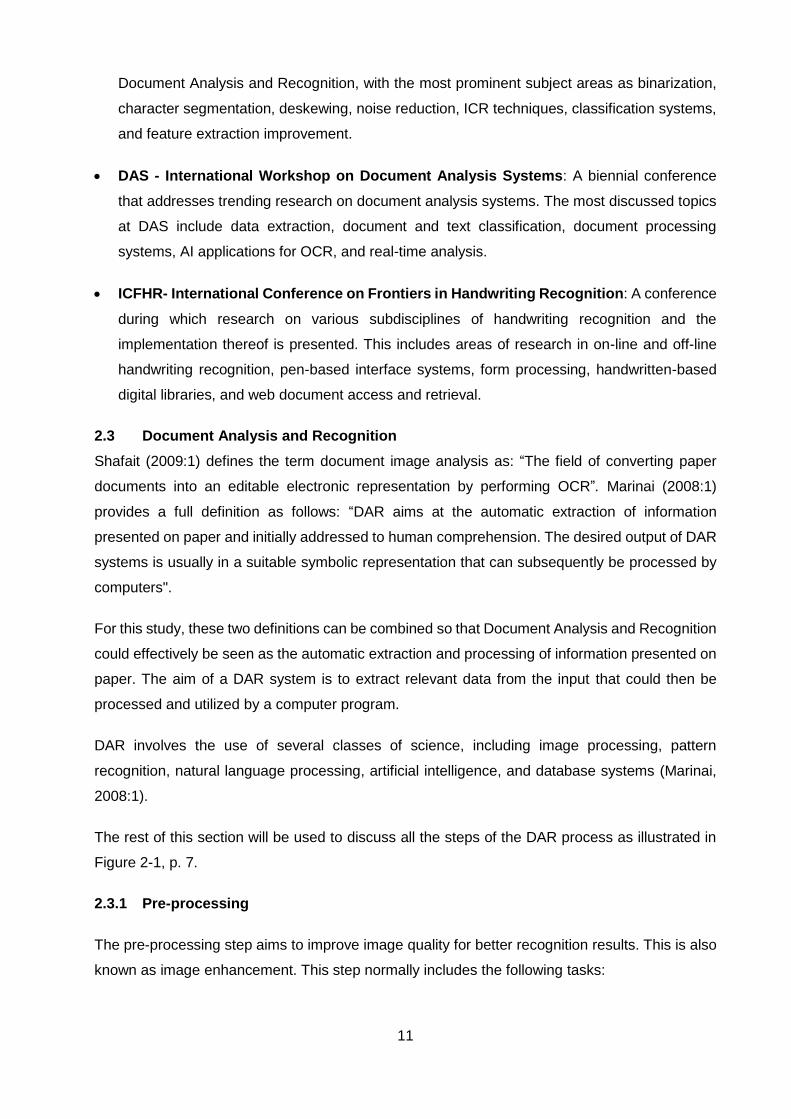
following table, Table 2-2, shows how multiple characters are recognized, and by using
dictionary support, the correct word can be identified.
Table 2-2 Dictionary support application
Character possibilities
I
l
1
|
m
rn a
g
9 e
Actual text I m a g e
The word could be run through the dictionary and the only matching word would be ‘Image’.
2. Manual-user input – Many OCR systems provide the user with the opportunity to verify the
data by reviewing that the correct character has been recognized for each character that is
represented by more than one character code. Sometimes a spellchecker is also used and
the user is required to verify that the detected misspelled words were recognized correctly.
It is important to evaluate the quality of all the processes involved in DAR in order to optimize
each step (Rabeux et al., 2014:125). The resulting accuracy of any processing technique, such
as binarization, is directly affected by the overall quality of the document image to be processed.
2.4 Techniques
The purpose of this section is to provide more details on the functioning of the techniques used
throughout this study. The rest of this section is divided into noise reduction and binarization
techniques. The noise reduction techniques discussed are median filter, average filter, weighted
smoothing linear filter, Gaussian filter, and Wiener filter. The binarization techniques discussed
are global threshold, Otsu threshold, Niblack, and Sauvola.
2.4.1 Noise reduction
Noise reduction has two main goals; the first is to eliminate noise from image, and the second is
to preserve the important features of the image (Tang et al., 2007:1299).
2.4.1.1 Median filter
Gonzalez and Woods (2006:156) explain that a median, 𝜉, of a set of values is the value in the
middle when the set is sorted from smallest to largest, such that half of the values are less than
or equal to the median and the other half are greater than or equal to the median.
To apply a median filter to a neighbourhood, the following has to be done:
1. Sort the pixels in a 1-D array from smallest to largest based on their intensity.
20
2. Determine the median.
3. Assign the median to the corresponding pixel.
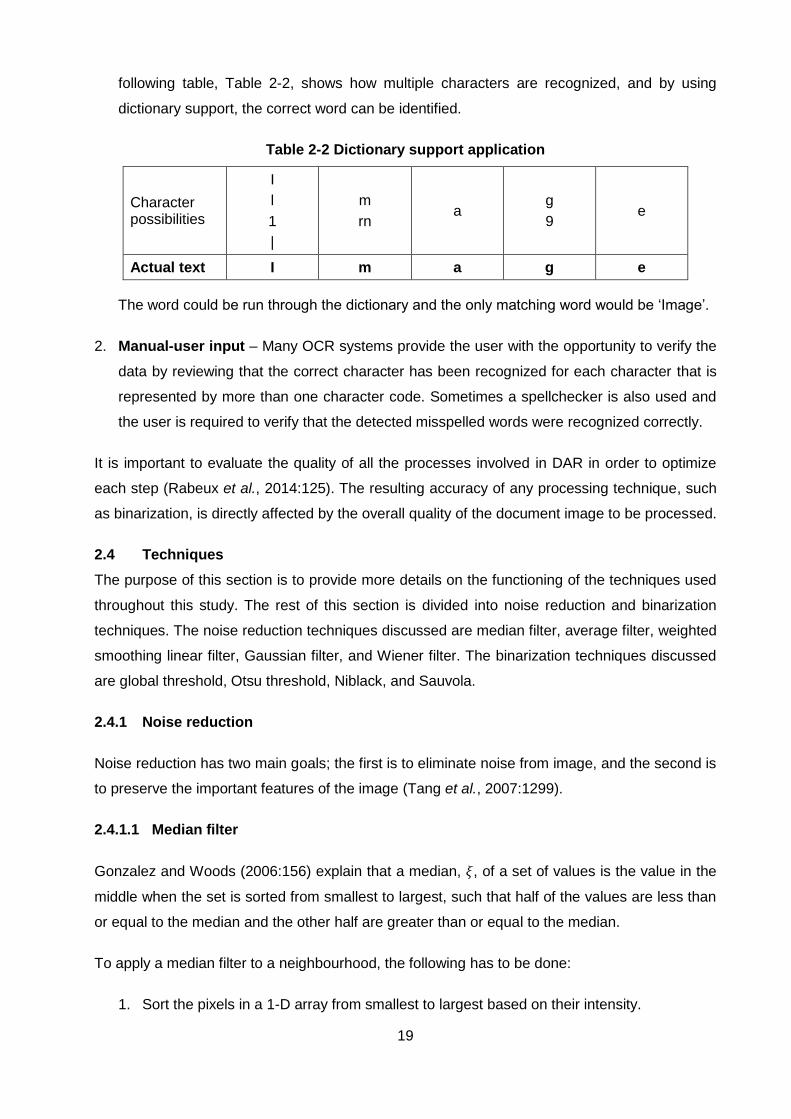
Figure 2-2 illustrates the results obtained (right) when applying a median filter of size 3 × 3 to an
image that is corrupted by salt-and-pepper noise (left).
Figure 2-2 Median filter example (Gonzalez & Woods, 2006:157)
2.4.1.2 Average filter
An average filter is also known as a smoothing linear filter or mean filter. This filter works by
setting the intensity value of a pixel to the average intensity of its neighbouring pixels. This is the
most obvious technique used to handle noise reduction.
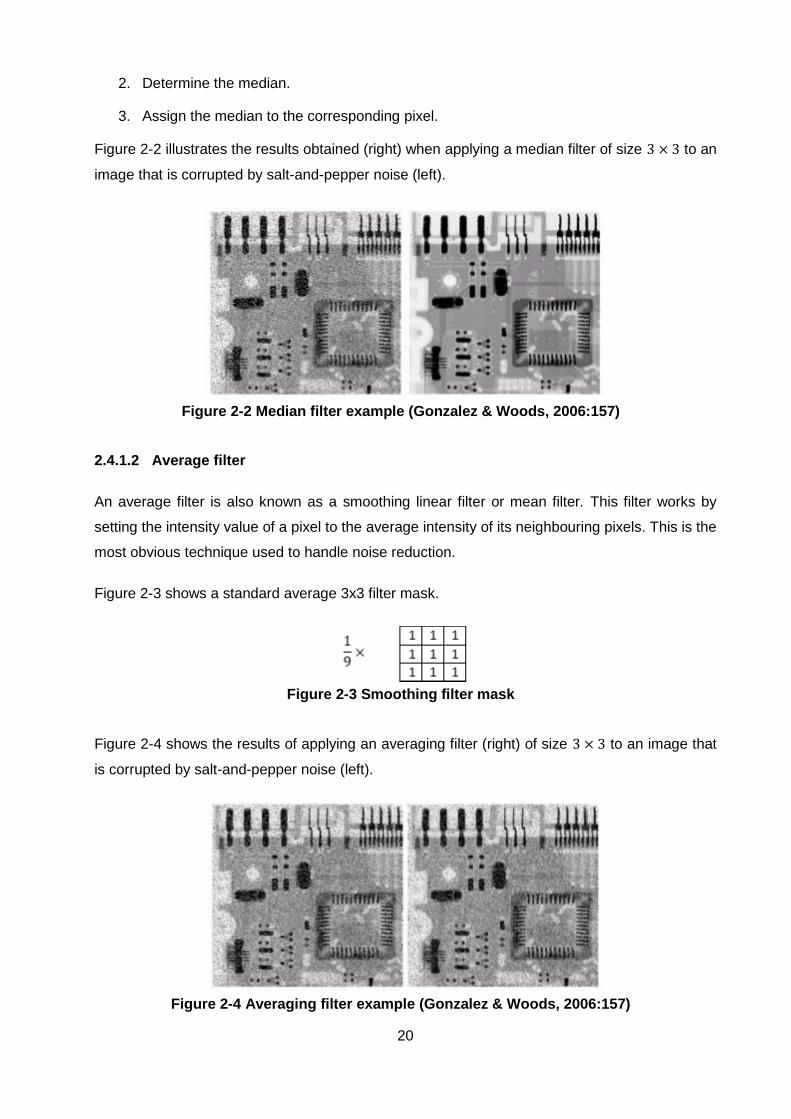
Figure 2-3 shows a standard average 3x3 filter mask.
Figure 2-3 Smoothing filter mask
Figure 2-4 shows the results of applying an averaging filter (right) of size 3 × 3 to an image that
is corrupted by salt-and-pepper noise (left).
Figure 2-4 Averaging filter example (Gonzalez & Woods, 2006:157)

21
2.4.1.3 Weighted smoothing linear filter
The downside to a standard average filter is that it causes the resulting image to be blurred. This
problem can be addressed by using a weighted average mask where certain pixels are seen as
more important than others.
Figure 2-5 shows a weighted smoothing 3x3 filter mask where the pixel in the middle has the
highest importance, thus preserving the edges of the original image.
Figure 2-5 Weighted smoothing filter mask
2.4.1.4 Gaussian filter
A Gaussian filter, also known as Gaussian blur or Gaussian smoothing is used to remove high
frequency components within an image by blurring the image with a Gaussian function.
The Gaussian filter works in more or less the same way as the weighted smoothing filter, except
that the weight of the pixels is based on their distance to the centre pixel of the selected
neighbourhood. These weights are obtained using the following equation:
𝑓(𝑥, 𝑦) =1
2𝜋𝜎2𝑒
−𝑥2+𝑦2
2𝜎2 ( 3 )
The sigma parameter, 𝜎, can be increased to lower the decay from the peak. The influence of
different values of 𝜎 is illustrated in Figure 2-6.
Figure 2-6 Sigma influence on peak

22
2.4.1.5 Wiener filter
The Wiener filter is applied by using the following equation (Patidar & Nagawat, 2010:46):
𝐺(𝑢, 𝑣) =𝐻∗(𝑢, 𝑣)
|𝐻(𝑢, 𝑣)|2 +𝑃𝑛(𝑢. 𝑣)𝑃𝑠(𝑢, 𝑣)
( 4 )
Where
𝐻(𝑢, 𝑣) = Degradation function
𝐻∗(𝑢, 𝑣) = Complex conjugate of degradation function
𝑃𝑛(𝑢, 𝑣) = Power spectral density of noise
𝑃𝑠(𝑢, 𝑣) = Power spectral density of un-degraded noise
The term 𝑃𝑛/𝑃𝑠 can be interpreted as the reciprocal of the signal-to-noise ratio.
2.4.2 Binarization
Binarization techniques can largely be divided into the following two categories (Khurshid et al.,
2009:73):
Global thresholding – This is used when there is a clear distinction between the text and the
background throughout the entire image (Gonzalez & Woods, 2006:741). A single intensity
threshold is applied to all the pixels in the image (Khurshid et al., 2009:73). Some concerns
with global thresholding techniques are that irregular illumination or noise may cause the
binarization to be inaccurate, with reduced performance for poor quality images.
Local thresholding – This is where a threshold is calculated for every pixel in the image
based on various properties of the pixels in the surrounding neighbourhood. Local
thresholding methods are typically more accurate on low quality images (Khurshid et al.,
2009:73).
2.4.2.1 Global threshold 128
A simple, but often ineffective global fixed threshold could be used where all the pixels with
intensity values below 128 are converted to a 0, and all pixels with intensity values equal to or
above 128 are converted to a 1 (Gupta et al., 2007:389). A more effective, iterative approach is
presented by (Gonzalez & Woods, 2006:741):
1. Select an initial estimate for the global threshold 𝑇.
2. Segment the image using 𝑇 in the following equation.

23
𝑔(𝑥, 𝑦) = {1 𝑖𝑓 𝑓(𝑥, 𝑦) > 𝑇
0 𝑖𝑓 𝑓(𝑥, 𝑦) ≤ 𝑇 ( 5 )
This will produce two groups of pixels: 𝐺1 consisting of all pixels with intensity values > 𝑇,
and 𝐺2 consisting of pixels with values ≤ 𝑇.
3. Compute the average (mean) intensity values 𝑚1 and 𝑚2 for the pixels in 𝐺1 and 𝐺2, respectively.
4. Compute a new threshold value
𝑇 =1
2(𝑚1 + 𝑚2) ( 6 )
5. Repeat Steps 2 through 4 until the difference between values of 𝑇 in successive iteration
is smaller than a predefined parameter ∆𝑇.
A parameter ∆𝑇 is used to regulate the number of iterations needed when processing speed is
important. Figure 2-7 illustrates an original input image of a finger print (left) and its corresponding
intensity histogram (middle), and the results of this global threshold method applied to it (right).
Figure 2-7 Application of global threshold (Gonzalez & Woods, 2006:743)
2.4.2.2 Otsu threshold
This method is also known as an optimum global thresholding method because it is concerned
with finding the global threshold that minimizes the interclass variance of the resulting black and
white pixels (Otsu, 1979:62; Zagoris et al., 2010:873).
Gonzalez and Woods (2006:747) explains Otsu’s algorithm as follows;
1. Compute the normalized histogram of the input image. Denote the components of the histogram by 𝑝𝑖 , 𝑖 = 0,1,2, … , 𝐿 − 1
2. Compute the cumulative sums, 𝑃1(𝑘), for 𝑘 = 0,1,2, … , 𝐿 − 1, using the following equation:

24
𝑃1(𝑘) = ∑ 𝑃𝑖
𝑘
𝑖=0
( 7 )
3. Compute the cumulative means, 𝑚(𝑘), for 𝑘 = 0,1,2, … , 𝐿 − 1, using the following equation:
𝑚(𝑘) = ∑ 𝑖𝑃𝑖
𝑘
𝑖=0
( 8 )
4. Compute the global intensity mean, 𝑚𝐺, using the following equation:
𝑚𝐺 = ∑ 𝑖𝑃𝑖
𝐿−1
𝑖=1
( 9 )
5. Compute the between-class variance, 𝜎𝐵2(𝑘), for 𝑘 − 0,1,2, … , 𝐿 − 1, using the following
equation:
𝜎𝐵2(𝑘) =
[𝑚𝐺𝑃1(𝑘) − 𝑚(𝑘)]2
𝑃1(𝑘)[1 − 𝑃1(𝑘)] ( 10 )
6. Obtain the Otsu threshold, 𝑘*, as the value of 𝑘 for which 𝜎𝐵2(𝑘) is maximum. If the
maximum is not unique, obtain 𝑘* by averaging the values of 𝑘 corresponding to the various maxima detected.
7. Obtain the separability measure, 𝜂*, by evaluating the following equation at 𝑘 = 𝑘*
𝜂(𝑘) =𝜎𝐵
2(𝑘)
𝜎𝐺2 ( 11 )
Figure 2-8 illustrates an original input image (top left) with its histogram (top right) as well as the
application of a global threshold technique (bottom left) and the application of the Otsu threshold
(bottom right).
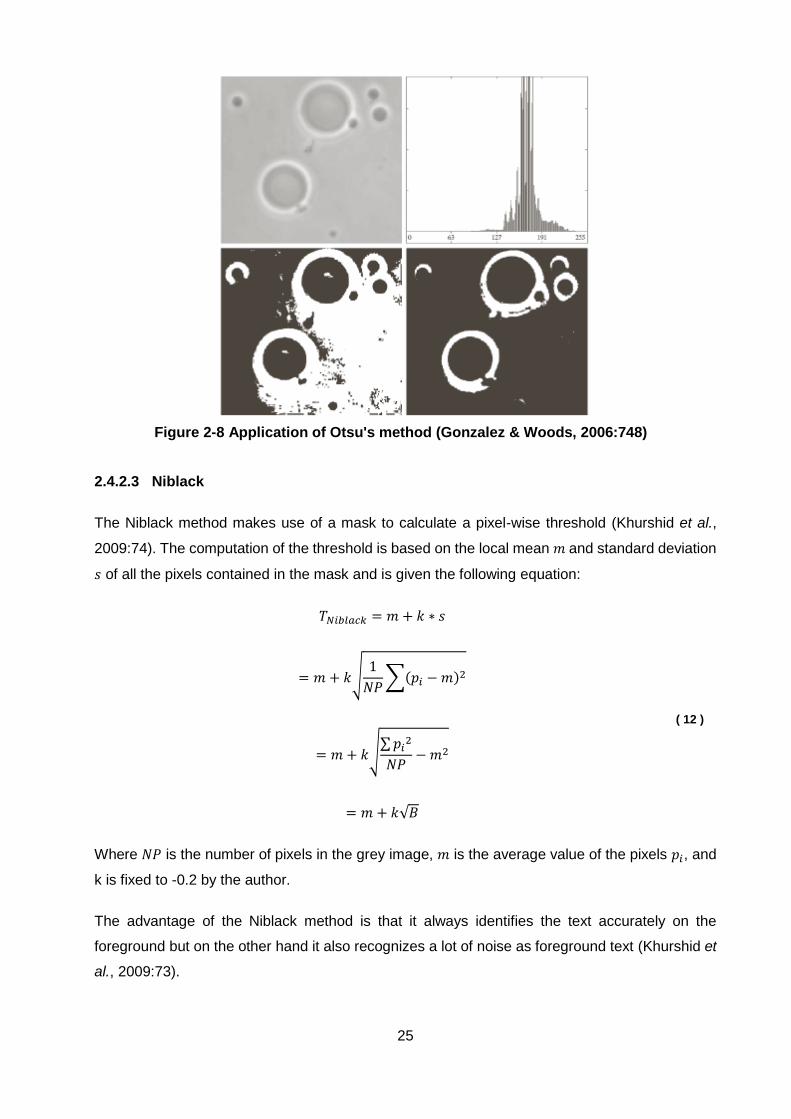
25
Figure 2-8 Application of Otsu's method (Gonzalez & Woods, 2006:748)
2.4.2.3 Niblack
The Niblack method makes use of a mask to calculate a pixel-wise threshold (Khurshid et al.,
2009:74). The computation of the threshold is based on the local mean 𝑚 and standard deviation
𝑠 of all the pixels contained in the mask and is given the following equation:
𝑇𝑁𝑖𝑏𝑙𝑎𝑐𝑘 = 𝑚 + 𝑘 ∗ 𝑠
= 𝑚 + 𝑘√1
𝑁𝑃∑(𝑝𝑖 − 𝑚)2
= 𝑚 + 𝑘√∑ 𝑝𝑖
2
𝑁𝑃− 𝑚2
= 𝑚 + 𝑘√𝐵
( 12 )
Where 𝑁𝑃 is the number of pixels in the grey image, 𝑚 is the average value of the pixels 𝑝𝑖, and
k is fixed to -0.2 by the author.
The advantage of the Niblack method is that it always identifies the text accurately on the
foreground but on the other hand it also recognizes a lot of noise as foreground text (Khurshid et
al., 2009:73).
26
2.4.2.4 Sauvola
Sauvola is also named the Sauvola-Niblack method. This makes use of Niblack’s binarization in
order to achieve the most accurate OCR on handwritten numbers. This is done by segmenting
the image into adjacent non-overlapping blocks and then thresholding each pixel based on the
local mean and local standard deviation. This method is seen as an evolved Niblack method (He
et al., 2005:541).
𝑇𝑆𝑎𝑢𝑣𝑜𝑙𝑎 = 𝑚 ∗ (1 − 𝑘 ∗ (1 −𝑆
𝑅)) ( 13 )
Where 𝑘 is set to 0.5 and 𝑅 to 128.
2.5 Summary
In this chapter, a number of technologies, techniques, and processes were discussed. The
chapter started off by explaining the complexity of the task of converting a physical document to
a machine-understandable document. It was then explained that OCR is the process in which
characters in a document image are identified. The history of OCR, its development, applications,
and recent trends and movement were then discussed.
It was then explained that DAR is the automatic extraction and processing of information
presented on paper, and that OCR is the main driving force of this process. The four steps of the
DAR process were explained. The first step, pre-processing, is used for improving the quality of
the image for better recognition accuracy and involves skew correction, noise reduction, and
binarization. The second step, layout analysis, is used to segment objects within the image. There
are two types of layout analysis; physical layout analysis, which is concerned with the geometric
page structure, and logical layout analysis, which is concerned with adding meaning to the
identified regions. The third step is character recognition, which is where OCR takes place. It
involves the segmentation of individual characters, and the classification of those characters. The
last step, post-processing makes use of contextual information to evaluate and modify the
recognized characters in order to improve recognition performance.
Lastly, the application of the techniques to be used in this study was explained. This included the
explanation of the noise reduction techniques; median filter, average filter, weighted smoothing
filter, Gaussian filter, and Wiener filter. This was followed by the explanation of binarization
techniques; global threshold 128, Otsu threshold, Niblack, and Sauvola.
The following chapter will describe how the research study was approached with regard to
philosophical paradigm, research strategy, data-generation techniques, and data-analysis
techniques.
27
CHAPTER 3 – RESEARCH METHOD
3.1 Introduction
Oates (2006:5) explains that research is a manner of thinking that leads to the creation of new
knowledge that satisfies the users of the research. This is done by identifying a problem, gathering
data from multiple accurate sources, properly analysing that data, interpreting it, drawing
conclusions based on the evidence, and professionally presenting the results. There are several
categories of aspects which have to be taken into account for any research project. These are
known as the six P’s of research (Oates, 2006:11-12):
Purpose - Research should have a good purpose, a valid reason for doing the research which
explains why it is important or useful. The purpose is normally captured in the research
question and the objectives of the research.
Paradigm - A philosophical paradigm is a shared way of thinking on which the research has
to be based. A research paradigm is concerned with the nature of the research question to be
answered as well as the manner in which the answer is obtained.
Participants - The participants are the people who are directly or indirectly involved in the
execution of the research. This includes the researcher, the research supervisor, the people
being studied, etc.
Process - A research project should be executed according to a certain process, which
normally involves the following:
o Identification of research topic(s)
o Establishment of a conceptual framework
o Selection and use of a research strategy and data-generation methods
o Analysis of data and the drawing of conclusions
Products - Research should produce something which ultimately contributes to the applied
knowledge area.
Presentation - The research has to be disseminated and professionally explained to others.
This could be done by writing it in a thesis, presenting a conference paper to an audience, or
by demonstrating a computer-based product.
28
For this research project, two separate studies will be conducted. Firstly, an exploratory study will
be used to gather background information on the DAR industry in order to be able to address the
research question more effectively. This information will then guide the main study, which is an
experimental investigation. This chapter will address the research methods used for these studies
according to Oates’ six P’s of research. The purpose of these studies will be explained in Section
3.2. The research paradigms used will be discussed in Section 3.3. Following that, the participants
will be discussed in Section 3.4 and the research process for each of the studies will be discussed
in Section 3.5.1 for the exploratory study, and Section 3.5.2 for the experimental investigation.
Lastly, the products and presentation of these studies will be addressed in Section 3.6.
3.2 Purpose
To understand the purpose of this research, the research objectives, as discussed in Chapter 1,
will be revisited. The objectives can be divided into the following two categories:
Exploratory study – The purpose of this part of the study is to understand the functioning of
the current DAR industry in South Africa. This research will make use of case studies in order
to study the DAR industry in South Africa to determine what the industry is like, how business
is done in the industry, what software is used and how it is used in the industry, and any other
relevant information regarding the industry. This study will also be used to determine what
makes invoice documents unique from other document types.
Experimental investigation – The purpose of this part of the study is to compare pre-
processing techniques to each other in order to find the best techniques to be used for DAR
on invoice documents. In order to accomplish this, the different techniques used for pre-
processing first have to be identified. This will allow the researcher to implement the
techniques on the test images in order to compare their recognition performance. The next
step is to set up a platform in which different techniques can be compared to one another in
terms of recognition accuracy, specifically for the recognition of invoices. Once this is done,
the techniques can be compared to each other to measure their performance. The results can
then be analysed and conclusions can be drawn. The techniques that would provide the
optimal recognition accuracy for DAR can then be suggested.
3.3 Paradigm
Oates (2006:13) defines a paradigm as “a pattern or model or shared way of thinking”. Patton
(1990:37) elaborates upon this by saying that a paradigm is “a worldview, a general perspective,
a way of breaking down the complexity of the real world”. Another definition states that a paradigm
is a revelatory framework guided by "a set of beliefs and feelings about the world and how it
should be understood and studied" (Guba, 1990:17). Grbich (2013:5) defines it as “worldviews of
beliefs, values, and methods for collecting and interpreting data”.

29
The above-mentioned beliefs can be categorized into the following (Denzin & Lincoln, 2005:163):
Ontology: An individual’s views about the nature of our world (Oates, 2006:284).
Epistemology: “A broad and high-level outline of the reasoning process by which a school
of thought performs its logical and empirical work” (Lee, 2004:5). Oates (2006:282) states it
simply as the “ways we can acquire knowledge about our world”.
Methodology: Process of how people know the world, or learn information about it.
When all this information is combined, it is possible to develop a definition for a philosophical
research paradigm that will be applicable for this research.
For this study, a paradigm will be considered as a shared way of thinking based on a worldview,
which provides us with methods that allow us to break down the complexity of the real world in
order to study and understand it.
In this research study, two philosophical paradigms will be used independently of each other. This
is because the exploratory study will be conducted first, using the interpretive paradigm. Following
that, the experimental investigation will be executed using the positivistic paradigm. Hence, a
mixed methods approach will be taken.
Mixed methods research was brought forward by a need for mixing methods in order to optimize
their strengths and neutralize their weaknesses (Jick, 1979:604).
In order to understand the functioning of this approach, consider Figure 3-1. All the investigations
make use of different research methods. The places where these areas overlap represent
resulting information that concurs from more than one investigation. This area of knowledge is
known as the apparent truth, as the results were proved accurate by all the investigations
involved.
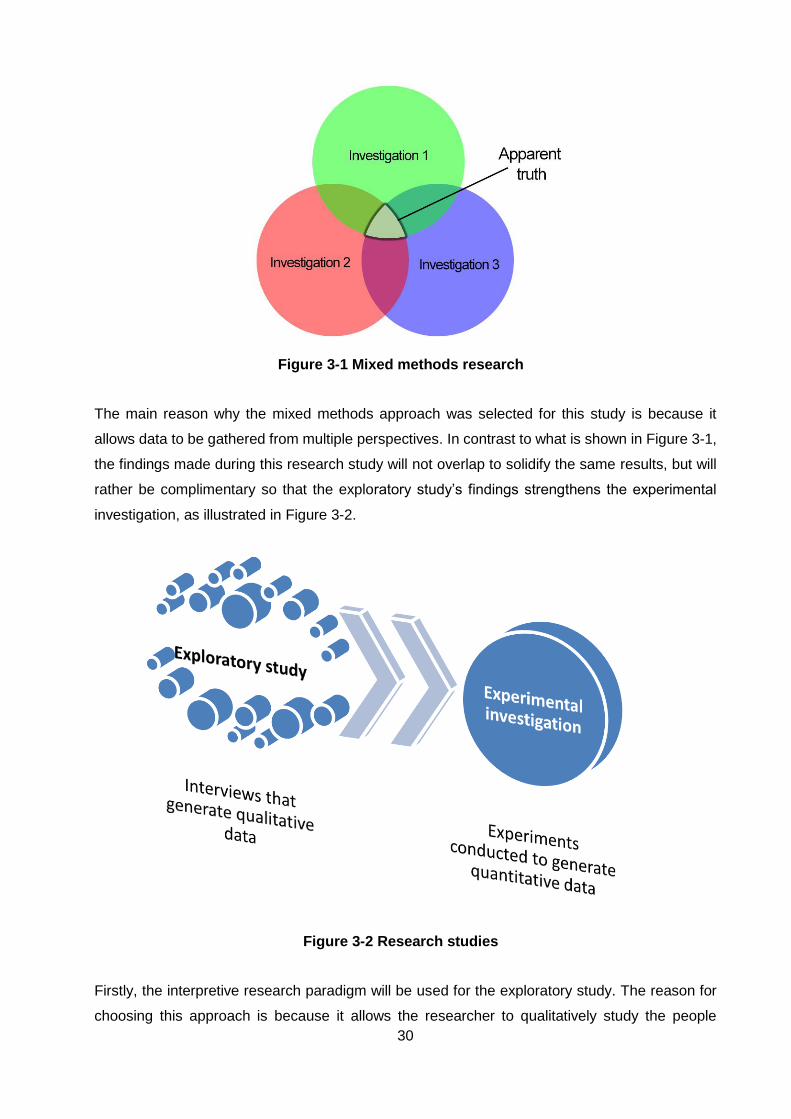
30
Figure 3-1 Mixed methods research
The main reason why the mixed methods approach was selected for this study is because it
allows data to be gathered from multiple perspectives. In contrast to what is shown in Figure 3-1,
the findings made during this research study will not overlap to solidify the same results, but will
rather be complimentary so that the exploratory study’s findings strengthens the experimental
investigation, as illustrated in Figure 3-2.
Figure 3-2 Research studies
Firstly, the interpretive research paradigm will be used for the exploratory study. The reason for
choosing this approach is because it allows the researcher to qualitatively study the people

31
involved in the DAR industry. The research data is based on information provided by people,
rather than by physical measurements. This will also allow the researcher to immerse himself in
the subject in order to document the gathered data as effectively as possible. The aim is for the
findings of this study to be transferable in the sense that some generalizations could be made so
that the reader is able to judge for himself/herself whether the research applies to his/her situation
or not.
One factor to be concerned about when using this paradigm is the trustworthiness of the
interviewees since some of them may not know what they are talking about. This will be addressed
by determining the position and relevant experience of the interviewee, and basing the reliability
of the data on that.
A few matters that will be kept in mind while using the interpretive paradigm are (Oates, 2006:292)
Multiple subjective realities – There is no single version of the truth. What people perceive
to be real is only a construction of their minds, either individually or in a group. Therefore,
none of the raw data will be considered as facts. Conclusions will only be drawn from the
processed data.
Dynamic, socially constructed meaning – An individual’s or a group’s reality can be
retrieved and transited to others. People are able to explain the reality of something but it will
still be based on their own social construction thereof. Thus, the researcher will bear in mind
that the interviewees’ opinions are based on socially constructed meanings from their previous
experiences on the subject.
Researcher reflexivity – Researchers are not neutral. Researchers’ assumptions, beliefs,
values, and actions will influence the research process and affect the situation. It is important
for the researcher to be aware of the impact that the researcher has on the data gathered.
Interviewees may not want to tell the whole truth because releasing vital information might
possibly make them vulnerable.
Study of people in their natural social settings – Interpretive research is aimed at studying
people in their natural worlds, and not in an artificial setting. The researcher has to study the
participant from the participant’s perspective in his/her natural world without forcing his
outsider perspective or expectation onto the situation.
Qualitative data analysis – The data analysed is qualitative and is gathered from the words
people use, metaphors they employ, and images they construct.

32
Multiple interpretations – Researchers should not expect to arrive at one fixed explanation
of what has occurred in the study. Instead, multiple possible explanations will be provided as
discussions and explanations.
Once the functioning of the industry is understood, the experimental investigation can commence.
This part of the research will focus on quantitative measurements of results from experiments,
thus it will be grounded in the positivistic paradigm. This means that this study will make use of
the three key techniques of positivism (Oates, 2006:285):
Reductionism – This is the process of breaking complex things down into smaller, simpler
units, which are easier to study. Through the experiments, the researcher will be able to study
the techniques by looking at the effects they have on the image, resulting text, and their
performance. This could provide clarity on how the techniques function and why they function
the way they do.
Repeatability – To be absolutely sure that the results are accurate and true, the experiment
may be repeated several times in order to ensure that the results obtained have not been
influenced by researchers, malfunctioning equipment, incorrect measurements or other
circumstances. The experiments will be repeated at least twice in order to ensure their
repeatability. In addition to this, the results will be thoroughly analysed to search for any sign
of malfunction in the experiments.
Refutation – A research experiment must be able to be duplicated by other researches and
provide the same results. If not, the hypothesis may be refuted. This will be addressed by
providing a detailed chapter on how the experiments will be conducted (see Chapter 5, p. 47).
The original images on which the experiments will be conducted are also provided, allowing
other researchers to duplicate the experiment.
3.4 Participants
The main participant involved in this study is the researcher, who is the author of this paper and
is responsible for the execution of the study through the use of the six P’s of research. During the
exploratory study, the researcher will be seen as an external observer, learning and gathering
information about the DAR industry without interfering. For the experimental investigation, the
researcher will be an active participant by executing the experiments, manipulating the variables,
and measuring the results. The researcher is therefore directly involved in the outcome of both
these studies.
The next key participants are the research supervisors, who are responsible for keeping the
researcher on track. The research supervisors play one of the most important roles as they
practically guide the research by providing the researcher with opinions and suggestions on the
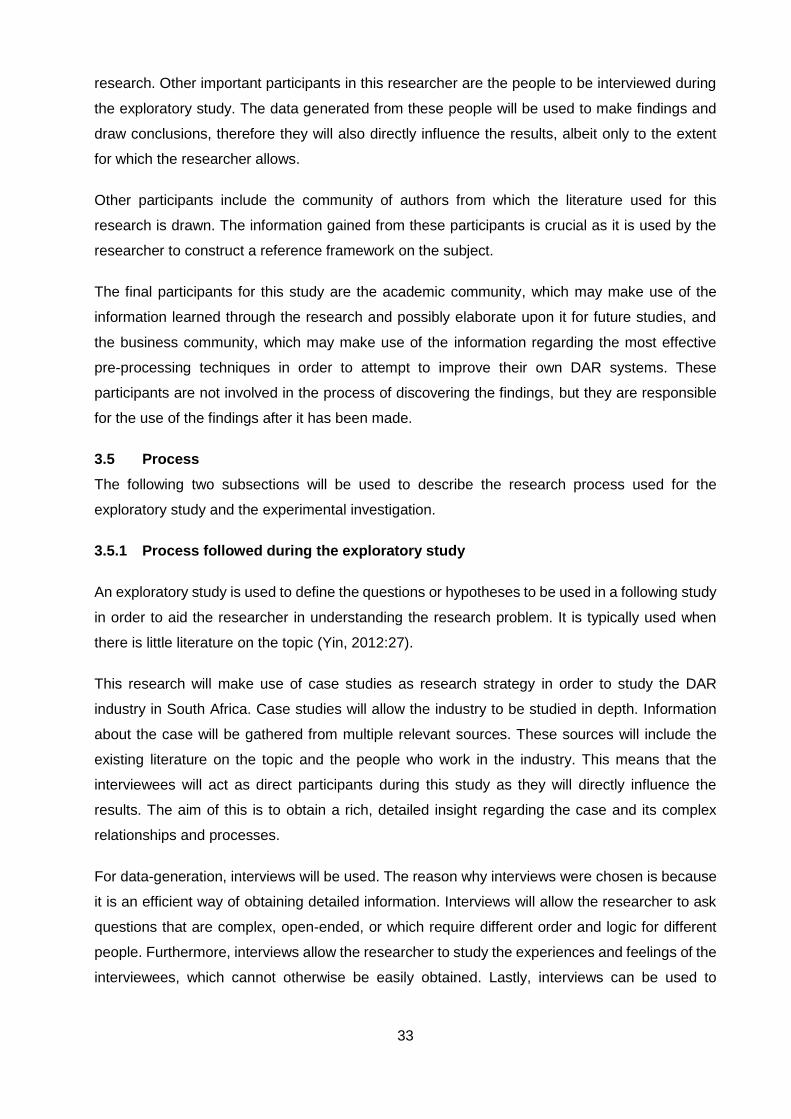
33
research. Other important participants in this researcher are the people to be interviewed during
the exploratory study. The data generated from these people will be used to make findings and
draw conclusions, therefore they will also directly influence the results, albeit only to the extent
for which the researcher allows.
Other participants include the community of authors from which the literature used for this
research is drawn. The information gained from these participants is crucial as it is used by the
researcher to construct a reference framework on the subject.
The final participants for this study are the academic community, which may make use of the
information learned through the research and possibly elaborate upon it for future studies, and
the business community, which may make use of the information regarding the most effective
pre-processing techniques in order to attempt to improve their own DAR systems. These
participants are not involved in the process of discovering the findings, but they are responsible
for the use of the findings after it has been made.
3.5 Process
The following two subsections will be used to describe the research process used for the
exploratory study and the experimental investigation.
3.5.1 Process followed during the exploratory study
An exploratory study is used to define the questions or hypotheses to be used in a following study
in order to aid the researcher in understanding the research problem. It is typically used when
there is little literature on the topic (Yin, 2012:27).
This research will make use of case studies as research strategy in order to study the DAR
industry in South Africa. Case studies will allow the industry to be studied in depth. Information
about the case will be gathered from multiple relevant sources. These sources will include the
existing literature on the topic and the people who work in the industry. This means that the
interviewees will act as direct participants during this study as they will directly influence the
results. The aim of this is to obtain a rich, detailed insight regarding the case and its complex
relationships and processes.
For data-generation, interviews will be used. The reason why interviews were chosen is because
it is an efficient way of obtaining detailed information. Interviews will allow the researcher to ask
questions that are complex, open-ended, or which require different order and logic for different
people. Furthermore, interviews allow the researcher to study the experiences and feelings of the
interviewees, which cannot otherwise be easily obtained. Lastly, interviews can be used to

34
investigate sensitive issues or privileged information, which respondents might not share with
someone they have not met.
According to Thomas (2010:314-315) and Oates (Oates, 2006:187-188), there are three different
types of interview. These are
(1) Structured interviews – These interviews are used to gather specific pre-coded answers
by making use of pre-determined, standardized, identical questions for all the interviewees.
(2) Semi-structured interviews – The interviewer is allowed to have a list of themes which
should be covered or some questions that need to be answered, but the order of the
questions and the flow of the conversation are flexible. This gives the interviewee an
opportunity to elaborate in order to provide more relevant information on the topic.
(3) Unstructured interviews – The interviewer does not have much control as he/she only
initiates the conversation with an introduction topic and the interviewee takes it from there.
For this study, semi-structured interviews will be used. Semi-structured interviews were chosen
because it will allow the researcher to steer the interviews in order to touch on all the relevant
topics, while allowing the interviewee to elaborate and provide more relevant information on the
topics. This type of interview will be used to explore personal accounts, feelings, and opinions of
the interviewees as it could reveal additional information, or be used to judge the reliability of their
knowledge.
The following will be important for the interviews (Oates, 2006:188-189):
Role and identity: The researcher will keep in mind that his age, sex, ethnic origin, accent,
and status may have an influence on the interviewees’ responses. The aim is to be
professional, polite, punctual, receptive, and neutral.
Interview preparation: Preparation for the interviews will include gathering background
information on the interviewees. This will help highlight important issues that may be
broached. It will also establish the researcher’s credibility as a professional in the eyes of the
interviewees, which might make them willing to reveal more. Lastly, it can help when
assessing the accuracy of some of the information learned.
Scheduling: The researcher will obtain an agreement for the interviews by telling the
proposed interviewees the purpose of the interviews and the likely duration.

35
Recording: The interviews will be recorded because relying on memory alone is not sufficient.
Audio recordings will be made with the interviewees’ consent. If audio recordings are not
allowed, notes will be taken with pen and paper.
Transcribing: After an interview, the researcher will transcribe the recordings. It is much
easier to search through and analyse the data once it is in written form.
In order to execute this research study, the following must be done:
1. The businesses in the industry have to be identified. This will be done by simply searching for
relevant businesses on the internet, and by using connections.
2. The identified businesses have to be contacted in order to arrange interviews if possible. A
face-to-face interview would be preferred, but if that is not possible, a Skype or telephone
interview would suffice.
3. An interview questionnaire has to be prepared. The interview questionnaire should contain
relevant topics to be discussed, such as the following:
Background of the business, including its history, the services it provides and the size of the business
Explanation of the business process
Software used by the business (DAR-related software)
Scanner used by the business
The future of the OCR, data extraction, and data management industry
4. During the interview, the interviewer should record the conversation. The interviewer should
also only steer the conversation towards the relevant topics so that the interviewee does most
of the talking.
Once all the relevant data has been gathered, all the audio recordings will be transcribed and all
the data will be placed in the same format. The data will then be coded and the relevant
relationships within the data will be identified. This will be done by reviewing the gathered data,
the summaries thereof, the analysis produced from it, the research notes taken, and any other
evidence the researcher generated.
The analysis will make use of all the relevant evidence. All the main opposing interpretations will
be considered, and each will be explored in turn. The researcher’s existing expert knowledge in
the field will also be drawn upon, but in an unbiased and objective manner.
36
3.5.2 Process followed during the experimental investigation
Oates (2006:127) defines an experiment as “a strategy that investigates cause and effect
relationships, seeking to prove or disprove a causal link between a factor and an observed
outcome”.
For this study, experiments will be used as a research strategy. The reason experiments were
chosen for this study is because they allow the researcher to manipulate variables in order to
study a cause and effect relationship. The experiments will also allow the researcher to work with
strictly quantitative data.
The research experiments will make use of the following (Oates, 2006:127):
Identification of relationships: The techniques will be tested based on their recognition
accuracy, therefore the various techniques will be viewed as the independent variables during
experiments, and the resulting recognition accuracy will be regarded as the dependent
variable. This means that the experiments will be based on the manipulation of the
independent variables, the various techniques, and the effects on the dependent variable, the
recognition accuracy.
Process: An experiment process will be used to guide the experiments from start to finish.
The complete experiment process is described in Chapter 5, p. 47.
Observation and measurements: Precise observations and measurements will be made in
order to capture the resulting outcomes of variables that are changed.
Manipulation of circumstances: Different techniques will be applied to the same batch of
documents.
Repetition: The experiments will be repeated using various different input documents in order
to ensure that the results are internally valid. This means that the same techniques be tested
repeatedly.
For the data-generation, observations will be used. There are two main types of observation
Oates (2006:204):
Systematic observation: The researcher decides in advance what the specific types of event
to be observed are and a pre-designed schedule is used to note the frequency or duration.
This normally involves counting or timing and leads to the generation of quantitative data.
Systematic observation is normally used for positivistic research.

37
Participant Observation: The researcher partakes in the situation under study in order to
experience it from the perspective of the people in the setting. This can be overt, meaning
people are aware that the researcher is studying what they do, or it can be covert, meaning
the people will be unaware that the researcher is studying them. Participant observation is
frequently associated with the interpretive research paradigm, thus it will not be discussed
further.
Systematic observations will be used in order to systematically measure and record the results of
all the experiments. A schedule will be used, which will contain all the important information
relevant to the experiments. This includes date, observation number, document batch processed,
technique(s) used, resulting recognition accuracy, and notes.
Once the results have been observed, the data will be analysed. The resulting data will be ratio
data as it will deal with percentages. This data will be quantitatively analysed by making use of
statistical analysis and visual representations in order to identify valuable patterns in the data.
Tables and bar charts will be used to visually represent the data as they seem to be the most
effective at representing the data dealt with in the study. The bar charts will effortlessly illustrate
which techniques were the most effective.
3.6 Products and presentation
Once the research studies are complete, findings will be extracted, which will ultimately contribute
to the applied knowledge area. The main products that will be delivered by these studies are
Findings regarding practices in the DAR industry, such as business process used, software
used, approach to scanning, and approach to ICR.
A method that can be used to compare the effect of pre-processing techniques on invoice
documents quantitatively.
Data that shows which noise reduction and binarization techniques are the most and least
effective for the processing of invoice documents.
The research will finally be written up in a dissertation, be presented to colleagues at a
conference, and be reviewed by highly skilled examiners. The aim is then to divide the research
findings into a conference article that addresses the exploratory study, which will be submitted to
the the Multi Conference on Computer Science and Information Systems (MCCSIS 2015), and a
journal article that will discuss the experimental investigation, which will be submitted to the
International Journal on Document Analysis and Recognition (IJDAR).
38
3.7 Summary
In this chapter, the research methods to be used were discussed. The six P’s of research were
explained and the Purpose, Paradigm, Process, Participants, Products, and Presentation of both
studies were revealed.
Figure 3-2, p. 30, illustrates how the exploratory study, which will gather qualitative data from
multiple sources, will be used to provide background information on the experimental
investigation, which will gather a large amount of quantitative data. Figure 3-3 summarizes the
research method to be used during this study. It shows how the six P’s are used as the backbone
of the exploratory study and the experimental investigation. The figure also describes the most
prominent features of both these studies.
Now that the research strategies behind the two studies have been outlined, the execution and
findings thereof can be discussed. The next chapter will discuss the exploratory study and its
findings.

39
Figure 3-3 Research method summary
Purpose Paradigm Participants Process Products Presentation
Exploratory study
• Study the DAR industry to gather background information
• Interpretive paradigm
• Case studies
• Structured interviews with DAR industry professionals
• Generation of qualitative data
• Transcriptions and content analysis performend on data
Experimental investigation
• Identify most effective pre-processing techniques
• Positivistic paradigm
• Experiments
• Comparison of techniques based on recognition performance
• Generation of quantitative data
• Statistical analysis performed on data
Findings

40
CHAPTER 4 – CURRENT STATE OF DAR IN SOUTH AFRICA
4.1 Introduction
Before the main research experiments could commence, an exploratory study was conducted in
order to investigate the use of DAR technologies in South Africa.
The need for such a study was brought on by a lack of research regarding the current state of the
South African DAR industry. It is clear that many companies could benefit greatly from the
effective implementation of DAR technologies. Despite this, it is still unclear how these
technologies are being implemented in South Africa.
In this chapter, the use of these technologies by the South African (SA) document solutions
industry will be investigated and discussed. Questions that are addressed are:
Is there a market for DAR to grow in SA?
To which other industry(s) is DAR connected?
The problems experienced with DAR compared to what could be achieved with DAR.
Which business practices result in the effective implementation of DAR?
What is the future of the industry?
In this chapter, the case studies will be elaborated upon by discussing the interview details in
Section 4.2.1 and the participants in Section 4.2.2. The findings made regarding business
process, software used, ICR, scanners, and the future of the industry will be revealed in Sections
4.3.1 - 4.3.5, respectively. The findings will then be discussed in Section 4.4.
4.2 Case studies
Case studies were conducted during which nine companies that are active in the document
solutions industry in SA were identified. These companies were identified based on their
involvement in the document solutions industry, the type of service they provide, and their
involvement with DAR technology. The identified companies were contacted by email in order to
arrange for interviews. Companies that did not respond to the emails were then contacted by
telephone. Five of the identified companies agreed to do interviews while the others declined. The
companies that declined closed down, were unwilling to cooperate, or gave references to other
companies that agreed to do interviews.
4.2.1 Interview details
Semi-structured interviews lasting between 15 minutes to an hour were conducted in May 2014.
The interviews were held at the premises of the participating companies. All but one of the

41
interviews were conducted with the owner or CEO of a company; the other interview was with an
employee. The interviews were recorded with the interviewees’ consent.
The topics of conversation during the interviews included an introduction of the interviewer,
background of interviewee and company, main questions, and opinions on the industry. The
following subjects were covered during the interviews:
Service(s) that the company provides
Explanation of the business process followed by the company
DAR-related software issues
o Which software products do they use, and their opinion thereof
o Languages used on documents
o Use of ICR (Intelligent Character Recognition)
o Problems experienced with the software
Scanners used
Factors that have an effect on recognition accuracy
The future of the industry
After the interviews were conducted, they were transcribed and content analysis was performed.
This was done by searching for related points of interest within all the transcriptions. This allowed
prevalent themes to emerge from the data.
4.2.2 Participants
To allow the participating companies to remain anonymous, they will be referred to as companies
A, B, C, D, and E. Short descriptions of these companies are provided in Table 4-1.
Table 4-1 Participating companies
Company Description
A
This company was started in 2002 by combining a passion for law and computer
science. This company has about eight employees, depending on the type of
project on which they are working. They started out by focusing solely on the law
market, but later went commercial. They do most of their work for large auditing
firms, lawyer firms, banks, and mining companies. They have done work for
multiple companies across the world. This company provides paper-based

42
information services for large court cases, forensic investigations, etc. based on
its clients’ needs.
B
This company was started in 2000 with the intention of helping other companies
automate manual data capturing. This company has twenty employees. Their
core focus is on automated data capturing, document management, and
electronic signature solutions. They have done business with both local and
international companies.
C
This company was established in 1993. It is a distributor of data capture,
document conversion, document management, and enterprise content
management software. Their products help organizations get the most from their
business documents by optimizing the capture, conversion, storage, security,
retrieval and management thereof with fast and accurate access to relevant
information. They have business partners in a number of different countries.
D
This company was started in 2000. This company started out by selling and fixing
scanners. They then expanded by scanning and indexing their clients’ documents
for them, and later branched out to provide training and technical maintenance
services as well. This company has eleven franchises in SA. They have been
involved in many projects in the rest of Africa.
E This company was established in 1999 and focuses on electronic document
imaging, management, and archiving, providing a comprehensive solution.
4.3 Findings
From the interviews, the following relevant information was obtained:
4.3.1 Business process
Companies B, C, and D agree that in this industry it is important to determine whether the product
or service the company provides is what the client is actually looking for as a long term solution.
Company A believes that it is important that documents be handled in such a way that there is
always an audit trail. The scanned documents should always refer back to the original document.
This includes information, such as where it came from, in what box it was stored, and a unique
file number. According to companies A, B, and D, the following general process is followed for
the development of an OCR-software based solution:
1. Demonstration – The company presents the clients with a demonstration so that they can
understand what the company can help them with.
43
2. Define business case – Help clients define their business case; this includes an analysis of
how the documents flow within their business.
3. Proof of concept – A trial run to prove to the client that the solution will work for them.
4. Purchase – The client buys the software.
5. Installation – The software is installed at the client’s premises.
6. Maintenance – Continuous maintenance ensures that the system works effectively over a long
period of time.
4.3.2 Software used
Company D claims that three main reasons for performing OCR is document indexing, connecting
metadata to documents, and analysis of document content. Companies A and D both believe that
when purchasing OCR software, it is important to search for something which is affordable,
accurate, and simple to use. The companies were unanimous that when deciding which software
to use, it is crucial to consider the type of document to be processed. Documents are normally
classified into structured, semi-structured and unstructured, based on the format of their contents,
as follows:
Structured documents have the same structure and appearance. It is the easiest type for
data capture, because every data field is located at the same place on all the documents.
Examples include census forms, university registration forms, or multiple-choice cards.
Semi-structured documents have the same structure but their appearance depends on a
number of items and other parameters. Capturing data from these documents is a complex,
but solvable task. Examples include invoices and purchase orders.
Unstructured documents have a variety of structures and appearances. Examples include
emails, letters, CVs, etc.
Companies B, C, and D make use of more than one OCR software package based on the
application required. The other two companies only make use of one OCR software package
because it is capable of doing everything they need. Companies A and E make use of ABBYY
products, namely FineReader and Flexicapture. The only problem experienced with FineReader
is the difficulty with which it recognizes complex documents that contain different texts,
illustrations, various text directions, etc. However, this problem is not very common. Company A
claims that FineReader allows one person to do the work of twenty when he/she knows how to

44
use it effectively. Other software used includes Captiva InputAccel, PSI:Capture, and FormStorm.
Company A pointed out that no OCR software product is capable of doing everything perfectly.
4.3.3 Intelligent Character Recognition (ICR)
Companies A, B, C, and E agree that for ICR to work, the input form has to be very carefully
structured, the user has to write in a clear print text, and the text should not be allowed to cross
over into adjacent text blocks. It is clear that ICR mainly works with carefully structured forms.
Furthermore, companies A and B state that form design is critical for ICR, in other words, people
need to be forced to write in print by making use of constrained print boxes. The problem with this
is that the input may be much larger than the boxes provided. For example, when an A4 page in
portrait orientation has more than 35 boxes in a row, the boxes become too small to write in.
Company B provided an example of a client who used to have fourteen data capturers a few
years ago. The number of data capturers have been reduced to four while the volume of
documents received has doubled over the same period. This is as a result of successful ICR
implemented on carefully designed forms.
4.3.4 Scanners
Companies A and C stated that while scanner classes mainly vary in their scanning speeds and
reliability, the scanning quality is more or less the same. Company A also states that paper
documents should be scanned to TIFF instead of PDF. This is because scanning to PDF makes
use of a compressing method that causes the image to lose some of its quality. All the companies
agree that documents should be scanned at a minimum of 200 DPI and a maximum of 300 DPI.
When scanning at lower than 200 DPI the OCR recognition will become inaccurate, while
scanning at higher than 300 DPI results in the file sizes of document images becoming too large.
Company A said that the optimal DPI for OCR is 240, but some of the other companies disagreed
and said that the benchmark for OCR is 300 DPI as 240 DPI is a little low for the recognition of
small text. Companies A and B have a term when referring to the effects of input documents
quality on recognition accuracy: Garbage in garbage out; meaning bad quality documents will
lead to bad recognition accuracy.
4.3.5 The future of the industry
Companies B and C stated that the document management industry is still in its infancy. The
global economy makes use of documents. Company A states that early in 2000 people said that
everyone would start going paperless, but contrary to this, studies have shown that the volume
of paper-based documents is only increasing. This is because many people prefer working with
paper-based documents.

45
4.4 Discussion
From the results of the interviews it is clear that a market for DAR does exist in SA, even though
it might be a niche market as company A describes it. The fact that most of these companies also
do business internationally highlights the extent of the SA DAR industry.
The study also revealed that most of these companies’ advertisement is via word of mouth. This
could be because the companies form such a close relationship with their clients. It is also clear
that these companies mostly deal with the same types of client who require more or less the same
services.
One could also conclude that the DAR industry in SA is closely linked to the scanning solutions
industry. Company B describes them as walking hand in hand. This is because scanning is the
most efficient way of capturing digital images of physical documents.
It seems that the main problems experienced by the DAR industry include the following:
Clients who are unsure about the capability of the solutions these companies provide, as
explained by companies A, B, C, and D. This could be as a result of the little effort these
companies put into advertising, causing potential clients to have a distorted impression of the
services these companies are able to provide.
Finding a software package which suits the clients’ needs, as stated by companies A and C.
This problem might be caused by each client requiring a different solution that is tailored
specifically for them.
Clients working with poor quality documents, as unanimously agreed upon by all the
companies.
It is also clear that most of these companies make use of the same practices, such as the business
process followed, the way they scan documents, and their approach to ICR. This shows that an
effective process for providing DAR services has naturally emerged and has been adopted by
most of the companies in the industry.
Lastly, it is impossible to tell what the future might hold, but the research has revealed that almost
any business makes use of paper documents and this trend is not decreasing. As the use of
paper-based information rises, the need for the digitization and processing of documents rises
along with it. This confirms the need for DAR technologies in SA.
4.5 Summary
In this chapter, it was revealed that there is a lack of research concerning the use of DAR
technologies in SA. Case studies were conducted in order to learn more about the situation. This
46
was done by conducting interviews with a handful of DAR-related companies in SA. The main
findings revealed that a DAR industry in SA does exist. It was also revealed that many of these
companies make use of the same business practices, get to deal with the same types of client,
and face the same problems. These problems are clients who are unsure about what services
they can provide, finding the right software for clients, and the use of poor quality documents.
Once the DAR industry, its practices, and use of OCR technologies were better understood, the
experiments could commence. The exploratory study has revealed that poor quality documents
are an actual problem that needs to be dealt with in the industry. Discovering which pre-
processing techniques are the most effective for improving document image quality can lead to
improvements in how companies in the DAR industry deal with these problems. The following
chapter reveals how the platform on which the experiments were conducted was set up.
47
CHAPTER 5 – EXPERIMENTAL INVESTIGATION
5.1 Introduction
The purpose of this chapter is to explain the technical process of conducting experiments for this
research study, as well as to reveal why experiments were chosen as research method.
As mentioned in Chapter 3, the aim of an experiment is to investigate cause and effect
relationships. The original research question of this study asks for the comparison of pre-
processing techniques for the processing of invoice documents. The reason for choosing
experiments as research method for this study is because they allow for the investigation of
various causes (application of different pre-processing techniques) and their related effects
(resulting recognition accuracy of technique).
This research method was chosen because it was the most practical way of researching the
effects of the various techniques. This research method also places a heavy emphasis on the
generation of quantified data, which will allow for comparisons based on various statistics.
The experiment conducted involved taking a number of invoice document images, performing
various pre-processing techniques on the images, and measuring the effect of the techniques on
the recognition rates. By acquiring the recognition rates of the different techniques, it is possible
to quantitatively compare the techniques with each other, as specified in the research question.
The rest of this chapter will describe and explain the experimental process. It is broken down into
the following subsections, as illustrated in Figure 5-1:
Acquisition of images – Explanation of how the original images, on which the experiments
were conducted, had to be acquired.
Degradation of images – Explanation of how the quality of some of the images was degraded
in order to further test the effects of some of the techniques.
Coding of techniques – Description of how the pre-processing techniques were coded in
MATLAB and applied to the original document images.
Character recognition – Shows how OCR was applied to the processed images.
Acquisition of ground truth text – Explanation of how the true text within the original
document images was obtained.

48
Development of comparison software – Description of how a customized software
application was developed, which allowed for the comparison of the original and resulting text
files.
Comparisons – Explanation of how the resulting OCR text files were compared with each
other using the software developed. The final results were obtained from this step.
Summary – A brief overview of the entire experiment process.
Figure 5-1 Experimental process overview
5.2 Acquisition of images
Firstly, the images that were used for the experiments had to be acquired. The selection of images
for experiments is an important step as this will greatly affect the outcome of the experiments.
The reason for this is that if the quality of all the images is bad, the text will be more difficult to
recognize. Therefore, it is important to use images that are of varying quality in order to get
comprehensive results.
The flowing images were used for the experiments:
Three control invoices – Named ‘Control Invoice 1/2/3’. These are mock-up invoice
documents that were created in Microsoft Word. They were then printed out and scanned in
order to simulate degradation. These images would ultimately serve as the ‘good quality’
images for the experiments. These images are shown in Figure 5-2.

49
Figure 5-2 Control invoices
Three real invoices - Named ‘Real Invoice 1/2/3’. These are real invoice documents which
were obtained from a local company. The documents selected were chosen to represent ‘real
world’ invoices with greater complexities than those of the control invoice documents. The
complexity of these invoices could easily be seen in their structure, content, and quality. These
invoices are illustrated in Figure 5-3.
Figure 5-3 Real invoices
Four invoices with noise - Named ‘Noisy Invoice 1/2/3/4’. These are four ‘real world’ invoice
documents with similar structure and content. Noise was digitally added to these images, as
explained in Section 5.3, specifically to determine how well the noise reduction techniques
work. The format of the noisy invoices is illustrated in Figure 5-4.
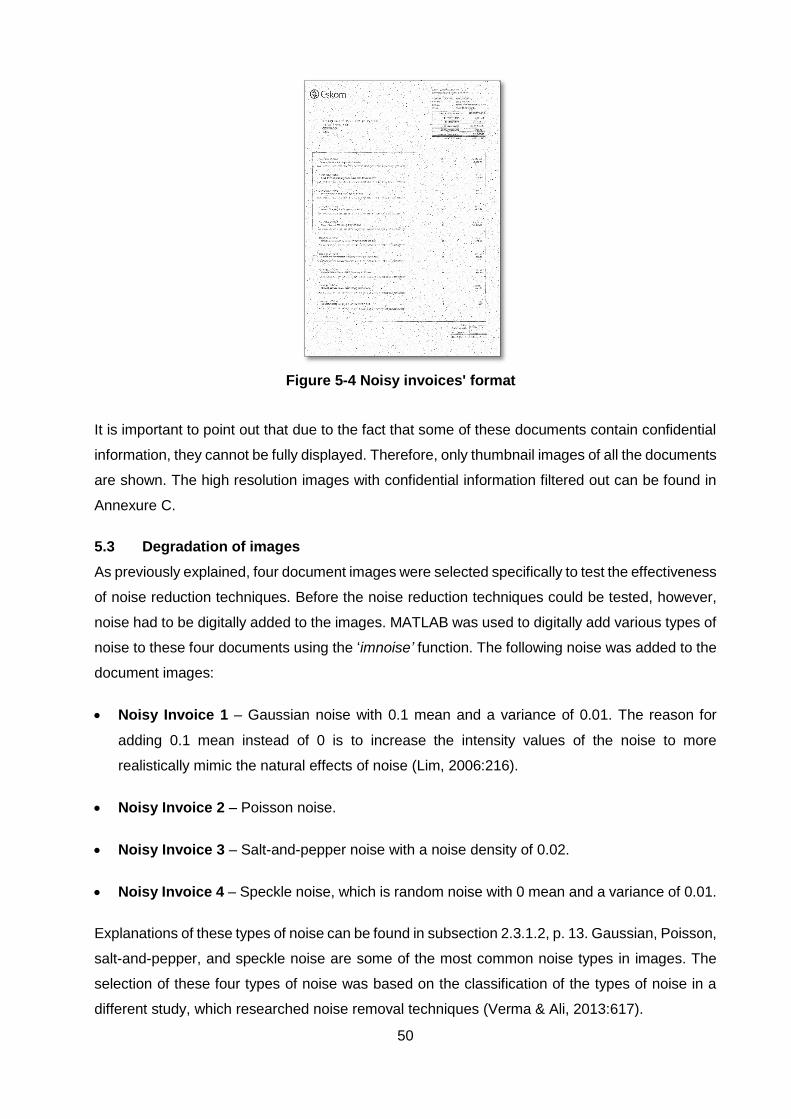
50
Figure 5-4 Noisy invoices' format
It is important to point out that due to the fact that some of these documents contain confidential
information, they cannot be fully displayed. Therefore, only thumbnail images of all the documents
are shown. The high resolution images with confidential information filtered out can be found in
Annexure C.
5.3 Degradation of images
As previously explained, four document images were selected specifically to test the effectiveness
of noise reduction techniques. Before the noise reduction techniques could be tested, however,
noise had to be digitally added to the images. MATLAB was used to digitally add various types of
noise to these four documents using the ‘imnoise’ function. The following noise was added to the
document images:
Noisy Invoice 1 – Gaussian noise with 0.1 mean and a variance of 0.01. The reason for
adding 0.1 mean instead of 0 is to increase the intensity values of the noise to more
realistically mimic the natural effects of noise (Lim, 2006:216).
Noisy Invoice 2 – Poisson noise.
Noisy Invoice 3 – Salt-and-pepper noise with a noise density of 0.02.
Noisy Invoice 4 – Speckle noise, which is random noise with 0 mean and a variance of 0.01.
Explanations of these types of noise can be found in subsection 2.3.1.2, p. 13. Gaussian, Poisson,
salt-and-pepper, and speckle noise are some of the most common noise types in images. The
selection of these four types of noise was based on the classification of the types of noise in a
different study, which researched noise removal techniques (Verma & Ali, 2013:617).

51
Figure 5-5 shows the original unaltered image, as well as the addition of Gaussian noise, Poisson
noise, salt-and-pepper noise, and speckle noise respectively.
Figure 5-5 Effects of various noise types on image
Original Image
Image corrupted by
Gaussian noise
Image corrupted by
Poisson noise
Image corrupted by
Salt-and-pepper noise
Image corrupted by
Speckle noise

52
5.4 Coding of techniques
The next step was to code the pre-processing techniques, which would be used to alter the
document images for the experiments. MATLAB was used for this step as well. The code for all
the techniques have the same format in order to keep them uniform and to avoid confusion. This
format is revealed in Figure 5-6.
%%# Clear workspace
clear;
%%# Read image
imgName = importdata('Current_Image.mat');
I = imread(imgName);
%Apply transformation : [TRANSFORMATION NAME]
%
% Apply transformation here
%
%Save resulting file
imwrite(I,'1.1.1 #1 Median filter 3x3 Result.tif');
% File Name Format:
% [Transformation type].
% [Transformation number].
% [Transformation variation]
% #[Document image number]
% [Transformation name]
% Result.tif
Figure 5-6 MATLAB technique template
It is important to note that this study focuses on the comparison of noise reduction and binarization
techniques independently. Therefore there are no noise reduction techniques that make use of
binarization, or binarization techniques that make use of noise reduction in this study.
The techniques used for the experiments in this study are:
1. Noise reduction
1.1. Median filter
1.1.1. 3 × 3 mask
1.1.2. 5 × 5 mask
1.2. Average filter
1.2.1. 3 × 3 mask
1.2.2. 5 × 5 mask
1.3. Weighted smoothing filter
1.3.1. 3 × 3 mask:

53
1.3.2. 3 × 3 mask:
1.3.3. 5 × 5 mask:
1.4. Gaussian filter
1.4.1. 5 × 5 mask, 𝜎 = 1
1.4.2. 10 × 10 mask, 𝜎 = 2
1.5. Wiener filter
1.5.1. 5 × 5 mask, additive noise estimation = 0.1
1.5.2. 10 × 10 mask, additive noise estimation = 0.01
2. Binarization
2.1. Global threshold 128
2.2. Otsu threshold
2.3. Niblack
2.3.1. 25 × 25 mask, padding size = 10
2.3.2. 10 × 10 mask, padding size = 25
2.4. Sauvola
2.4.1. 25 × 25 mask, threshold = 0.2
2.4.2. 10 × 10 mask, threshold = 0.1

54
Various mask sizes or technique settings were used where it was possible, therefore most of the
techniques appear more than once in the experiments. These techniques were then applied to
each document image, resulting in the creation of 170 different processed document images.
The technical descriptions of each of these techniques can be found in Section 2.4, p. 19. The
effects of each of these techniques, with its various mask sizes and settings on the same piece
of text, are shown in the following three pages.

55
1. Noise reduction techniques’ effects on text image
1.1.1 Median filter 3x3 1.1.2 Median filter 5x5
1.2.1 Average filter 3x3 1.2.2 Average filter 5x5
1.3.2 Weighted smoothing filter 1 1.3.1 Weighted smoothing filter 2
1.3.3 Weighted smoothing filter 3

56
1.4.1 Gaussian filter 5x5 s1 1.4.2 Gaussian filter 10x10 s2
1.5.1 Wiener filter 5x5 0.1v 1.5.2 Wiener filter 10x10 0.01v

57
2. Binarization techniques’ effects on text image
2.1 Global threshold 128 2.2 Otsu threshold
2.3.1 Niblack 1 2.3.2 Niblack 2
2.4.1 Sauvola 1 2.4.2 Sauvola 2
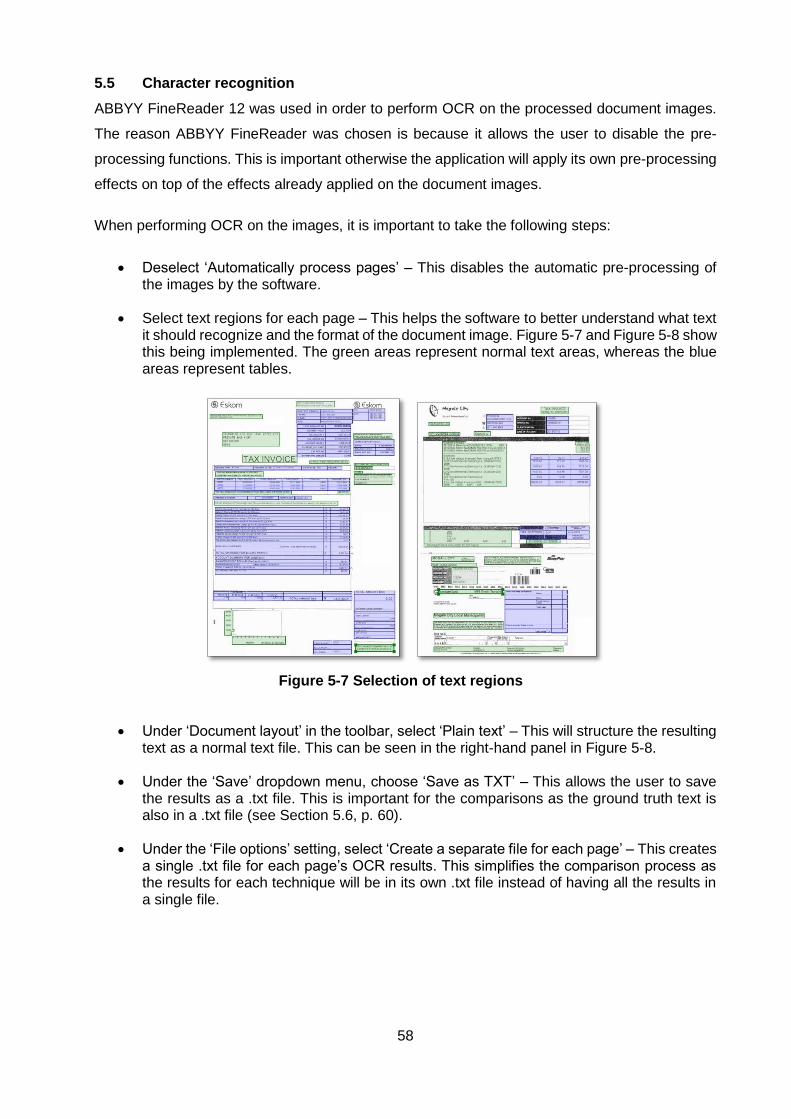
58
5.5 Character recognition
ABBYY FineReader 12 was used in order to perform OCR on the processed document images.
The reason ABBYY FineReader was chosen is because it allows the user to disable the pre-
processing functions. This is important otherwise the application will apply its own pre-processing
effects on top of the effects already applied on the document images.
When performing OCR on the images, it is important to take the following steps:
Deselect ‘Automatically process pages’ – This disables the automatic pre-processing of the images by the software.
Select text regions for each page – This helps the software to better understand what text it should recognize and the format of the document image. Figure 5-7 and Figure 5-8 show this being implemented. The green areas represent normal text areas, whereas the blue areas represent tables.
Figure 5-7 Selection of text regions
Under ‘Document layout’ in the toolbar, select ‘Plain text’ – This will structure the resulting text as a normal text file. This can be seen in the right-hand panel in Figure 5-8.
Under the ‘Save’ dropdown menu, choose ‘Save as TXT’ – This allows the user to save the results as a .txt file. This is important for the comparisons as the ground truth text is also in a .txt file (see Section 5.6, p. 60).
Under the ‘File options’ setting, select ‘Create a separate file for each page’ – This creates a single .txt file for each page’s OCR results. This simplifies the comparison process as the results for each technique will be in its own .txt file instead of having all the results in a single file.
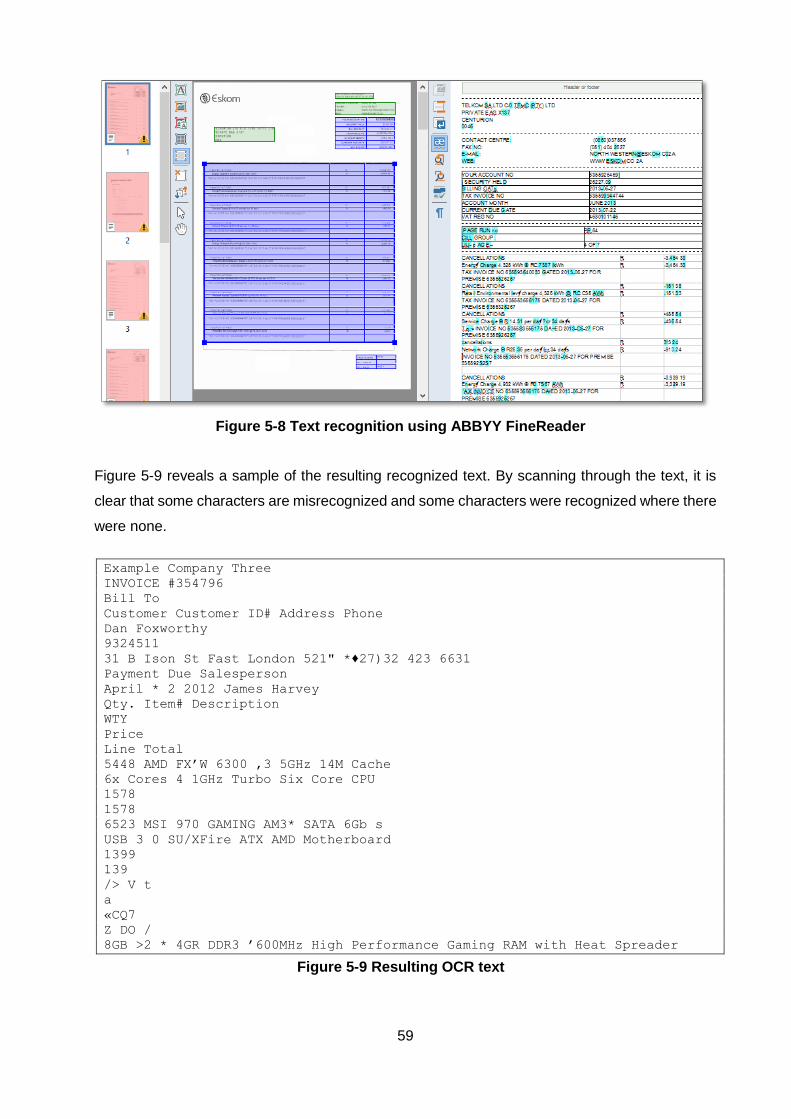
59
Figure 5-8 Text recognition using ABBYY FineReader
Figure 5-9 reveals a sample of the resulting recognized text. By scanning through the text, it is
clear that some characters are misrecognized and some characters were recognized where there
were none.
Example Company Three
INVOICE #354796
Bill To
Customer Customer ID# Address Phone
Dan Foxworthy
9324511
31 B Ison St Fast London 521" *♦27)32 423 6631
Payment Due Salesperson
April * 2 2012 James Harvey
Qty. Item# Description
WTY
Price
Line Total
5448 AMD FX’W 6300 ,3 5GHz 14M Cache
6x Cores 4 1GHz Turbo Six Core CPU
1578
1578
6523 MSI 970 GAMING AM3* SATA 6Gb s
USB 3 0 SU/XFire ATX AMD Motherboard
1399
139
/> V t
a
«CQ7
Z DO /
8GB >2 * 4GR DDR3 ’600MHz High Performance Gaming RAM with Heat Spreader
Figure 5-9 Resulting OCR text
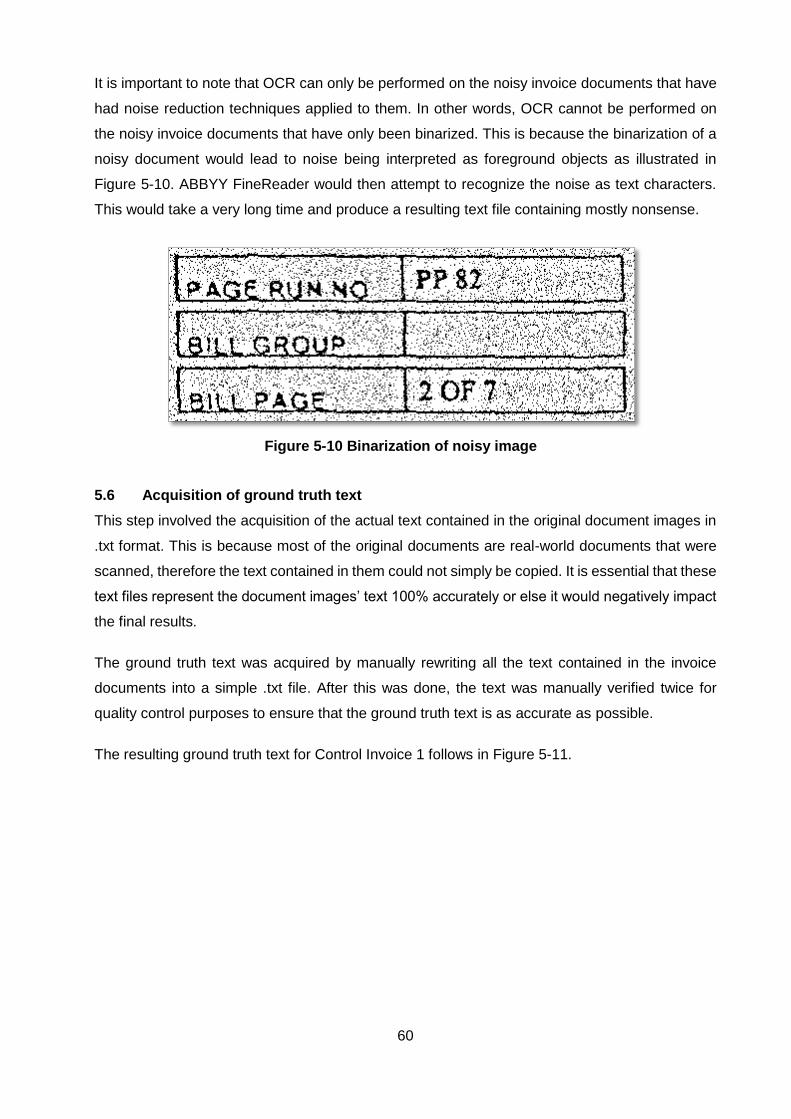
60
It is important to note that OCR can only be performed on the noisy invoice documents that have
had noise reduction techniques applied to them. In other words, OCR cannot be performed on
the noisy invoice documents that have only been binarized. This is because the binarization of a
noisy document would lead to noise being interpreted as foreground objects as illustrated in
Figure 5-10. ABBYY FineReader would then attempt to recognize the noise as text characters.
This would take a very long time and produce a resulting text file containing mostly nonsense.
Figure 5-10 Binarization of noisy image
5.6 Acquisition of ground truth text
This step involved the acquisition of the actual text contained in the original document images in
.txt format. This is because most of the original documents are real-world documents that were
scanned, therefore the text contained in them could not simply be copied. It is essential that these
text files represent the document images’ text 100% accurately or else it would negatively impact
the final results.
The ground truth text was acquired by manually rewriting all the text contained in the invoice
documents into a simple .txt file. After this was done, the text was manually verified twice for
quality control purposes to ensure that the ground truth text is as accurate as possible.
The resulting ground truth text for Control Invoice 1 follows in Figure 5-11.

61
Example Company One
13 Non Existing Street, Johannesburg, 5310
Tel (+34)75 468 8954
INVOICE 0086521 7.12.2013
BILL TO SHIP TO INSTRUCTIONS
Jack Peterson Same as recipient No additional instructions were given
253 Fox Ave
Pretoria, 2331
QUANTITY DESCRIPTION UNIT PRICE TOTAL
1 AMD FX™ 6300 (3.5GHz, 14M Cache, 6x Cores, 4.1GHz Turbo) Six Core CPU
1299.00 1299.00
1 MSI 970 GAMING AM3+ SATA 6Gb/s USB 3.0 SLI/XFire ATX AMD Motherboard
1599.00 1599.00
1 MSI GAMING Radeon R9 280 3GB 384bit OVERCLOCKED EDITION DDR5 Graphics Card
4549.00 4549.00
1 Antec 500W 80+ High Performance Power Supply 449.00 449.00
1 NZXT S340 Professional Gaming Case 399.00 399.00
2 8GB (2 x 4GB) DDR3 1600MHz High Performance Gaming RAM with Heat Spreader
1299.00 2598.00
2 128GB SSD Upto 500MB/s + Speed Ultra-Fast Solid State Drive (OS DRIVE)
649.00 1298.00
1 24X Dual Layer DVD Writer 499.00 499.00
1 Gigabit LAN Card - Broadband Ready 199.00 199.00
SUBTOTAL (INCL. TAX) 12889.00
SHIPPING & HANDLING 110.00
TOTAL DUE BY 7.15.2013 12999.00
Thank you for your business!
Figure 5-11 Control Invoice 1 ground truth text
5.7 Development of comparison software
In order to be able to compare the contents of the resulting OCR text files with the ground truth
text files, the best approach was to develop a simple C# application. The need for a custom built
application was brought on by the lack of an effective method or existing software that can
effectively compare the text files’ contents. Manual comparison methods were out of the question
as comparisons had to be made for each character in 170 different documents. There was also
no available software that could do these comparisons. Most of the software that was considered
for the experiment, was plagiarism checkers and other applications that compared full words and
sentences to each other. These applications did not focus on the comparison of individual
characters. This caused the applications to be wildly inaccurate as a single misread character
would lead to the misrecognition of a whole word.
A custom-built application, on the other hand, was able to compare the resulting OCR text files to
the ground truth text files on the following three grounds:
Characters recognized – The application looks at all the characters contained in the ground
truth text file, and sees how many of those characters are contained in the OCR text files. It
62
also looks at how many additional characters (that were not matched to any in the ground
truth text) are contained in the OCR text files. These numbers are identified as ‘Correct’ and
‘Additional’ respectively.
Phrases recognized – The application splits the files’ contents up into phrases of text, which
are separated by spaces or line separations. The application then checks how many of the
phrases recognized are the same as the phrases in the ground truth text files.
Numbers recognized – The application removes all the nonnumeric text from the files. It then
checks to see how many of the numbers contained in the ground truth text file are also in the
OCR result text files.
In order to avoid inaccurate recognitions because of the case of a character, the case of the
following characters are not taken into consideration for the comparisons since both the upper
and lower cases look similar:
C, F, J, K, M, O, P, S, U, V, W, X, Y, Z
The cases of all the other characters were, however, still taken into consideration.
Three random samples were selected from the application’s results and then manually verified in
order to ensure that the software was working effectively. This was done by manually comparing
the characters in the ground truth text file with the characters in the resulting OCR text file and
crossing off characters that exist in both documents one by one. The resulting documents’ text
was then classified into ‘missing’ and ‘additional’ characters, just as the application does. The
resulting ‘missing’ and ‘additional’ characters obtained contained the same characters, and
number of characters, as that of the application, meaning that it was working as intended. This
was quite a time consuming process, which is the reason why only three samples could be tested.
The user interface of the comparison application is shown in Figure 5-12.
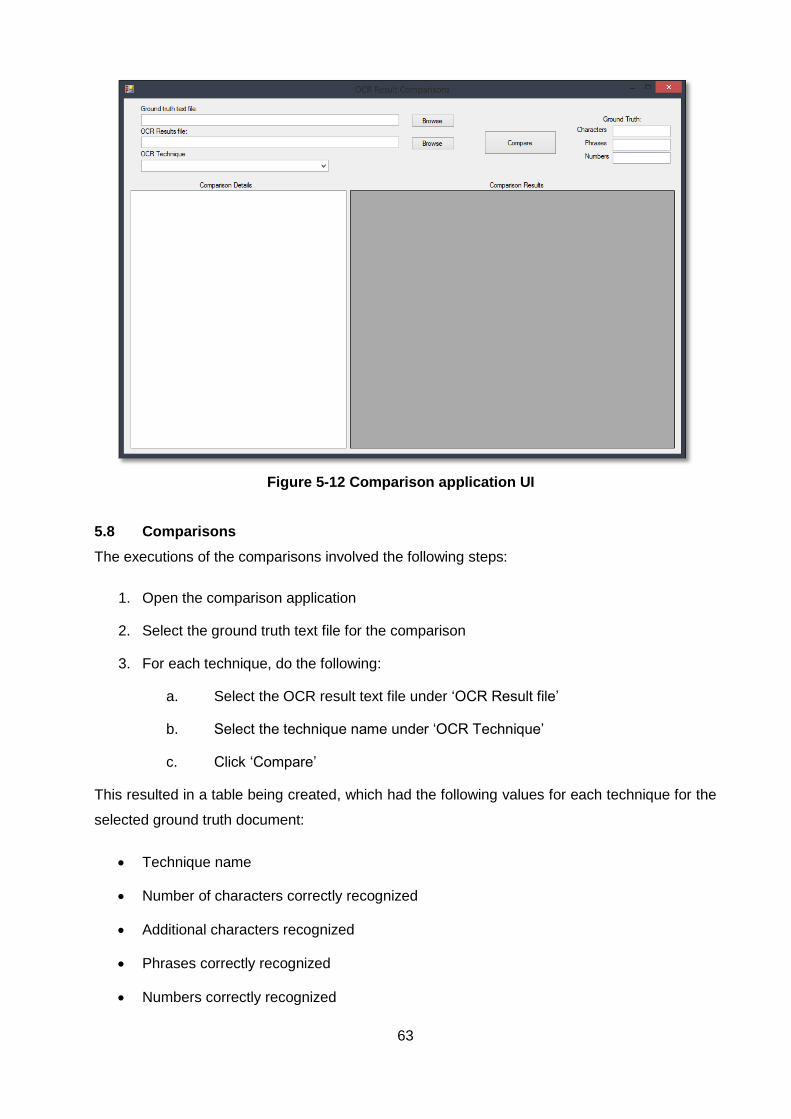
63
Figure 5-12 Comparison application UI
5.8 Comparisons
The executions of the comparisons involved the following steps:
1. Open the comparison application
2. Select the ground truth text file for the comparison
3. For each technique, do the following:
a. Select the OCR result text file under ‘OCR Result file’
b. Select the technique name under ‘OCR Technique’
c. Click ‘Compare’
This resulted in a table being created, which had the following values for each technique for the
selected ground truth document:
Technique name
Number of characters correctly recognized
Additional characters recognized
Phrases correctly recognized
Numbers correctly recognized

64
The application also revealed the total number of characters, phrases, and numbers in the ground
truth text file. The comparison application containing the results of the comparisons for Control
Invoice 1 is shown in Figure 5-13.
Figure 5-13 Comparison application results
5.9 Summary
In this chapter, experiments were used for this research study as they allowed for the systematic
observation of the cause and effect relationship between the various pre-processing techniques
and the resulting recognition accuracy of each technique.
This chapter also discussed the process of comparing these techniques in great detail. Firstly,
the original images on which the experiments would be done were obtained. The quality of some
of these images was then degraded to be able to later test the effects of the noise reduction
techniques. The various pre-processing techniques were then coded in MATLAB, whereafter
each technique was applied to each original image, resulting in the creation of 170 different
processed images. The text within these document images was then recognized using ABBYY
FineReader. After this was done, the actual text contained in the original images was manually
acquired to allow for comparisons between the processed text and the actual text. A custom
software application was then developed in order to allow for comparisons based on the text
contained in the processed and the original images. The comparisons were executed

65
successfully, and the results were obtained. This entire process is illustrated clearly in Figure 5-1,
p. 48.
The results obtained can be found in Annexure A - Results, and the analysis thereof in Annexure
B - Analysis. The following chapter will be used to analyse and discuss the findings of the
experimental investigation results.

66
CHAPTER 6 – EXPERIMENT RESULTS AND DISCUSSION
6.1 Introduction
In this chapter, the results of the experimental investigation will be discussed and analysed. The
figures and statistics discussed in this chapter can be found in Annexure A – Results, and
Annexure B – Analysis.
The analysis and discussion of the results aims to answer the following questions:
Which techniques were the best/worst at recognizing individual characters?
Which techniques were the best/worst at recognizing whole phrases?
Which techniques were the best/worst at recognizing numbers?
Which techniques were the best/worst on average?
Which document image was the easiest/most difficult to recognize?
Which results stood out from the norm, and why?
This rest of this chapter will be dedicated to discussing the results found concerning the
characters, phrases, and numbers recognized in Sections 6.2 - 6.4. Following that, the average
recognition performance, document performance, and unaltered document performance will be
looked at in Sections 6.5 - 6.7 respectively. Lastly, the findings will be summarized in Section 6.8
before moving on to the conclusions.
6.2 Characters
In the first instance it is important to note how the performance of the techniques on character
recognition has been measured since the number of characters correctly recognized as well as
the additional characters incorrectly recognized had to be taken into consideration.
When looking at the results tables in Annexure A – Results, there are three dividing columns; the
first column contains the character recognition statistics, which includes True Positive, False
Positive, and F-factor. The second column reveals the number of phrases recognized, and what
percentage of the total phrases have been recognized. The third column reveals the same as the
second, but for numbers recognized.
Character recognition makes use of the F-factor to score the performance of the techniques. The
F-factor can be determined as follows:
𝑃𝑟𝑒𝑐𝑖𝑠𝑖𝑜𝑛 =𝑇𝑟𝑢𝑒 𝑃𝑜𝑠𝑖𝑡𝑖𝑣𝑒𝑠
𝑇𝑟𝑢𝑒 𝑃𝑜𝑠𝑖𝑡𝑖𝑣𝑒𝑠 + 𝐹𝑎𝑙𝑠𝑒 𝑃𝑜𝑠𝑖𝑡𝑖𝑣𝑒𝑠 ( 14 )

67
𝑅𝑒𝑐𝑎𝑙𝑙 =𝑇𝑟𝑢𝑒 𝑃𝑜𝑠𝑖𝑡𝑖𝑣𝑒𝑠
𝑇𝑟𝑢𝑒 𝑃𝑜𝑠𝑖𝑡𝑖𝑣𝑒𝑠 + 𝐹𝑎𝑙𝑠𝑒 𝑁𝑒𝑔𝑎𝑡𝑖𝑣𝑒𝑠 ( 15 )
𝐹 𝑓𝑎𝑐𝑡𝑜𝑟 = 2 ×𝑃𝑟𝑒𝑐𝑖𝑠𝑖𝑜𝑛 × 𝑅𝑒𝑐𝑎𝑙𝑙
𝑃𝑟𝑒𝑐𝑖𝑠𝑖𝑜𝑛 + 𝑅𝑒𝑐𝑎𝑙𝑙 ( 16 )
To put it in other words, precision is the fraction of retrieved characters that are relevant and recall
is the fraction of relevant characters that are retrieved. This concept is illustrated in Figure 6-1.
Figure 6-1 Precision and recall (Wikipedia, 2015)

68
The F-factor makes use of precision and recall to accurately score the performance of the
techniques by considering both the characters correctly recognized and the characters incorrectly
recognized.
Secondly, when looking at the techniques’ scores in terms of characters recognized, it is clear
that the character recognition rates are much higher than phrases and numbers recognition rates
for all noise reduction techniques. Average character recognition rates for noise reduction
techniques range from 75.2% to 92.2% while phrase recognition rates range from 31.5% to 76.7%
and numbers recognition rates range from 33.5% to 76.1%. These rates are much more balanced
out for binarization, with the average character recognition rates ranging from 78% to 91.7%,
phrase recognition rates ranging from 50.6% to 80.8%, and number recognition rates ranging
from 54.5% to 88%. This difference is clearly illustrated in Figure 6-2.
Figure 6-2 Average by recognition type
This is because the document images have far more characters than they have phrases or
numbers. Another contributing factor is the fact that a character can be recognized regardless of
its position on the document image or the phrase in which it is. In other words, the rules for
recognizing characters are not as strict as they are for phrases and numbers, where the text is
required to contain exactly the same sequence of characters as the ground truth text.
0,0%
10,0%
20,0%
30,0%
40,0%
50,0%
60,0%
70,0%
80,0%
90,0%
100,0%
Average by recognition typeCharacters Phrases Numbers
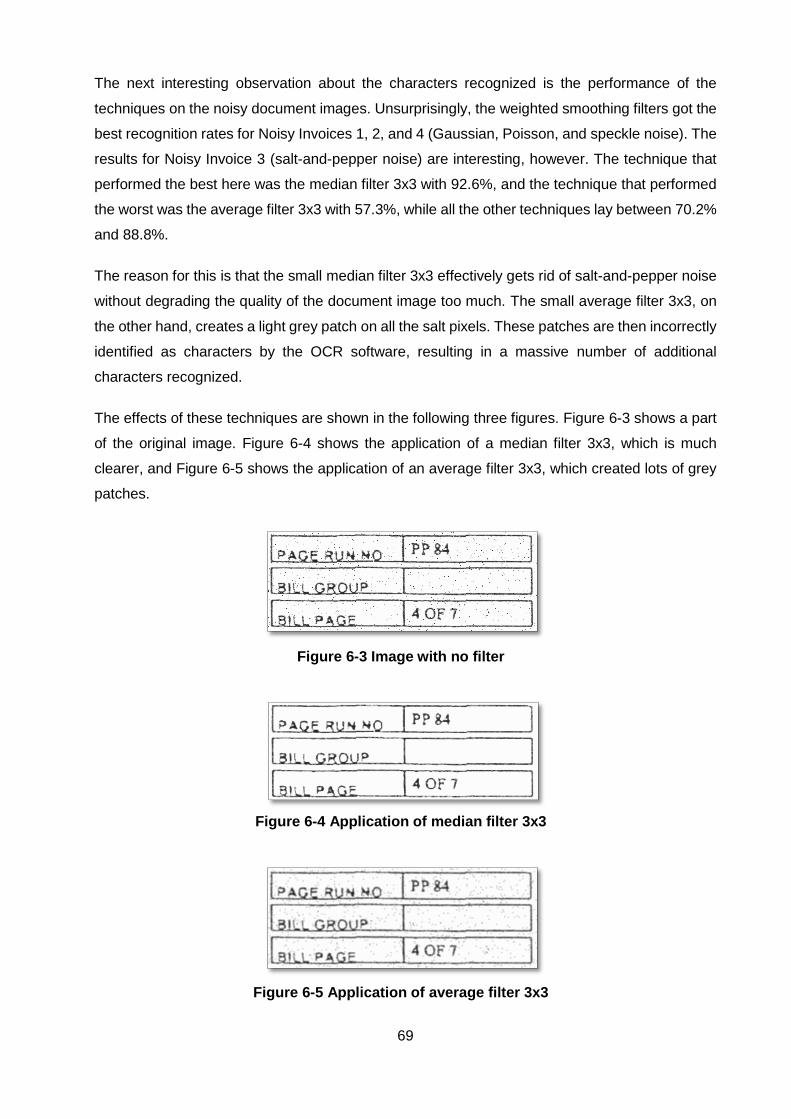
69
The next interesting observation about the characters recognized is the performance of the
techniques on the noisy document images. Unsurprisingly, the weighted smoothing filters got the
best recognition rates for Noisy Invoices 1, 2, and 4 (Gaussian, Poisson, and speckle noise). The
results for Noisy Invoice 3 (salt-and-pepper noise) are interesting, however. The technique that
performed the best here was the median filter 3x3 with 92.6%, and the technique that performed
the worst was the average filter 3x3 with 57.3%, while all the other techniques lay between 70.2%
and 88.8%.
The reason for this is that the small median filter 3x3 effectively gets rid of salt-and-pepper noise
without degrading the quality of the document image too much. The small average filter 3x3, on
the other hand, creates a light grey patch on all the salt pixels. These patches are then incorrectly
identified as characters by the OCR software, resulting in a massive number of additional
characters recognized.
The effects of these techniques are shown in the following three figures. Figure 6-3 shows a part
of the original image. Figure 6-4 shows the application of a median filter 3x3, which is much
clearer, and Figure 6-5 shows the application of an average filter 3x3, which created lots of grey
patches.
Figure 6-3 Image with no filter
Figure 6-4 Application of median filter 3x3
Figure 6-5 Application of average filter 3x3

70
The noise reduction techniques that performed the best for character recognition were weighted
smoothing filters 1, 2, and 3, with an insignificant performance difference between the three at
±92.1%. The noise reduction technique that performed the worst for character recognition was
median filter 5x5 with 75.2%.
The binarization technique that performed the best for character recognition was Otsu threshold
with 91.7% and the technique that performed the worst was global threshold 128 with 78%. Global
threshold 128 would actually have performed much better if its performance on Control Invoice 1
was not taken into account. This implies that the rest of the test documents’ text was dark enough
to be binarized sufficiently by a subpar technique.
6.3 Phrases
The noise reduction techniques that performed the best for the recognition of phrases, are
weighted smoothing filter 3 with 76.7%, weighted smoothing filter 2 with 75.7%, and weighted
smoothing filter 1 with 75.5%. Gaussian filter 5x5 s1 follows closely with 74.3%. These four noise
reduction techniques outperformed most of the other techniques effortlessly.
When looking at the binarization techniques in terms of phrases recognized, Niblack 1, Niblack 2,
and Sauvola 2 performed the best with ±80.6%, while global threshold 128 performed the worst
with 50.6%.
What stands out the most in the phrases results is the score of global threshold 128 on Control
Invoice 1 with only 4.7%. This is because only eight out of the possible 171 phrases were
recognized correctly. The reason for this is the light intensity of the text in the image. The resulting
text is a collection of nonsense characters. This is illustrated in Figure 6-6 with a piece of Control
Invoice 1 processed by global threshold 128, and its resulting text in Figure 6-7.
Figure 6-6 Application of global threshold 128
Figure 6-7 Global threshold 128 resulting text
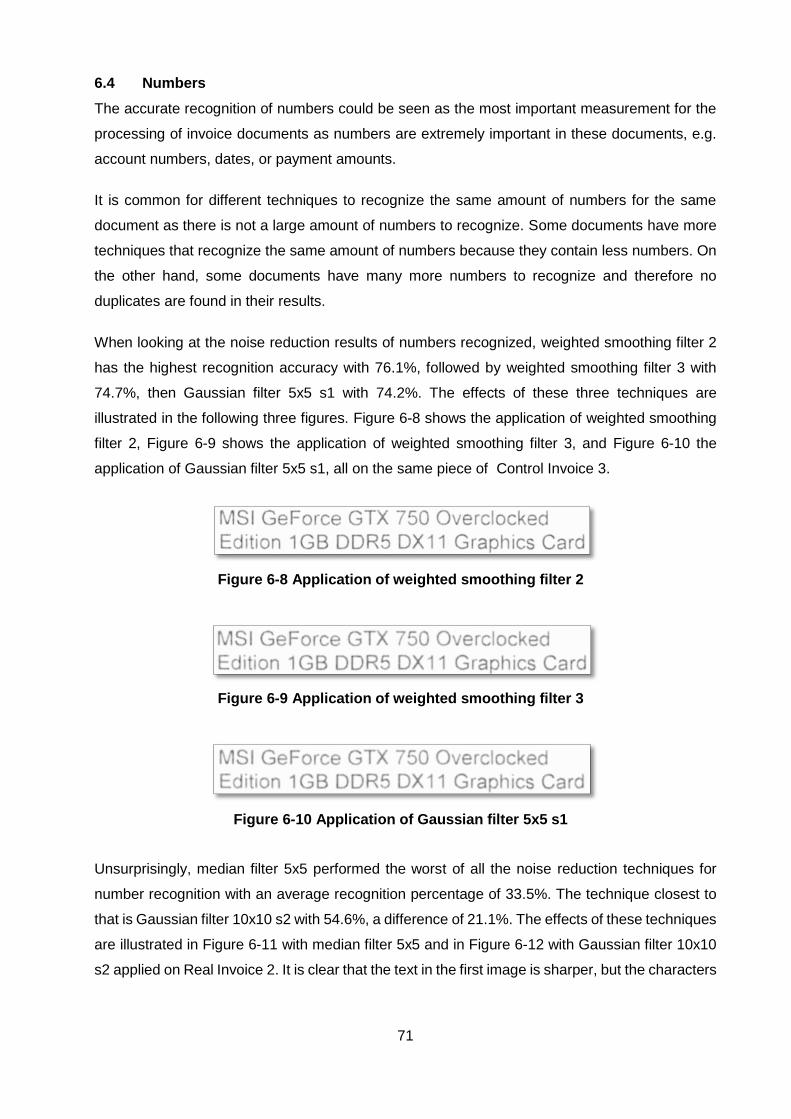
71
6.4 Numbers
The accurate recognition of numbers could be seen as the most important measurement for the
processing of invoice documents as numbers are extremely important in these documents, e.g.
account numbers, dates, or payment amounts.
It is common for different techniques to recognize the same amount of numbers for the same
document as there is not a large amount of numbers to recognize. Some documents have more
techniques that recognize the same amount of numbers because they contain less numbers. On
the other hand, some documents have many more numbers to recognize and therefore no
duplicates are found in their results.
When looking at the noise reduction results of numbers recognized, weighted smoothing filter 2
has the highest recognition accuracy with 76.1%, followed by weighted smoothing filter 3 with
74.7%, then Gaussian filter 5x5 s1 with 74.2%. The effects of these three techniques are
illustrated in the following three figures. Figure 6-8 shows the application of weighted smoothing
filter 2, Figure 6-9 shows the application of weighted smoothing filter 3, and Figure 6-10 the
application of Gaussian filter 5x5 s1, all on the same piece of Control Invoice 3.
Figure 6-8 Application of weighted smoothing filter 2
Figure 6-9 Application of weighted smoothing filter 3
Figure 6-10 Application of Gaussian filter 5x5 s1
Unsurprisingly, median filter 5x5 performed the worst of all the noise reduction techniques for
number recognition with an average recognition percentage of 33.5%. The technique closest to
that is Gaussian filter 10x10 s2 with 54.6%, a difference of 21.1%. The effects of these techniques
are illustrated in Figure 6-11 with median filter 5x5 and in Figure 6-12 with Gaussian filter 10x10
s2 applied on Real Invoice 2. It is clear that the text in the first image is sharper, but the characters
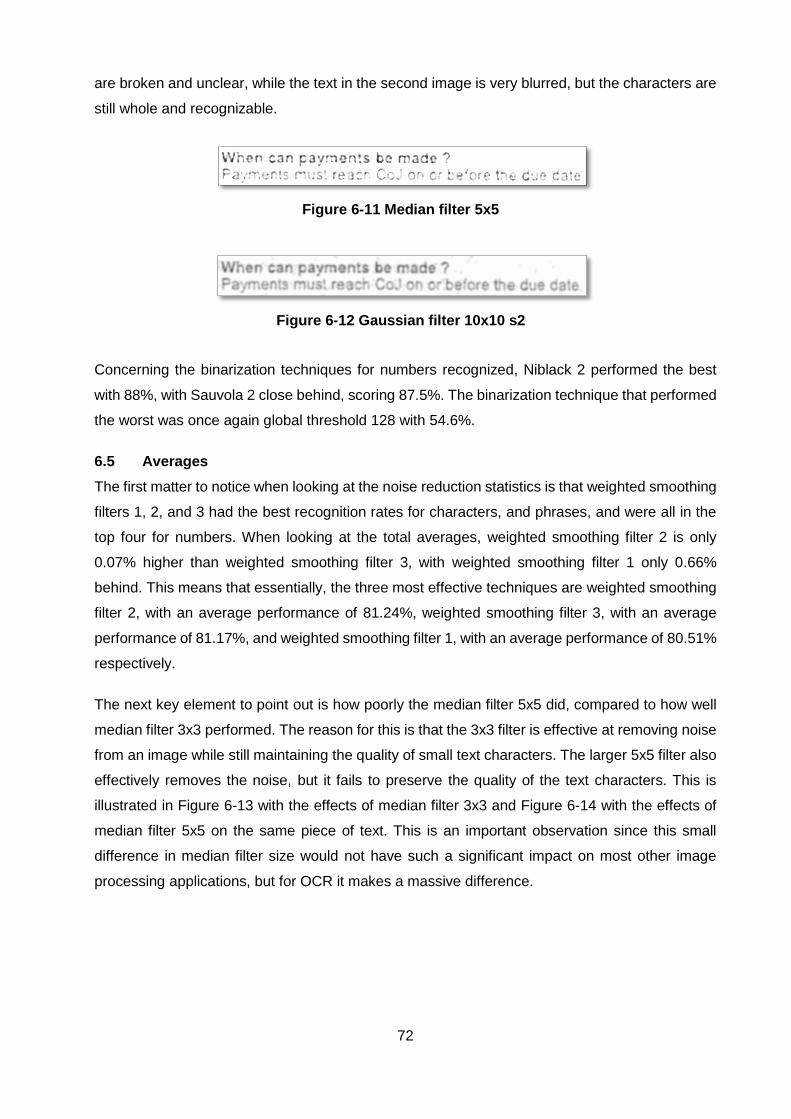
72
are broken and unclear, while the text in the second image is very blurred, but the characters are
still whole and recognizable.
Figure 6-11 Median filter 5x5
Figure 6-12 Gaussian filter 10x10 s2
Concerning the binarization techniques for numbers recognized, Niblack 2 performed the best
with 88%, with Sauvola 2 close behind, scoring 87.5%. The binarization technique that performed
the worst was once again global threshold 128 with 54.6%.
6.5 Averages
The first matter to notice when looking at the noise reduction statistics is that weighted smoothing
filters 1, 2, and 3 had the best recognition rates for characters, and phrases, and were all in the
top four for numbers. When looking at the total averages, weighted smoothing filter 2 is only
0.07% higher than weighted smoothing filter 3, with weighted smoothing filter 1 only 0.66%
behind. This means that essentially, the three most effective techniques are weighted smoothing
filter 2, with an average performance of 81.24%, weighted smoothing filter 3, with an average
performance of 81.17%, and weighted smoothing filter 1, with an average performance of 80.51%
respectively.
The next key element to point out is how poorly the median filter 5x5 did, compared to how well
median filter 3x3 performed. The reason for this is that the 3x3 filter is effective at removing noise
from an image while still maintaining the quality of small text characters. The larger 5x5 filter also
effectively removes the noise, but it fails to preserve the quality of the text characters. This is
illustrated in Figure 6-13 with the effects of median filter 3x3 and Figure 6-14 with the effects of
median filter 5x5 on the same piece of text. This is an important observation since this small
difference in median filter size would not have such a significant impact on most other image
processing applications, but for OCR it makes a massive difference.

73
Figure 6-13 Effects of median filter 3x3
Figure 6-14 Effects of median filter 5x5
When looking at the average statistics for binarization techniques, it is clear that global threshold
128 does extremely poorly on Control Invoice 1 with only 15.8% compared to its performance on
the other document images where it scored between 64.2% and 84.7%. The reason for this is, as
previously mentioned, because the text in the original Control Invoice 1 is really light compared
to the text from other original invoice document images. This is illustrated in the following three
figures, with Figure 6-15 showing a piece of light text from Control Invoice 1, Figure 6-16 with a
similar piece of text from Control Invoice 2, and Figure 6-17 with a piece from Control Invoice 3.
Figure 6-15 Text from Control Invoice 1
Figure 6-16 Text from Control Invoice 2

74
Figure 6-17 Text from Control Invoice 3
This low intensity means that most of the pixels will get cut off by the technique, resulting in a
processed image where half of the necessary pixels are missing, as illustrated in Figure 6-18.
Figure 6-18 Application of global threshold 128 on low intensity text
By looking at the average performance of the binarization techniques, it becomes clear that all
the techniques except global threshold 128 performed really well. The technique that performed
the best was Niblack 2 with 85.5%. It is also worth noting that Niblack 2 had the highest recognition
rate for phrases and numbers, and Otsu threshold had the highest recognition rate for characters.
The information discussed above is summarised in Figure 6-2, p. 68, which reveals the
performance of each technique based on its average recognition rate for characters (represented
by blue), phrases (represented by red), and (numbers represented by green).
The following chart, Figure 6-19, reveals the total average performance of each technique. These
scores were obtained by averaging the characters, phrases, and numbers recognition
performance. Figure 6-20 shows the box plot of the average accuracy of each technique.
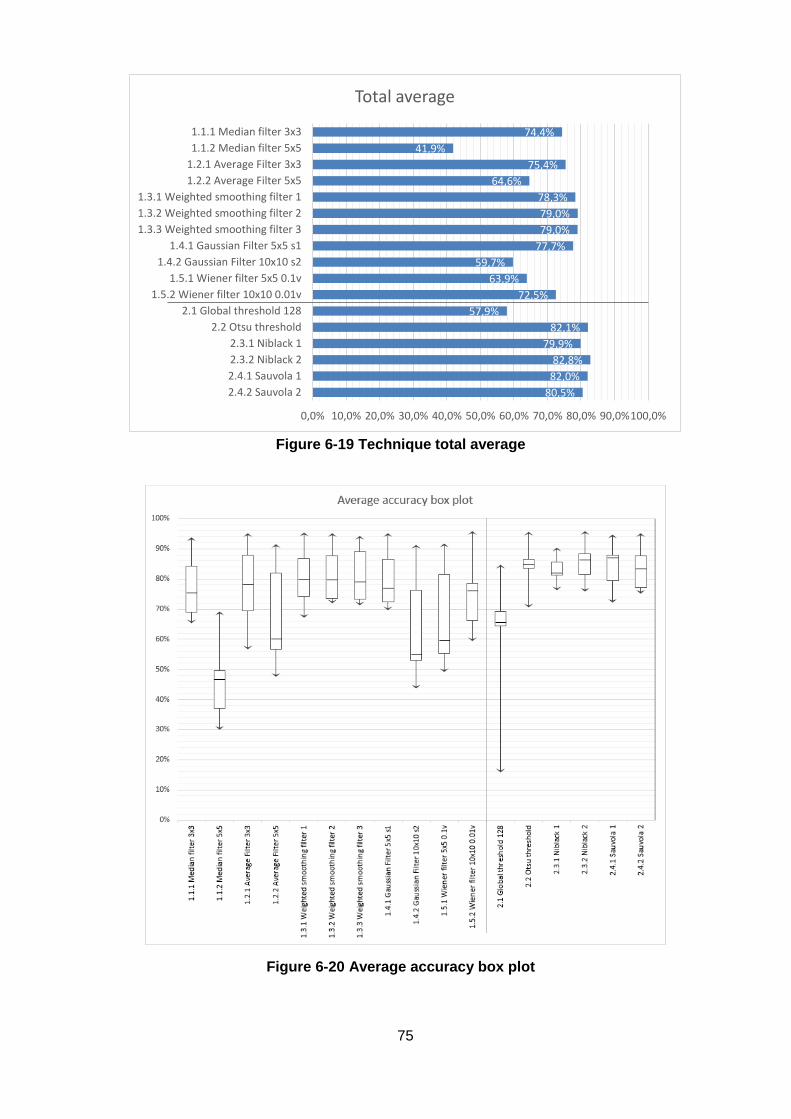
75
Figure 6-19 Technique total average
Figure 6-20 Average accuracy box plot
74,4%
41,9%
75,4%
64,6%
78,3%
79,0%
79,0%
77,7%
59,7%
63,9%
72,5%
57,9%
82,1%
79,9%
82,8%
82,0%
80,5%
0,0% 10,0% 20,0% 30,0% 40,0% 50,0% 60,0% 70,0% 80,0% 90,0%100,0%
1.1.1 Median filter 3x3
1.1.2 Median filter 5x5
1.2.1 Average Filter 3x3
1.2.2 Average Filter 5x5
1.3.1 Weighted smoothing filter 1
1.3.2 Weighted smoothing filter 2
1.3.3 Weighted smoothing filter 3
1.4.1 Gaussian Filter 5x5 s1
1.4.2 Gaussian Filter 10x10 s2
1.5.1 Wiener filter 5x5 0.1v
1.5.2 Wiener filter 10x10 0.01v
2.1 Global threshold 128
2.2 Otsu threshold
2.3.1 Niblack 1
2.3.2 Niblack 2
2.4.1 Sauvola 1
2.4.2 Sauvola 2
Total average
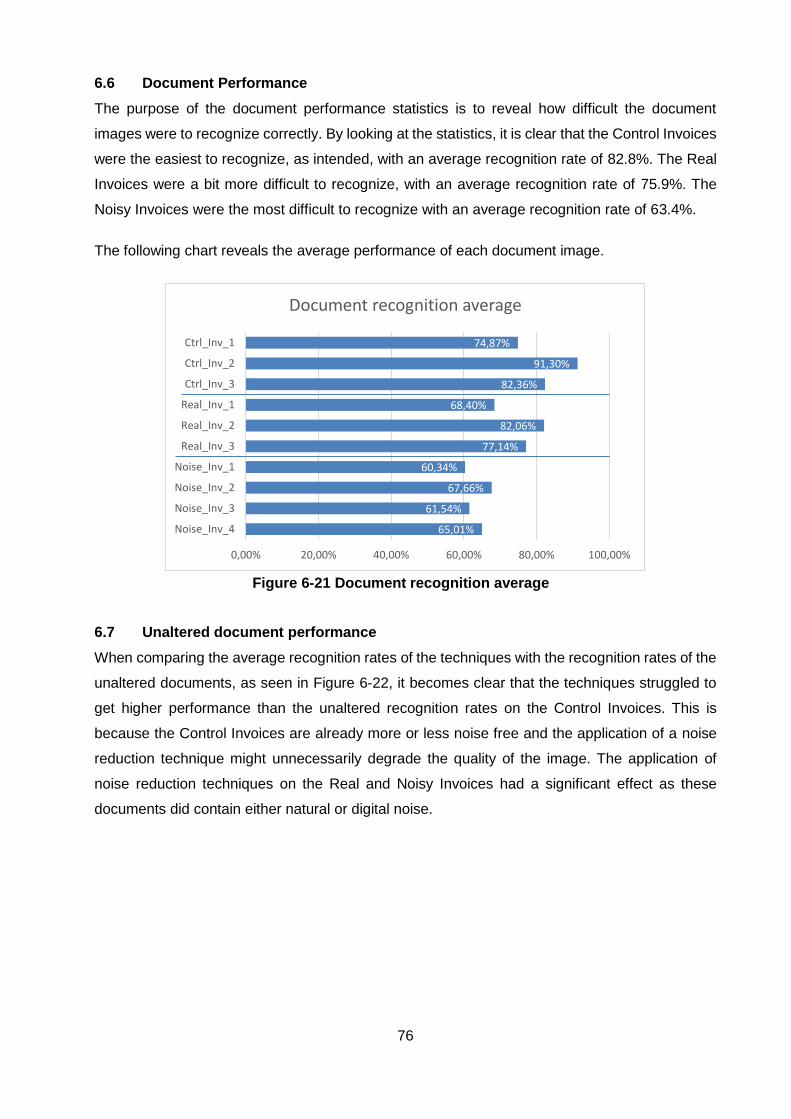
76
6.6 Document Performance
The purpose of the document performance statistics is to reveal how difficult the document
images were to recognize correctly. By looking at the statistics, it is clear that the Control Invoices
were the easiest to recognize, as intended, with an average recognition rate of 82.8%. The Real
Invoices were a bit more difficult to recognize, with an average recognition rate of 75.9%. The
Noisy Invoices were the most difficult to recognize with an average recognition rate of 63.4%.
The following chart reveals the average performance of each document image.
Figure 6-21 Document recognition average
6.7 Unaltered document performance
When comparing the average recognition rates of the techniques with the recognition rates of the
unaltered documents, as seen in Figure 6-22, it becomes clear that the techniques struggled to
get higher performance than the unaltered recognition rates on the Control Invoices. This is
because the Control Invoices are already more or less noise free and the application of a noise
reduction technique might unnecessarily degrade the quality of the image. The application of
noise reduction techniques on the Real and Noisy Invoices had a significant effect as these
documents did contain either natural or digital noise.
74,87%
91,30%
82,36%
68,40%
82,06%
77,14%
60,34%
67,66%
61,54%
65,01%
0,00% 20,00% 40,00% 60,00% 80,00% 100,00%
Ctrl_Inv_1
Ctrl_Inv_2
Ctrl_Inv_3
Real_Inv_1
Real_Inv_2
Real_Inv_3
Noise_Inv_1
Noise_Inv_2
Noise_Inv_3
Noise_Inv_4
Document recognition average

77
Figure 6-22 Unaltered document performance
The following three figures illustrate this by showing a part of the essentially noiseless image
Control Invoice 2 in Figure 6-23, a part of image Noisy Invoice 1 with added noise in Figure 6-24,
and a naturally noisy part of image Real Invoice 2 in Figure 6-25.
Figure 6-23 Noiseless image Control Invoice 2
Figure 6-24 Added noise in Noisy Invoice 1
83,79%
98,74%
99,17%
38,45%
19,62%
18,57%
60,17%
43,52%
22,62%
24,13%
0,00% 20,00% 40,00% 60,00% 80,00% 100,00% 120,00%
Ctrl_Inv_1
Ctrl_Inv_2
Ctrl_Inv_3
Real_Inv_1
Real_Inv_2
Real_Inv_3
Noise_Inv_1
Noise_Inv_2
Noise_Inv_3
Noise_Inv_4
Unaltered document performance
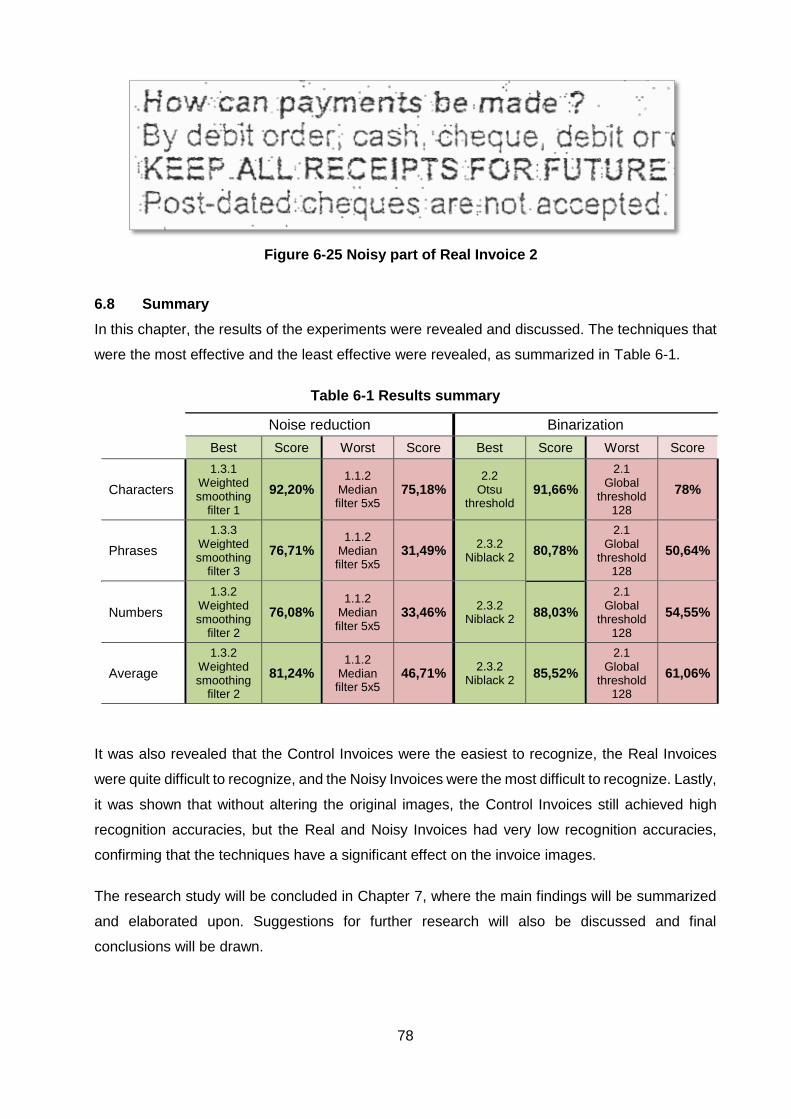
78
Figure 6-25 Noisy part of Real Invoice 2
6.8 Summary
In this chapter, the results of the experiments were revealed and discussed. The techniques that
were the most effective and the least effective were revealed, as summarized in Table 6-1.
Table 6-1 Results summary
Noise reduction Binarization
Best Score Worst Score Best Score Worst Score
Characters
1.3.1 Weighted smoothing
filter 1
92,20% 1.1.2
Median filter 5x5
75,18% 2.2
Otsu threshold
91,66%
2.1 Global
threshold 128
78%
Phrases
1.3.3 Weighted smoothing
filter 3
76,71% 1.1.2
Median filter 5x5
31,49% 2.3.2
Niblack 2 80,78%
2.1 Global
threshold 128
50,64%
Numbers
1.3.2 Weighted smoothing
filter 2
76,08% 1.1.2
Median filter 5x5
33,46% 2.3.2
Niblack 2 88,03%
2.1 Global
threshold 128
54,55%
Average
1.3.2 Weighted smoothing
filter 2
81,24% 1.1.2
Median filter 5x5
46,71% 2.3.2
Niblack 2 85,52%
2.1 Global
threshold 128
61,06%
It was also revealed that the Control Invoices were the easiest to recognize, the Real Invoices
were quite difficult to recognize, and the Noisy Invoices were the most difficult to recognize. Lastly,
it was shown that without altering the original images, the Control Invoices still achieved high
recognition accuracies, but the Real and Noisy Invoices had very low recognition accuracies,
confirming that the techniques have a significant effect on the invoice images.
The research study will be concluded in Chapter 7, where the main findings will be summarized
and elaborated upon. Suggestions for further research will also be discussed and final
conclusions will be drawn.

79
CHAPTER 7 – CONCLUSIONS
7.1 Introduction and thesis summary
In Chapter 1 – Introduction, it was pointed out that physical and electronic documents are
extremely important for the preservation of information, and the conversion from physical
document to machine-understandable electronic document is a very complex task (Shafait,
2009:1). It was revealed that DAR is the process whereby useful information on physical
documents is extracted, and it consists of four phases, namely pre-processing, layout analysis,
text recognition, and post-processing (Marinai, 2008:1). The importance of the pre-processing
phase was highlighted by revealing how big the impact was that it has on the successful
recognition of a document (2009:72). It was also revealed that there is a lack of studies that
compare pre-processing techniques with one another specifically for the optimization of invoice
or semi-structured documents.
This brought forward the main objective of this study, which was to compare various pre-
processing techniques with one another in order to determine the most effective techniques to be
used for invoice processing. In order to achieve this the following objectives were accomplished:
(1) an understanding was gained regarding the functioning of the document management and
OCR industry, (2) the most common pre-processing techniques were identified and studied, (3)
invoice documents were distinguished from other documents, (4) an experiment process was
created in which various techniques could be compared to one another based on their
performance, (5) the techniques were compared and results were obtained, (6) the experiment
results were analysed and discussed to reveal important findings, and (7) techniques that are the
most likely to be effective were revealed.
In Chapter 2 – Literature review, the literature on the topic was investigated in order to gain a
comprehensive understanding of the subject material. This was done by first looking at what OCR
is, which includes its history, applications, and recent trends and movements. Following this, the
DAR process was broken down and each of its steps was discussed. This included pre-
processing, layout analysis, text recognition, and post-processing. All the key concepts discussed
in this chapter are summed up in Figure 2-1, p. 7.
In Chapter 3 – Research method, the research studies were explained by making use of the six
P’s of research. It was explained that an exploratory study was conducted by making use of case
studies to interview people involved in the DAR industry. Following that, an explanation was given
of how an experimental investigation was conducted to compare pre-processing techniques to
each other. A summary of the research method is illustrated in Figure 3-3, p. 39.

80
In Chapter 4 – Current state of DAR in South Africa, the exploratory study was discussed in
detail. The chapter started out by motivating the need for such a study, whereafter an explanation
of the case studies that were conducted followed. This included details of the interviews and the
participants. The findings regarding business process, software, ICR, scanners, and the future of
the industry were then revealed and discussed.
In Chapter 5 – Experimental investigation, the technical process of conducting the experiments
was described and explained. This process started out with the acquisition of the original images.
The quality of some of those images was then degraded in order to later test the effects of the
noise reduction techniques. The techniques were then coded in MATLAB and applied to the
original images. Following that, the processed documents were recognized using ABBYY
FineReader. The ground truth text was then manually taken from the original document images.
A software application was then developed, which allowed for comparisons of the processed
images in order to measure their performance. All the processed images were fed into the
application and the final results were obtained.
In Chapter 6 – Results and discussion, the results obtained from the experiments were
analysed and explained. The results were discussed in terms of the recognition rates for
characters, phrases, and numbers. The average recognition performance of each document was
also discussed as well as the performance of the unaltered documents. A summary of the most
significant findings can be found in Table 6-1, p. 78.
The rest of this chapter will be used to effectively summarize the results of the experiments in
Section 7.2. The contribution of the work is then summarized in Section 7.3, suggestions for future
work are given in Section 7.4, and the final conclusions are drawn in Section 7.5.
7.2 Summary of findings
The exploratory study has revealed many relevant findings regarding the DAR industry.
Concerning the software used in the industry, it was learned that there are three main reasons for
using OCR, namely document indexing, connecting metadata to documents, and to analyse
document content. It was also revealed that affordability, accuracy, and simplicity are things to
look for when purchasing OCR software. In addition to this, it is important to consider the type of
document which has to be processed by categorizing it into structured, semi-structured, or
unstructured.
The exploratory study showed that carefully structured forms have to be used for the
implementation of ICR, as the users are required to write in clear print text which should not cross
over into adjacent text boxes. The professionals also believe that the way in which documents

81
are scanned is also important. The optimal DPI to scan documents at for the use of OCR is
between 240 and 300.
The last important thing revealed by the exploratory study, was the problems experienced by the
professionals in the DAR industry. This includes clients which are unsure about what the
companies can help them with, finding the right software packages for each of the clients, and
the use of poor quality documents. The use of poor quality documents is an actual problem which
can be addressed by using the findings of the experimental investigation.
In the experimental investigation, the most prominent noise reduction and binarization techniques
have been identified and explained. These techniques were successfully compared with one
another through the experiments conducted in Chapter 5.
Regarding the noise reduction techniques, it was discovered that the three weighted smoothing
filters had the highest average recognition accuracies, suggesting that they are the three most
effective noise reduction techniques for the recognition of invoice documents.
It was revealed in this study that the two main relevant elements that make invoice documents
unique from other documents are their typical structure, and the strong focus on accurate
numbers. Invoice documents are typically semi-structured documents. This means that they have
more or less the same structure, but their appearance depends on various parameters, such as
the number of items contained in the document.
The strong focus on numbers means that for invoice document processing, the accurate
recognition of numbers is very important. Considering the performance of techniques on the
recognition of numbers, weighted smoothing filter 2 performed the best.
It was also revealed that when working with salt-and-pepper noise, an average filter 3x3 is very
inefficient as a grey patch is created for each piece of noise, which is then incorrectly read as a
character. A median filter 3x3 on the other hand, is very effective at removing this type of noise
as it does not degrade the quality of the original text too much.
The last observation concerning the noise reduction techniques is how poorly the median filter
5x5 performed all around. This is because the size of the filter is too big, causing it to degrade the
image of the text significantly as it attempts to remove the noise.
Regarding the binarization techniques, the first observation to point out is the extremely poor
performance of the global threshold 128. This is as a result of the technique separating the
foreground and background pixels at a pre-set intensity value. By contrast, the Otsu threshold

82
separates the foreground and background at the optimum intensity, and therefore performs better
in most instances.
From this study, one is able to conclude that of the binarization techniques tested, Niblack 2 and
Otsu threshold are the most effective for the processing of invoice documents. The results have
also revealed that Niblack 2 excelled at the recognition of numbers, while Otsu threshold had the
highest recognition rate for characters. This would suggest that for the processing of invoice
documents, Niblack 2 would be preferred.
Unfortunately, this study was limited by some factors. One of the limiting factors is the fact that
only single techniques were compared with one another, and no combinations of techniques were
tested. Combinations of techniques would possibly lead to even better results and could be
considered for future research.
Another limiting factor is the timeframe for this study. Given more time, more conclusive results
could be obtained using the same experiments. These possibilities are further discussed in
Section 7.4.
7.3 Summary of contributions
One of the main contributions of this study was the creation of a method that allows for the
comparison of pre-processing techniques, which is based on the recognition performance of the
resulting text. This method can be used to test and compare any pre-processing techniques,
independent from the rest of the recognition process. This method could also be used to test
different types of document and is not in any way limited to invoice documents.
Furthermore, the most effective techniques for noise reduction and for binarization have been
identified, based on their recognition performance on invoice documents. This allows businesses
who process invoice documents through DAR to potentially improve their recognition rates by
making use of the suggested techniques.
It was revealed that in the DAR industry, a general business process is followed by most
companies. This process includes a demonstration during which the business shows its clients
what it is able to help them with. Subsequently, a business case is defined, and a proof of concept
trial run is used to show that the proposed solution will work for the client. The client then
purchases the software, it is installed, and the software is continually maintained to ensure that it
works effectively over a long period.
The exploratory study for this research also revealed many interesting elements regarding the
document solutions industry. Findings regarding the software used revealed that most companies
make use of ABBYY software. Other software used includes Captiva InputAccel, PSI:Capture,

83
and FormStorm. It was also learned that ICR and invoice documents do not really work together,
as ICR works best when carefully structured forms are used so that the users can be forced to
write in constrained print boxes. Since invoice documents are mainly semi-structured, ICR for
invoice documents can be tricky. Lastly, it was revealed that the preferred DPI to scan documents
at for OCR, is between 240 and 300.
7.4 Suggestions for further research
When considering future work that may emanate from this study, there are a number of possible
research directions that could make use of the experiment method used, such as
Additional techniques could be added to the experiment.
Combinations of techniques could be tested, and more complex techniques could be
incorporated.
Processing time could be taken into account when comparing the techniques. Processing time
could apply to the time taken to apply the technique to the document image, or the time taken
to recognize the text of the processed document image.
This would allow for more comprehensive results. Another possibility involving the experiment
method would be to modify and improve the software application used to compare the recognised
text. This would potentially allow the comparisons to be made based on more than just characters,
numbers, and phrases. It would be very valuable if the application was able to identify and
compare key words or phrases in the recognized text. This would allow weights of importance to
be added to some of the characters, numbers, or phrases in the documents.
Moving away from the experiment method, other possible research directions could involve the
analysis and comparison of techniques for the other three phases of the DAR process, namely
layout analysis, text recognition, and post-processing. This could possibly lead to a complete
optimization of the combination of techniques used for DAR.
7.5 Conclusions
The aims and objectives of this study have been achieved. This research has tested and revealed
some of the most effective pre-processing techniques to be used for the processing of invoice
documents. In addition to this, some insight into the current state of affairs in the South African
DAR industry was gained.
This study has shown that a couple of noise reduction and binarization techniques stand out from
the rest for the processing of invoice documents. It has also revealed something about the

84
functioning of some of these techniques when applied to invoice documents, which aids in the
understanding of why these techniques should or should not be used for invoice processing.
The findings of this study could be implemented by DAR-related businesses in order to improve
their recognition accuracy. This can easily be done by making use of the most effective techniques
revealed in this study, and staying away from the least effective techniques. Business can also
learn from the findings of this study regarding the business practices, software used, ICR
implementation, and scanners.
Regarding the future of the DAR industry, many consider it to be in its infancy. Information is the
most valuable asset to any organization and DAR technologies could be incorporated by most
companies to support their business processes. The automated processing of invoice documents
could save companies time and resources.
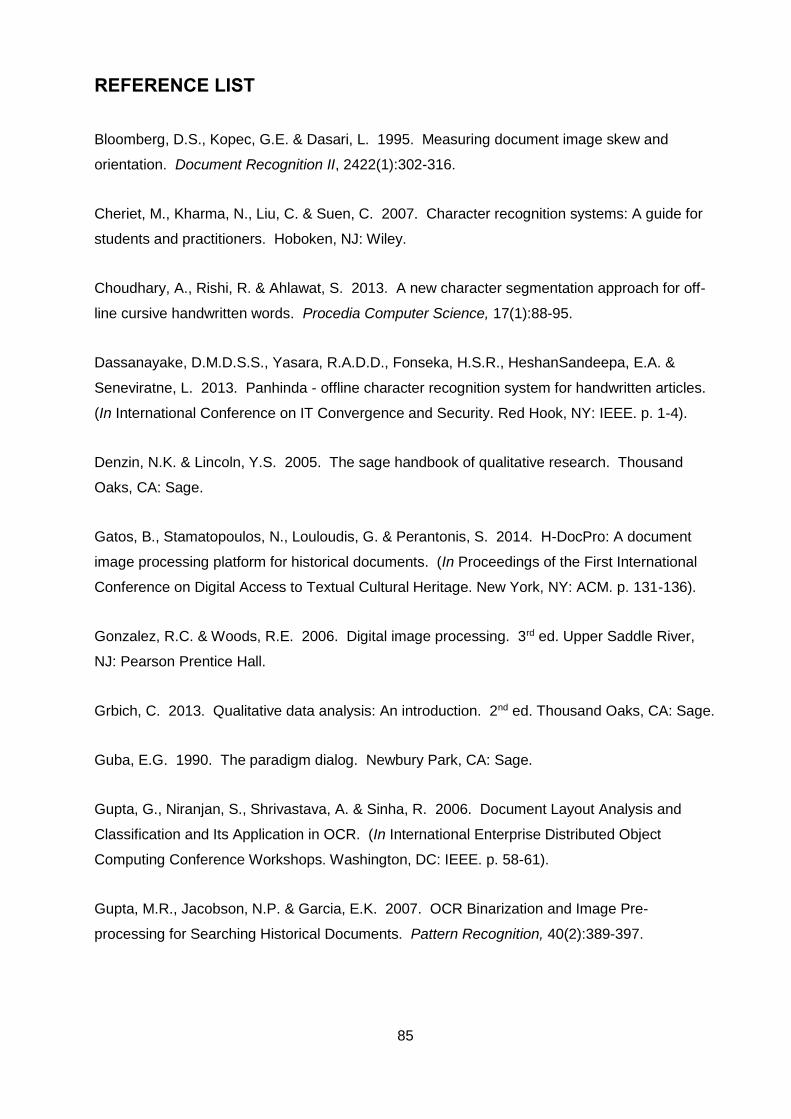
85
REFERENCE LIST
Bloomberg, D.S., Kopec, G.E. & Dasari, L. 1995. Measuring document image skew and
orientation. Document Recognition II, 2422(1):302-316.
Cheriet, M., Kharma, N., Liu, C. & Suen, C. 2007. Character recognition systems: A guide for
students and practitioners. Hoboken, NJ: Wiley.
Choudhary, A., Rishi, R. & Ahlawat, S. 2013. A new character segmentation approach for off-
line cursive handwritten words. Procedia Computer Science, 17(1):88-95.
Dassanayake, D.M.D.S.S., Yasara, R.A.D.D., Fonseka, H.S.R., HeshanSandeepa, E.A. &
Seneviratne, L. 2013. Panhinda - offline character recognition system for handwritten articles.
(In International Conference on IT Convergence and Security. Red Hook, NY: IEEE. p. 1-4).
Denzin, N.K. & Lincoln, Y.S. 2005. The sage handbook of qualitative research. Thousand
Oaks, CA: Sage.
Gatos, B., Stamatopoulos, N., Louloudis, G. & Perantonis, S. 2014. H-DocPro: A document
image processing platform for historical documents. (In Proceedings of the First International
Conference on Digital Access to Textual Cultural Heritage. New York, NY: ACM. p. 131-136).
Gonzalez, R.C. & Woods, R.E. 2006. Digital image processing. 3rd ed. Upper Saddle River,
NJ: Pearson Prentice Hall.
Grbich, C. 2013. Qualitative data analysis: An introduction. 2nd ed. Thousand Oaks, CA: Sage.
Guba, E.G. 1990. The paradigm dialog. Newbury Park, CA: Sage.
Gupta, G., Niranjan, S., Shrivastava, A. & Sinha, R. 2006. Document Layout Analysis and
Classification and Its Application in OCR. (In International Enterprise Distributed Object
Computing Conference Workshops. Washington, DC: IEEE. p. 58-61).
Gupta, M.R., Jacobson, N.P. & Garcia, E.K. 2007. OCR Binarization and Image Pre-
processing for Searching Historical Documents. Pattern Recognition, 40(2):389-397.

86
He, J., Do, Q.D.M., Downton, A.C. & Kim, J.H. 2005. A comparison of binarization methods for
historical archive documents. (In Proceedings of the Eighth International Conference on
Document Analysis and Recognition. Washington, DC: IEEE. p. 538-542).
Himmel, D.P. & Peasner, D. 1974. A Large-scale Optical Character Recognition System
Simulation. (In Proceedings of the 7th Conference on Winter Simulation. Washington, DC:
ACM. p. 239-248).
Ishitani, Y. 1997. Document Layout Analysis Based on Emergent Computation.
(In Proceedings of the Fourth International Conference on Document Analysis and Recognition.
Los Alamitos, CA: IEEE. p. 45-50).
Ishitani, Y. 1993. Document skew detection based on local region complexity.
(In Proceedings of the Second International Conference on Document Analysis and
Recognition. Los Alamitos, CA: IEEE. p. 49-52).
Jick, T.D. 1979. Mixing Qualitative and Quantitative Methods: Triangulation in Action.
Administrative Science Quarterly, 24(4):602-611.
Jung, K., Kim, K.I. & Jain, A.K. 2004. Text information extraction in images and video: a
survey. Pattern Recognition, 37(5):977-997.
Khurshid, K., Siddiqi, I., Faure, C. & Vincent, N. 2009. Comparison of Niblack inspired
binarization methods for ancient documents. Document Recognition and Retrieval, 47(1):72-82.
Lee, A.S. 2004. Thinking about Social Theory and Philosophy for Information Systems.
(In Mingers, J. & Willcocks, L., eds. Social Theory and Philosophy for Information Systems.
Chichester, UK: Wiley. p. 1-26).
Lim, S.H. 2006. Characterization of Noise in Digital Photographs for Image Processing. Digital
Photography II, 6069(1):216-228.
Liolios, N., Fakotakis, N. & Kokkinakis, G. 2002. On the generalization of the form identification
and skew detection problem. Pattern Recognition, 35(1):253-264.
Liu, C. & Fujisawa, H. 2008. Classification and Learning Methods for Character Recognition:
Advances and Remaining Problems. (In Marinai, S. & Fujisawa, H., eds. Machine Learning in
Document Analysis and Recognition. Heidelberg, Germany: Springer. p. 139-162).

87
Marinai, S. 2008. Introduction to Document Analysis and Recognition. (In Marinai, S. &
Fujisawa, H., eds. Machine Learning in Document Analysis and Recognition. Heidelberg,
Germany: Springer. p. 1-20).
Mori, S., Suen, C.Y. & Yamamoto, K. 1992. Historical review of OCR research and
development. Proceedings of the IEEE, 80(7):1029-1058.
Mori, S., Nishida, H. & Yamada, H. 1999. Character Recognition. (In Optical Character
Recognition. New York, NY: Wiley. p. 1-36).
Nagy, G., Seth, S. & Viswanathan, M. 1992. A Prototype Document Image Analysis System for
Technical Journals. Computer, 25(7):10-22.
Neves, R.F.P., Zanchettin, C. & Mello, C.A.B. 2013. An Adaptive Thresholding Algorithm
Based on Edge Detection and Morphological Operations for Document Images. (In
Proceedings of the 2013 ACM Symposium on Document Engineering. New York, NY: ACM. p.
107-110).
Oates, B.J. 2006. Researching Information Systems and Computing. London, UK: Sage.
Otsu, N. 1979. A Threshold Selection Method from Gray-Level Histograms. IEEE
Transactions on Systems, Man, and Cybernetics, 9(1):62-66.
Patidar, P. & Nagawat, A.K. 2010. Image de-noising by various filters for different noise.
International Journal of Computer Applications, 9(4):45-50.
Patton, M.Q. 1990. Qualitative Evaluation and Research Methods. 2nd ed. Newbury Park, CA:
Sage.
Patvardhan, C., Verma, A.K. & Lakshmi, C.V. 2012. Document image binarization using
wavelets for OCR applications. (In Proceedings of the Eighth Indian Conference on Computer
Vision, Graphics and Image Processing. New York, NY: ACM. p. 60-68).
Plamondon, R. & Srihari, S.N. 2000. On-Line and Off-Line Handwriting Recognition: A
Comprehensive Survey. IEEE Transactions on Pattern Analysis and Machine Intelligence,
22(1):63-84.

88
Rabeux, V., Journet, N., Vialard, A. & Domenger, J. 2014. Quality Evaluation of Degraded
Document Images for Binarization Result Prediction. International Journal on Document
Analysis and Recognition, 17(2):125-137.
Robertson, B., Dalitz, C. & Schmitt, F. 2014. Automated Page Layout Simplification of
Patrologia Graeca. (In Proceedings of the First International Conference on Digital Access to
Textual Cultural Heritage. New York, NY: ACM. p. 167-172).
Schantz, H.F. 1982. History of OCR, Optical Character Recognition. Manchester Center, VT:
Recognition Technologies Users Association.
Sellen, J. & Harper, R.H.R. 2003. The Myth of the Paperless Office. Cambridge, MA: MIT
Press.
Shafait, F. 2009. Document Image Analysis with OCRopus. (In 13th International Multitopic
Conference. Washington, DC: IEEE. p. 1-6).
Shafait, F., Keysers, D. & Breuel, T. 2006. Performance Comparison of Six Algorithms for
Page Segmentation. Document analysis systems, 3872(7):368-379.
Shivakumara, P., Kumar, G.H., Guru, D.S. & Nagabhushan, P. 2005. A New Boundary
Growing and Hough Transform Based Approach for Accurate Skew Detection in Binary
Document Images. (In Proceedings of International Conference on Intelligent Sensing and
Information Processing. Piscataway, NJ: IEEE. p. 140-146).
Shivakumara, P. & Kumar, G.H. 2006. A novel boundary growing approach for accurate skew
estimation of binary document images. Pattern Recognition Letters, 27(7):791-801.
Stoliński, S. & Bieniecki, W. 2011. Application of OCR systems to processing and digitization
of paper documents. Information Systems in Management, 8(1):1-102.
Tang, J., Sun, Q., Liu, J. & Cao, Y. 2007. An Adaptive Anisotropic Diffusion Filter for Noise
Reduction in MR Images. (In International Conference on Mechatronics and Automation.
Washington, DC: IEEE. p. 1299-1304).
Thomas, P.Y. 2010. Towards developing a web-based blended learning environment at the
University of Botswana. Pretoria: Unisa. (Thesis – PhD).

89
Vamvakas, G., Gatos, B., Stamatopoulos, N. & Perantonis, S.J. 2008. A Complete Optical
Character Recognition Methodology for Historical Documents. (In Proceedings of the 8th IAPR
International Workshop on Document Analysis Systems. Los Alamitos, CA: IEEE. p. 525-533).
Verma, R. & Ali, J. 2013. A Comparative Study of Various Types of Image Noise and Efficient
Noise Removal Techniques. International Journal of Advanced Research in Computer Science
and Software Engineering, 3(10):617-622.
Vidyasaraswathi, N. & Hanumantharaju, M.C. 2015. Review of Various Histogram Based
Medical Image Enhancement Techniques. (In Proceedings of the 2015 International
Conference on Advanced Research in Computer Science Engineering & Technology. New
York, NY: ACM. p. 48-53).
Wikipedia. 2015. Precision and recall. https://en.wikipedia.org/wiki/Precision_and_recall
Date of access: 2 Sep. 2015.
Ye, Q., Jiao, J., Huang, J. & Yu, H. 2007. Text Detection and Restoration in Natural Scene
Images. Journal of Visual Communication and Image Representation, 18(6):504-513.
Yin, R.K. 2012. Applications of Case Study Research. 3rd ed. Thousand Oaks, CA: Sage.
Zagoris, K., Ergina, K. & Papamarkos, N. 2010. A Document Image Retrieval System.
Engineering Applications of Artificial Intelligence, 23(6):872-879.
Zhang, H., Zhao, K., Song, Y. & Guo, J. 2013. Text extraction from natural scene image: A
survey. Neurocomputing, 122(1):310-323.
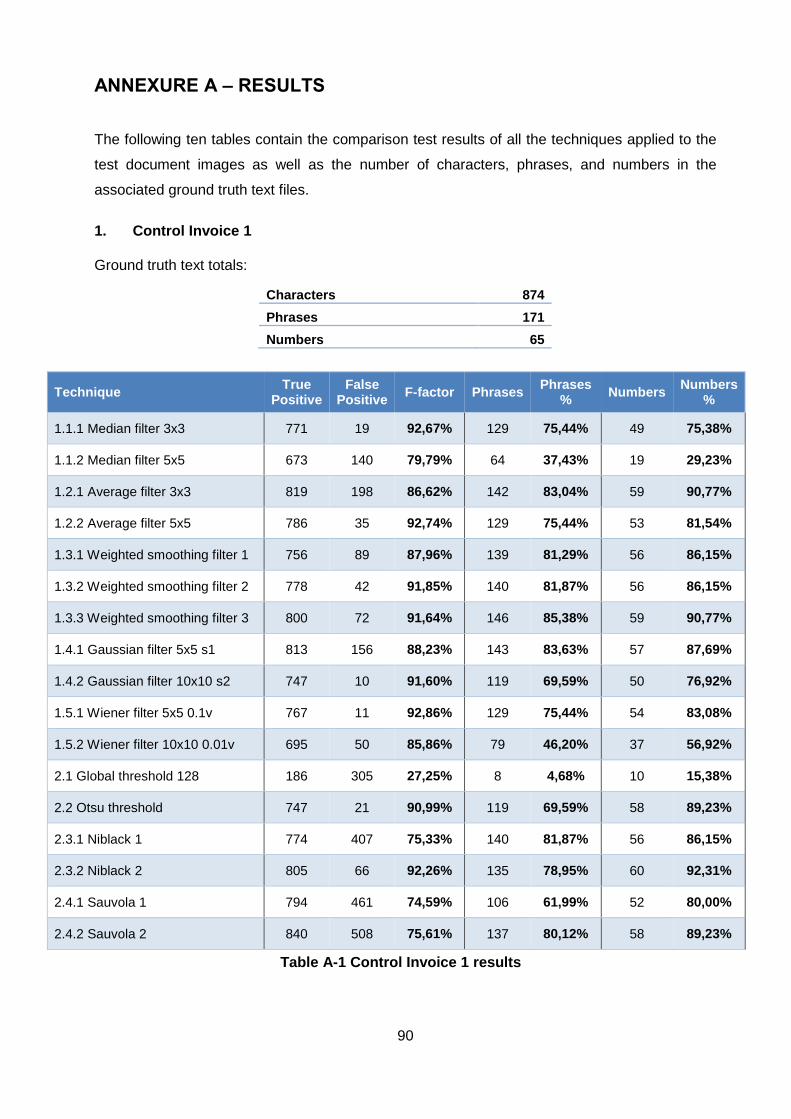
90
ANNEXURE A – RESULTS
The following ten tables contain the comparison test results of all the techniques applied to the
test document images as well as the number of characters, phrases, and numbers in the
associated ground truth text files.
1. Control Invoice 1
Ground truth text totals:
Characters 874
Phrases 171
Numbers 65
Technique True
Positive False
Positive F-factor Phrases
Phrases %
Numbers Numbers
%
1.1.1 Median filter 3x3 771 19 92,67% 129 75,44% 49 75,38%
1.1.2 Median filter 5x5 673 140 79,79% 64 37,43% 19 29,23%
1.2.1 Average filter 3x3 819 198 86,62% 142 83,04% 59 90,77%
1.2.2 Average filter 5x5 786 35 92,74% 129 75,44% 53 81,54%
1.3.1 Weighted smoothing filter 1 756 89 87,96% 139 81,29% 56 86,15%
1.3.2 Weighted smoothing filter 2 778 42 91,85% 140 81,87% 56 86,15%
1.3.3 Weighted smoothing filter 3 800 72 91,64% 146 85,38% 59 90,77%
1.4.1 Gaussian filter 5x5 s1 813 156 88,23% 143 83,63% 57 87,69%
1.4.2 Gaussian filter 10x10 s2 747 10 91,60% 119 69,59% 50 76,92%
1.5.1 Wiener filter 5x5 0.1v 767 11 92,86% 129 75,44% 54 83,08%
1.5.2 Wiener filter 10x10 0.01v 695 50 85,86% 79 46,20% 37 56,92%
2.1 Global threshold 128 186 305 27,25% 8 4,68% 10 15,38%
2.2 Otsu threshold 747 21 90,99% 119 69,59% 58 89,23%
2.3.1 Niblack 1 774 407 75,33% 140 81,87% 56 86,15%
2.3.2 Niblack 2 805 66 92,26% 135 78,95% 60 92,31%
2.4.1 Sauvola 1 794 461 74,59% 106 61,99% 52 80,00%
2.4.2 Sauvola 2 840 508 75,61% 137 80,12% 58 89,23%
Table A-1 Control Invoice 1 results

91
2. Control Invoice 2
Ground truth text totals:
Characters 1489
Phrases 347
Numbers 162
Technique True
Positive False
Positive F-factor Phrases
Phrases %
Numbers Numbers
%
1.1.1 Median filter 3x3 1417 14 97,05% 309 89,05% 154 95,06%
1.1.2 Median filter 5x5 1230 190 84,57% 176 50,72% 96 59,26%
1.2.1 Average filter 3x3 1388 1 96,46% 320 92,22% 157 96,91%
1.2.2 Average filter 5x5 1334 7 94,28% 298 85,88% 153 94,44%
1.3.1 Weighted smoothing filter 1 1392 1 96,60% 321 92,51% 157 96,91%
1.3.2 Weighted smoothing filter 2 1388 1 96,46% 320 92,22% 157 96,91%
1.3.3 Weighted smoothing filter 3 1387 2 96,39% 314 90,49% 156 96,30%
1.4.1 Gaussian filter 5x5 s1 1388 1 96,46% 321 92,51% 157 96,91%
1.4.2 Gaussian filter 10x10 s2 1358 17 94,83% 294 84,73% 153 94,44%
1.5.1 Wiener filter 5x5 0.1v 1331 8 94,13% 298 85,88% 154 95,06%
1.5.2 Wiener filter 10x10 0.01v 1416 5 97,32% 324 93,37% 157 96,91%
2.1 Global threshold 128 1396 65 94,64% 268 77,23% 133 82,10%
2.2 Otsu threshold 1415 4 97,32% 322 92,80% 157 96,91%
2.3.1 Niblack 1 1395 322 87,02% 282 81,27% 124 76,54%
2.3.2 Niblack 2 1454 100 95,56% 330 95,10% 157 96,91%
2.4.1 Sauvola 1 1389 0 96,53% 315 90,78% 157 96,91%
2.4.2 Sauvola 2 1429 89 95,04% 325 93,66% 157 96,91%
Table A-2 Control Invoice 2 results
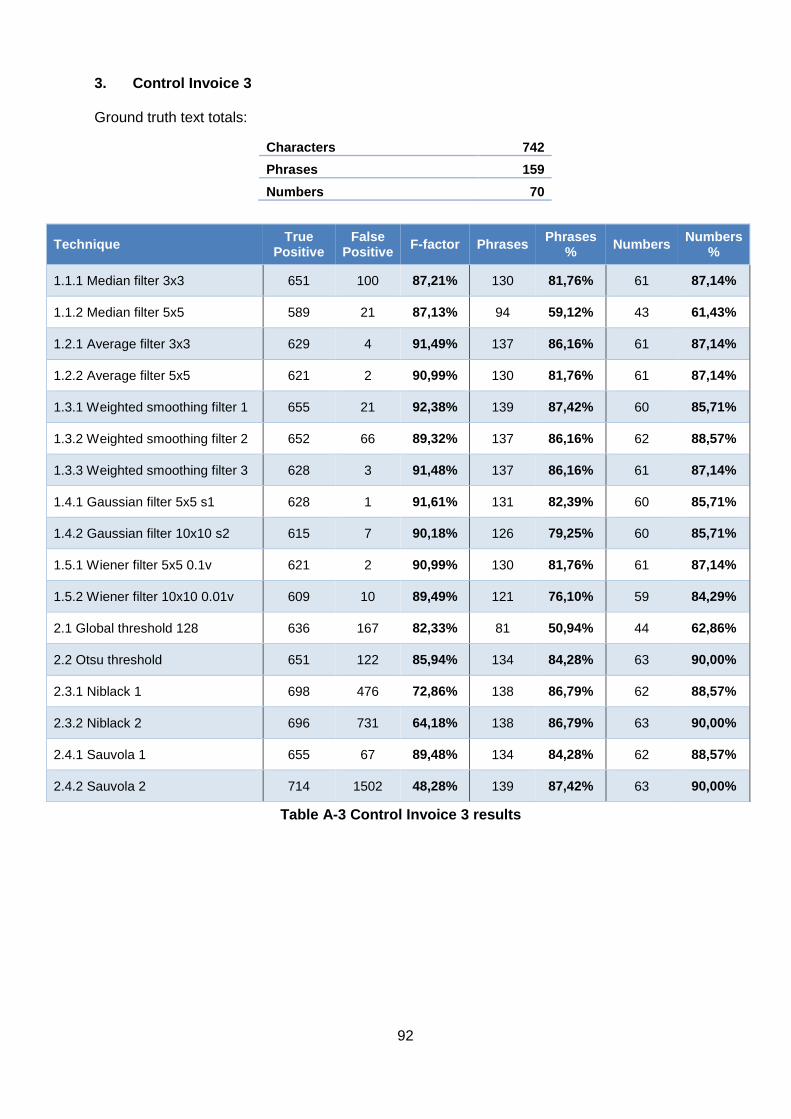
92
3. Control Invoice 3
Ground truth text totals:
Characters 742
Phrases 159
Numbers 70
Technique True
Positive False
Positive F-factor Phrases
Phrases %
Numbers Numbers
%
1.1.1 Median filter 3x3 651 100 87,21% 130 81,76% 61 87,14%
1.1.2 Median filter 5x5 589 21 87,13% 94 59,12% 43 61,43%
1.2.1 Average filter 3x3 629 4 91,49% 137 86,16% 61 87,14%
1.2.2 Average filter 5x5 621 2 90,99% 130 81,76% 61 87,14%
1.3.1 Weighted smoothing filter 1 655 21 92,38% 139 87,42% 60 85,71%
1.3.2 Weighted smoothing filter 2 652 66 89,32% 137 86,16% 62 88,57%
1.3.3 Weighted smoothing filter 3 628 3 91,48% 137 86,16% 61 87,14%
1.4.1 Gaussian filter 5x5 s1 628 1 91,61% 131 82,39% 60 85,71%
1.4.2 Gaussian filter 10x10 s2 615 7 90,18% 126 79,25% 60 85,71%
1.5.1 Wiener filter 5x5 0.1v 621 2 90,99% 130 81,76% 61 87,14%
1.5.2 Wiener filter 10x10 0.01v 609 10 89,49% 121 76,10% 59 84,29%
2.1 Global threshold 128 636 167 82,33% 81 50,94% 44 62,86%
2.2 Otsu threshold 651 122 85,94% 134 84,28% 63 90,00%
2.3.1 Niblack 1 698 476 72,86% 138 86,79% 62 88,57%
2.3.2 Niblack 2 696 731 64,18% 138 86,79% 63 90,00%
2.4.1 Sauvola 1 655 67 89,48% 134 84,28% 62 88,57%
2.4.2 Sauvola 2 714 1502 48,28% 139 87,42% 63 90,00%
Table A-3 Control Invoice 3 results

93
4. Real Invoice 1
Ground truth text totals:
Characters 2368
Phrases 453
Numbers 130
Technique True
Positive False
Positive F-factor Phrases
Phrases %
Numbers Numbers
%
1.1.1 Median filter 3x3 2049 157 89,59% 252 55,63% 66 50,77%
1.1.2 Median filter 5x5 1779 546 75,82% 131 28,92% 40 30,77%
1.2.1 Average filter 3x3 2095 260 88,71% 282 62,25% 68 52,31%
1.2.2 Average filter 5x5 1975 310 84,89% 188 41,50% 56 43,08%
1.3.1 Weighted smoothing filter 1 2096 180 90,27% 296 65,34% 73 56,15%
1.3.2 Weighted smoothing filter 2 2086 186 89,91% 299 66,00% 78 60,00%
1.3.3 Weighted smoothing filter 3 2110 184 90,52% 300 66,23% 77 59,23%
1.4.1 Gaussian filter 5x5 s1 2063 261 87,94% 284 62,69% 76 58,46%
1.4.2 Gaussian filter 10x10 s2 1804 296 80,75% 142 31,35% 42 32,31%
1.5.1 Wiener filter 5x5 0.1v 1960 293 84,83% 190 41,94% 54 41,54%
1.5.2 Wiener filter 10x10 0.01v 2128 184 90,94% 304 67,11% 78 60,00%
2.1 Global threshold 128 2075 189 89,59% 276 60,93% 62 47,69%
2.2 Otsu threshold 2103 214 89,78% 299 66,00% 73 56,15%
2.3.1 Niblack 1 2176 196 91,81% 336 74,17% 82 63,08%
2.3.2 Niblack 2 2143 182 91,33% 321 70,86% 85 65,38%
2.4.1 Sauvola 1 2140 168 91,53% 325 71,74% 87 66,92%
2.4.2 Sauvola 2 2118 171 90,96% 319 70,42% 85 65,38%
Table A-4 Real Invoice 1 results

94
5. Real Invoice 2
Ground truth text totals:
Characters 2956
Phrases 585
Numbers 139
Technique True
Positive False
Positive F-factor Phrases
Phrases %
Numbers Numbers
%
1.1.1 Median filter 3x3 2783 87 95,54% 472 80,68% 112 80,58%
1.1.2 Median filter 5x5 2283 712 76,73% 262 44,79% 31 22,30%
1.2.1 Average filter 3x3 2811 134 95,27% 491 83,93% 122 87,77%
1.2.2 Average filter 5x5 2672 88 93,49% 426 72,82% 93 66,91%
1.3.1 Weighted smoothing filter 1 2819 143 95,27% 473 80,85% 119 85,61%
1.3.2 Weighted smoothing filter 2 2818 159 94,99% 490 83,76% 126 90,65%
1.3.3 Weighted smoothing filter 3 2849 148 95,72% 508 86,84% 125 89,93%
1.4.1 Gaussian filter 5x5 s1 2855 164 95,56% 503 85,98% 124 89,21%
1.4.2 Gaussian filter 10x10 s2 2488 61 90,39% 358 61,20% 68 48,92%
1.5.1 Wiener filter 5x5 0.1v 2665 74 93,59% 414 70,77% 84 60,43%
1.5.2 Wiener filter 10x10 0.01v 2778 52 96,02% 462 78,97% 85 61,15%
2.1 Global threshold 128 2586 362 87,60% 315 53,85% 71 51,08%
2.2 Otsu threshold 2754 77 95,18% 427 72,99% 124 89,21%
2.3.1 Niblack 1 2935 246 95,65% 466 79,66% 133 95,68%
2.3.2 Niblack 2 2830 240 93,93% 444 75,90% 133 95,68%
2.4.1 Sauvola 1 2903 192 95,95% 453 77,44% 126 90,65%
2.4.2 Sauvola 2 2831 159 95,22% 437 74,70% 133 95,68%
Table A-5 Real Invoice 2 results

95
6. Real Invoice 3
Ground truth text totals:
Characters 1425
Phrases 249
Numbers 66
Technique True
Positive False
Positive F-factor Phrases
Phrases %
Numbers Numbers
%
1.1.1 Median filter 3x3 1356 257 89,27% 171 68,67% 56 84,85%
1.1.2 Median filter 5x5 1057 325 75,31% 72 28,92% 30 45,45%
1.2.1 Average filter 3x3 1332 152 91,58% 173 69,48% 54 81,82%
1.2.2 Average filter 5x5 1143 262 80,78% 87 34,94% 37 56,06%
1.3.1 Weighted smoothing filter 1 1287 72 92,46% 172 69,08% 48 72,73%
1.3.2 Weighted smoothing filter 2 1314 215 88,96% 175 70,28% 55 83,33%
1.3.3 Weighted smoothing filter 3 1359 137 93,05% 175 70,28% 52 78,79%
1.4.1 Gaussian filter 5x5 s1 1348 160 91,92% 177 71,08% 53 80,30%
1.4.2 Gaussian filter 10x10 s2 993 162 76,98% 77 30,92% 41 62,12%
1.5.1 Wiener filter 5x5 0.1v 1197 301 81,90% 101 40,56% 41 62,12%
1.5.2 Wiener filter 10x10 0.01v 1344 222 89,87% 167 67,07% 44 66,67%
2.1 Global threshold 128 1326 312 86,58% 140 56,22% 45 68,18%
2.2 Otsu threshold 1346 196 90,73% 191 76,71% 56 84,85%
2.3.1 Niblack 1 1333 166 91,18% 198 79,52% 59 89,39%
2.3.2 Niblack 2 1414 330 89,24% 192 77,11% 58 87,88%
2.4.1 Sauvola 1 1346 169 91,56% 204 81,93% 59 89,39%
2.4.2 Sauvola 2 1360 206 90,94% 192 77,11% 58 87,88%
Table A-6 Real Invoice 3 results

96
7. Noisy Invoice 1
Ground truth text totals:
Characters 1620
Phrases 304
Numbers 97
Technique True
Positive False
Positive F-factor Phrases
Phrases %
Numbers Numbers
%
1.1.1 Median filter 3x3 1453 150 90,16% 169 55,59% 52 53,61%
1.1.2 Median filter 5x5 1138 433 71,33% 58 19,08% 21 21,65%
1.2.1 Average filter 3x3 1434 138 89,85% 179 58,88% 47 48,45%
1.2.2 Average filter 5x5 1329 247 83,17% 93 30,59% 28 28,87%
1.3.1 Weighted smoothing filter 1 1477 99 92,43% 198 65,13% 59 60,82%
1.3.2 Weighted smoothing filter 2 1467 99 92,09% 196 64,47% 61 62,89%
1.3.3 Weighted smoothing filter 3 1482 103 92,48% 197 64,80% 55 56,70%
1.4.1 Gaussian filter 5x5 s1 1460 119 91,28% 189 62,17% 62 63,92%
1.4.2 Gaussian filter 10x10 s2 1237 278 78,92% 79 25,99% 25 25,77%
1.5.1 Wiener filter 5x5 0.1v 1269 276 80,19% 101 33,22% 33 34,02%
1.5.2 Wiener filter 10x10 0.01v 1430 142 89,60% 160 52,63% 49 50,52%
Table A-7 Noisy Invoice 1 results

97
8. Noisy Invoice 2
Ground truth text totals:
Characters 1622
Phrases 307
Numbers 99
Technique True
Positive False
Positive F-factor Phrases
Phrases %
Numbers Numbers
%
1.1.1 Median filter 3x3 1440 116 90,62% 188 61,24% 58 58,59%
1.1.2 Median filter 5x5 1106 527 67,96% 49 15,96% 27 27,27%
1.2.1 Average filter 3x3 1484 82 93,10% 217 70,68% 62 62,63%
1.2.2 Average filter 5x5 1370 169 86,68% 131 42,67% 49 49,49%
1.3.1 Weighted smoothing filter 1 1502 75 93,90% 234 76,22% 74 74,75%
1.3.2 Weighted smoothing filter 2 1536 60 95,46% 227 73,94% 67 67,68%
1.3.3 Weighted smoothing filter 3 1504 87 93,62% 221 71,99% 67 67,68%
1.4.1 Gaussian filter 5x5 s1 1480 87 92,82% 205 66,78% 60 60,61%
1.4.2 Gaussian filter 10x10 s2 1332 203 84,38% 107 34,85% 42 42,42%
1.5.1 Wiener filter 5x5 0.1v 1343 212 84,55% 125 40,72% 48 48,48%
1.5.2 Wiener filter 10x10 0.01v 1489 65 93,77% 217 70,68% 70 70,71%
Table A-8 Noisy Invoice 2 results

98
9. Noisy Invoice 3
Ground truth text totals:
Characters 1655
Phrases 308
Numbers 99
Technique True
Positive False
Positive F-factor Phrases
Phrases %
Numbers Numbers
%
1.1.1 Median filter 3x3 1511 98 92,59% 201 65,26% 51 51,52%
1.1.2 Median filter 5x5 1176 521 70,17% 52 16,88% 23 23,23%
1.2.1 Average filter 3x3 1554 2216 57,29% 170 55,19% 57 57,58%
1.2.2 Average filter 5x5 1412 178 87,03% 136 44,16% 51 51,52%
1.3.1 Weighted smoothing filter 1 1544 372 86,47% 186 60,39% 54 54,55%
1.3.2 Weighted smoothing filter 2 1557 375 86,81% 205 66,56% 66 66,67%
1.3.3 Weighted smoothing filter 3 1568 607 81,88% 224 72,73% 64 64,65%
1.4.1 Gaussian filter 5x5 s1 1539 372 86,32% 212 68,83% 61 61,62%
1.4.2 Gaussian filter 10x10 s2 1400 162 87,04% 101 32,79% 38 38,38%
1.5.1 Wiener filter 5x5 0.1v 1381 280 83,29% 111 36,04% 45 45,45%
1.5.2 Wiener filter 10x10 0.01v 1461 175 88,79% 138 44,81% 44 44,44%
Table A-9 Noisy Invoice 3 results
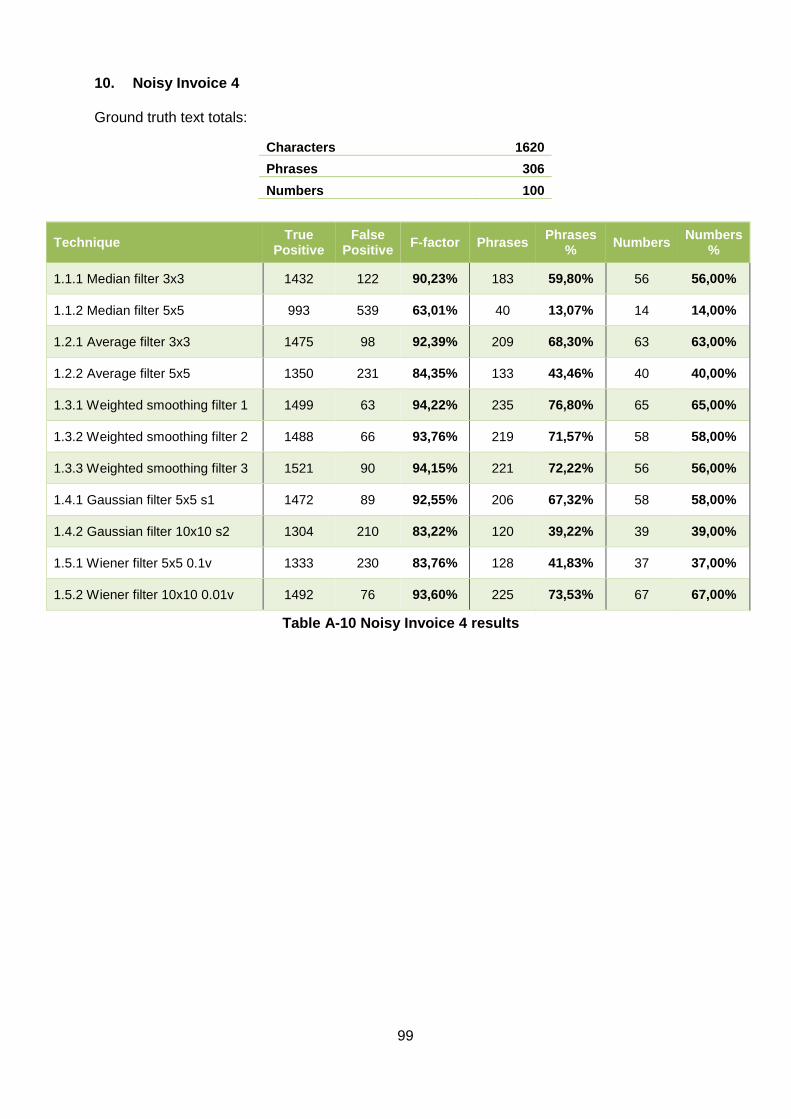
99
10. Noisy Invoice 4
Ground truth text totals:
Characters 1620
Phrases 306
Numbers 100
Technique True
Positive False
Positive F-factor Phrases
Phrases %
Numbers Numbers
%
1.1.1 Median filter 3x3 1432 122 90,23% 183 59,80% 56 56,00%
1.1.2 Median filter 5x5 993 539 63,01% 40 13,07% 14 14,00%
1.2.1 Average filter 3x3 1475 98 92,39% 209 68,30% 63 63,00%
1.2.2 Average filter 5x5 1350 231 84,35% 133 43,46% 40 40,00%
1.3.1 Weighted smoothing filter 1 1499 63 94,22% 235 76,80% 65 65,00%
1.3.2 Weighted smoothing filter 2 1488 66 93,76% 219 71,57% 58 58,00%
1.3.3 Weighted smoothing filter 3 1521 90 94,15% 221 72,22% 56 56,00%
1.4.1 Gaussian filter 5x5 s1 1472 89 92,55% 206 67,32% 58 58,00%
1.4.2 Gaussian filter 10x10 s2 1304 210 83,22% 120 39,22% 39 39,00%
1.5.1 Wiener filter 5x5 0.1v 1333 230 83,76% 128 41,83% 37 37,00%
1.5.2 Wiener filter 10x10 0.01v 1492 76 93,60% 225 73,53% 67 67,00%
Table A-10 Noisy Invoice 4 results
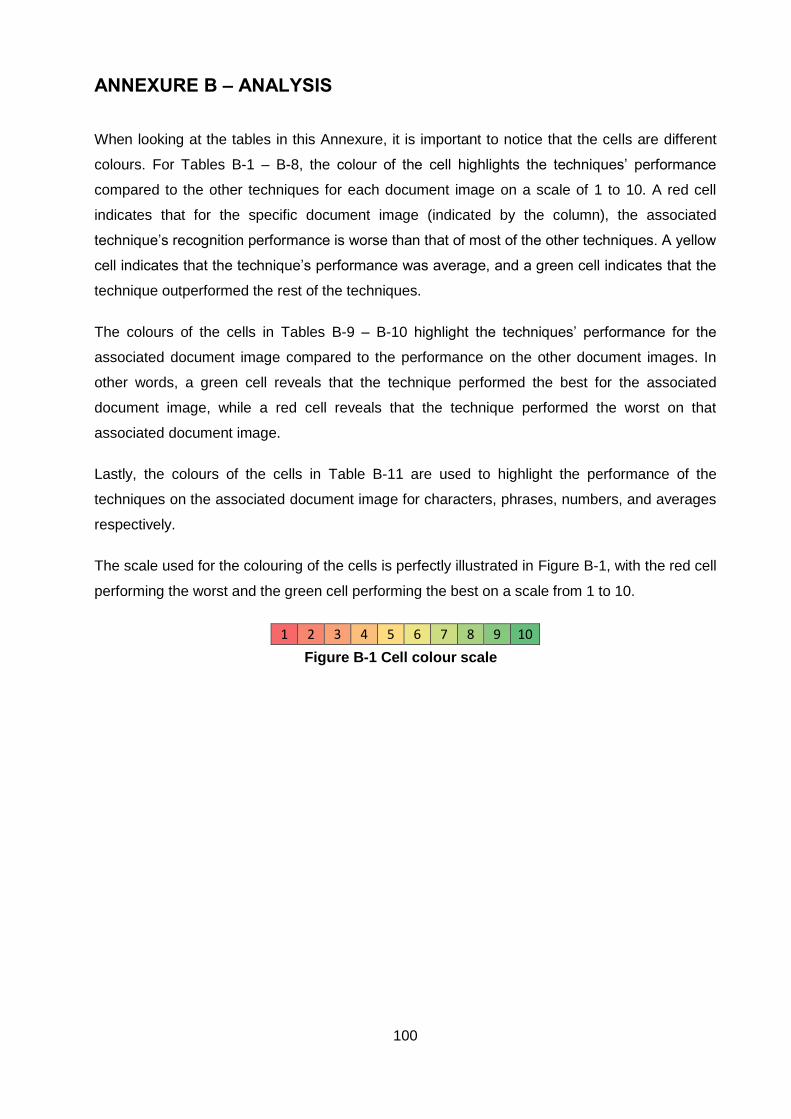
100
ANNEXURE B – ANALYSIS
When looking at the tables in this Annexure, it is important to notice that the cells are different
colours. For Tables B-1 – B-8, the colour of the cell highlights the techniques’ performance
compared to the other techniques for each document image on a scale of 1 to 10. A red cell
indicates that for the specific document image (indicated by the column), the associated
technique’s recognition performance is worse than that of most of the other techniques. A yellow
cell indicates that the technique’s performance was average, and a green cell indicates that the
technique outperformed the rest of the techniques.
The colours of the cells in Tables B-9 – B-10 highlight the techniques’ performance for the
associated document image compared to the performance on the other document images. In
other words, a green cell reveals that the technique performed the best for the associated
document image, while a red cell reveals that the technique performed the worst on that
associated document image.
Lastly, the colours of the cells in Table B-11 are used to highlight the performance of the
techniques on the associated document image for characters, phrases, numbers, and averages
respectively.
The scale used for the colouring of the cells is perfectly illustrated in Figure B-1, with the red cell
performing the worst and the green cell performing the best on a scale from 1 to 10.
1 2 3 4 5 6 7 8 9 10
Figure B-1 Cell colour scale

101
1. Characters
Table B-1 Average by characters recognized – Noise reduction
Technique Ctrl
Inv 1 Ctrl
Inv 2 Ctrl
Inv 3 Real Inv 1
Real Inv 2
Real Inv 3
Noise Inv 1
Noise Inv 2
Noise Inv 3
Noise Inv 4
Average
1.1.1 Median filter 3x3 92,67% 97,05% 87,21% 89,59% 95,54% 89,27% 90,16% 90,62% 92,59% 90,23% 91,49%
1.1.2 Median filter 5x5 79,79% 84,57% 87,13% 75,82% 76,73% 75,31% 71,33% 67,96% 70,17% 63,01% 75,18%
1.2.1 Average filter 3x3 86,62% 96,46% 91,49% 88,71% 95,27% 91,58% 89,85% 93,10% 57,29% 92,39% 88,28%
1.2.2 Average filter 5x5 92,74% 94,28% 90,99% 84,89% 93,49% 80,78% 83,17% 86,68% 87,03% 84,35% 87,84%
1.3.1 Weighted smoothing filter 1 87,96% 96,60% 92,38% 90,27% 95,27% 92,46% 92,43% 93,90% 86,47% 94,22% 92,20%
1.3.2 Weighted smoothing filter 2 91,85% 96,46% 89,32% 89,91% 94,99% 88,96% 92,09% 95,46% 86,81% 93,76% 91,96%
1.3.3 Weighted smoothing filter 3 91,64% 96,39% 91,48% 90,52% 95,72% 93,05% 92,48% 93,62% 81,88% 94,15% 92,09%
1.4.1 Gaussian filter 5x5 s1 88,23% 96,46% 91,61% 87,94% 95,56% 91,92% 91,28% 92,82% 86,32% 92,55% 91,47%
1.4.2 Gaussian filter 10x10 s2 91,60% 94,83% 90,18% 80,75% 90,39% 76,98% 78,92% 84,38% 87,04% 83,22% 85,83%
1.5.1 Wiener filter 5x5 0.1v 92,86% 94,13% 90,99% 84,83% 93,59% 81,90% 80,19% 84,55% 83,29% 83,76% 87,01%
1.5.2 Wiener filter 10x10 0.01v 85,86% 97,32% 89,49% 90,94% 96,02% 89,87% 89,60% 93,77% 88,79% 93,60% 91,53%
Table B-2 Average by characters recognized – Binarization
Technique Ctrl Inv
1 Ctrl Inv
2 Ctrl Inv
3 Real Inv 1
Real Inv 2
Real Inv 3
Average
2.1 Global threshold 128 27,25% 94,64% 82,33% 89,59% 87,60% 86,58% 78,00%
2.2 Otsu threshold 90,99% 97,32% 85,94% 89,78% 95,18% 90,73% 91,66%
2.3.1 Niblack 1 75,33% 87,02% 72,86% 91,81% 95,65% 91,18% 85,64%
2.3.2 Niblack 2 92,26% 95,56% 64,18% 91,33% 93,93% 89,24% 87,75%
2.4.1 Sauvola 1 74,59% 96,53% 89,48% 91,53% 95,95% 91,56% 89,94%
2.4.2 Sauvola 2 75,61% 95,04% 48,28% 90,96% 95,22% 90,94% 82,68%
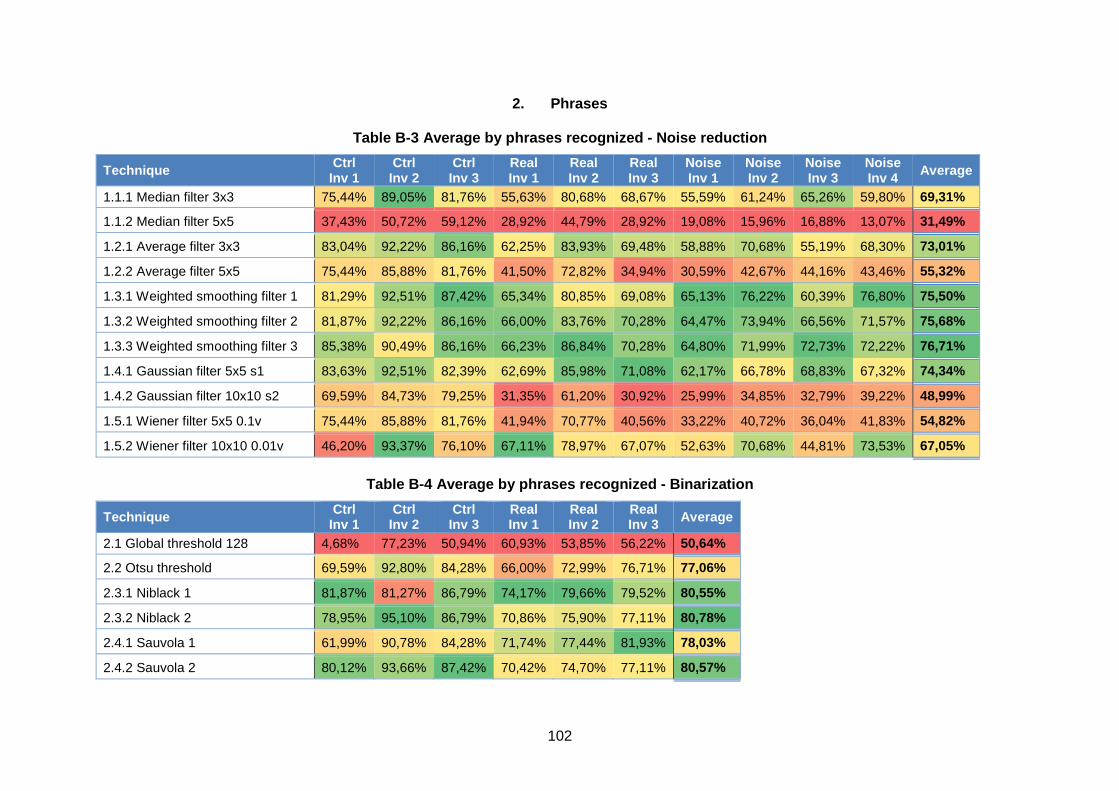
102
2. Phrases
Table B-3 Average by phrases recognized - Noise reduction
Technique Ctrl
Inv 1 Ctrl
Inv 2 Ctrl
Inv 3 Real Inv 1
Real Inv 2
Real Inv 3
Noise Inv 1
Noise Inv 2
Noise Inv 3
Noise Inv 4
Average
1.1.1 Median filter 3x3 75,44% 89,05% 81,76% 55,63% 80,68% 68,67% 55,59% 61,24% 65,26% 59,80% 69,31%
1.1.2 Median filter 5x5 37,43% 50,72% 59,12% 28,92% 44,79% 28,92% 19,08% 15,96% 16,88% 13,07% 31,49%
1.2.1 Average filter 3x3 83,04% 92,22% 86,16% 62,25% 83,93% 69,48% 58,88% 70,68% 55,19% 68,30% 73,01%
1.2.2 Average filter 5x5 75,44% 85,88% 81,76% 41,50% 72,82% 34,94% 30,59% 42,67% 44,16% 43,46% 55,32%
1.3.1 Weighted smoothing filter 1 81,29% 92,51% 87,42% 65,34% 80,85% 69,08% 65,13% 76,22% 60,39% 76,80% 75,50%
1.3.2 Weighted smoothing filter 2 81,87% 92,22% 86,16% 66,00% 83,76% 70,28% 64,47% 73,94% 66,56% 71,57% 75,68%
1.3.3 Weighted smoothing filter 3 85,38% 90,49% 86,16% 66,23% 86,84% 70,28% 64,80% 71,99% 72,73% 72,22% 76,71%
1.4.1 Gaussian filter 5x5 s1 83,63% 92,51% 82,39% 62,69% 85,98% 71,08% 62,17% 66,78% 68,83% 67,32% 74,34%
1.4.2 Gaussian filter 10x10 s2 69,59% 84,73% 79,25% 31,35% 61,20% 30,92% 25,99% 34,85% 32,79% 39,22% 48,99%
1.5.1 Wiener filter 5x5 0.1v 75,44% 85,88% 81,76% 41,94% 70,77% 40,56% 33,22% 40,72% 36,04% 41,83% 54,82%
1.5.2 Wiener filter 10x10 0.01v 46,20% 93,37% 76,10% 67,11% 78,97% 67,07% 52,63% 70,68% 44,81% 73,53% 67,05%
Table B-4 Average by phrases recognized - Binarization
Technique Ctrl
Inv 1 Ctrl
Inv 2 Ctrl
Inv 3 Real Inv 1
Real Inv 2
Real Inv 3
Average
2.1 Global threshold 128 4,68% 77,23% 50,94% 60,93% 53,85% 56,22% 50,64%
2.2 Otsu threshold 69,59% 92,80% 84,28% 66,00% 72,99% 76,71% 77,06%
2.3.1 Niblack 1 81,87% 81,27% 86,79% 74,17% 79,66% 79,52% 80,55%
2.3.2 Niblack 2 78,95% 95,10% 86,79% 70,86% 75,90% 77,11% 80,78%
2.4.1 Sauvola 1 61,99% 90,78% 84,28% 71,74% 77,44% 81,93% 78,03%
2.4.2 Sauvola 2 80,12% 93,66% 87,42% 70,42% 74,70% 77,11% 80,57%

103
3. Numbers
Table B-5 Average by numbers recognized - Noise reduction
Technique Ctrl
Inv 1 Ctrl
Inv 2 Ctrl
Inv 3 Real Inv 1
Real Inv 2
Real Inv 3
Noise Inv 1
Noise Inv 2
Noise Inv 3
Noise Inv 4
Average
1.1.1 Median filter 3x3 75,38% 95,06% 87,14% 50,77% 80,58% 84,85% 53,61% 58,59% 51,52% 56,00% 69,35%
1.1.2 Median filter 5x5 29,23% 59,26% 61,43% 30,77% 22,30% 45,45% 21,65% 27,27% 23,23% 14,00% 33,46%
1.2.1 Average filter 3x3 90,77% 96,91% 87,14% 52,31% 87,77% 81,82% 48,45% 62,63% 57,58% 63,00% 72,84%
1.2.2 Average filter 5x5 81,54% 94,44% 87,14% 43,08% 66,91% 56,06% 28,87% 49,49% 51,52% 40,00% 59,90%
1.3.1 Weighted smoothing filter 1 86,15% 96,91% 85,71% 56,15% 85,61% 72,73% 60,82% 74,75% 54,55% 65,00% 73,84%
1.3.2 Weighted smoothing filter 2 86,15% 96,91% 88,57% 60,00% 90,65% 83,33% 62,89% 67,68% 66,67% 58,00% 76,08%
1.3.3 Weighted smoothing filter 3 90,77% 96,30% 87,14% 59,23% 89,93% 78,79% 56,70% 67,68% 64,65% 56,00% 74,72%
1.4.1 Gaussian filter 5x5 s1 87,69% 96,91% 85,71% 58,46% 89,21% 80,30% 63,92% 60,61% 61,62% 58,00% 74,24%
1.4.2 Gaussian filter 10x10 s2 76,92% 94,44% 85,71% 32,31% 48,92% 62,12% 25,77% 42,42% 38,38% 39,00% 54,60%
1.5.1 Wiener filter 5x5 0.1v 83,08% 95,06% 87,14% 41,54% 60,43% 62,12% 34,02% 48,48% 45,45% 37,00% 59,43%
1.5.2 Wiener filter 10x10 0.01v 56,92% 96,91% 84,29% 60,00% 61,15% 66,67% 50,52% 70,71% 44,44% 67,00% 65,86%
Table B-6 Average by numbers recognized - Binarization
Technique Ctrl Inv
1 Ctrl Inv
2 Ctrl Inv
3 Real Inv 1
Real Inv 2
Real Inv 3
Average
2.1 Global threshold 128 15,38% 82,10% 62,86% 47,69% 51,08% 68,18% 54,55%
2.2 Otsu threshold 89,23% 96,91% 90,00% 56,15% 89,21% 84,85% 84,39%
2.3.1 Niblack 1 86,15% 76,54% 88,57% 63,08% 95,68% 89,39% 83,24%
2.3.2 Niblack 2 92,31% 96,91% 90,00% 65,38% 95,68% 87,88% 88,03%
2.4.1 Sauvola 1 80,00% 96,91% 88,57% 66,92% 90,65% 89,39% 85,41%
2.4.2 Sauvola 2 89,23% 96,91% 90,00% 65,38% 95,68% 87,88% 87,52%

104
4. Averages
Table B-7 Total average - Noise reduction
Technique Ctrl
Inv 1 Ctrl
Inv 2 Ctrl
Inv 3 Real Inv 1
Real Inv 2
Real Inv 3
Noise Inv 1
Noise Inv 2
Noise Inv 3
Noise Inv 4
Average
1.1.1 Median filter 3x3 81,16% 93,72% 85,37% 65,33% 85,60% 80,93% 66,45% 70,15% 69,79% 68,68% 76,72%
1.1.2 Median filter 5x5 48,81% 64,85% 69,23% 45,17% 47,94% 49,89% 37,35% 37,06% 36,76% 30,03% 46,71%
1.2.1 Average filter 3x3 86,81% 95,20% 88,27% 67,76% 88,99% 80,96% 65,73% 75,47% 56,69% 74,56% 78,04%
1.2.2 Average filter 5x5 83,24% 91,53% 86,63% 56,49% 77,74% 57,26% 47,54% 59,62% 60,90% 55,94% 67,69%
1.3.1 Weighted smoothing filter 1 85,13% 95,34% 88,51% 70,59% 87,24% 78,09% 72,79% 81,62% 67,14% 78,67% 80,51%
1.3.2 Weighted smoothing filter 2 86,63% 95,20% 88,02% 71,97% 89,80% 80,86% 73,15% 79,03% 73,35% 74,44% 81,24%
1.3.3 Weighted smoothing filter 3 89,26% 94,39% 88,26% 71,99% 90,83% 80,71% 71,33% 77,76% 73,08% 74,12% 81,17%
1.4.1 Gaussian filter 5x5 s1 86,51% 95,29% 86,57% 69,70% 90,25% 81,10% 72,46% 73,40% 72,25% 72,62% 80,02%
1.4.2 Gaussian filter 10x10 s2 79,37% 91,33% 85,05% 48,14% 66,84% 56,67% 43,56% 53,89% 52,74% 53,81% 63,14%
1.5.1 Wiener filter 5x5 0.1v 83,79% 91,69% 86,63% 56,10% 74,93% 61,53% 49,14% 57,92% 54,93% 54,20% 67,09%
1.5.2 Wiener filter 10x10 0.01v 62,99% 95,87% 83,29% 72,68% 78,72% 74,53% 64,25% 78,39% 59,35% 78,04% 74,81%
Table B-8 Total average - Binarization
Technique Ctrl
Inv 1 Ctrl
Inv 2 Ctrl
Inv 3 Real Inv 1
Real Inv 2
Real Inv 3
Average
2.1 Global threshold 128 15,77% 84,66% 65,38% 66,07% 64,18% 70,33% 61,06%
2.2 Otsu threshold 83,27% 95,68% 86,74% 70,64% 85,79% 84,10% 84,37%
2.3.1 Niblack 1 81,12% 81,61% 82,74% 76,35% 90,33% 86,70% 83,14%
2.3.2 Niblack 2 87,84% 95,86% 80,32% 75,86% 88,50% 84,74% 85,52%
2.4.1 Sauvola 1 72,19% 94,74% 87,44% 76,73% 88,01% 87,63% 84,46%
2.4.2 Sauvola 2 81,65% 95,21% 75,23% 75,59% 88,54% 85,31% 83,59%

105
5. Document performance
Table B-9 Document performance - Noise reduction
Technique Ctrl
Inv 1 Ctrl
Inv 2 Ctrl
Inv 3 Real Inv 1
Real Inv 2
Real Inv 3
Noise Inv 1
Noise Inv 2
Noise Inv 3
Noise Inv 4
1.1.1 Median filter 3x3 81,16% 93,72% 85,37% 65,33% 85,60% 80,93% 66,45% 70,15% 69,79% 68,68%
1.1.2 Median filter 5x5 48,81% 64,85% 69,23% 45,17% 47,94% 49,89% 37,35% 37,06% 36,76% 30,03%
1.2.1 Average filter 3x3 86,81% 95,20% 88,27% 67,76% 88,99% 80,96% 65,73% 75,47% 56,69% 74,56%
1.2.2 Average filter 5x5 83,24% 91,53% 86,63% 56,49% 77,74% 57,26% 47,54% 59,62% 60,90% 55,94%
1.3.1 Weighted smoothing filter 1 85,13% 95,34% 88,51% 70,59% 87,24% 78,09% 72,79% 81,62% 67,14% 78,67%
1.3.2 Weighted smoothing filter 2 86,63% 95,20% 88,02% 71,97% 89,80% 80,86% 73,15% 79,03% 73,35% 74,44%
1.3.3 Weighted smoothing filter 3 89,26% 94,39% 88,26% 71,99% 90,83% 80,71% 71,33% 77,76% 73,08% 74,12%
1.4.1 Gaussian filter 5x5 s1 86,51% 95,29% 86,57% 69,70% 90,25% 81,10% 72,46% 73,40% 72,25% 72,62%
1.4.2 Gaussian filter 10x10 s2 79,37% 91,33% 85,05% 48,14% 66,84% 56,67% 43,56% 53,89% 52,74% 53,81%
1.5.1 Wiener filter 5x5 0.1v 83,79% 91,69% 86,63% 56,10% 74,93% 61,53% 49,14% 57,92% 54,93% 54,20%
1.5.2 Wiener filter 10x10 0.01v 62,99% 95,87% 83,29% 72,68% 78,72% 74,53% 64,25% 78,39% 59,35% 78,04%
Average 79,43% 91,31% 85,07% 63,27% 79,90% 71,14% 60,34% 67,66% 61,54% 65,01%
Table B-10 Document performance - Binarization
Technique Ctrl Inv 1
Ctrl Inv 2
Ctrl Inv 3
Real Inv 1
Real Inv 2
Real Inv 3
2.1 Global threshold 128 15,77% 84,66% 65,38% 66,07% 64,18% 70,33%
2.2 Otsu threshold 83,27% 95,68% 86,74% 70,64% 85,79% 84,10%
2.3.1 Niblack 1 81,12% 81,61% 82,74% 76,35% 90,33% 86,70%
2.3.2 Niblack 2 87,84% 95,86% 80,32% 75,86% 88,50% 84,74%
2.4.1 Sauvola 1 72,19% 94,74% 87,44% 76,73% 88,01% 87,63%
2.4.2 Sauvola 2 81,65% 95,21% 75,23% 75,59% 88,54% 85,31%
Average 70,31% 91,29% 79,64% 73,54% 84,22% 83,13%

106
6. Unaltered document performance
Table B-11 Unaltered document performance
Document True
Positive False
Positive Total
Characters Characters
% Phrases
Total Phrases
Phrases %
Numbers Total
Numbers Numbers
% Average
%
Ctrl_Inv_1 96,04% 91,53% 874 93,73% 138 171 80,70% 50 65 76,92% 83,79%
Ctrl_Inv_2 99,87% 99,46% 1489 99,66% 335 347 96,54% 162 162 100,00% 98,74%
Ctrl_Inv_3 99,19% 99,60% 742 99,39% 156 159 98,11% 70 70 100,00% 99,17%
Real_Inv_1 90,54% 61,02% 2368 72,91% 126 453 27,81% 19 130 14,62% 38,45%
Real_Inv_2 70,07% 38,33% 2956 49,55% 46 585 7,86% 2 139 1,44% 19,62%
Real_Inv_3 35,65% 76,56% 1425 48,65% 10 249 4,02% 2 66 3,03% 18,57%
Noise_Inv_1 94,01% 93,09% 1620 93,55% 186 304 61,18% 25 97 25,77% 60,17%
Noise_Inv_2 61,15% 91,62% 1622 73,35% 126 307 41,04% 16 99 16,16% 43,52%
Noise_Inv_3 40,24% 73,23% 1655 51,94% 49 308 15,91% 0 99 0,00% 22,62%
Noise_Inv_4 61,74% 70,43% 1620 65,80% 14 306 4,58% 2 100 2,00% 24,13%
Average 74,85% 43,78% 33,99%
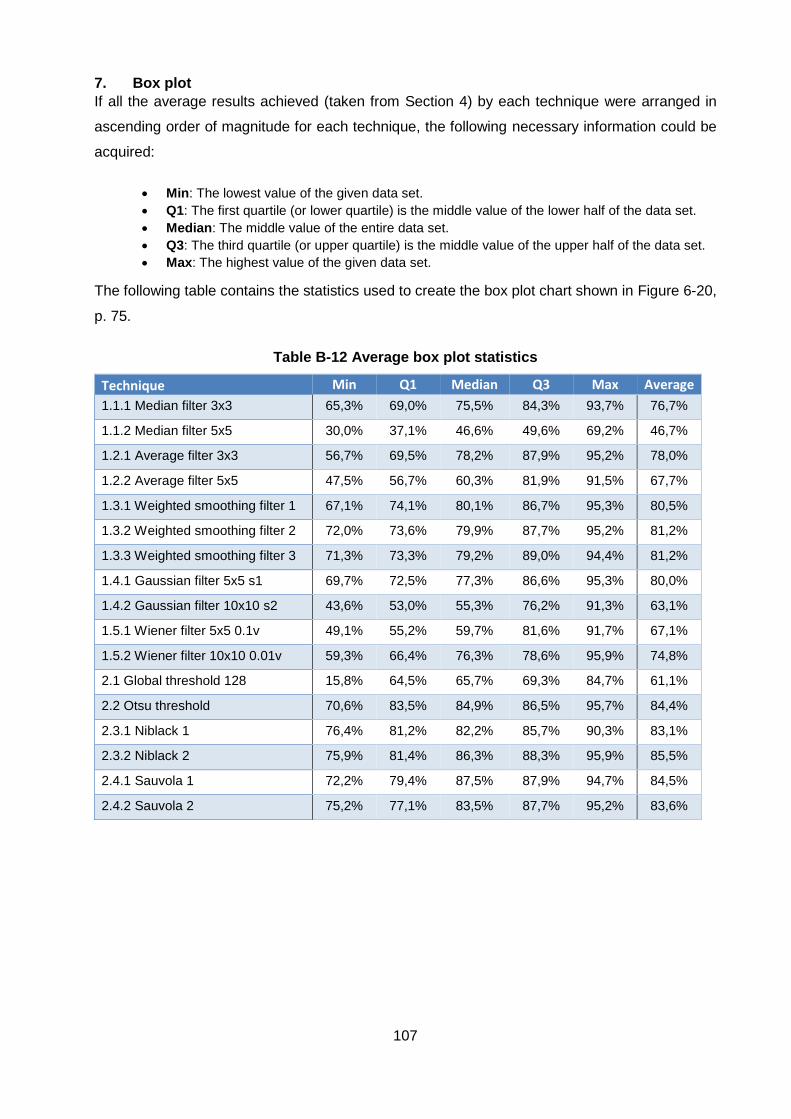
107
7. Box plot
If all the average results achieved (taken from Section 4) by each technique were arranged in
ascending order of magnitude for each technique, the following necessary information could be
acquired:
Min: The lowest value of the given data set.
Q1: The first quartile (or lower quartile) is the middle value of the lower half of the data set.
Median: The middle value of the entire data set.
Q3: The third quartile (or upper quartile) is the middle value of the upper half of the data set.
Max: The highest value of the given data set.
The following table contains the statistics used to create the box plot chart shown in Figure 6-20,
p. 75.
Table B-12 Average box plot statistics
Technique Min Q1 Median Q3 Max Average
1.1.1 Median filter 3x3 65,3% 69,0% 75,5% 84,3% 93,7% 76,7%
1.1.2 Median filter 5x5 30,0% 37,1% 46,6% 49,6% 69,2% 46,7%
1.2.1 Average filter 3x3 56,7% 69,5% 78,2% 87,9% 95,2% 78,0%
1.2.2 Average filter 5x5 47,5% 56,7% 60,3% 81,9% 91,5% 67,7%
1.3.1 Weighted smoothing filter 1 67,1% 74,1% 80,1% 86,7% 95,3% 80,5%
1.3.2 Weighted smoothing filter 2 72,0% 73,6% 79,9% 87,7% 95,2% 81,2%
1.3.3 Weighted smoothing filter 3 71,3% 73,3% 79,2% 89,0% 94,4% 81,2%
1.4.1 Gaussian filter 5x5 s1 69,7% 72,5% 77,3% 86,6% 95,3% 80,0%
1.4.2 Gaussian filter 10x10 s2 43,6% 53,0% 55,3% 76,2% 91,3% 63,1%
1.5.1 Wiener filter 5x5 0.1v 49,1% 55,2% 59,7% 81,6% 91,7% 67,1%
1.5.2 Wiener filter 10x10 0.01v 59,3% 66,4% 76,3% 78,6% 95,9% 74,8%
2.1 Global threshold 128 15,8% 64,5% 65,7% 69,3% 84,7% 61,1%
2.2 Otsu threshold 70,6% 83,5% 84,9% 86,5% 95,7% 84,4%
2.3.1 Niblack 1 76,4% 81,2% 82,2% 85,7% 90,3% 83,1%
2.3.2 Niblack 2 75,9% 81,4% 86,3% 88,3% 95,9% 85,5%
2.4.1 Sauvola 1 72,2% 79,4% 87,5% 87,9% 94,7% 84,5%
2.4.2 Sauvola 2 75,2% 77,1% 83,5% 87,7% 95,2% 83,6%
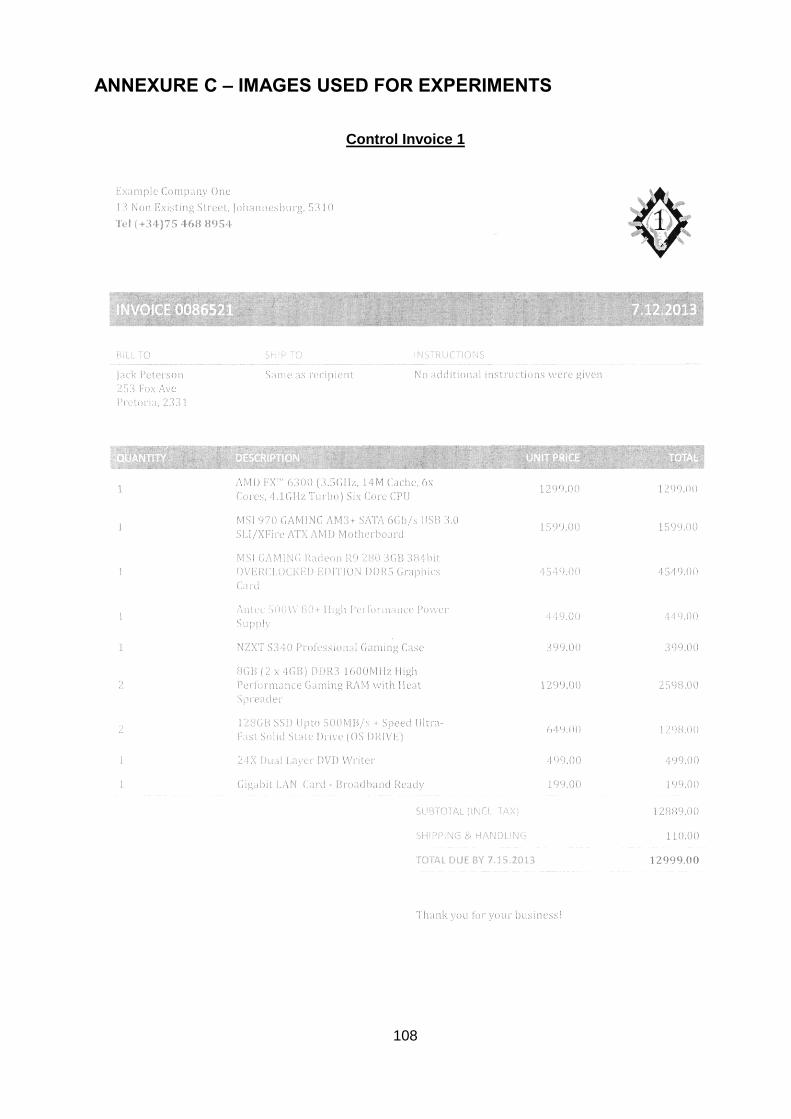
108
ANNEXURE C – IMAGES USED FOR EXPERIMENTS
Control Invoice 1

109
Control Invoice 2

110
Control Invoice 3

111
Real Invoice 1

112
Real Invoice 2
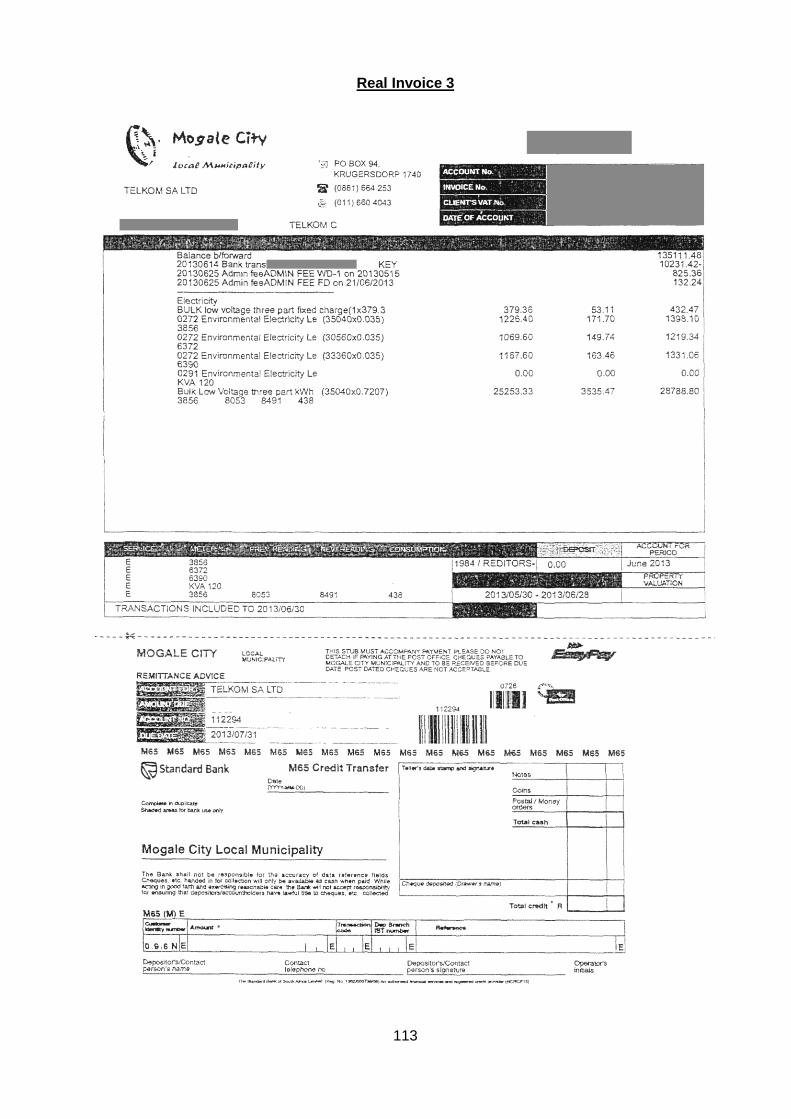
113
Real Invoice 3

114
Noisy Invoice1

115
Noisy Invoice 2
116
Noisy Invoice 3

117
Noisy Invoice 4
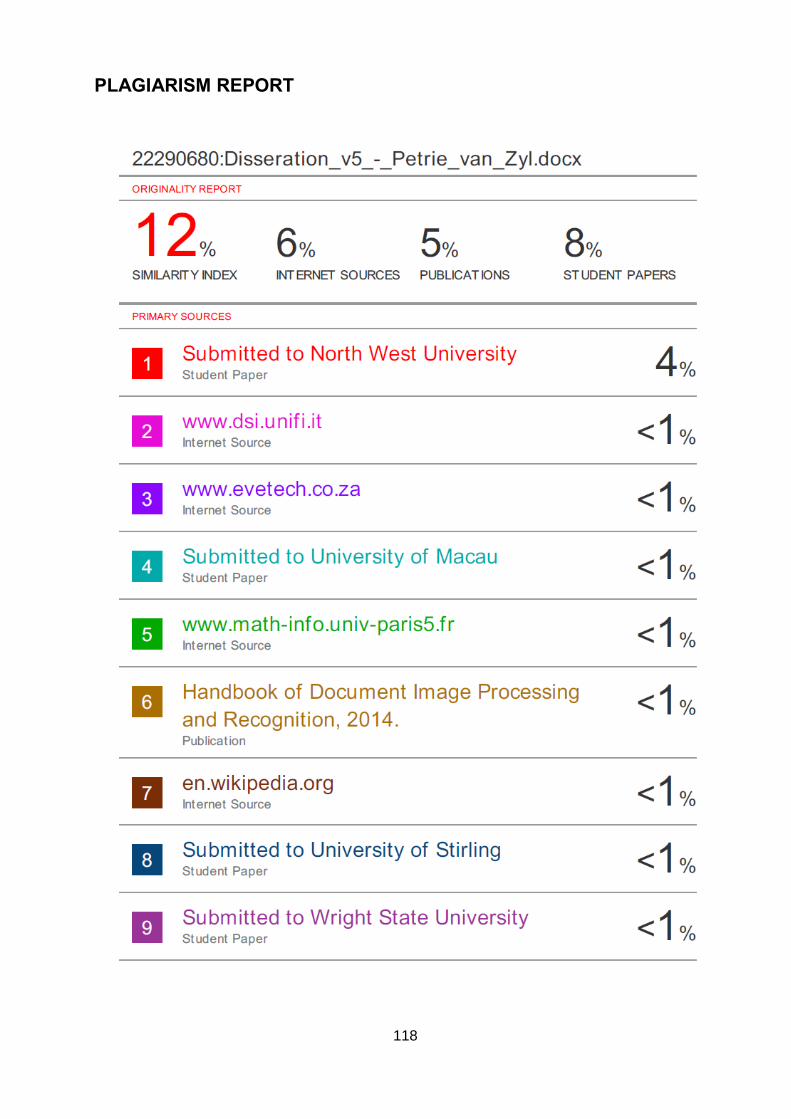
118
PLAGIARISM REPORT
119
PROOF OF LANGUAGE EDITING
Top Related