


Languages
Pages
Legal


A Harmful Guarantee?The 1983 Israel Bank Shares Crisis Revisited
Asher A. Blass* and Richard S. Grossman**
Discussion Paper No. 96.03May, 1996
The views expressed in the paper are those of the authors and do notnecessarily represent those of the Bank of Israel.
* Research Department, Bank of Israel.** Department of Economics, Wesleyan University, Middietown,CT 06459
Research Department, Bank of Israel, POB 780, 91007 Jerusalem, Israel

Abstract1
In a recent verdict (subsequently overturned in part by theIsrael Supreme Court), an Israeli Court found that in the early1980's Israeli banks, representing 95 percent of commercialbanking, were guilty of providing shareholders with fraudulentguarantees that share prices would rise indefinitely, that theyharmed banking stability and caused the government to takeoverthe banks. We use high frequency price data to identify whether aguarantee was, indeed, provided.
We also compare 1993 bank share prices after the banks werepartially relisted with 1983 precrisis prices. The figuresindicate that 1993 timeadjusted market values were $10 billionlower than in 1983, a decline borne by two groups of shareholders:precrisis shareholders ($4 billion) and the government whichbecame the sole shareholder in 1983 ($6 billion( .
Key words: banking crisis, shareholder fraud, GlassSteagall,privatization, manipulation.
2 We thank Nahum Gross, Giora Hanoch, Marshall Sarnat, Zalman Shiffer,Shlomo Yitzhaki and seminar participants at the Research Department of the Bankof Israel for helpful comments; the Maurice Falk Institute for Economic Researchon Israel for financial support and A. BarEliezer, L. BenTuvim, Y. Inbar, R.Kehunai and N. Lipson for excellent research assistance. Work on the project wasundertaken while Grossman was a visitor at the Hebrew University of Jerusalem.He thanks the University for its hospitality and the German Marshall Fund of theUnited States for financial support.

l. Introduction
On October 6, 1983, the Tel Aviv Stock Exchange (TASE) was shut down for
eighteen days. The closure followed several weeks of heavy selling by
shareholders of six banks and one bank holding company representing virtually
all commercial banking in Israel and more than 60 percent of total market
capitalization (equivalent to 40 percent of GNP) . The banks reacted, as they
had done during previous episodes of excess supply, by making largescale
purchases of their own shares. In the fall of 1983, however, the selloff was
much greater than in the past so that share purchases strained bank liquidity,
raising concerns about overall banking stability. These concerns threatened
to cause a run on deposits and a decline in foreign exchange reserves which,
together with other political considerations, led the government to close the
Exchange. During the closure the government devalued the Shekel and took
control of five of the banks, converting their shares into government
guaranteed zero coupon bonds maturing within 5 to 6 years at face values of 85
to 117 percent of preclosure dollar market values. Bank share prices
declined by 40 percent after the TASE reopened.
In a recent verdict (District Court of Jerusalem, TafHay 524/90, State
of Israel vs. Bank Leumi Lelsrael, Ltd. et al . ) , Judge Miriam Naor found that
the banks were responsible for the crisis and were guilty of providing
fraudulent guarantees that share prices would continue to rise. She sentenced
prominent bank officials to prison and both the officials and the banks to pay
fines.^
The verdict was the culmination of an extended period of investigation
which began almost immediately after the collapse. The governmentappointed
2 Parts of the verdict were reversed on appeal in 1996 so that the bankerswere not required to serve time in prison.

4
Bej sky Commission concluded in its 1986 report that the banks had manipulated
stock prices "through a series of actions...designed to affect share prices
and returns," and that these actions caused the subsequent collapse. After
the Report 's publication, several government regulators resigned. The State
Attorney ultimately indicted the banks and many key bank executives
)collectively the "defendants") in 1990 on three criminal counts:
)1) the defendants impaired the banks' ability to meet theircommitments, a violation of Section 14 b (a) of the Banking Order
)and for the bank holding company defendant I .D.B. Section 424 (1)
of the Penal Code), by fraudulently guaranteeing to shareholders
that share prices would not fall even though they knew or should
have known that the guarantees might not be fulfilled;
)2) they knowingly gave false investment advice, a violation of
the Securities Law (Section 54 (a) (1) ) , the Banking Law (Sections
3, 10 and 11) and Section 415 of the Penal Code;
)3) they committed accounting violations (Penal Code, Section
423) .
Because the banks were exempt from insider trader legislation
)Securities Law 52 g (a) (8), 1981), they were not, with the exception of the
false investment advice charge, indicted for violating Securities Law. Indeed
the prosecution and defense were in broad agreement that the banks had
employed a smorgasbord of trading practices which would have been illegal had
they been implemented by parties other than the banks. Instead, the dispute
)especially in regard to Count l of the indictment) centered on whether or not
agreed upon trading practices and other actions implied that the banks
guaranteed that share prices would not fall and whether or not the guarantees
harmed bank stability.
5
,Inorder to properly determine whether there was an economic guarantee
it is necessary to use high frequency stock price data. Indeed, in the U.S.,
stock return data used to determine financial fraud have generally been of a
daily or intraday frequency (Easterbrook and Fischel, 1991). In this paper
we assemble and analyze daily price data to determine whether a reasonable
investor might have believed that there was a guarantee.3
In addition, we compare t ime adjust ed share prices in 1993 after two
banks were partially sold back to the public to 1983 pre crash prices and
estimate that the value for all defendant banks declined by $10 billion during
the crash and through the period of government ownership brought about by the
banks' actions (1983 GNP in Israel was $30 billion). Part of the decline was
immediately apparent when the market value of the defendant banks fell in
October 1983 by $4 billion after the government stepped in and provided a
guarantee worth much less than precrash prices. That amount represents the
decline in wealth of precrash shareholders. As we discuss later on, the
figure generally does not represent a reduction in allocative efficiency to
the economy.
The rest of the decline in market value $6 billion ($10 billion less
the $4 billion shareholder hit)is the difference between 1983 post crash
prices and properly discounted 1993 prices and can only now be calculated
after the government began to sell off the banks in 1993. This amount can be
viewed as added government expenditures brought on by the crisis since the
decline equals the difference between the values of banking assets that the
government realized in 1993 and those of the liability that it assumed in 1983
3 Although in the early 1980's Barnea (1981, 1982 and 1983) gathered partof the data analyzed here, it was neccesary, however, to assemble the datasetfrom scratch.

6
by effectively converting shares into government debt. We further show that
the $6 billion gap can be attributed to two factors:
l) The liability was $4 billion greater than the fundamental value
of the banks in 1983. Indeed, by committing to pay shareholders
$4 billion more than the banks were worth, the government effected
a transfer payment of $4 billion from taxpayers to shareholders;
)2) The fundamental values of the banks owned by the government
declined by $2 billion from 1983 to 1993, relative to normal rates
of return. We suggest that the decline might represent an
efficiency loss resulting from government ownership of the banks
for ten years following the crisis.
We estimate the two components with counterfactual analyses of what
prices would have been in the absence of manipulation, using a methodology
employed in estimating financial fraud damages in the United States
)Easterbrook and Fischel, 1991) . Our calculation is derived from a forward
projection of bank share prices from 1977 to estimate fundamental values in
1983 as well as a backward projection of actual market values from 1993 after
the relisting of the two largest banks.
The outline of the paper is as follows. Section 2 provides background
information, including a description of the events and legal proceedings.Section 3 considers whether or not the banks provided a guarantee. In Section
4, we calculate the timeadjusted decline in market value and its breakdown by
its three components: the decline in shareholder wealth in 1983, the hit to
the government by guaranteeing prices above 1983 fundamental value, and the
decline in share values that accompanied ten years government operation of the
banks. We also discuss the relation between the calculations and the economic
costs of the crisis. Conclusions are in Section 5.

7
2. Background
2.1. The Crisis and Banking Structure
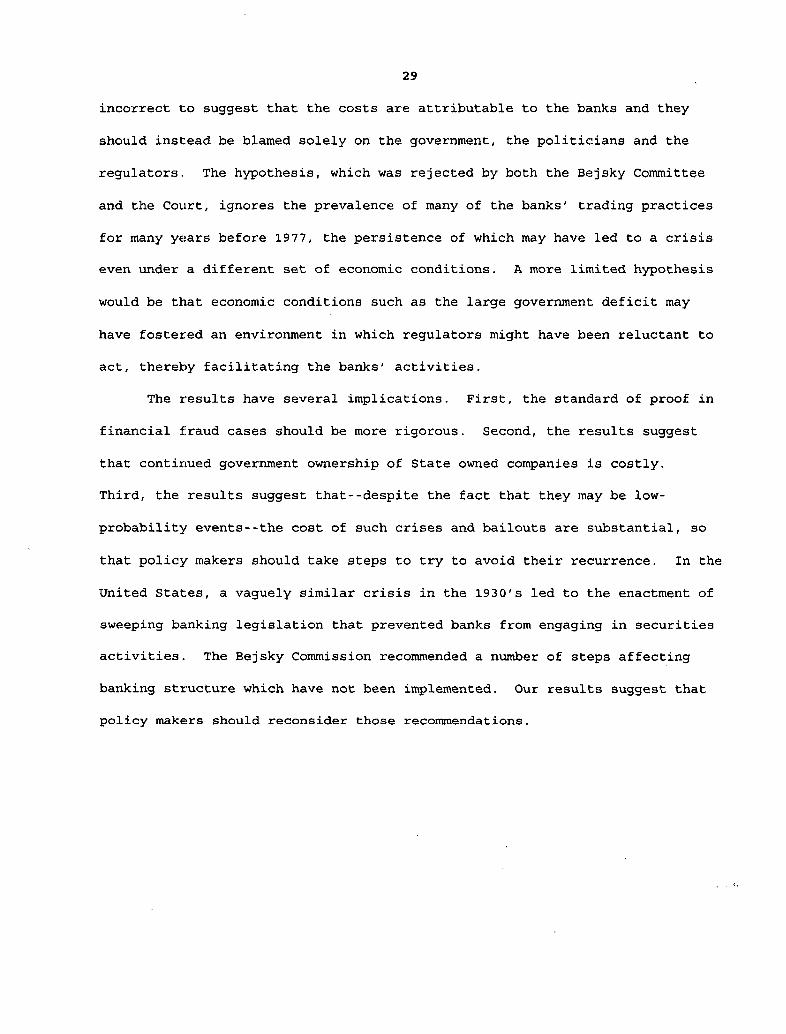
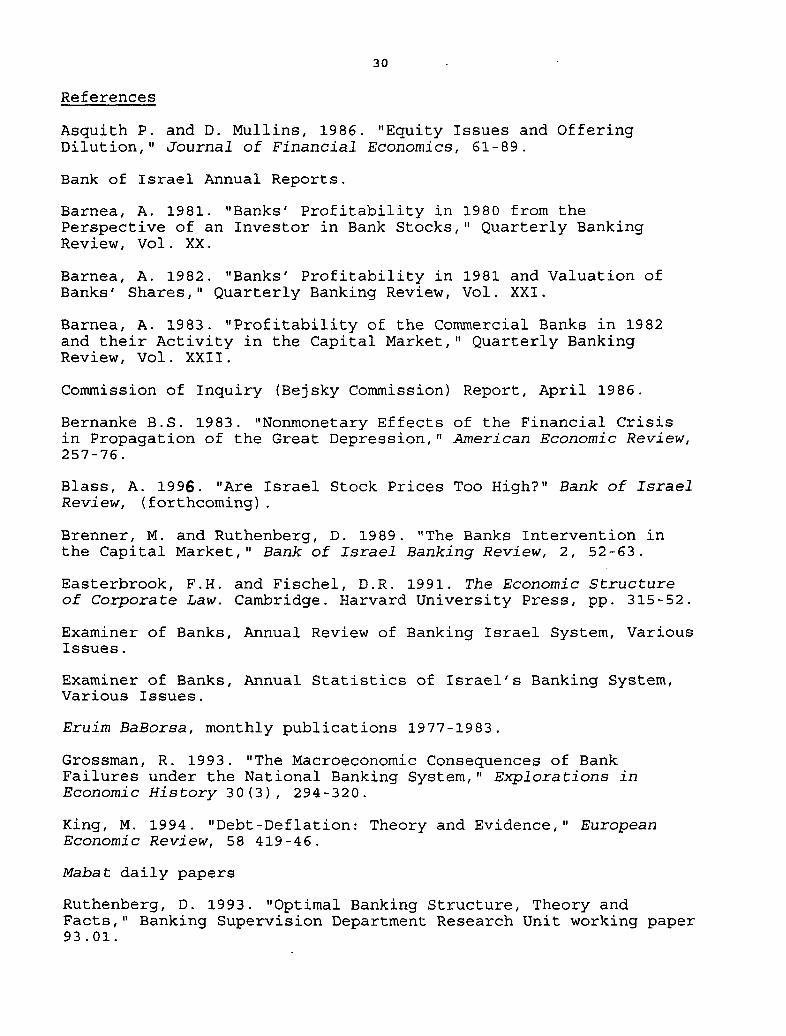
The collapse of the bank stocks occurred after a period of several years
during which the banks intervened in the market for their shares, smoothing
price fluctuations and providing support for upwards movement in price and for
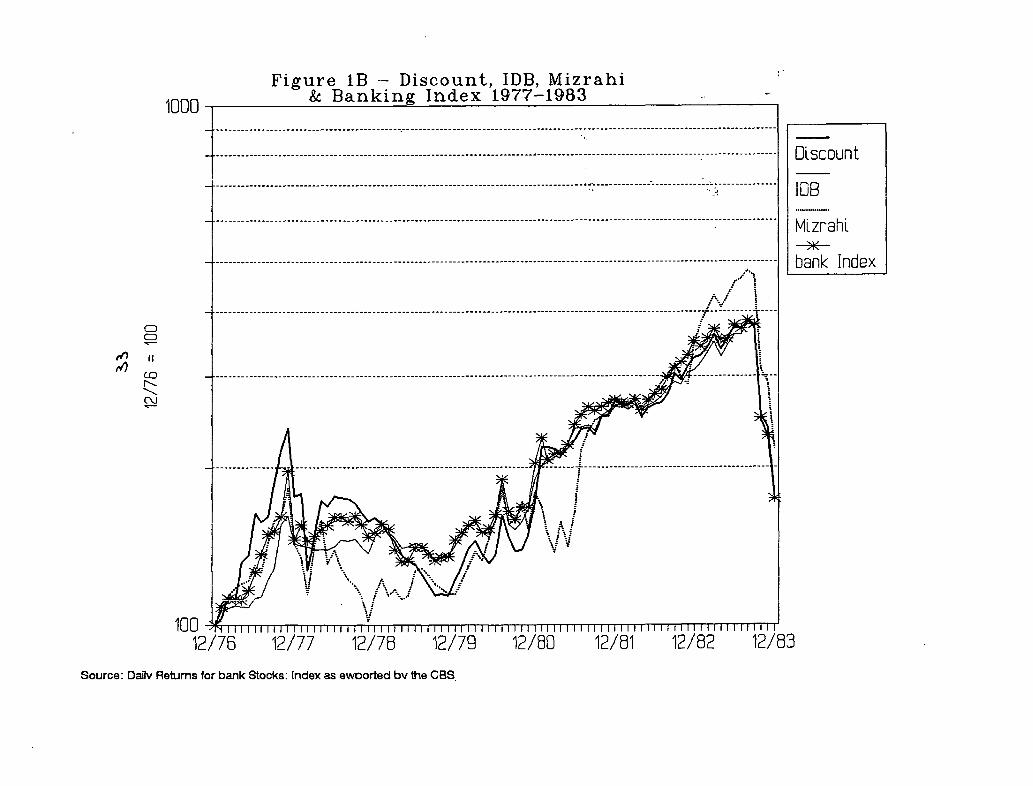
frequent and substantial new issues. Share prices quadrupled in real terms
)Figures 1, 1A and IB), while stock offering proceeds from 1977 through 1983
were larger than 1977 market values for every defendant bank. Share
appreciation together with share offerings contributed to a 700 percent
increase in market value during the same period (Figure 2). The banks'
intervention successfully prevented bank shares from falling even when the
Industrial Index declined in real terms by 70 percent in 1978 and 1979 and by
50 percent in the first half of 1983.
Normally, it might be difficult to successfully sustain price levels not
in accordance with fundamental values for extended periods of time. Capital
markets in Israel, however, were then and to an extent are today,
characterized by unique features which allowed the intervention to succeed for
many years .
A. Commercial banking is (and was in 1983) highly concentrated
the top three banks account for 80 percent of commercial banking
activity, and the HerfindahlHirschman index calculated from
lending activity or total assets is approximately 3000
)Ruthenberg, 1993) . Moreover , it has been alleged that
substantial barriers to entry into Israeli commercial banking have
further dampened competition. Such barriers have probably been
fortified by the political nature of ownership structure at
several of the banks.
8
B. Commercial banks in Israel have traditionally dominated
investment banking, mutual and provident fund industries, and the
brokerage business, which may lead to conflicts of interest within
banks among their different fiduciary roles. Indeed, such
conflicts were key factors behind the passage of laws in various
countries limiting the securities' activities of commercial banks.
C. Commercial banks in Israel are also merchant banks and hold
large equity stakes in a variety of nonfinancial corporations,
which may have allowed them to exert market power in several non
financial sectors.
D. The capital market has been relatively constrainedmany
Israeli investors are not allowed to purchase foreign securities
while foreign financial firms have been effectively barred from
the Israeli market.
2.2. Motivation and the Regulators
Why did the banks manipulate stock prices? The Be j sky Committee and the
Indictment describe two key motives. First, if market prices were above the
shares' economic value, the offering of additional shares at prevailing market
prices benef itted existing shareholders at the expense of new shareholders.
Indeed, even though bank shares lost half of their value in October 1983
shareholders who purchased bank shares before 1980 fared much better than
investors in nonbank shares, realizing annualized real returns of at least 10
percent. Second, the high inflation that prevailed in the late 1970's and
early 1980's forced banks to repeatedly raise equity to maintain required
capital ratios: until the mid 1980's, equity was generally stated athistorical values while other balance sheet items were stated at current
9
values which, beginning in 1979, more than doubled every year. Unless new
shares were issued frequently, equity to asset ratios would have fallen below
regulatory requirements.
The banks were not hindered in their actions by government regulators
who focused on short term benefits, rather than on the longterm costs of
these actions. The Supervisor of Banks was reportedly concerned that it would
become increasingly difficult for the banks to raise capital and meet reserve
requirements unless they manipulated share prices. Other officials were
pleased that equity offering proceeds were invested in newly issued government
bonds that funded annual budget deficits totalling 68 percent of GDP.
Not only did regulators and legislators fail to stop the banks, they
actively fcicilitated manipulation in at least three ways. First, they granted
the banks an exemption from insider trader legislation so that they could buy
and sell their own shares without breaking the law (Securities Law 52 g (a)
)8), 1981). Second, they exempted the banks from a turnover tax imposed
following the 1982 Lebanon War so that the banks could manipulate their shares
without being hindered by transactions costs. Third, monetary restrictions
which normally prevented the banks from converting foreign to local currency
did not apply to conversions for manipulating bank stocks.
2.3. Mode of Operation
The banks employed a variety of techniques to support share prices.4First, each bank maintained inventories of its own shares for the stated
purpose of causing share prices to rise smoothly and consistently over time.
Indeed, the rise in inventories to more than $1 billion by September 1983 and
4Although we focus on events and data beginning in 1977, the Bej sky Reportfound that many techniques were actually introduced several years earlier.

10
.resulting liquidity problems ultimately led to the government guarantee
Second, bankemployed stockbrokers bolstered demand by recommending that
their clients purchase bank shares. Special incentives were offered to bank
branches that attained certain bank share sales quotas. In addition, public
issues were often floated in the form of rights offerings that allowed
existing shareholders to purchase shares at a discount from market value,
thereby ensuring that new stock would be fully subscribed.
Third, the banks extended credit to purchasers of bank shares and called
in lines of credit from sellers. Since credit was tight and regulated in
Israel during the 1970's and 1980's, it was difficult for many businesses and
individuals to obtain credit at any interest rate. By tying access to credit
to bank share holdings, the banks were able to pump up demand. The banks in
their roles as stockbrokers, also relaxed collateral requirements for
purchasers of bank shares: they allowed bank shares to be margined at 90^ of
market value, compared to 50% for other securities. Banks provided large
amounts of credit when new shares were offered to the purchasers of these
shares. In addition, the banks engaged in reverse repurchases of bank shares,
simultaneously selling shares while committing themselves to repurchase them
at a higher price.
Fourth, bank controlled mutual and provident funds (whose assets
represented more than 90 percent of all funds' assets) purchased bank shares
when demand was slack, thereby ensuring that prices would not decrease. The
funds also made loans to parent banks providing additional resources to the
latter to buy stock.
Fifth, the banks instructed subsidiaries and bank controlled companies
to purchase shares when demand was relatively low. This technique allowed the
banks to circumvent reserve requirements because while stock inventories held
11
by the banks would reduce equity and reserve ratios, shares held by certain
subsidiaries and affiliates did not. Another way in which equity requirements
were circumvented was through a "parking" arrangement between Bank Leumi and
Discount two of the larger defendant banks: Leumi temporarily took on some of
Discount' s inventory of Discount stock, while Discount took some of Leumi 's
inventory. Each bank thereby provided support to the other's stock price,
while the balance sheets of both banks were "windowdressed" to meet reserve
requirements.
2.4. Indictment, the Bankers' Defense and the Judge' s Decisio n
The banks were indicted, as noted above, on three counts. We focus on
the first which charged bank executives with violating banking laws by harming
the banks' ability to meet commitments by fraudulently guaranteeing to
shareholders that real share prices would not fall. According to the
Indictment, the guarantee could be presumed to impair the ability to meet
commitments since share prices would ultimately fall, subsequent to which
shareholders would sue the banks and win substantial judgements which would
result in a decline in bank net worth. Similarly, shares held in inventory
would eventually decline in price and further reduce bank net worth. Third,
the collapse would cause a run on the banks and fourth, the value of bank
loans collateralized by bank shares would substantially decline in value.
The defendants offered three key lines of defense. First, they argued
that since the banks in fact did not become insolvent they could not as a
matter of law be found guilty of having harmed banking stability. Second,
they claimed that the banks' activities did not amount to a guarantee. Third,
the defense argued that even if a guarantee had been provided it would not
have affected banking stability because share prices at the time of the crash

12
were no higher than their fundamental values. As a result, shareholders would
not sue the banks because the prices that they paid were fundamentally sound.
Similarly, bank net worth was not reduced by purchasing shares for inventory
because the purchase prices were not above fundamental values.
The judge did not accept any of these claims. First, she found that as a
matter of law it was unnecessary for the banks to actually become insolvent inorder for them to ofe found guilty of harming stability and. that it was enough
to show that their actions were likely to have lead to that eventuality.
Second, although the prosecution did not formulate a quantitative standard of
proof to show that the banks provided a guarantee, she accepted its view that
upwards stock movement, combined with qualitative evidence were sufficient to
prove that they had provided a guarantee. Third, she concluded that the
guarantee harmed banking stability because the guaranteed prices were above
fundamental values.

13
3. Did the Banks Provide a Guarantee?
3 . 1 Data Sources
Much of the price data that was analyzed at the bankers' trialconsisted of monthly and yearly total returns. It is virtually impossible to
use such low frequency data to prove or disprove financial wrongdoing and
attempts to do so during the trial led to erroneous claims.
The defense argued that the existence of months in which real returns
were negative proves that a guarantee could not have existed. That conclusion
is incorrect because real stock returns were calculated using inflation
figures published two weeks after the end of each month, so that even if the
banks had intended that real share prices would not decline, they might have
misjudged inflation in certain months so that real returns turned out
negative. '
While the prosecution highlighted the banks' daily activities designed
to prevent bank shares from falling on any day, it too relied on monthly data,
suggesting that the persistence of positive nominal monthly returns indicated
that the banks provided a guarantee against loss. That argument, however,
sidesteps the fact that in a high inflation environment, monthly nominal stock
returns will tend to increase across the board. The prosecution also argued
that since real bank stock prices rose substantially during three consecutive
5 The defendant' s claim also presumes that the guarantee implied that priceswould not decline in real rather than in U.S. dollar terms.
Using monthly data to estimate the covariances between bank shares andoverall market returns might also lead to upwardly biased estimates: thecorrelations between nominal returns will contain a large inflationary componentcommon to bank and overall market returns. Similarly, covariances calculatedafter deflating returns by actual inflation (as published after the fact Seefor example, Yitzhaki and Shalit, 1984) might also tend to overstate thecovariance, because both market and bank real returns will contain an error termequal to the difference between actual and expected inflation.

14
years and that inflationadjusted stock prices rose in a majority of months
that suggests that a guarantee existed. The claim ignores the fact that the
behavior of monthly real returns was not extremely.unusual: in other
countries, many share prices rise rapidly (in real terms) every year, and in
most months over a three year period. For example, from 1992 through 1994 the
total real return for many U.S. banks exceeded bank share returns in Israel
from 1980 through 1982.
In this paper, we construct a new highfrequency data set covering the
period 19771983. The data consist of daily observations of price, stock
splits, rights issues, dividend payments, demand and volume for the largest
component stock class for the seven defendant banks: Bank Leumi ("Leumi"),
Bank HaPoalim ("Hapoalim") , Israel Discount Bank ("Discount") , IDB Holdings
)" IDB" Discount '3 parent, technically not a bank) , Bank: HaMizrahi
)"Mizrahi"), Bank Igud ("Igud"a Bank Leumi subsidiary bank), and Bank Clall
)"Clali") as well as the First International Bank of Israel ("FIBI") a small
bank not alleged to have manipulated shares. Together the data represent
about 85 percent of bank share value, while almost all the rest is comprised
of other classes of stock for the seven banks. The data come from the daily
publications Shaar and Mabat as well as the weekly EruimBaBorsa . We also
collected data on the general share price index, the industrial share price
index, and the bank share price index.
3.2. A CAPM Framework
The expected daily nominal return on a risky security consists of two
components: the riskless return the return that would have been earned had
the security been a riskless security like shortterm government securities
plus a risk premium to compensate for risk. In the Capital Asset Price Model
15
(CAPM), a security's expected risk premium is related to the correlation of
the security's returns with that of the overall stock market. More
specifically, the risk premium equals the product of (a) the covariance of the
security's return with that of the market return divided by the market
variance (the "Beta"); and (b) the market premium or its expected return
above the riskless rate. Securities with zero betas such as Treasury Bills
are riskless and their expected return is low because the risk premium is
zero. Conversely, securities with high betas are more risky and offer higher
risk premia. Securities with betas equal to one are as risky as the market as
a whole (in terms of systematic or nondiversified risk) so that their
expected market returns equal the expected return on the entire stock market.
A firm's Beta also affects the valuation of its securities because share
value equals future cash flow discounted by the firm's cost of capital. Since
firms can raise funds from investors who need to be compensated at the
expected rate of return, a firm's cost of capital equals its expected rate of
return, which in turn rises with Beta. As a result, firm valuation rises as
Beta declines.
The! estimated betas of banks stocks since they were relisted in 1993
have been approximately 0.8, a figure similar to U.S. banks stocks. The 0.8
figure means that the expected return in these securities is somewhat lower
than the market's. For example, if the riskless rate of return is 3 percent
and the expected stock market return is 13 percent, the expected return on
banks stocks is 11 percent.
It would be unusual for bank stock betas as for most equity to equal
zero, because while it wouldn't necessarily imply that returns were constant,
it would mean that there was no market or systematic risk; i.e. that similar
to government shortterm securities, their returns were unrelated to other

16
assets' returns. That would be implausible since banks' future earnings are
related to profit streams in the overall eclonomy.
By contrast, if the banks gave a guarantee that price shares would
neither decline nor be affected by overall market developments, we would
expect beta to be zero. Moreover, zero betas would tend to artificially
increase share values because share values would then be calculated bydiscounting future cash flow by the riskless rate of return.
Table 1 presents the estimated betas for each bank and for each year
from 1977 through 1983. We calculate the betas by regressing daily stock
return on the Industrial Total Return Index, which proxies for an overall
market return index untainted by bank share returns. The Industrial Total
Return Index was not available for most days from 1979 through 1981, so we
used a weighted least squares technique to estimate Betas for those years.
The results indicate that Hapoalim and IDB's returns were barely correlated
with the market in 1977 and were uncorrelated after 1978. Leumi's returns
were weakly correlated through 1981 but afterwards were no longer correlated
with the market. Mizrahi and Discount's betas were significantly different
from zero until 1979. By contrast, the estimated Betas for non de fendant FIBI
were significantly higher.
Table 2 shows that over hundreds of days bank stocks rarely declined.
Indeed from the fourth quarter of 1981 through the third quarter of 1983,
Leumi shares fell just once, Hapoalim and Discount twice, Mizrahi fell on
fourteen days, while IDB never fell. These results are also in stark contrast
to the behavior of other banks such as FIBI whose share prices fell on 127
days out of approximately 500 trading days from 1981 through 1983as well as
to that of the overall market. The results are also unusual because during
those years, the average daily return and the standard deviation for most bank
17
shares were approximately one half percent: the Normal distribution
probability that Leumi shares would fall just once over a 250 day trading
period is less than one in a trillion!
Since daily returns appear to be truncated at zero, we ran Tobit
regressions to see whether or not the beta estimates in Table 1 are biased
downwards. If the Tobit regressions were to produce new beta estimates
significantly higher, that would indicate that while the banks' actions
prevented bank shares from falling on any given day, they did not immunize the
shares from market risk. If that were the case, that could mean that their
actions did not artificially increase bank share prices. By contrast, if the
Tobit regressions produced zero betas estimates, that would mean that bank
share returns were devoid of market risk. Table 3 shows that even after
correcting for truncation, the betas are still not significantly greater than
zero.
We conclude that an investor might have inferred that a guarantee
existed that the shares provided high returns but were devoid of market risk.
3 .3 TheDefense' s Claim that No Guarantee Existed
The banks argued that a rational investor could not have believed that a
guarantee existed because in several months investors in bank shares incurred
real losses. The claim is wrong because inflationary surprises could have
caused ex post monthly real returns to be negative even if there was a
concerted attempt to attain monthly real returns.
The defendants argued further that it was not credible for a rational
investor to believe that the banks offered a guarantee without receiving
anything in return. The banks are mistaken, however, because they did receive
consideration since the guarantee enabled the banks to lower their cost of

18
.capital f as evidenced by zero betas
The banks also claimed that since a guarantee could be expected to
ultimately harm shareholders when it became clear that it couldn't be met, a
rational shareholder could not possibly believe that a guarantee existed
because he wouldn't want to hold shares that would later decline. That
argument is also wrong because it is premised on the mistaken notion that
shareholders do not hold shares when market prices are above fundamentals and
that bubbles or fads never exist.
3.4. TheDefense' s Claims that Pre Crash Share Prices Were Reasonable
IDB, Discount and Leumi argued that share prices prevailing prior to the
crash were reasonable and were unaffected by the banks' actions which were
designed to smooth price fluctuations. Specifically, the banks argued that
share prices prevailing prior to the crash could be justified ex ante,
employing reasonable assumptions about profit growth and discount rates, so
even if the banks did provide a guarantee it was neither costly nor harmed
banking stability. The argument is inherently inconsistent, however, because
by smoothing stock prices so that fluctuations would be unaffected by overall
market volatility, the bankers brought about a decrease in beta, hence raisingmarket value.

19
4. Share Values
4 .1 Total Decline in Share Value
We begin by calculating the overall decline in share values from 1983
before the crash until 1993 when the government began to divest its bank
holdings. The precrash 1983 prices are readily available, while the 1993
partial sale of Leumi and HaPoalim permit us to construct a market model to
estimate the discounted value of bank stocks in 1983 conditional on their
actual 1993 valuations. We then break down the decline by three components:
the decline in shareholder wealth in 1983, the hit to the government by
guaranteeing prices above 1983 fundamentals , and the decline in share values
that accompanied ten years government operation of the banks.
We define four quantities. Vm represents the market value of bank
shares prior to the Exchange 's closure, V the value of bank shares implied by
the government guarantee, V£83 the fundamental ("true") value of bank shares
in 1983, and Vb93 the fundamental value of bank shares in 1993, projected back
to 1983. Vm less V^gj represents the total decline in market value.
To calculate vb93' we project 1993 share values (after the banks were
partially sold to the public) back to 1983, assuming that bank market values
increased by the riskless rate plus 70 percent of market return in excess of
the riskless. The model's best estimate is that Leumi's market value, which
equalled NIS 5.8 billion in December 1993 after its relisting, increased by
approximately 9 percent during 1993 in real terms (net of dividends) so that
estimated market value at yearend 1992 before Leumi was relisted, was 5.3
billion. Similarly, Leumi 's value is estimated to have increased by 56
percent during 1992 so that its estimated value at year end 1991 was 3.4
billion. Working backwards, we estimate Leumi's market value at the end of
198.*(vb93^ as 1.7 billion NIS, compared to a precrash 10 .5 billion. We

20
similarly calculate these values for Hapoalim and assume that the ratio of
vb93 to Vf83 (calculated in Section 4.4) for the other defendants is the same
as the weighted average of Leumi and Hapoalim. Figure 4 shows that Vk93 forall banks was NIS 5 billion while precrash market value was NIS 34 billion,
so that the total decline in value incurred during the crash and the period of
government ownership (Vm vb93^ was 29 billion ($10 billion) .
4.2 The Breakdown
In order to identify the classes that were harmed by the decline in
market value, we distinguish between three components that account for the
overall decline in market value (Vm vb93^: the decline in shareholder
wealth upon impact in 1983, the hit to the government by guaranteeing prices
above 1983 fundamental value, and the decline in share values that accompanied
ten years of government ownership. The components are calculated as follows:
1) First, we evaluate the decline in shareholder wealth after the
Exchange was reopened. This is a straightforward calculation of
Vm V , or the difference between the market value of the shares
before the crisis and the amount received by shareholders under
the government guarantee.
2) Second, we evaluate the net increase in government liabilities
equal to the value of the government guarantee less the 1983
value of the banks that it received in return (Vq Vf 83) . Vf q3
can be viewed as the level to which prices would have declined, if
there had been no government guarantee.6
3) Finally, we estimate the decline in bank value from 1983
" If^f 83 > V,, then the guarantee arrangement results in a transfer ofwealth from shareholders and a windfall to the government.
21
through 1993^vf83vb93^ which reflects the loss absorbed by the
government by holding on to the banks for such an extended period
of time, instead of selling them to private investors in 1983.
The decline could be viewed as an estimate of consequential
damages, namely the cost of the banks having been inefficiently
run by the government. To the extent that bank values declined
from 1983 on because of increased competition and/or reduced
margins , the government 's loss by not selling early might be
partially offset by gains by investors who avoided purchasing
banks shares which would have underperformed relative to the risk.
4.3. Gross Damages to Pre crash Shareholders
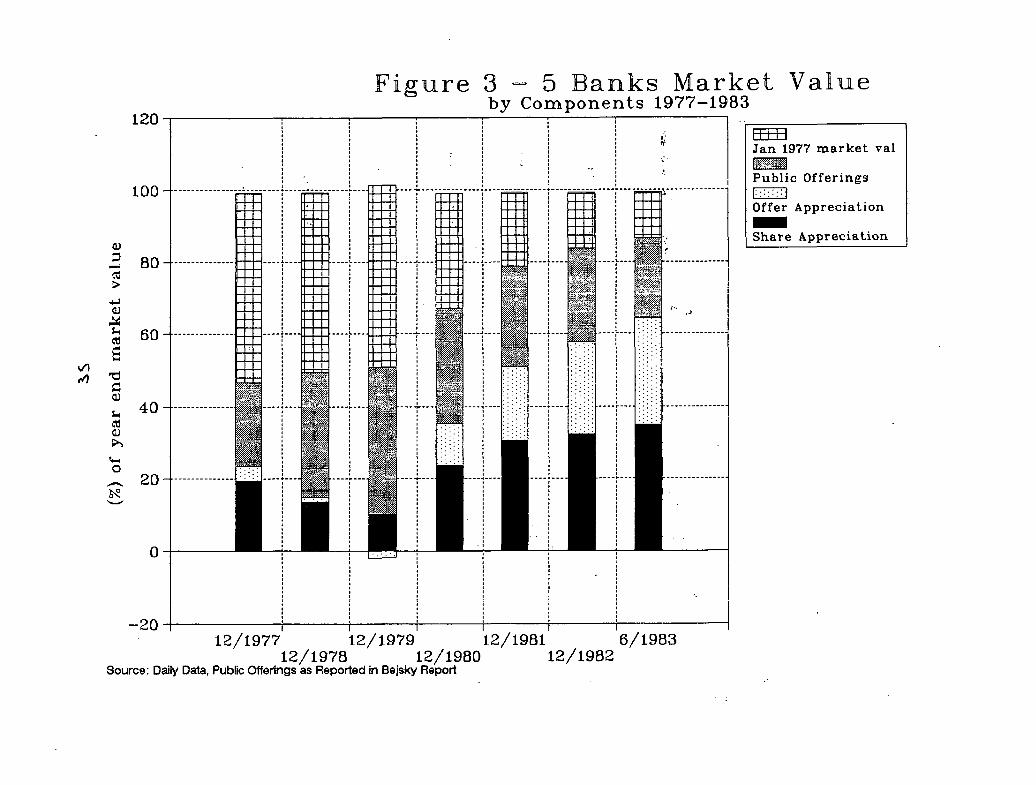
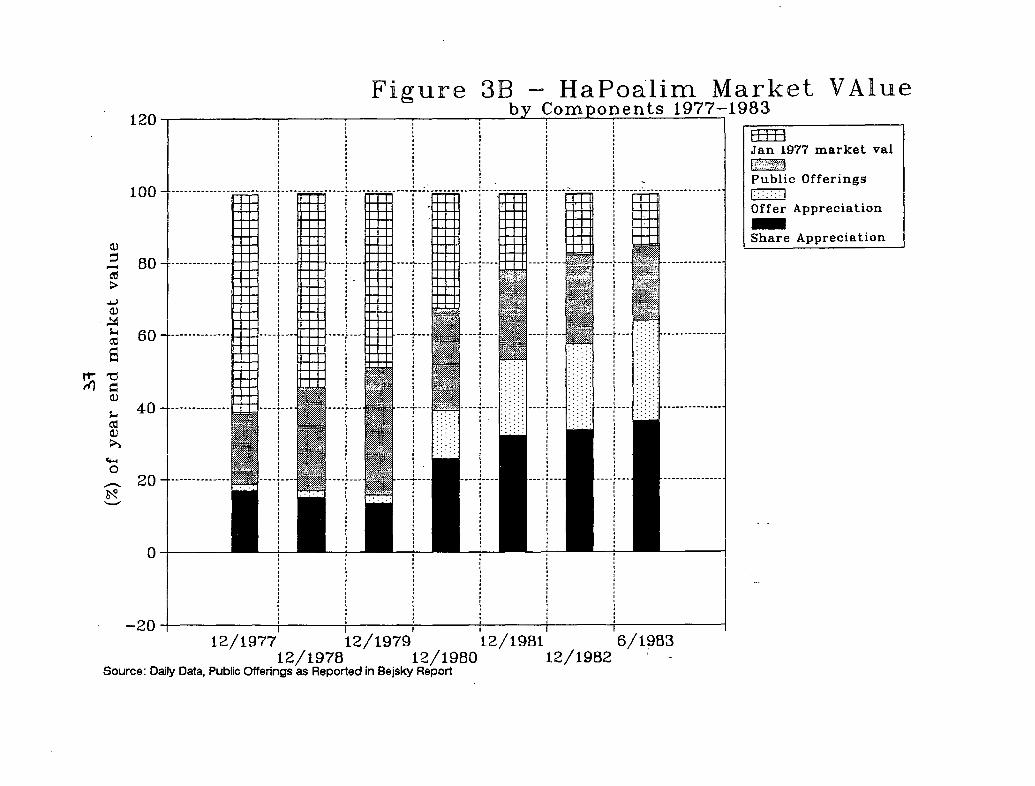
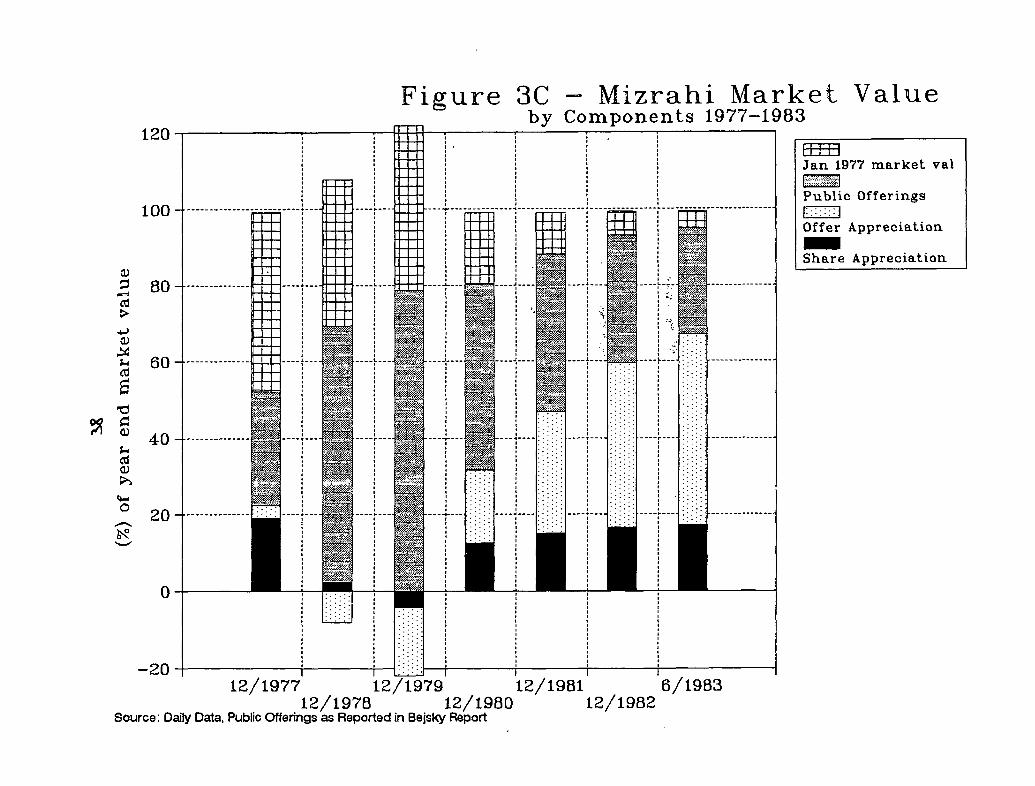
The market value of the defendant banks increased by 700 percent (NIS 4
billion to NIS 34 billion) from 1977 through June 1983 rising from the
equivalent of 6 percent of GNP to 40 percent (Figure 2). The increase is
attributable to three factors (Figures 3A3E) . First, real prices nearly
quadrupled. contributing NIS 11.6 billion, or 40 percent of the increase.
Second, public offerings, including rights offerings raised 7.5 billion (26
percent). Third, the market value of public offerings increased by 10.5
billion between the time of issue and June 1983 (35 percent).
From its peak, the market value of the defendant banks fell by NIS 11
billion, from NIS 34 billion (Vm) to 23 billion in October 1983 after the
government stepped in and provided a guarantee, by effectively converting the
bank shares into government debt. Assuming that the governmentbacked shares
were correctly priced, the value of the guarantee (V") was therefore NIS 23
billion, while shareholders' gross damages were NIS 11 billion (1993 prices).
22
4.4. The Net Increase in Government Liabilities
We estimate the net increase in government liabilities by looking at the
difference between the government liability incurred in 1983, i.e. the amount
that the government guaranteed to shareholders (V_)and the fundamental value
of the banks *n 1983 'vf83^ that the government received in return. In order
to estimate^f83 ' we construct a counter factual estimate of what bank stock
prices would have been after 1977 had there been no manipulation. In
constructing this estimate, we assume that monthly bank returns would have
been equal to the riskless rate of return, plus 50 percent of the industrial
shares' excess monthly return. The 50 percent figure, while lower than the 80
percent figure estimated from post1992 data, is consistent with Discount's
and Mizrahi's betas in 1977 and 1978. Moreover, the Industrial Index was
narrower 15 years ago and presumably more risky so that the banks' betas with
respect to this index are probably lower than the 1990's estimates.
To arrive at counterfactual market values, we subtract dividend payments
and add public offerings and their counterfactual returns.7 Figure 4 plotsactual market values and counterf actual or "projected forward" values. The
figure indicates that the value of the defendant banks (Vf 83) would have been
NIS 11 billion, instead of NIS 23 billion as guaranteed by the government
)V_), so that the government incurred a net liability of 12 billion.8
' The calculation assumes that 19771983 share offerings would not haveadversely affected bank share returns. That assumption probably causes ourestimates to overstate Vf 83 because, as evidenced by the US finance literature,the market value of a firm can be expected to decline upon issuing additionalshares (Asquith and Mullins, 1986) .
8We also estimate an alternative counterf actual . We assume that prices wereguaranteed that is the banks convinced the shareholders that shares wereriskless. As a result, shareholders discounted the future flow of profits at theriskless rate and not at a rate commensurate with market risk. We assume thatthe promised real yield on long term government indexed bonds was 4 percent . Wealso assume that the risk premium was 8 percent and that the banks shares' "true"
23
4.5. The Decline in Value During the Period of Government Ownership
The fundamental value of the banks in 1983 (Vf83) was NIS 6 billiongreater than 1993 bank values projected back to 1983 (V^gj) estimated in
Section 4 . 1 at NIS 5 billion (Figure 4). We postulate that the NIS 6 billion
decline could be construed as an estimate of efficiency losses spread over ten
years of government ownership relative to a counter factual scenario in which
banks were sold to private investors in 1983. That assumption is consistent
with government statements indicating that government owned companies in
general and banks in particular have been inefficiently run.
An alternative explanation could be that bank value declined because of
increased competition and/ or reduced margins. A third explanation is that
bank value was eroded as a result of government policies that provided off
budget subsidies, such as debt moratoria to farmers, at the expense of banks.
4 .6 Sensitivity Analysis
The estimates of the different components are sensitive to Vj83 and
^\,S1. so we begin by calculating Vjd93 under alternative sets of assumptions :
a. Betas ranging from 0.5 to 1, instead of a fixed Beta of 0.7.
b. Instead of using a market model, we project 1993 market values
backwards to 1983 at fixed annual real rates from 5 to 15 percent.
c. The other banks are sold at premia ranging from 50 to +100
percent relative to the prices received for Hapoalim and Leumi.
beta was 0.5. If the banks had not provided a guarantee, shareholders would havediscounted profits at 8 percent, but instead were discounting profits at 4percent. If profits (p) were rising over time at a growth rate of a, that meansthat share prices should have been equal to p/ (0 . 08a) but instead were equal top/(0.04a). If a were equal to 0 .02, that means that manipulation caused shareprices to rise 200 percent above their true values, an estimate consistent withour calculation that the precrash market value (Vm) of 34 billion NIS wasapproximately triple fundamental value 'vf 83^ .
24
Because 1993 market value was so much smaller than 1983's, Vj293 isrelatively small under all the assumptions, so that our overall NIS 29 billion
damage estimate is robust. Changing betas results in gross damage estimates
ranging from NIS 27.5 to 30 billion. Projecting backwards at fixed discount
rates results in estimates ranging from NIS 24 to 30 billion. Assuming thatthe other banks are different from Leumi and Hapoalim results in estimates
ranging from NIS 27 to 30 billion.
The relative shares of the components, however, are sensitive to the
assumptions . If we were to calculate ^t>9"i by projecting 1993 market values to
1983 at fixed annual real rates of 5 percent instead of using the market
model, the consequential damages component would be as low as NIS 1 billion.We next calculateVf 83 under different assumptions. Changes invf 83
the fundamental value of the banks do not affect the total NIS 29 billion
gross damage estimate which is only sensitive to VjDg2. Moreover, changes in
Vf 83 do not affect the total NIS 18 billion hit absorbed by the government,
which is equal to the difference between the observable value of the
government guarantee (Vq) and V^gj . Changes inVf 83 affect, however, the two
components of the government hit: if the 1983 fundamental value of the banks
shares was lower than our estimate that means that the value of the transfer
payment to the shareholders (V_Vf83) was greater, while the decline in post
crash bank va^ue ^vf83"vb93' was lower. Conversely, if the 1983 fundamental
value of the banks shares was higher than our estimate, the value of the
transfer payment to the shareholders would be smaller and the decline in post
crash bank value higher.
We calculate alternative vf 83' s by assigning fixed annual real ratesfrom 5 to 15 percent to market value at the beginning of the period and to
public offering proceeds, instead of using the market model. The alternative
25
calculations indicate that our earlier estimate ofVf 83 might be too low. The
reason is that at the market's peak, 62 percent of share values could be
explained by the real rise in prices, while 38 percent reflect the real values
of shares and funds raised in public offerings assuming a zero real rate of
return (Figure 2). If we were to calculate 1983 fundamental values by
assigning positive real rates of return to initial market values in 1977 and
to proceeds raised in public offerings, the fundamental values would be larger
than 38 percent of precrash prices, ranging instead between 45 to 60 percent
of precrash prices (or NIS 15 billion to NIS 20 billion) . By contrast, our
earlier market model calculation suggested that Vf83 was approximately 32
percent of precrash values (NIS 11 billion out of NIS 34 billion). The size
of the government transfer to shareholders by guaranteeing share prices might
therefore be lower than our estimates, ranging from $1 billion to $3 billion
)instead of $4 billion as we calculated). By contrast, the decline in value
under the government 's stewardship, however, would be larger than our $2
billion calculation, ranging from $3 billion to $5 billion.
4.7 Discussion
The sum of the three components (vm~vb93'' represent an estimate of gross
damages, or the harm suffered by certain classes without offsetting benefits
accruing to other classes. To arrive at a better estimate of actual costs to
the economy, it would be preferable to calculate net damages, subtracting from
the gross harm gains realized by other classes of investors. In particular,
the hit absorbed by precrash shareholders is to a large degree offset by
gains made by old shareholders. Similarly, the second component which
reflects the fact that the government guaranteed the shares at prices above
their fundamental values represents a transfer from non shareholders to
26
shareholders. As a result, it would be wrong to view these components as
estimates of macroeconomic costs. By contrast, the third component might
reflect efficiency losses.
To arrive at an appropriate measure of macroeconomic costs, it would be
necessary, on the one hand, to offset the three components with the benefits
accruing to certain classes, but to factor in additional costs. These include
the substantial costs of carrying out the offenses, unmasking them, taking
precautions against similar offenses and litigation. Perhaps more
importantly, it would also be necessary to add costs that reduced allocative
efficiency. These include costs incurred during the runup: the fact that
misleading information about bank shares and the large amounts of funds raised
through public offerings may have led investors to invest in the wrong
projects. Similarly, share manipulation led investors to misinterpret the
amount of risk associated with the bank shares, thereby distorting choices
between investment and consumption from 1977 through 1983. In response to the
new information generated in the aftermath of the crash about the nature of
capital markets in general and the behavior of the intermediaries (i.e. banks)
in particular, investors may have adjusted their attitudes to investing in
risky assets and generally avoided investing in risky assets throughout the
rest of the 1980' s (Sarnat and Szapiro, 1991) . Similarly the disruptions in
asset markets in the crash's aftermath may have harmed investors' ability to
efficiently allocate capital among various investment projects (Bernanke,
1983) .9 Additional possible macroeconomic costs may stem from the transferof wealth from entities with different marginal propensities to consume (King
9 Because a large section of the credit allocation process in Israel wasgovernment directed, however , it is difficult to estimatecredit allocation costsin the wake of the Bank Shares Crisis.

27
1994).
,Themagnitude of the swings in market values before and after the crash
relative to variables such as GDP, savings and investment suggest that themacroeconomic consequences were indeed serious . Moreover, since Vjjgj issimilar to actual January 1977 market value (Figure 4), that means that bank
value remained unchanged in real terms from 1977 through 1983 even though the
banks raised NIS 7.5 billion of proceeds from public offerings. That
suggests that the funds that were raised may not have been allocated in an
efficient manner.

28
5. Conclusions
In this paper we have revisited the 1983 Crisis with two questions in
mind. First, does the j udge 's finding that banks provided shareholders with a
guarantee stand up to a highfrequency time series data and a market model
analysis? Second, whatever the reasons for the crisis, who was harmed and by
how much?
Our answer to the first question is affirmative. Using neverbefore
assembled daily price data we find that share prices rarely fell in six years
preceding the crisis. Even in a highly inflationary economy, such a record is
difficult to explain in the absence of an implicit guarantee, as is the fact
that nominal daily bank shares returns were uncorrelated with the market.
We formulate three gross damage estimates: the hit taken by
shareholders at the time of the crash, the increase in the government 's net
liabilities that resulted from its guarantee of shares at prices above
fundamentals and the decline in bank values from 1983 through 1993 which we
suggest resulted from inefficiencies caused by government 's operation of the
banks. The first two are mostly transfer payments and are estimated at NIS 23
billion while the third is probably an efficiency loss estimated at 6 billion.To arrive at an appropriate measure of macroeconomic costs, it would be
necessary to add in additional costs related to disruptions in capital
markets. The magnitude of the swings in market values before and after the
crash, relative to variables such as GDP, savings and investment suggest thatthese costs were substantial so that the banking crisis had serious
macroeconomic consequences.
An alternative hypothesis is that these costs as well as the banking
crisis itself were mere manifestations of the macroeconomic policies of
Israeli governments from 1977 through 1983. Accordingly, it would be
29
incorrect to suggest that the costs are attributable to the banks and they
should instead be blamed solely on the government, the politicians and the
regulators. The hypothesis, which was rejected by both the Be j sky Committee
and the Court, ignores the prevalence of many of the banks' trading practices
for many years before 1977, the persistence of which may have led to a crisis
even under a different set of economic conditions. A more limited hypothesis
would be that economic conditions such as the large government deficit may
have fostered an environment in which regulators might have been reluctant to
act, thereby facilitating the banks' activities.
The results have several implications. First, the standard of proof in
financial fraud cases should be more rigorous. Second, the results suggest
that continued government ownership of State owned companies is costly.
Third, the results suggest that despite the fact that they may be low
probability events the cost of such crises and bailouts are substantial, so
that policy makers should take steps to try to avoid their recurrence. In the
United States, a vaguely similar crisis in the 1930's led to the enactment of
sweeping banking legislation that prevented banks from engaging in securities
activities. The Bej sky Commission recommended a number of steps affectingbanking structure which have not been implemented. Our results suggest thatpolicy makers should reconsider those recommendations.
30
References
Asquith P. and D. Mull ins, 1986. "Equity Issues and OfferingDilution," Journal of Financial Economics, 6189.Bank of Israel Annual Reports.Barnea, A. 1981. "Banks' Profitability in 1980 from thePerspective of an Investor in Bank Stocks," Quarterly BankingReview, Vol. XX.
Barnea, A. 1982. "Banks' Profitability in 1981 and Valuation ofBanks' Shares," Quarterly Banking Review, Vol. XXI.
Barnea, A. 1983. "Profitability of the Commercial Banks in 1982and their Activity in the Capital Market," Quarterly BankingReview, Vol. XXII.
Commission of Inquiry (Be j sky Commission) Report, April 1986.
Bernanke B.S. 1983. "Nonmonetary Effects of the Financial Crisisin Propagation of the Great Depression," American Economic Review,25776.
Blass, A. 1996. "Are Israel Stock Prices Too High?" Bank of IsraelReview, (forthcoming).Brenner, M. and Ruthenberg, D. 1989. "The Banks Intervention inthe Capital Market," Bank of Israel Banking Review, 2, 5263.Easterbrook, F.H. and Fischel, D.R. 1991. The Economic Structureof Corporate Law. Cambridge. Harvard University Press, pp. 31552.Examiner of Banks, Annual Review of Banking Israel System, VariousIssues.
Examiner of Banks, Annual Statistics of Israel's Banking System,Various Issues.
Eruim BaBorsa, monthly publications 19771983.
Grossman, R. 1993. "The Macroeconomic Consequences of BankFailures under the National Banking System," Explorations inEconomic History 30(3), 294320.King, M. 1994. "DebtDeflation: Theory and Evidence," EuropeanEconomic Review, 58 41946.Mabat daily papersRuthenberg, D. 1993. "Optimal Banking Structure, Theory andFacts," Banking Supervision Department Research Unit working paper93.01.
לא
1000
O0
cd 100
en
CM
Figure 1 Industrial and Bank ShareTotal Return Index 19771983
Industrial Return
Bank Total Return
1U 1 1 11 1 1 711111111 11 1 1 1 11 1 1 1 1 1 11 1 1 1 1 1 ( 1 1 1 1 I I I I I I I I I I I I I I I 1 I 1 I IIII I 1 1I I I I I 11 1 1 1 1 1 1 11 1 1 1 1
12/76 12/77 12/78 12/79 12/80 12/81 12/82 12/83Source: Central Bureau of Staitsitcs and Bank of Israel
1000
00
/p ווCO
\CVI
Figure 1A Leumi, Hapoalim k BankingIndex Total Return 19771983
lUU I I I I I I I IIIIIIIM I I I I I I IIII I I I I I I I I I I I I 1 1 1 1 1 1 1 1 1 1 1 1 1 1 1 1 1 1 1 1 1 1 1 1 1 1 1 1 1 1 1 1 1 1 1 1 11 1 11 1 1 1 1 1 1
12/76 12/77 12/78 12/79 12/80 12/81 12/82 12/83Source: Daily Returns for Bank Stocks; Bank Index as reported by the CBS
1000
ft)
O
CO
CM
Figure IB Discount, IDB, MizrahiU Banking Index 19771983
Discount
IDB
Mizrahi
bank IndGx
100^12/76 12/77 12/78 12/79 12/80 12/81 12/82 12/83
.Source:Dailv Returns for bank Stocks: Index as ewDotred bv the CBS

35,000
30.000
25,000
23 20,000
T 3£/7 0
£ 15,000|
10,000
5,000
Fig. 2 Market Value of 5 Major BanksMillion NIS (12/93 price level)
12/76 12/77 12/78 12/79 12/80 12/81 12/82 6/83 12/83end of month Asof 12/93, $1 = 2.9 NIS
120
100
1 80<
01
uCO
3 ICO
o
60
40
20
Figure 35 Banks Market Valueby Components 19771983
20 i i i i i i r12/1977 12/1979 12/1981 6/1983
12/1978 12/1980 12/1982Source: Daily Data, Public Offerings as Reported in Bejsky Report
rr 1 1 1I I I I I
Jan. 1977 market val
Public Offerings
Offer Appreciation
Share Appreciation

100
<.41
CD
Ua
CmO
Figure 3A Leumi Market Valueby Components 19771983
u י י /Jan 1977 market val
Public Offerings
Offer Appreciation
Share Appreciation
12/1977 12/1979 12/1981 6/198312/1978 12/1980 12/1982
Source: Daily Data, Public Offerings as Repotred in Bejstcy Repotr
120
100
Figure 3B HaPoalim Market VAlueby Components 19771983
0
<
u
יא c0)
:.)Aע!
41o
pi 1 t 1
Jan 1977 market val
Public Offerings
Offer Appreciation
Share Appreciation
2012/1977 12/1979 12/1981 6/1983
12/1978 12/1980 12/1982Source: Daily Data, Public Offerings as Reported in Bejsky Report
ן?
קa
>
ua
nG<v
ua
o
120
100
80
60
Figure 3C " Mizrahi Market Valueby Components 19771983
40
20
2012/1977 12/1979 12/1981 6/19B3
12/1978 12/1980 12/1982Source: Daily Data, Public Offerings as Reported in Bejsky Report
1 1 1 1 MI riJan 1977 market val
Public Offerings
Offer Appreciation
Share Appreciation

tf
120
100
A"
Figure 3D Discount Market Valueby Components 19771983
0
2012/1977 12/1979 12/1981 6/1983
12/1978 12/1980 12/1982Source: Daily Data, Public Offeirngs as Repotred in Bejsky Repotr
n / 1 1
ill 1 1
Jan. 1977 market val
Public Offerings
Offer Appreciation
Share Appreciation

0J
120
100
1 1
<
Sir01
a
>>
CMo
Figure 3E IDB Market Valueby Components 19771983
Jan 1977 market val
Public Offerings
Offer Appreciation
Share Appreciation
2012/1977 12/1979 12/1981 6/1983
12/1978 12/1980 12/1982Source: Daily Data, Public Offerings as Repotred in Bejsky Repotr

30 i
enCDu
cnenen
in
כדכ0
20
10
Figure 45 Banks Actual k ProjectedMarket Values 197793
+ ti
Vm
4
+
4. 4
vg
Vf83
Vb93A 4 4 4
S^e Foptnote
012/76 12/78 12/80 12/82 12/84 12/86 12/88 12/90 12/92
12/77 12/79 12/81 12/83 12/85 12/87 12/89 12/91 12/93
Actual Market Value 1977 Projected Forw 1993 Projected Back
The 12/93 figure is an estimate of 5 bank market value based on actual Leumi and HaPoalim values in Dec. 1993.

Table 1 Bank Share Betas 10771983I
et
e
Clali8
FIBIea
LeumiB>r
HapoalimB
MizrahiBa
DiscountBor
l£UdB
IDBB
0.050.270.040.100.080.790.090.530.080.910.050.181977
0.350.390.030.090.010.030.070.730.060.440.080.780.010.001978
0.080.180.100.220.020.010.090.240.050.040.140.560.030.031979
0.050.020.100.590.110.210.060.010.060.130.070.030.070.180.050.021980
0.010.000.280.740.110.190.050.010.060.050.050.070.090.100.040.061931
0.050.060.080.530.010.020.010.000.030.020.010.030.030.040.01.0.011982
0.010.020.181.380.010.010.010.010.010.030.010.010.060.230.010.011983
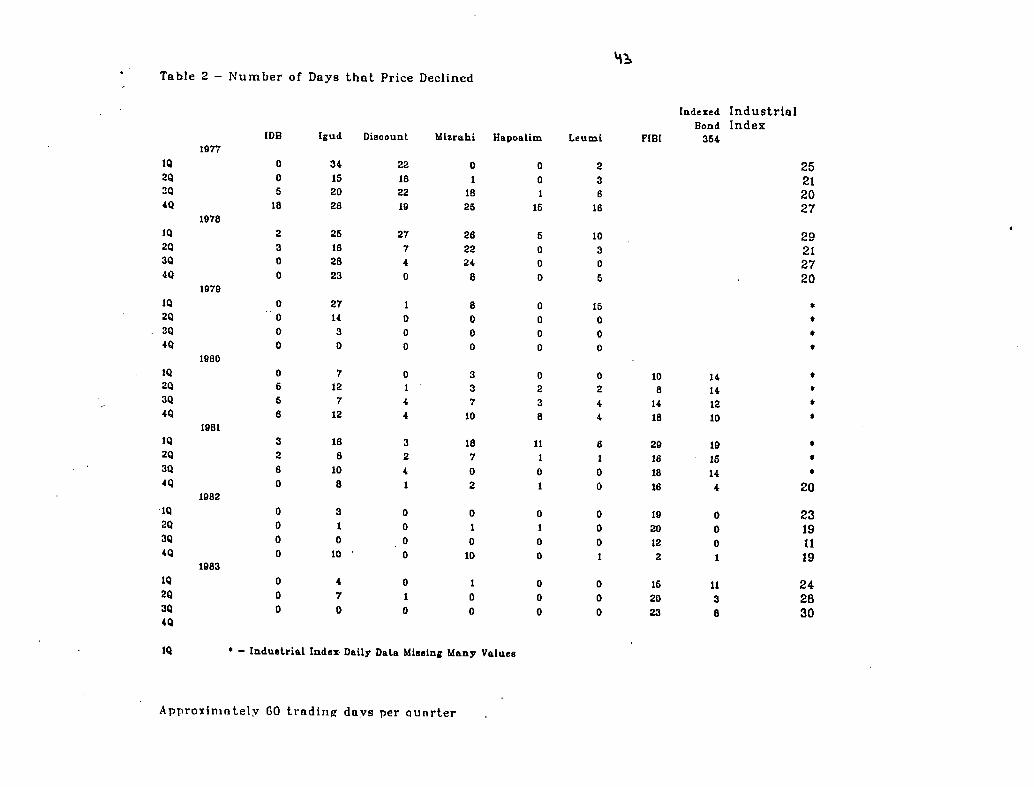
Table 2 Number of Days that Price Declined93
19771Q
2Q3Q
4Q
1Q
2Q3Q
4Q
1Q
2Q3Q4Q
1Q
2Q3Q4Q
1Q
2Q3Q
4Q
1Q
2Q3Q4Q
1Q
2Q3Q4Q
10
1078
1979
1980
1081
1982
1983
IDB
0
05
18
2
3
0
0
00
00
0
6
5
6
3
260
0000
000
. Industrial Index Daily Data Missing Many Values
Discountud
2234161522201928
2725716428023
1270140300
0711247412
3IB2841018
0301
00010
041700
Hapoalimhi
00
01
1181525
52802202408
0800
0000
032337810
111817
0012
0011
00010
01
0000
Leumi
23616
10305
15000
0244
61
00
0
0
0
1
0
0
0
F(B]
108
14IB
29161816
1920122
152023
IndustrialIndexedIndexBond
354
25212027
29212720
*
*
*
.
*14*14*12*10
.19*15*14
204
230190110191
2411
283308
Approximately GO trading days per aunrter
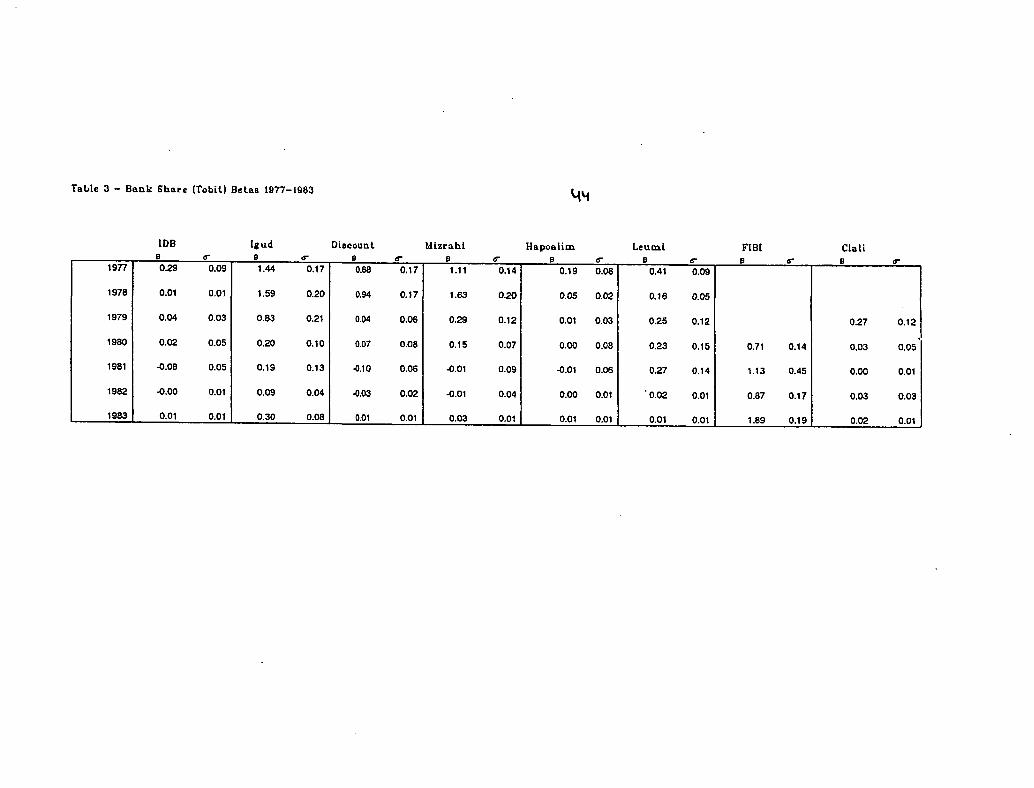
Table 3 Back Share (Tobil) BetaB 19771983Mm
ClaliB
FIBtBa
LeutniBa
HapoalimB
Mizrahie
DiscountB>r
]gilda
IDBB
0.090.410.080.190.141.110.170.880.171.440.090291977
0.050.160.02O.OS0.201.630.170.940.201.590.010.011978
0.120.270.120.250.030.010.120.290.060.040.210.830.030.041979
0.050.030.140.710.150.230.080.000.070.150.080.070.100.200.050.021980
0.010.000.451.130.140.270.060.010.090.010.060.100.130.190.050.081981
0.030.030.170.870.010.020.010.000.040.010.020.030.040.090.010.001982
0.010.020.191.890.010.010.010.010.010.030.010.010.080.300.010.011983
45
בסדרה המאמרים רשימת
R. Meinick and Y. Golan Measurement of Business Fluctuations in Israel . 91.01
שוק כוחות בישראל: שכר עליות של דינאמיקה זוסמן צ. ארטשטיין, י. 91.02בינענפיות. והשוואות
M. Sokoler Seigniorage and Real Rates of Return in a Banking Economy. 91.03
E.K. Offenbacher Tax Smoothing and Tests of Ricardian Equivalence: 91.04Israel 19611988.
בשנת בריה"מ עולי של בתעסוקה קליטה קסיר, (קלינר) נ. פלוג, ק. עופר, ג. 91.05יד. משלחי והחלפת שמירה של היבטים והלאה: 1990
ציבורית: במערכת ומשברים וזוטרים בכירים בין פערים זכאי, ד. זוסמן, צ. 91.06.1990 עד 1974 בשנים הרופאים שכר
M. Beenstock, Y. Lavi and S. Ribon The Supply and Demand for Exports 91.07in Israel .
R. Ablin The Current Recession and Steps Required for Sustained 91.08Sustained Recovery and Growth.
המונית עלייה של המקרוכלכליות ההשלכות מרידור (רובין) ל. הרקוביץ, צ. 91.09לישראל.
M. Beenstock Business Sector Production in the Short and Long Run ווו 91.10Israel : A Cointegrated Analysis.
וגבולותיה. ההפרטה עמיחי, ר. ארנון, א. 91.11
הישראלית. בתעשייה העבודה עלות (קלינר) קסיר נ. פלוג, ק. 91.12
A. Marom The BlackMarket Dollar Premium: The Case of Israel. 91.13
A. Bar II an and A. Levy Endogenous and Exoqenous Restrictions on 91.14Search for Employment.
46
M. Beentstock and S. Ribon The Market for Labor in Israel. 91.15
הלא השקלי במגזר הריביות פער על המוניטרית המדיניות השפעת אלקיים, ד. 91.16.1990 עד 1986 צמוד
לשנים הישראלי המשק עבור IMFn של הפיסקאלי הדחף מדד בחינת דהן, מ. 92.01.1990 עד 1964
0. Bar Efrat Interest Rate Determination and Liberalization of 92.02International Capital Movement: Israel 1973 1990.
Z. Sussman and D. Zakai Wage Gaps between Senior and Junior 92.03Physicians and Crises in Public Health in Israel, 19741990.
.1989 עד 1965 בישראל, העברה תשלומי התפתחות לויתן ע. ויס, צ. 92.04
0. Liviatan The Impact of Real Shocks on Fiscal Redistribution and 92.05Their LongTerm Aftermath.
A. Bregman, M. Fuss and H. Regev The Production and Cost Structure 92.06of the Israeli Industry: Evidence from Individual FiRm Data.
M. Beenstock, Y. Lavi and A. Offenbacher A Macroeconometric Model 92.07for Israel 19621990: A Market Equilibrium Approach toAggregate Demand and Supply.
הכסף. לשוק חודשי מודל ריבון, ס. 92.08
R. Melnick Financial Services, Cointegration and the Demand for 92.09Money in Israel .
והן האוכלוסייה של הדמוגרפי הפסיפס על והשפעתן לארץ העליות ברון, מ. 92.10האנושי. ההון
להיסגר. פירמות של ההסתברות את הקובעים גורמים זינגר, ד. 92.11
R. Melnick Forecasting ShortRun Business Fluctuations in Israel. 92.12

47
K. Flug, N. Kasir and G. Ofer The Absorption of Soviet Immigrants 92.13into the Labor Market from 1990 Onwards: Aspects ofOccupational Substitution and Retention.
מוכח. הבלתי אחר הריצה טבעיים: מונופולים הפרטת פרשטמן, ח. ארנון, א. 92.14
B. Eden How to Subsidize Education and Achieve Voluntary Integration: 93.01An Analysis of Voucher Systems.
.(1988 עד 1958) בישראל העסקי בסקטור צמיחה גורמי מרום, א. ברגמן, א. 93.02
ביטחוני. איום תחת כלכלית צמיחה דהן, מ. 93.03
הקצר. הטווח המדינות חבר עולי של בתעסוקה קליטה (קלינר)קסיר נ. פלוג, ק. 93.04
כלכלית? להתפתחות ההכנסות בחלוקת שיויון בין יריבות קיימת האם דהן, מ. 93.05ישראל. של המקרה :
לישראל: המונית עלייה של המקרוכלכליות ההשלכות מרידור ל. הרקוביץ, צ. 93.06מחודשת. ובחינה עדכון
A. Arnon, D. Gottlieb An Economic Analysis of the Palestinian Economy: 93.07The West Bank and Gaza, 19681991.
הון ניידות של בתנאים וצמיחה הגירה קנטור נ. מרידור, ל. הרקוביץ, צ. 93.08התשעים. שנות בראשית לישראל העלייה גל משוכללת: בלתי
K. Flug, N. Kasir The Absorption in the Labor Market of Immigrants 93.09from the CIS the Short Run.
R. Ablin Exchange Rate Systems, Incomes Policy and Stabilization 94.01Some Short and LongRun Considerations.
B .Eden The Adjustment of Prices to Monetary Shocks When Trade is 94.02Uncertain and Sequential.
48
ולקחיה. הדמוגרפית התחזית ברון, מ. 94.03
K. Flug, Z. Hercowitz and A. Levi A Smal1OpenEconomy Analysis of 94.04Migration.
R. Melnick and E. Yashiv The Macroeconomic Effects of Financial 94.05Innovation: The Case of Israel .
בישראל. ציבורי חוב מדיניות סטרבציינסקי, מ. הרקוביץ, צ. 94.06
הממונה החלטת בחינת תילדוק: לתחנות דלק בשיווק כניסה כחסמי חוזים בלס, א. 94.07כובל. הסדר בגדר היא הקיימת ההסדרים מערכת לפיה עיסקיים הגבלים על
הכנסות. והתחלקות חוקית בלתי פעילות כלכלית, צמיחה דהן, מ. 94.08
A. Blass Are Israeli Stock Prices Too High? 94.09
וירדן. הפלסטינים ישראל, בין הסחר פוטנציאל וינבלט, גי. ארנון, א. 94.10
A. Arnon and J. Weinblatt The Potential for Trade Between Israethe Palestinians, and Jordan.
בישראל. כלכלית וצמיחה הציבורי הסקטור תקציב סטרבציינסקי, מ. דהן, מ. 94.11
העסקי. בסקטור המינימום שכר לחוק הציות קסיר (קלינר) נ. פלוג, ק. 94.12
B. Eden Inflation and Price Dispersion: An Analysis of Micro Data 94.13
לפתרון. ההמלצות ובחינת מושגית מסגרת בישראל: הפנסיה קרנות משבר ספיבק, א. 94.14
עשורים. שלושה של פרספקטיבה בישראל: הריאלי החליפין שער פסח ש. מרידור, ל. 94.15
B. Eden Time Rigidities in The Adjustment of Prices to Monetary Shocks: 94.16An Analysis of Micro Data.
O. Yosna Privatizing Multi Product Banks. 94.17

49
B. Eden Optimal Fiscal and Monetary Policy in a BaumoiTobin Model 95.01
B. BarNathan, M. Beenstock and Y. Haitovsky An Econometric Model of 95.02The Israeli Housing Market.
הכנסות. והתחלקות אנדוגנית אוכלוסיה דהן מ. 95.03
A. Arnon and A. Spivak A Seigniorage Perspective on the Introduction 95.04of a Palestinian Currency.
בישראל? בתצרוכת השינוי להסבר תורמ השוטפת בהכנסה השינוי האם לביא, י. 95.05רציונאליות. צפיות עם הפרמננטית ההכנסה תיאוריית של אמפירית בחינה
M. Bruno and R. Melnick High Inflation Dynamics: Integrating ShortRun 95.06Accommodation and LongRun SteadyStates
הענפי" "המבנה מזוית ניתוח והשפעתה: ההון בשוק הרפורמה יפה י. יושע, ע. 95.07
M. Strawczynski Capital Accumulation in a Bequest Economy. 95.08
לצרכן. המחירים במדד הדיירים בבעלות הדיור סעיף על שיפר ז. 95.9
האינפלציה. ויעד המוניטרית המדיניות החליפין, שער משטר בסט בן א. 95.10
A. Arnon and A. Spivak Monetary Integration Between the Israeli, 95.11Jordanian and Palestinian Economies
ולקחים. פירושים במכסיקו המשבר לויתן נ. 95.12
.19881994 בישראל מוניטרית למדיניות ביניים יעד איתור סורני ב. כהן, ר. 95.13
.19941987 שוק: ומבנה הגמל קופות ביצועי בלס א. 96.01
על עדויות עניין: ובעלי בורסה בנקים, על פיקוח יפה י. יושע, ע. בר, ח. 96.02בישראל. פירמות
A. Biass and R. S. Grossman A Harmful Guarantee? The 1983 Israel Bank 96.03Shares Crisis Revisited
Top Related