


Languages
Pages
Legal


264
Working paper Disaster Category Classification and peril Terminology for Operational Purposes Common accord Centre for Research on the Epidemiology of Disasters (CRED) and Munich Reinsurance Company (Munich RE )
Regina Below, CRED Angelika Wirtz, Munich RE Debarati GUHA-SAPIR, CRED
October 2009

1
1. Introduction
One of the major current challenges in the field of disaster data is to overcome the limitations induced by the lack of clear standards and definitions, which leads to inconsistent reliability and poor interoperability of different disaster data compilation initiatives. The Centre for Research on the Epidemiology of Disasters (CRED) militates for years for the creation of internationally recognized standards and definitions. In 2006, CRED undertook an analytical review of selected data set on natural disasters and impacts1. The objective was to provide a comprehensive overview of current global disaster database initiatives to better identify gaps or differences in information and strengths in our individual interpretations. The paper highlights the strengths and weaknesses of all those efforts that have taken place to better document the impacts of disasters and draws attention to the problems and the areas in which management of disaster information could improve. Some of the areas identified include: ‐ Disaster definition: Differences and lack of standardization of the terminology complicate
comparisons of data ‐ Disaster typology/classification: Databases have to cope with disaster (sub)type
classifications as well as their primary and secondary effects. Without standardized terminology, databases continue to face a decreased accuracy in reporting disaster related impact.
Georeferencing, temporal aspects, methodology and sourcing were other issues that have been identified. Although these issues are not new, they represent areas where we should focus our attention, and also remind us of the challenges that this area of research continues to face. The standardization of methods and definitions is clearly the key issue to be addressed in order to improve data quality and to ensure comparability between data sets.
1 Tschoegl L., with Below R. and Guha‐Sapir D. (2006). An Analytical review of selected data sets on natural disasters and impacts. Paper prepared for the UNDP/CRED Workshop on Improving Compilation of Reliable Data on Disaster Occurrence and Impact. Bangkok, 2‐4 April 2008.

2
2. Context
In 2002, under the request of the ProVention Consortium, CRED has led a comparative study of three global data sets: EM‐DAT (CRED), NatCatSERVICE (Munich RE) and Sigma (Swiss RE)2. The aim was to assess the comparative strengths and weaknesses of these three databases. The analysis was based on 4 countries ‐ Vietnam, India, Honduras and Mozambique ‐ over a period of 15 years (1985‐1999). All records were extracted from the 3 databases and were tabulated in a matrix where the disaster entries from each source could be cross‐referenced by each variable of interest. The variables included for comparison were: date, disaster type, number of people killed, homeless, injured, affected and overall damage costs. Taking into account that each of these databases has its own specificity, one of the conclusions was that a disaster event may be classified as a different type of disaster by different databases. This occurs particularly for associated disasters or secondary disasters. For example, a flood which was a consequence of a wind storm may be recorded as one or the other; or a flood recorded as such in one database could be recorded as a cyclone in another. A further example is the use of different terminologies to define the same event: a winter storm could be registered as cold/frost; or similarly a heat wave as drought. Taxonomy is also difficult to standardize since perfectly credible sources will also differ as to whether an event was a landslide, a mudslide, a flood, or whether they occurred simultaneously or sequentially. Difference in typology and taxonomy make the comparison of data sets difficult. Transparent standards would improve the credibility of all databases significantly.
It is in this context that in 2007, CRED and Munich RE led a collaborative initiative, agreed on and implemented as a common “Disaster Category Classification and Peril Terminology for Operational Databases". This new common classification has been established through several technical meetings and working groups that brought together CRED, Munich RE, Swiss Re, Asian Disaster Reduction Center (ADRC) and United Nations Development Programme (UNDP) and represents a first and important step in the development of a standardized international classification of disasters and terminology of perils.
2 Guha Sapir D., Below R. (2002). The quality and accuracy of disaster data: A comparative analysis of three global data sets, ProVention Consortium

3
Table 1: Overview of EM‐DAT and NatCatSERVICE databases
EM-DAT(CRED)
NatCatSERVICE(Munich RE)
Period covered 1900 – present 0079 - present
Number of entries 17,000 26,000
Type of disasters Natural and technological disasters Natural disasters
Entry criteria 10 or >deathsand/or100 or > af fectedand/orDeclaration of a state ofemergency/call for interantionalassistance
• Entry if any property damageand/orany person sincerely af fected(injured, dead)
• Before 1970 only major events
Main sources UN agencies, US Governmentagencies, of f icial governmentalsources, IFRC, research centres, Lloyd‘s, Reinsurance sources, press, private
Munich RE branch of f ices; Insurance Associations; Insurance press; Scientif ic sources; Weatherservices; Governmental and non-governmental organisations
Priority source Priority is given to the UN agencies For monetory losses priority isgiven to Munich RE branch of f icesand Insurance Associations
Access Public Partially accessible
Web address www.emdat.be www.munichre.com/geo
The table gives an overview of the meta information and criteria applied in the EM‐DAT and NatCatSERVICE databases.

4
3. Goals
The goals of this initiative are: 1. Create and agree on a common hierarchy and terminology for all global and regional
databases on natural disasters;
2. Establish a common and agreed definition of disaster groups, main types and sub‐types that is simple and self‐explanatory.
The conditions are to allow all global databases to compare and exchange data at a detailed level, as well as all other databases using this standard to do the same. 4. Disaster category classification and peril terminology: Methodology
The classification of different types of disasters into main categories was primarily based on a matrix including the existing disaster categories from the main database owners: ADRC (GLIDE), CRED (EM‐DAT), La Red (DesInventar), Munich RE (NatCatSERVICE) and Swiss Re (Sigma). The same exercise was done for the definitions of the disaster categories. Taking into account each database specificities, a first working group meeting was set up in order to reach a common disaster category classification and terminology to fit all databases.
4.1 Hierarchy of disaster categories
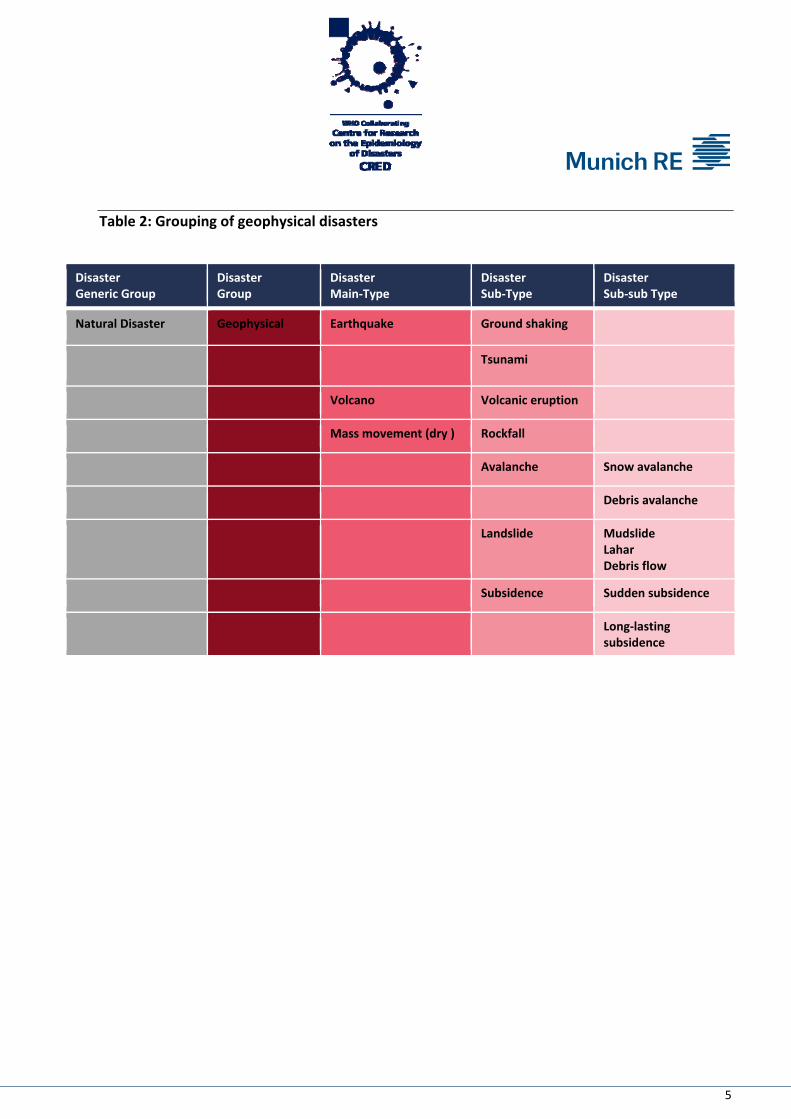
The new classification distinguishes two generic disaster groups: natural and technological disasters. The natural disaster category being divided into six disaster groups: Biological, Geophysical, Meteorological, Hydrological, Climatological and Extra‐Terrestrial. Each group covers different disaster main types, each having different disaster sub‐types. Tables 2 – 7 give an overview of the grouping of natural disasters.
5
Table 2: Grouping of geophysical disasters
Disaster Generic Group
Disaster Group
Disaster Main‐Type
Disaster Sub‐Type
Disaster Sub‐sub Type
Natural Disaster Geophysical Earthquake Ground shaking
Tsunami
Volcano Volcanic eruption
Mass movement (dry ) Rockfall
Avalanche Snow avalanche
Debris avalanche
Landslide MudslideLahar Debris flow
Subsidence Sudden subsidence
Long‐lasting subsidence

6
Table 3: Grouping of meteorological disasters
Disaster Generic Group
Disaster Group
Disaster Main‐Type
Disaster Sub‐Type
Disaster Sub‐sub Type
Natural Disaster Meteorological Storm Tropical storm
Extra‐tropical cyclone (Winter storm)
Local/Convective storm
Thunderstorm/Lightning
Snowstorm/Blizzard
Sandstorm/Duststorm
Generic (severe) storm
Tornado
Orographic storm (strong winds)
Table 4: Grouping of hydrological disasters
Disaster Generic Group
Disaster Group
Disaster Main‐Type
Disaster Sub‐Type
Disaster Sub‐sub Type
Natural disaster Hydrological Flood General (river) flood
Flash flood
Storm surge/coastal flood
Mass movement (wet)
Rockfall
Landslide Debris flow
Avalanche Snow avalanche
Debris avalanche
Subsidence Sudden subsidence
Long‐lasting subsidence

7
Table 5: Grouping of climatological disasters
Disaster Generic Group
Disaster Group
Disaster Main‐Type
Disaster Sub‐Type
Disaster Sub‐sub Type
Natural disaster Climatological Extreme temperature
Heat wave
Cold wave Frost
Extreme winter conditions
Snow pressure
Icing
Freecing rain
Debris avalanche
Drought Drought
Wild fire Forest fire
Land fires (grass, scrub, bush, etc. …)
Table 6: Grouping of biological disasters
Disaster Generic Group
Disaster Group
Disaster Main‐Type
Disaster Sub‐Type
Disaster Sub‐sub Type
Natural disaster Biological Epidemic Viral Infectious Diseases
Bacterial Infectious Diseases
Parasitic Infectious Diseases
Fungal Infectious Diseases
Prion Infectious Diseases
Insect infestation Grasshoper/Locust/Worms
Animal stampede

8
Table 7: Grouping of extra‐terrestrial disasters
Disaster Generic Group
Disaster Group
Disaster Main‐Type
Disaster Sub‐Type
Disaster Sub‐sub Type
Natural disaster Extra‐terrestrial Meteorit/Asteorit
4.2 Methodology The hierarchy of the new classification is based on a “triggering hazard/event” logic. Indeed, the triggering hazard/event is used as the reference root to classify the disaster. For example, a mass movement can be triggered by either a geophysical or a hydrological phenomenon. The triggering hazard will then determine if the disaster is assigned to enter into the “mass movement dry” or “mass movement wet” category. Table 8 shows examples of how disasters are classified following this hierarchy. Tables 9 and 10 show the percentage distribution of events by disaster groups and disaster main types for the period 2000 – 2008 in both databases after the implementation of the new classification Table 8: Examples of classification of disasters
Example DisasterGeneric Group
DisasterGroup
DisasterMain-type
DisasterSub-type
DisasterSub-subtype
1999:Landslides,Venezuela
Natural disaster Hydrological Mass movement (wet) Landslides
2004:Tsunami,South Asia
Natural disaster Geophysical Earthquake Tsunami
2008:Cyclone Nargis, Myanmar
Natural disaster Meteorological Storm Tropical storm Storm surge
2009:„Victoria-Fires“, Australia
Natural disaster Climatological Wild fire Bush fire
9
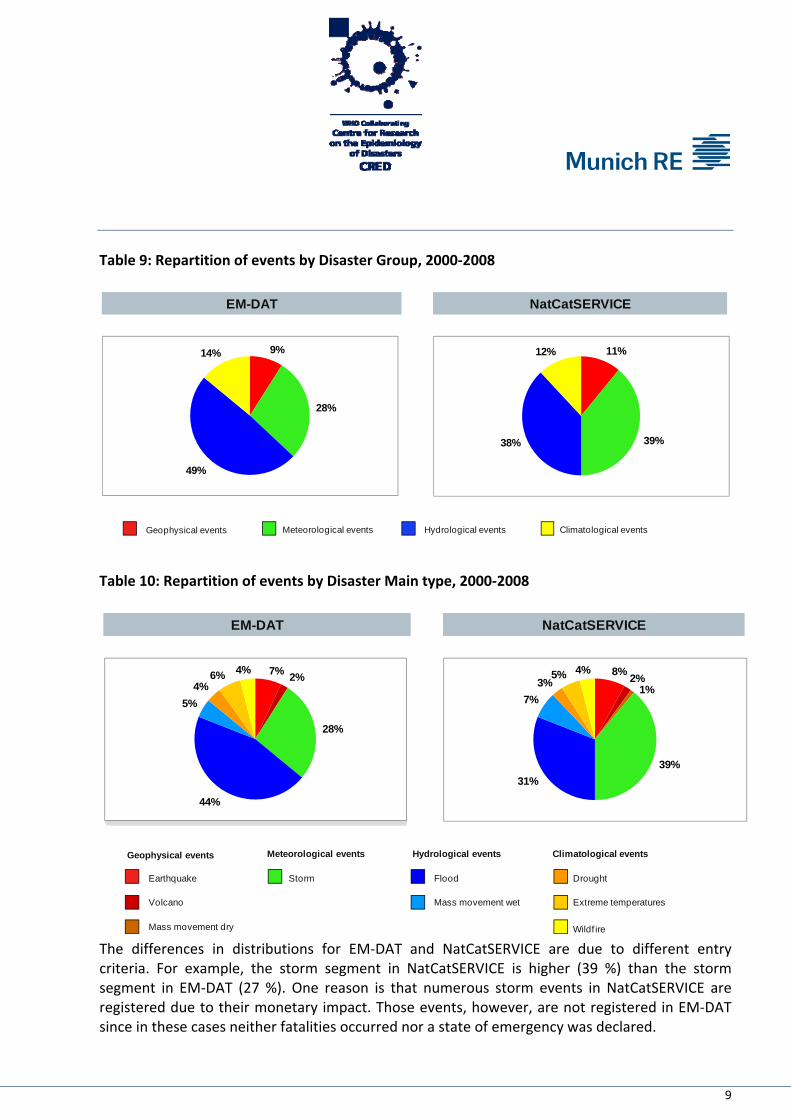
Table 9: Repartition of events by Disaster Group, 2000‐2008
EM-DAT
9%
28%
49%
14%
NatCatSERVICE
11%
39%38%
12%
Climatological eventsHydrological eventsMeteorological eventsGeophysical events
Table 10: Repartition of events by Disaster Main type, 2000‐2008
NatCatSERVICE
8% 2%1%
39%31%
7%3%
5% 4%
Earthquake
Mass movement dry
Volcano
Storm Flood
Mass movement wet Extreme temperatures
Drought
Wildf ire
Geophysical events Meteorological events Hydrological events Climatological events
EM-DAT
7% 2%
28%
44%
5%4%
6% 4%
The differences in distributions for EM‐DAT and NatCatSERVICE are due to different entry criteria. For example, the storm segment in NatCatSERVICE is higher (39 %) than the storm segment in EM‐DAT (27 %). One reason is that numerous storm events in NatCatSERVICE are registered due to their monetary impact. Those events, however, are not registered in EM‐DAT since in these cases neither fatalities occurred nor a state of emergency was declared.

10
5. Conclusion/Recommendations The harmonizing of the disaster category classification between two of the most important global disaster databases ‐ NatCatSERVICE and EM‐DAT – as well as the definition of common standards is an important contribution to the improvement of quality and reliability of the international disaster databases. Both disaster classification and definition of common standards serve the international community, users and developers of databases at national or sub‐national levels to have a better understanding of the management of disaster data. It demonstrates the importance to develop the capacity of information exchange, integration and comparability between disaster databases. CRED and Munich RE are aware of the limitations of and/or differences in concepts which may occur. This classification of perils does not claim to be exhaustive or to fit into each database specification. However, it is a valuable tool which facilitates the exchange and comparison of disaster events and their impacts and also allows interoperability between disaster databases. © 2009 CRED/Munich RE Munich Reinsurance Company Geo Risks Research Koeniginstrasse 107 80802 Munich Germany www.munichre.com/geo Catholic University of Louvain Centre for Research on the Epidemiology of Disasters ‐ CRED 30.94 Clos Chapelle‐aux‐Champs 1200 Brussels Belgium www.cred.be


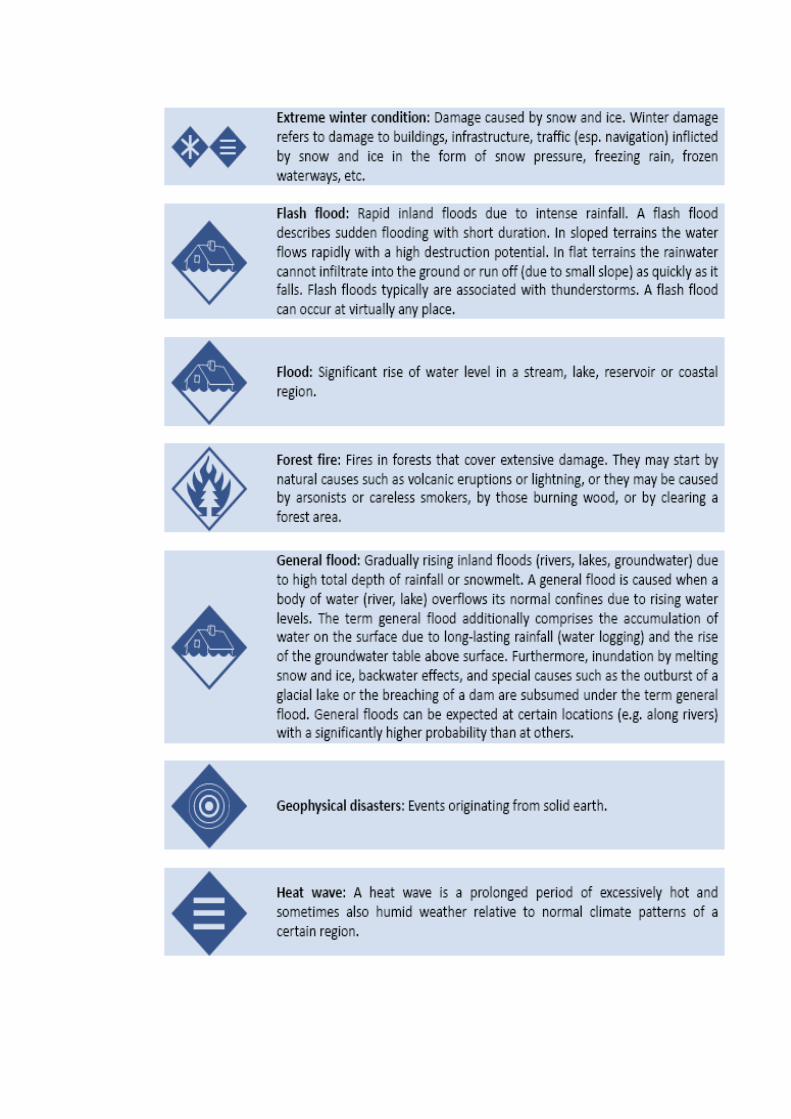

These definitions have been established by Munich RE Risks Research and CRED. More definitions can be found on the EM‐DAT website in the “Glossary” section and at Munich RE/Geo website in the “NatCatSERVICE” section.

ANNEX II EM‐DAT ‐ Data definitions, criteria and content CRED defines a disaster as “a situation or event which overwhelms local capacity, necessitating a request to a national or international level for external assistance; an unforeseen and often sudden event that causes great damage, destruction and human suffering”. For a disaster to be entered into the database, at least one of the following criteria must be fulfilled: 10 or more people reported killed; 100 or more people reported affected; declaration of a state of emergency; call for international assistance. EM‐DAT distinguishes 2 generic categories for disasters (natural and technological), the natural disaster category being divided into 5 sub‐groups, which in turn cover 12 disaster types and more then 30 sub‐types (tables 1 and 2). Table 1 – Disaster sub‐group definition and classification
Disaster Subgroup
Definition Disaster Main Type
Geophysical Events originating from solid earth Earthquake, Volcano, Mass Movement (dry)
Meteorological Events caused by short‐lived/small to meso scale atmospheric processes (in the spectrum from minutes to days)
Storm
Hydrological Events caused by deviations in the normal water cycle and/or overflow of bodies of water caused by wind set‐up
Flood, Mass Movement (wet)
Climatological Events caused by long‐lived/meso to macro scale processes (in the spectrum from intra‐seasonal to multi‐decadal climate variability)
Extreme Temperature, Drought, Wildfire
Biological Disaster caused by the exposure of living organisms to germs and toxic substances
Epidemic, Insect Infestation, Animal Stampede
Table 2 – Natural Disaster Classification
EM‐DAT includes the following fields:
NATURAL DISASTERS
Epidemic o Viral Infectious Disease
o Bacterial Infectious Disease
o Parasitic Infectious Disease
o Fungal Infectious Disease
o Prion Infectious Disease
Insect Infestation Animal Stampede
Earthquake Volcano Mass Movement (Dry)
o Rockfall o Landslide o Avalanche o Subsidence
Extreme Temperature
o Heat Wave o Cold Wave o Extreme Winter Condition
Drought Wildfire
o Forest Fire o Land Fire
Flood o General Flood o Flash Flood o Storm Surge / Coastal Flood
Mass Movement (Wet)
o Rockfall o Landslide o Avalanche o Subsidence
Geophysical Hydrological
Storm o Tropical Cyclone o ExtraTropical Cyclone o Local Storm
Biological
Climatological
Meteorological
HydroMeteorological

DISNO: Unique disaster number for each disaster event (8 digits: 4 digits for
the year and 4 digits for the disaster number – for example, 19950324).
Country: Country (ies) in which the disaster occurred.
Disaster generic
group: 2 groups are distinguished in EM‐DAT – natural and technological disasters.
Disaster sub‐
group: 5 sub‐groups of natural disasters have been defined: geophysical, meteorological, hydrological, climatological and biological.
Disaster main type
and sub‐type: Description of the disaster according to a pre‐defined classification (for example, type: flood; sub‐type: flash flood).
Date (start and
end): Date when the disaster occurred and ended (month/day/year).
Killed: Number of people confirmed dead and number missing and
presumed dead.
Injured: Number of people suffering from physical injuries, trauma or an illness requiring immediate medical treatment as a direct result of a disaster.
Homeless: Number of people needing immediate assistance for shelter.
Affected: Number of people requiring immediate assistance during a period of
emergency; this may include displaced or evacuated people.
Total affected: Sum of injured, homeless and affected.
Victims: Sum of killed and total affected.
Estimated damage: Global figure of the economic impact of a disaster; it is given in US dollars.
Additional fields: Other geographical information (such as latitude and longitude,
location), value and scale of the events (such as the Richter scale value for an earthquake), the international status (OFDA response, request for international assistance, disaster/emergency declaration), the aid contribution (in US dollars), and the different sectors affected.

ANNEX III NatCatSERVICE ‐ Data definitions, criteria and content Munich RE NatCatSERVICE distinguishes between small‐scale and moderate loss events, severe and major catastrophes, and devastating and great natural catastrophes. Entered are such events which have resulted in human or material loss, they are then grouped into defined catastrophe categories. NatCatSERVICE covers natural disasters and distinguishes between 4 groups (geophysical, meteorological, hydrological and climatological), which in turn cover 9 disaster main‐types and about 20 sub‐types (tables 1 and 2). Table 1 – Disaster group definition and classification
Disaster Definition
Subgroup Disaster Main Type
Geophysical Events originating from solid earth Earthquake, Volcano, Mass Movement (dry)
Meteorological Events caused by short‐lived/small to meso scale atmospheric processes (in the spectrum from minutes to days)
Storm
Hydrological Events caused by deviations in the normal water cycle and/or overflow of bodies of water caused by wind set‐up
Flood, Mass Movement (wet)
Climatological Events caused by long‐lived/meso to macro scale processes (in the spectrum from intra‐seasonal to multi‐decadal climate variability)
Extreme Temperature, Drought, Wildfire
Biological Disaster caused by the exposure of living organisms to germs and toxic substances
Epidemic, Insect Infestation, Animal Stampede
Table 2 – Natural disaster classification

NatCatSERVICE includes the following main fields:
MR‐Number: Unique number for each loss event giving the year, month, disaster
group (A = Geophysical, B = Meteorological, C = Hydrological, D = Climatological), and a 3 digit cat‐number. For example: MR200901A005.
Geographical information:
Continent, Sub‐continent, Country, State/Province, County, Longitude/Latitude.
Generic group: Natural disasters
Disaster group: 4 groups of natural disasters have been defined: geophysical,
meteorological, hydrological, and climatological.
Disaster main type and sub‐type:
Description of the disaster according to pre‐defined classification. For example, disaster main‐type is flood and sub‐type is flash flood.
Date (start and
end): Date when the disaster occurred and ended (month/day/year). This date is strongly linked to the impact and not to the natural phenomenon itself. For example, the start date for a hurricane will be the first loss date and not the birth date of the hurricane.
Killed:
Missing:
Number of people confirmed dead. Number of people declared missing.
Injured: Number of people suffering from physical injuries.
Homeless: Number of people needing immediate assistance for shelter.
Evacuated:
Number of people forced to leave their homes.
Overall loss: Direct, tangible monetary impact of a disaster. Loss is given in original
values, in USD, EUR and the country’s original currency. The exchange rate is the “end‐of‐the‐month” rate of that month when the event occurred.
Insured loss: Monetary loss paid out by the worldwide insurance industry. Loss is
given in original values, in USD, EUR and the country’s original currency. The exchange rate is the “end‐of‐the‐month” rate of that month when the event occurred.
Additional fields: In addition to the basic parameters there are about 200 fields for each loss event allowing detailed analyses. For example, scientific parameters (magnitude, intensity, precipitation, wind force), lines of business and sectors (industry, infrastructure, agriculture, transport, offshore), as well as number of claims and average losse

Top Related