


Languages
Pages
Legal


C.N.S.
Stroke

Mohamed Zaitoun
Assistant Lecturer-Diagnostic Radiology Department , Zagazig University Hospitals
EgyptFINR (Fellowship of Interventional
Neuroradiology)[email protected]


Knowing as much as possible about your enemy precedes successful battle
and learning about the disease process precedes successful management
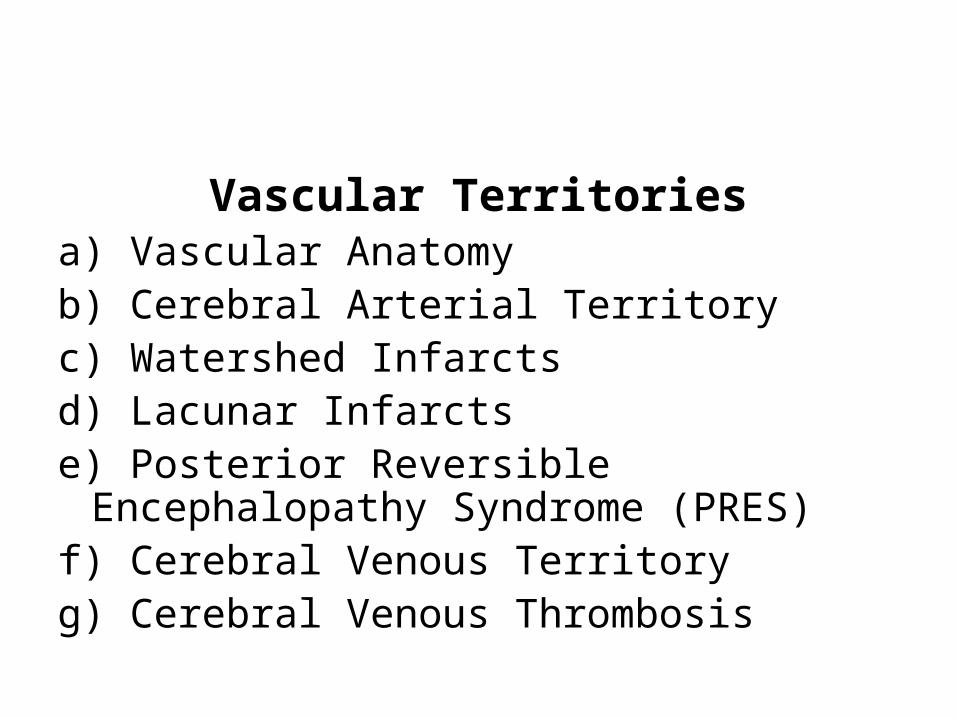
Vascular Territoriesa) Vascular Anatomyb) Cerebral Arterial Territoryc) Watershed Infarctsd) Lacunar Infarctse) Posterior Reversible Encephalopathy Syndrome
(PRES)f) Cerebral Venous Territoryg) Cerebral Venous Thrombosis

a) Vascular Anatomy :1-Internal Carotid Artery2-Circle of Willis3-Middle Cerebral Artery4-Anterior Cerebral Artery5-Persistent Carotid-Basilar Connections
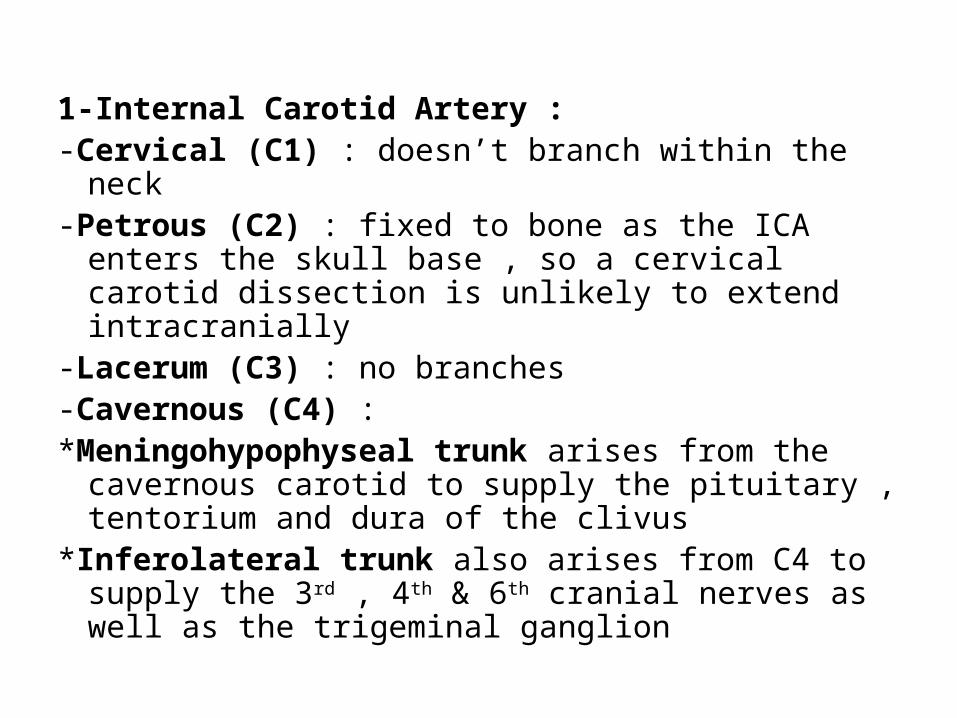
1-Internal Carotid Artery :-Cervical (C1) : doesn’t branch within the neck-Petrous (C2) : fixed to bone as the ICA enters the skull
base , so a cervical carotid dissection is unlikely to extend intracranially
-Lacerum (C3) : no branches-Cavernous (C4) :*Meningohypophyseal trunk arises from the cavernous
carotid to supply the pituitary , tentorium and dura of the clivus
*Inferolateral trunk also arises from C4 to supply the 3rd , 4th & 6th cranial nerves as well as the trigeminal ganglion
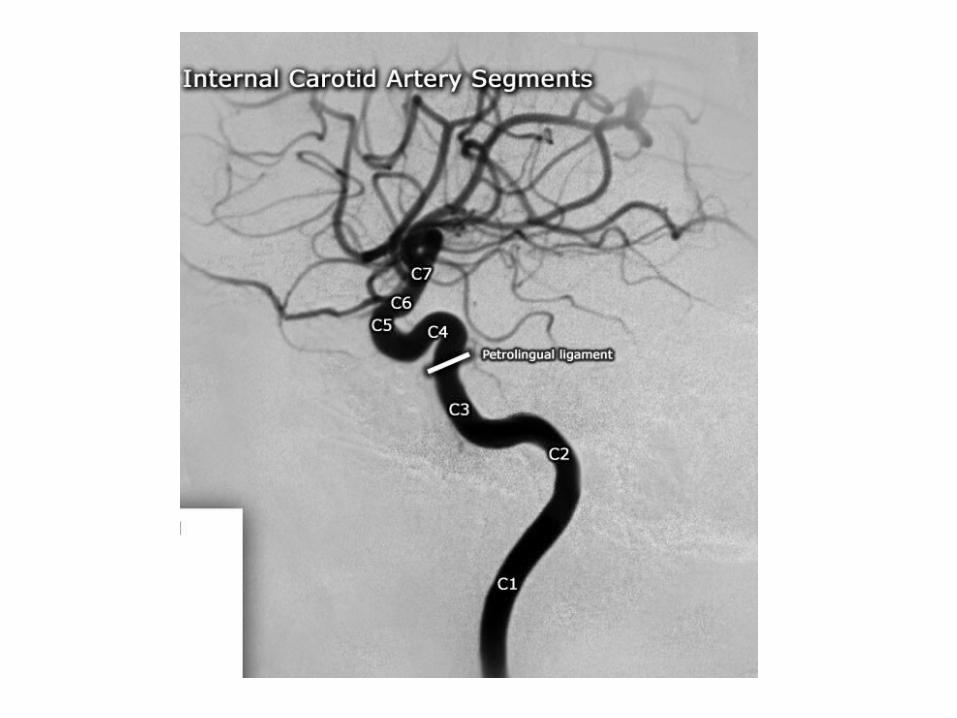

-Clinoid Segment (C5) : the carotid rings are two dural rings that mark the proximal & distal portions of the clinoid segment of the ICA , the carotid rings prevent an inferiorly located aneurysm from causing intracranial SAH with rupture
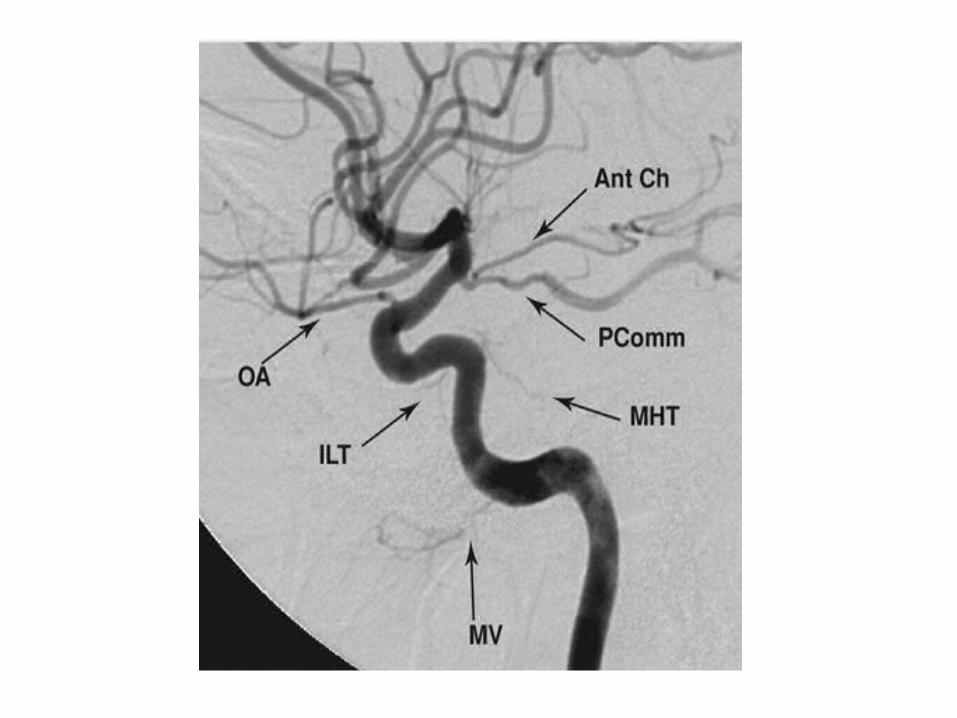
-Supraclinoid (C6-C7) : gives off several key arteries :1-Ophthalmic artery :-Supplies the optic nerve , it takes off just distal to the distal
carotid ring in 90 % of cases and can be used as a landmark for the distal ring
-Aneurysms located superior to this ring can result in subarachnoid hemorrhage
2-PCOM :-Is an anastomosis to the posterior circulation -A fetal PCA is a variant supplied entirely by the ipsilateral ICA via
an enlarged PCOM3-Anterior choroidal artery :-Supplies several critical structures , despite its small size , it
supplies the optic chiasm , hippocampus and posterior limb of the internal capsule
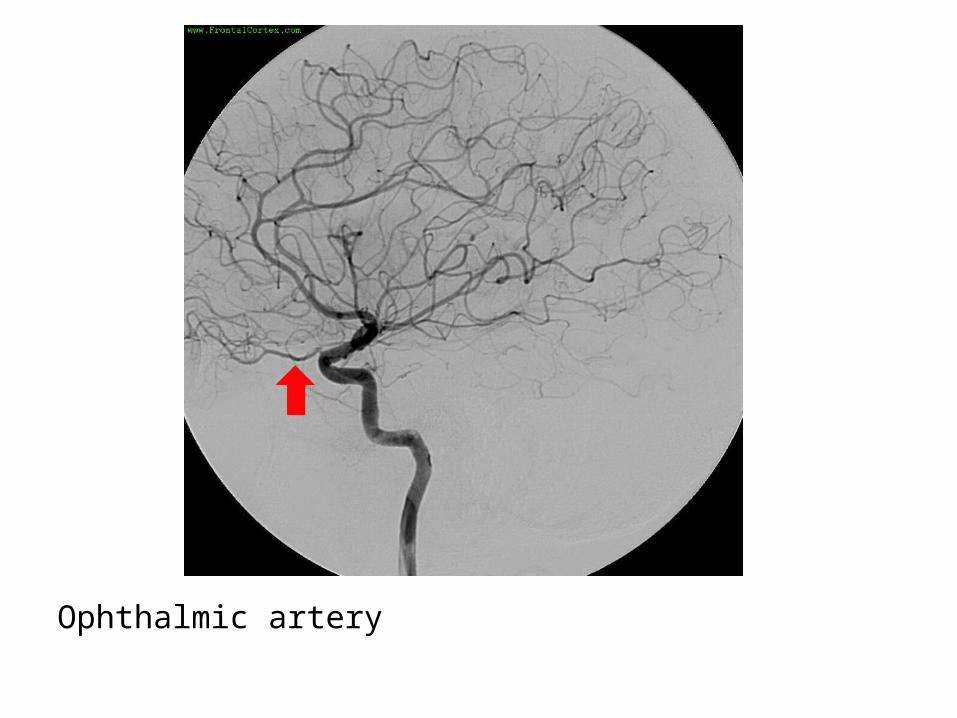
Ophthalmic artery
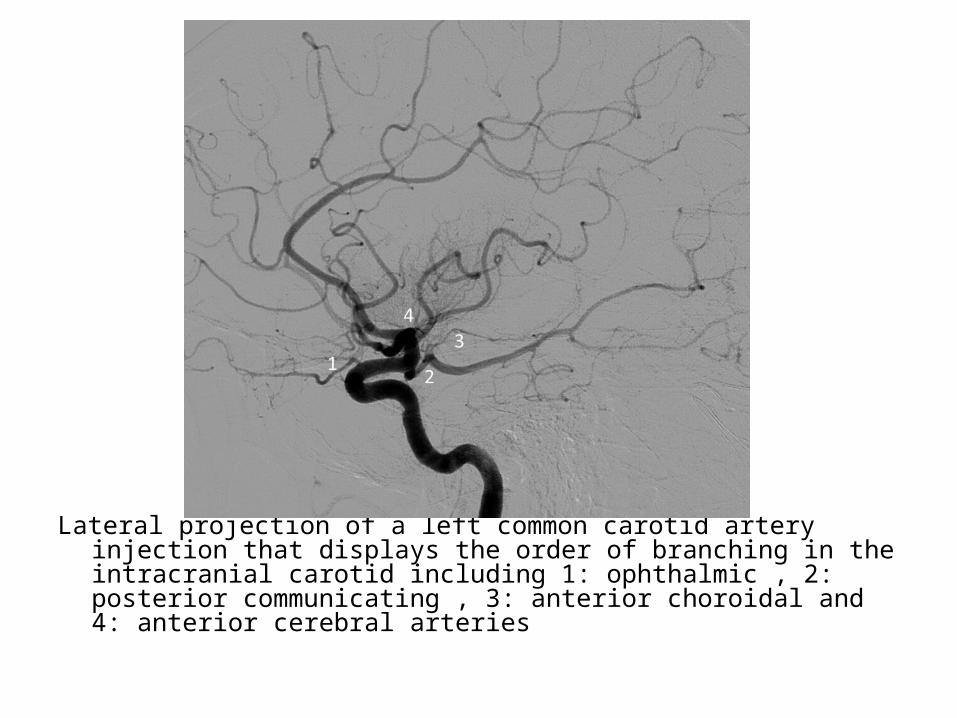
Lateral projection of a left common carotid artery injection that displays the order of branching in the intracranial carotid including 1: ophthalmic , 2: posterior communicating , 3: anterior choroidal and 4: anterior cerebral arteries
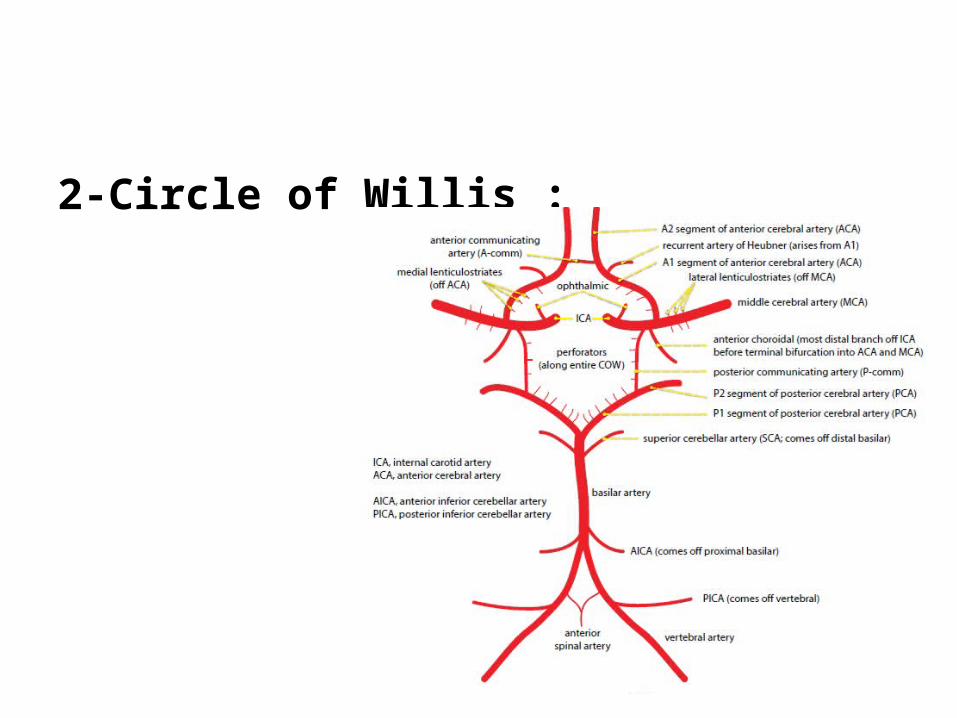
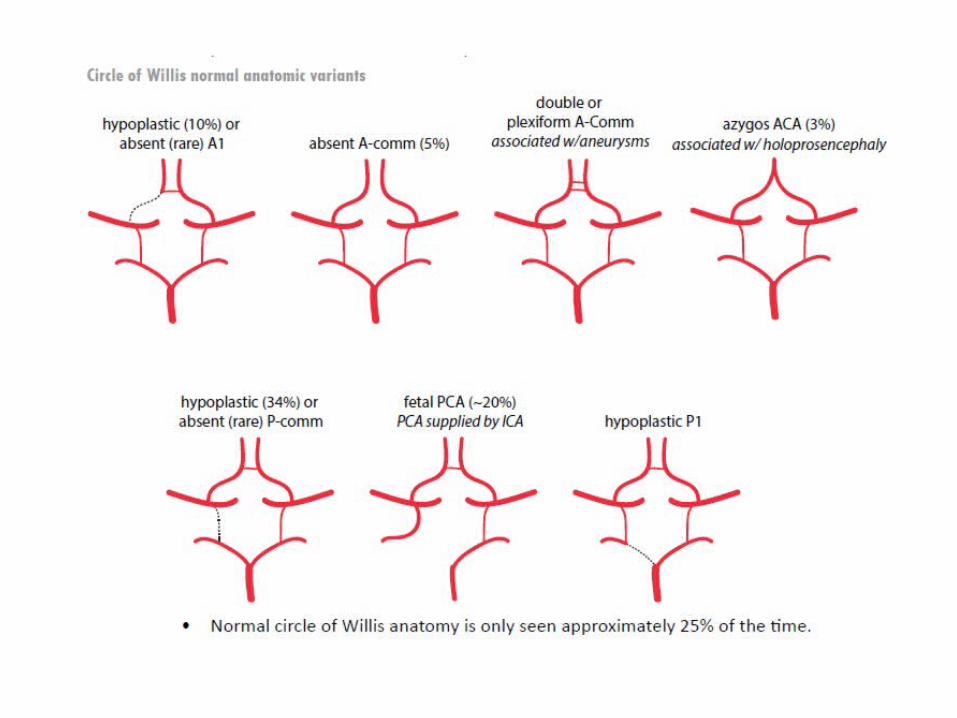
2-Circle of Willis :
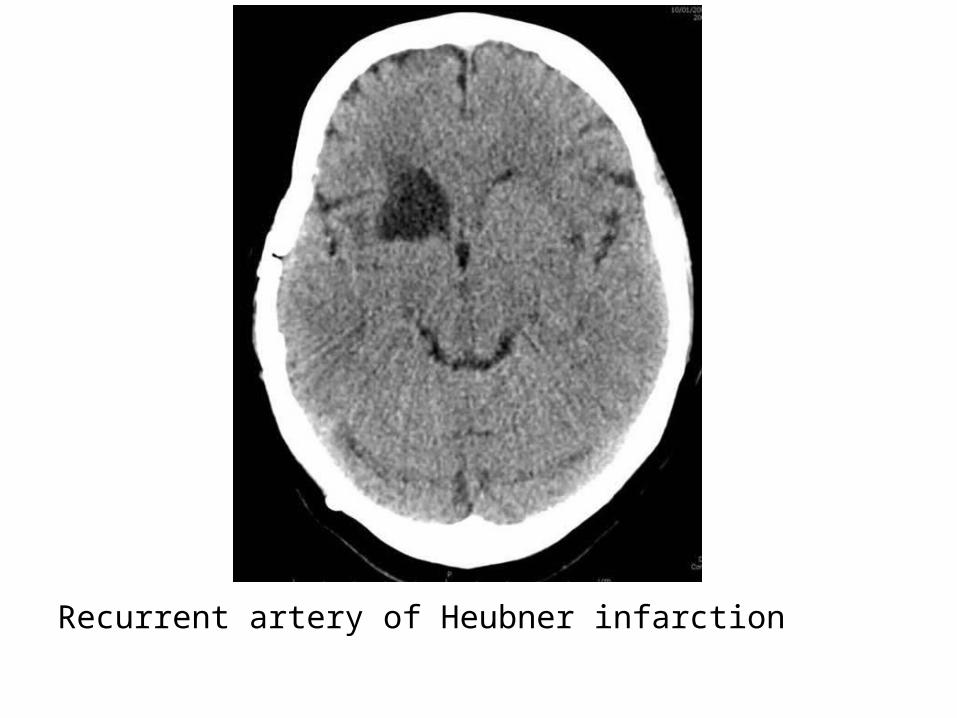
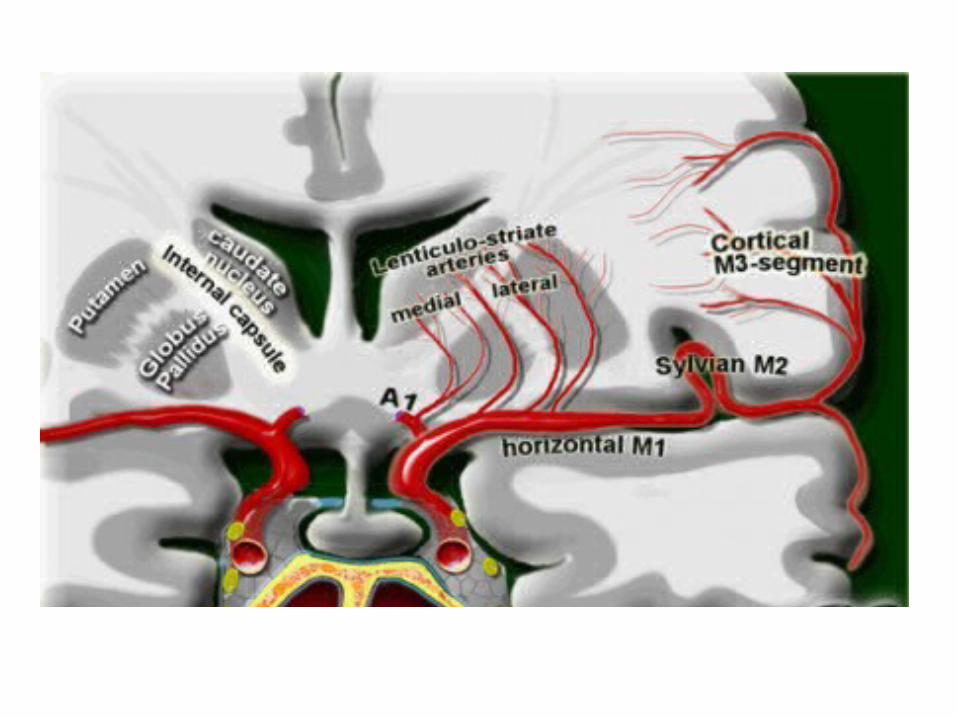
*Critical small arteries arising from the Circle of Willis:-The A1 segment of the ACA travels above the optic nerves
and give off the recurrent artery of Heubner which supplies the caudate head & anterior limb of the internal capsule , the A1 segment also gives rise to the medial lenticulostriate perforator vessels which supply the medial basal ganglia
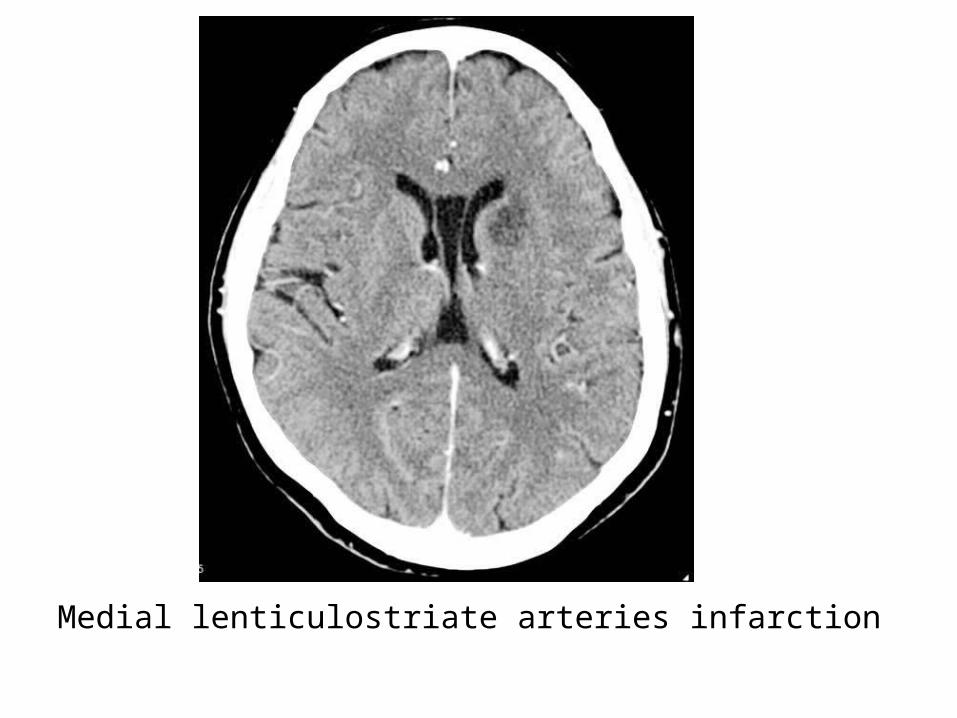
-Just outside the circle of Willis , the MCA gives rise to the lateral lenticulostriate perforator vessels to supply the lateral basal ganglia including the lateral putamen , external capsule and the posterior limb of internal capsule
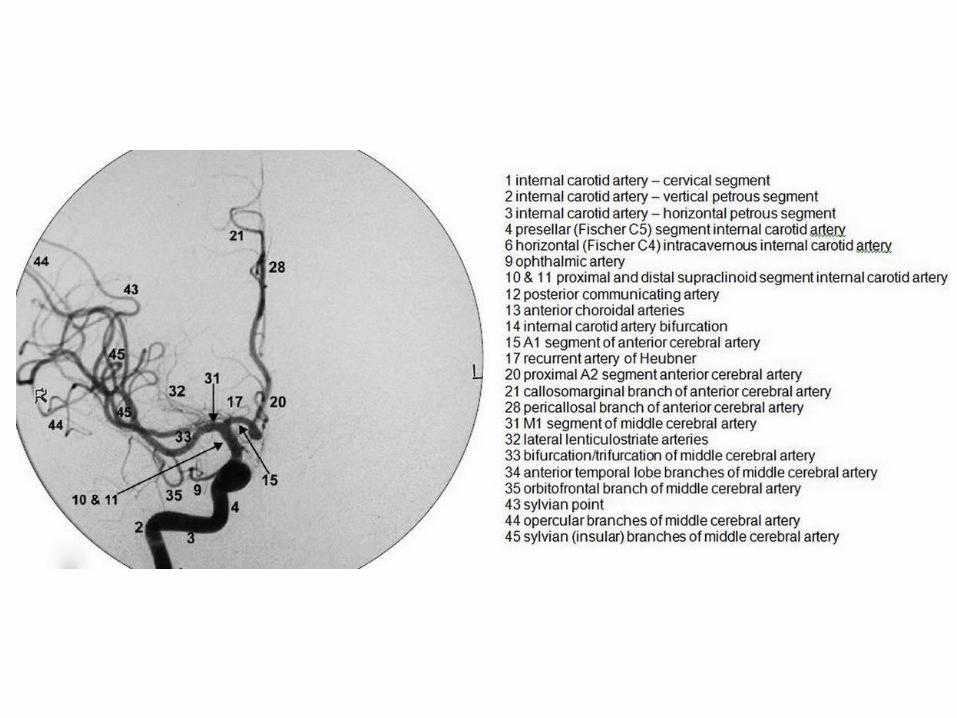

Recurrent artery of Heubner infarction
Medial lenticulostriate arteries infarction

Lateral lenticulostriate infarction , note the inverted comma-shaped hypodense left lenticular nucleus (red dotted lines) , the anterior limb of the left internal capsule (yellow arrow) is also involved by the ischemic infarction while the head of the left caudate nucleus (blue dotted lines) is spared
-The PCOM travels between the optic tract and the 3rd cranial nerve giving off anterior thalamoperforator vessels , PCOM aneurysm may cause cranial nerve III palsy
-The PCA gives off thalamoperforators to supply the thalamus
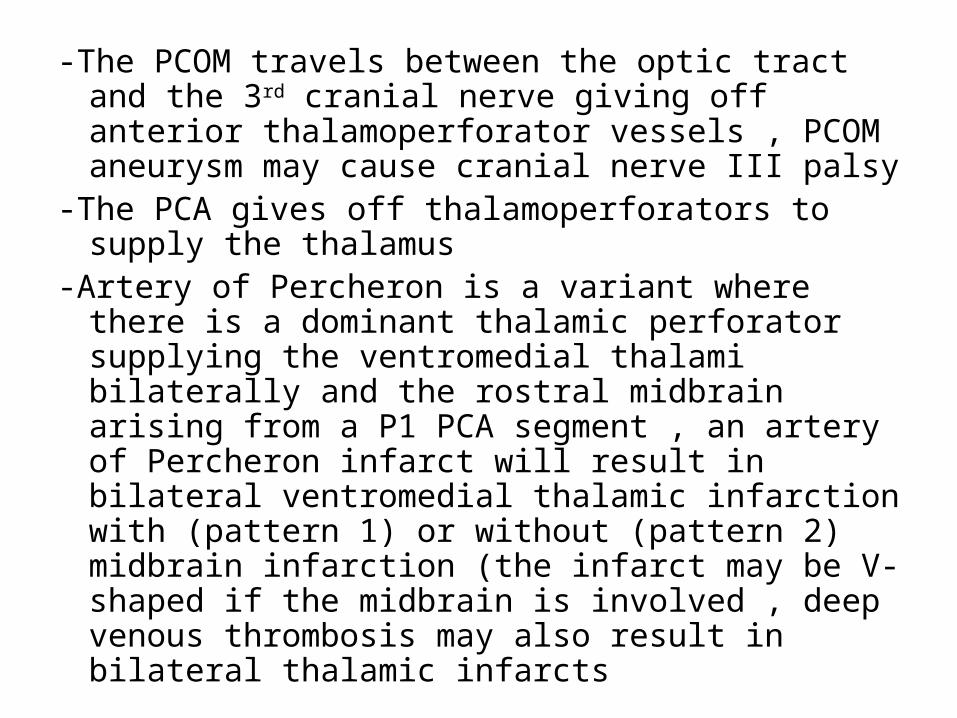
-Artery of Percheron is a variant where there is a dominant thalamic perforator supplying the ventromedial thalami bilaterally and the rostral midbrain arising from a P1 PCA segment , an artery of Percheron infarct will result in bilateral ventromedial thalamic infarction with (pattern 1) or without (pattern 2) midbrain infarction (the infarct may be V-shaped if the midbrain is involved , deep venous thrombosis may also result in bilateral thalamic infarcts
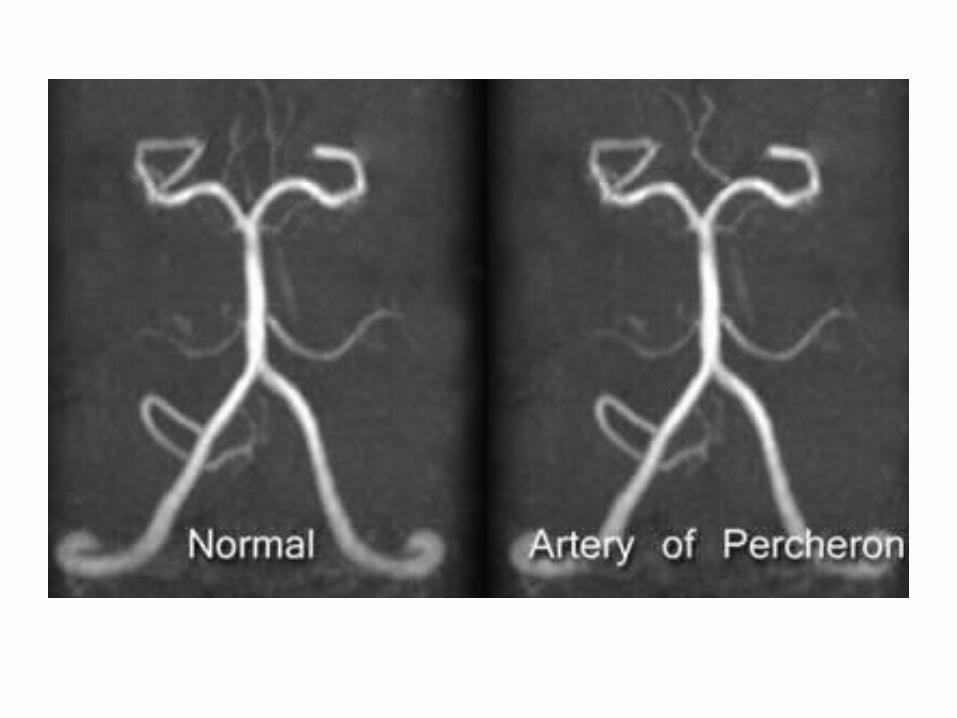
DSA of the left vertebral injection , lateral (A) and anteroposterior (B) views and a coronal CTA image (C) show a large unpaired thalamic perforating artery (arrows) arising from the proximal P1 segment supplying the bilateral thalami (i.e. Artery of Percheron)
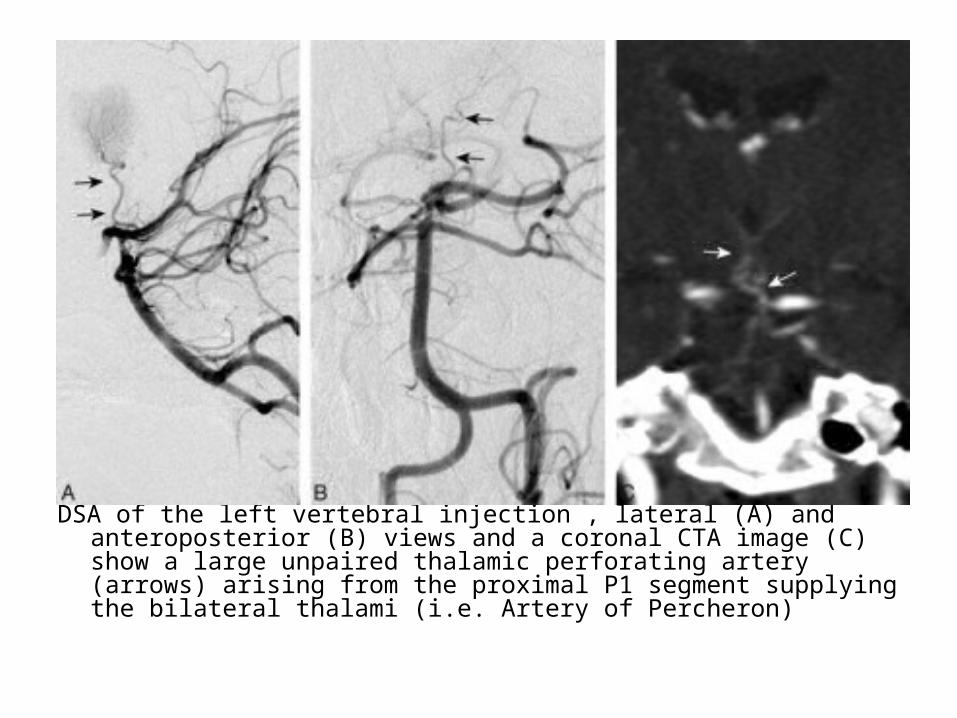
FLAIR at the level the thalamus (A & C) and midbrain (B & D) show bilateral paramedian thalamic and midbrain involvement (pattern 1), notice the hyperintense signal intensity along the pial surface of the midbrain interpeduncular fossa representing the V sign (B and D)
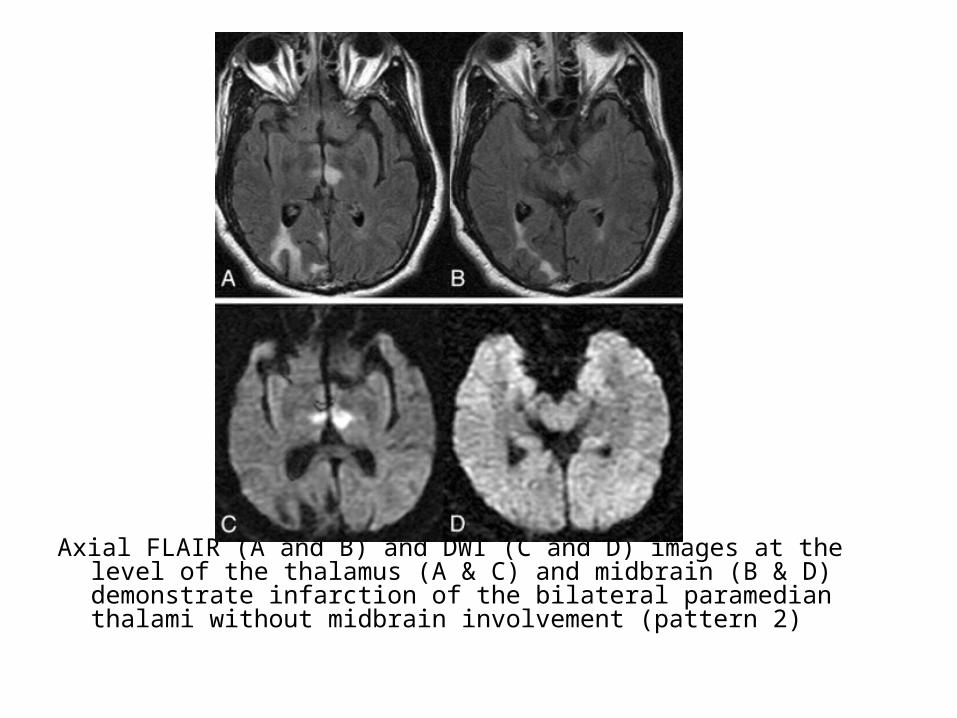
Axial FLAIR (A and B) and DWI (C and D) images at the level of the thalamus (A & C) and midbrain (B & D) demonstrate infarction of the bilateral paramedian thalami without midbrain involvement (pattern 2)
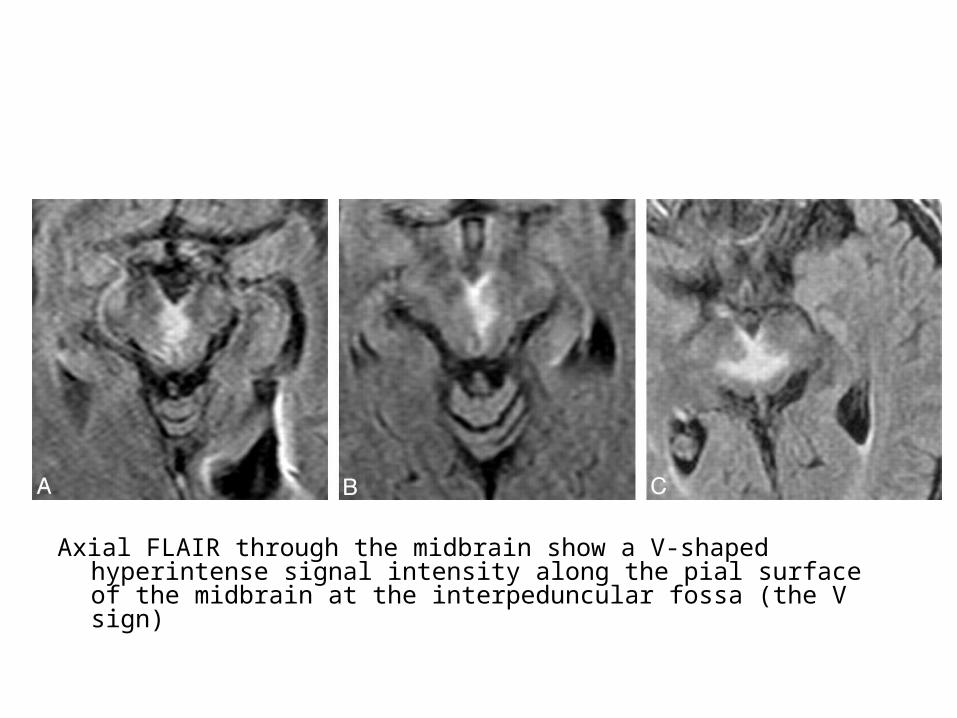
Axial FLAIR through the midbrain show a V-shaped hyperintense signal intensity along the pial surface of the midbrain at the interpeduncular fossa (the V sign)

-The anterior choroidal artery is the most distal branch of the ICA , it supplies the optic chiasm , hippocampus and posterior limb of the internal capsule
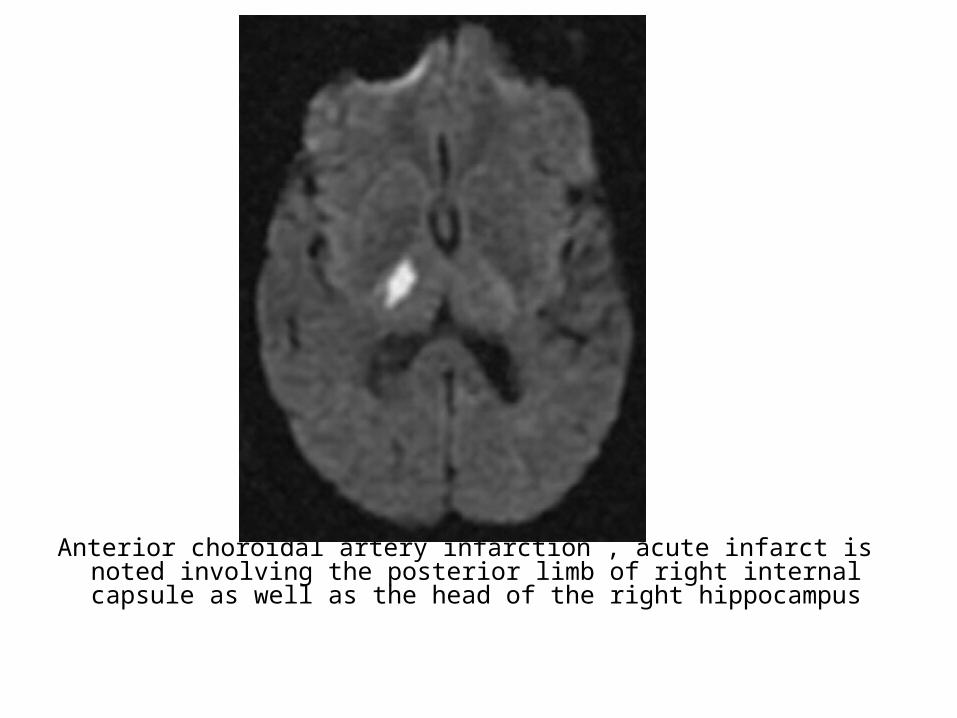
Anterior choroidal artery infarction , acute infarct is noted involving the posterior limb of right internal capsule as well as the head of the right hippocampus
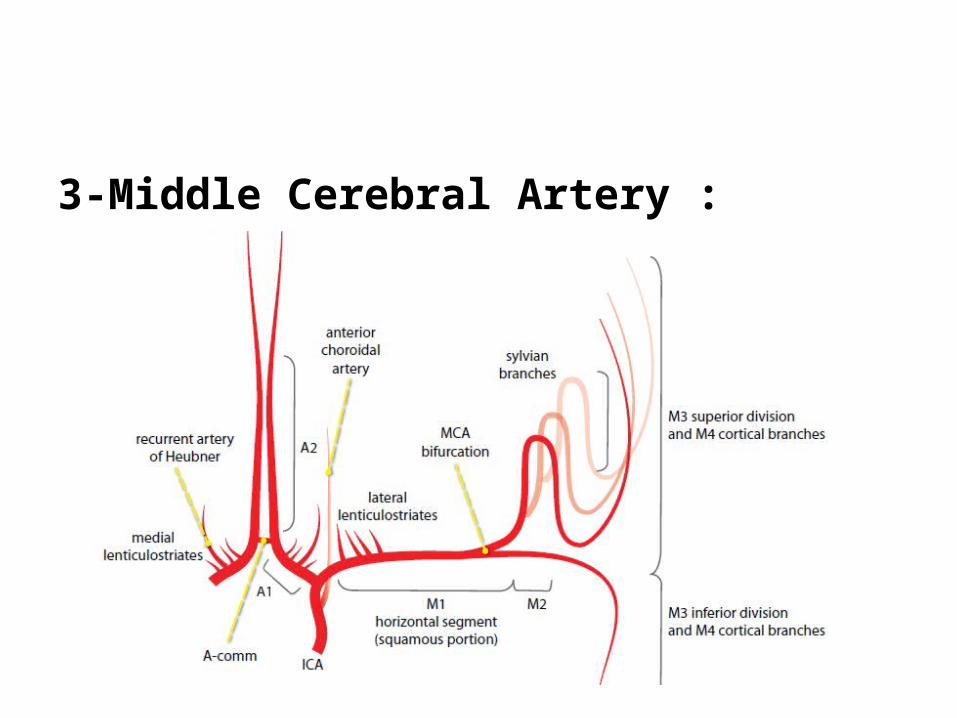
3-Middle Cerebral Artery :

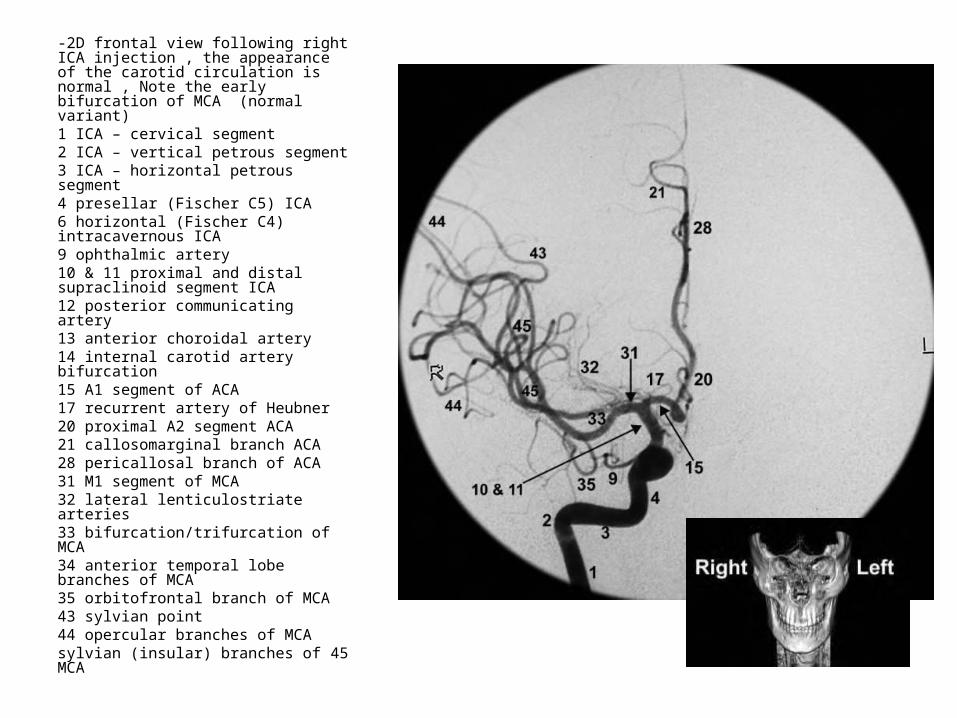
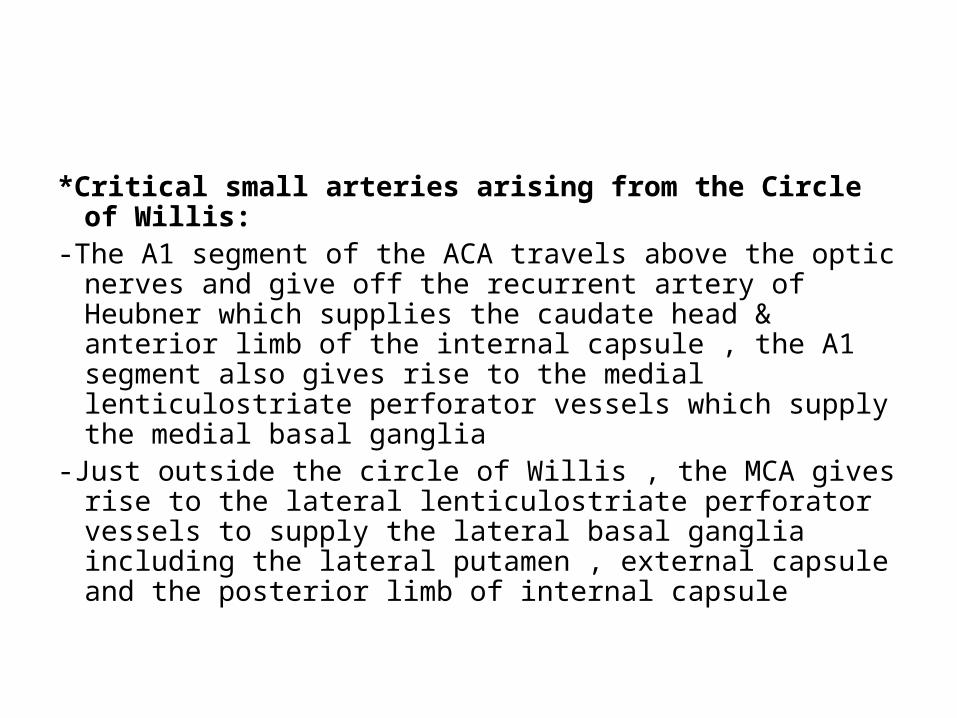
-2D frontal view following right ICA injection , the appearance of the carotid circulation is normal , Note the early bifurcation of MCA (normal variant)1 ICA – cervical segment2 ICA – vertical petrous segment3 ICA – horizontal petrous segment4 presellar (Fischer C5) ICA6 horizontal (Fischer C4) intracavernous ICA9 ophthalmic artery10 & 11 proximal and distal supraclinoid segment ICA12 posterior communicating artery13 anterior choroidal artery14 internal carotid artery bifurcation15 A1 segment of ACA17 recurrent artery of Heubner20 proximal A2 segment ACA21 callosomarginal branch ACA28 pericallosal branch of ACA31 M1 segment of MCA32 lateral lenticulostriate arteries33 bifurcation/trifurcation of MCA34 anterior temporal lobe branches of MCA35 orbitofrontal branch of MCA43 sylvian point44 opercular branches of MCA
45 sylvian (insular) branches of MCA

4-Anterior Cerebral Artery :

5-Persistent Carotid-Basilar Connections :-Overview of persistent fetal anterior-posterior
connections :*A number of carotid to basilar connections are formed
during embryogenesis , these fetal anterior-posterior circulation connections normally regress before birth
*Occasionally , a fetal carotid-basilar connection may persist after birth , each anomalous connection is named for the structures adjacent to its course in the head & neck
-Persistent Trigeminal Artery :*The most common persistent carotid-basilar
connection and has an association with aneurysms
*The persistent trigeminal artery courses adjacent to the trigeminal nerve , angiography shows a characteristic trident or tau sign (resembling the Greek letter τ) on the lateral view due to the artery’s branching system
*Saltzman type I connects to the basilar artery while Saltzman type II connects to the superior cerebellar artery
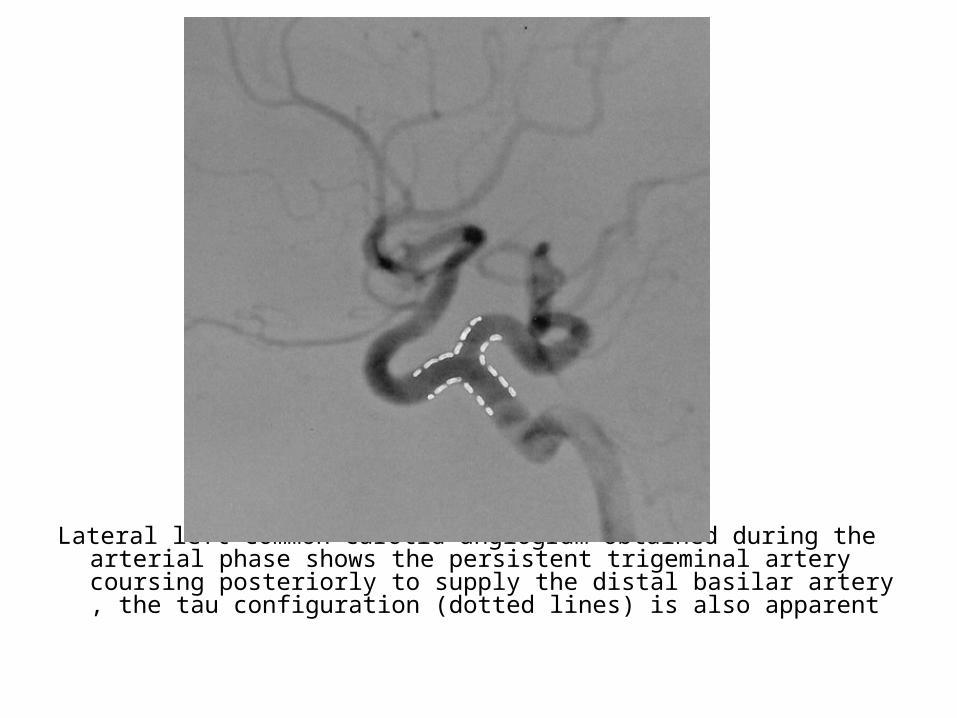
Lateral left common carotid angiogram obtained during the arterial phase shows the persistent trigeminal artery coursing posteriorly to supply the distal basilar artery , the tau configuration (dotted lines) is also apparent
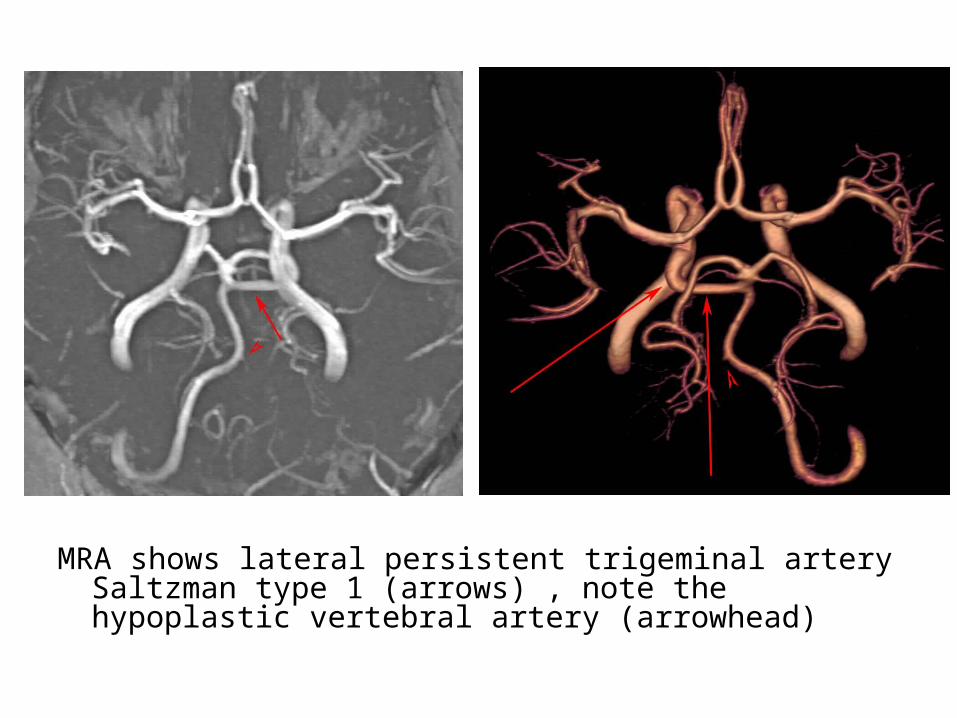
MRA shows lateral persistent trigeminal artery Saltzman type 1 (arrows) , note the hypoplastic vertebral artery (arrowhead)

-Less common carotid to basilar connections :*The hypoglossal , otic and proatlantal intersegmental arteries
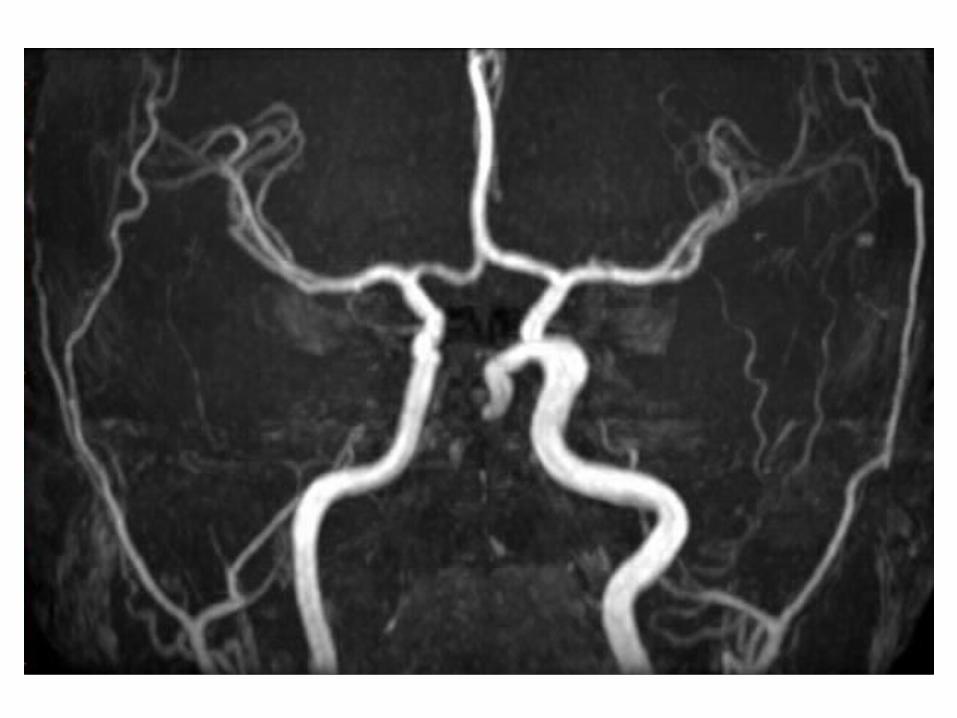
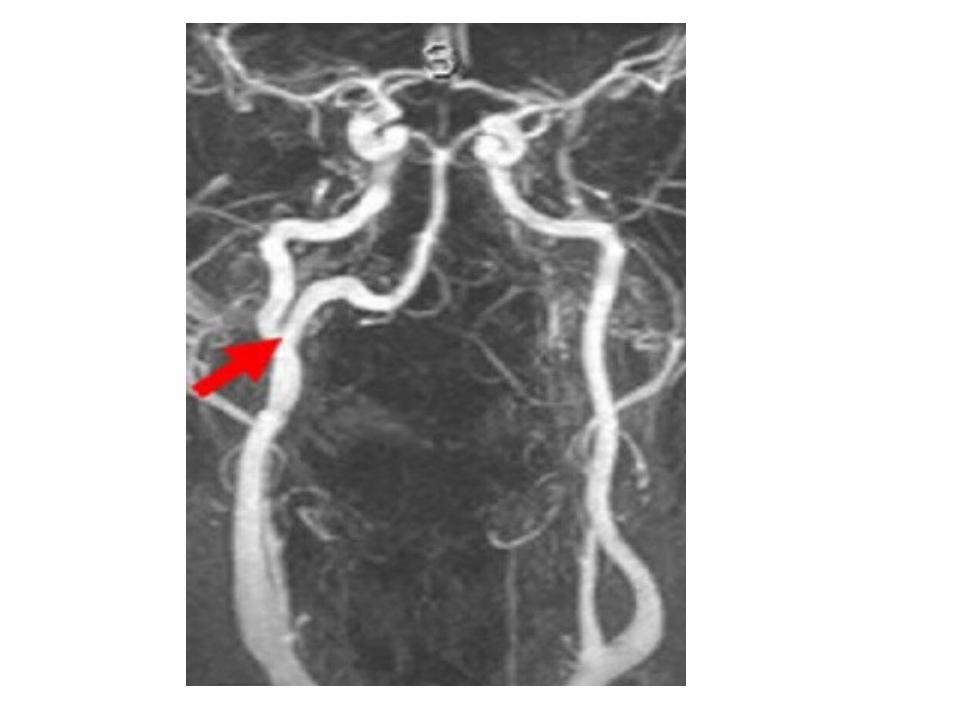
are rare persistent carotid-basilar connections-Persistent primitive hypoglossal artery (HA) :*Artery named for its association with 12th nerve*Second most common after PTA , persistent vessel arises from
ICA at C1 to C3 segments , enters the skull through anterior condylar or hypoglossal canal (not through the foramen magnum) and courses posteromedially to continue as terminal segment of the VA and BA
*The contralateral VA, if present, generally terminates in the posterior inferior cerebellar artery
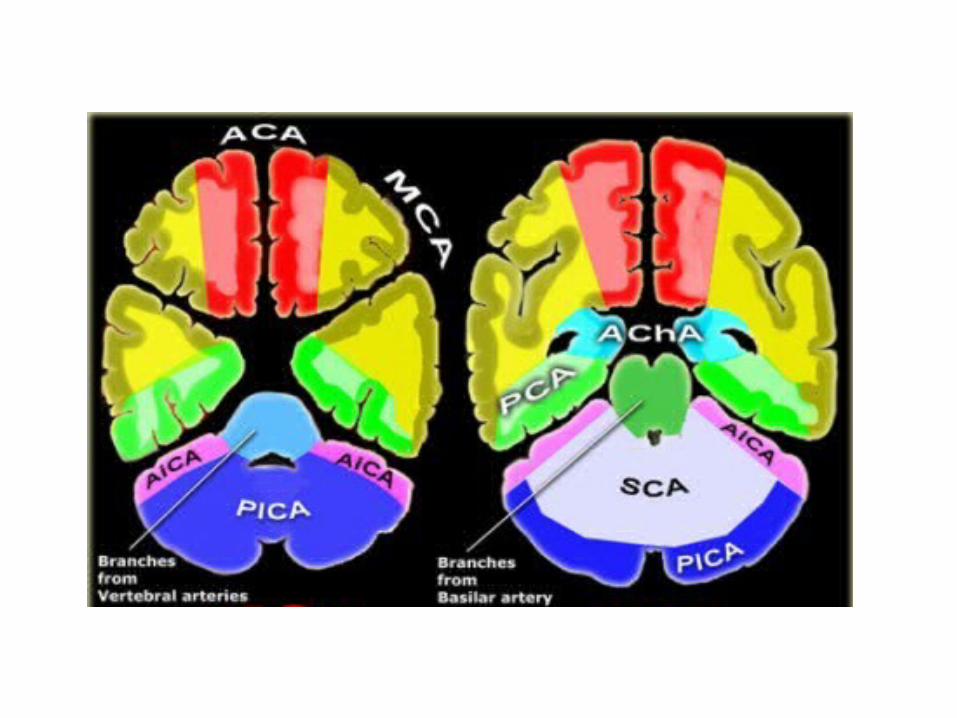
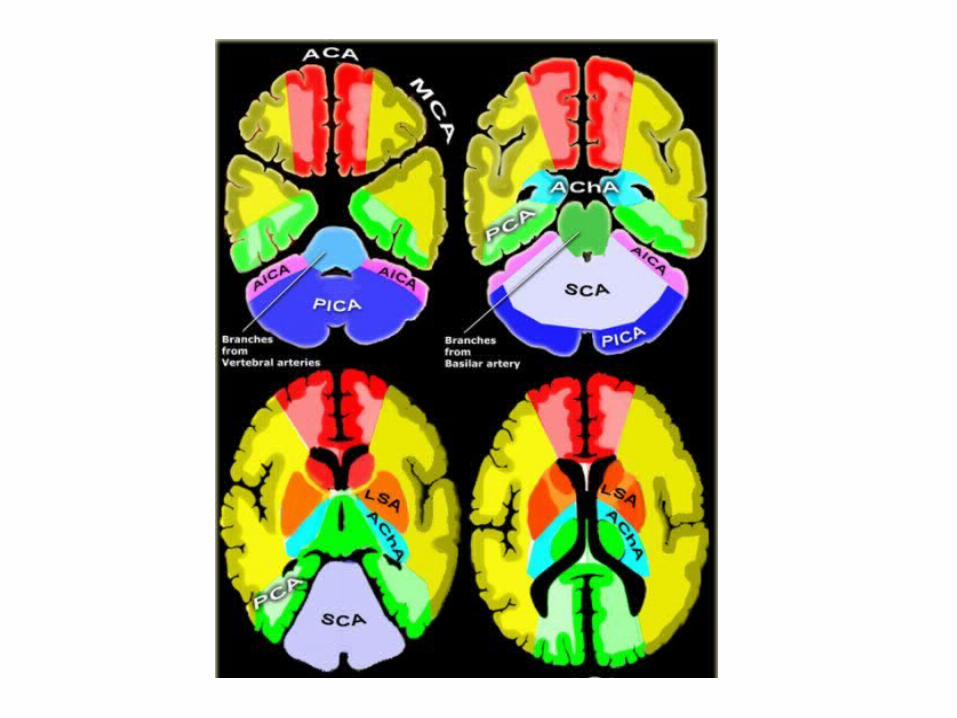
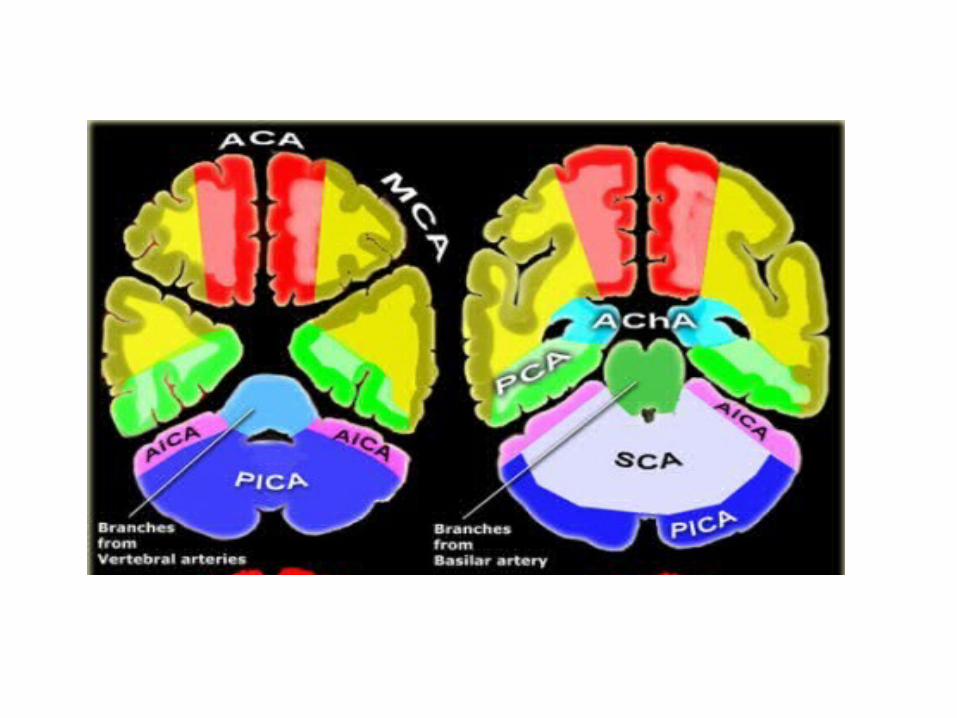
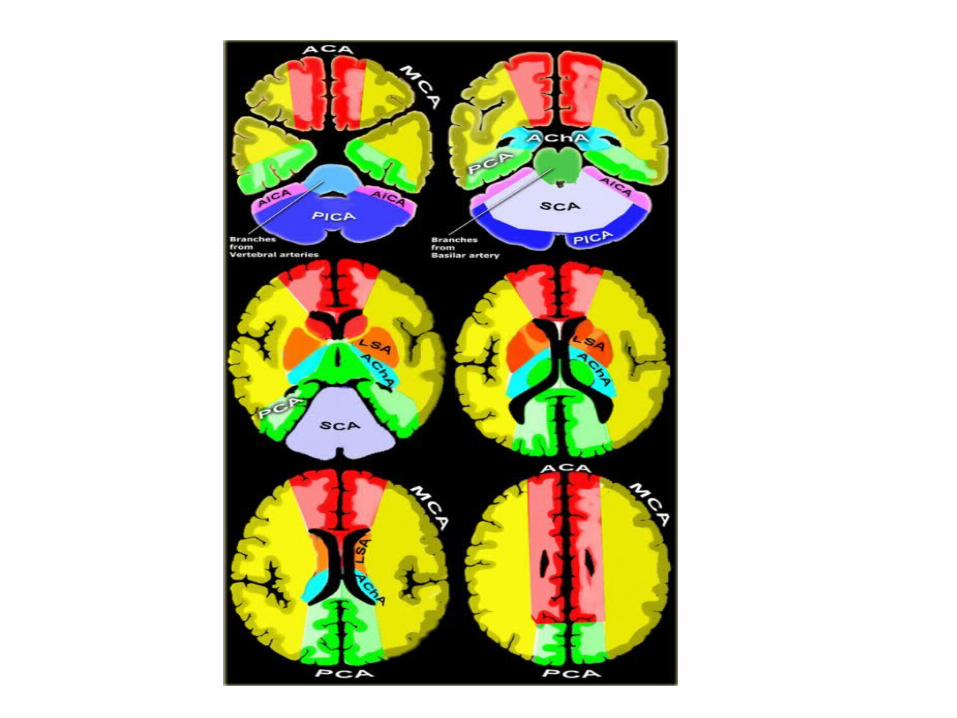
b) Cerebral Arterial Territory :1-Posterior Inferior Cerebellar Artery2-Superior Cerebellar Artery3-Branches from vertebral and basilar artery4-Anterior Choroidal artery5-Lenticulostriate arteries 6-Anterior cerebral artery 7-Middle cerebral artery8-Posterior cerebral artery
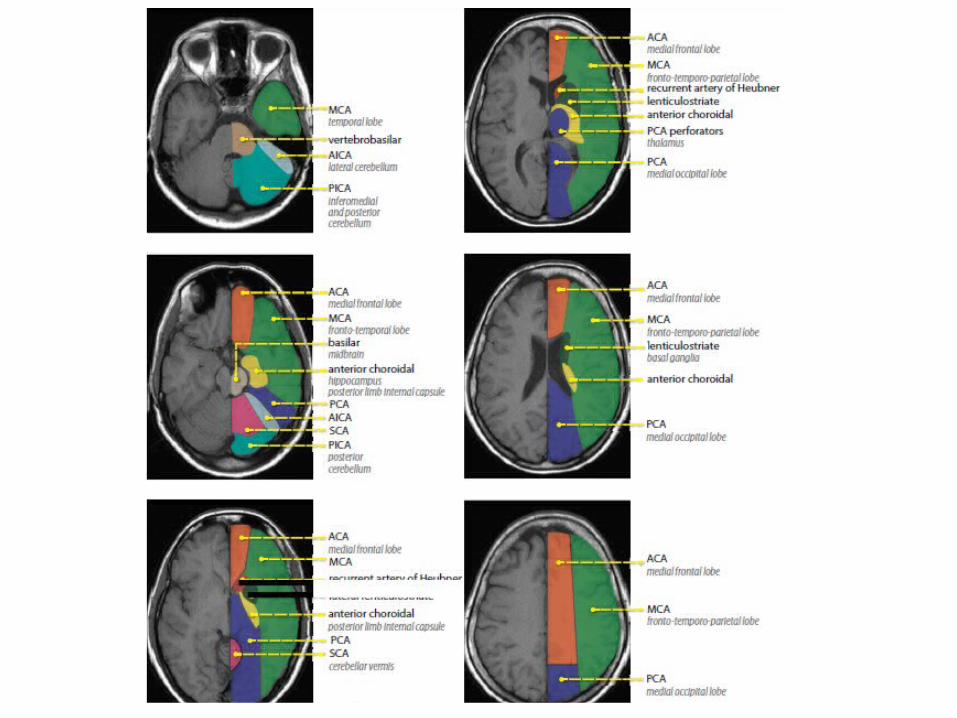
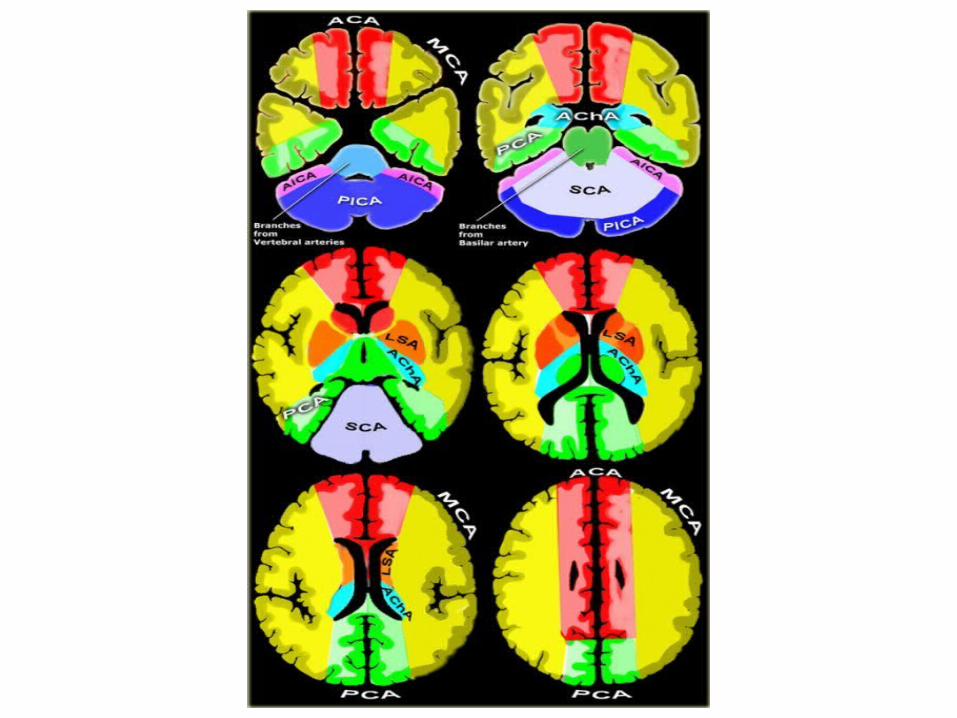

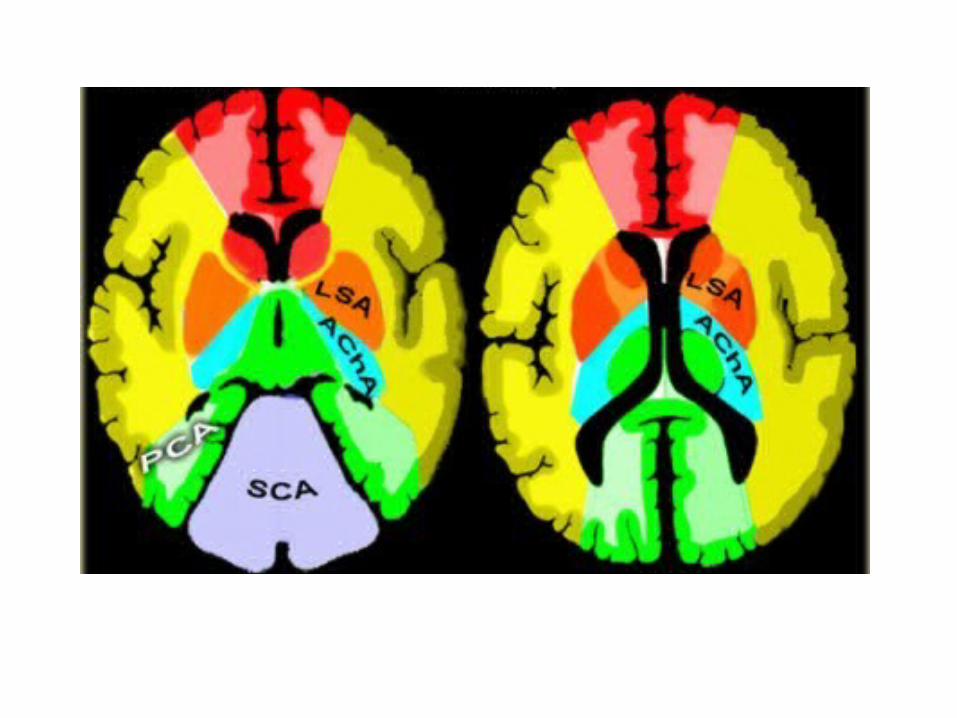

1-Posterior Inferior Cerebellar Artery (PICA in blue)
-The PICA territory is on the inferior occipital surface of the cerebellum and is in equilibrium with the territory of the AICA in purple which is on the lateral side
-The larger the PICA territory , the smaller the AICA and vice versa
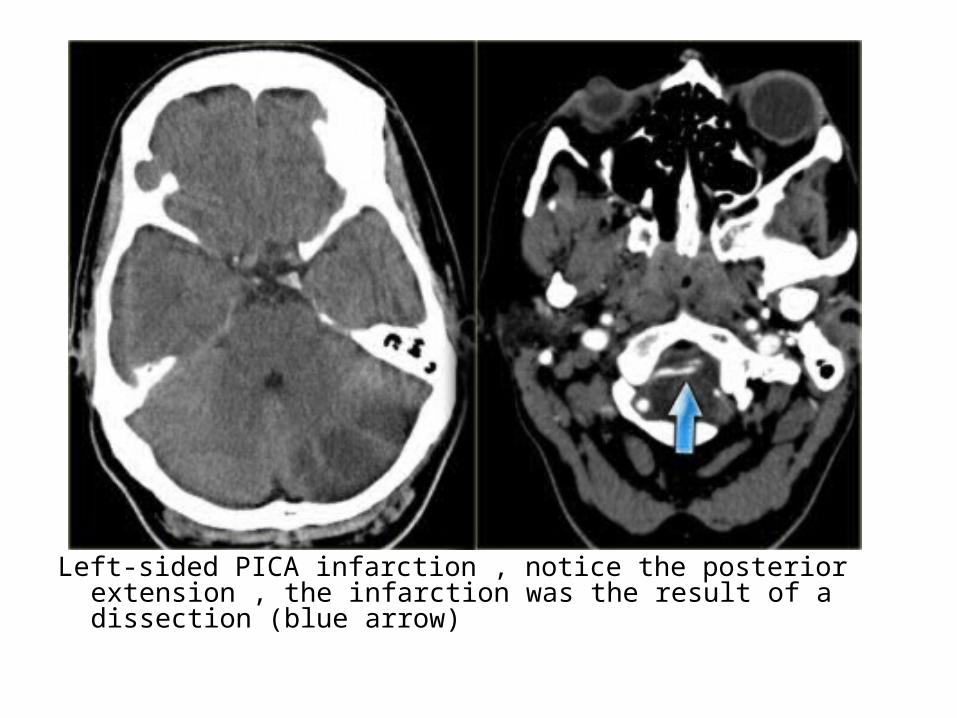
Left-sided PICA infarction , notice the posterior extension , the infarction was the result of a dissection (blue arrow)
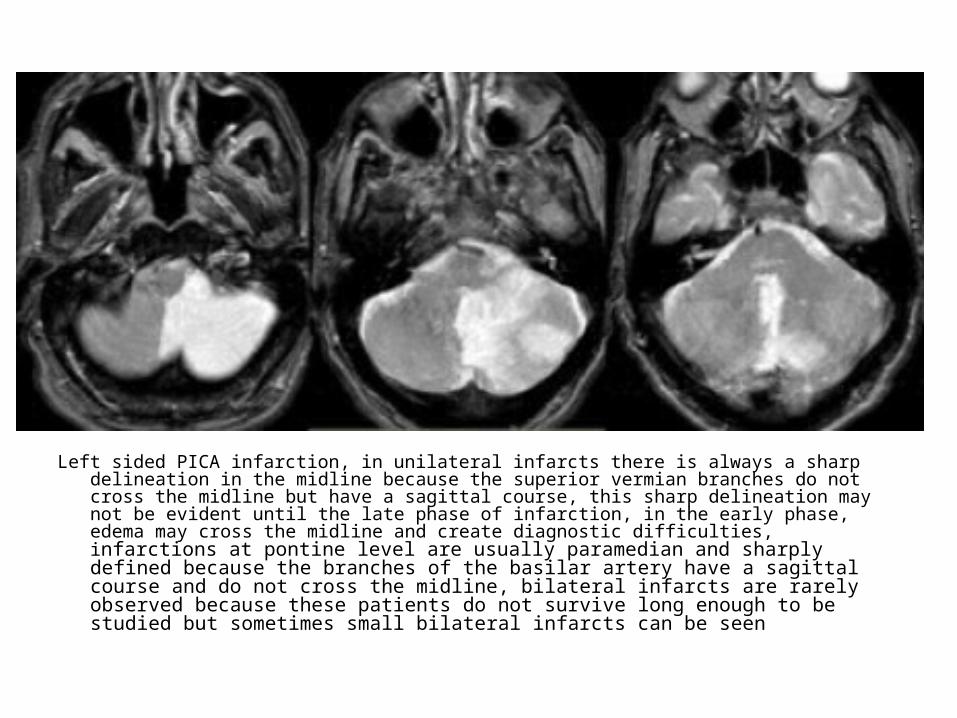
Left sided PICA infarction, in unilateral infarcts there is always a sharp delineation in the midline because the superior vermian branches do not cross the midline but have a sagittal course, this sharp delineation may not be evident until the late phase of infarction, in the early phase, edema may cross the midline and create diagnostic difficulties, infarctions at pontine level are usually paramedian and sharply defined because the branches of the basilar artery have a sagittal course and do not cross the midline, bilateral infarcts are rarely observed because these patients do not survive long enough to be studied but sometimes small bilateral infarcts can be seen
2-Superior Cerebellar Artery (SCA in grey)-The SCA territory is in the superior and tentorial
surface of the cerebellum
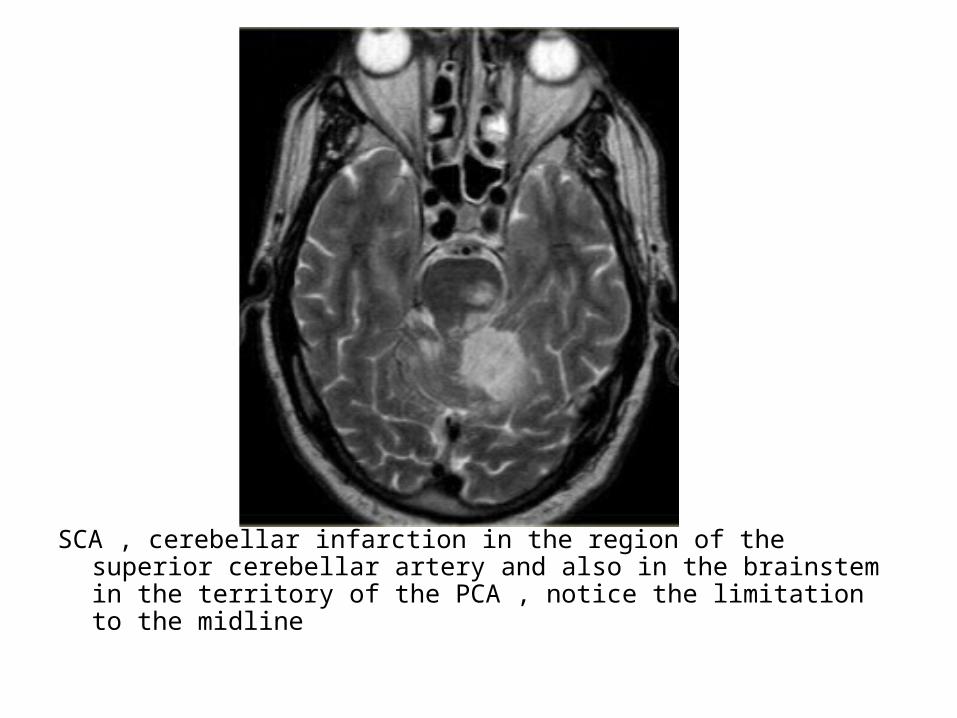
SCA , cerebellar infarction in the region of the superior cerebellar artery and also in the brainstem in the territory of the PCA , notice the limitation to the midline
3-Branches from Vertebral and Basilar artery-These branches supply the medulla oblongata
(in blue) and the pons (in green)
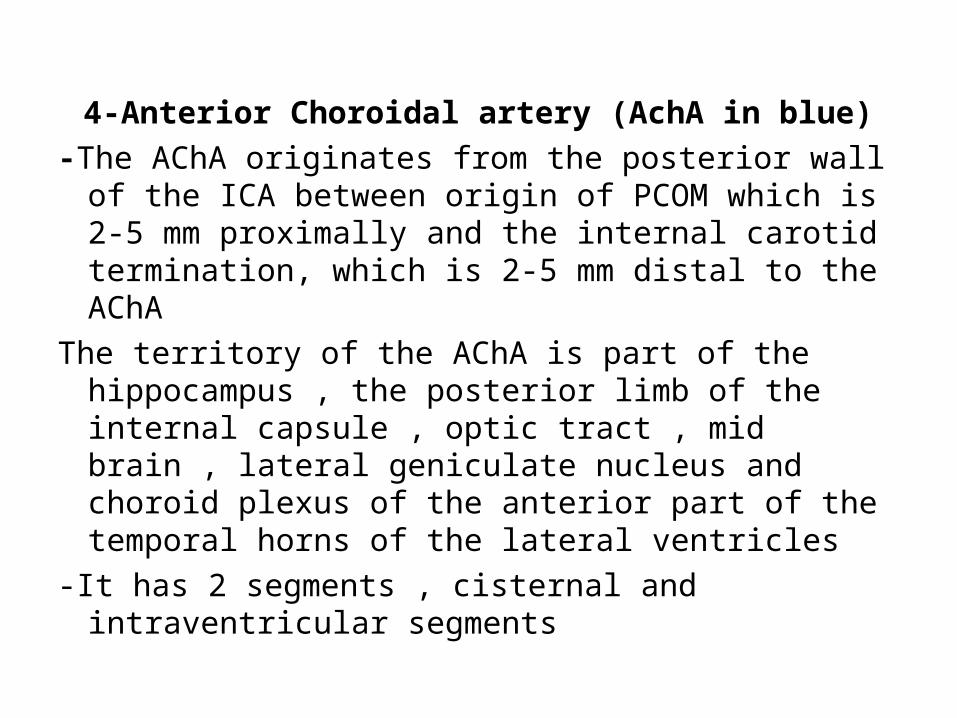
4-Anterior Choroidal artery (AchA in blue)-The AChA originates from the posterior wall of
the ICA between origin of PCOM which is 2-5 mm proximally and the internal carotid termination, which is 2-5 mm distal to the AChA
The territory of the AChA is part of the hippocampus , the posterior limb of the internal capsule , optic tract , mid brain , lateral geniculate nucleus and choroid plexus of the anterior part of the temporal horns of the lateral ventricles
-It has 2 segments , cisternal and intraventricular segments

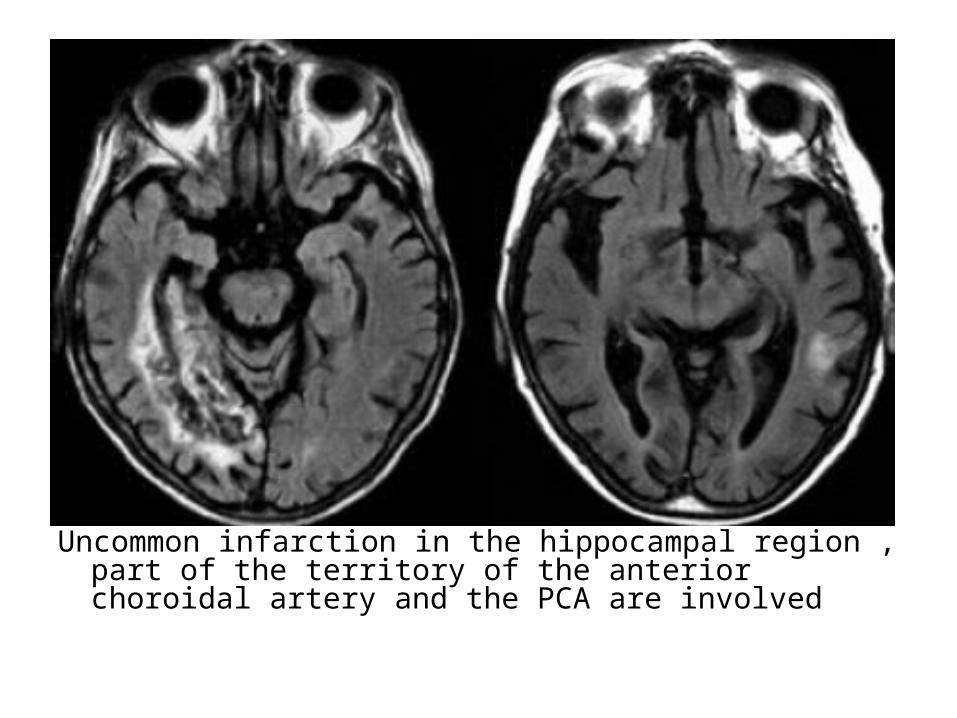
Uncommon infarction in the hippocampal region , part of the territory of the anterior choroidal artery and the PCA are involved

5-Lenticulostriate Arteries -The lateral LSA (in orange) are deep penetrating
arteries of the middle cerebral artery (MCA)-Their territory includes most of the basal ganglia-The medial LSA (indicated in dark red) arise from
the ACA (usually the A1 segment)-Heubner's artery is the largest of the medial
lenticulostriate arteries and supplies the anteromedial part of the head of the caudate and anteroinferior internal capsule
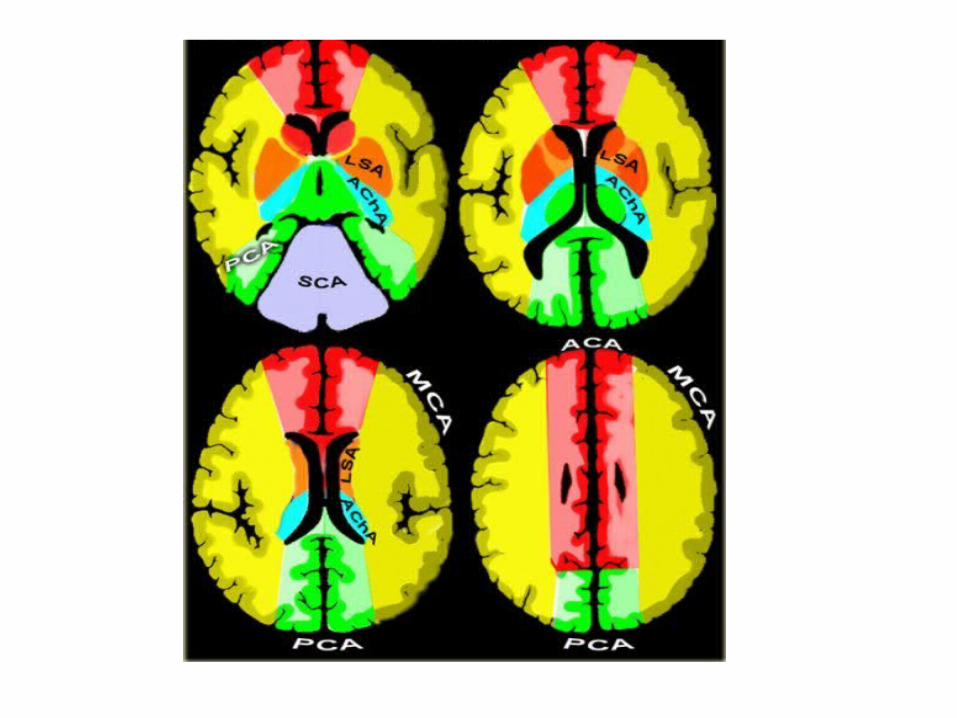
-The territory of the lateral lenticulostriate perforating arteries of the MCA is indicated with a different color from the rest of the territory of the MCA because it is a well-defined area supplied by penetrating branches which may be involved or spared in infarcts separately from the main cortical territory of the MCA

Vascular supply to the basal ganglia
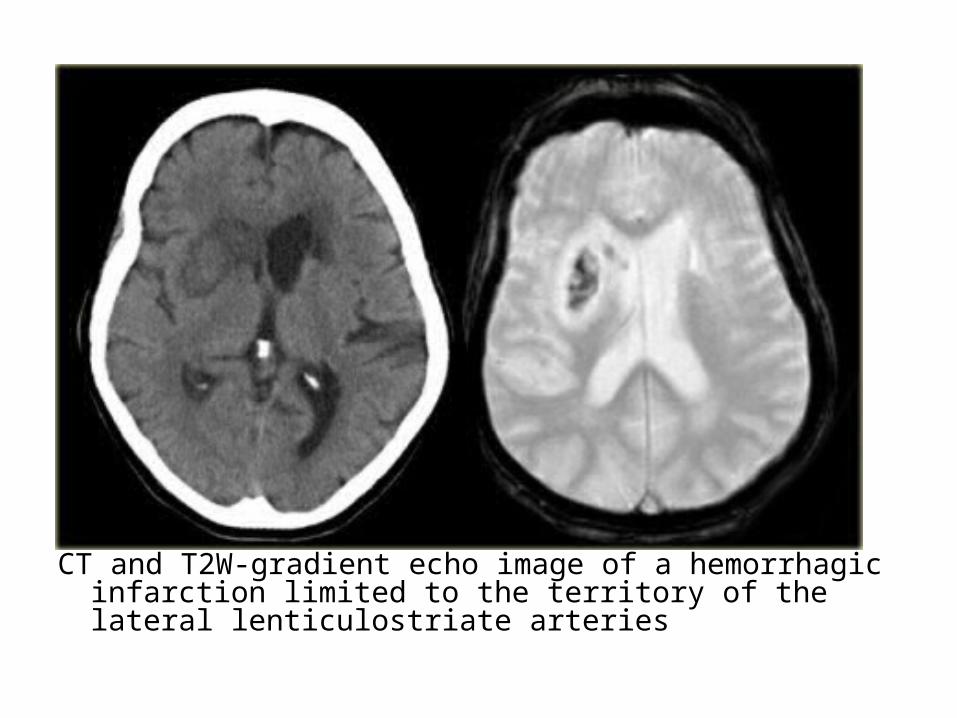
CT and T2W-gradient echo image of a hemorrhagic infarction limited to the territory of the lateral lenticulostriate arteries
6-Anterior Cerebral Artery (ACA in red)-The ACA supplies the medial part of the frontal
and the parietal lobe and the anterior portion of the corpus callosum , basal ganglia and internal capsule
-A1 segment : from origin to ACOM and gives rise to medial lenticulostriate arteries (inferior parts of the head of the caudate and the anterior limb of the internal capsule)
-A2 segment : from ACOM to bifurcation of pericallosal and callosomarginal arteries
-A3 segment : major branches (medial portions of frontal lobes , superior medial part of parietal lobes , anterior part of the corpus callosum)


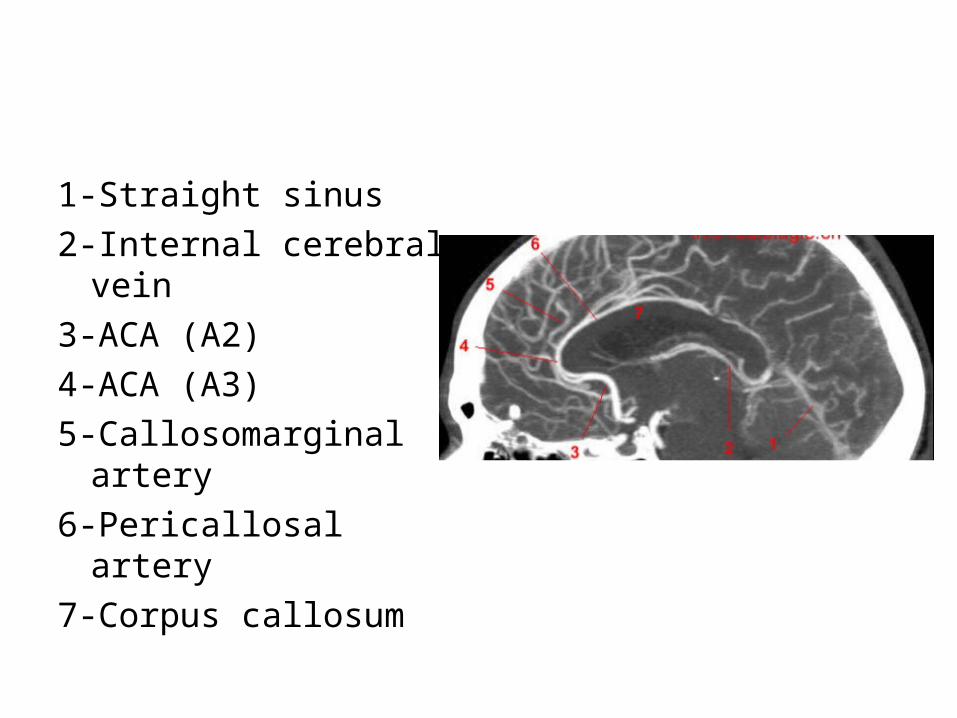
1-Straight sinus2-Internal cerebral vein3-ACA (A2)4-ACA (A3)5-Callosomarginal artery6-Pericallosal artery7-Corpus callosum
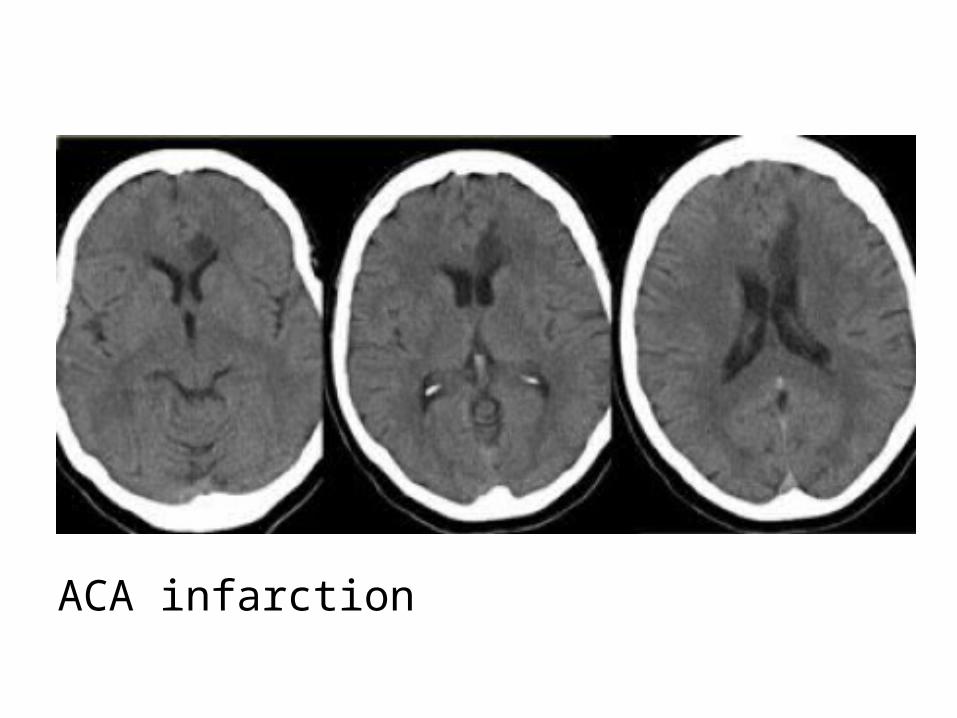
ACA infarction
7-Middle cerebral artery (MCA in yellow)-The cortical branches of the MCA supply the
lateral surface of the hemisphere except for the medial part of the frontal and the parietal lobe (anterior cerebral artery) and the inferior part of the temporal lobe (PCA)
-The deep penetrating LSA branches are discussed before

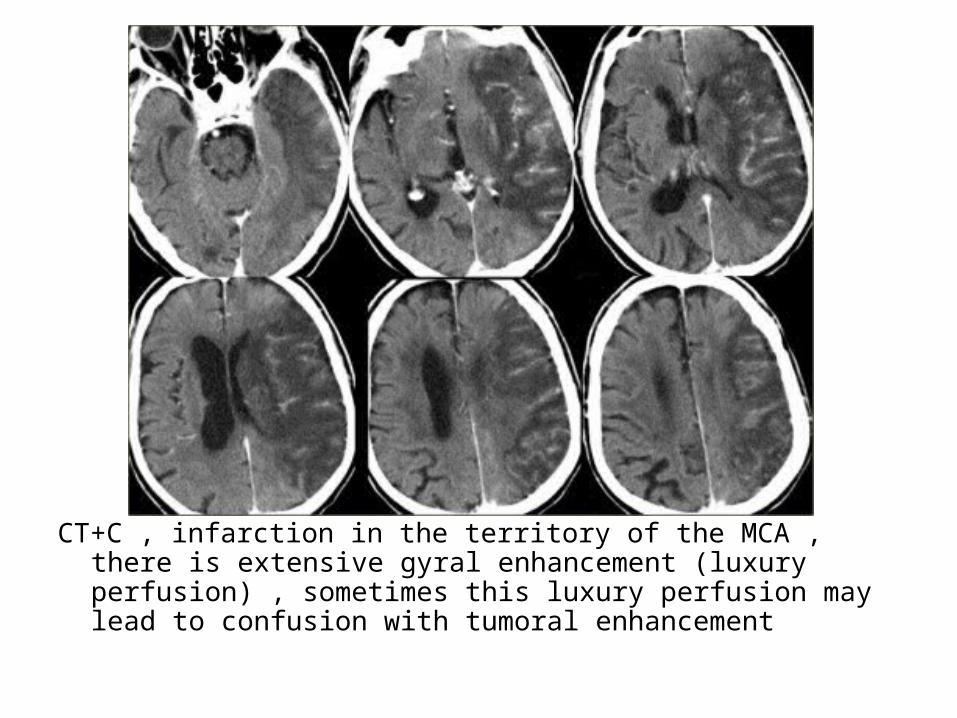
CT+C , infarction in the territory of the MCA , there is extensive gyral enhancement (luxury perfusion) , sometimes this luxury perfusion may lead to confusion with tumoral enhancement

8-Posterior cerebral artery (PCA in green)-P1 extends from origin of the PCA to the posterior
communicating artery contributing to the circle of Willis
-Posterior thalamoperforating arteries branch off the P1 segment and supply blood to the midbrain and thalamus
-Cortical branches of the PCA supply the inferomedial part of the temporal lobe , occipital pole , visual cortex and splenium of the corpus callosum
-Deep or proximal PCA strokes cause ischemia in the thalamus and / or midbrain as well as in the cortex
-Superficial or distal PCA infarctions involve only cortical structures
-Only about 5% of ischemic strokes involve the PCA or its branches

Patient with acute vision loss in the right half of the visual field , CT shows an infarction in the contralateral visual cortex , i.e left occipital lobe

PCA infarction , notice the loss of gray / white matter differentiation in the region of the left occipital lobe
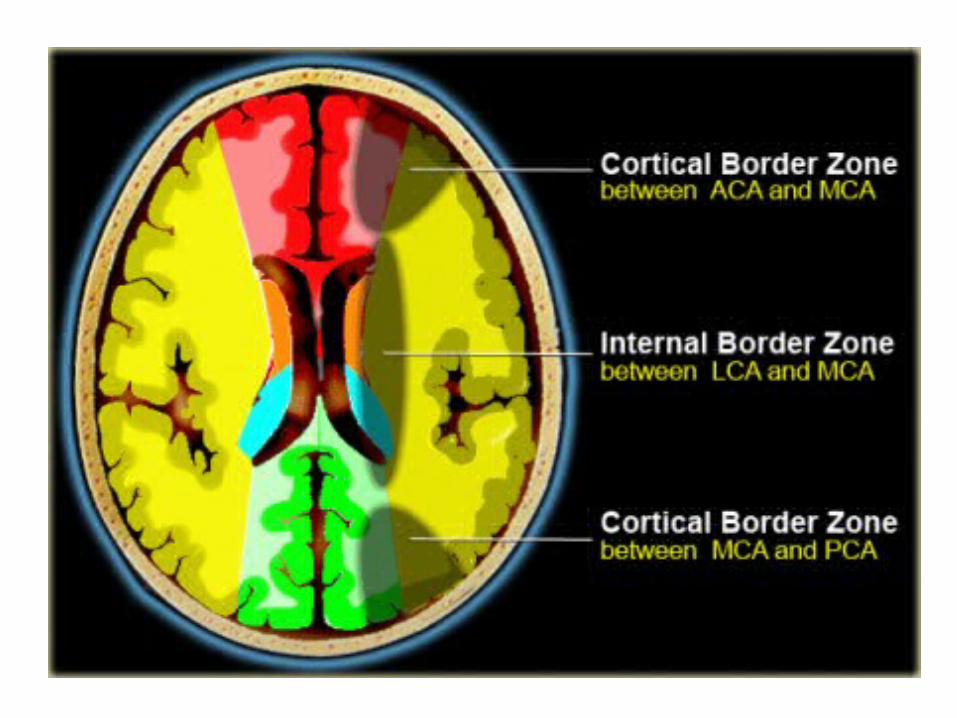
c) Watershed Infarcts :-Watershed infarcts occur at the border zones
between major cerebral arterial territories as a result of hypoperfusion
-There are two patterns of border zone infarcts:1-Cortical border zone infarctions :-Infarctions of the cortex and adjacent subcortical
white matter located at the border zone of ACA / MCA and MCA / PCA
2-Internal border zone infarctions :-Infarctions of the deep white matter of the
centrum semiovale and corona radiata at the border zone between lenticulostriate perforators and the deep penetrating cortical branches of the MCA or at the border zone of deep white matter branches of the MCA and the ACA

A patient with an occlusion of the right internal carotid artery , the hypoperfusion in the right hemisphere resulted in multiple internal border zone infarctions, this pattern of deep watershed infarction is quite common and should urge you to examine the carotids

Small infarctions in the right hemisphere in the deep border zone (blue arrowheads) and also in the cortical border zone between the MCA & PCA territory (yellow arrows) , there is abnormal signal in the right carotid (red arrow) as a result of occlusion
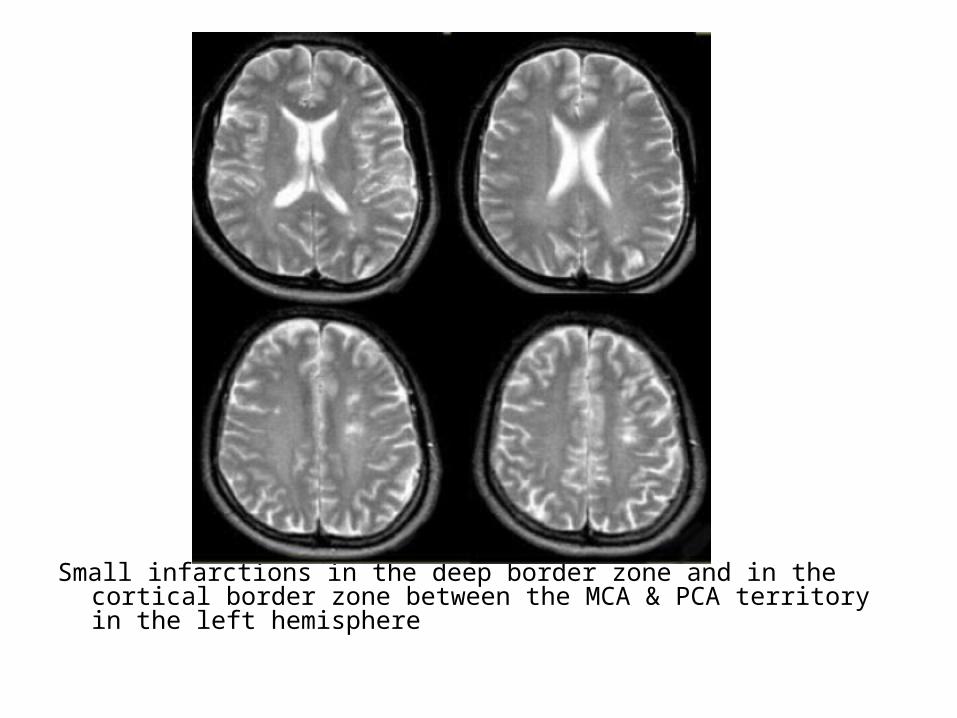
Small infarctions in the deep border zone and in the cortical border zone between the MCA & PCA territory in the left hemisphere
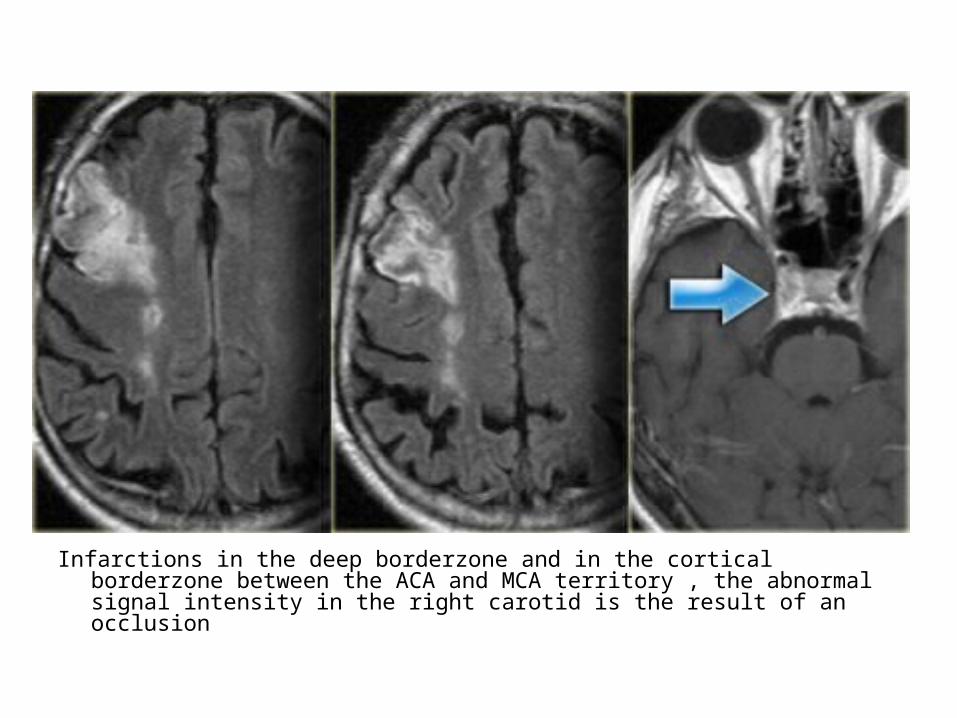
Infarctions in the deep borderzone and in the cortical borderzone between the ACA and MCA territory , the abnormal signal intensity in the right carotid is the result of an occlusion
d) Lacunar Infarcts :-Lacunar infarcts are small infarcts in the deeper
parts of the brain (basal ganglia , thalamus , white matter) and in the brain stem
-Lacunar infarcts are caused by occlusion of a single deep penetrating artery

-Lacunar infarcts account for 25% of all ischemic strokes
-Atherosclerosis is the most common cause of lacunar infarcts followed by emboli
-25% of patients with clinical and radiologically defined lacunes had a potential cardiac cause for their strokes

T2W- and FLAIR image of a Lacunar infarct in the left thalamus , on the FLAIR image the infarct is hardly seen , there is only a small area of subtle hyperintensity

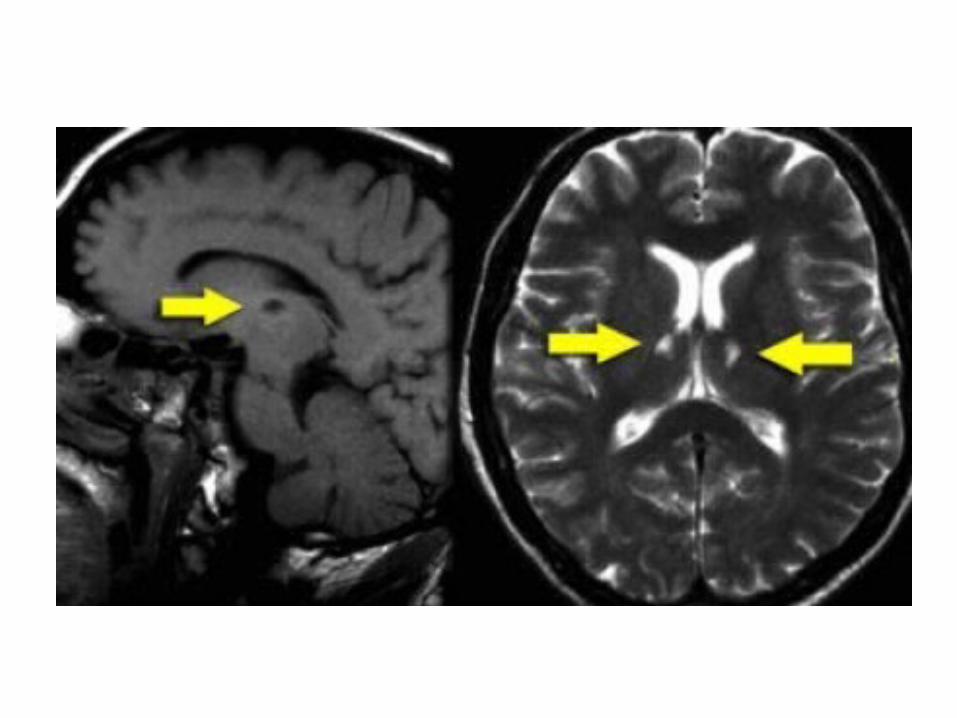
e) Posterior Reversible Encephalopathy Syndrome (PRES) :
-It is also known as reversible posterior Leukoencephalopathy syndrome (RPLS)
-It classically consists of potentially reversible vasogenic edema in the posterior circulation territories but anterior circulation structures can also be involved
-Many causes have been described including hypertension , eclampsia and preeclampsia , immunosuppressive medications such as cyclosporine
-The mechanism is not entirely understood but is thought to be related to a hyperperfusion state , with blood brain barrier breakthrough , extravasation of fluid potentially containing blood or macromolecules and resulting cortical or subcortical edema
-The typical imaging findings of PRES are most apparent as hyperintensity on FLAIR images in the parieto-occipital and posterior frontal cortical and subcortical white matter , less commonly , the brainstem , basal ganglia and cerebellum are involved

Patient with reversible neurological symptoms , the abnormalities are seen both in the posterior circulation as well as in the basal ganglia

Four days later most of the abnormalities have disappeared

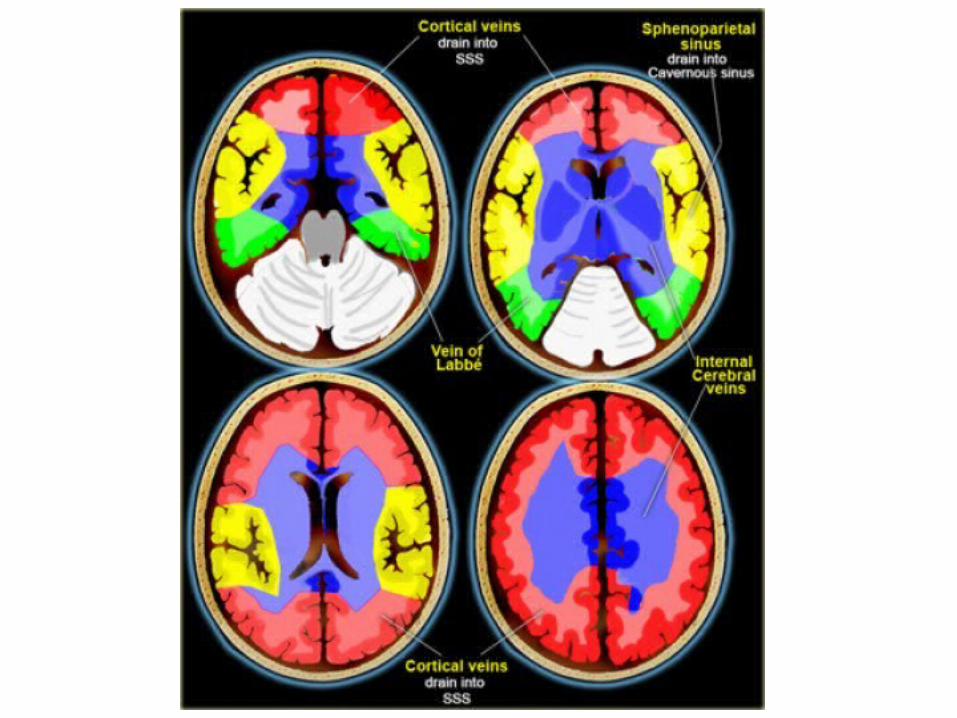
f) Cerebral Venous Territory :-There is great variation in the territories of
venous drainage

g) Cerebral Venous Thrombosis :1-Etiology :-Cerebral venous thrombosis results from occlusion
of a venous sinus and / or cortical vein and usually is caused by a partial thrombus or an extrinsic compression that subsequently progresses to complete occlusion
-Dehydration, pregnancy, a hypercoagulable state and adjacent infection (eg, mastoiditis) are predisposing factors
2-Diagnosis :-Cerebral venous thrombosis is an elusive
diagnosis because of its nonspecific presentation
-It often presents with hemorrhagic infarction in areas atypical for arterial vascular distribution
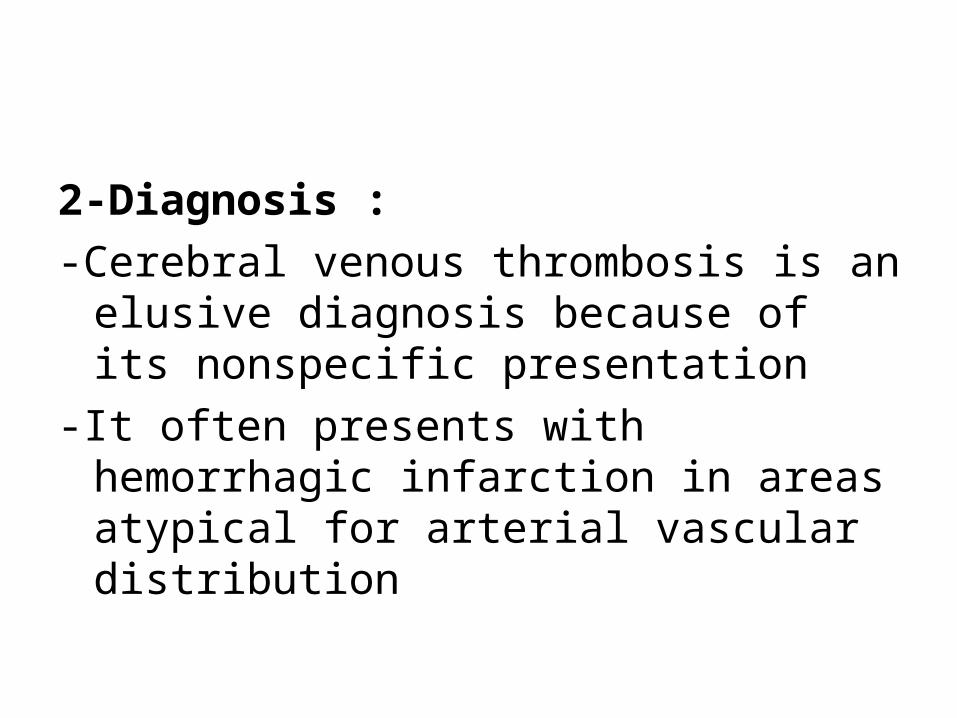
MRA with non-visualization of the left transverse sinus, since the venous anatomy is variable, this can be due to absence of the transverse sinus or thrombosis, the T1 clearly demonstrates, that there is a transverse sinus on the left, so the MRA findings are due to thrombosis

The same patient , CT shows the dense thrombosed transverse sinus (yellow arrow) , the FLAIR shows the venous infarction in the temporal lobe

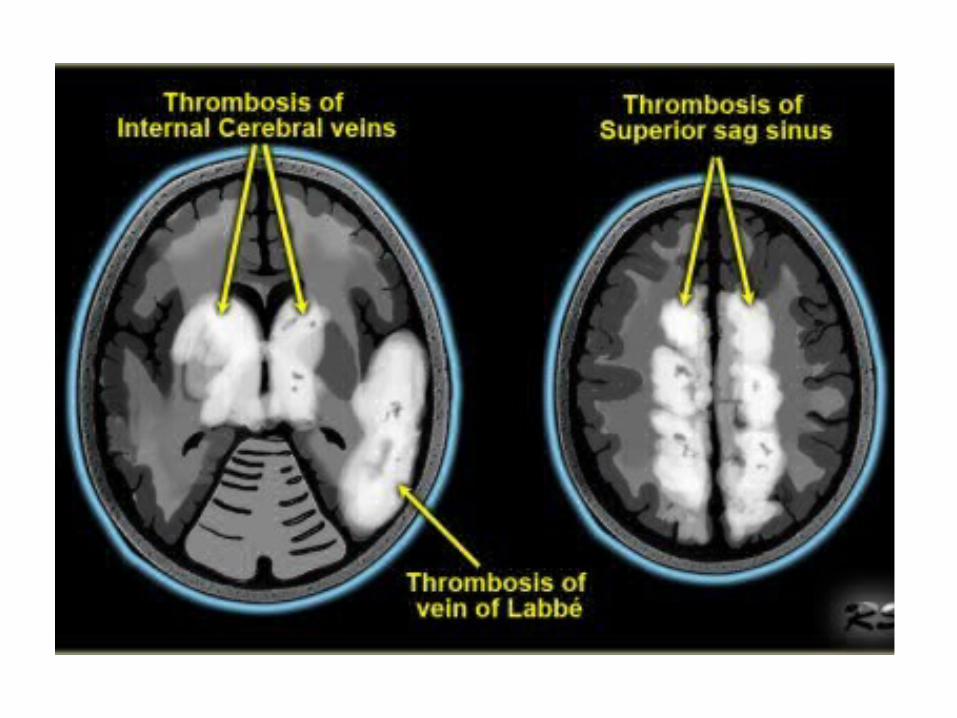
Thrombosis of deep cerebral veins-The clinical presentation of thrombosis of the
deep cerebral venous system are severe dysfunction of the diencephalon reflected by coma and disturbances of eye movements and pupillary reflexes , usually this results in a poor outcome
-However , partial syndromes without a decrease in the level of consciousness or brainstem signs exist which may lead to initial misdiagnoses
-Deep cerebral venous system thrombosis is an underdiagnosed condition when symptoms are mild and should be suspected if the patient is a young woman , if the lesions are within the basal ganglia or thalamus and especially if they are bilateral
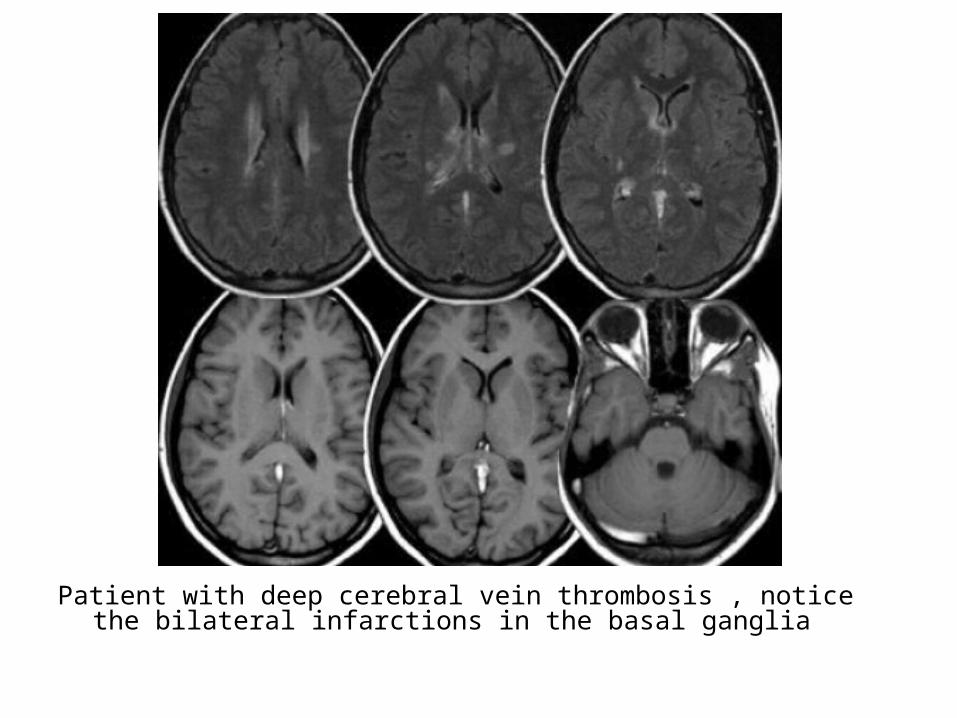
Patient with deep cerebral vein thrombosis , notice the bilateral infarctions in the basal ganglia

The same patient , there is absence of flow void in the internal cerebral veins, straight sinus and right transverse sinus (blue arrows) , on the MRA the right transverse sinus is not visualized

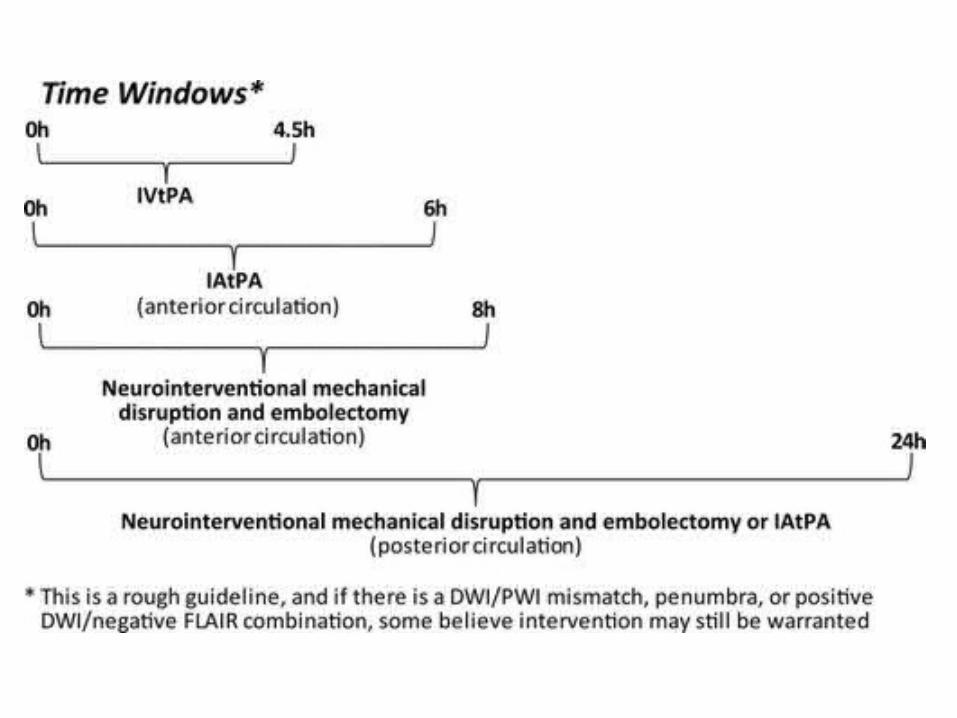
Acute Arterial Infarct - CT appearance 1-Normal2-Initial Signs3-Later Signs 4-Contrast Enhancement5-Arterial Occlusion6-Perfusion Defect
1-Normal :-Initial appearances often normal in first few
hours , larger infarcts more prominent
2-Initial Signs :a) Low Density Regionb) Mass Effectc) Hyperdense Artery
a) Low Density Region :1-Loss of grey / white matter differentiation is a
feature of acute infarction and is the earliest radiological abnormality (thought to be due to decreased cerebral blood volume)

Normal GWM differentiation Loss of GWM differentiation
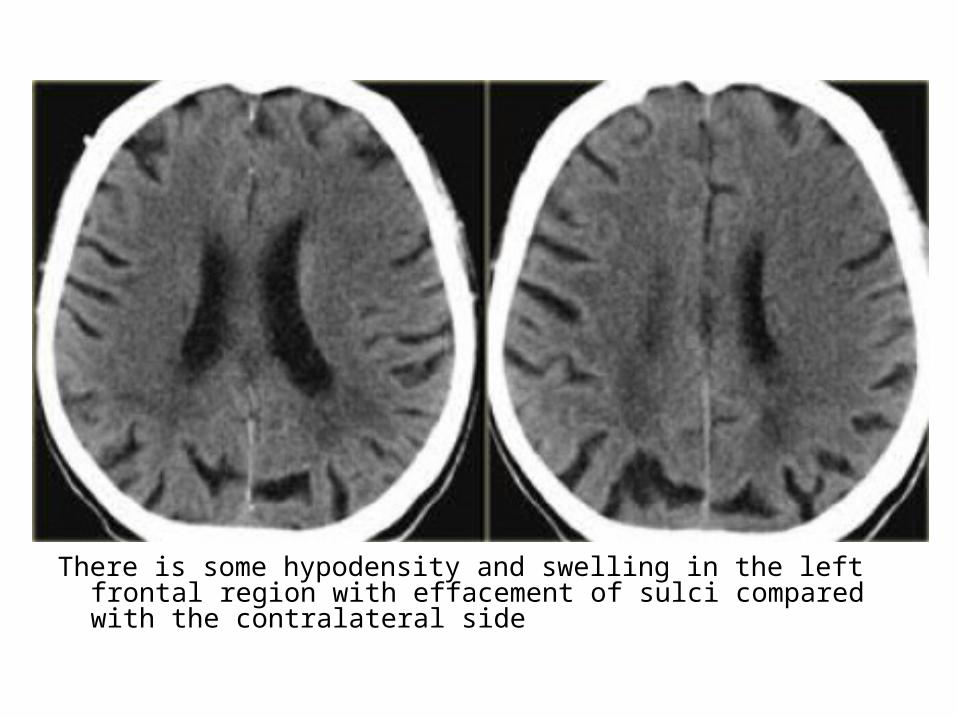
There is some hypodensity and swelling in the left frontal region with effacement of sulci compared with the contralateral side

2-The typical appearance of a cortical infarct is a bland wedge-shaped area of low attenuation involving both grey and white matter
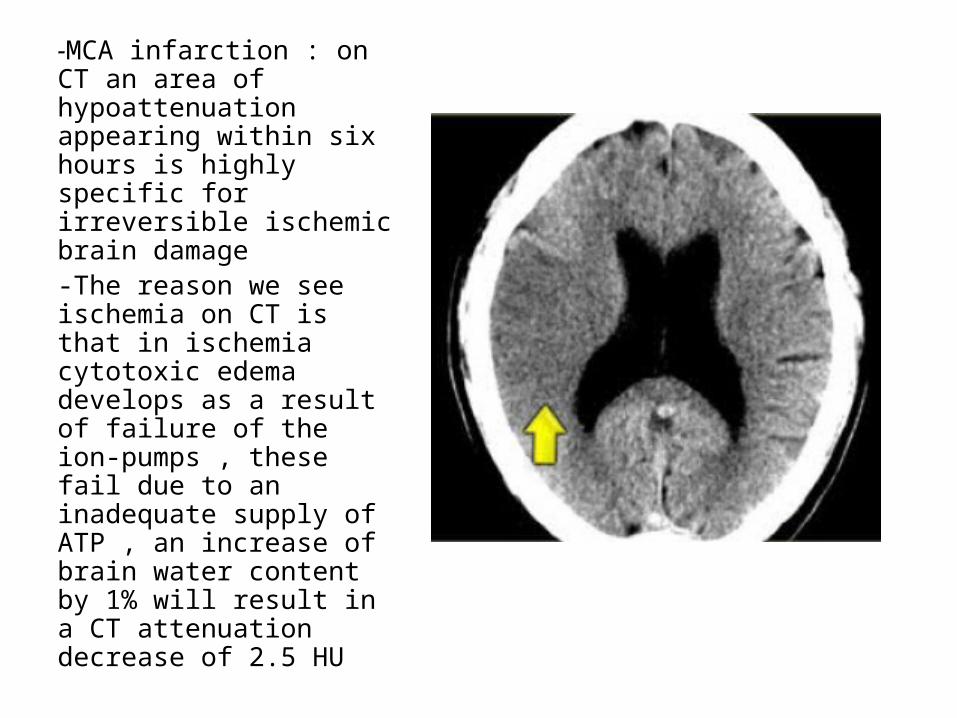
-MCA infarction : on CT an area of hypoattenuation appearing within six hours is highly specific for irreversible ischemic brain damage-The reason we see ischemia on CT is that in ischemia cytotoxic edema develops as a result of failure of the ion-pumps , these fail due to an inadequate supply of ATP , an increase of brain water content by 1% will result in a CT attenuation decrease of 2.5 HU


Left MCA infarction , CT shows hypoattenuating foci throughout the left sided white matter (arrows) and sulcal effacement in the left MCA territory consistent with infarction

3-The (insular ribbon sign) is a finding of early MCA infarction describes the loss of gray-white matter differentiation in the insula , the normal striated appearance of this area is replaced by a swollen homogeneous area of low attenuation
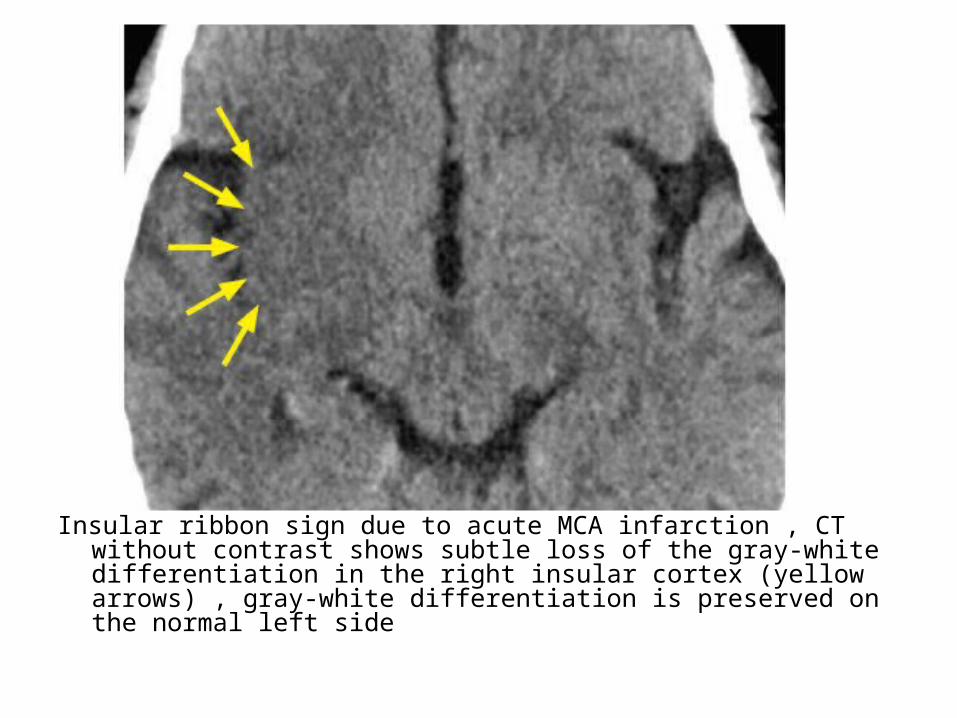
Insular ribbon sign due to acute MCA infarction , CT without contrast shows subtle loss of the gray-white differentiation in the right insular cortex (yellow arrows) , gray-white differentiation is preserved on the normal left side
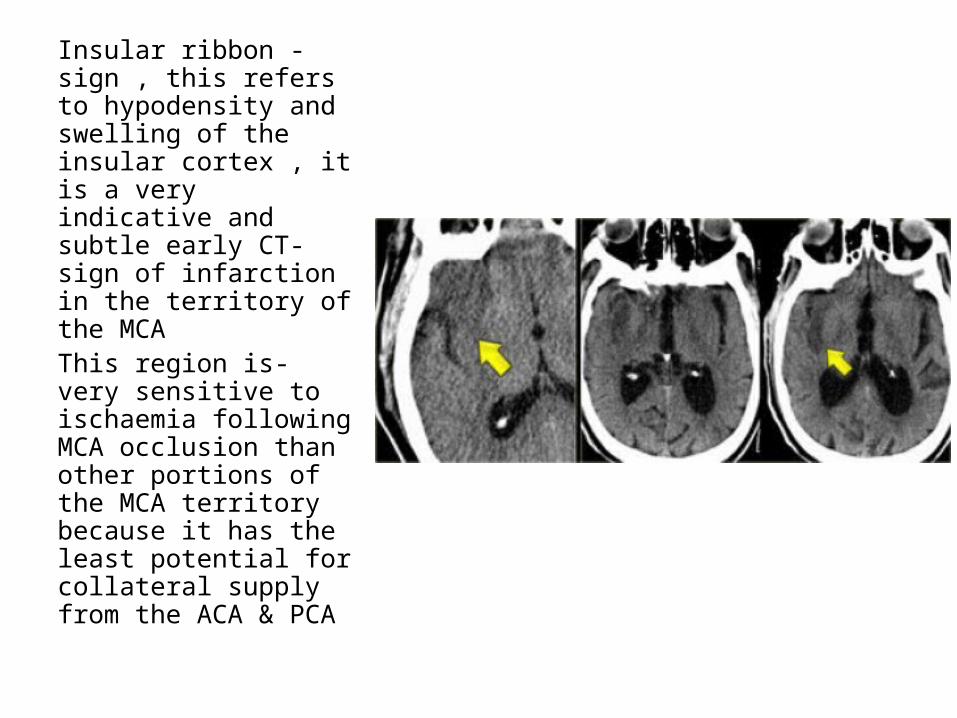
-Insular ribbon sign , this refers to hypodensity and swelling of the insular cortex , it is a very indicative and subtle early CT-sign of infarction in the territory of the MCA
-This region is very sensitive to ischaemia following MCA occlusion than other portions of the MCA territory because it has the least potential for collateral supply from the ACA & PCA


**This figure shows :-The insular cortex is located along the Sylvian fissure
overlying the external capsule where a ribbon of normal cortex should be appreciable (red arrows)
-In the setting of MCA infarction , cytotoxic edema leads to hypoattenuation such that the normal insular ribbon is no longer visible (blue arrows)
-The left image shows a very early infarct (within the first few hours) while the right image shows a more established infarct (greater than 4 hours old)
4-Alternatively , the basal ganglia may disappear as the infarcted grey matter acquires the same CT attenuation as the surrounding white matter , obscuration of the lentiform nucleus (putamen & globus pallidus) is caused by loss of gray-white matter differentiation at the border of the lentiform nucleus and the posterior limb of the internal capsule

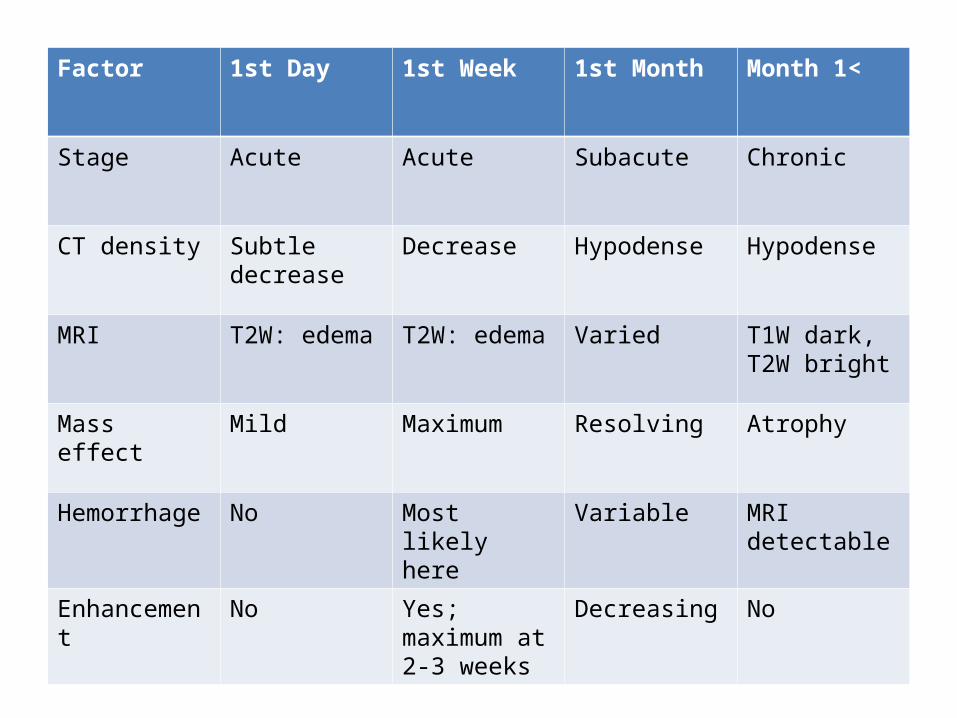
Factor 1st Day 1st Week 1st Month >1 Month
Stage Acute Acute Subacute Chronic
CT density Subtle decrease
Decrease Hypodense Hypodense
MRI T2W: edema T2W: edema Varied T1W dark, T2W bright
Mass effect Mild Maximum Resolving Atrophy
Hemorrhage No Most likely here
Variable MRI detectable
Enhancement No Yes; maximum at 2-3 weeks
Decreasing No
b) Mass Effect :-Local effacement of the cerebral sulci and
fissures may be followed by more diffuse brain swelling
-Maximal swelling usually occurs after 3-5 days-Infarcts that do not have a typical appearance
must be differentiated from other solitary intracranial masses

*N.B. : D.D. of a Solitary Intracerebral Mass1-Primary Brain Tumor2-Metastases3-Arterial Infarct4-Venous Infarct5-Abscess6-Acute Demyelinating Plaque7-Hematoma8-Cerebritis / Encephalitis9-Aneurysm
1-Primary Brain Tumor :-High grade tumors tend to have most mass
effect (tumor & surrounding edema) -Heterogenous with areas of necrosis
(Glioblastoma)-May infiltrate and involve (cross) corpus
callosum-Variable enhancement but tends to increase
with increased grade
2-Metastases :-Appearance variable on scans depending on
primary -Often considerable associated edema
(vasogenic , white matter)-Multiple / Solitary-Often located at the grey-white junction
3-Arterial Infarct :-Developing low attenuation (CT) , High T2 signal
(MRI) wedge shaped lesion with variable mass effect
-Various enhancement patterns if contrast given

4-Venous Infarct :-Area of low attenuation (CT) , High signal (MRI)
not in arterial distribution-Often associated mass -Often hemorrhagic5-Abscess :-Homogenous thin enhancing rim -Usually considerable vasogenic edema

6-Acute Demyelinating Plaque :-May be very large with minimal clinical signs-Low attenuation (CT) , High signal T2 (MRI)-Variable enhancement
7-Hematoma :-Subacute to chronic
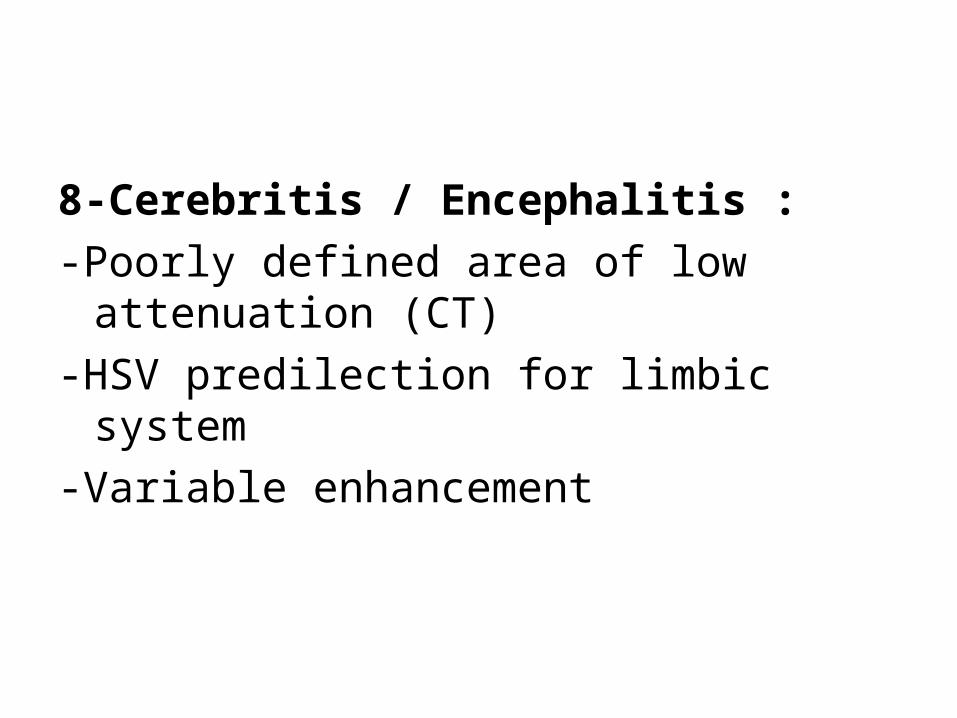
8-Cerebritis / Encephalitis :-Poorly defined area of low attenuation (CT)-HSV predilection for limbic system -Variable enhancement

9-Aneurysm :-May give rise to mass effect by itself but also
often associated edema in surrounding brain -Appearance varies according to whether patent
or associated intramural thrombus +/- calcification
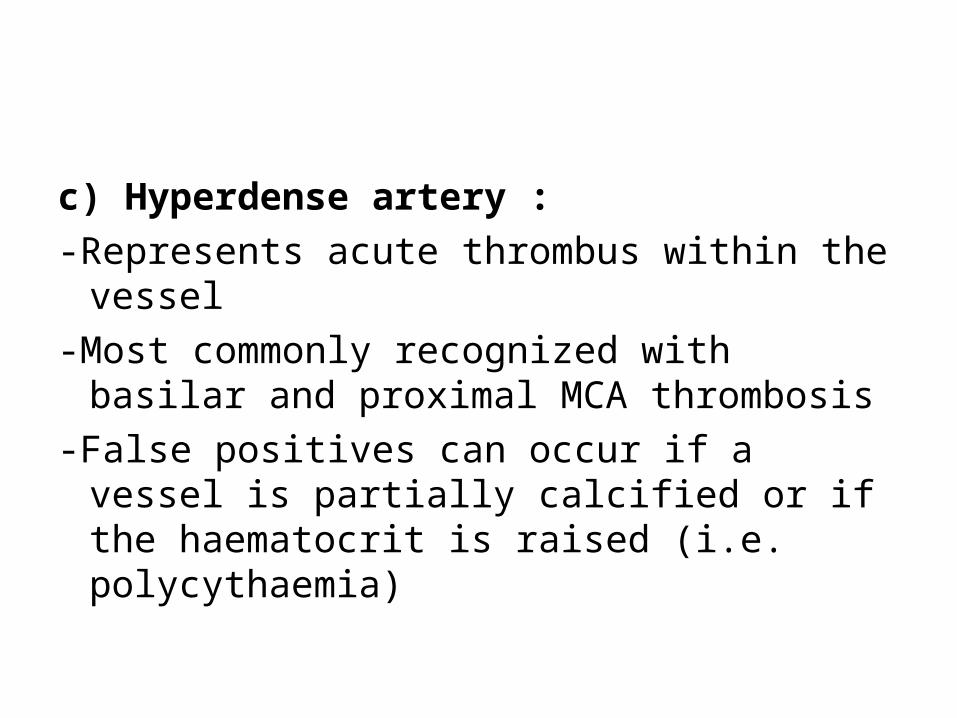
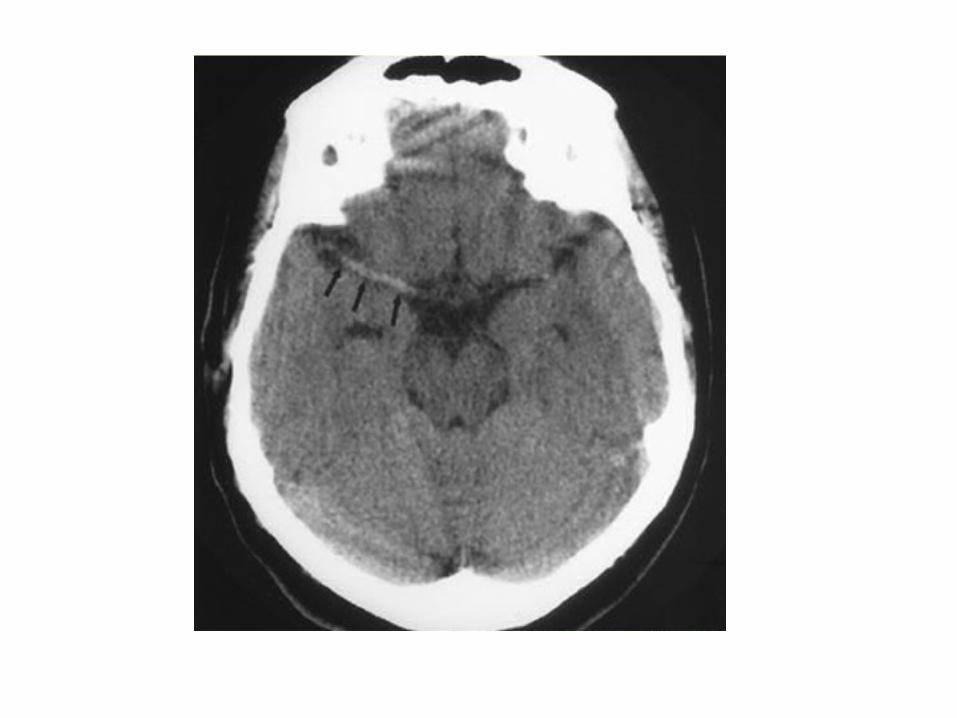
c) Hyperdense artery :-Represents acute thrombus within the vessel-Most commonly recognized with basilar and
proximal MCA thrombosis-False positives can occur if a vessel is partially
calcified or if the haematocrit is raised (i.e. polycythaemia)
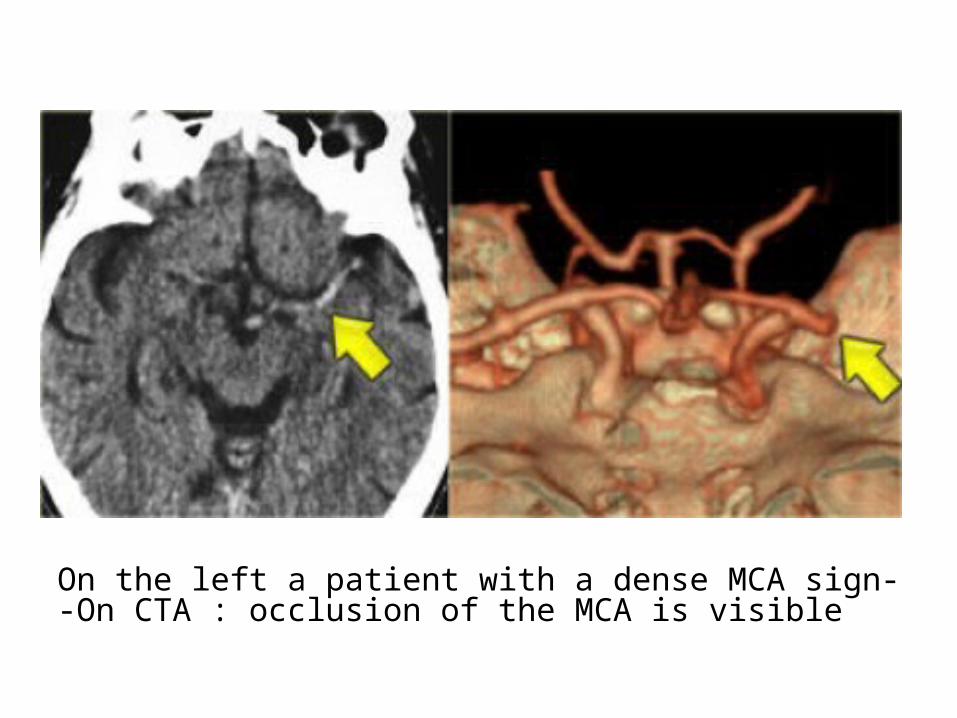
-On the left a patient with a dense MCA sign-On CTA : occlusion of the MCA is visible

Gradient Echo shows blooming artifact (red arrow) in the right proximal MCA which represents intraluminal thrombus and in the MRI correlate to the hyperdense artery sign that can be seen on CT

3-Later Signs :a) More Low Densityb) Generalized Mass Effectc) Hemorrhage
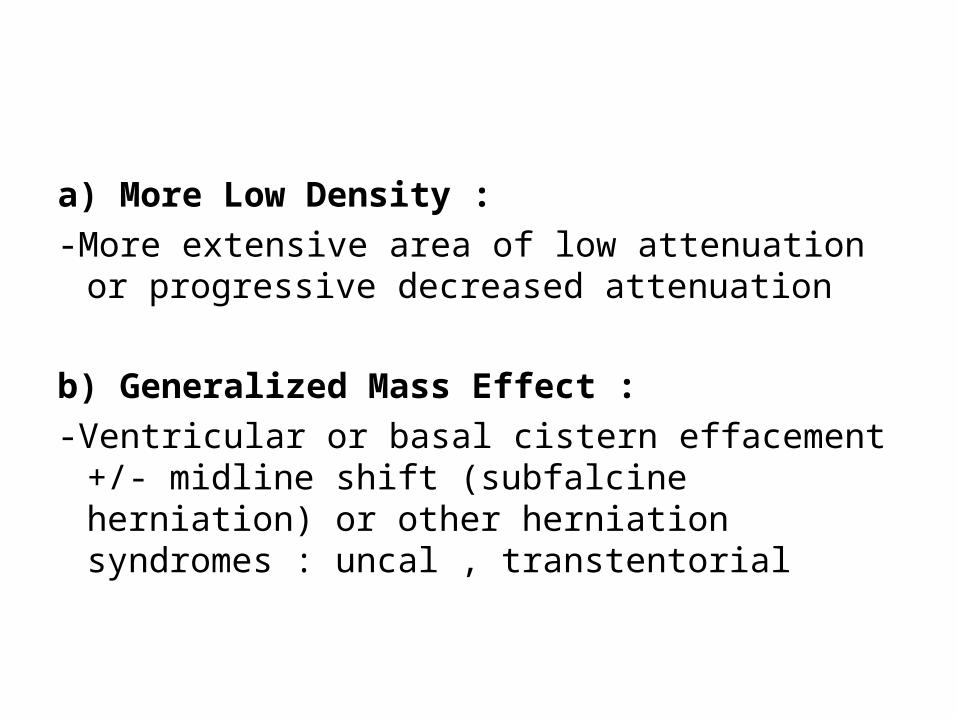
a) More Low Density :-More extensive area of low attenuation or
progressive decreased attenuation
b) Generalized Mass Effect :-Ventricular or basal cistern effacement +/-
midline shift (subfalcine herniation) or other herniation syndromes : uncal , transtentorial
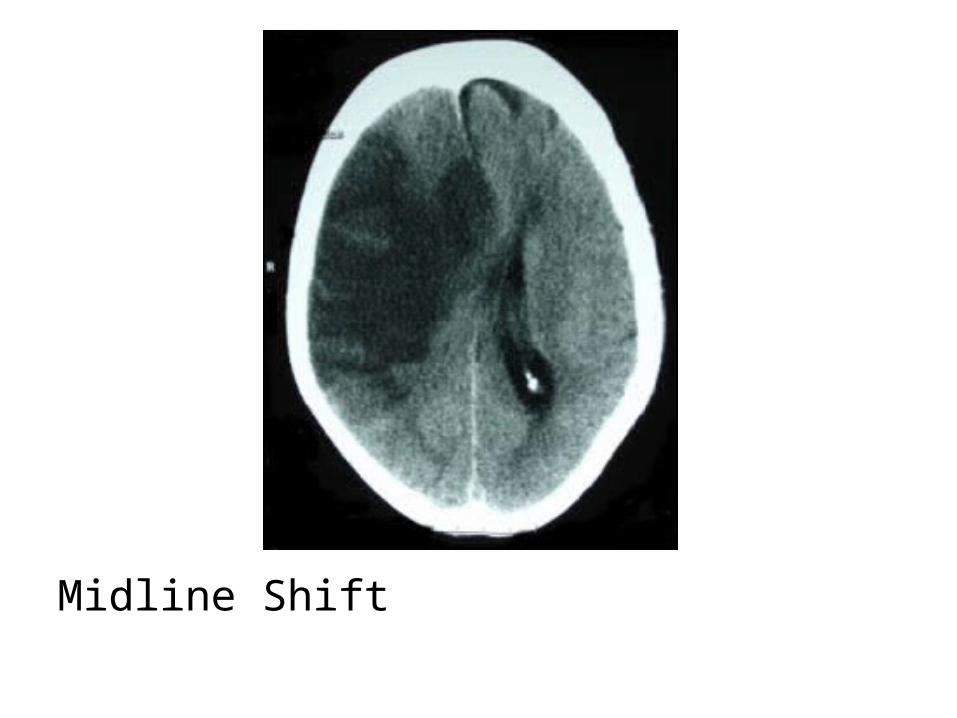
Midline Shift

Midline Shift

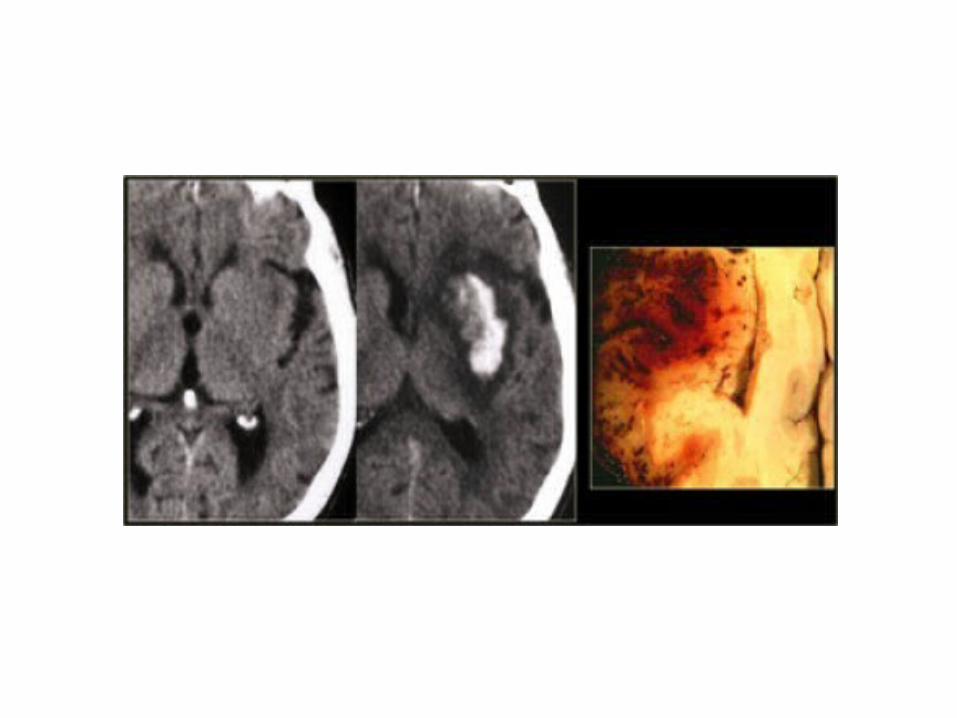
c) Hemorrhage :-Frank hemorrhage into an arterial infarct
typically occurs a few days after the initial stroke
-If there is hemorrhage within an infarct from the outset , a venous stroke or arterial embolus should be considered
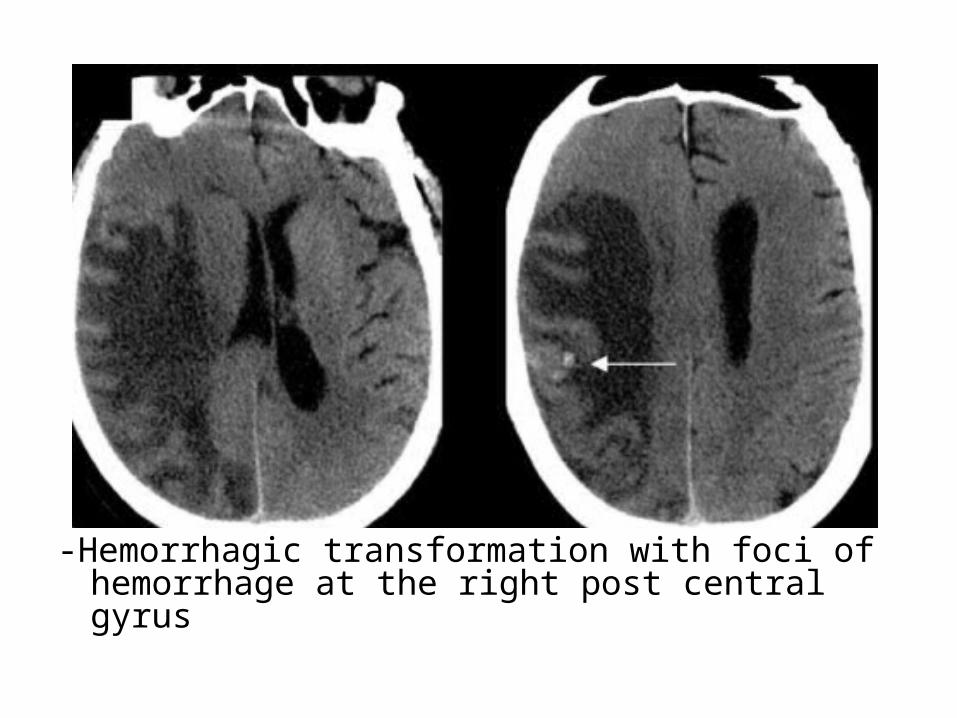
-Hemorrhagic transformation with foci of hemorrhage at the right post central gyrus

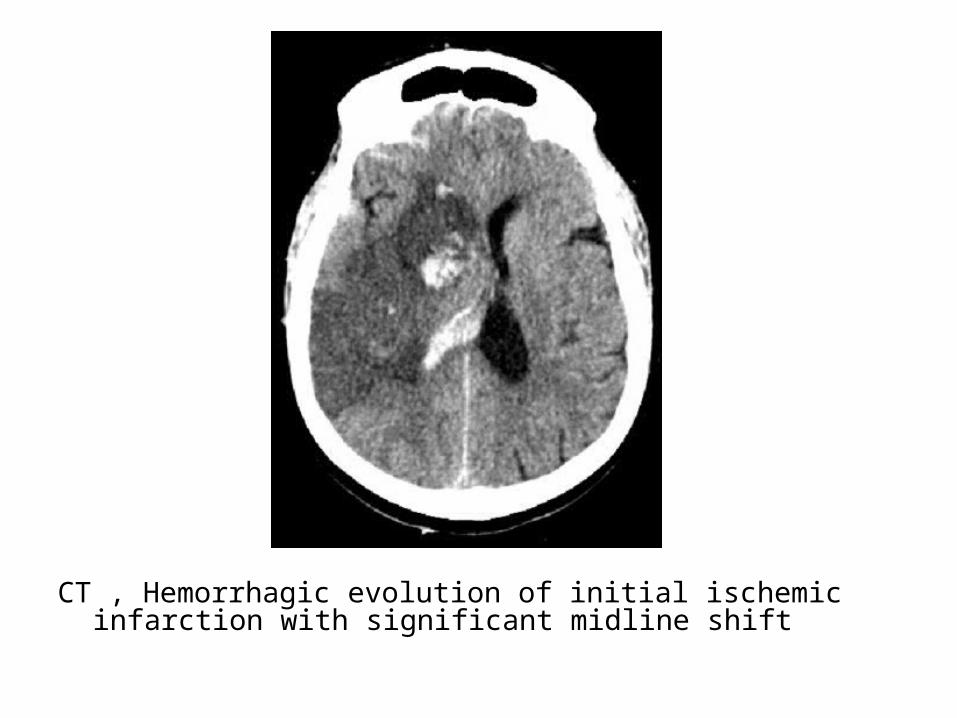
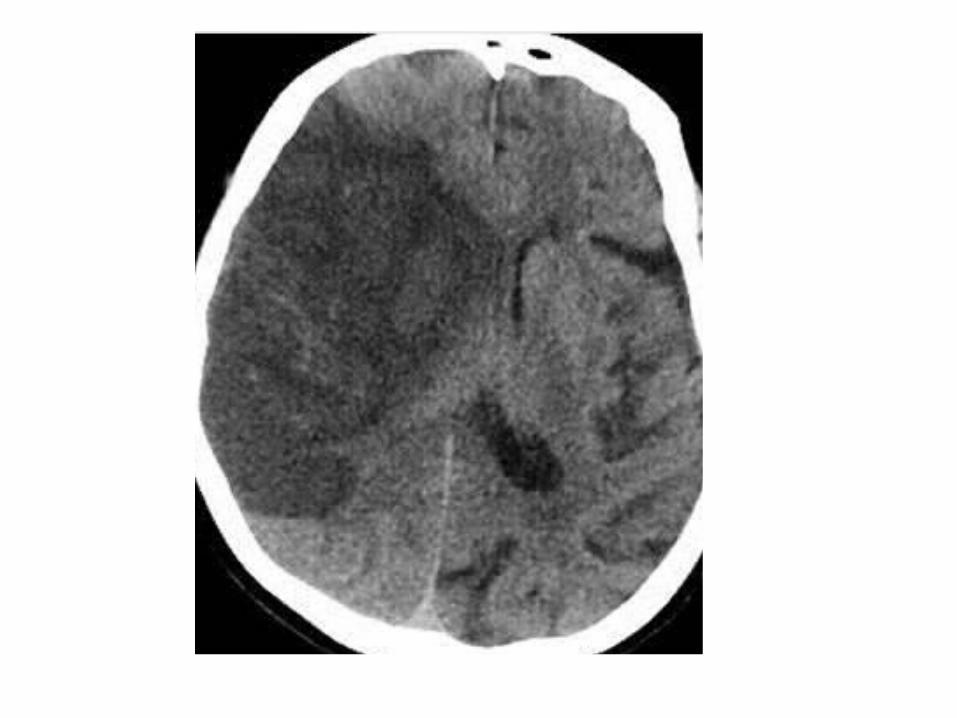
CT , Hemorrhagic evolution of initial ischemic infarction with significant midline shift
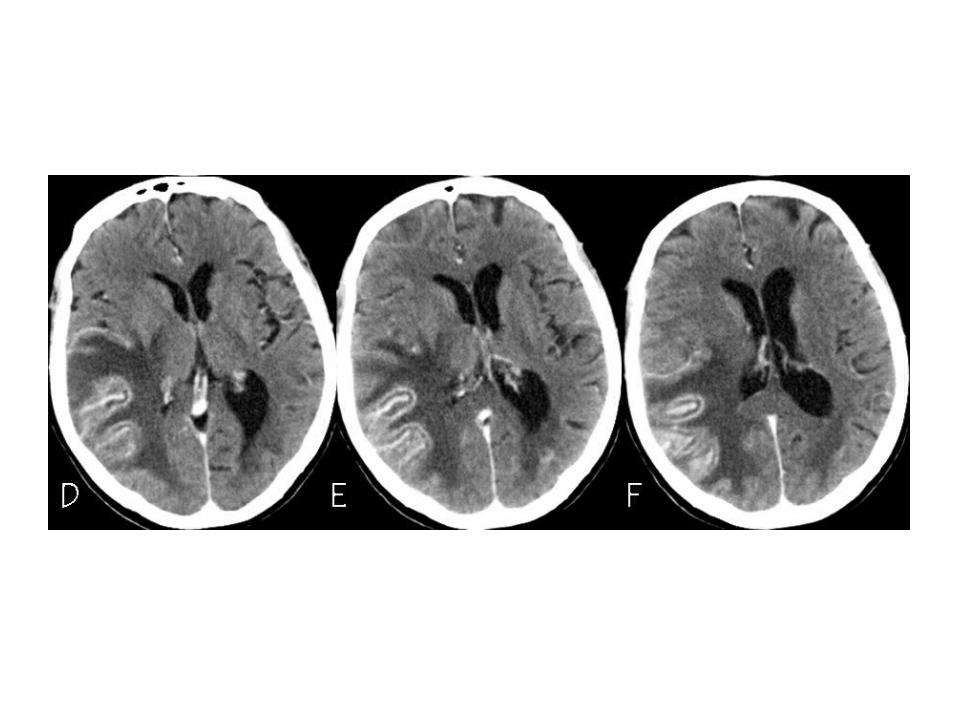
4-Contrast Enhancement :-Usually occurs by 4 days and reflects impairment
of the blood-brain barrier-Typically gyriform (following the cerebral cortex)
but may appear ring-enhancing or confluent-Subsides by 4-8 weeks -Luxury perfusion refers to hyperemia of an
ischemic area , the increased blood flow is thought to be due to compensatory vasodilatation secondary to parenchymal lactic acidosis

-Enhanced CT images of a patient with an infarction in the territory of the MCA -There is extensive gyral enhancement (luxury perfusion)-Sometimes this luxury perfusion may lead to confusion with tumoral enhancement-Luxury perfusion used to describe the dilation of numerous vascular channels observed within the relatively avascular infarcted area of the brain 24-48 h after an ischemic stroke , these are predominantly venous channels but arterial channels open up as well
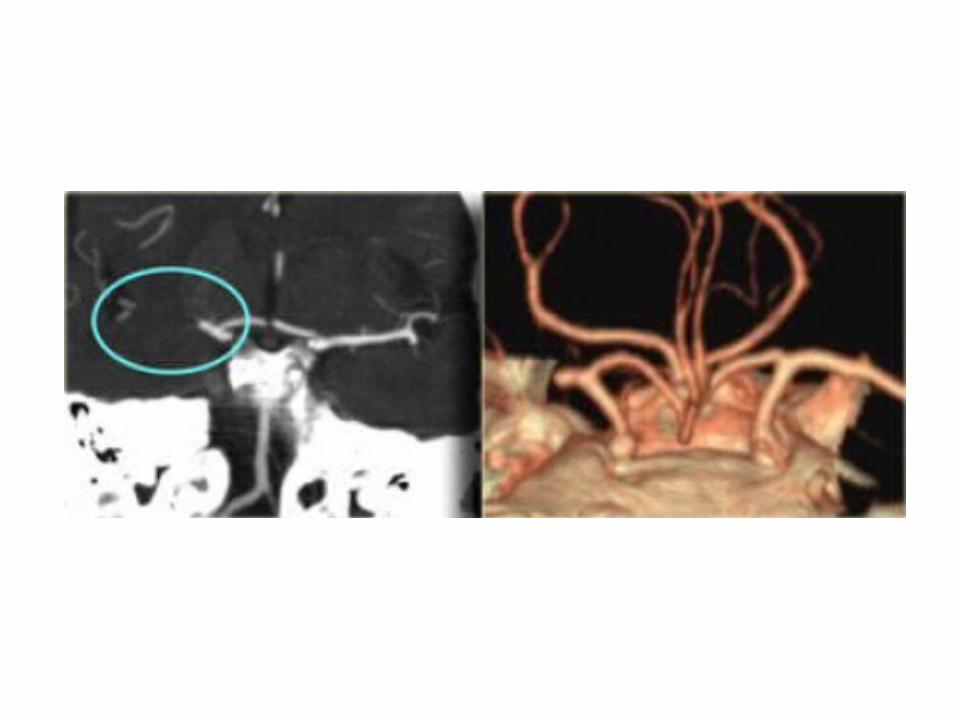
5-Arterial Occlusion :-CT angiography may demonstrate stenosis or
complete arterial occlusion prior to spontaneous recanalization
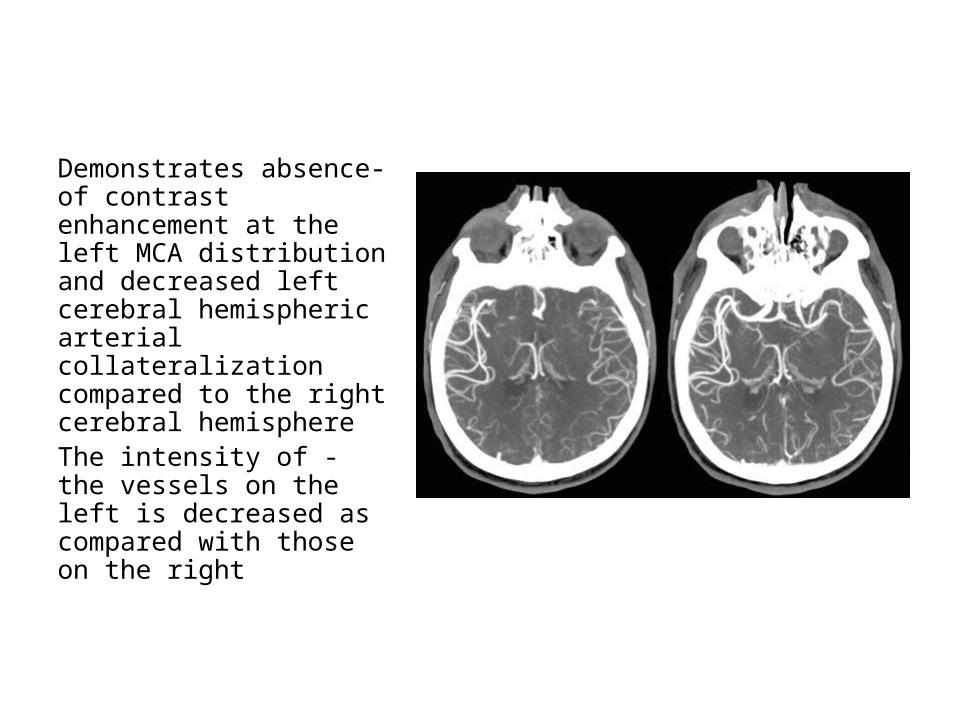
-Demonstrates absence of contrast enhancement at the left MCA distribution and decreased left cerebral hemispheric arterial collateralization compared to the right cerebral hemisphere
-The intensity of the vessels on the left is decreased as compared with those on the right

6-Perfusion Defect :-CT can demonstrate the extent and degree of
cerebral ischemia with the use of iodinated contrast medium or xenon
-With CT and MR diffusion we can get a good impression of the area that is infarcted but we cannot preclude a large ischemic penumbra
(tissue at risk)
-Within the ischemic cerebrovascular bed , there are two major zones of injury :
1-The core ischemic zone2-Ischemic penumbra (the term generally used to define
ischemic but still viable cerebral tissue)-In the core zone which is an area of severe ischemia
(blood flow below 10% to 25%) , the loss of oxygen and glucose results in rapid depletion of energy stores , severe ischemia can result in necrosis of neurons and also of supporting cellular elements (glial cells) within the severely ischemic area
-Brain cells within the penumbra , a rim of mild to moderately ischemic tissue lying between tissue that is normally perfused and the area in which infarction is evolving may remain viable for several hours , that is because the penumbral zone is supplied with blood by collateral arteries anastomosing with branches of the occluded vascular tree , however , even cells in this region will die if reperfusion is not established during the early hours since collateral circulation is inadequate to maintain the neuronal demand for oxygen and glucose indefinitely

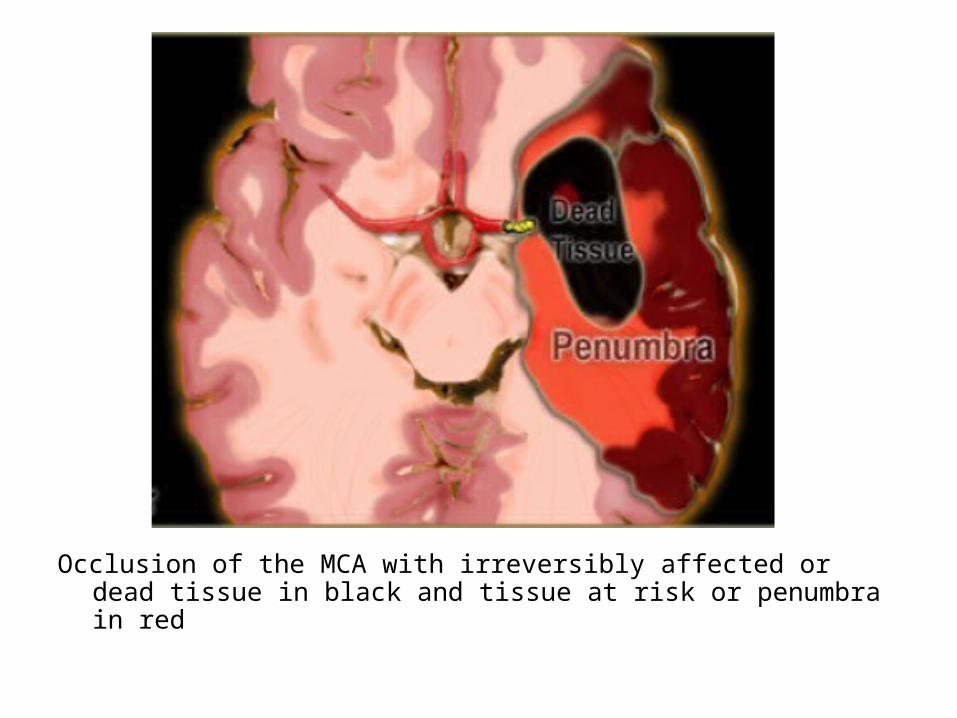
Occlusion of the MCA with irreversibly affected or dead tissue in black and tissue at risk or penumbra in red
-The penumbra does receive some perfusion but at a reduced rate compared to normal brain , perfusion of the penumbra is < 20 mL/100 g tissue per minute in physiologic studies , compared to 60 mL/100 g tissue for normal grey matter , such a low rate of perfusion causes cellular dysfunction and produces a neurological deficit
-With perfusion studies we monitor the first pass of an iodinated contrast agent bolus through the cerebral vasculature
-Perfusion will tell us which area is at risk , approximately 26% of patients will require a perfusion study to come to the proper diagnosis , the limitation of CT-perfusion is the limited coverage
-The key to interpretation is understanding a number of perfusion parameters :
1-Cerebral blood volume (CBV)2-Cerebral blood flow (CBF)3-Mean transit time (MTT)

1-Cerebral blood volume (CBV) :-Is measured in relative units and correlates to the
total volume of circulating blood in the voxel-CBV is a parameter that changes late in the
ischemic cascade and usually reduced CBV is also accompanied by restricted diffusion
-Reduced CBV (and restricted diffusion) correlates well with tissue that goes on to infarction
2-Cerebral blood flow (CBF) :-Is measured in relative units and correlates to the
flow of blood in the voxel-CBF can be used to predict the likelihood of brain
tissue infarcting-In current clinical practice , a CBF abnormality
exceeding the DWI abnormality (diffusion-perfusion mismatch) implies that there is brain at risk that has not infracted yet , this brain at risk is the target of therapeutic interventions
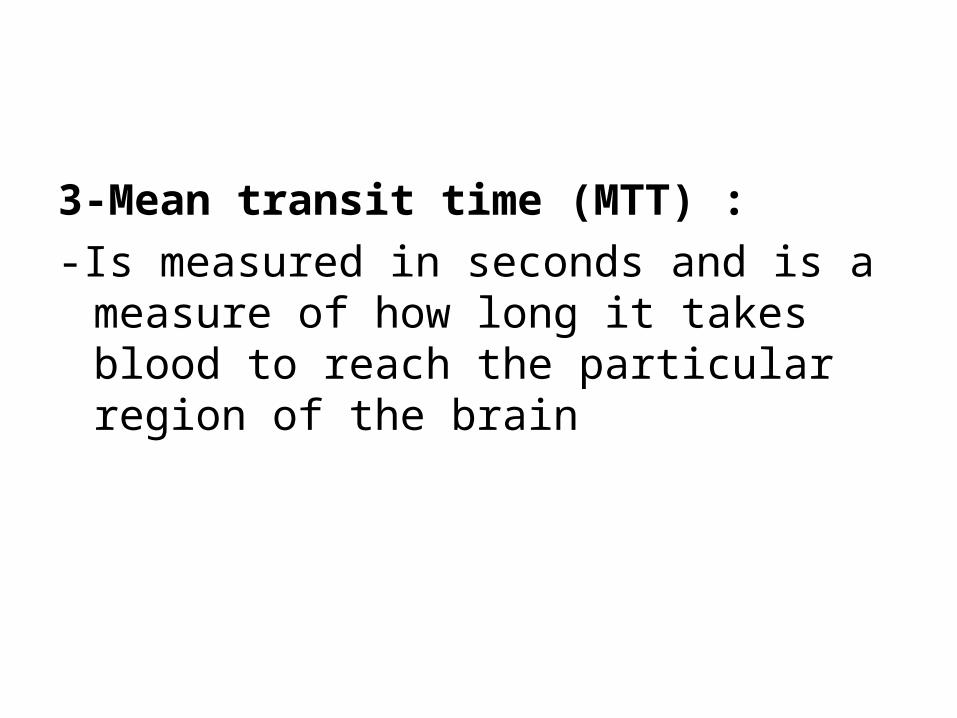
3-Mean transit time (MTT) :-Is measured in seconds and is a measure of
how long it takes blood to reach the particular region of the brain
-Areas which demonstrate matched defects in CBV and MTT represent the unsalvageable infarct core , whereas areas which have prolonged MTT but preserved CBV are considered to be the ischaemic penumbra
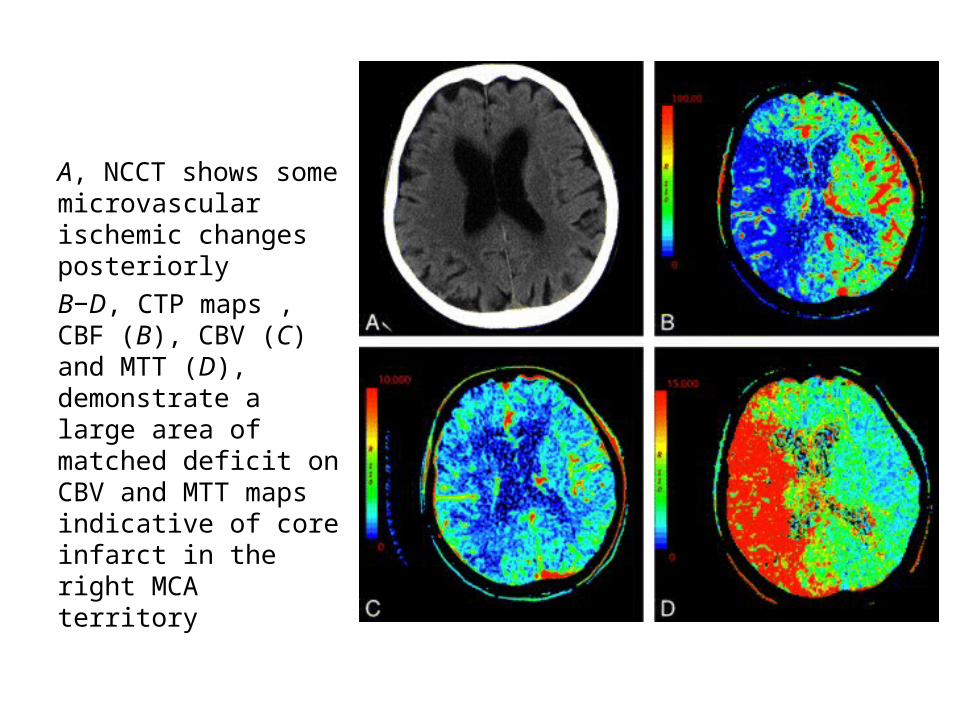
A, NCCT shows some microvascular ischemic changes posteriorlyB−D, CTP maps , CBF (B), CBV (C) and MTT (D), demonstrate a large area of matched deficit on CBV and MTT maps indicative of core infarct in the right MCA territory

A, On admission , NCCT and CTP were performedNCCT shows no evidence of acute infarctionB, CT perfusion CBF map shows a region of decreased perfusion within the posterior segment of the left MCA territory (arrows)D, MTT map shows a corresponding prolongation within this same region (arrows)C, CBV map demonstrates no abnormality , therefore, representing a CBV/MTT mismatch or ischemic penumbra

Left MCA infarct. (A) Regional cerebral blood flow map from computed tomography perfusion shows a large perfusion defect in the left frontal and temporal lobes , evidenced by a lack of color display , (B) Regional cerebral blood volume map demonstrates a penumbra of decreased perfusion (indicated with arrows around blue areas) surrounding the defect (purple) indicating potentially reversible ischemia about the perfusion defect

Acute Arterial Infarct – MRI Appearance1-Diffusion Abnormality2-Absent Arterial Flow Void3-Increased T2 Signal4-Mass Effect5-Intravascular Stasis of Contrast Medium6-Reduced Perfusion7-Arterial Occlusion8-Meningeal Enhancement9-Hemorrhage10-Wallerian Degeneration

1-Diffusion Abnormality :-Abnormalities may be seen within minutes of
arterial occlusion with diffusion-weighted MRI-Standard diffusion protocol includes a DWI and an
apparent diffusion coefficient (ADC) image , these are usually interpreted side by side
-DWI : summation of diffusion and T2 effects , abnormalities appear as high signal
-ADC : diffusion effects only , abnormalities appear as low signal
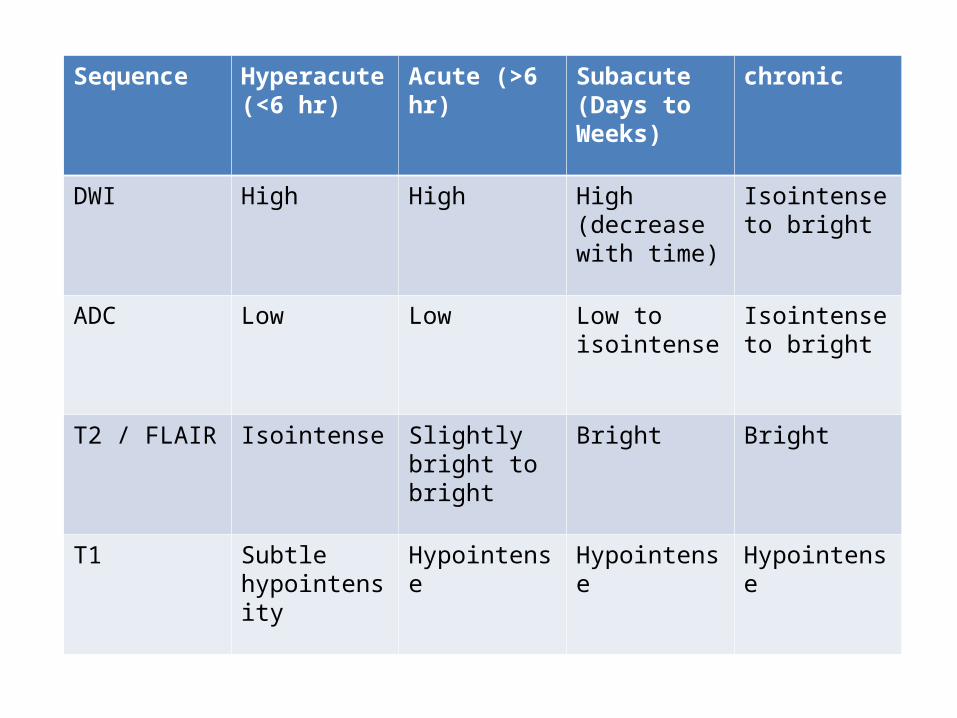
Sequence Hyperacute (<6 hr)
Acute (>6 hr) Subacute (Days to Weeks)
chronic
DWI High High High (decrease with time)
Isointense to bright
ADC Low Low Low to isointense
Isointense to bright
T2 / FLAIR Isointense Slightly bright to bright
Bright Bright
T1 Subtle hypointensity
Hypointense Hypointense Hypointense
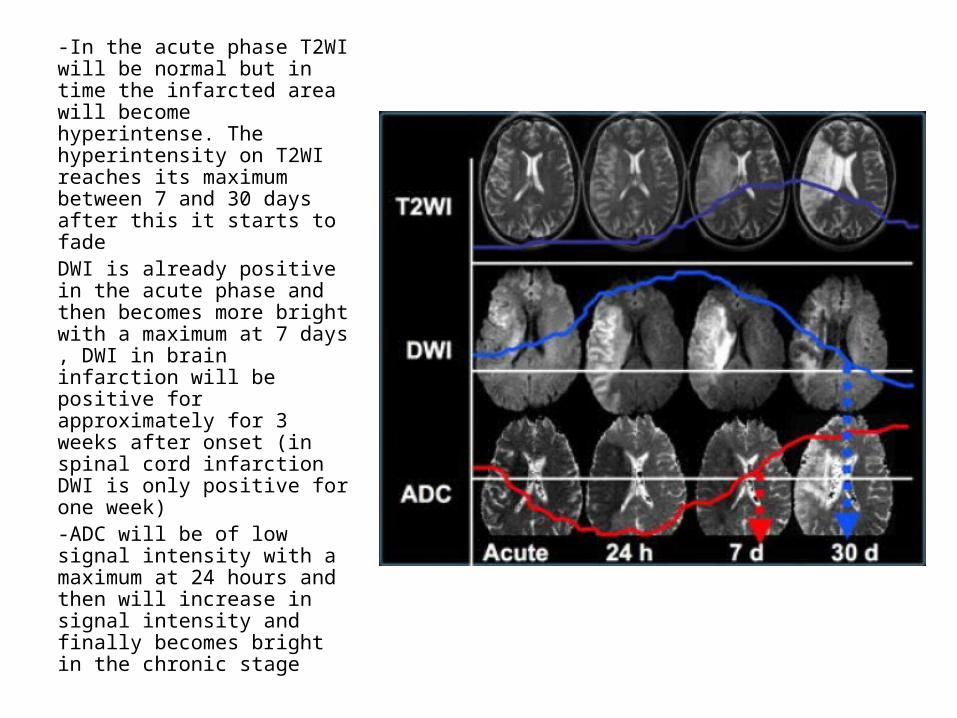
-In the acute phase T2WI will be normal but in time the infarcted area will become hyperintense. The hyperintensity on T2WI reaches its maximum between 7 and 30 days after this it starts to fadeDWI is already positive in the acute phase and then becomes more bright with a maximum at 7 days , DWI in brain infarction will be positive for approximately for 3 weeks after onset (in spinal cord infarction DWI is only positive for one week)-ADC will be of low signal intensity with a maximum at 24 hours and then will increase in signal intensity and finally becomes bright in the chronic stage
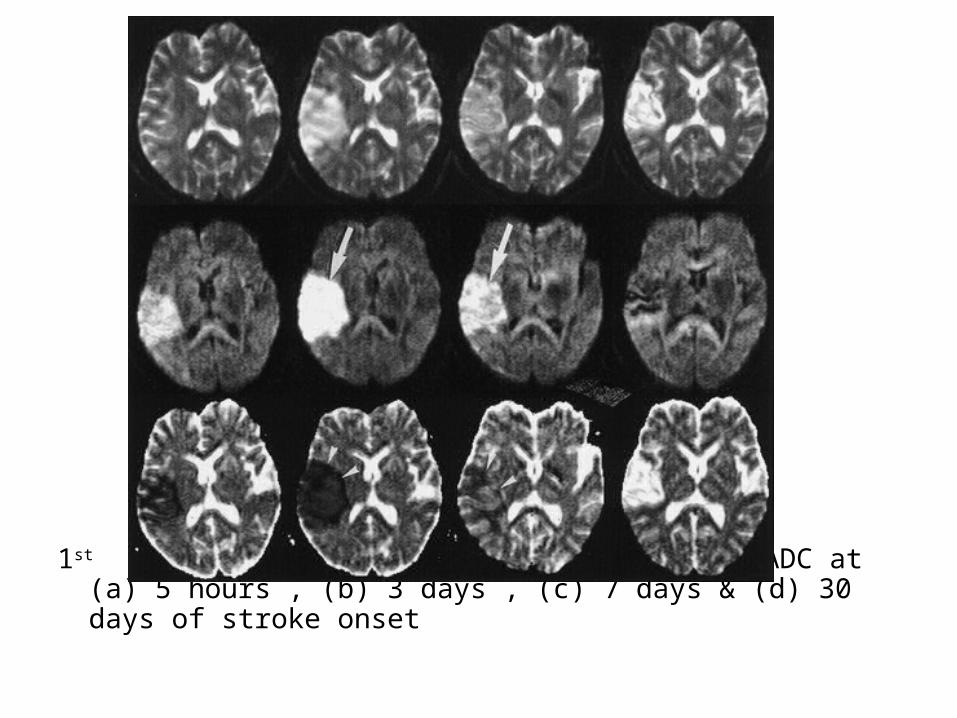
1st row is T2 , 2nd row is DWI & 3rd row is ADC at (a) 5 hours , (b) 3 days , (c) 7 days & (d) 30 days of stroke onset

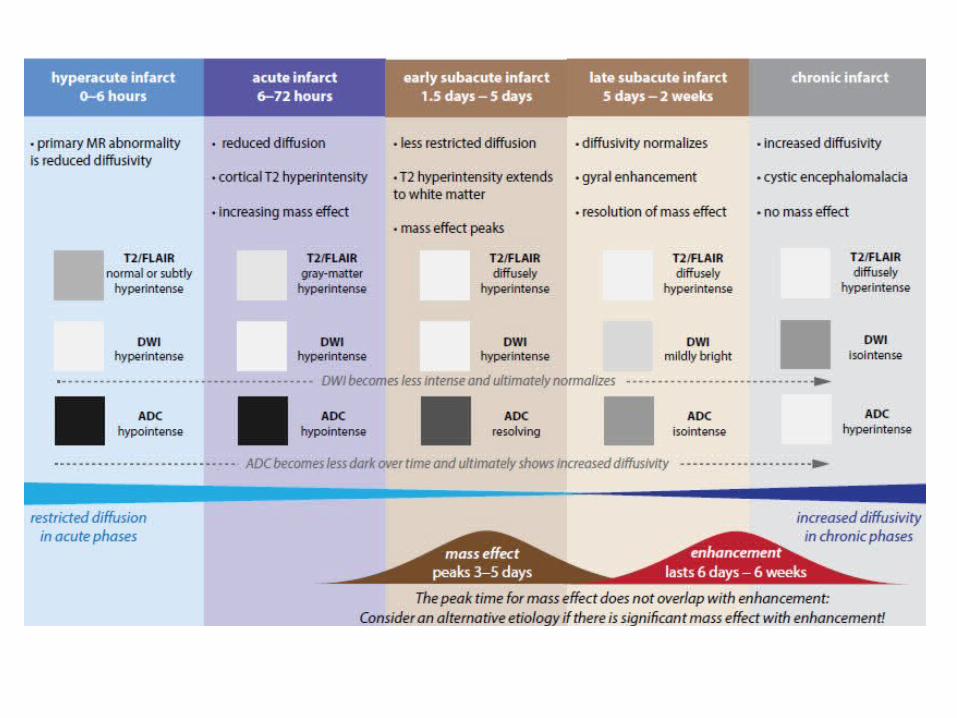
a) Hyperacute Infarct (0-6 hours)b) Acute Infarct (6-72 hours)c) Early Subacute Infarct (1.5 days-5 days)d) Late Subacute Infarct (5 days-2 weeks)e) Chronic Infarct
a) Hyperacute Infarct (0-6 hours) :-Within minutes of critical ischemia , the sodium-
potassium ATPase pump that maintains the normal low intracellular sodium concentration fails , sodium & water diffuse into cells leading to cell swelling and cytotoxic edema
-Calcium also diffuses into cells which triggers cascades that contribute to cell lysis
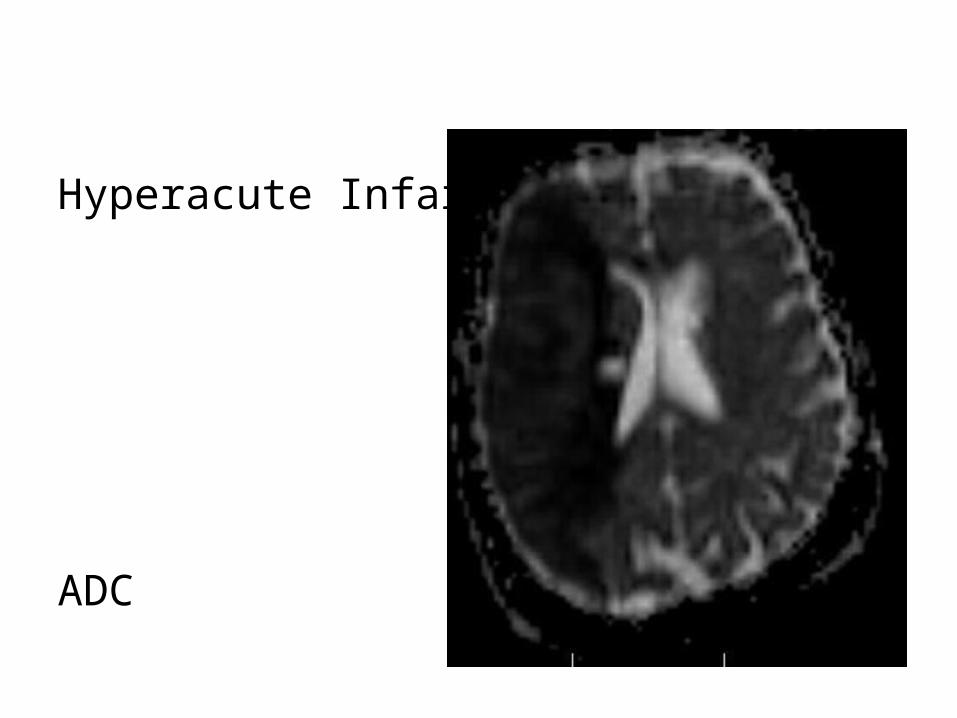
-Diffusion is the most sensitive modality , DWI hyperintensity & ADC map hypointensity reflect reduced diffusivity which can be seen within minutes of the ictus
-Diffusion is reduced in acute infarct by 2 factors:1-Shift from extracellular to intracellular water due to
Na/K ATPase pump failure2-Increased viscosity of infarcted brain due to cell lysis
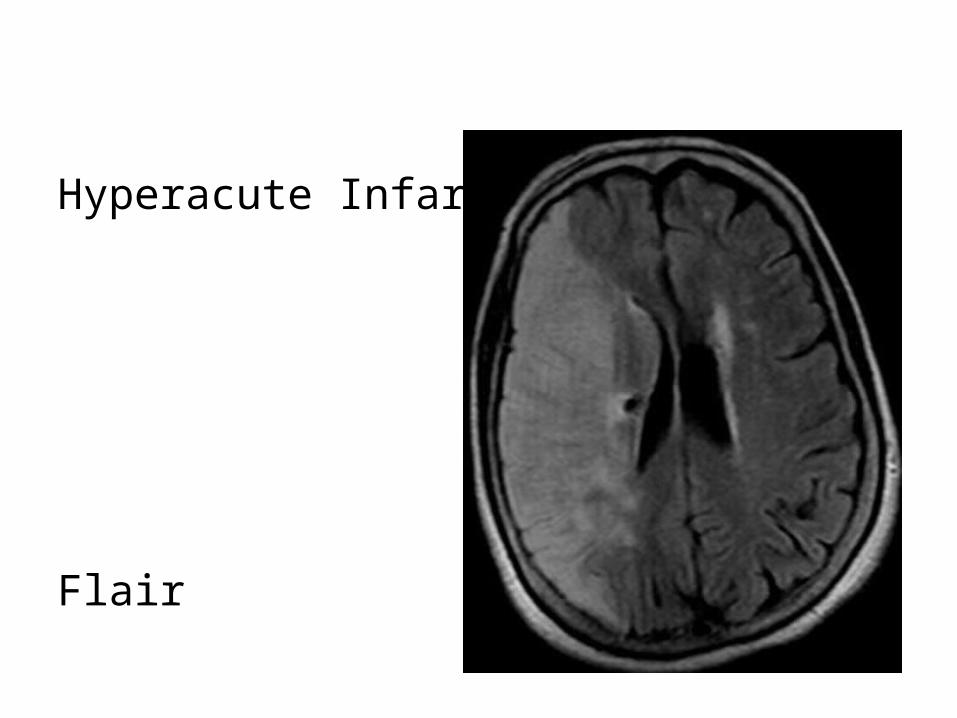
and increased extracellular protein-FLAIR may be normal , subtle hyperintensity may be
seen on FLAIR-Perfusion shows decreased cerebral blood volume of
the infarct core with or without a surrounding region of decreased cerebral blood flow which represents the penumbra

Hyperacute Infarct
T1
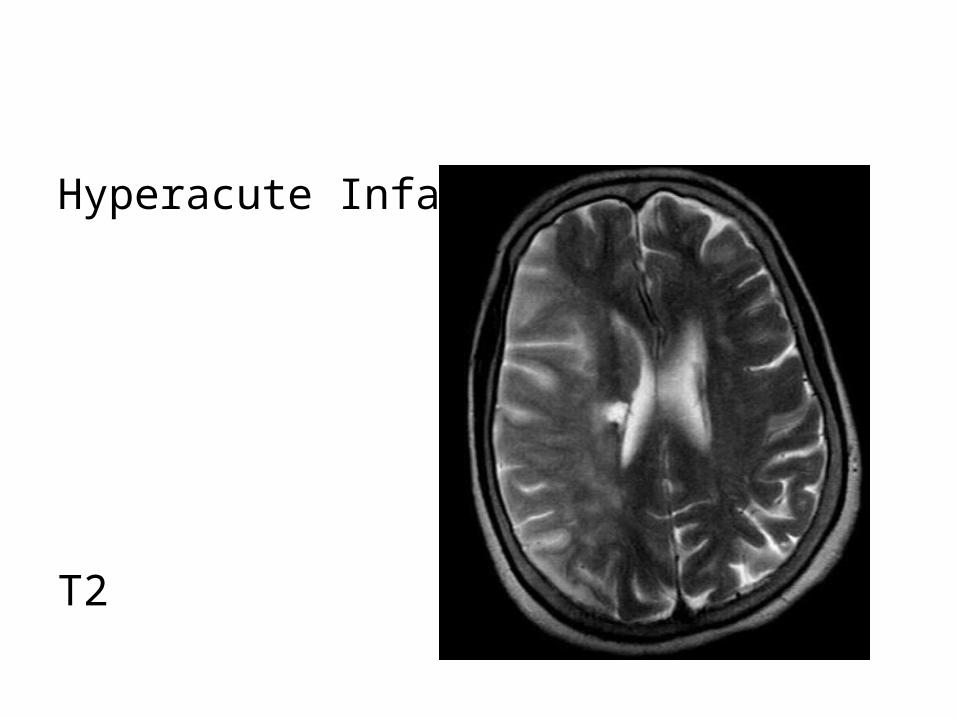
Hyperacute Infarct
T2
Hyperacute Infarct
Flair

Hyperacute Infarct
DWI
Hyperacute Infarct
ADC
b) Acute Infarct (6-72 hours) :-The acute infarct is characterized by increase in
vasogenic edema and mass effect-Damaged vascular endothelial cells cause leakage of
extracellular fluid and increase the risk of hemorrhage
-On imaging , there is increased sulcal effacement and mass effect , the mass effect peaks at 3-4 days which is an overlap between the acute & early subacute phases

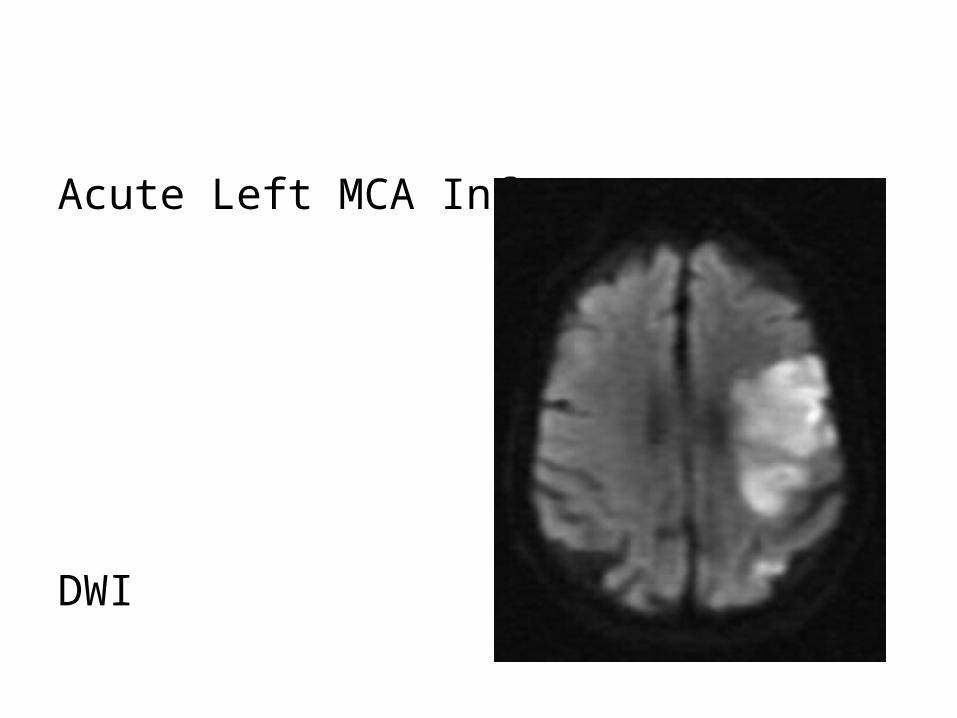
-MRI shows hyperintensity of the infarct core on T2 , best seen on FLAIR , the FLAIR abnormality is usually confined to the grey matter , DWI continues to show restricted diffusion
-There may be some arterial enhancement due to increased collateral flow
-Perfusion images most commonly show increase in size of the infarct core with resultant decrease in size of penumbra

Acute Left MCA Infarct
T1

Acute Left MCA Infarct
T2
Acute Left MCA Infarct
DWI

Acute Left MCA Infarct
ADC
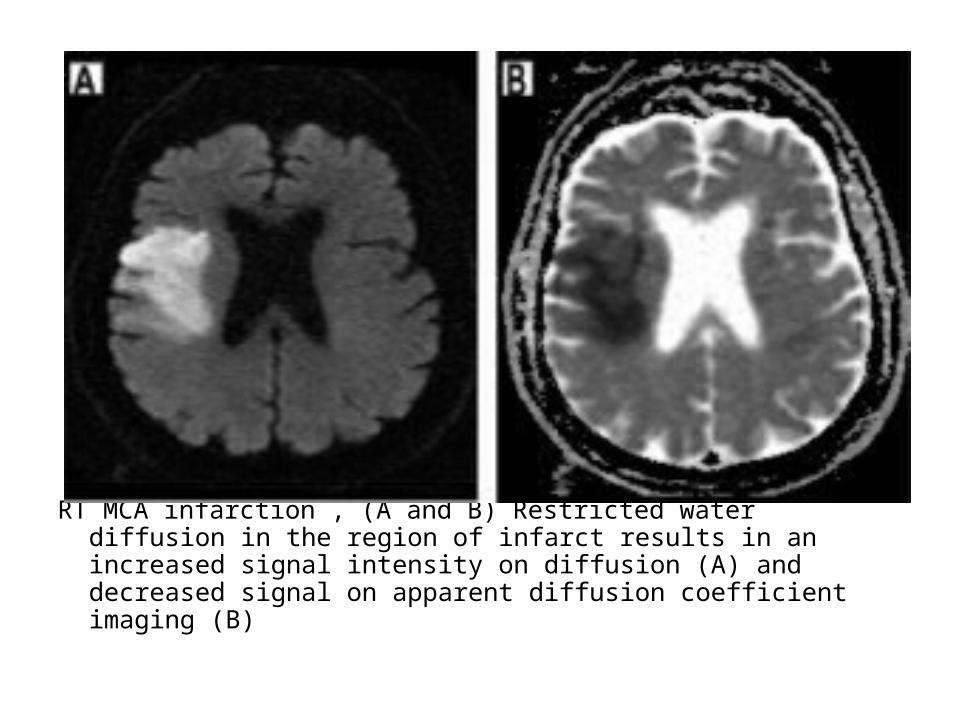
RT MCA infarction , (A and B) Restricted water diffusion in the region of infarct results in an increased signal intensity on diffusion (A) and decreased signal on apparent diffusion coefficient imaging (B)
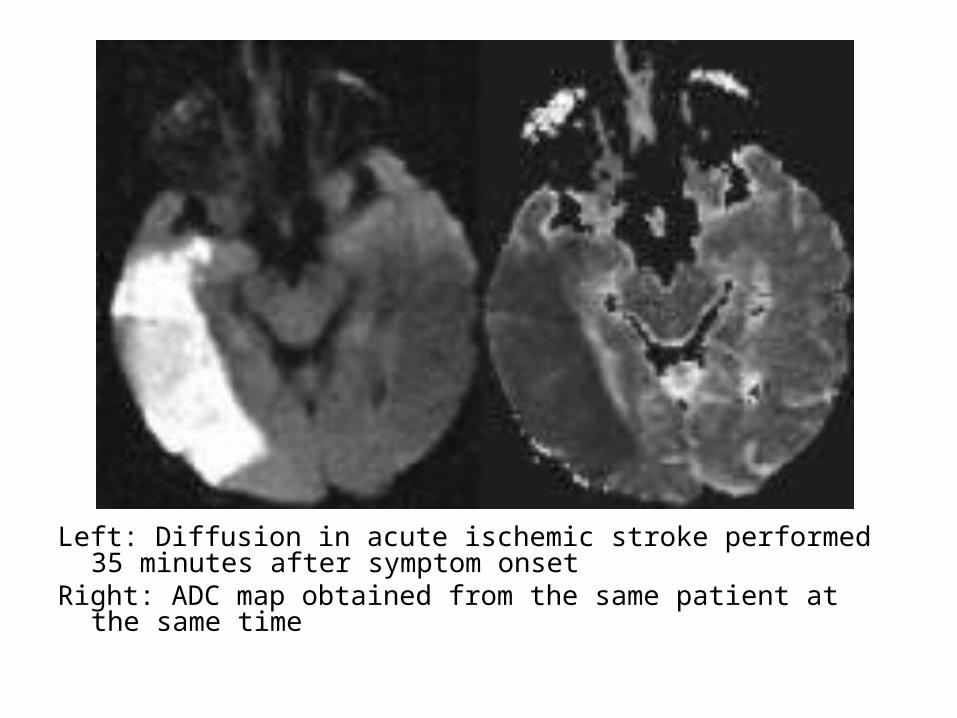
Left: Diffusion in acute ischemic stroke performed 35 minutes after symptom onset
Right: ADC map obtained from the same patient at the same time
c) Early Subacute Infarct (1.5 days-5 days) :-In the early subacute phase , blood flow to the
affected brain is re-established by leptomeningeal collaterals and ingrowth of new vessels into the region of infarction
-The new vessels have an incomplete blood brain barrier causing a continued increase in vasogenic edema & mass effect which peaks at 3-4 days
-MRI shows marked hyperintensity on T2 involving both grey & white matter (in contrast to the acute phase which usually involves just the grey matter)
-The ADC map becomes less dark or even resolves if there is extensive edema , however , the DWI typically remain bright due to underlying T2 shine through
-Perfusion imaging shows continued expansion of the infarct core and further reduction in the ischemic penumbra
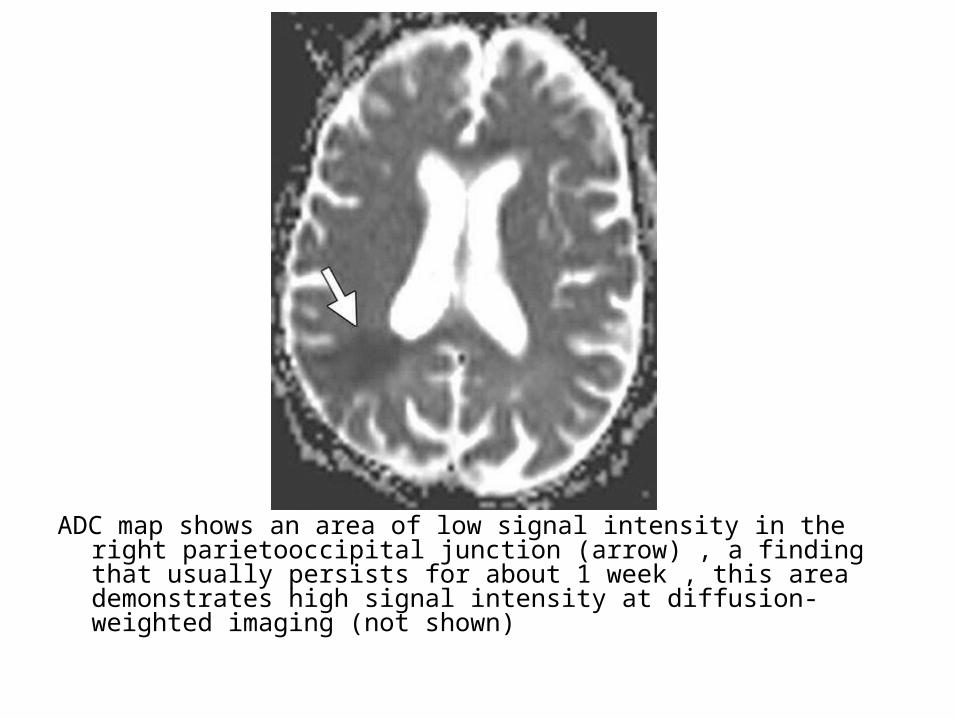
ADC map shows an area of low signal intensity in the right parietooccipital junction (arrow) , a finding that usually persists for about 1 week , this area demonstrates high signal intensity at diffusion-weighted imaging (not shown)

T1 shows an area of low signal intensity (arrow)
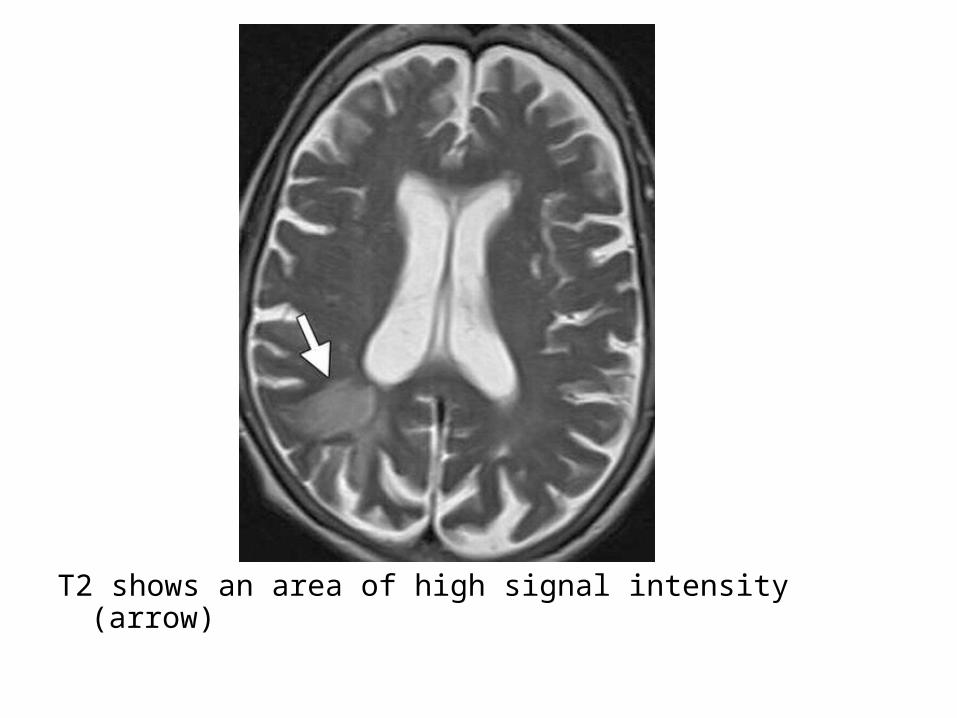
T2 shows an area of high signal intensity (arrow)
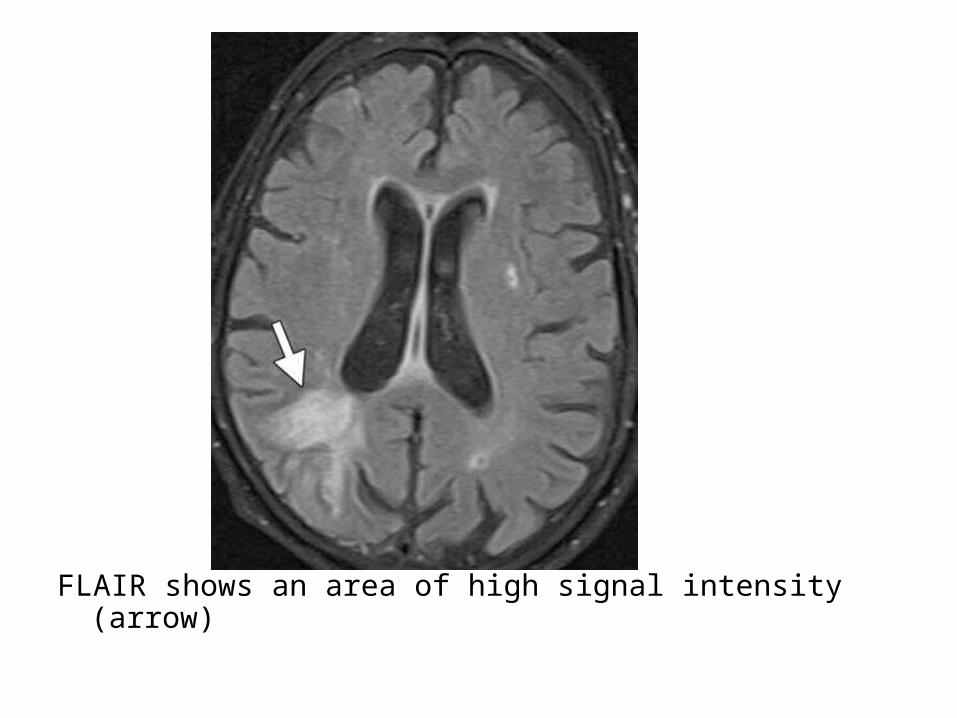
FLAIR shows an area of high signal intensity (arrow)
d) Late Subacute Infarct (5 days-2 weeks) :-The subacute phase is characterized by resolution of
vasogenic edema and reduction in mass effect-A key imaging finding is gyriform enhancement which
may occasionally be confused for a neoplasm , unlike a tumor , subacute infarction will not typically show both mass effect and enhancement simultaneously , enhancement be seen from approximately 6 days to 6 weeks after the initial infarct
-Diffusion may remain bright due to T2 shine through , although ADC map will either return to normal or show increased diffusivity
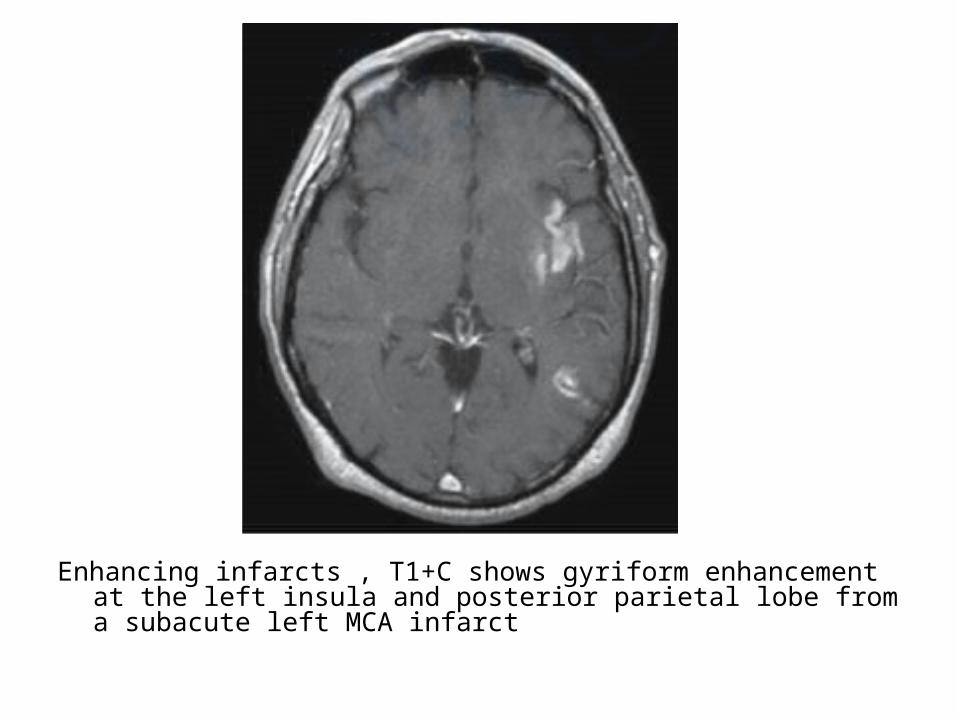
Enhancing infarcts , T1+C shows gyriform enhancement at the left insula and posterior parietal lobe from a subacute left MCA infarct
e) Chronic Infarct :-In the chronic stage of infarction , cellular debris and
dead brain tissue are removed by macrophages and replaced by cystic encephalomalacia and gliosis
-Infarct involvement of the corticospinal tract may cause mass effect , mild hyperintensity on T2 and eventual atrophy of the ipsilateral cerebral peduncle & ventral pons due to Wallerian degeneration , these changes can first be seen in the subacute phase with atrophy being predominant feature in the chronic stage (See later)
-DWI has usually returned to normal in the chronic stages
-Occasionally , cortical laminar necrosis can develop instead of encephalomalacia , cortical laminar necrosis is a histologic finding characterized by deposition of lipid-laden macrophages after ischemia that manifests on imaging as hyperintensity on both T1 & T2
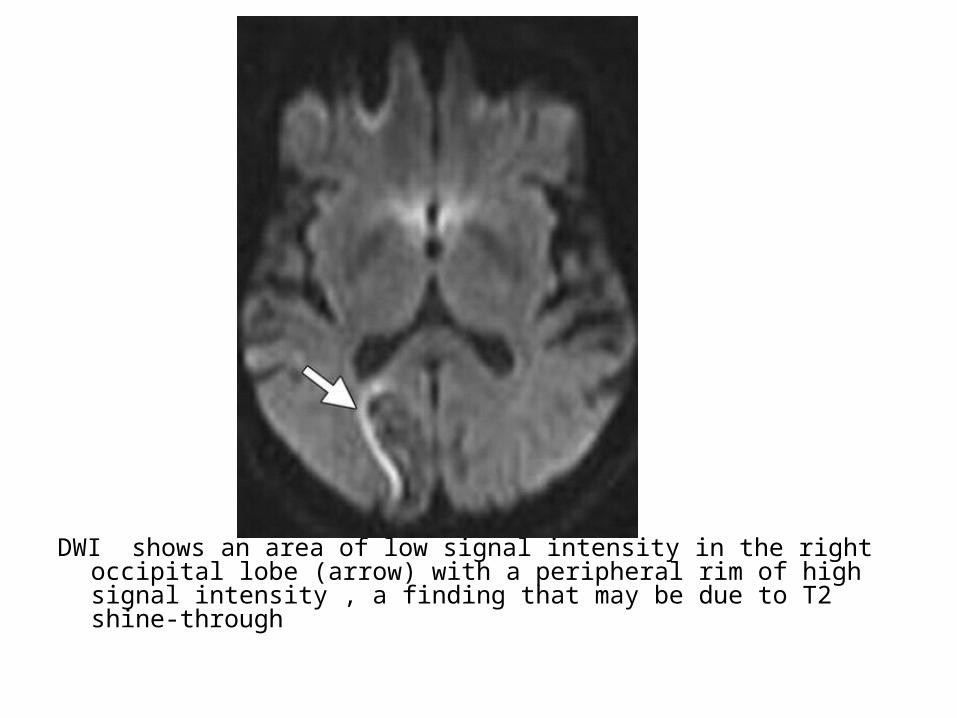
DWI shows an area of low signal intensity in the right occipital lobe (arrow) with a peripheral rim of high signal intensity , a finding that may be due to T2 shine-through
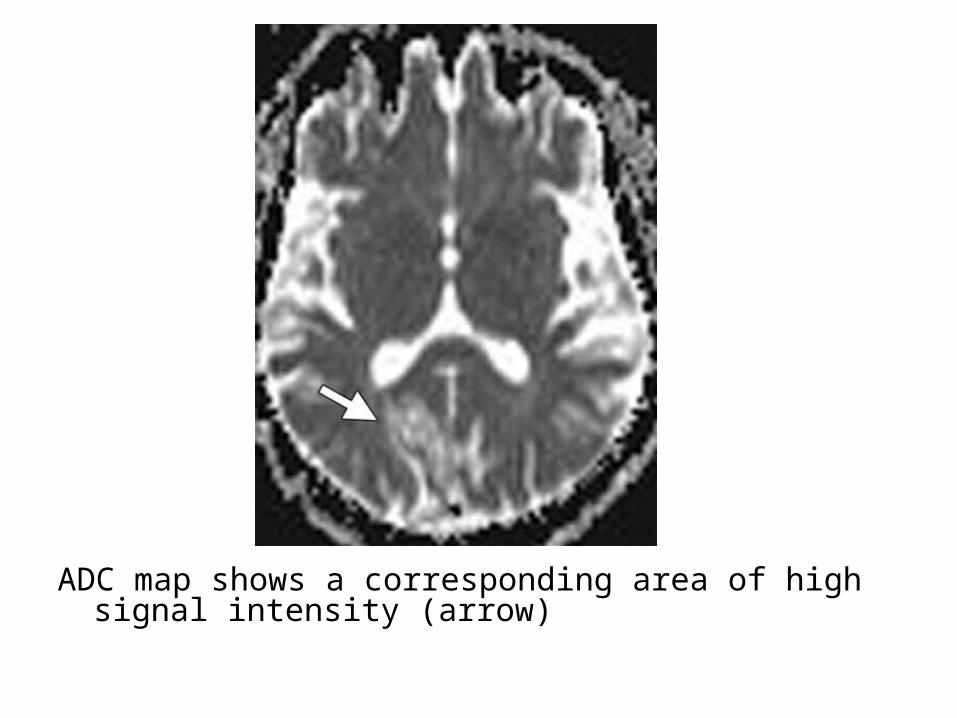
ADC map shows a corresponding area of high signal intensity (arrow)
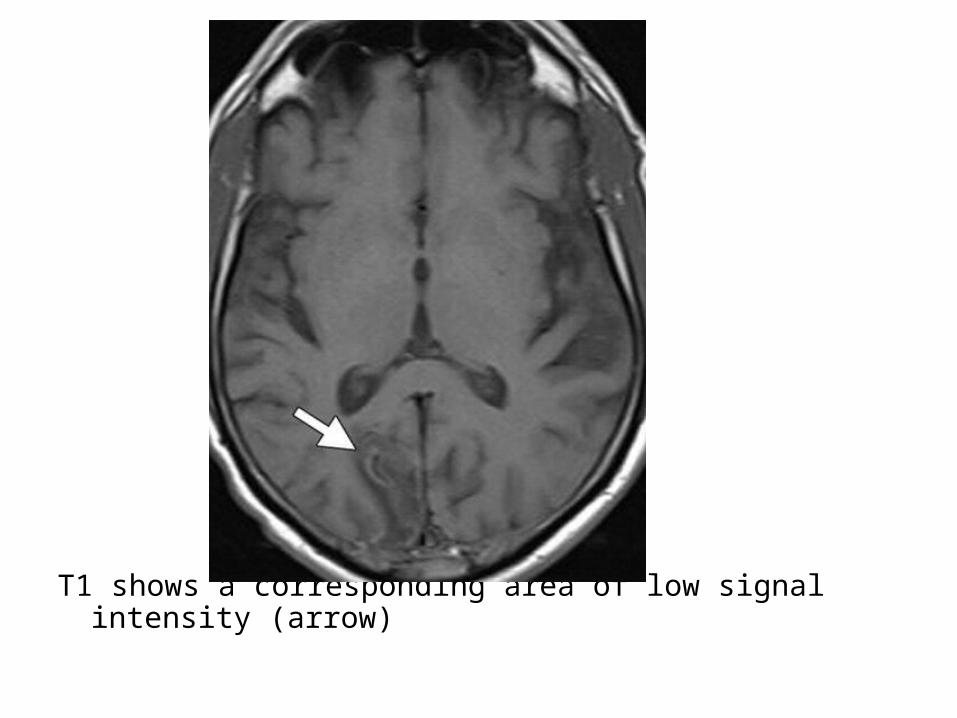
T1 shows a corresponding area of low signal intensity (arrow)
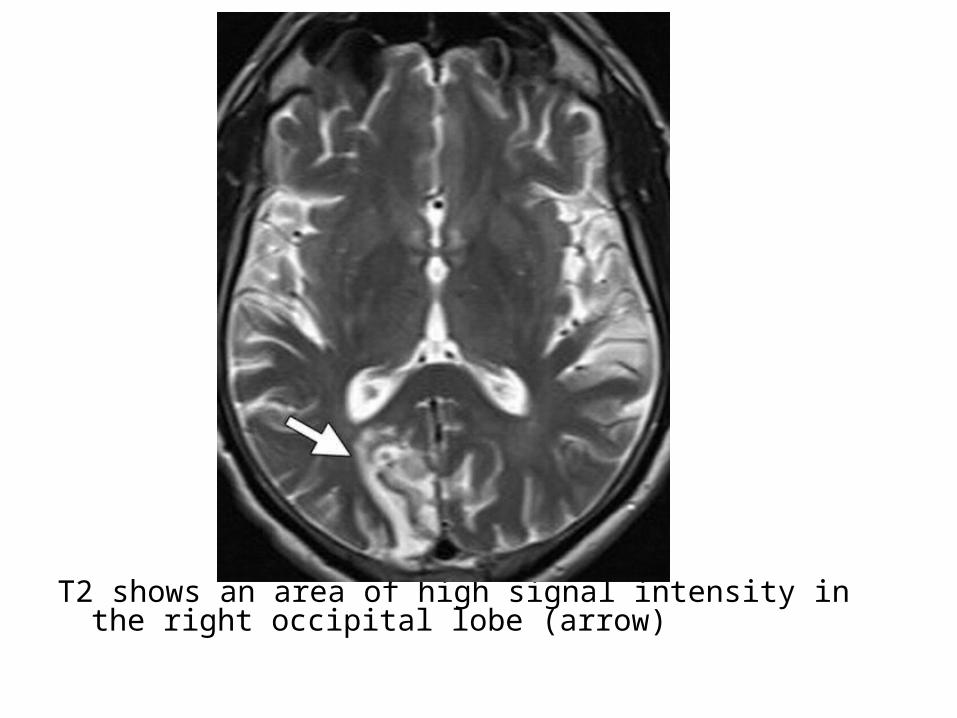
T2 shows an area of high signal intensity in the right occipital lobe (arrow)

T1+C shows a corresponding area of parenchymal enhancement (arrow)
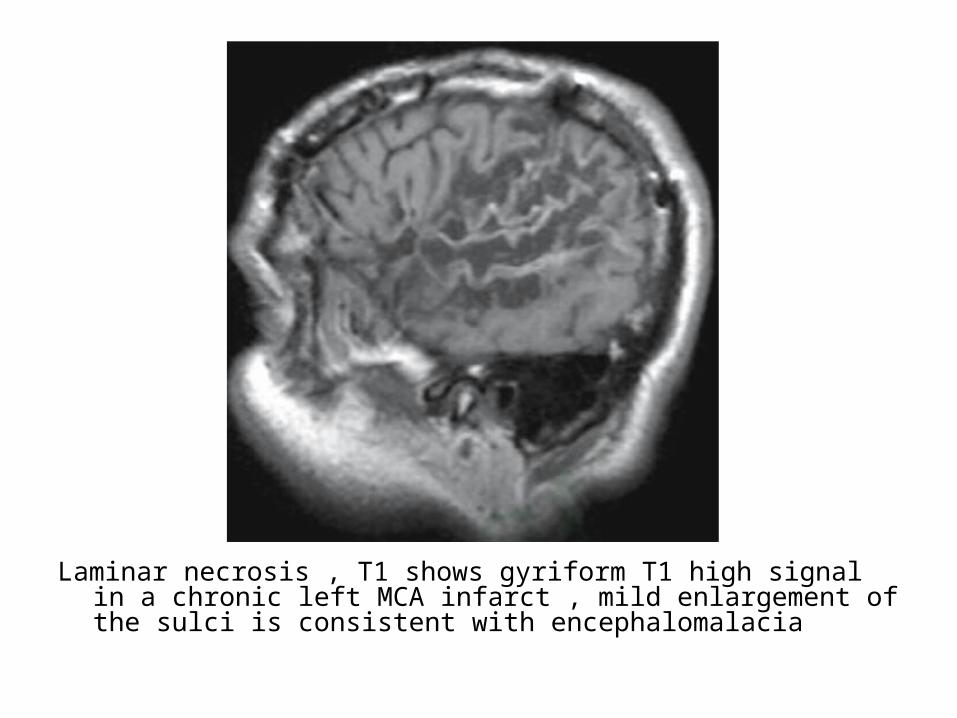
Laminar necrosis , T1 shows gyriform T1 high signal in a chronic left MCA infarct , mild enlargement of the sulci is consistent with encephalomalacia

A : Diffusion with b = 1000 s/mm2 shows a high signal lesion , consistent with acute infarct in the left corona radiata and a low signal area in the right periventricular white matter (arrow), consistent with a chronic infarct, a second low signal lesion is seen anterior to the high-signal area in the left subcortical white matter, B : Diffusion at b = 2500 s/mm2 shows increased contrast of the high signal and two low-signal lesions, C : Diffusion at b = 3000 s/mm2 also shows the high and low signal areas more conspicuously than at b = 1000, D : FLAIR image demonstrating the encephalomalacia and reactive gliosis associated with the two chronic strokes seen as low signal lesions on a diffusion-weighted image, and increased signal in the lesion seen as high signal on a diffusion-weighted image
2-Absent Arterial Flow Void :-An immediate sign of vessel occlusion best seen
on T2W and FLAIR imaging-An occluded vessel returns high signal on these
sequences

Left MCA thrombus , the left MCA shows high signal from an intraluminal clot on FLAIR (a) but low signal on gradient recalled echo (GRE) T2* (b) , this corresponds to a filling defect (arrow) on CT angiogram (c) , asubtle FLAIR high signal is present at the left insula
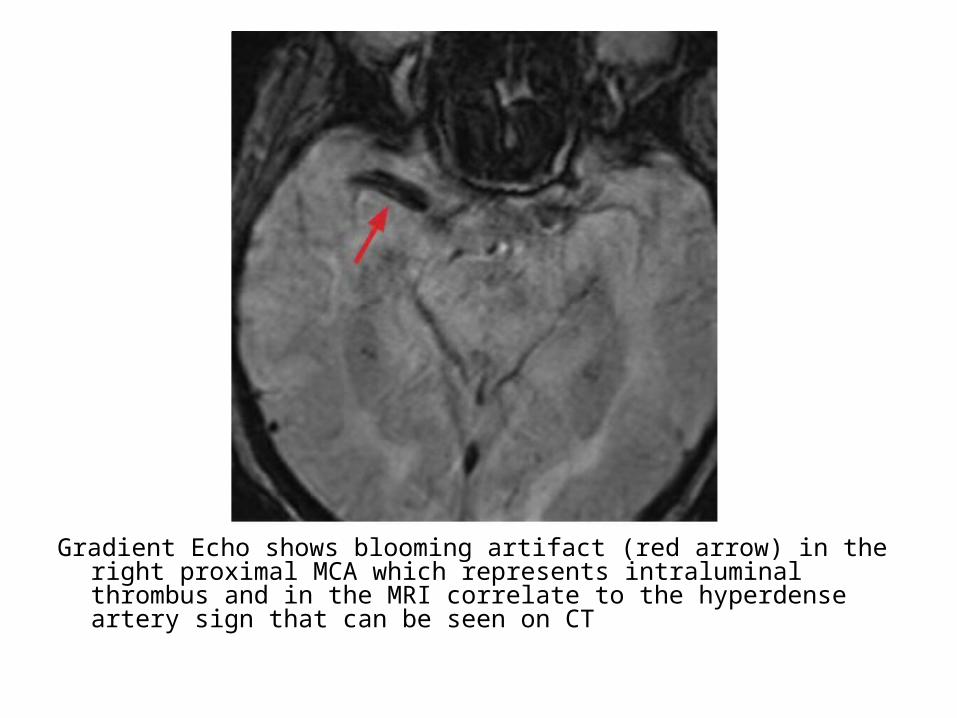
Gradient Echo shows blooming artifact (red arrow) in the right proximal MCA which represents intraluminal thrombus and in the MRI correlate to the hyperdense artery sign that can be seen on CT

Right MCA occlusion , 3D TOF MRA MIP shows absent flow-related enhancement in the right MCA from embolic occlusion
3-Increased T2 Signal :-T2W signal change represents cytotoxic edema
and typically becomes visible by 3-6 hours-The earliest changes are identified within the
grey matter structures , accompanied by a reduction in T1W signal
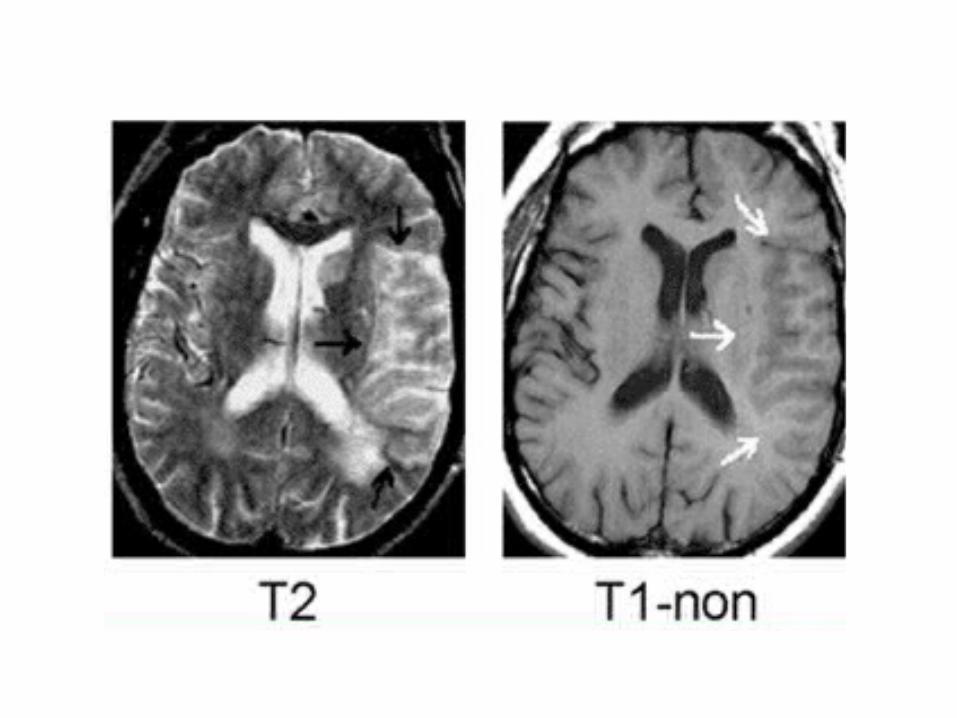
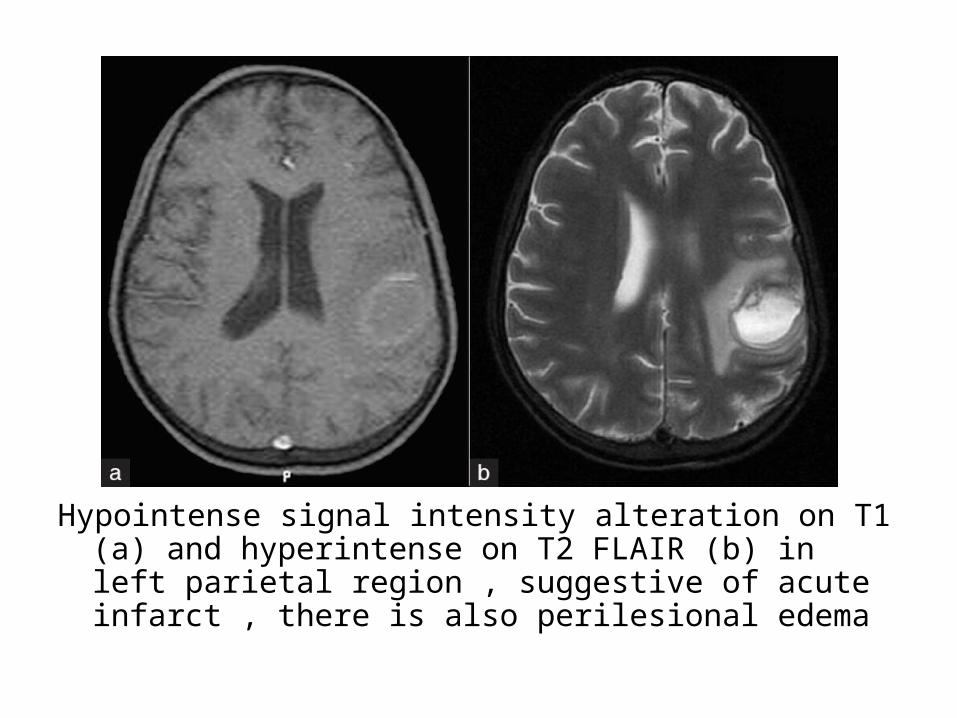
Hypointense signal intensity alteration on T1 (a) and hyperintense on T2 FLAIR (b) in left parietal region , suggestive of acute infarct , there is also perilesional edema

T2 of acute infarct with increased signal involving the right putamen and body and superior head of the caudate sparing the inferior caudate and globus pallidus
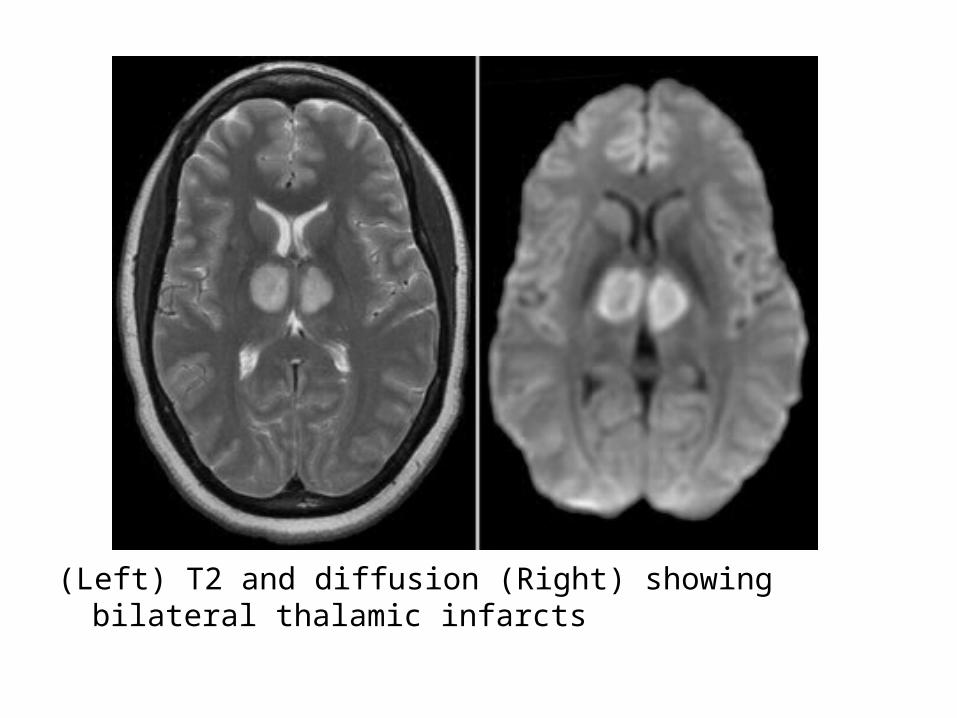
(Left) T2 and diffusion (Right) showing bilateral thalamic infarcts
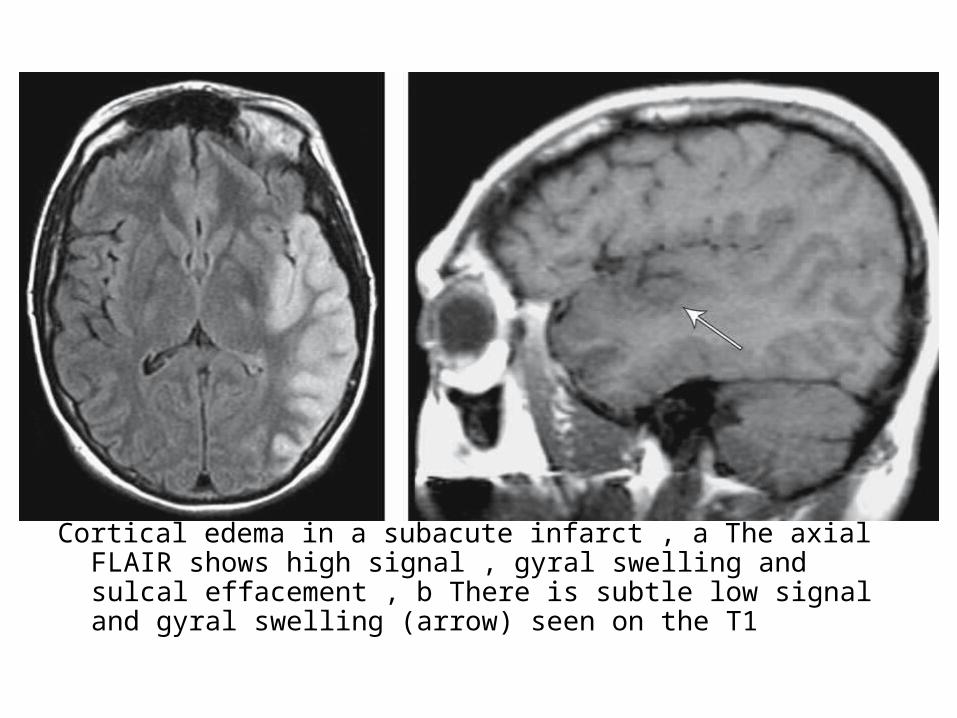
Cortical edema in a subacute infarct , a The axial FLAIR shows high signal , gyral swelling and sulcal effacement , b There is subtle low signal and gyral swelling (arrow) seen on the T1

Axial FLAIR shows geographic T2 prolongation in the RT MCA territory (arrows) involving the RT frontal & temporal lobes & RT basal ganglia , the size of the T2 signal abnormality is less extensive that the infarct size apparent on DWI

4-Mass Effect :-Local effacement of the cerebral sulci and
fissures may be followed by more diffuse brain swelling
-Maximal swelling usually occurs after 3-5 days -Infarcts that do not have a typical appearance
must be differentiated from other solitary intracranial masses (See Before)
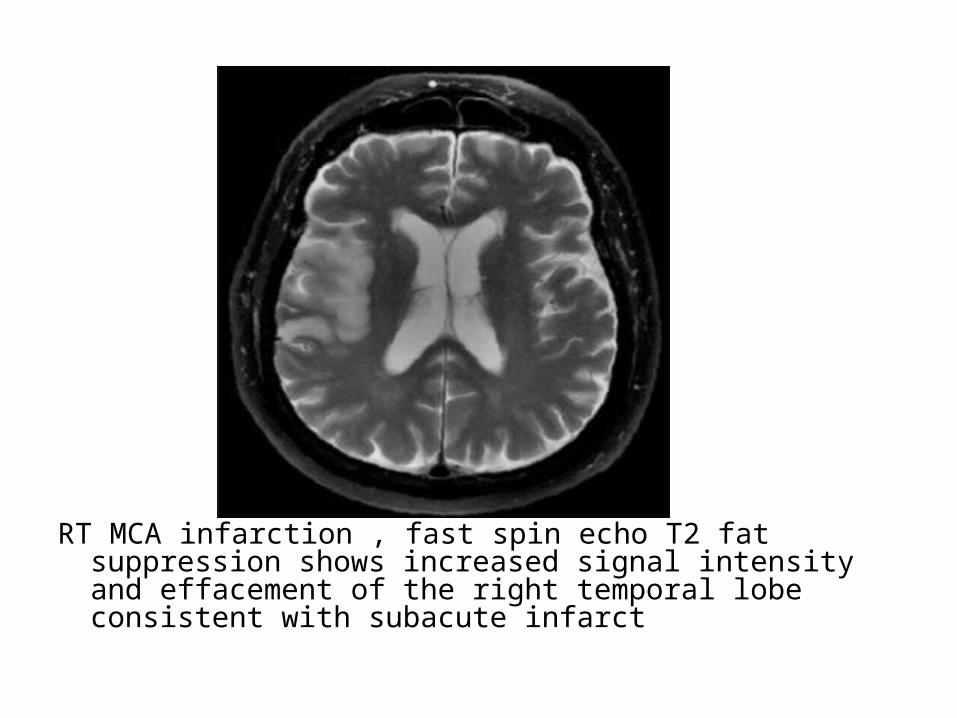
RT MCA infarction , fast spin echo T2 fat suppression shows increased signal intensity and effacement of the right temporal lobe consistent with subacute infarct
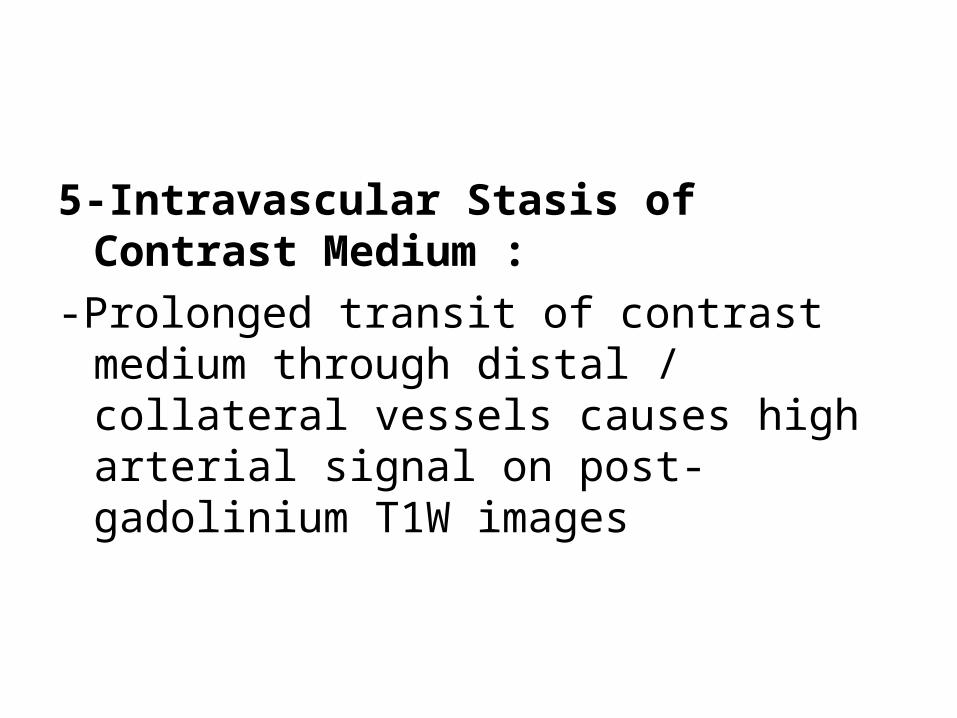
5-Intravascular Stasis of Contrast Medium :-Prolonged transit of contrast medium through
distal / collateral vessels causes high arterial signal on post-gadolinium T1W images

Arterial enhancement from infarct , T1+C shows increased enhancement of the left MCA vessels in this hyperacute infarct
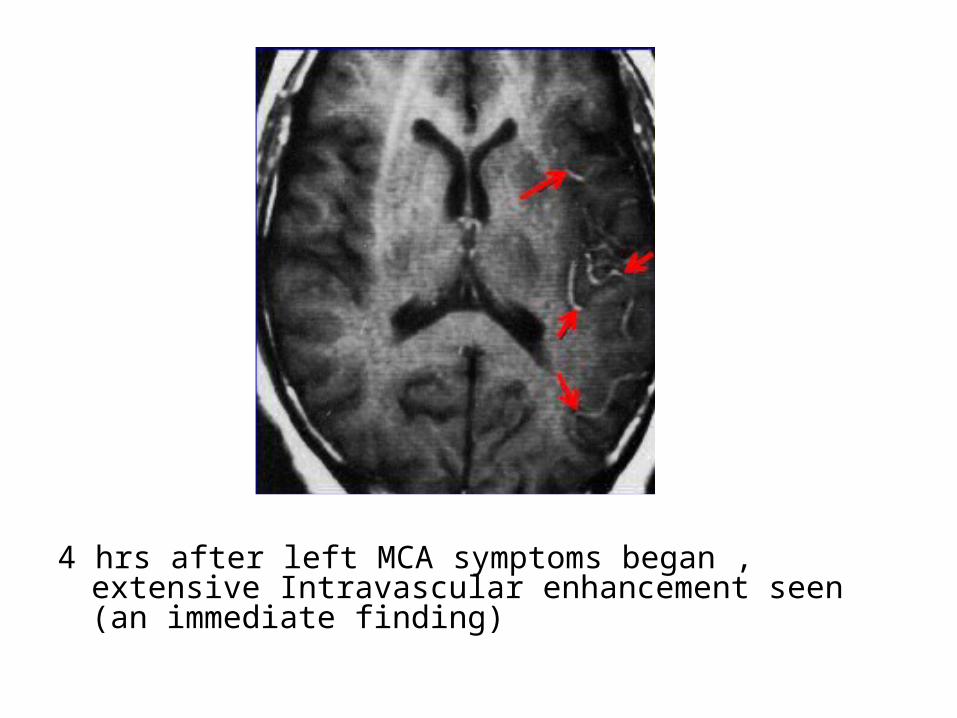
4 hrs after left MCA symptoms began , extensive Intravascular enhancement seen (an immediate finding)
6-Reduced Perfusion :-Contrast-based MRI techniques show a
qualitative fall in brain perfusion within the relevant vascular territory
-Early the process of cerebral ischemia reveals reductions in CBF and CBV and an increase in MTT of blood through the brain

Left: Perfusion-weighted MRI of a patient who presented 1 hour after onset of stroke symptoms
Right: MTT map of the same patient
-Matched diffusion and perfusion abnormalities correlate with the region of infarction and are indicative of permanent neuronal death
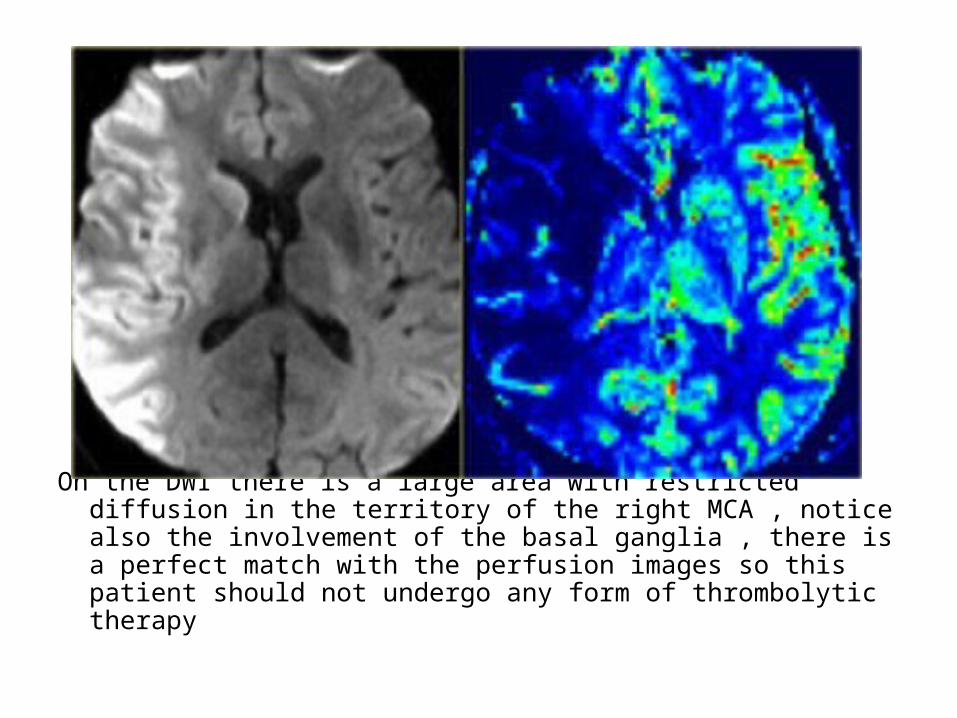
On the DWI there is a large area with restricted diffusion in the territory of the right MCA , notice also the involvement of the basal ganglia , there is a perfect match with the perfusion images so this patient should not undergo any form of thrombolytic therapy

There is a match of DWI and Perfusion , so no therapy
-Mismatched diffusion and perfusion abnormalities with the perfusion abnormality larger than the diffusion abnormality may be indicative of a region of reversible ischemic penumbra , patients with mismatch may be candidates for stroke treatment by thrombolysis

Diffusion-perfusion mismatch in acute ischemic stroke , the perfusion abnormality (right) is larger than the diffusion abnormality (left) indicating the ischemic penumbra which is at risk of infarction

-On the left we first have a diffusion image indicating the area with irreversible changes (dead issue)-In the middle there is a large area with hypoperfusion-On the right the diffusion-perfusion mismatch is indicated in blue , this is the tissue at risk , this is the brain tissue that maybe can be saved with therapy
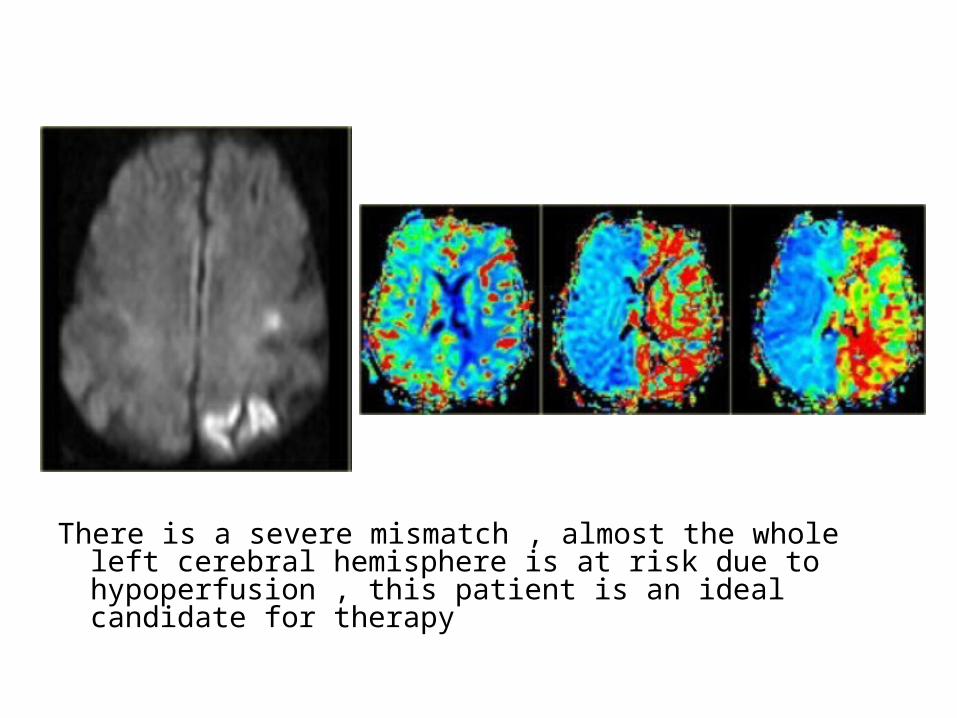
There is a severe mismatch , almost the whole left cerebral hemisphere is at risk due to hypoperfusion , this patient is an ideal candidate for therapy
7-Arterial Occlusion :-MR angiography may demonstrate vessel
stenosis or occlusion -Spontaneous recanalization is a feature of
thromboembolic stroke but may not occur until after a period of irreversible ischaemia

ACA occlusion and infarct , (a) MIP of 3D TOF MRA shows absent flow-related enhancement of the distal A2 segment of the left ACA ,arrow , (b) This corresponds to a focal filling defect on CTA ,arrow) , note that MRA cannot image the slow collateral flow in the distal left ACA , (c) DWI shows the left ACA territory infarct

8-Meningeal Enhancement :-Observed at 24 hours in the meninges adjacent
to an infarct-Parenchymal enhancement is maximal at 4-7
days and is usually gyriform or patchy in appearance

Enhancing infarcts , T1+C shows gyriform enhancement at the left insula and posterior parietal lobe from a subacute left MCA infarct
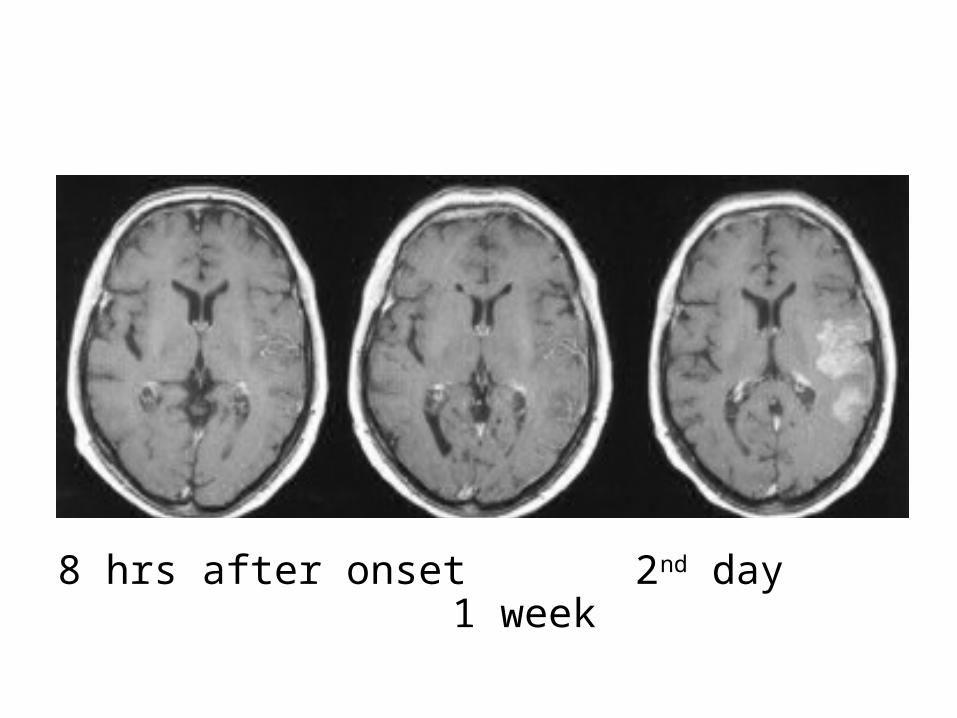
8 hrs after onset 2nd day 1 week
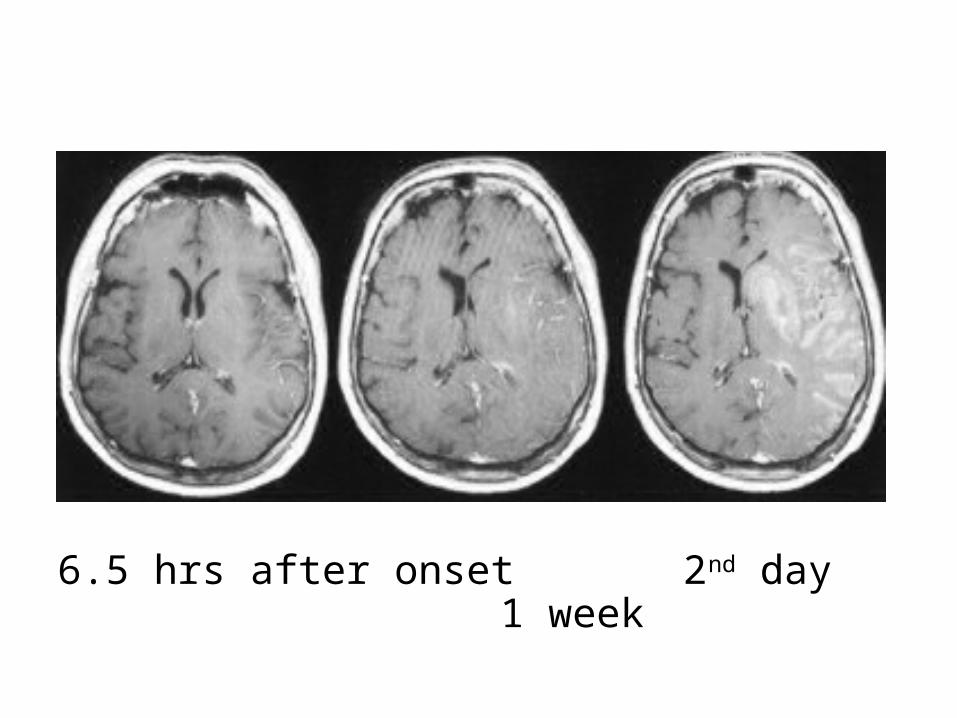
6.5 hrs after onset 2nd day 1 week
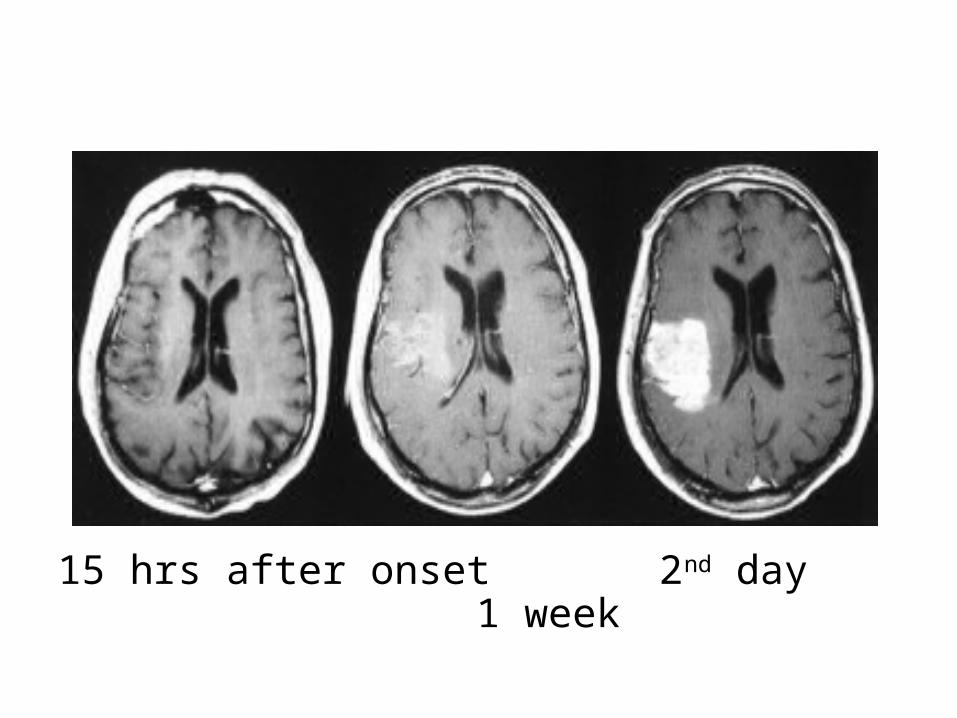
15 hrs after onset 2nd day 1 week
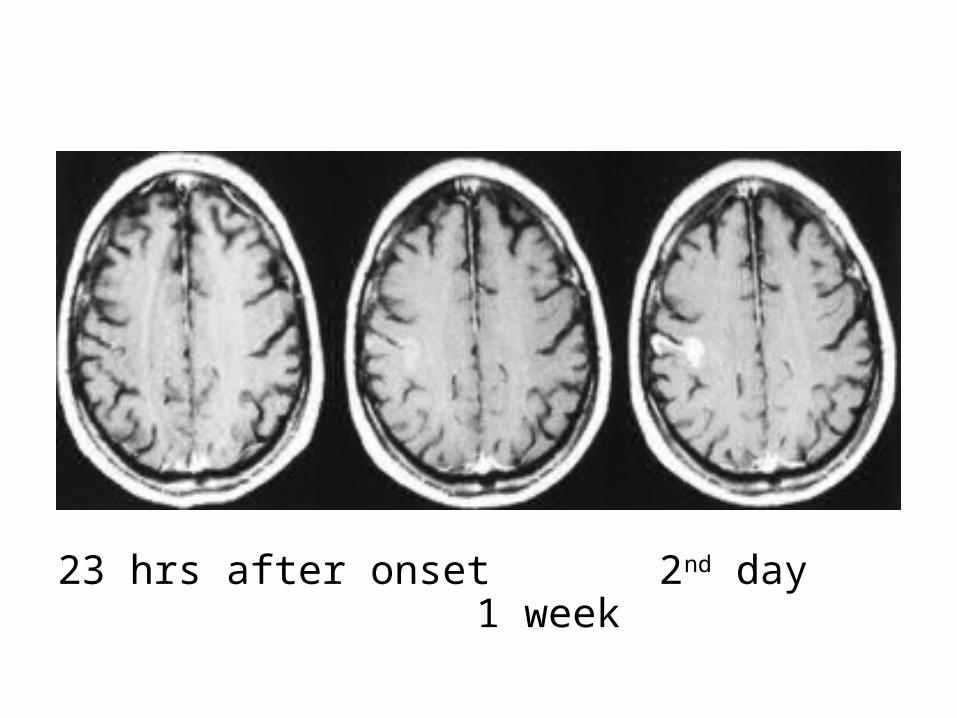
23 hrs after onset 2nd day 1 week

9-Hemorrhage :-Hemorrhagic transformation is a little variably
used and collectively refers to two different processes which have different incidence , appearance and prognostic implications , these are :
a) Petechial hemorrhageb) Intracerebral hematoma
a) Petechial hemorrhages :-Usually appear as the name suggests , as tiny
punctate regions of hemorrhage often not able to be individually resolved but rather resulting in increased attenuation of the region on CT of signal loss on MRI , although this petechial change can result in cortex appearing near normal it should not be confused with the phenomenon of fogging seen on CT which occurs 2 to 3 weeks after infarction

-Petechial hemorrhage typically is more pronounced in grey matter and results in increased attenuation
-This sometimes mimics normal grey matter density and contributes to the phenomenon of fogging
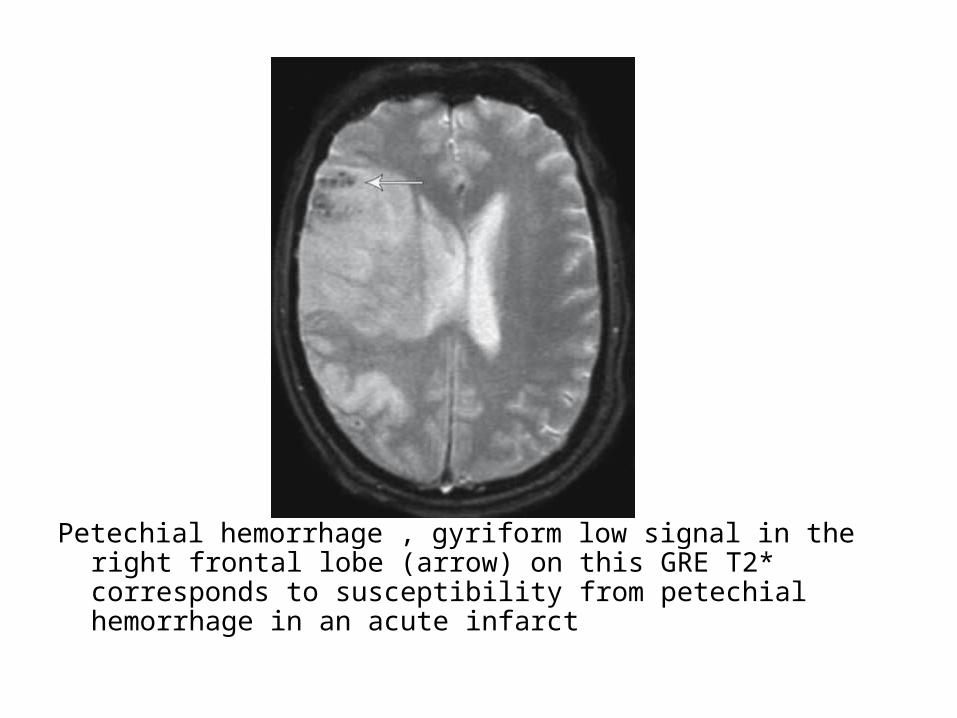
Petechial hemorrhage , gyriform low signal in the right frontal lobe (arrow) on this GRE T2* corresponds to susceptibility from petechial hemorrhage in an acute infarct

Hemosiderin in chronic infarct , the low signal from the gyriform on this GRE T2* at the right frontal lobe is from hemosiderin in an old petechial bleed

N.B. :Fogging Phenomenon -Is seen on non contrast CT of the brain and
represents a transient phase of the evolution of cerebral infarct where the region of cortical infarction regains a near normal appearance
-During the first week following a cortical infarct hypoattenuation and swelling become more marked resulting in significant mass effect and clear demarkation of the infarct with vivid gyral enhancement usually seen at this time
-As time goes on the swelling starts to subside and the cortex begins to increase in attenuation , this is believed to occur as the result of migration into the infarcted tissue of lipid-laden macrophages as well as proliferation of capillaries and decrease in the amount of edema
-After 2 to 3 weeks following an infarct the cortex regains near-normal density and imaging at this time can lead to confusion or missed diagnosis
-Fogging has been demonstrated in around 50% of cases
-If in doubt the administration of IV contrast will demarcate the region of infarction
-A similar phenomenon is also seen on T2 weighted sequences on MRI of the brain and is believed to be due to similar cellular processes, as the timing is similar , it has been found to occur in approximately 50% of patients between 6 and 36 days (median 10 days) after onset of infarction

2 Days post onset of symptoms 9 days post onset of symptoms

b) In the case of secondary hematomas :-The radiographic features on both CT and MRI are
merely a summation of the features of a ischemic infarct with superimposed cerebral hemorrhage
-The amount of hemorrhage relative the size of the infarct can vary widely but usually it is possible to identify significant areas of the brain which are infarcted but not hemorrhagic
-This may not be the case if the hemorrhage is large and the underlying infarct small
-By the time secondary hematomas form , the underlying infarct should be easily seen and will appear as a region of low attenuation involving both the white matter and the overlying cortex
-Hemorrhage is often patchy , scattered throughout the infarcted tissue and usually represents only a small component of the abnormal tissue
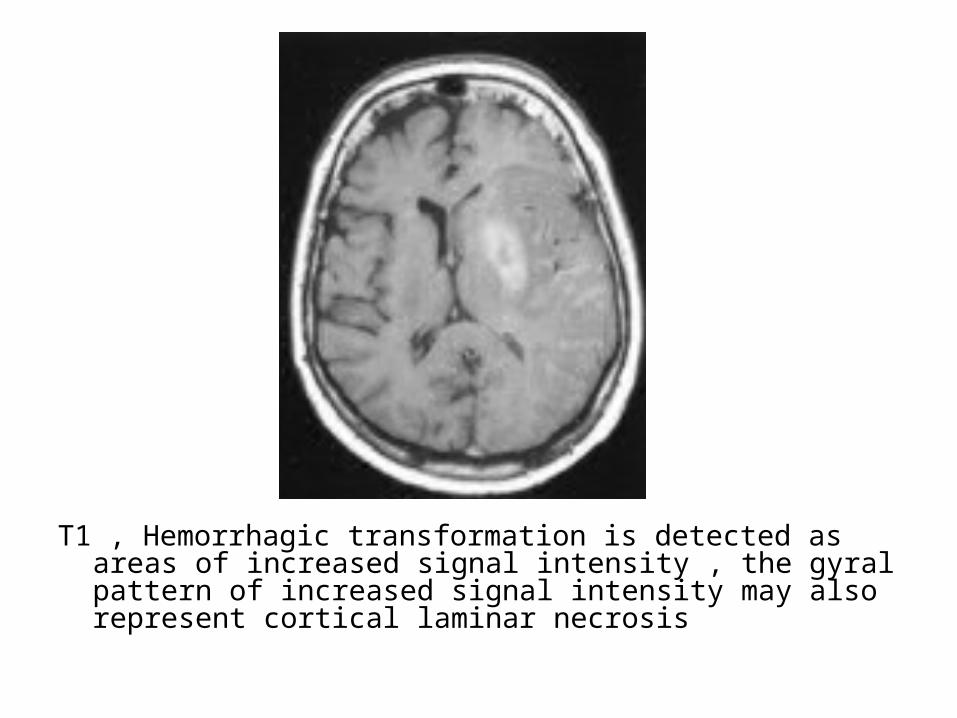
T1 , Hemorrhagic transformation is detected as areas of increased signal intensity , the gyral pattern of increased signal intensity may also represent cortical laminar necrosis
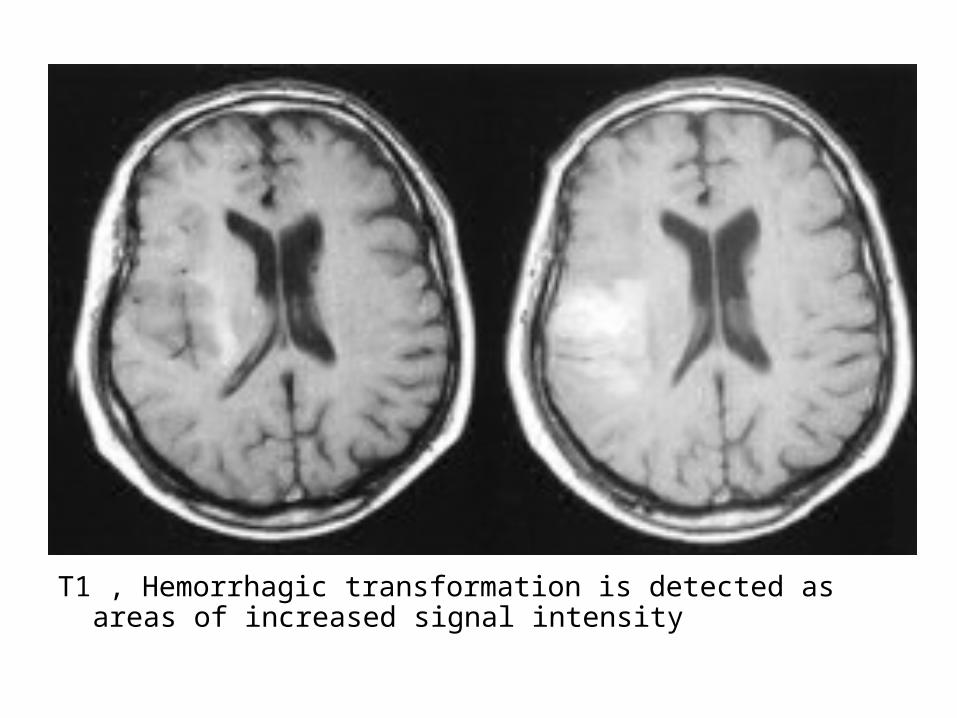
T1 , Hemorrhagic transformation is detected as areas of increased signal intensity

10-Wallerian Degeneration :a) Incidenceb) Radiographic Features
a) Incidence :-Appears in the chronic phase of cerebral
infarction (> 30 days)-Frequently observed in the corticospinal tract
following infarction of the motor cortex or internal capsule
-After ischaemic stroke it usually takes two to four weeks before WD can be detected by conventional MRI
c) Radiographic Features :-Hyperintensity on T2-weighted images along the affected tracts-Conventional MRI depict WD when sufficiently large bundles of
fibers are involved along the corticospinal tract , the corpus callosum , fibers of the optic radiations , fornices and cerebellar peduncles
-The most common observations regard the corticospinal tract-WD of cerebellar peduncles is rarely described , It usually
involves the middle ones because they are largest and the main path for pontocerebellar tracts
-Shows diffusion restriction
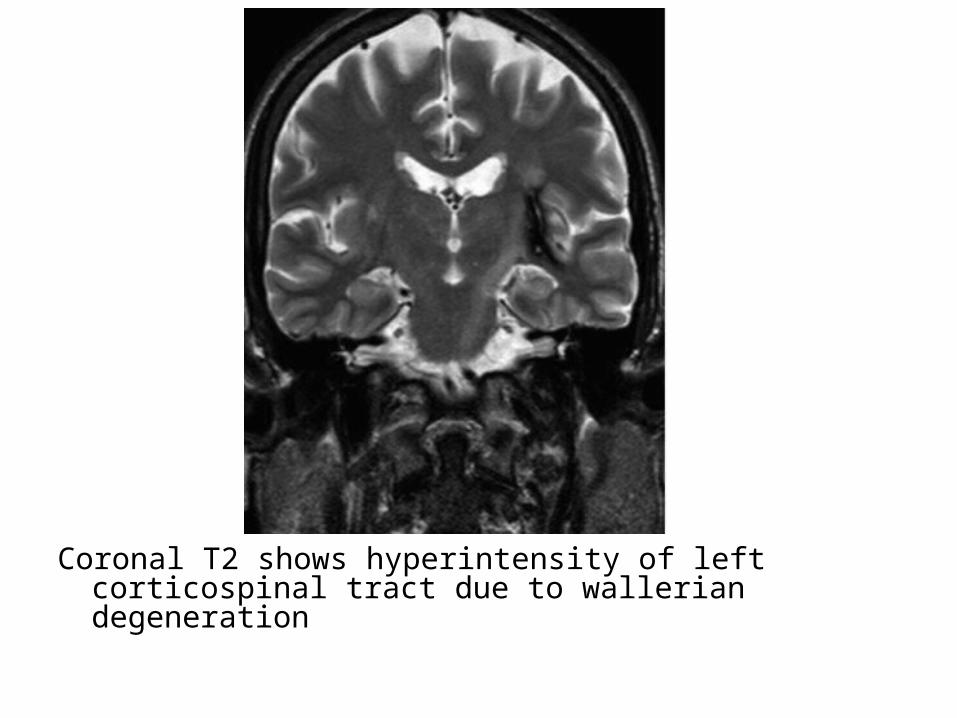
Coronal T2 shows hyperintensity of left corticospinal tract due to wallerian degeneration

Axial T2 shows Bilateral and symmetric hyperintensities of pontocerebellar tract (arrows)
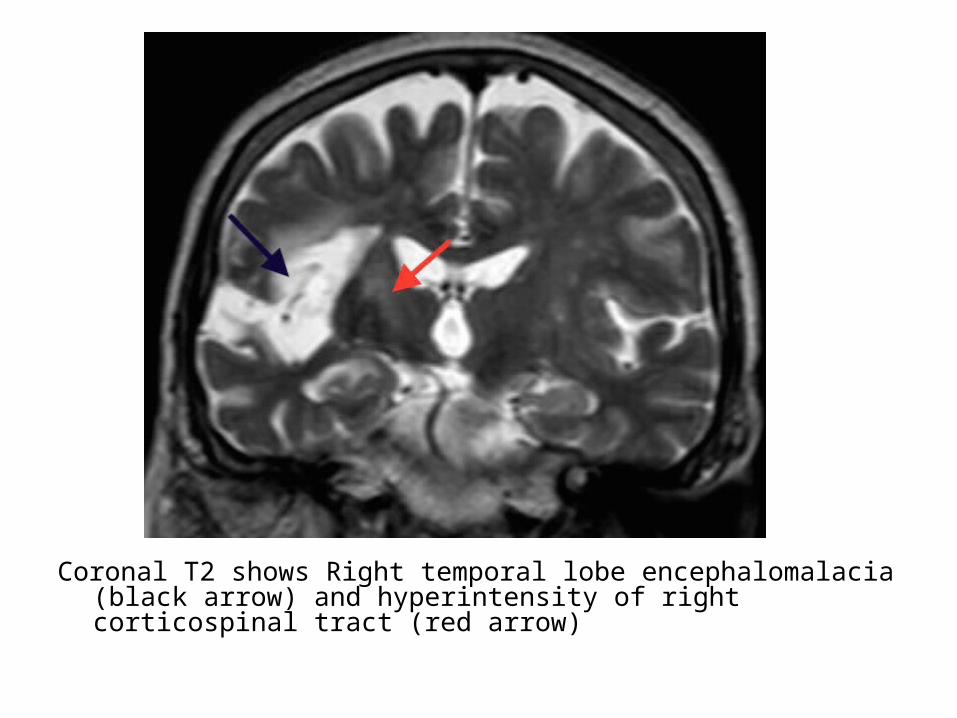
Coronal T2 shows Right temporal lobe encephalomalacia (black arrow) and hyperintensity of right corticospinal tract (red arrow)

Coronal T2 shows encephalomalacia of the right frontal and temporal lobes and T2 high signal extending into the right cerebral peduncle (arrow) from Wallerian degeneration

Axial T2 shows hyperintense signal in pons due to chronic infarct and bilateral- symmetrical hyperintense signal in pontocerebellar tracts due to WD
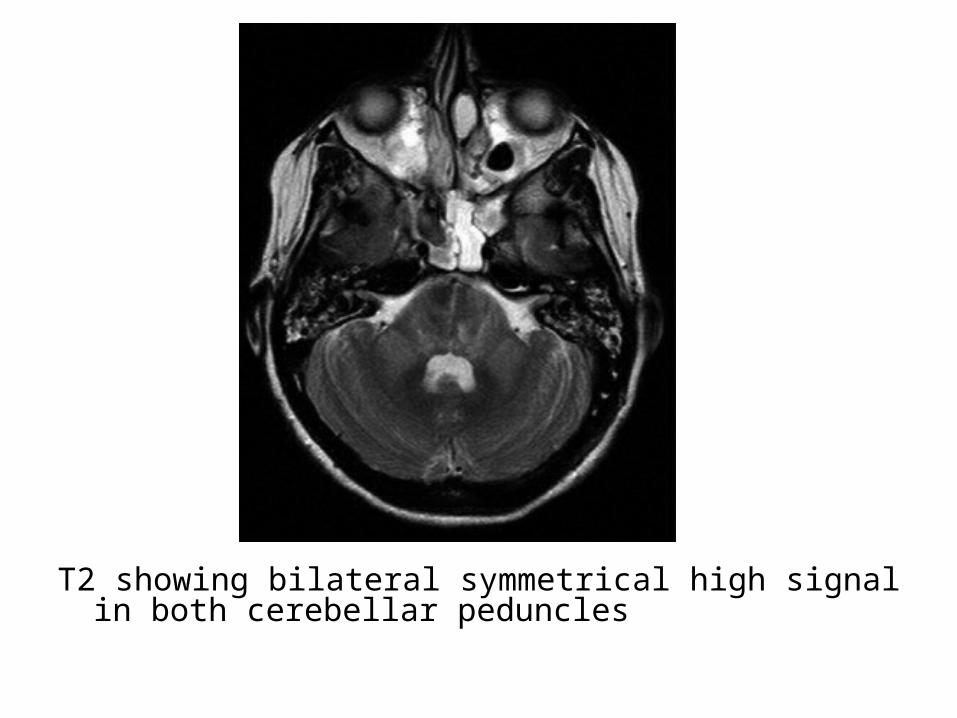
T2 showing bilateral symmetrical high signal in both cerebellar peduncles
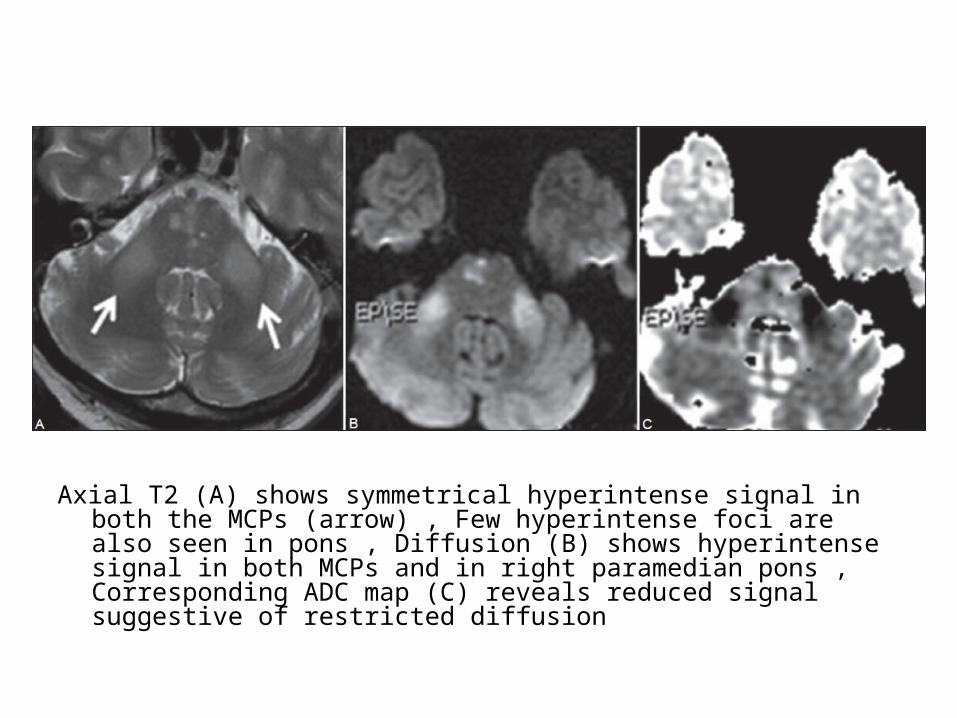
Axial T2 (A) shows symmetrical hyperintense signal in both the MCPs (arrow) , Few hyperintense foci are also seen in pons , Diffusion (B) shows hyperintense signal in both MCPs and in right paramedian pons , Corresponding ADC map (C) reveals reduced signal suggestive of restricted diffusion
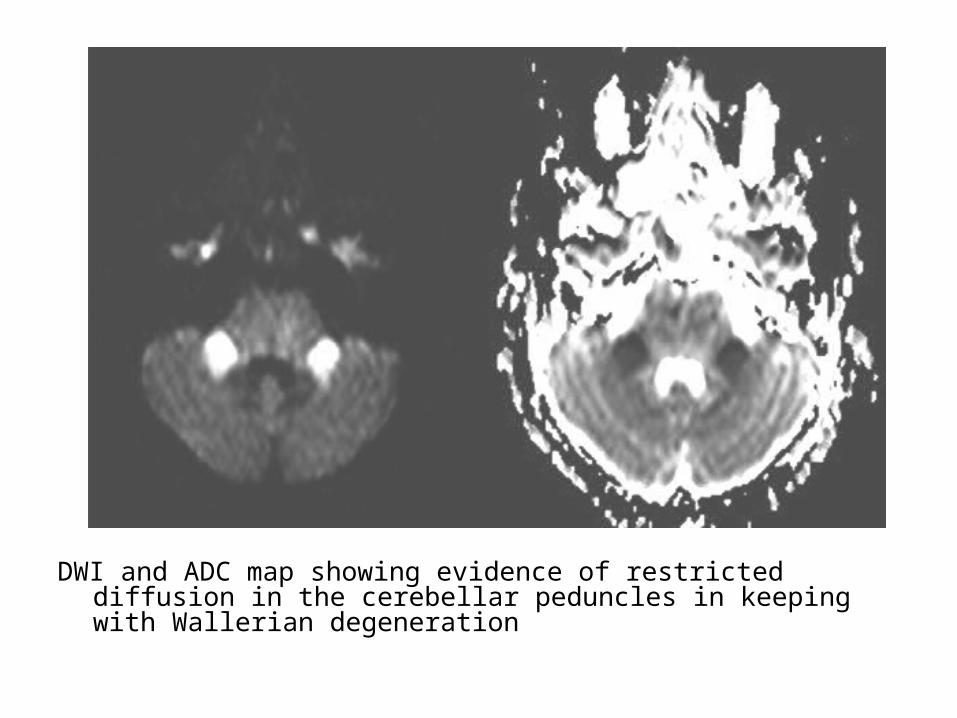
DWI and ADC map showing evidence of restricted diffusion in the cerebellar peduncles in keeping with Wallerian degeneration
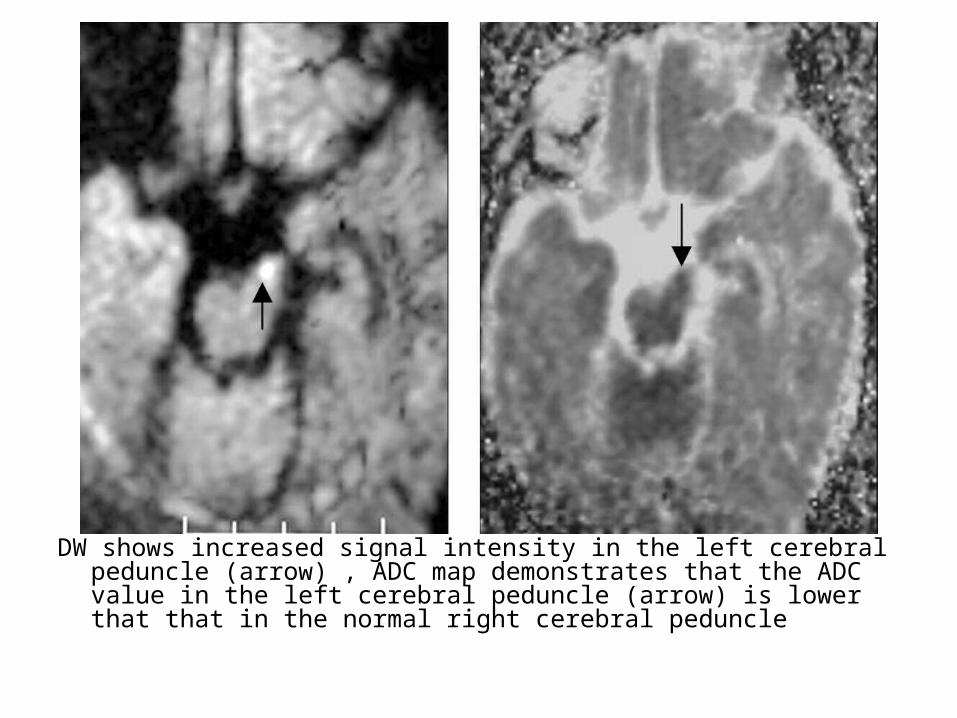
DW shows increased signal intensity in the left cerebral peduncle (arrow) , ADC map demonstrates that the ADC value in the left cerebral peduncle (arrow) is lower that that in the normal right cerebral peduncle
*N.B. :Differentiation between Infarct & Tumor1-Clinical History 2-Distribution3-Shape4-Tissue Involvement5-Advanced Imaging Techniques
1-Clinical History :-Abrupt versus gradual onset and development of
symptoms
2-Distribution :-Tumors not confined to vascular territory
3-Shape :-Infarcts usually wedge shaped with base at
periphery , tumors tend to be spherical / ovoid
4-Tissue Involvement :-Infarcts involve grey and white matter -Most metastases or higher grade gliomas
involve white matter primarily-Lower grade primary tumors may involve grey
matter

5-Advanced Imaging Techniques :-Such as DWI or MR spectroscopy may be useful
in cases that remain unclear on standard sequences
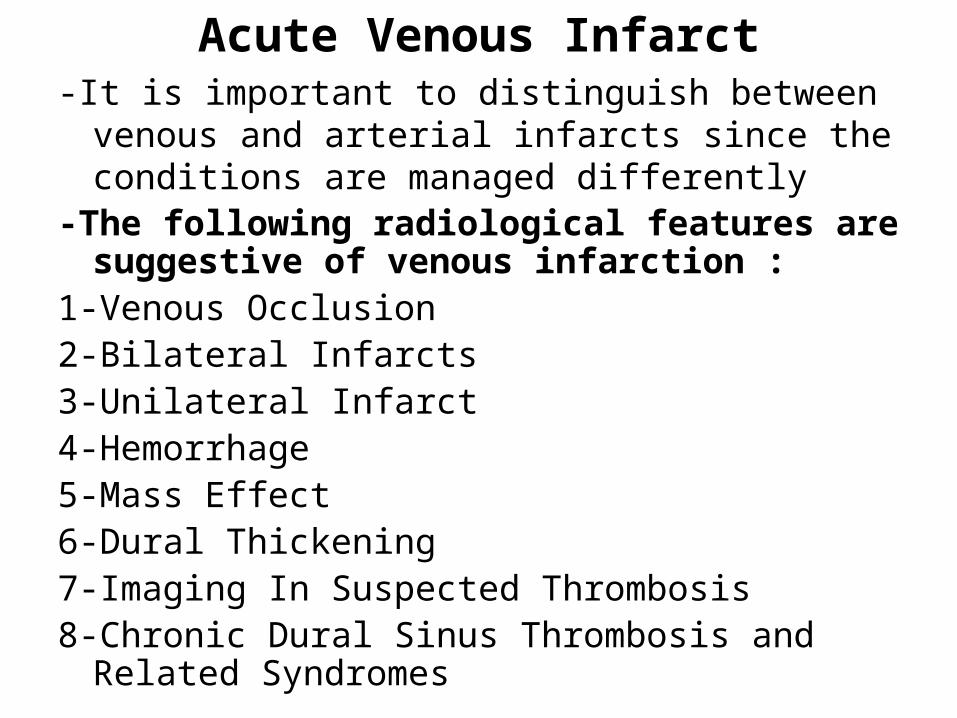
Acute Venous Infarct-It is important to distinguish between venous and
arterial infarcts since the conditions are managed differently
-The following radiological features are suggestive of venous infarction :
1-Venous Occlusion2-Bilateral Infarcts3-Unilateral Infarct4-Hemorrhage5-Mass Effect6-Dural Thickening7-Imaging In Suspected Thrombosis8-Chronic Dural Sinus Thrombosis and Related
Syndromes
Venous Anatomy a) Dural Sinusesb) Deep Cerebral Veinsc) Superficial Cerebral Veins
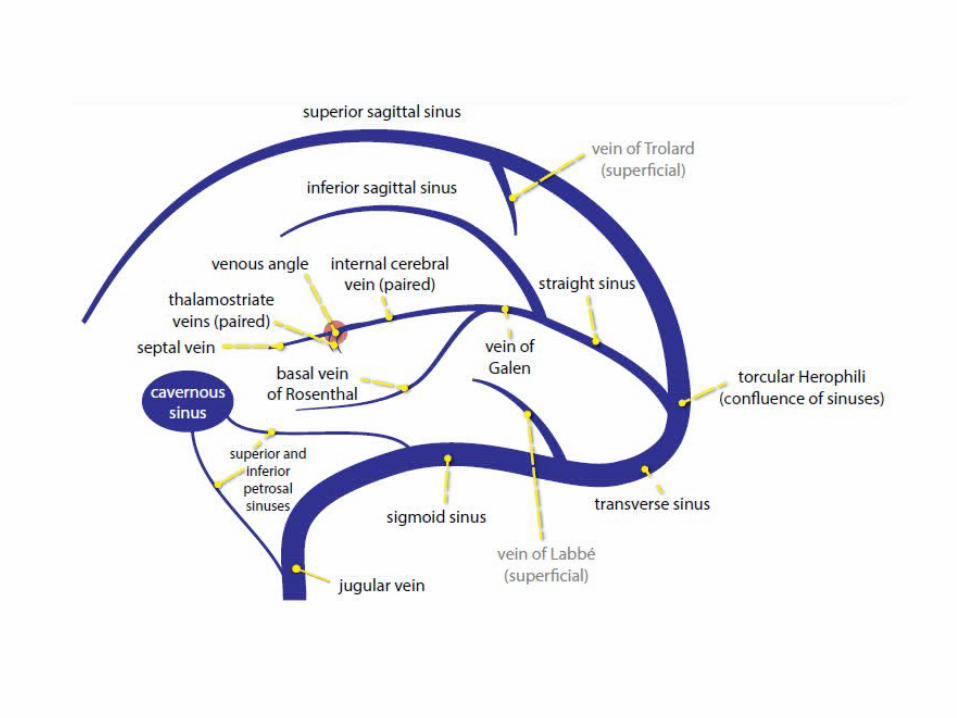
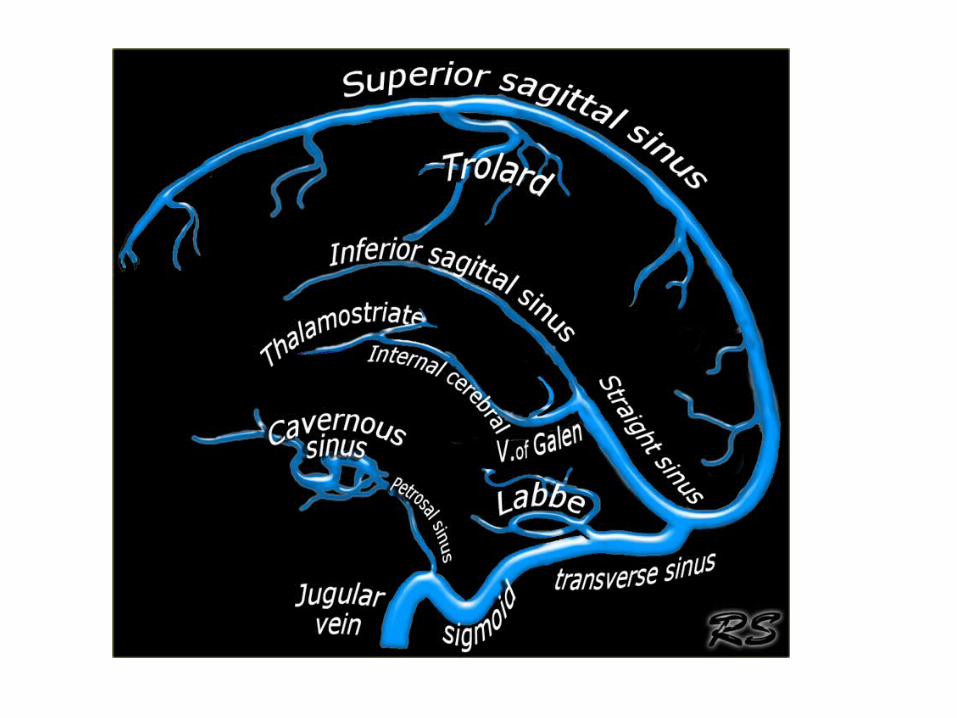
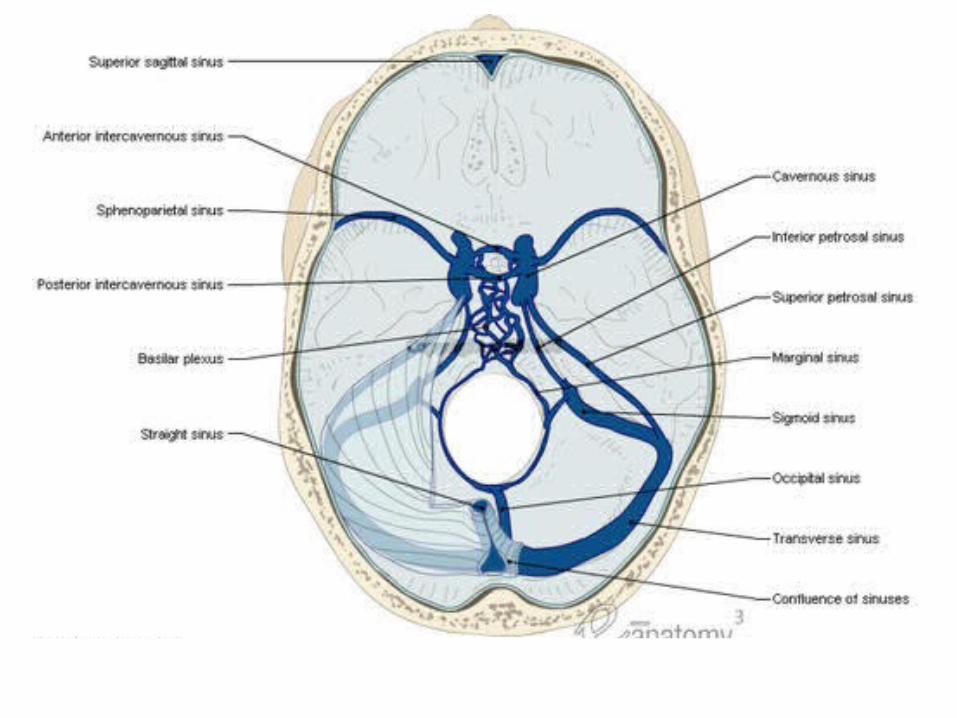
a) Dural Sinuses :-The superior sagittal sinus (SSS) & its tributaries
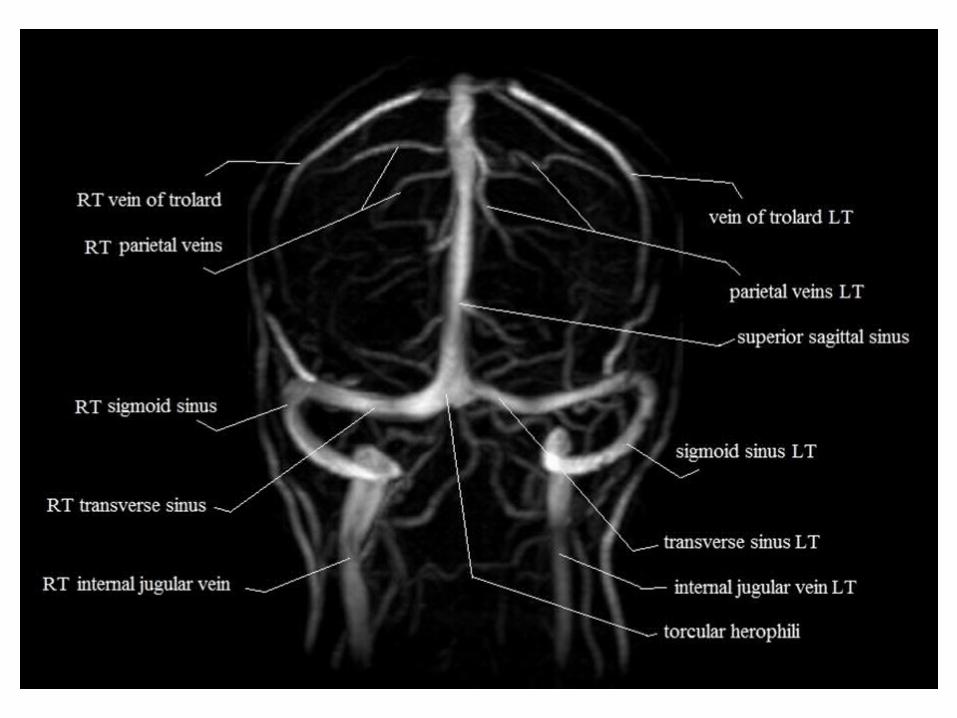
drains the motor & sensory strips-The paired transverse sinuses are usually
asymmetric , with the left transverse sinus often hypoplastic
-The sigmoid sinus connects to the jugular bulb-Te torcular herophili is the confluence of the
SSS , the transverse sinus & the straight sinus
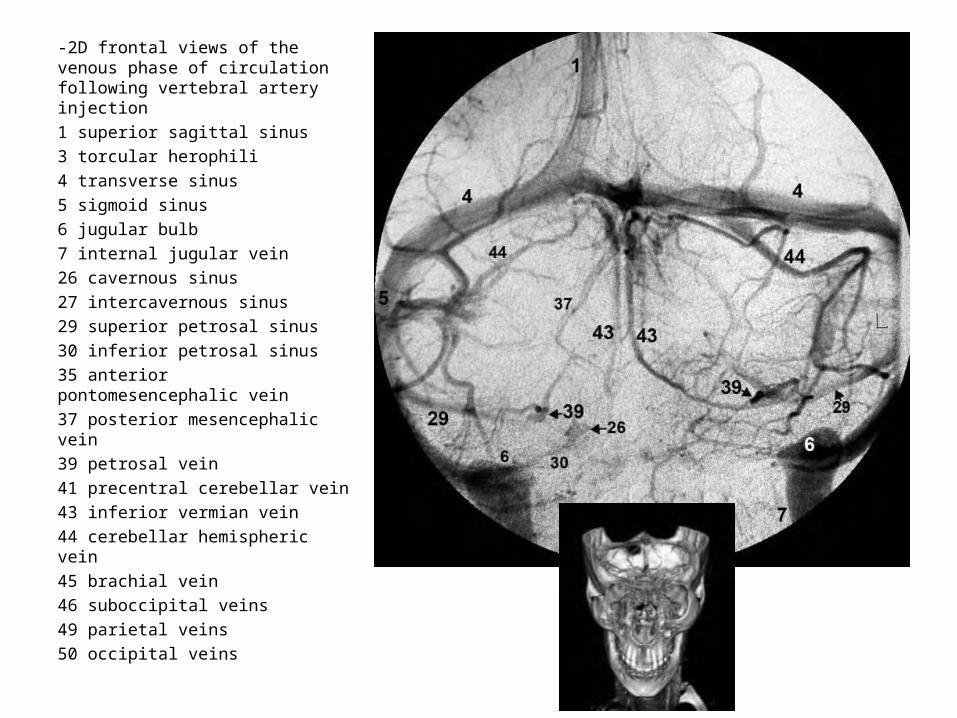
-2D frontal views of the venous phase of circulation following vertebral artery injection1 superior sagittal sinus3 torcular herophili4 transverse sinus5 sigmoid sinus6 jugular bulb7 internal jugular vein26 cavernous sinus27 intercavernous sinus29 superior petrosal sinus30 inferior petrosal sinus35 anterior pontomesencephalic vein37 posterior mesencephalic vein39 petrosal vein41 precentral cerebellar vein43 inferior vermian vein44 cerebellar hemispheric vein45 brachial vein46 suboccipital veins49 parietal veins50 occipital veins
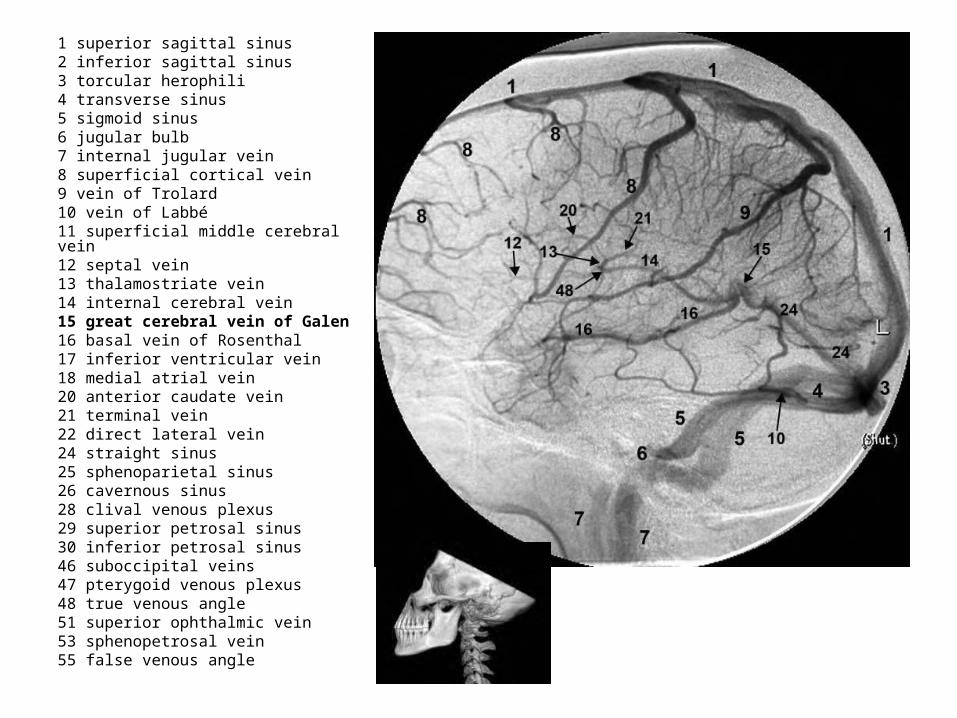
1 superior sagittal sinus2 inferior sagittal sinus3 torcular herophili4 transverse sinus5 sigmoid sinus6 jugular bulb7 internal jugular vein8 superficial cortical vein9 vein of Trolard10 vein of Labbé11 superficial middle cerebral vein12 septal vein13 thalamostriate vein14 internal cerebral vein15 great cerebral vein of Galen16 basal vein of Rosenthal17 inferior ventricular vein18 medial atrial vein20 anterior caudate vein21 terminal vein22 direct lateral vein24 straight sinus25 sphenoparietal sinus26 cavernous sinus28 clival venous plexus29 superior petrosal sinus30 inferior petrosal sinus46 suboccipital veins47 pterygoid venous plexus48 true venous angle51 superior ophthalmic vein53 sphenopetrosal vein55 false venous angle
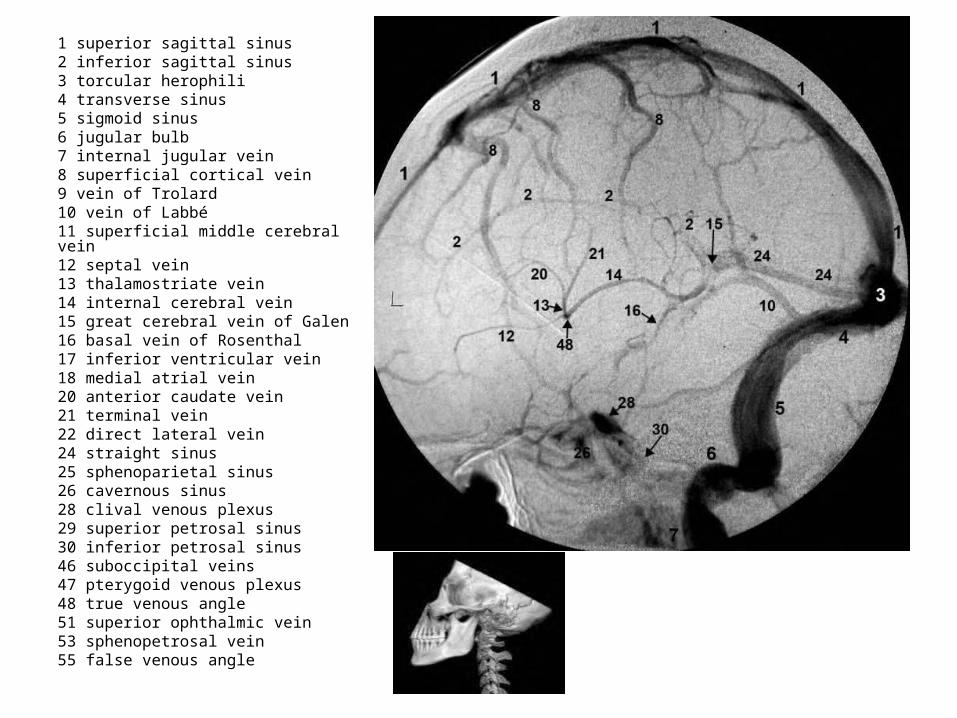
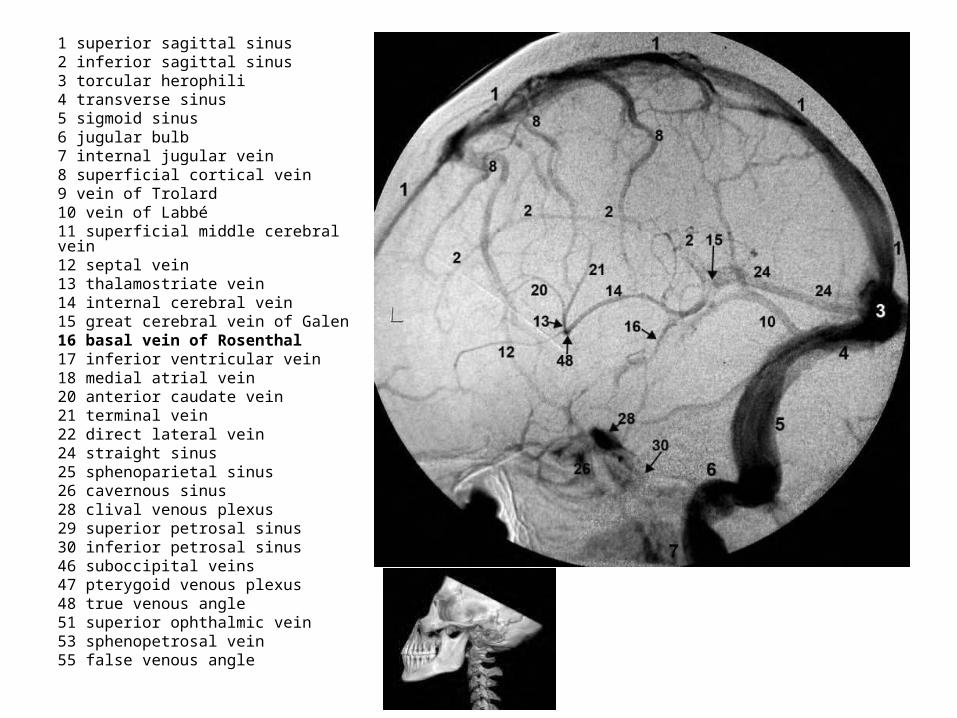
b) Deep Cerebral Veins :-Consist of paired internal cerebral veins , the
basal vein of Rosenthal & the vein of Galen-The venous angle is the intersection of the
septal vein & the thalamostriate veins , the venous angle is the angiographic mark for the foramen of Monro


1 superior sagittal sinus2 inferior sagittal sinus3 torcular herophili4 transverse sinus5 sigmoid sinus6 jugular bulb7 internal jugular vein8 superficial cortical vein9 vein of Trolard10 vein of Labbé11 superficial middle cerebral vein12 septal vein13 thalamostriate vein14 internal cerebral vein15 great cerebral vein of Galen16 basal vein of Rosenthal17 inferior ventricular vein18 medial atrial vein20 anterior caudate vein21 terminal vein22 direct lateral vein24 straight sinus25 sphenoparietal sinus26 cavernous sinus28 clival venous plexus29 superior petrosal sinus30 inferior petrosal sinus46 suboccipital veins47 pterygoid venous plexus48 true venous angle51 superior ophthalmic vein53 sphenopetrosal vein55 false venous angle

-2D frontal views of thevenous phase of circulation followingcarotid artery injection1 superior sagittal sinus3 torcular herophili4 transverse sinus5 sigmoid sinus6 jugular bulb7 internal jugular vein8 superficial cortical veins9 vein of Trolard10 vein of Labbé11 superficial middle cerebral vein12 septal vein13 thalamostriate vein14 internal cerebral vein16 basal vein of Rosenthal24 straight sinus25 sphenoparietal sinus26 cavernous sinus27 intercavernous sinus29 superior petrosal sinus30 inferior petrosal sinus31 occipital sinus56 insular vein57 deep middle cerebral vein
1 superior sagittal sinus2 inferior sagittal sinus3 torcular herophili4 transverse sinus5 sigmoid sinus6 jugular bulb7 internal jugular vein8 superficial cortical vein9 vein of Trolard10 vein of Labbé11 superficial middle cerebral vein12 septal vein13 thalamostriate vein14 internal cerebral vein15 great cerebral vein of Galen16 basal vein of Rosenthal17 inferior ventricular vein18 medial atrial vein20 anterior caudate vein21 terminal vein22 direct lateral vein24 straight sinus25 sphenoparietal sinus26 cavernous sinus28 clival venous plexus29 superior petrosal sinus30 inferior petrosal sinus46 suboccipital veins47 pterygoid venous plexus48 true venous angle51 superior ophthalmic vein53 sphenopetrosal vein55 false venous angle
1 superior sagittal sinus2 inferior sagittal sinus3 torcular herophili4 transverse sinus5 sigmoid sinus6 jugular bulb7 internal jugular vein8 superficial cortical vein9 vein of Trolard10 vein of Labbé11 superficial middle cerebral vein12 septal vein13 thalamostriate vein14 internal cerebral vein15 great cerebral vein of Galen16 basal vein of Rosenthal17 inferior ventricular vein18 medial atrial vein20 anterior caudate vein21 terminal vein22 direct lateral vein24 straight sinus25 sphenoparietal sinus26 cavernous sinus28 clival venous plexus29 superior petrosal sinus30 inferior petrosal sinus46 suboccipital veins47 pterygoid venous plexus48 true venous angle51 superior ophthalmic vein53 sphenopetrosal vein55 false venous angle
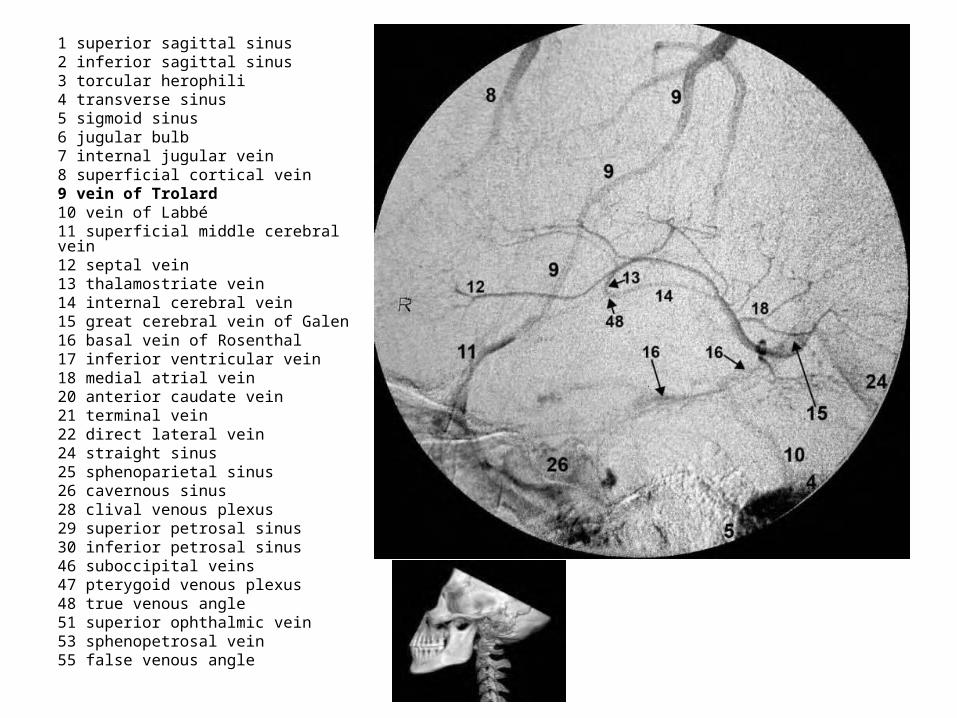
c) Superficial Cerebral Veins :-The vein of Trolard connects superficial cortical
veins to the SSS-The vein of Labbe drains the temporal
convexity into the transverse or sigmoid sinus
1 superior sagittal sinus2 inferior sagittal sinus3 torcular herophili4 transverse sinus5 sigmoid sinus6 jugular bulb7 internal jugular vein8 superficial cortical vein9 vein of Trolard10 vein of Labbé11 superficial middle cerebral vein12 septal vein13 thalamostriate vein14 internal cerebral vein15 great cerebral vein of Galen16 basal vein of Rosenthal17 inferior ventricular vein18 medial atrial vein20 anterior caudate vein21 terminal vein22 direct lateral vein24 straight sinus25 sphenoparietal sinus26 cavernous sinus28 clival venous plexus29 superior petrosal sinus30 inferior petrosal sinus46 suboccipital veins47 pterygoid venous plexus48 true venous angle51 superior ophthalmic vein53 sphenopetrosal vein55 false venous angle
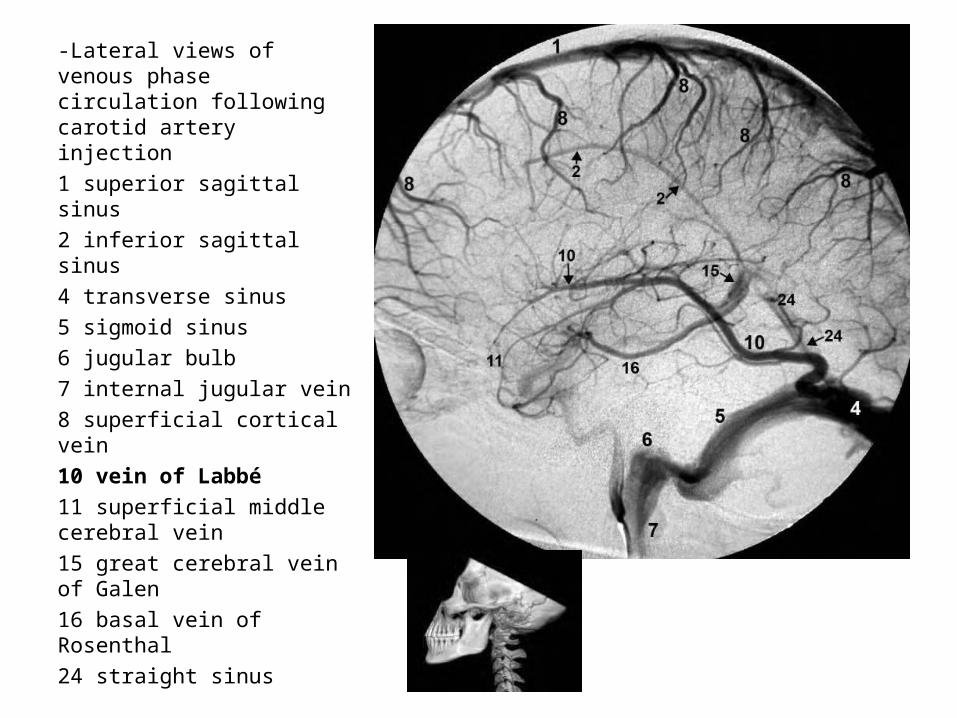
-Lateral views of venous phase circulation following carotid artery injection1 superior sagittal sinus2 inferior sagittal sinus4 transverse sinus5 sigmoid sinus6 jugular bulb7 internal jugular vein8 superficial cortical vein10 vein of Labbé11 superficial middle cerebral vein15 great cerebral vein of Galen16 basal vein of Rosenthal24 straight sinus
1-Venous Occlusion :a) Etiologyb) Radiological Findingsc) Diagnostic Difficultiesd) Characteristic Patterns of Venous Infarctions

a) Etiology :-The vast majority of venous infarcts are caused
by venous thrombosis-If an area of infarction is seen which isn’t in
arterial distribution , consider sinus thrombosis
b) Radiological Findings :*CT :-Acute thrombus is hyperdense on precontrast CT
and expands the occluded sinus / vein (Dense clot sign)
- Cord sign : is defined as a homogeneous , hyperattenuated appearance of thrombosed venous sinuses , the hyperattenuated appearance of the affected veins often being named (the attenuated vein sign)
-Postcontrast :1-Filling Defect : demonstration of contrast-filling defects
in the involved sinus or vein2-Empty Delta sign :*The sign consists of a triangular area of enhancement
with a relatively low-attenuating center which is the thrombosed sinus
*In early thrombosis the empty delta sign may be absent and you will have to rely on non-visualization of the thrombosed vein on the CECT
*The sign may be absent after two months due to recanalization within the thrombus
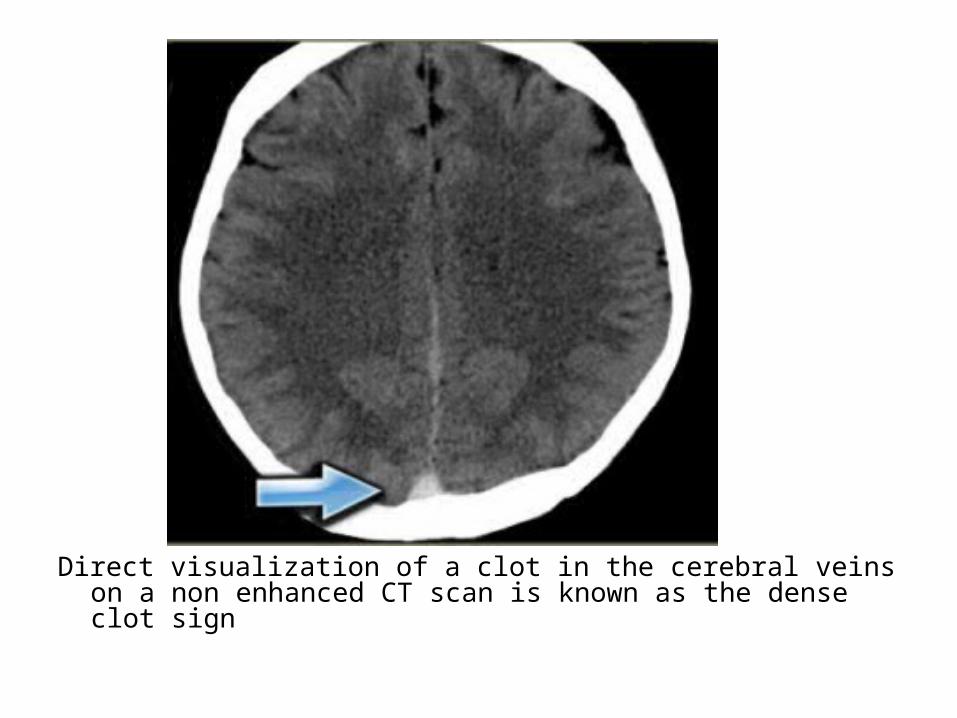
Direct visualization of a clot in the cerebral veins on a non enhanced CT scan is known as the dense clot sign
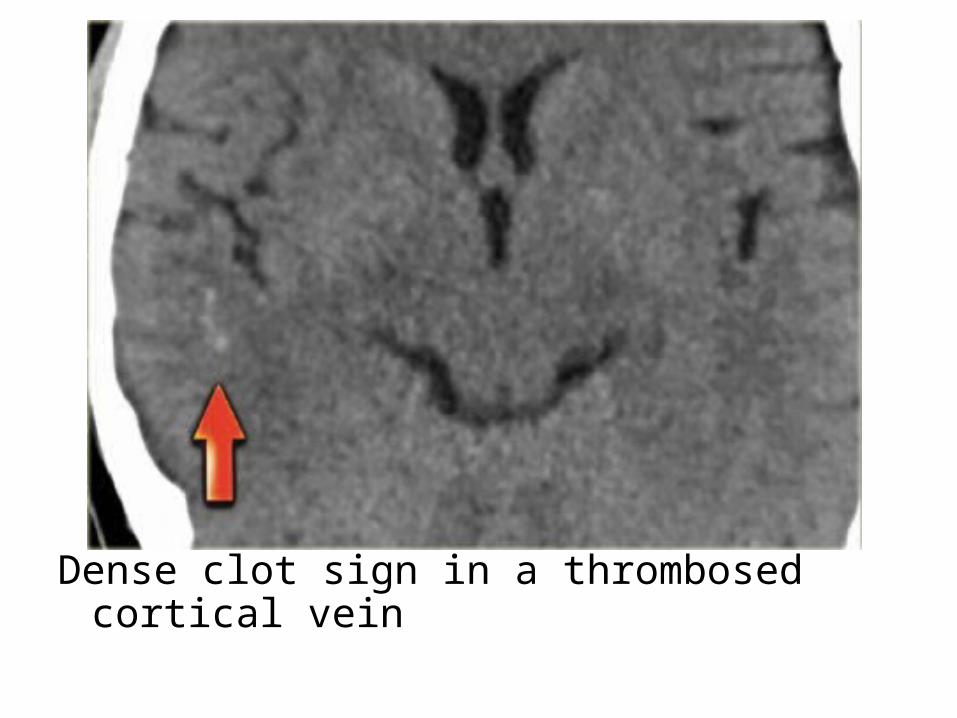
Dense clot sign in a thrombosed cortical vein
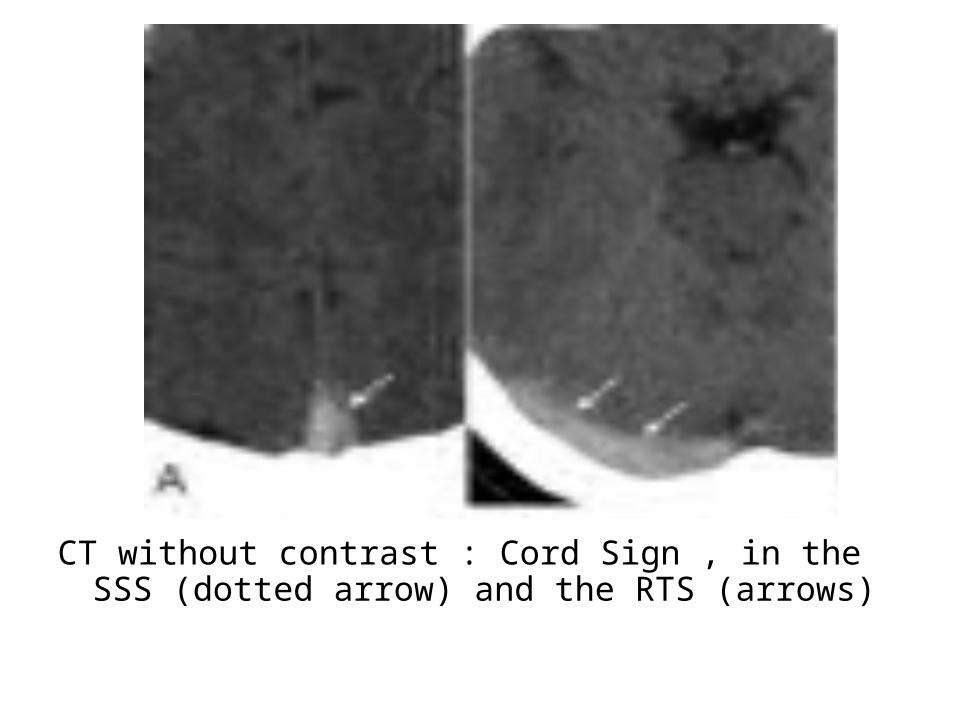
CT without contrast : Cord Sign , in the SSS (dotted arrow) and the RTS (arrows)
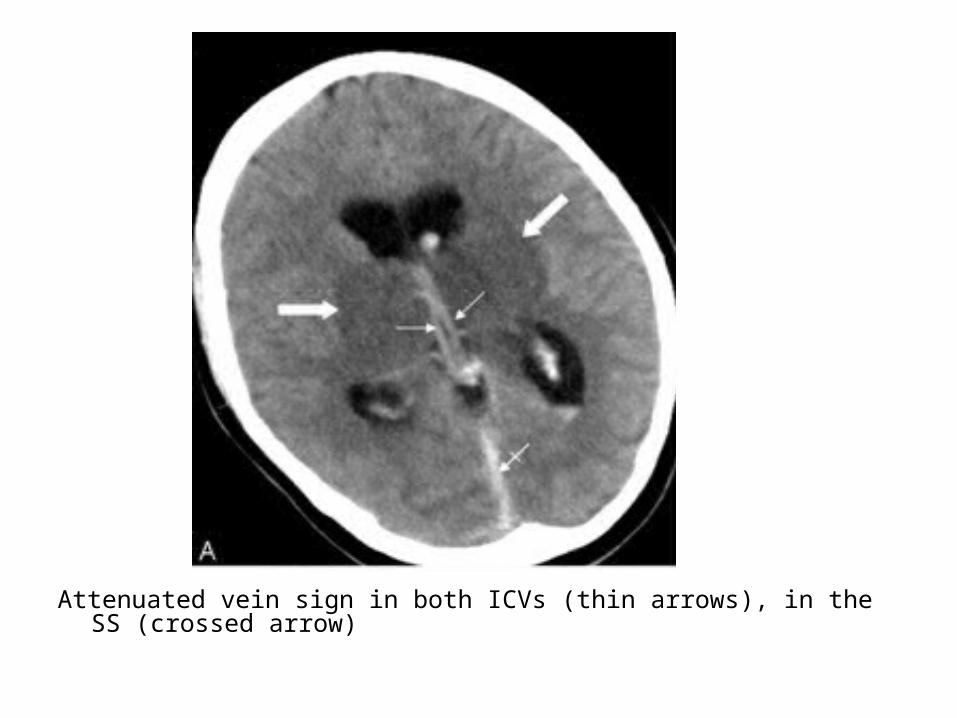
Attenuated vein sign in both ICVs (thin arrows), in the SS (crossed arrow)
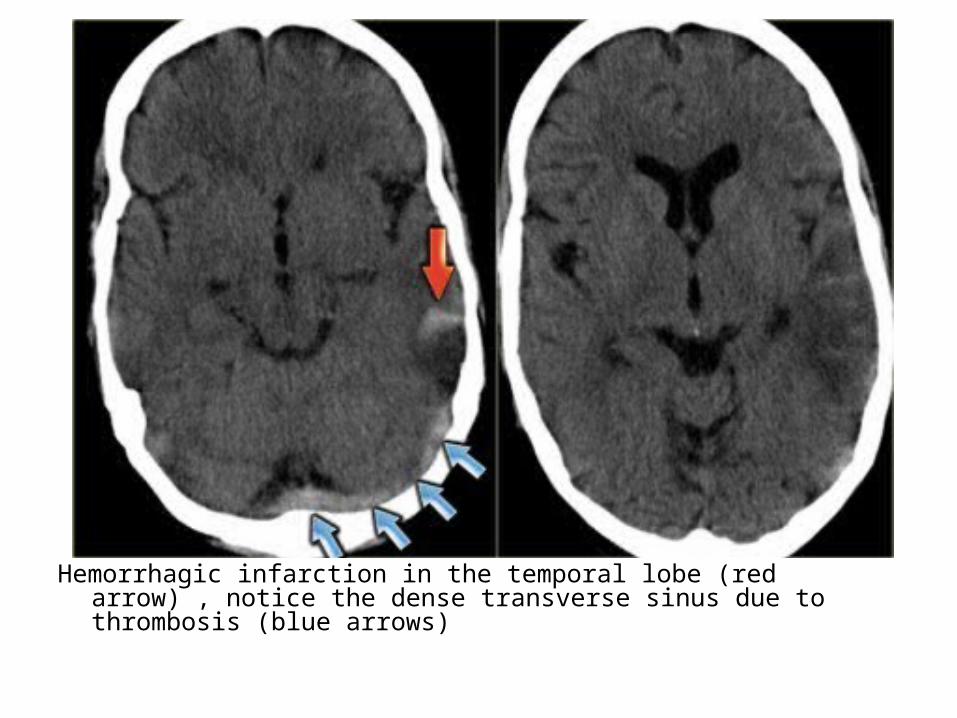
Hemorrhagic infarction in the temporal lobe (red arrow) , notice the dense transverse sinus due to thrombosis (blue arrows)
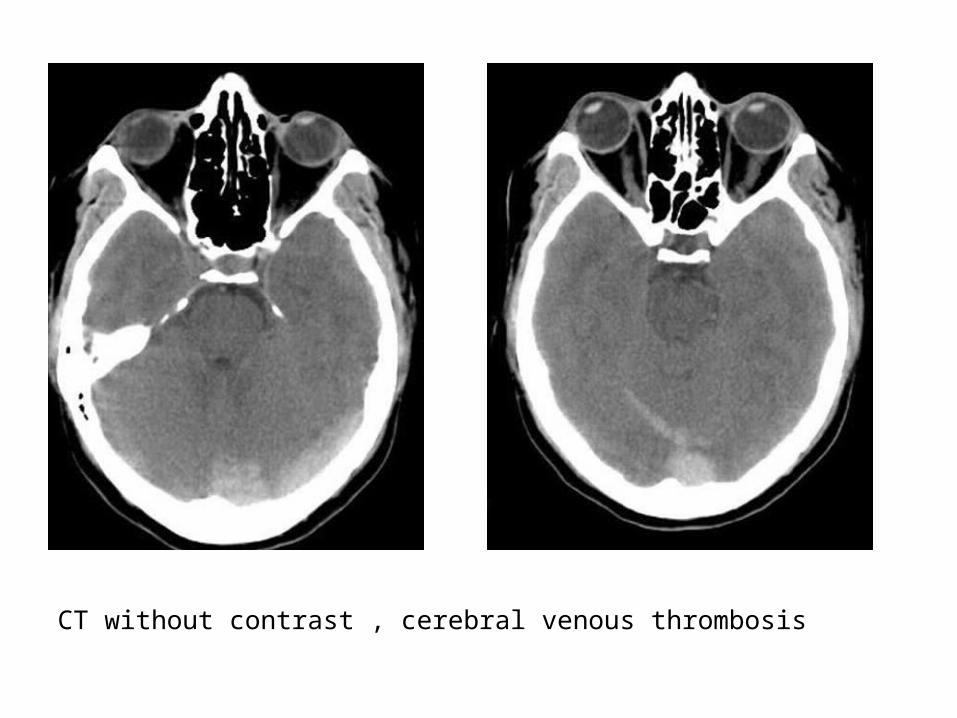
CT without contrast , cerebral venous thrombosis
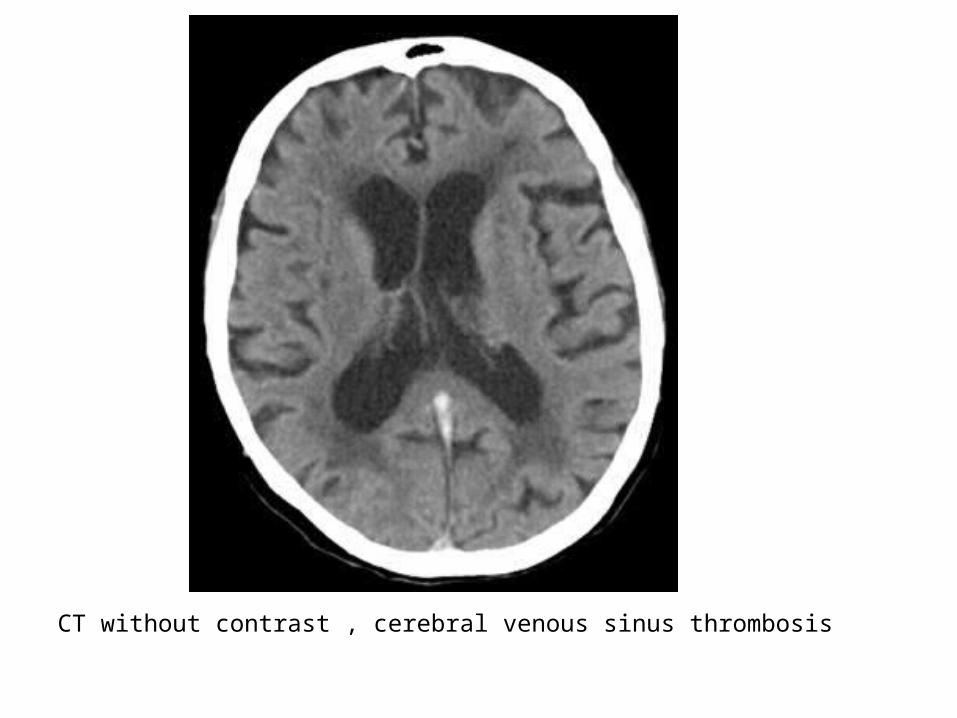
CT without contrast , cerebral venous sinus thrombosis
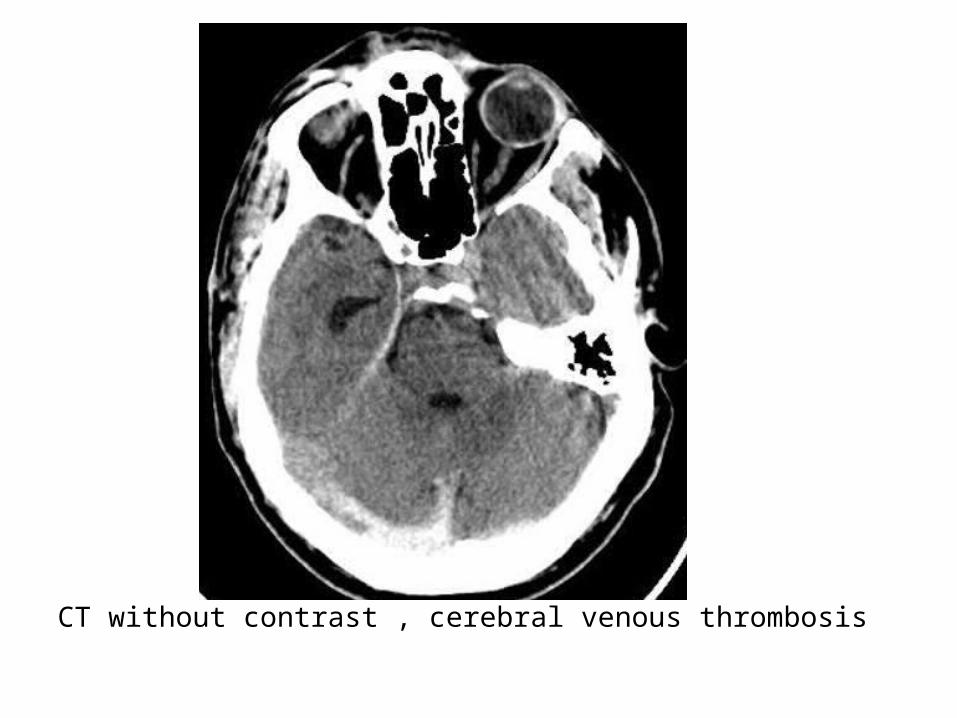
CT without contrast , cerebral venous thrombosis

CT without contrast , Hyperdense veins (attenuated vein sign)

CT without contrast , Hyperdense internal cerebral veins (attenuated vein sign)
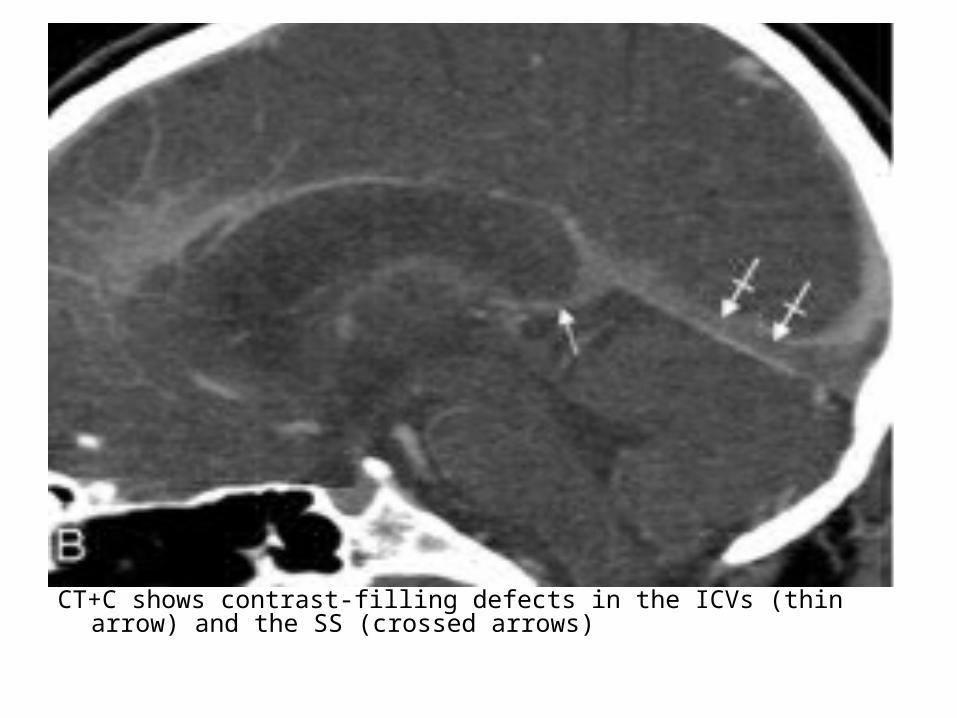
CT+C shows contrast-filling defects in the ICVs (thin arrow) and the SS (crossed arrows)
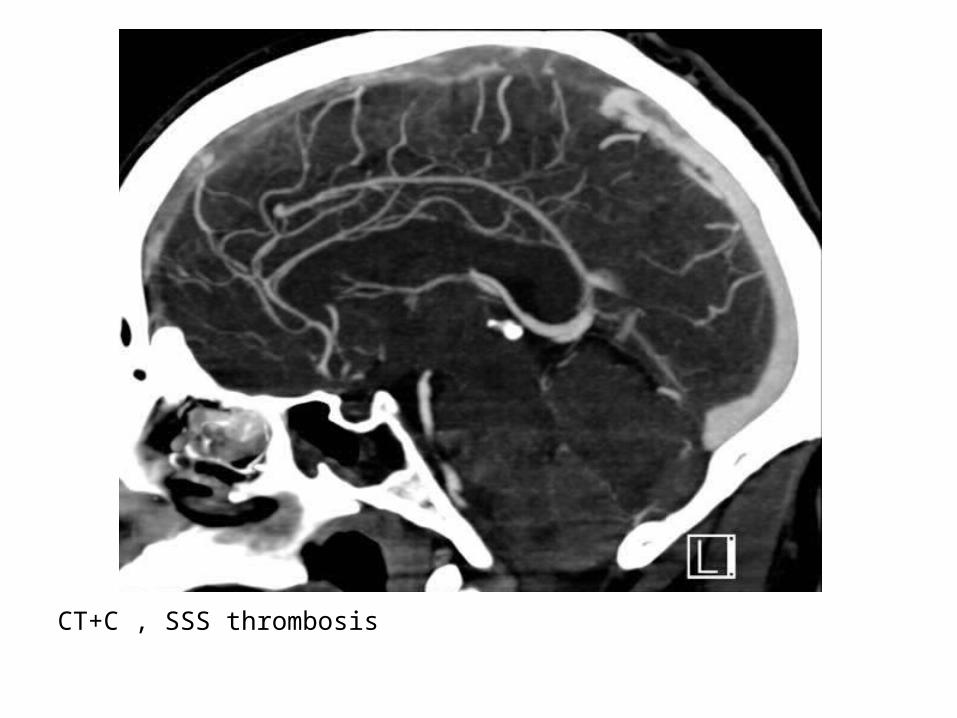
CT+C , SSS thrombosis
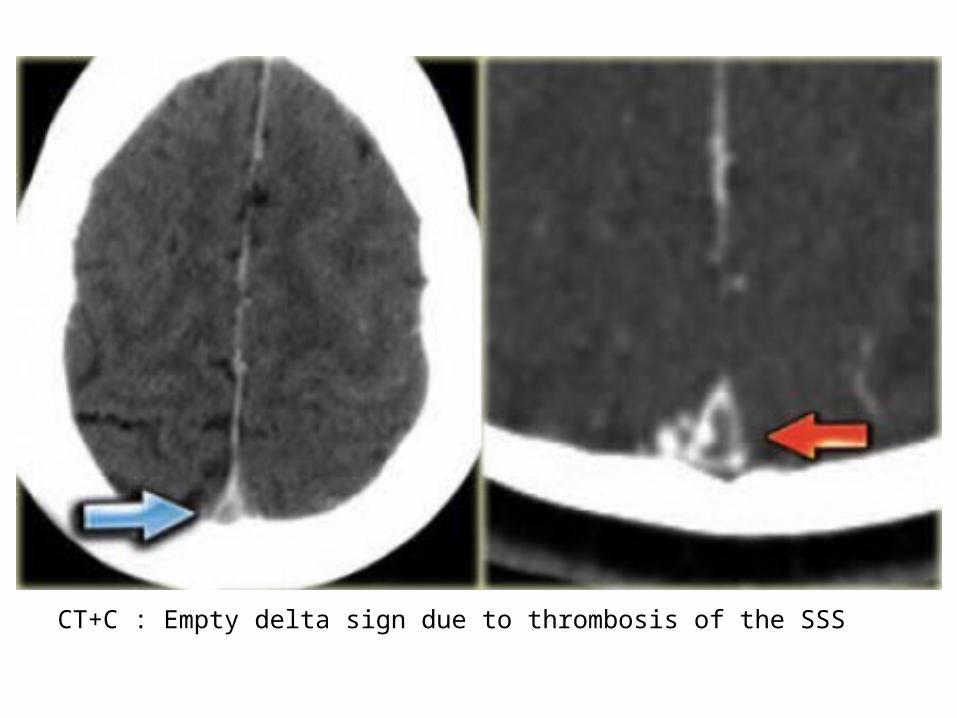
CT+C : Empty delta sign due to thrombosis of the SSS
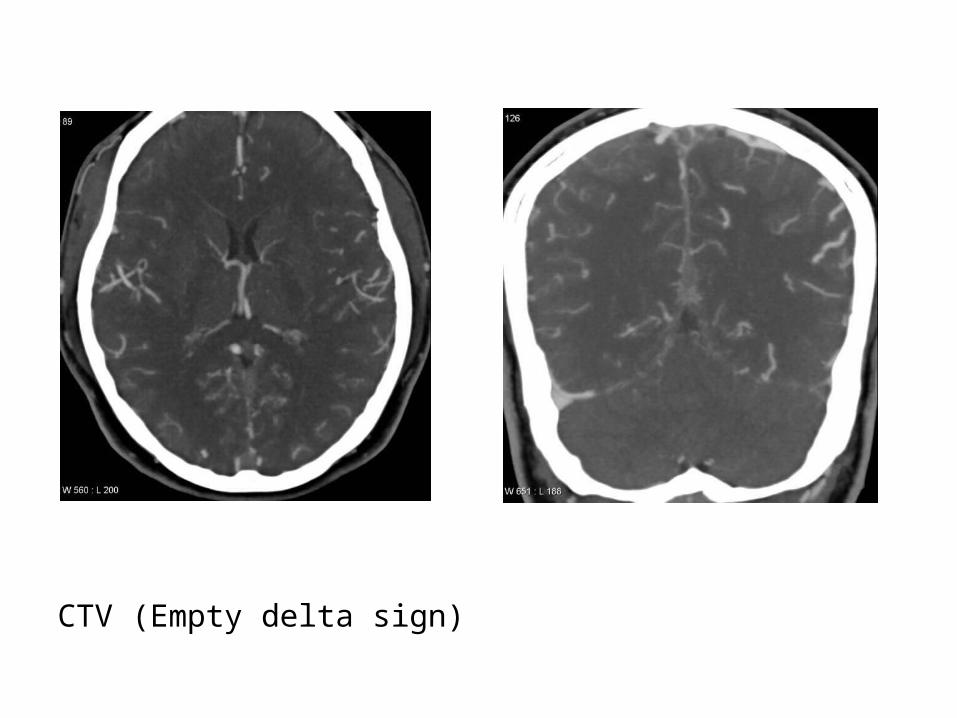
CTV (Empty delta sign)

CT+C (Empty delta sign)

CT+C ( Empty delta sign )
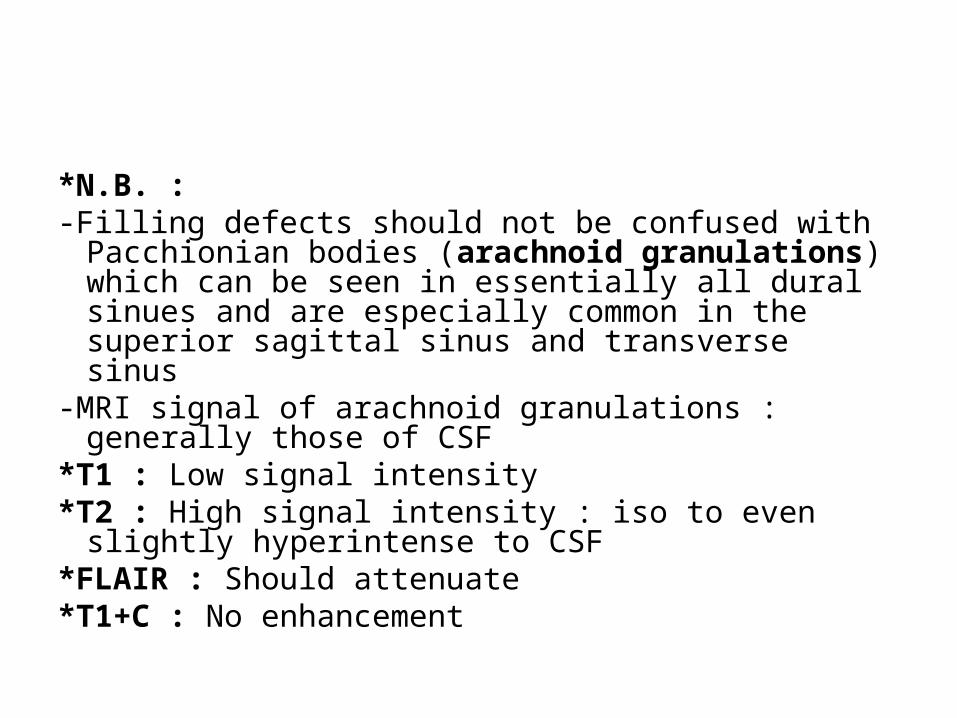
*N.B. :-Filling defects should not be confused with Pacchionian
bodies (arachnoid granulations) which can be seen in essentially all dural sinues and are especially common in the superior sagittal sinus and transverse sinus
-MRI signal of arachnoid granulations : generally those of CSF
*T1 : Low signal intensity*T2 : High signal intensity : iso to even slightly
hyperintense to CSF*FLAIR : Should attenuate*T1+C : No enhancement

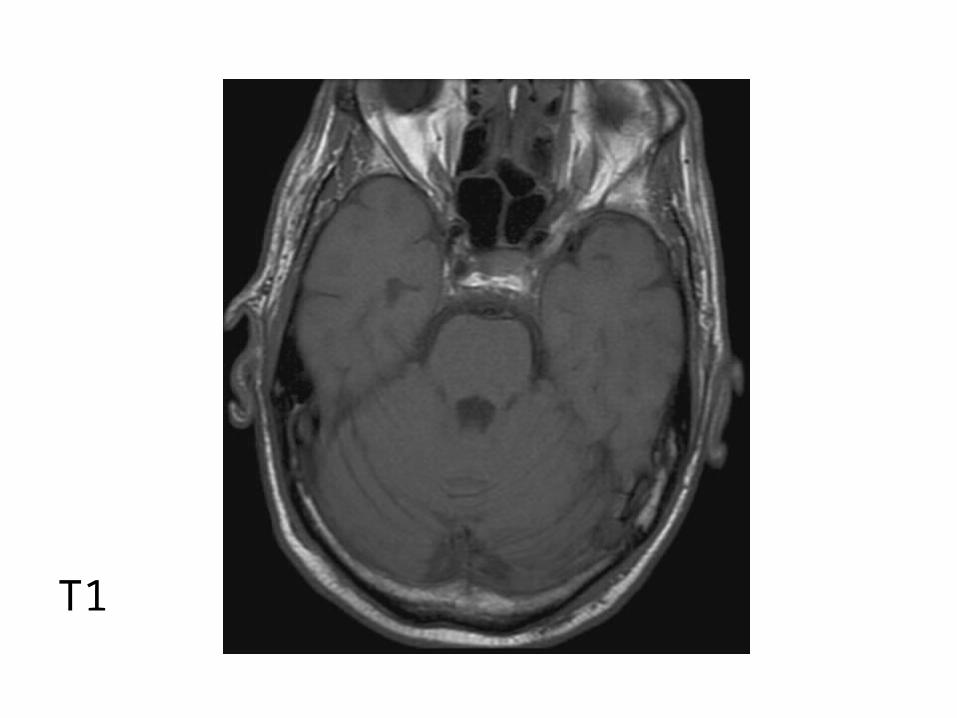
T1
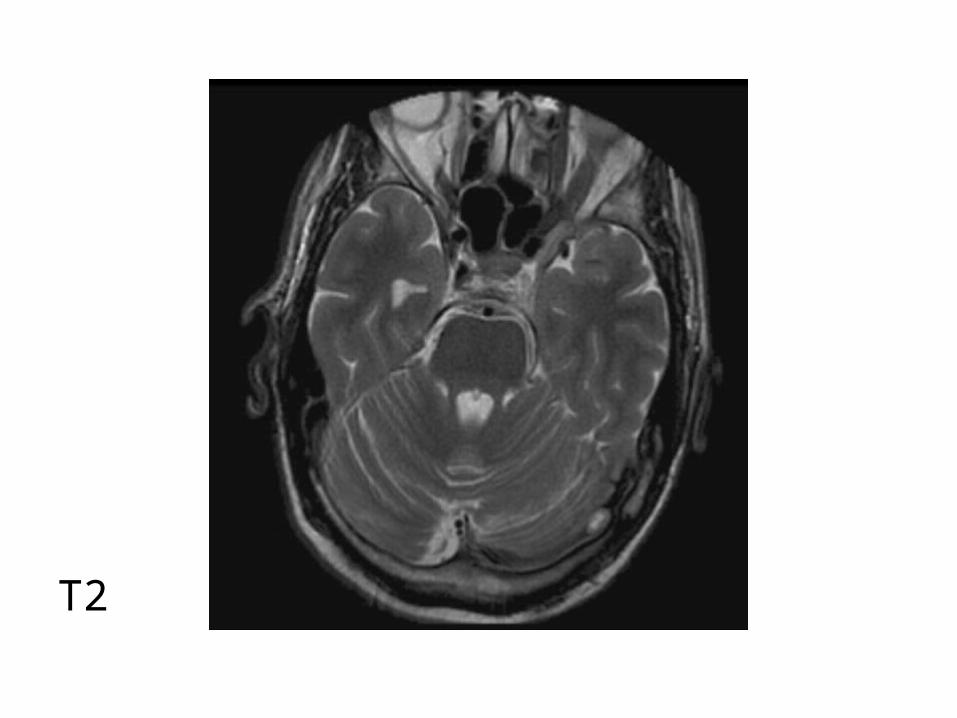
T2

T1+C
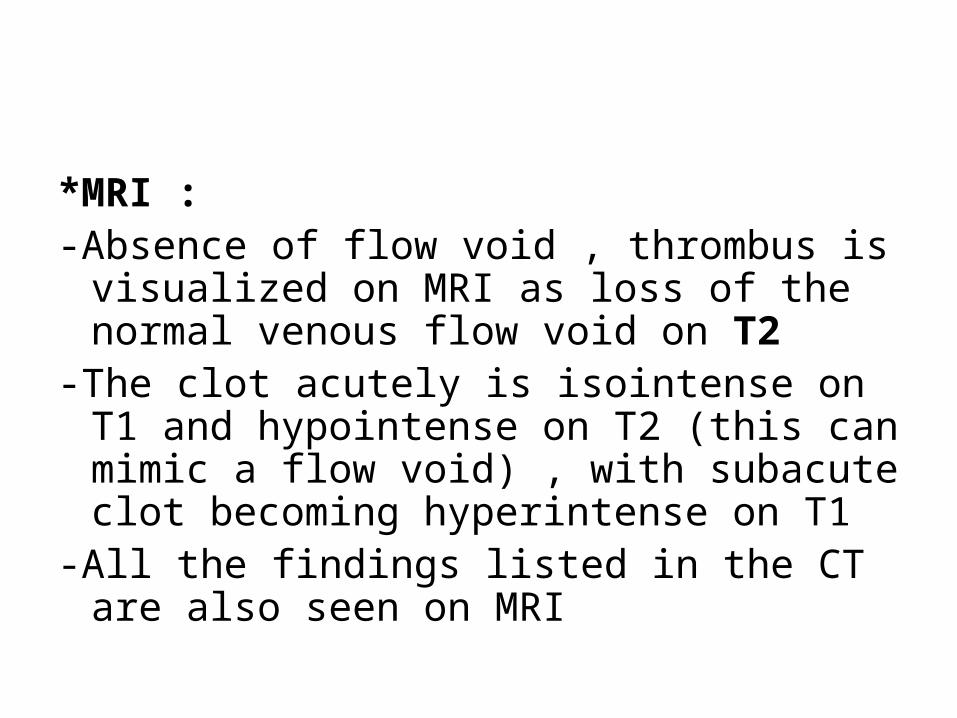
*MRI :-Absence of flow void , thrombus is visualized on
MRI as loss of the normal venous flow void on T2-The clot acutely is isointense on T1 and
hypointense on T2 (this can mimic a flow void) , with subacute clot becoming hyperintense on T1
-All the findings listed in the CT are also seen on MRI
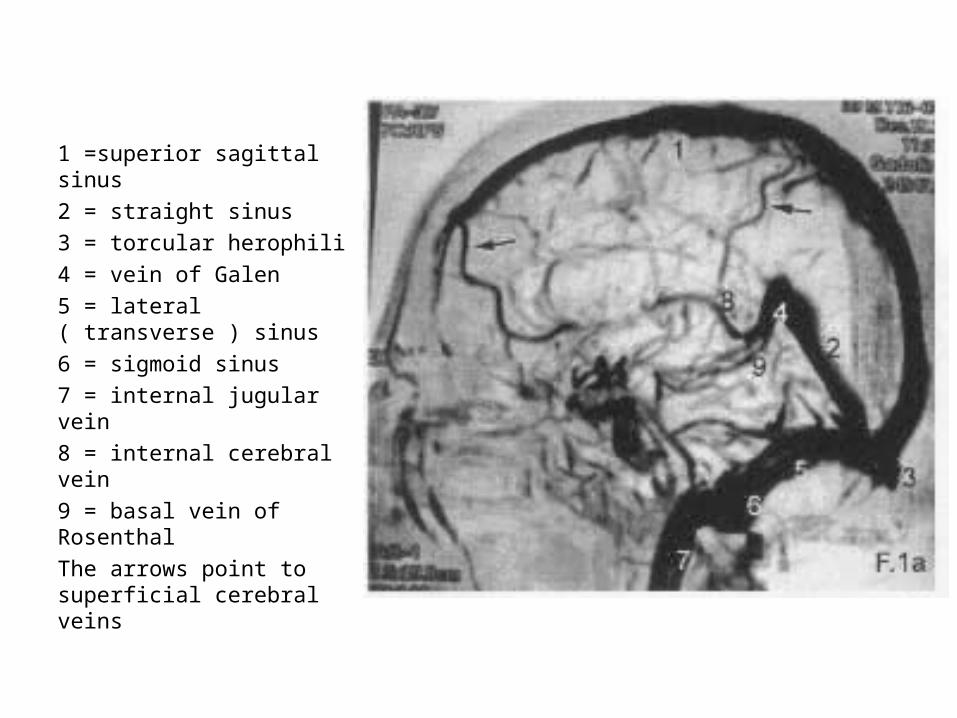
1 =superior sagittal sinus2 = straight sinus3 = torcular herophili4 = vein of Galen5 = lateral ( transverse ) sinus6 = sigmoid sinus7 = internal jugular vein8 = internal cerebral vein9 = basal vein of RosenthalThe arrows point to superficial cerebral veins
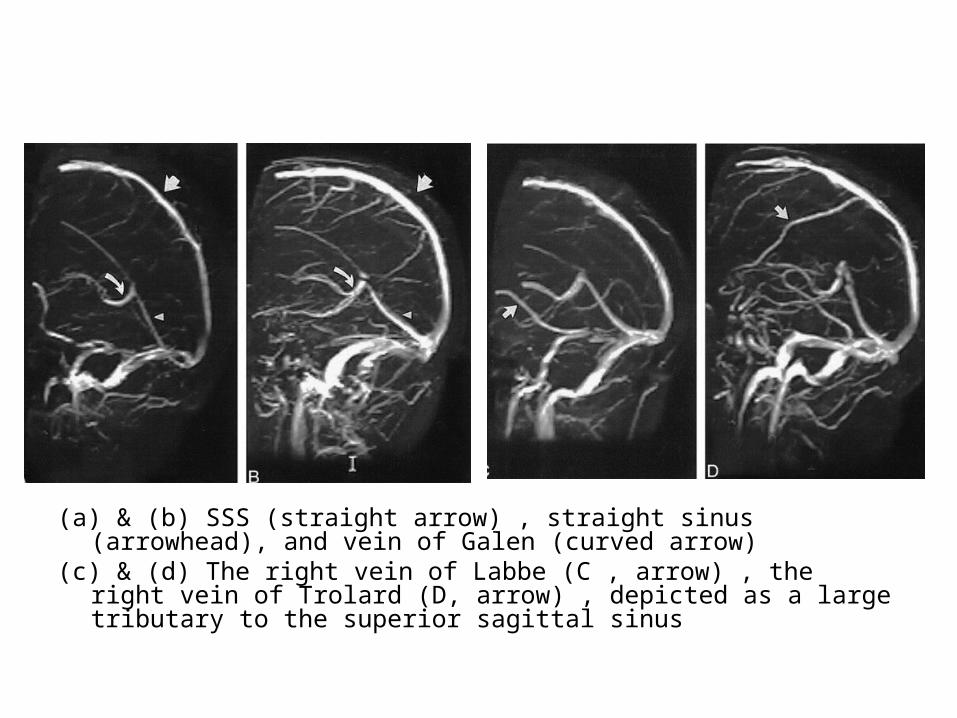
(a) & (b) SSS (straight arrow) , straight sinus (arrowhead), and vein of Galen (curved arrow)
(c) & (d) The right vein of Labbe (C , arrow) , the right vein of Trolard (D, arrow) , depicted as a large tributary to the superior sagittal sinus
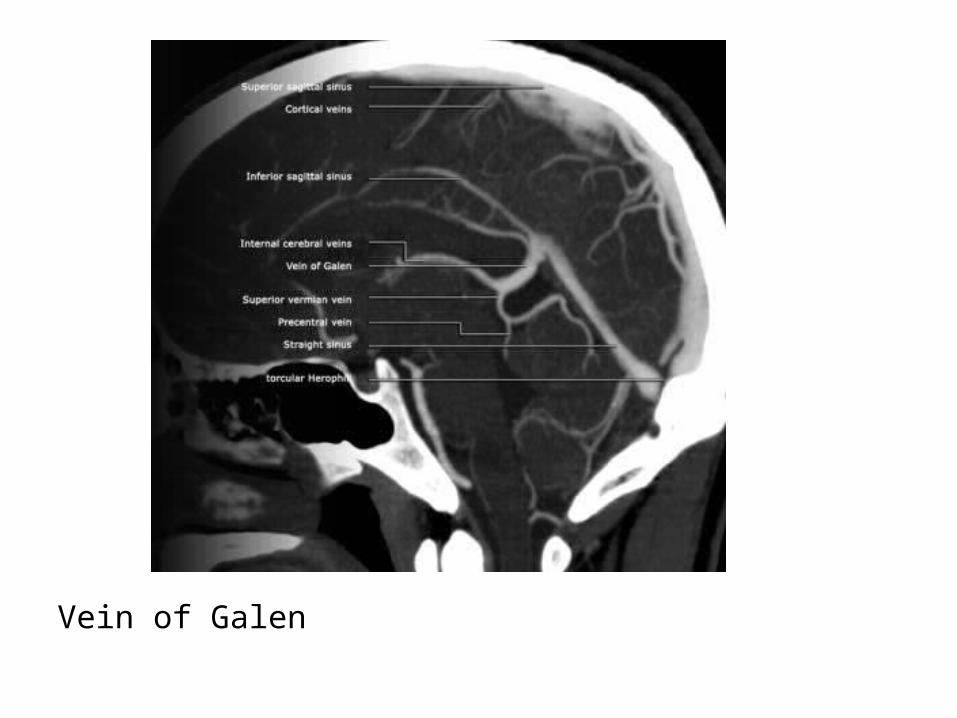
Vein of Galen

Vein of Labbe (6) , Transverse sinus (3)
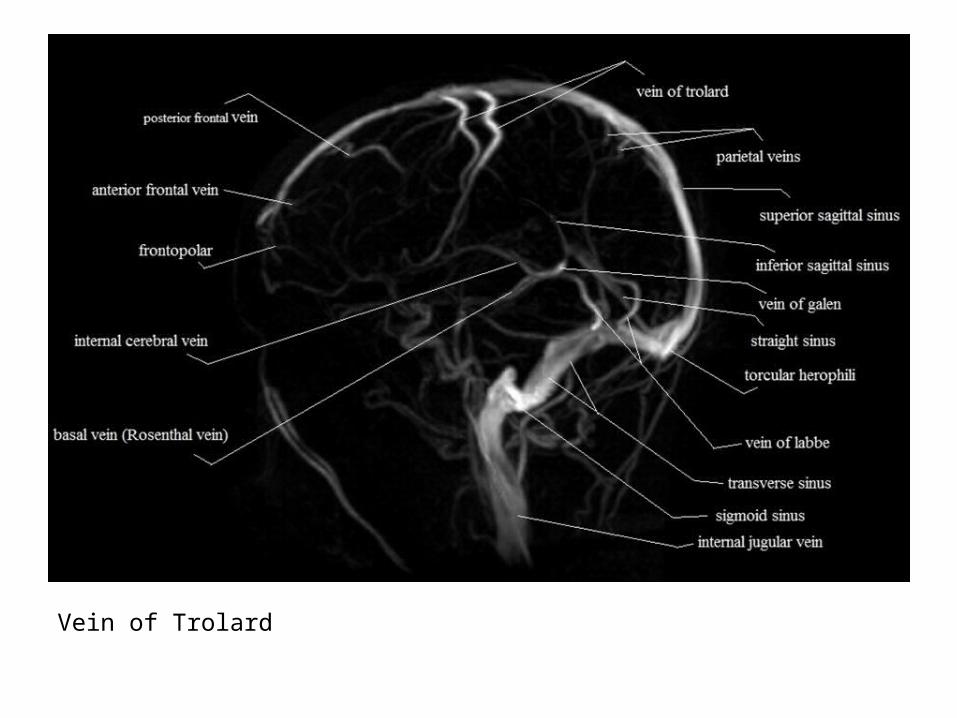
Vein of Trolard

T2 with normal flow void in the right sigmoid sinus and jugular vein (blue arrow) , on the left there is abnormal high signal as a result of thrombosis (red arrow)
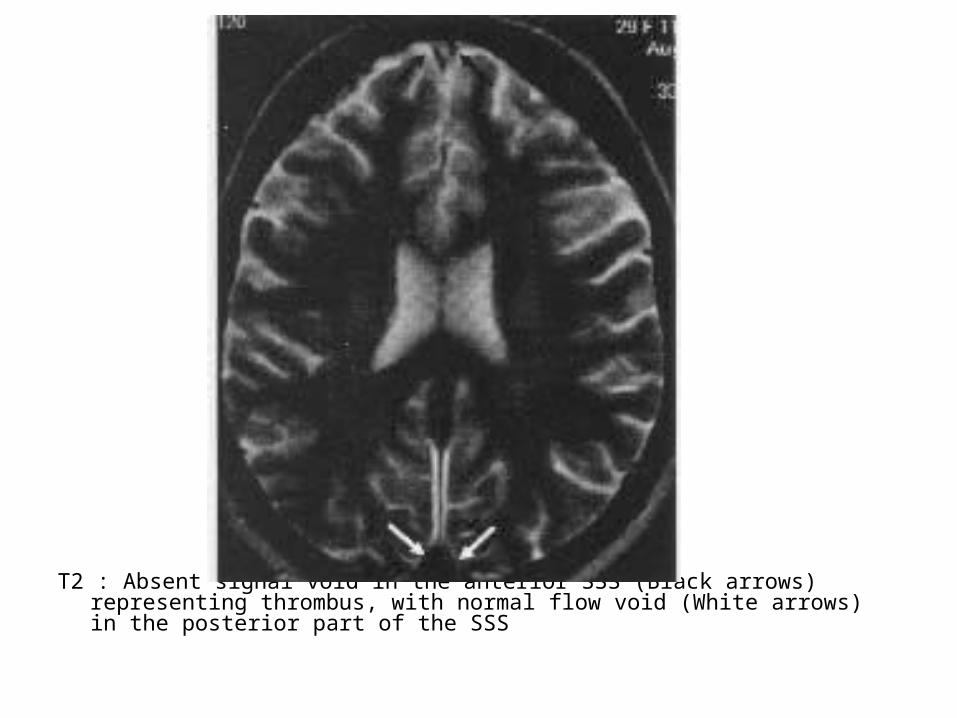
T2 : Absent signal void in the anterior SSS (Black arrows) representing thrombus, with normal flow void (White arrows) in the posterior part of the SSS
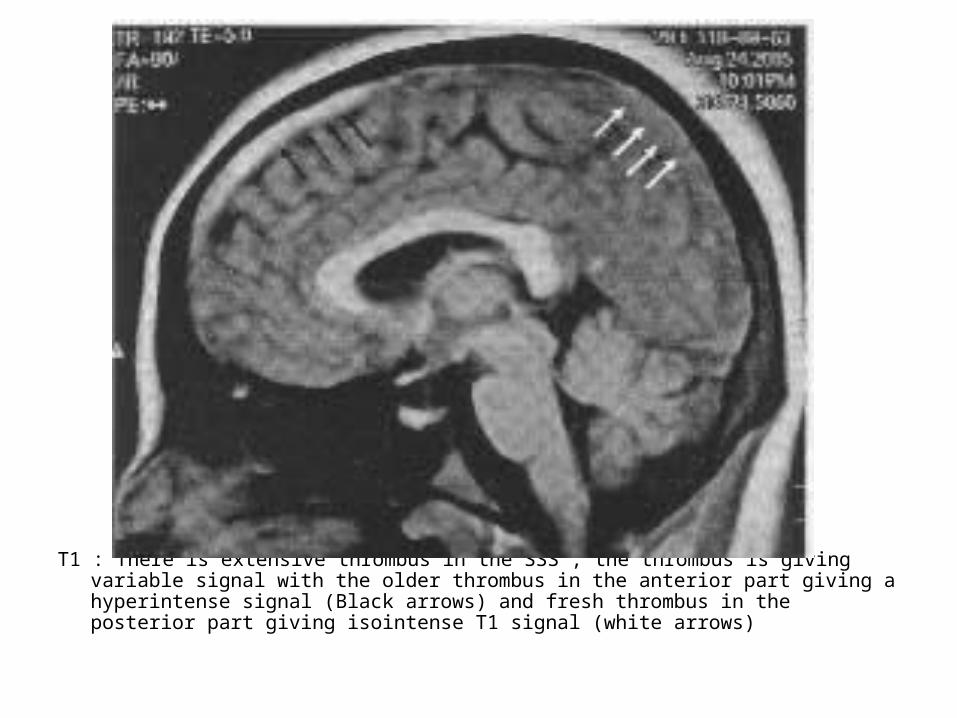
T1 : There is extensive thrombus in the SSS , the thrombus is giving variable signal with the older thrombus in the anterior part giving a hyperintense signal (Black arrows) and fresh thrombus in the posterior part giving isointense T1 signal (white arrows)

Cerebral venous thrombosis in a 44 year old woman, axial (a) and sagittal (b) T1 show high signal intensity in the deep cerebral veins (arrow) and venous sinuses (arrowheads), (c) 3D MIP from MR venography demonstrates collateral vessels (arrowhead) secondary to occlusion of the cortical veins and venous sinuses (arrow)
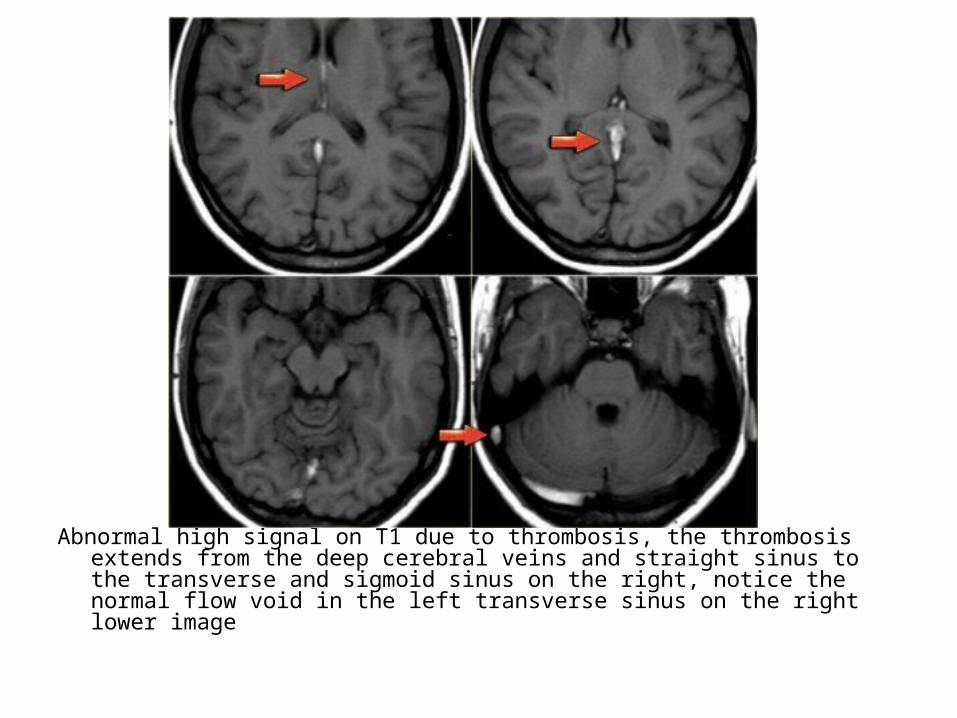
Abnormal high signal on T1 due to thrombosis, the thrombosis extends from the deep cerebral veins and straight sinus to the transverse and sigmoid sinus on the right, notice the normal flow void in the left transverse sinus on the right lower image

T1+C : Extensive filling defect due to thrombus in the SSS (White arrows) and the straight sinus (Black arrows)
c) Diagnostic Difficulties :-Diagnostic difficulties arise with congenital
variations of the venous system (i.e. normal hypoplasia of the transverse sinuses) , arachnoid granulations and normal slow turbulent flow

Hypoplasia of the left transverse sinus , notice the size difference of the jugular foramen
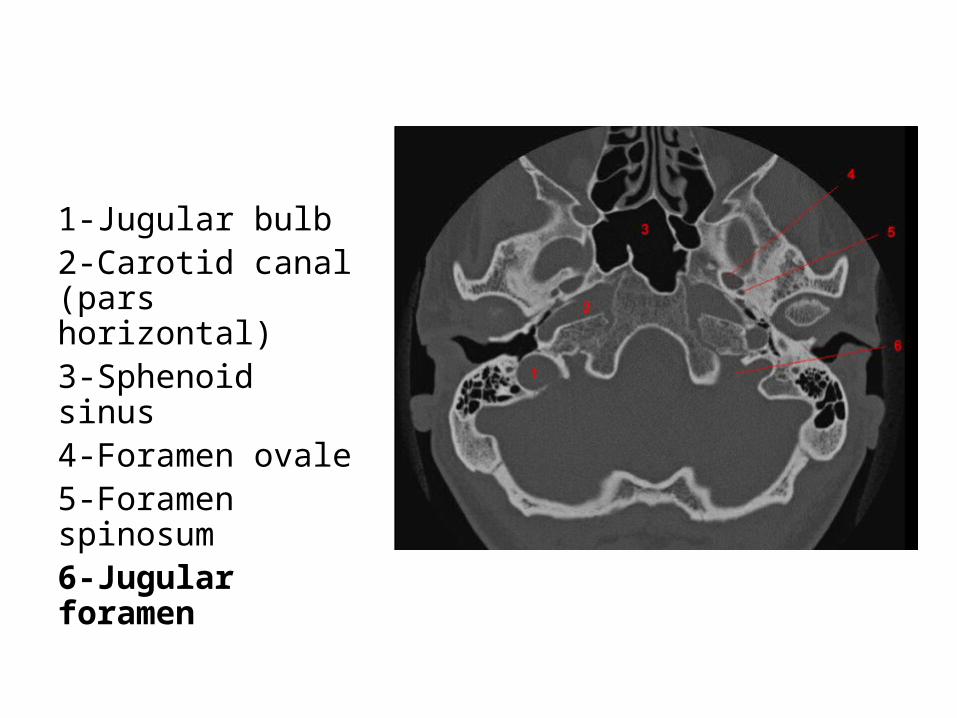
1-Jugular bulb2-Carotid canal (pars horizontal)3-Sphenoid sinus4-Foramen ovale5-Foramen spinosum6-Jugular foramen

Transverse MIP of phase-contrast images, to differentiate whether there is a hypoplastic transverse sinus or thrombosed sinus , you need to look at the source images, on the source image on the right you can see that there is no hypoplasia (blue arrow), in this case there thrombosis of the left transverse sinus

The signal in the vein depends on the velocity of the flowing blood and the velocity encoding by the technician, on the far left a patient with non visualization of the left transverse sinus, this could be hypoplasia , venous thrombosis or slow flow, on T1+C, it is obvious that the sinus fills with contrast and is patent
d) Characteristic Patterns of Venous Infarctions:-There are 3 characteristic patterns of venous
infarctions dependant on the location of the thrombosed vein :
1-SSS thrombosis : infarction of the parasagittal high convexity cortex
2-Deep venous system thrombosis : infarction of the bilateral thalami
3-Transverse sinus thrombosis : infarction of the posterior temporal lobe

NECT showing the delta sign at the level of the torcula (dark arrows) and hemorrhagic infarctions on the parasagittal frontal lobes (light arrows) in a case of SSS thrombosis

NECT shows hyperdense internal veins and bilateral (R > L) thalami hypodensities , compatible with dural vein thrombosis and venous infarction
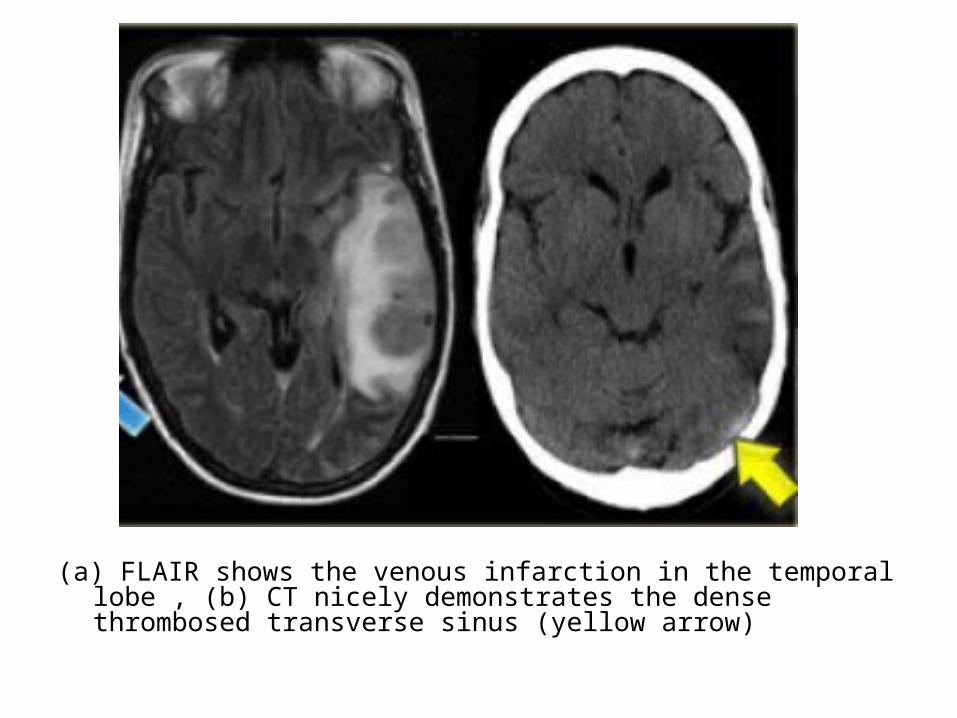
(a) FLAIR shows the venous infarction in the temporal lobe , (b) CT nicely demonstrates the dense thrombosed transverse sinus (yellow arrow)
2-Bilateral Infarcts :-Venous infarcts are often bilateral in the midline and
hemorrhagic-Occlusion of the midline veins (deep cerebral veins “
Internal cerebral veins and basal veins of Rosenthal “ , straight sinus & SSS) may result in bilateral areas of low attenuation on CT and increased T2
-Thrombosis of the deep cerebral veins may involve the basal ganglia , thalami , midbrain and mesial temporal lobes in a relatively symmetrical fashion
-The most frequently thrombosed venous structure is the SSS , infarction is seen in 75% of cases , the abnormalities are parasagittal and frequently bilateral , hemorrhage is seen in 60% of the cases
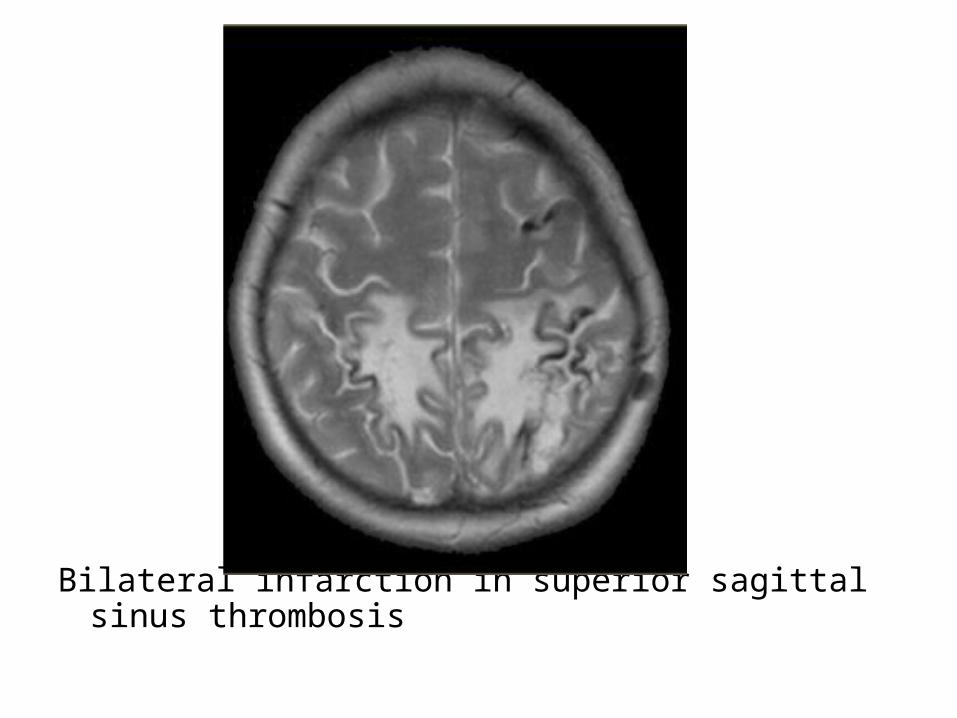
Bilateral infarction in superior sagittal sinus thrombosis

Bilateral parasagittal hemorrhage due to thrombosis of the SSS , the red arrow on the contrast enhanced image indicates the filling defect caused by the thrombus
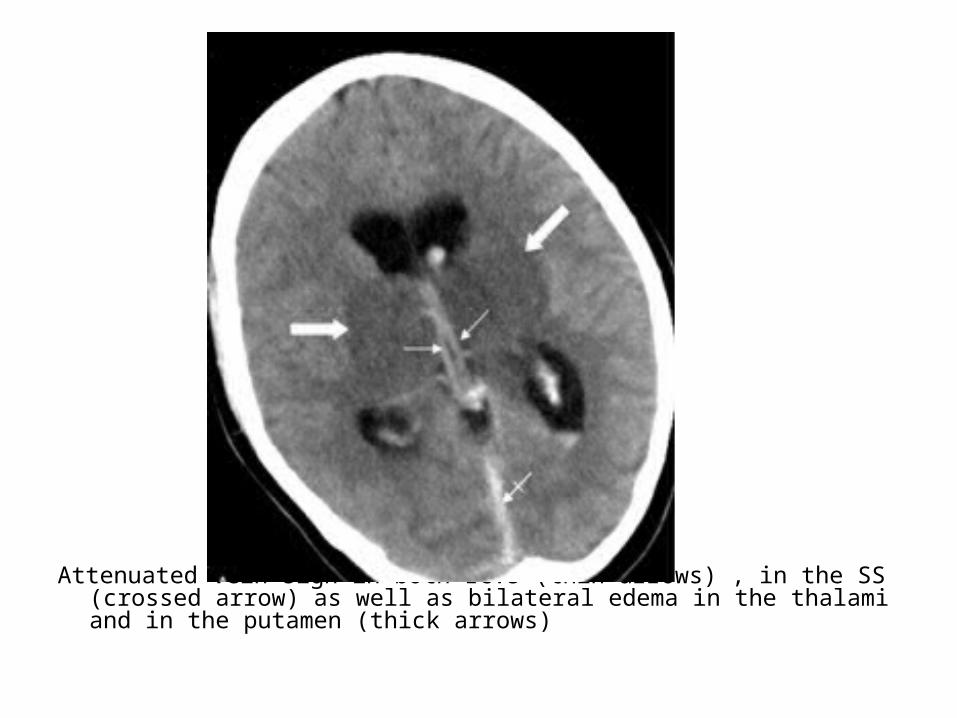
Attenuated vein sign in both ICVs (thin arrows) , in the SS (crossed arrow) as well as bilateral edema in the thalami and in the putamen (thick arrows)

T1 revealing swollen hypointense thalami , T2 depicting swollen hyperintense thalami
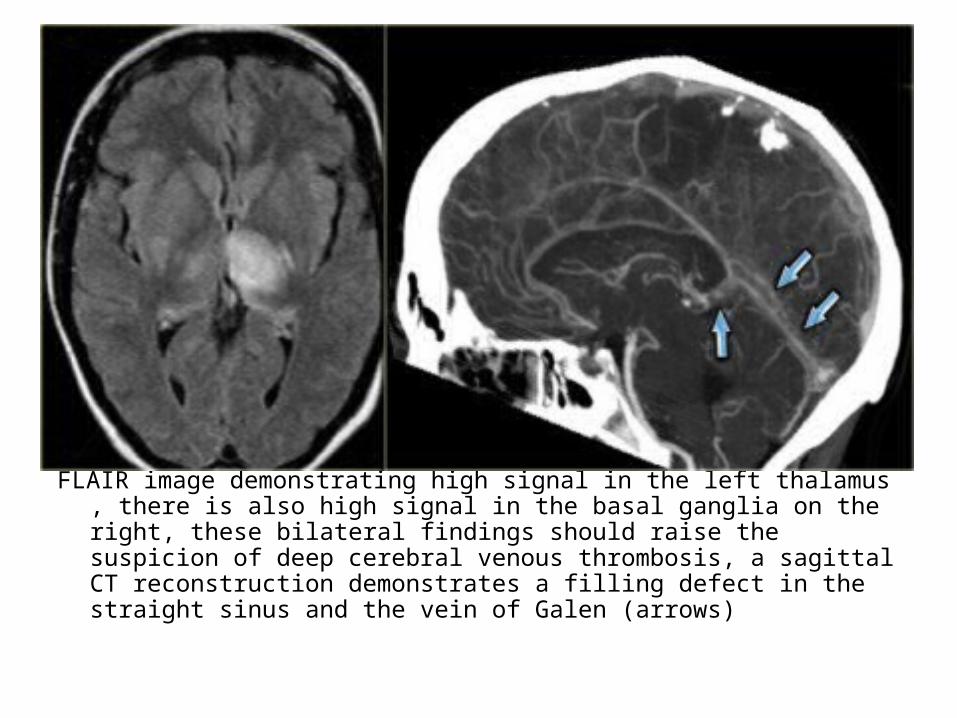
FLAIR image demonstrating high signal in the left thalamus , there is also high signal in the basal ganglia on the right, these bilateral findings should raise the suspicion of deep cerebral venous thrombosis, a sagittal CT reconstruction demonstrates a filling defect in the straight sinus and the vein of Galen (arrows)

Bilateral abnormalities in the region of the basal ganglia, based on the imaging findings there is a broad differential including small vessel disease, demyelination, intoxication and metabolic disorders, but there are abnormal high signal in the internal cerebral veins and straight sinus on the T1, where there should be a low signal due to flow void, this was unlike the low signal in other sinuses, diagnosis is bilateral infarctions in the basal ganglia due to deep cerebral venous thrombosis

Edema in venous infarction, in some cases of venous thrombosis the imaging findings can resolve completely, on the left a patient with a subcortical area of high signal intensity, the first impression was that this could be a low grade glioma, on a follow up scan the abnormalities had resolved completely, in retrospect a dense vessel sign was seen in one of the cortical veins and the diagnosis of venous thrombosis was made, the high signal intensity can be attributed to vasogenic edema due to the high venous pressure that resulted from the thrombosis
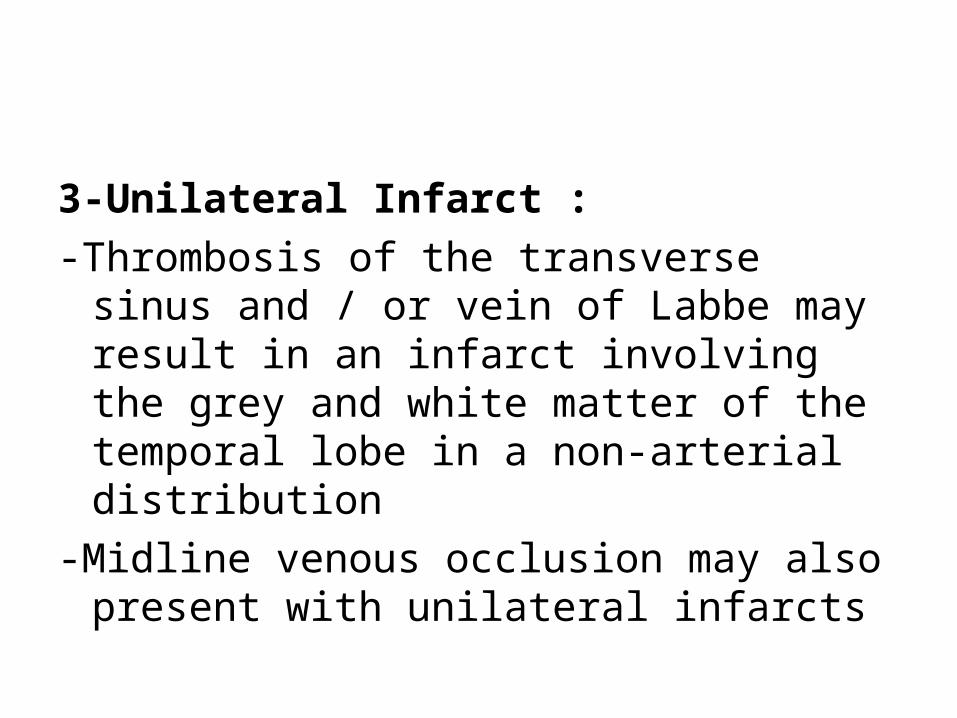
3-Unilateral Infarct :-Thrombosis of the transverse sinus and / or
vein of Labbe may result in an infarct involving the grey and white matter of the temporal lobe in a non-arterial distribution
-Midline venous occlusion may also present with unilateral infarcts

Thrombosis of the vein of Labbe, hypodensity in the white matter and less pronounced in the gray matter of the left temporal lobe, there is some linear density within the infarcted area, this is due to hemorrhage, the subtle density in the area of the left transverse sinus (arrow) is the key to the diagnosis
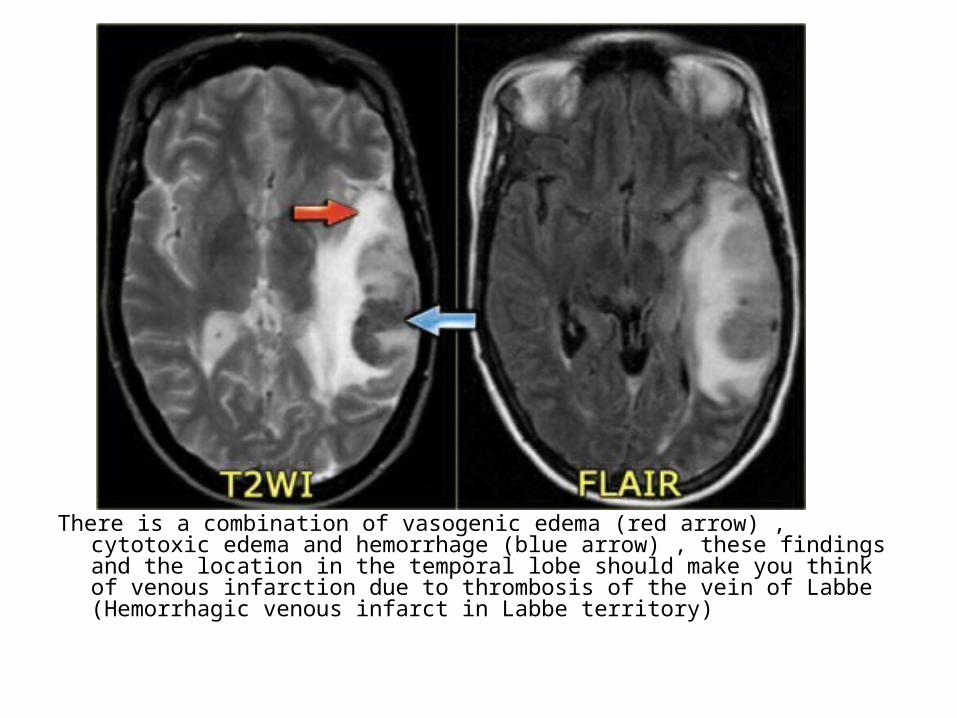
There is a combination of vasogenic edema (red arrow) , cytotoxic edema and hemorrhage (blue arrow) , these findings and the location in the temporal lobe should make you think of venous infarction due to thrombosis of the vein of Labbe (Hemorrhagic venous infarct in Labbe territory)

4-Hemorrhage :-Hemorrhage is common within an acute venous
infarct (but this isn’t a contraindication to anticoagulation as aim of anticoagulation is to stop propagation of thrombus)
-Seen as an area of high attenuation on CT-MR signal intensity depends on the age of the
hemorrhage (See Acute Intracerebral Hematoma)

5-Mass Effect :-Current diagnosis of CVI relies on the detection
of parenchymal edema or hemorrhage in the presence of acute cerebral venous thrombosis
-Marked brain swelling is often seen with venous infarction , even on day 1
-Arterial infarcts usually show maximal swelling at 3-5 days
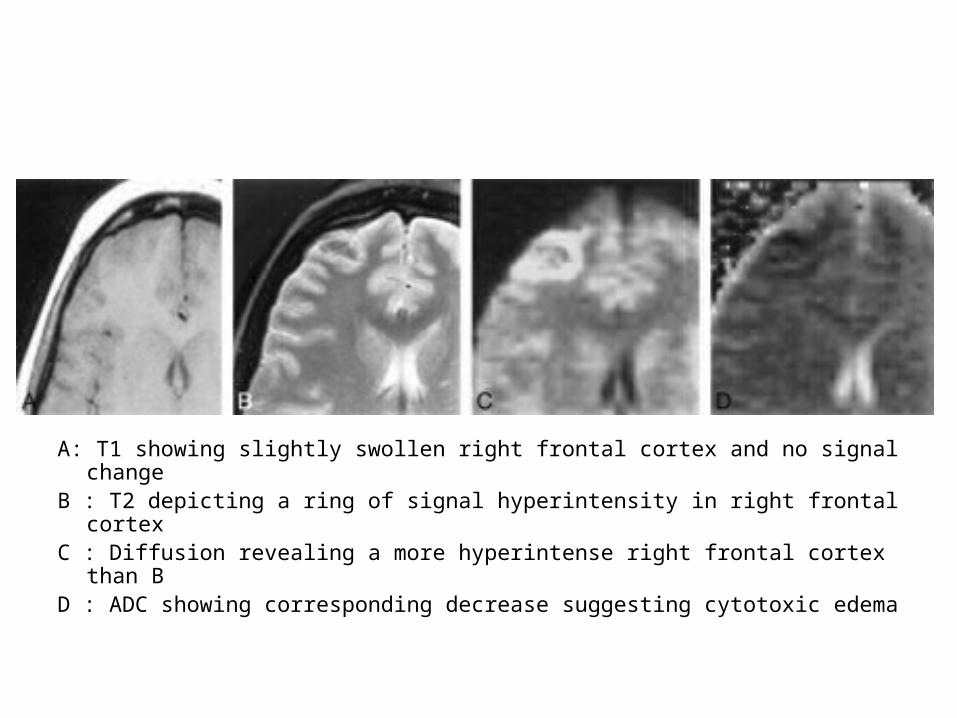
A: T1 showing slightly swollen right frontal cortex and no signal changeB : T2 depicting a ring of signal hyperintensity in right frontal cortexC : Diffusion revealing a more hyperintense right frontal cortex than BD : ADC showing corresponding decrease suggesting cytotoxic edema
-Cytotoxic cerebral edema refers to a type of cerebral edema in which the blood brain barrier (BBB) is intact (c.f. vasogenic cerebral edema where BBB is lost) , it is an intracellular edema which mainly affects grey matter but also involves the white matter , it is due to a cellular swelling from lack of ATP , that is typically seen in area of cerebral ischemia or cerebral hypoxia
MRI : Hyperintense T2 and FLAIR signals which characteristically shows restricted diffusion
CT : Loss of grey white matter differentiation (as it mainly affects grey matter) , effacement of sulcal spaces

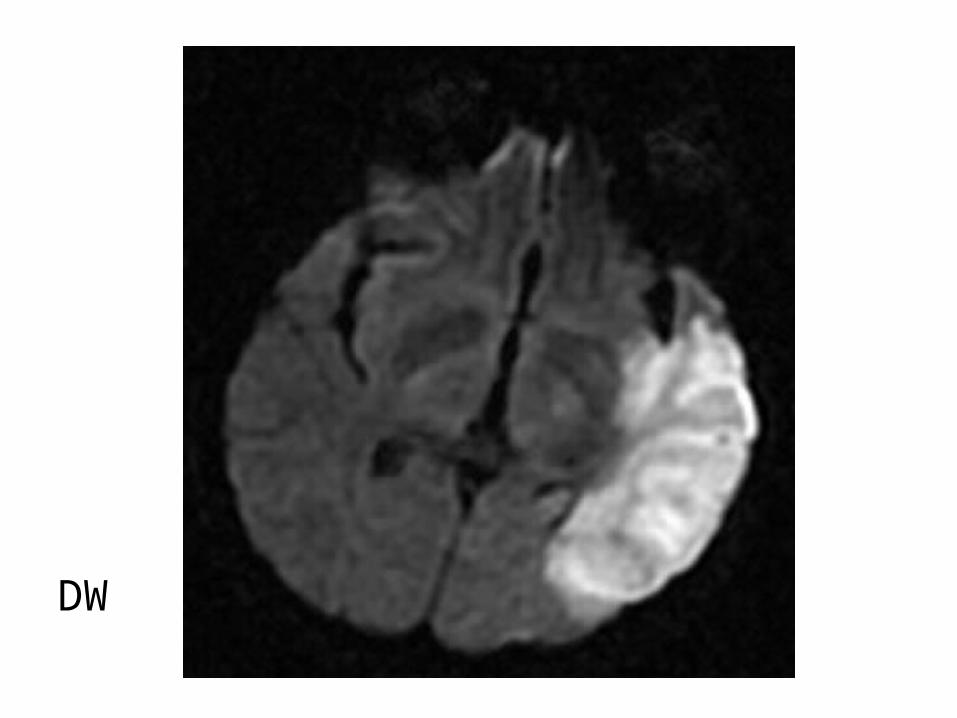
DW
-Vasogenic cerebral edema refers to a type of cerebral edema in which the blood brain barrier (BBB) is disrupted , it is an extracellular edema which mainly affects the white matter , through leakage of fluid out of capillaries , it is most frequently seen around brain tumors (both primary and secondary) and cerebral abscesses , although some vasogenic edema may be seen around maturing cerebral contusion and cerebral hemorrhage

CT : Grey-white matter differentiation is maintained and the edema involves mainly white matter , extending in finger-like fashion , secondary effects of vasogenic edema are similar to cytotoxic edema with effacement of cerebral sulci with or without midline shift
MRI : Hyperintense T2 and FLAIR signals which do not show restricted diffusion (c.f. cytotoxic cerebral edema which shows diffusion restriction)

6-Dural Thickening :-The empty delta sign of peripheral
enhancement around a central core of acute thrombus represents hypervascularity and engorgement of the dura , not a patent peripheral channel
-Persistent dural thickening is a feature of subacute / chronic venous thrombosis

7-Imaging In Suspected Thrombosis :a) CT venographyb) MR venographyc) DSA
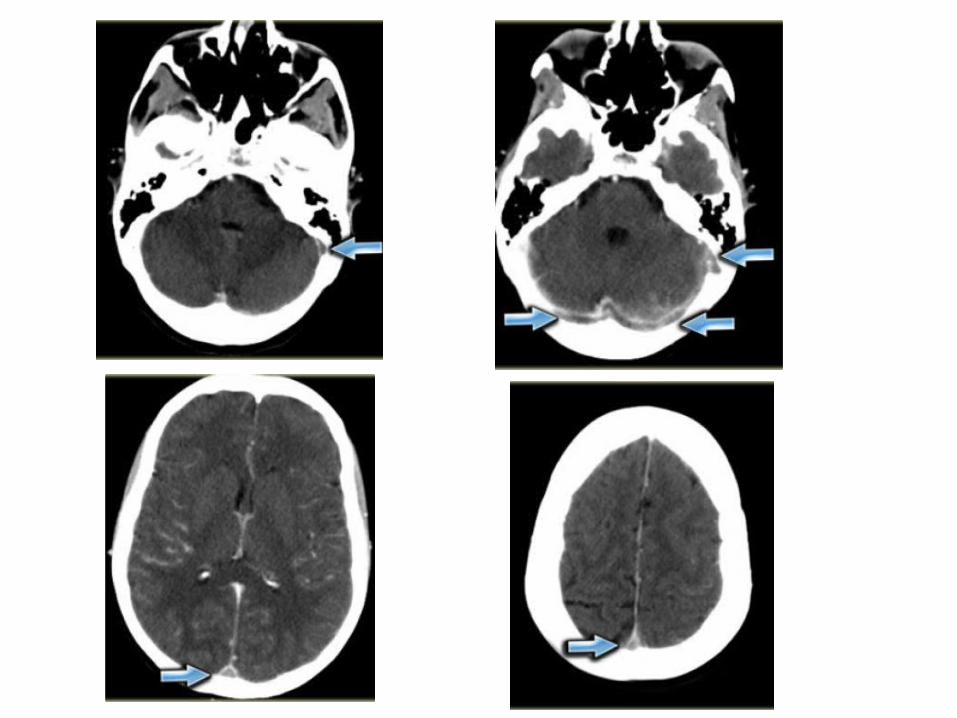
a) CT Venography :-CT venography is a simple and straight forward
technique to demonstrate venous thrombosis-In the early stage there is non-enhancement of
the thrombosed vein and in a later stage there is non-enhancement of the thrombus with surrounding enhancement known as empty delta sign
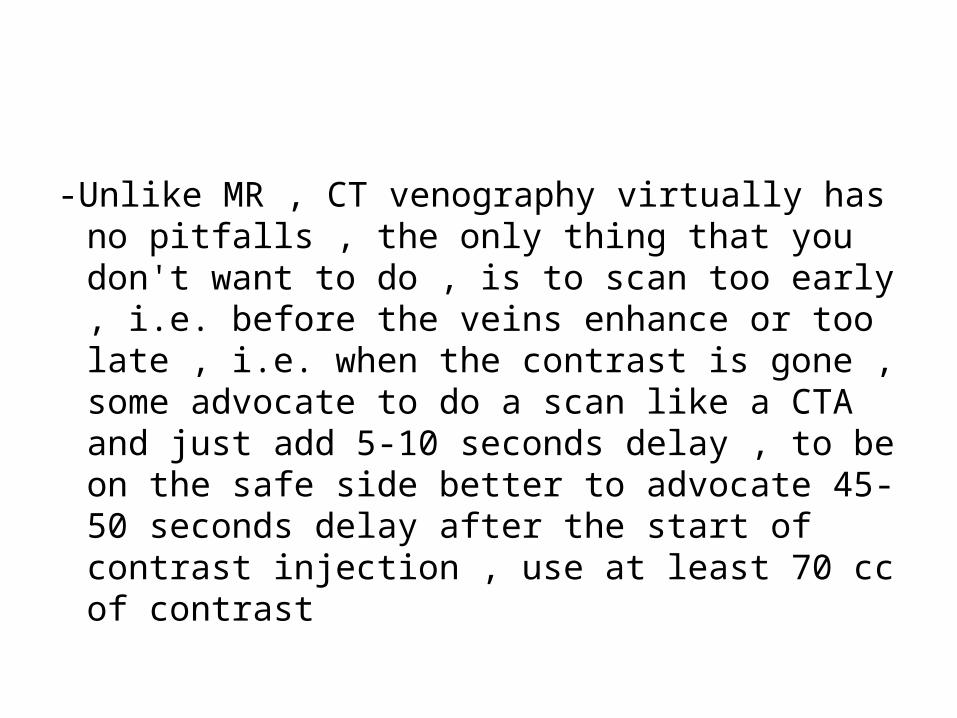
-Unlike MR , CT venography virtually has no pitfalls , the only thing that you don't want to do , is to scan too early , i.e. before the veins enhance or too late , i.e. when the contrast is gone , some advocate to do a scan like a CTA and just add 5-10 seconds delay , to be on the safe side better to advocate 45-50 seconds delay after the start of contrast injection , use at least 70 cc of contrast

Infarction in the area of the vein of Labbe, on the non-enhanced images you can appreciate the dense thrombus within the transverse sinus and the hemorrhage in the infarcted area, on the enhanced images a filling defect can be seen in the transverse sinus
b) MR Venography :-The MRI techniques that are used for the
diagnosis of cerebral venous thrombosis are :1-Time of Flight (TOF)2-Phase Contrast Angiography (PCA)3-Contrast Enhanced MRV

1-Time of Flight (TOF) :-MRI technique to visualize flow within vessels ,
without the need to administer contrast-It is based on the phenomenon of flow-related
enhancement of spins entering into an imaging slice
-As a result of being unsaturated , these spins give more signal that surrounding stationary spins

-With 2-D TOF , multiple thin imaging slices are acquired with a flow-compensated gradient-echo sequence , these images can be combined by using a technique of reconstruction such as maximum intensity projection (MIP) to obtain a 3D image of the vessels analogous to conventional angiography
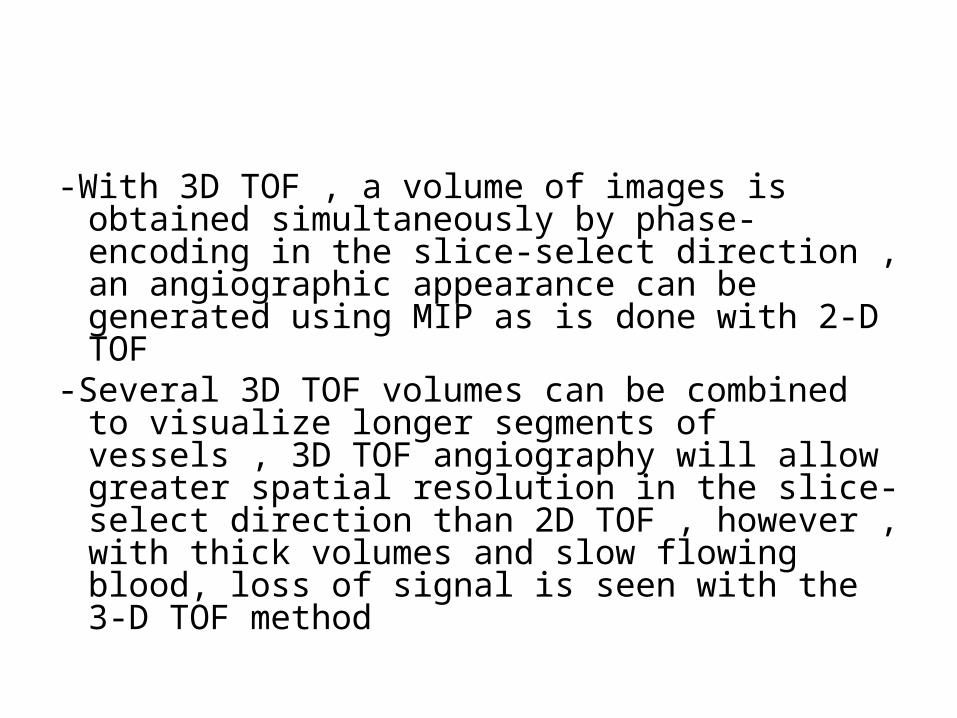
-With 3D TOF , a volume of images is obtained simultaneously by phase-encoding in the slice-select direction , an angiographic appearance can be generated using MIP as is done with 2-D TOF
-Several 3D TOF volumes can be combined to visualize longer segments of vessels , 3D TOF angiography will allow greater spatial resolution in the slice-select direction than 2D TOF , however , with thick volumes and slow flowing blood, loss of signal is seen with the 3-D TOF method
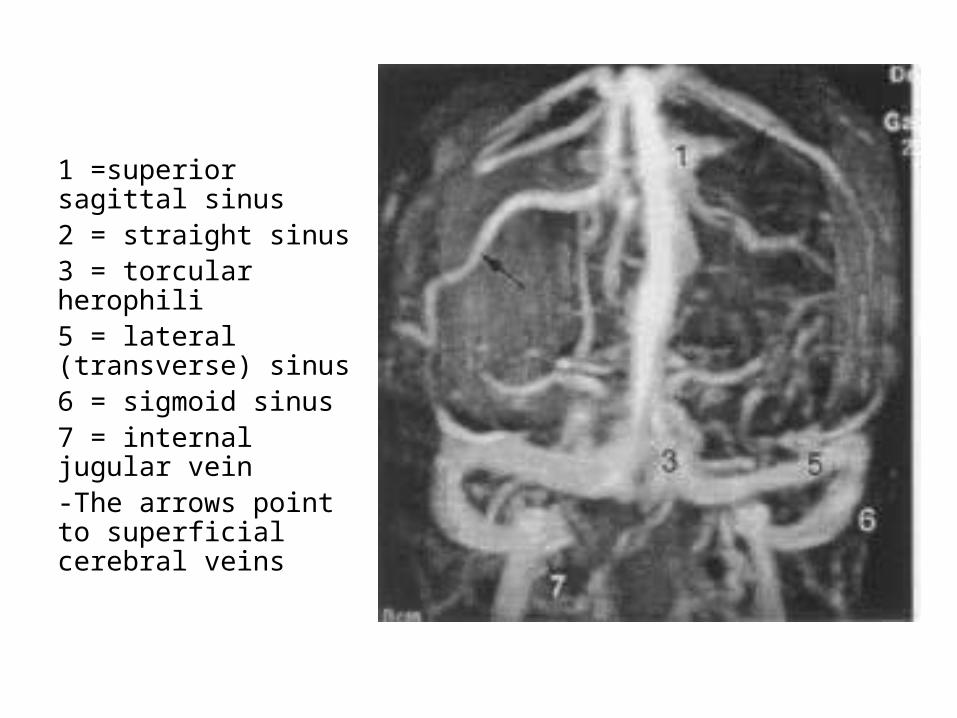
1 =superior sagittal sinus2 = straight sinus3 = torcular herophili5 = lateral (transverse) sinus6 = sigmoid sinus7 = internal jugular vein-The arrows point to superficial cerebral veins

1 =superior sagittal sinus2 = straight sinus3 = torcular herophili4 = vein of Galen5 = lateral ( transverse ) sinus6 = sigmoid sinus7 = internal jugular vein8 = internal cerebral vein9 = basal vein of RosenthalThe arrows point to superficial cerebral veins
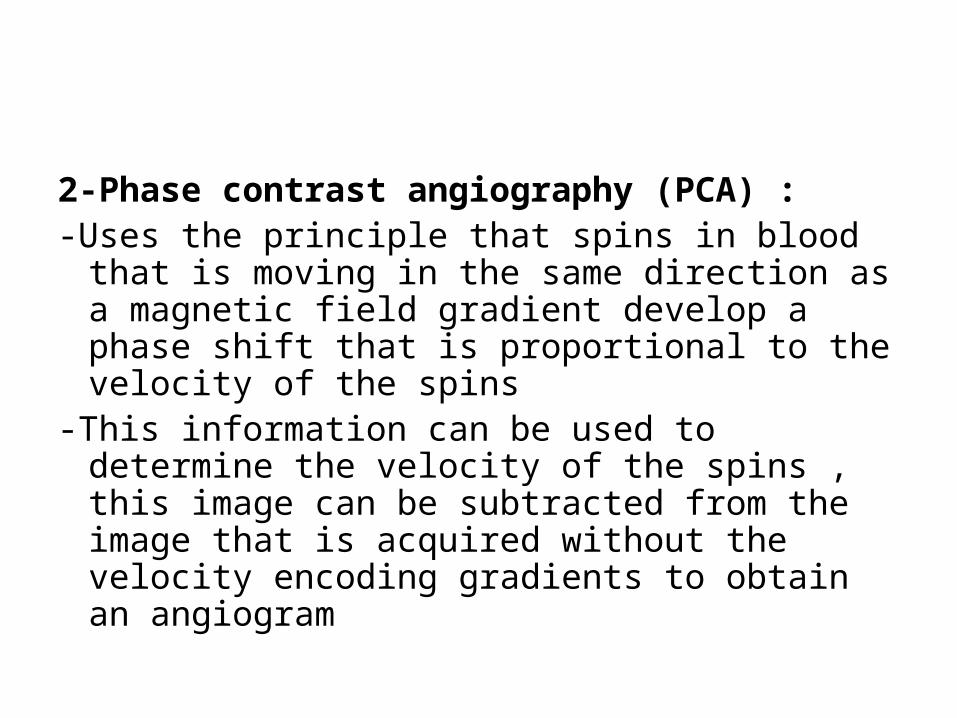
2-Phase contrast angiography (PCA) :-Uses the principle that spins in blood that is
moving in the same direction as a magnetic field gradient develop a phase shift that is proportional to the velocity of the spins
-This information can be used to determine the velocity of the spins , this image can be subtracted from the image that is acquired without the velocity encoding gradients to obtain an angiogram

Transverse MIP image of a Phase-Contrast angiography , the right transverse sinus and jugular vein have no signal due to thrombosis
3-Contrast enhanced MRV :-Uses the T1-shortening of Gadolinium-It is similar to contrast-enhanced CTV
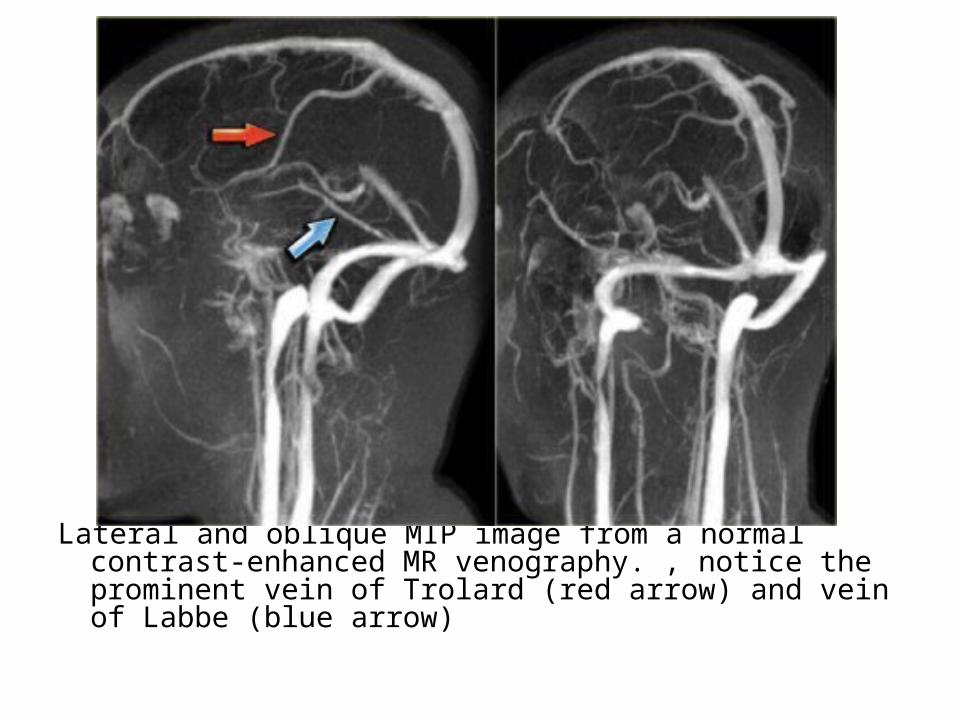
Lateral and oblique MIP image from a normal contrast-enhanced MR venography. , notice the prominent vein of Trolard (red arrow) and vein of Labbe (blue arrow)

CE-MRV , sagittal (A) and axial (B) thin MIP images shows filling defects within the SSS (A, large arrow) and transverse and sigmoid sinuses (B, small arrows) consistent with thrombosis, note the high diagnostic quality of the vein of Galen (A, arrowhead) , the basal vein of Rosenthal (A, small arrow), and the internal cerebral veins (A, thin large arrow)
c) Digital Subtraction Angiography (DSA) :Angiography is only performed in severe cases ,
when an intervention is planned

Thrombosis of the SSS (red arrow) , straight sinus (blue arrow) and transverse and sigmoid sinus (yellow arrow)

8-Chronic Dural Sinus Thrombosis and Related Syndromes :
-Chronic dural sinus thrombosis can lead to dural arteriovenous fistula formation and to increased CSF pressure
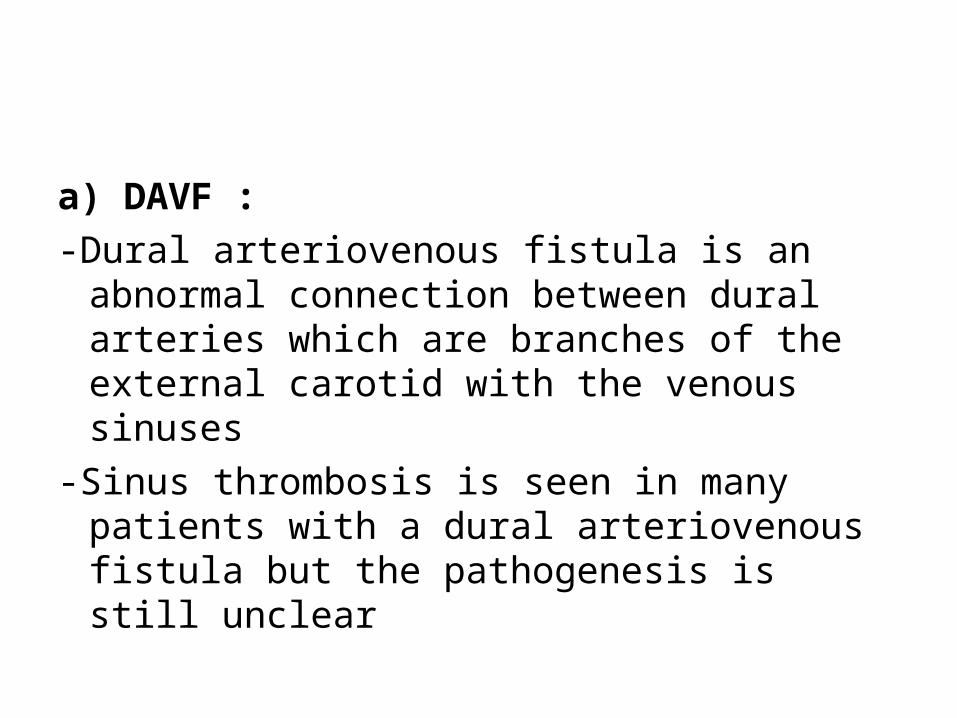
a) DAVF :-Dural arteriovenous fistula is an abnormal
connection between dural arteries which are branches of the external carotid with the venous sinuses
-Sinus thrombosis is seen in many patients with a dural arteriovenous fistula but the pathogenesis is still unclear

-There are two possible mechanisms:1-Thrombophlebitis of the dural sinus may
induce a dural fistula2-In the course of a dural fistula flow reversal
may lead to thrombosis-Current classifications of DAVF focus mainly on
the presence of leptomeningeal reflux related to cerebral venous hypertension leading to cerebral venous infarction or hemorrhage
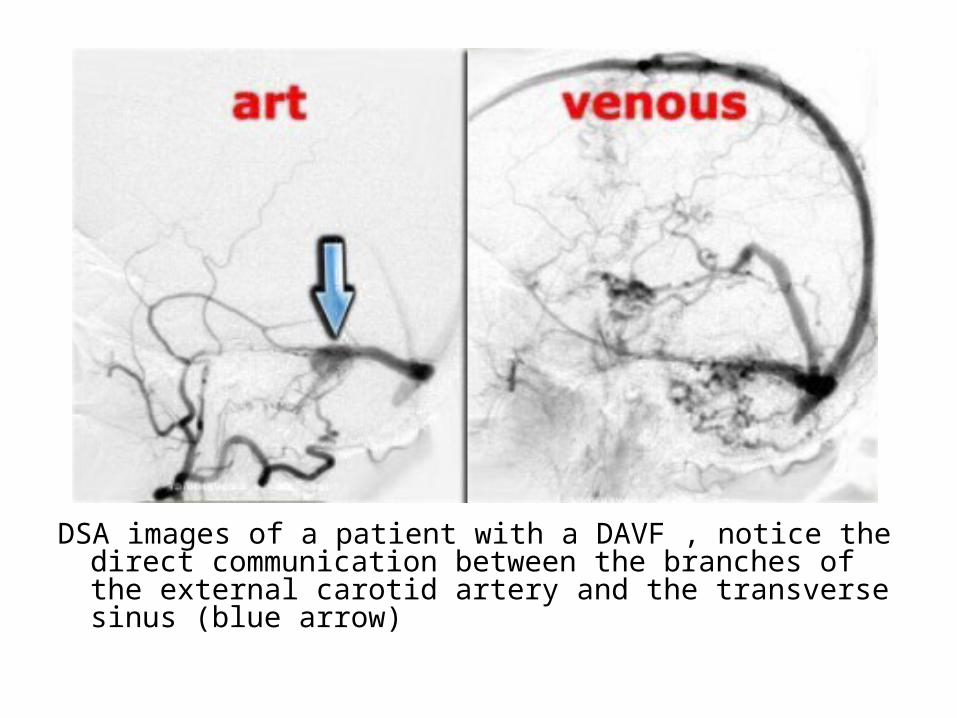
DSA images of a patient with a DAVF , notice the direct communication between the branches of the external carotid artery and the transverse sinus (blue arrow)
b) Thrombosis and increased CSF pressure :-In some patients dural sinus thrombosis may
even after recanalization lead to persisting disturbances in venous circulation
-This may lead to raised intracranial CSF pressure as assessed by lumbar puncture
-Clinically , these patients complain of headaches and they may have vision disturbances due to papiledema
-On MRI , one may see increased CSF around the optic nerve and an empty sella
-Apparently in some patients a residual stenosis persists
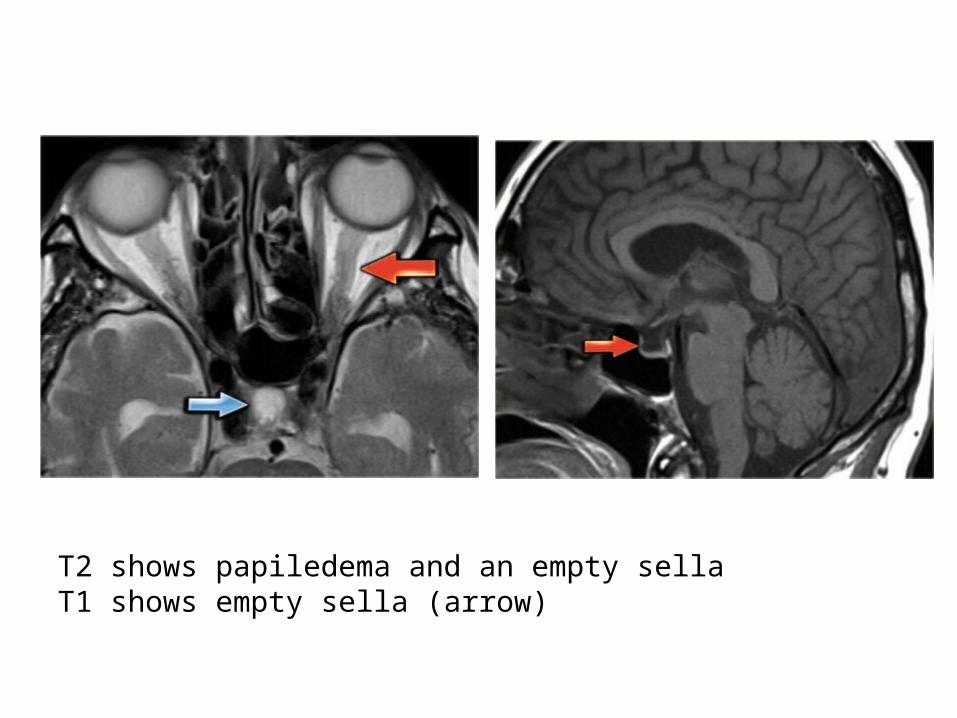
T2 shows papiledema and an empty sellaT1 shows empty sella (arrow)

Intracranial Hematomaa) Classificationb) Stagingc) CTd) MRI

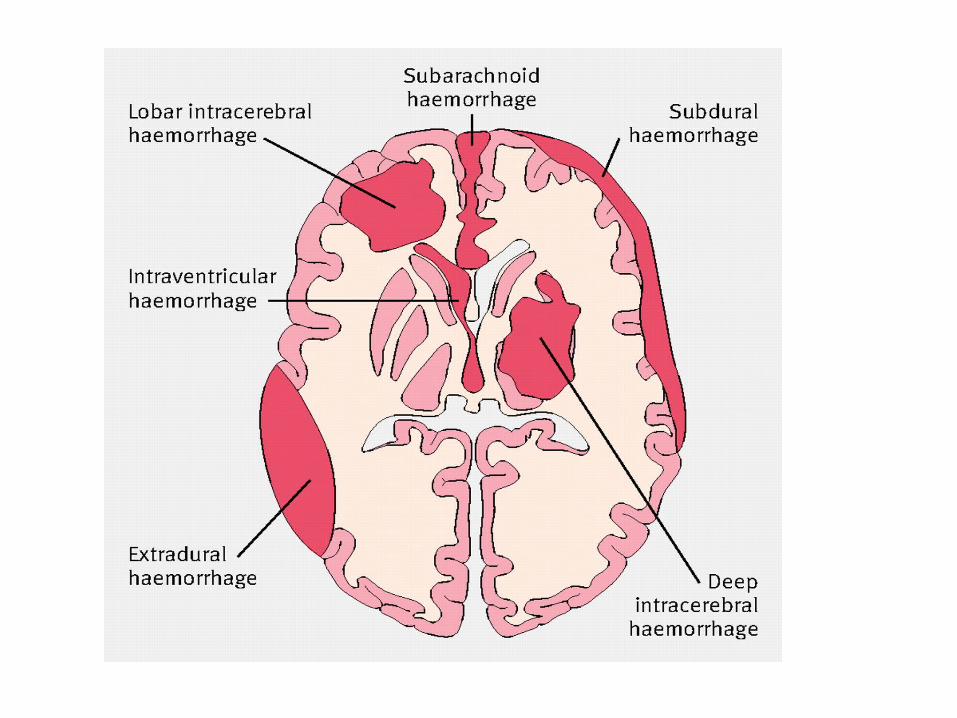
a) Classification :Can be classified into :1-Intracerebral (Intra-axial) Type2-Extracerebral (Extra-axial) Type
1-Intracerebral (Intra-axial) :-These can occur in the cerebral hemispheres ,
the cerebellar hemispheres or brainstem-More in males , steadily increases with age and
peaks in the eight decade
-The mechanisms responsible for ICH include :1-Hypertension2-Hemorrhagic infarction 3-Cerebral amyloid angiopathy4-Vascular malformations5-Bleeding into primary or metastatic brain tumors6-Coagulopathies (due to the use of anticoagulants and
thrombolytic agents)7-Sympathomimetic drugs effect (amphetamines ,
phenylpropanolamine and cocaine )8-Vasculitis9-Moyamoya

1-Intraparenchymal hemorrhage associated with hypertension :
-This entity affects patients in the average age of 50-60 years
-Chronic hypertension is the most common cause of spontaneous adult intraparenchymal hemorrhage
-Most commonly occurs in deep brain structures like basal ganglia (especially putamen) , thalamus , pons and cerebellum
-An additional MR specific findings suggesting hypertensive hemorrhage is the presence of microhemorrhages on T2* (GRE or SWI) in the basal ganglia or brainstem

Hypertensive hemorrhage , NECT show a left thalamic hemorrhage (yellow arrow) with extension into the left ventricle occipital horn (red arrow)
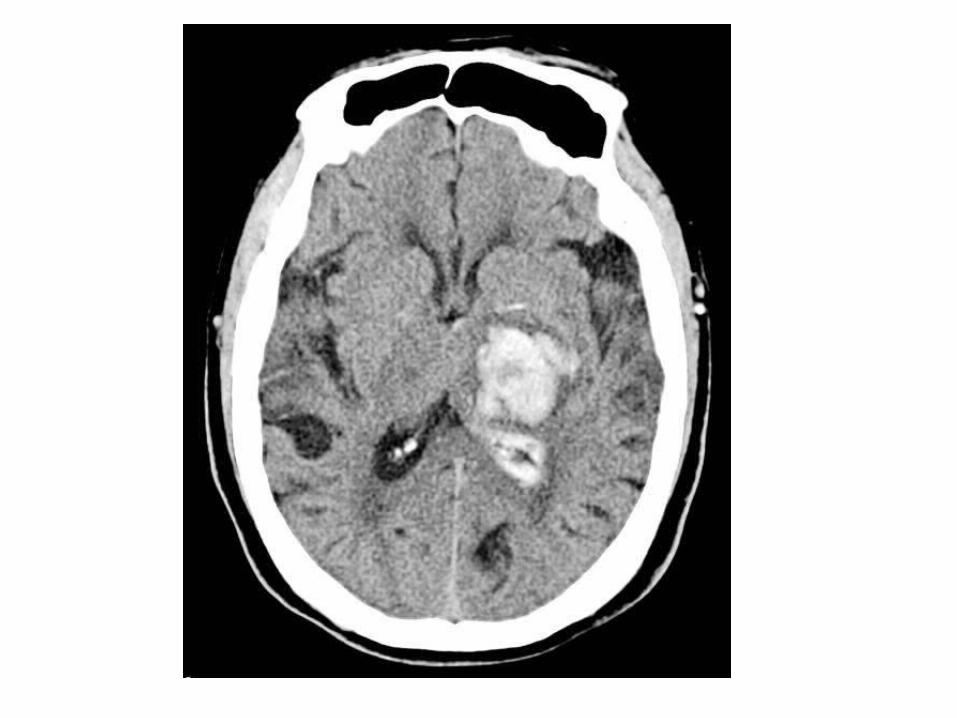


-Intraparenchymal hemorrhage associated with hypertension , sagittal T1 and axial T2 FLAIR show a hyperintense hematoma located in the left putamen , this location is typical of hypertensive hemorrhage , SWI shows a halo of hemosiderin in the periphery of the hematoma (arrow) , an hemorrhage of chronic evolution and of the same etiology is seen in the contralateral basal ganglia
2-Hemorrhagic transformation secondary to ischemic stroke :
-T2 FLAIR , GRE or SWI sequences , diffusion-weighted and ADC can give information about non-hemorrhagic areas and show the blood within the infarct
-Venous thrombosis , thrombosis of cortical veins or deep venous sinuses leads to venous hypertension which may cause infarction & parenchymal hemorrhage
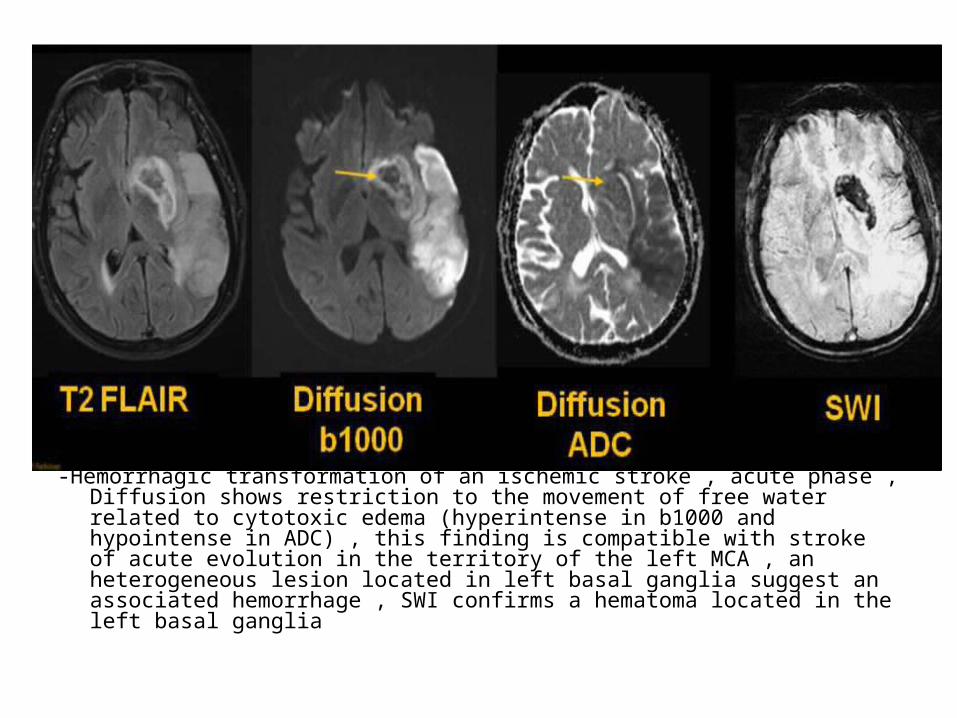
-Hemorrhagic transformation of an ischemic stroke , acute phase , Diffusion shows restriction to the movement of free water related to cytotoxic edema (hyperintense in b1000 and hypointense in ADC) , this finding is compatible with stroke of acute evolution in the territory of the left MCA , an heterogeneous lesion located in left basal ganglia suggest an associated hemorrhage , SWI confirms a hematoma located in the left basal ganglia
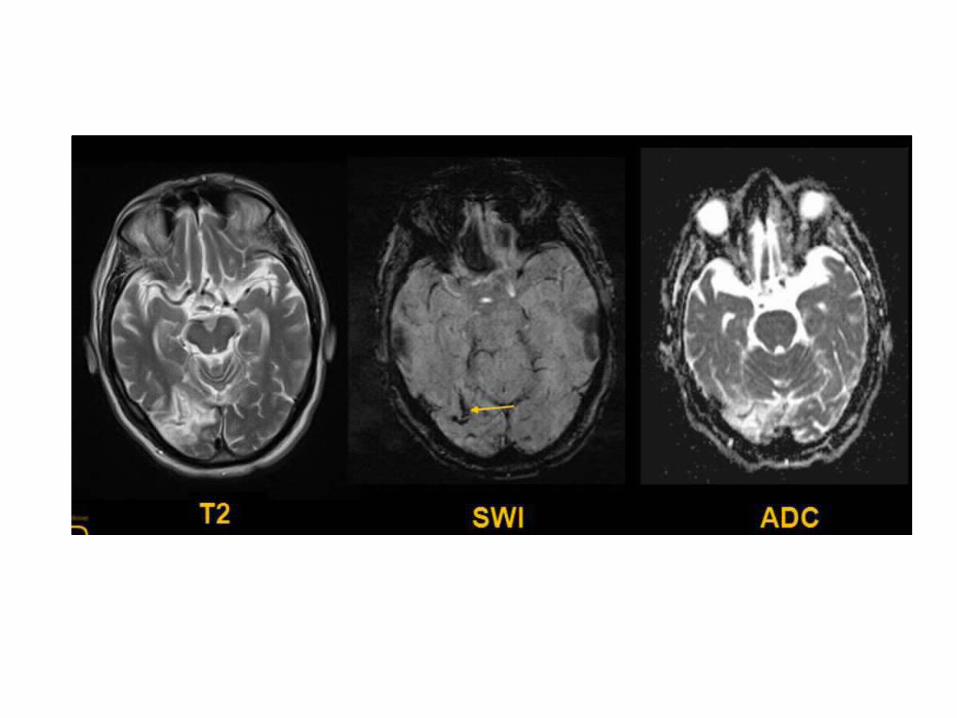

-Hemorrhagic transformation of an ischemic stroke , Chronic phase , T2 shows a hyperintense lesion located in the right occipital lobe with hemosiderin deposits (arrow) on SWI sequence , related to a cerebral parenchymal hemorrhagic infarct , there is no free water movement restriction in ADC
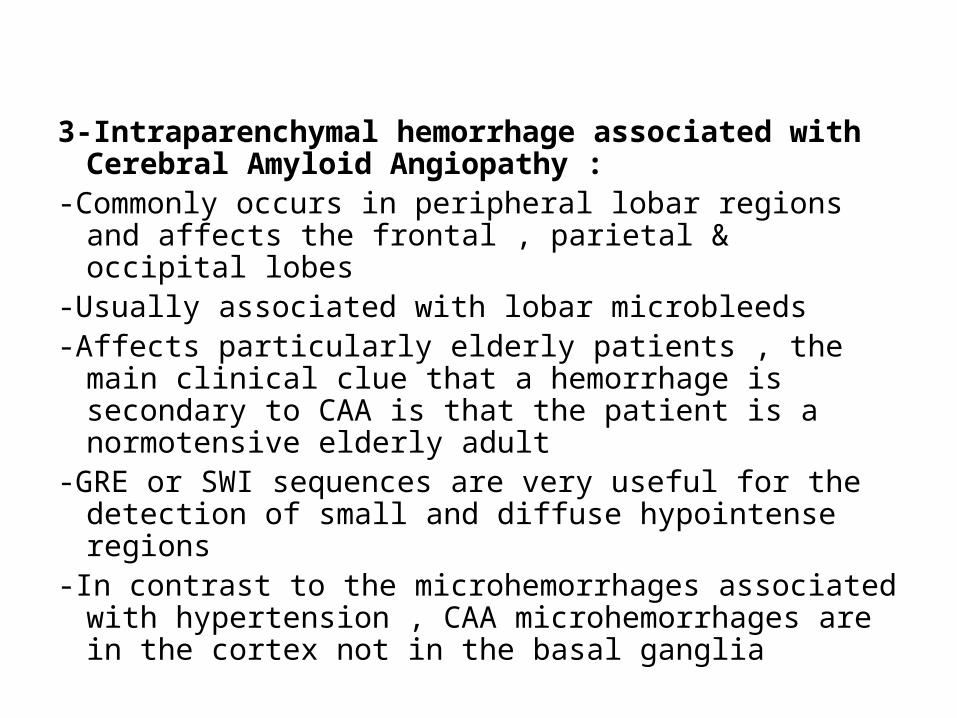
3-Intraparenchymal hemorrhage associated with Cerebral Amyloid Angiopathy :
-Commonly occurs in peripheral lobar regions and affects the frontal , parietal & occipital lobes
-Usually associated with lobar microbleeds-Affects particularly elderly patients , the main clinical
clue that a hemorrhage is secondary to CAA is that the patient is a normotensive elderly adult
-GRE or SWI sequences are very useful for the detection of small and diffuse hypointense regions
-In contrast to the microhemorrhages associated with hypertension , CAA microhemorrhages are in the cortex not in the basal ganglia

-Intraparenchymal hemorrhage associated with cerebral amyloid angiopathy , 70 years old male patient with lobar hemorrhagic collections in different stages , SWI identified multiples hypointense foci (arrow) in relation to microbleedings , their distribution and multiplicity are typical of hemosiderin deposits in the context of cerebral amyloid angiopathy
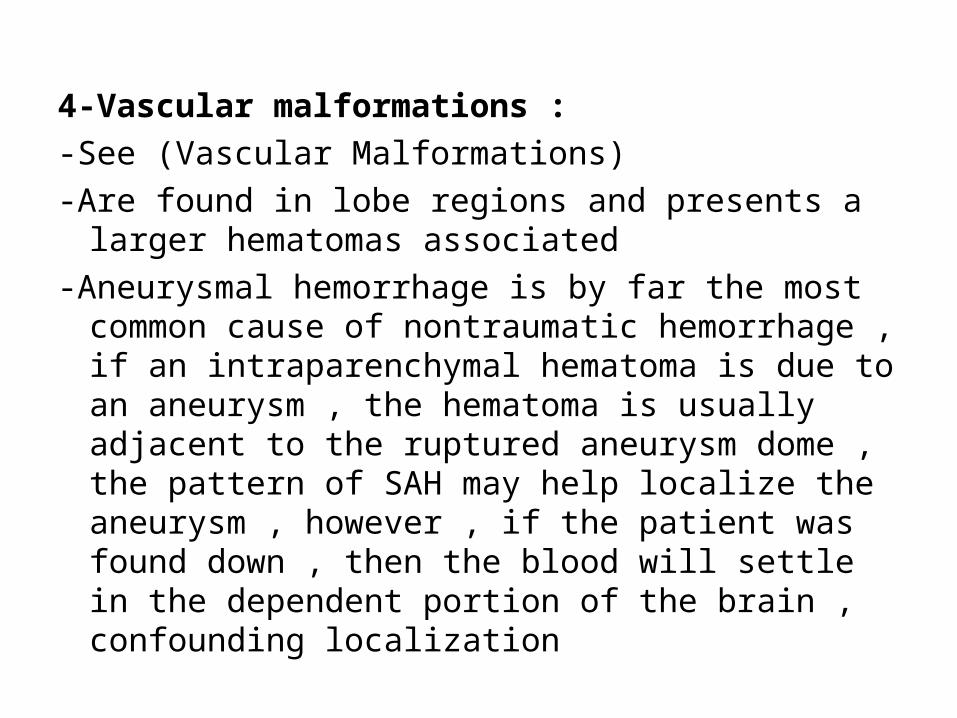
4-Vascular malformations :-See (Vascular Malformations)-Are found in lobe regions and presents a larger
hematomas associated-Aneurysmal hemorrhage is by far the most common
cause of nontraumatic hemorrhage , if an intraparenchymal hematoma is due to an aneurysm , the hematoma is usually adjacent to the ruptured aneurysm dome , the pattern of SAH may help localize the aneurysm , however , if the patient was found down , then the blood will settle in the dependent portion of the brain , confounding localization

-In case of AVM rupture , the resultant hematoma is usually parenchymal , in contrast to amyloid angiopathy , a hematoma from a bleeding AVM tends to affect younger patients
-Dural AVFs is a group of high-flow vascular malformations characterized by a fistulous connection between a meningeal artery and a venous sinus or cortical vein , cavernous sinus (cavernous-carotid fistula) & posterior fossa dAVFs are the most common types
-Cavernoma , although non-hemorrhagic cavernomas have a characteristic MRI with popcorn-like lobular mixed/high signal on T1 & T2 and a dark peripheral hemosiderin rim , once bleeding occurs , the resultant hematomas has nonspecific imaging features , the presence of a developmental venous anomaly adjacent to a hematoma may suggest the diagnosis of a recently hemorrhaged cavernoma


5-Hemorrhage Secondary to Tumors :-There is more edema and mass effect compared to simple
bleeding and the vasogenic edema is persistent on time-Most common primary tumor to cause hemorrhage is
glioblastoma-There are relatively limited number of extracranial primary
tumors known to cause hemorrhagic metastases , including :Choriocarcinoma , melanoma , thyroid carcinoma , renal cell
carcinoma-In cases where the diagnosis is unclear , a follow-up MRI should
be performed once the initial hemorrhagic improves , it tumor is present , the MRI may show a delay in the expected evolution of blood products , persistent edema & enhancement of the underlying tumor
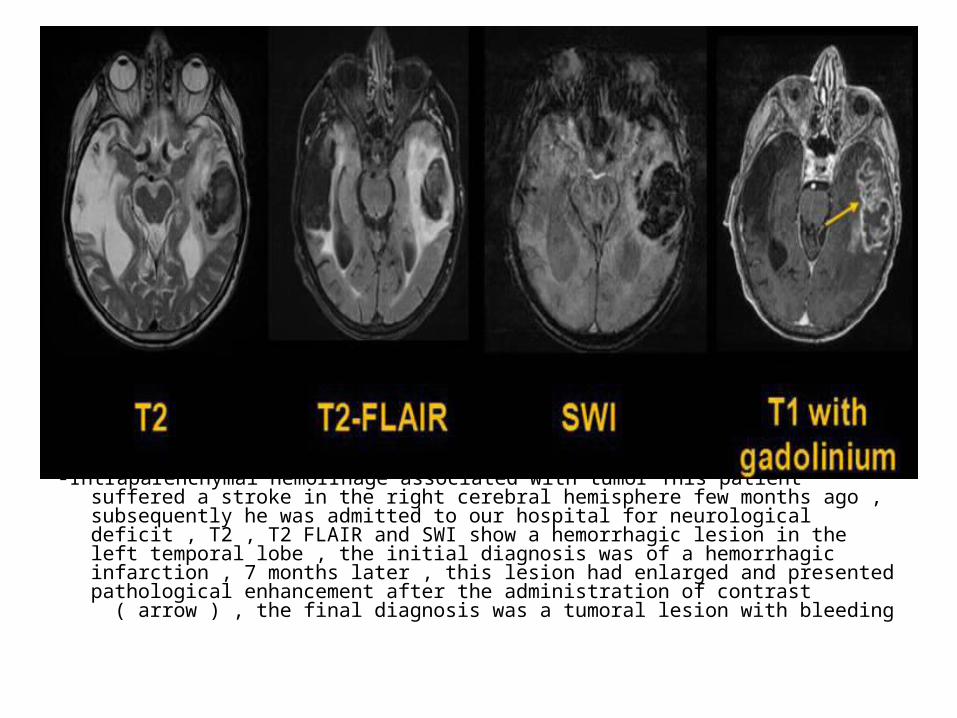
-Intraparenchymal hemorrhage associated with tumor This patient suffered a stroke in the right cerebral hemisphere few months ago , subsequently he was admitted to our hospital for neurological deficit , T2 , T2 FLAIR and SWI show a hemorrhagic lesion in the left temporal lobe , the initial diagnosis was of a hemorrhagic infarction , 7 months later , this lesion had enlarged and presented pathological enhancement after the administration of contrast ( arrow ) , the final diagnosis was a tumoral lesion with bleeding

6-Coagulopathies (due to the use of anticoagulants and thrombolytic agents)
7-Sympathomimetic drugs effect (amphetamines , phenylpropanolamine and cocaine)
8-Vasculitis :-Vasculitis affecting the CNS may be primary or secondary to
systemic vasculitides-The most common presentation of vasculitis is cerebral ischemia ,
less commonly , vasculitis may present with frank hemorrhage-Standard MRI imaging shows multiple foci of T2 prolongation in
the basal ganglia & subcortical white matter-Angiography is the most sensitive test and shows multifocal areas
of stenosis & dilatation

9-Moyamoya :-Moyamoya is a non-atherosclerotic vasculopathy
characterized by progressive stenosis of the intracranial internal carotid arteries & their proximal branches which leads to proliferation of fragile lenticulostriate collateral vessels
-Angiography of the enlarged basal perforating arteries gives a puff of smoke appearance
-The ivy sign on FLAIR represents tubular branching hyperintense structures within the sulci representing cortical arterial branches that appear hyperintense due to slow collateral flow
-Perfusion studies show decreased flow in the affected vascular regions

Arrows indicate the ivy sign
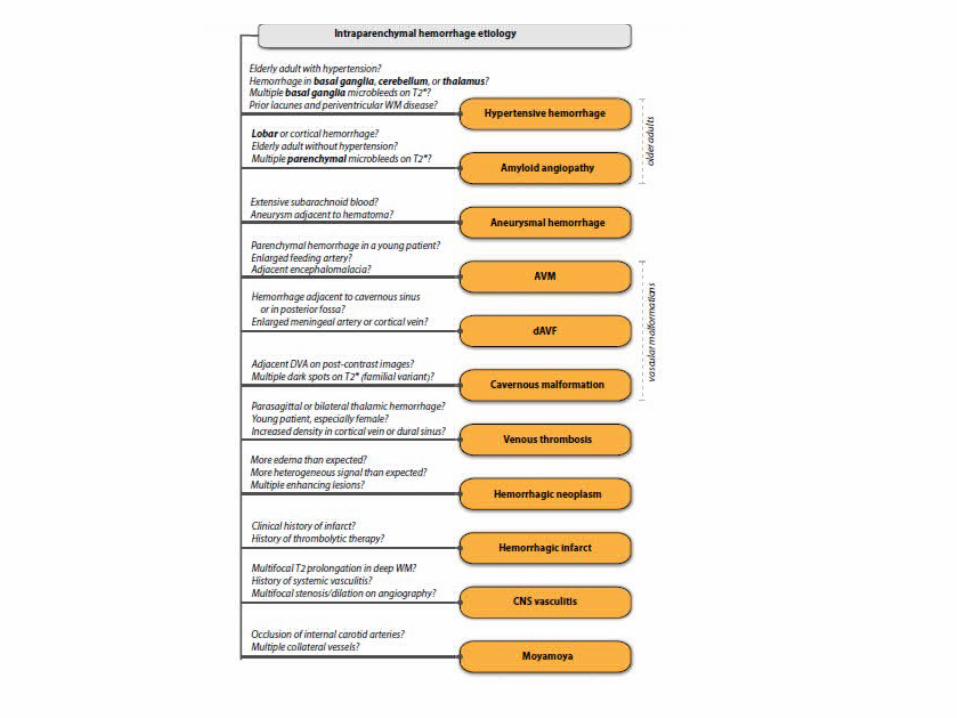
2-Extracerebral (Extra-axial) : -The blood can be located in the ventricular
system , subarachnoid spaces , subdural space and epidural space
-Extracerebral Hemorrhages compromise :a) Epidural Hemorrhage (EDH)b) Subdural Hemorrhage (SDH)c) Subarachnoid Hemorrhage (SAH)d) Intraventricular Hemorrhage (IVH)
a) Epidural Hemorrhage (EDH) :-It is a blood collection extra-axial , results more
frequently from the laceration of the meningeal arteries
-Location : blood between the skull and the dura mater-Cause : It usually occurs after a severe head trauma and
the temporal lobe is affected more frequently-Characteristics : It is a well defined biconvex collection ,
it does not exceed the skull sutures and it can cross the midline

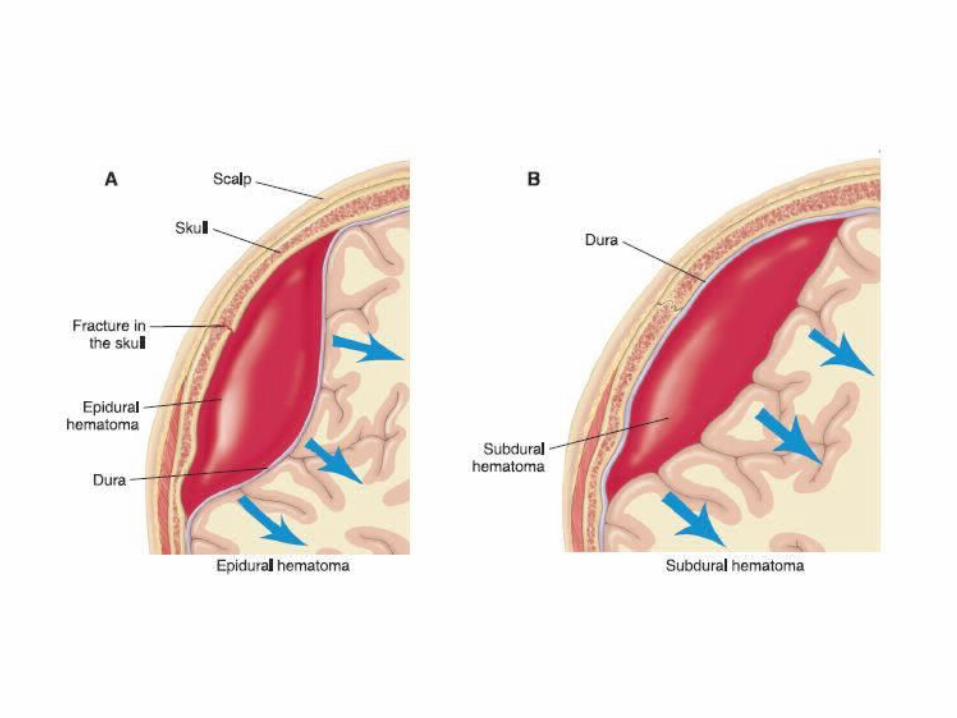

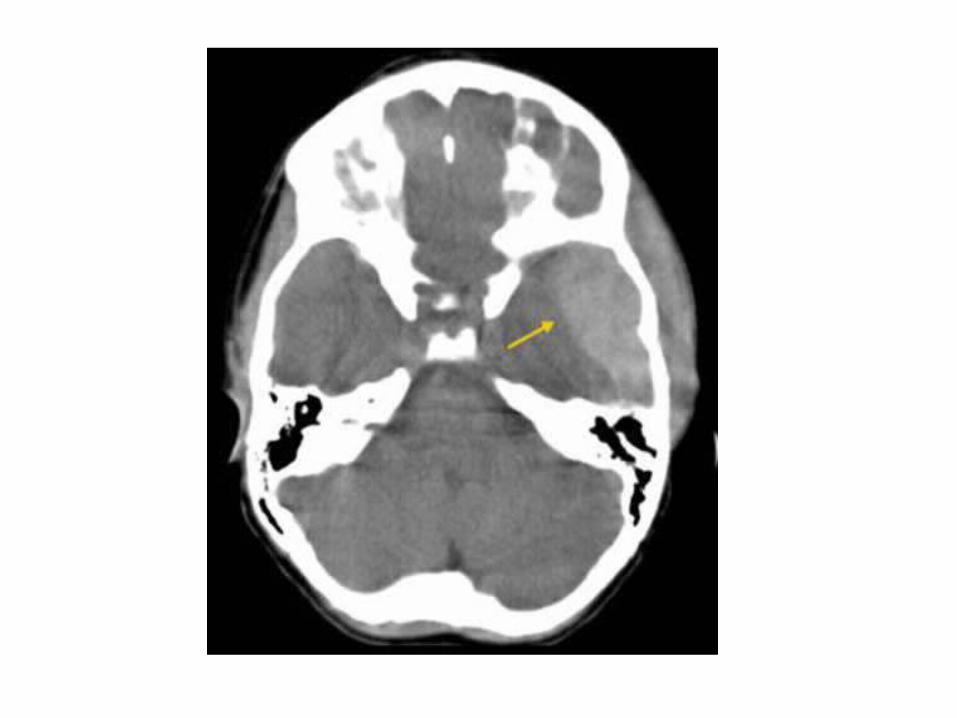
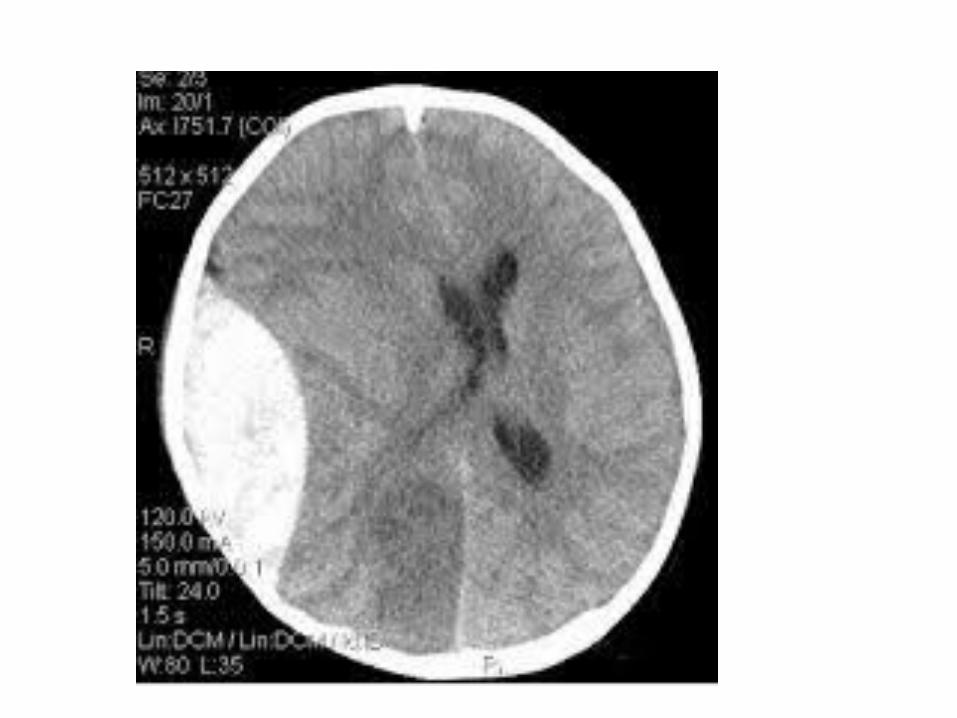
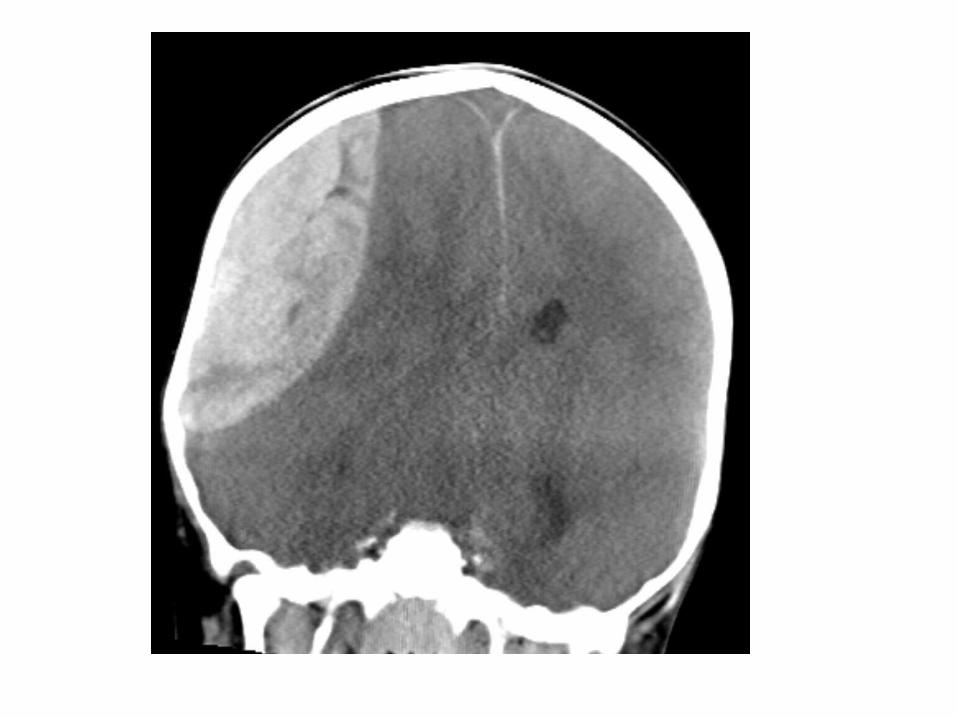
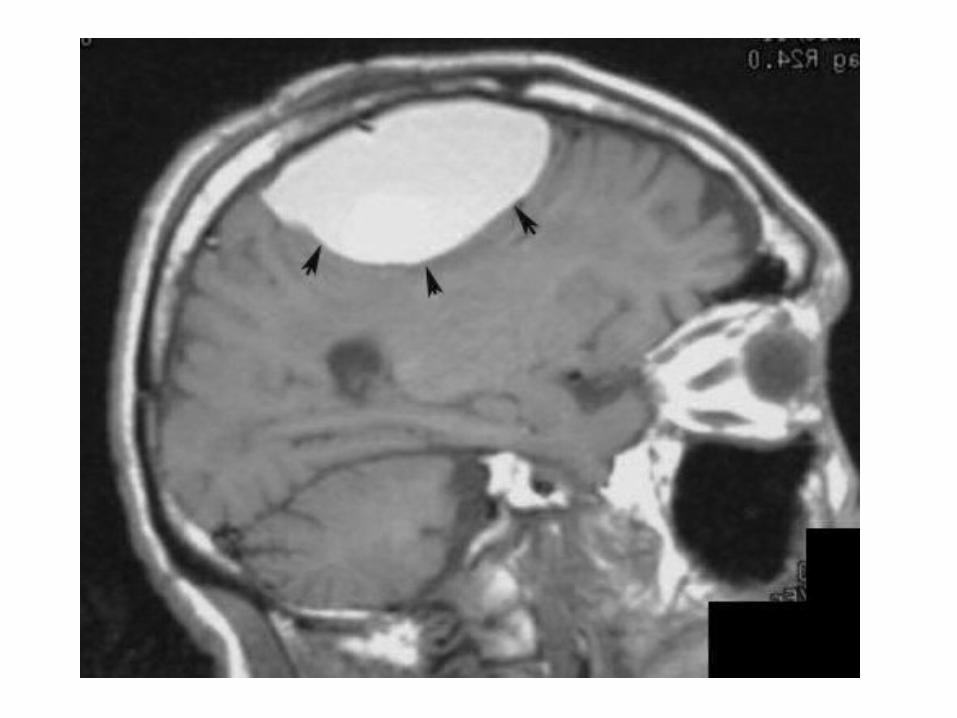

b) Subdural Hemorrhage (SDH) :-It is a blood collection extra-axial and generally it
occurs by laceration of a cortical vein-Location : They are located between the dura
mater and the arachnoid-Cause : Trauma is the most common cause-Characteristics : Crescentic extra-axial collection , it
can cross skull sutures , it never cross the midline due to it is reflected along the brain falx
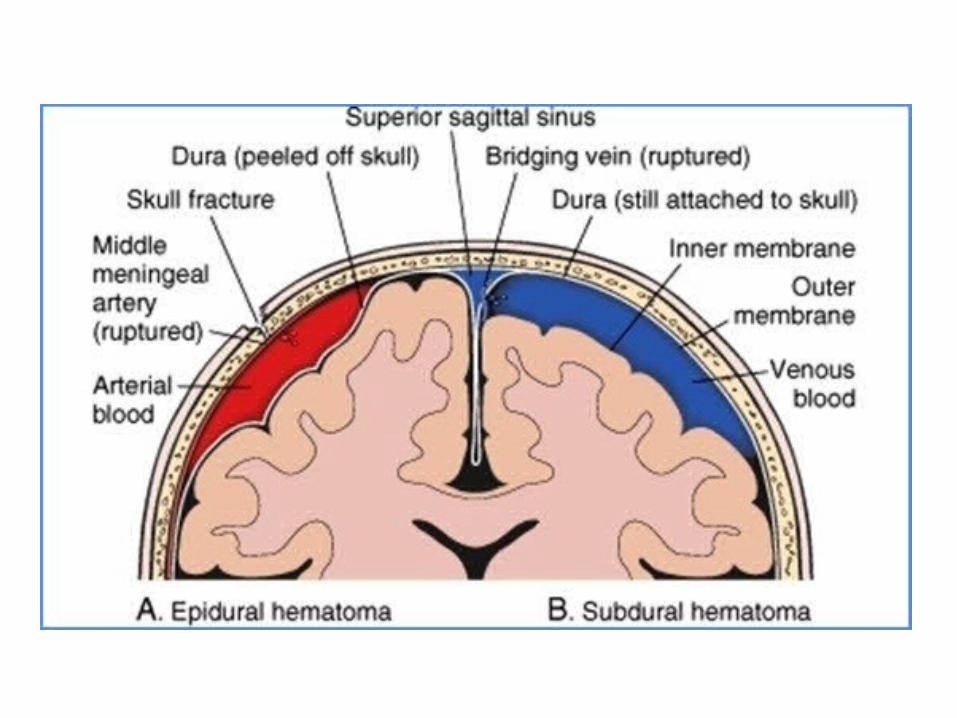


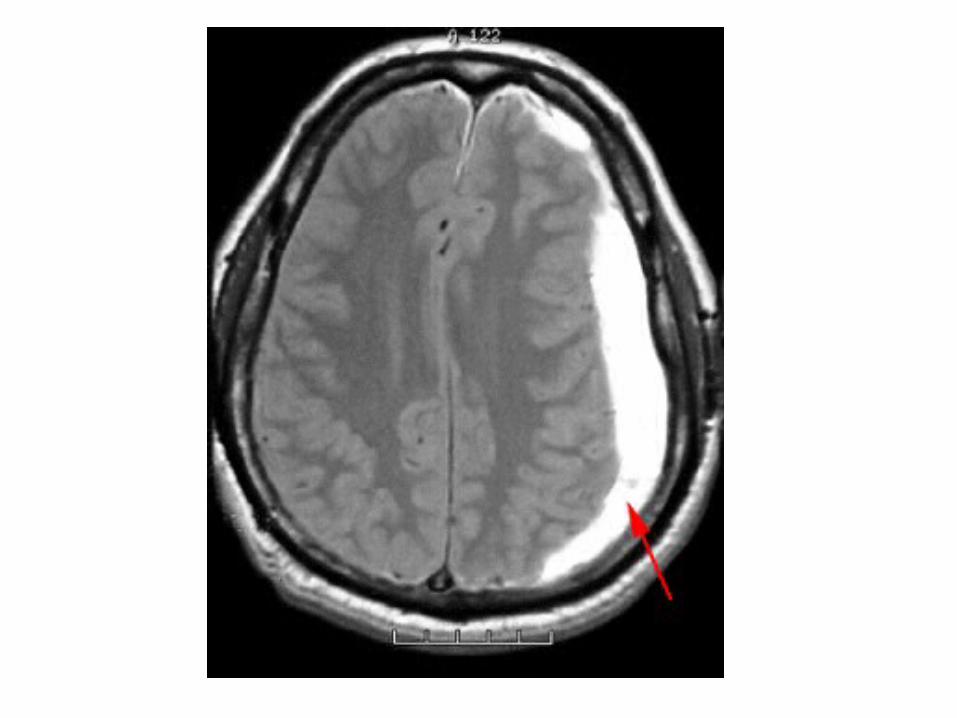
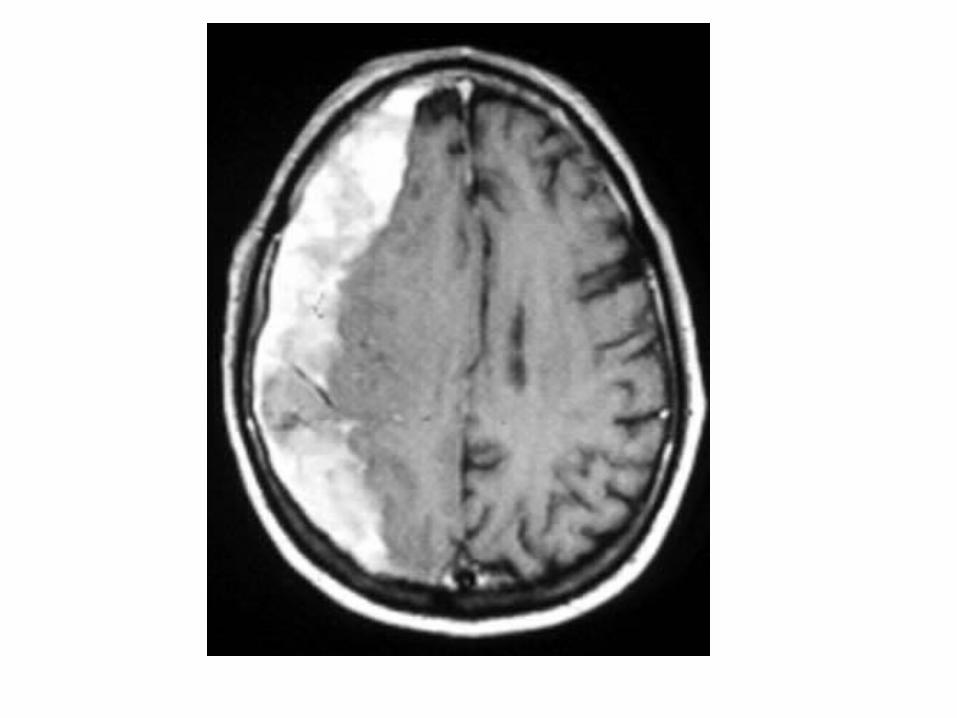

Subdural hematoma, axial and coronal CT , hyperdense hematoma of 14 hours of evolution located in the left side , corresponding to a subdural hematoma, axial T2 and coronal T1 MRI , in another patient , show a large subdural hematoma located in the right side , the hematoma is hyperintense in both sequences due to blood breakdown products , indicating a late subacute hematoma , this hematoma is causing mass effect with compression of the ipsilateral ventricular system and sulcal effacement
c) Subarachnoid Hemorrhage (SAH) :-It is a blood collection extra-axial-Can be traumatic (laceration of cortical veins or
arteries localized in the subarachnoid space or cortical contusions with extravasation of blood into the subarachnoid space) or non-traumatic (ruptured aneurysms)
-Location : there is an accumulation of blood within the subarachnoid space
-Cause : trauma is the most common cause-Characteristics : Blood within subarachnoid
spaces between pia and arachnoid membranes

-CT is very sensitive in detecting hyperdense blood in the basal cistern and subarachnoid space
-On MRI , the blood is diluted with the cerebrospinal fluid signal (CSF) , for this reason it is difficult to detect on normal T2-weighted sequences , on the other hand on T2-FLAIR sequences subarachnoid hemorrhage is easily detected as its signal is not suppressed like in normal CSF
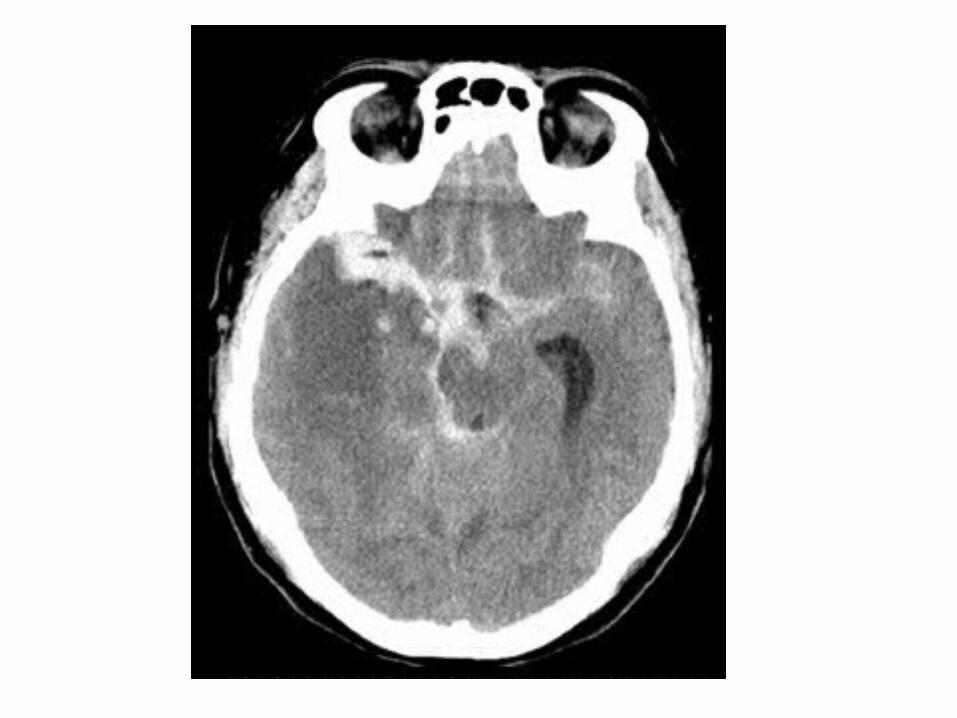
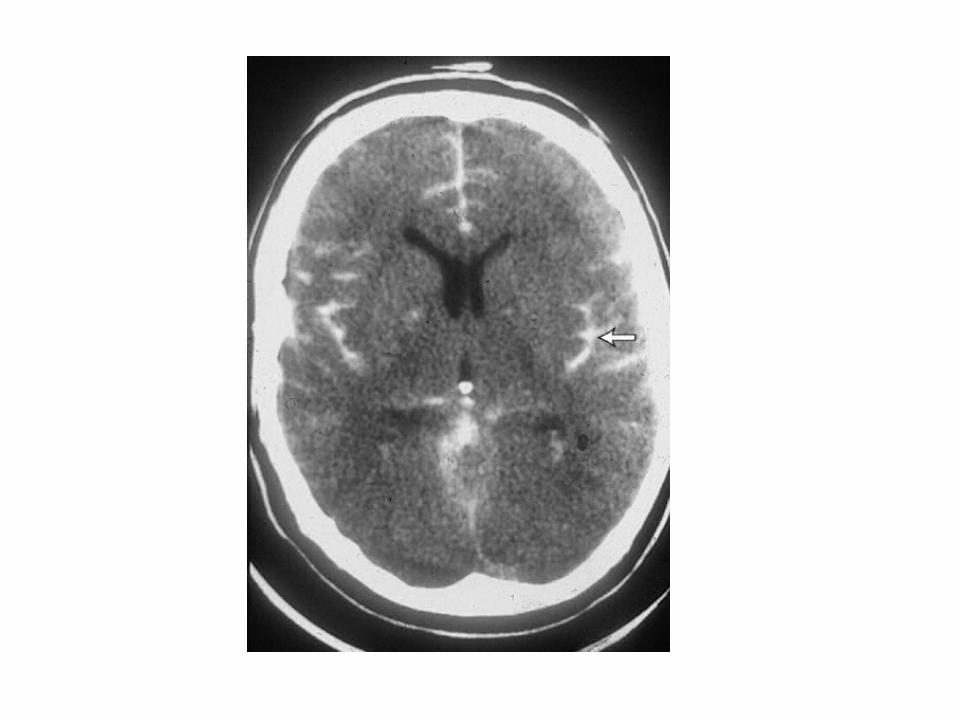

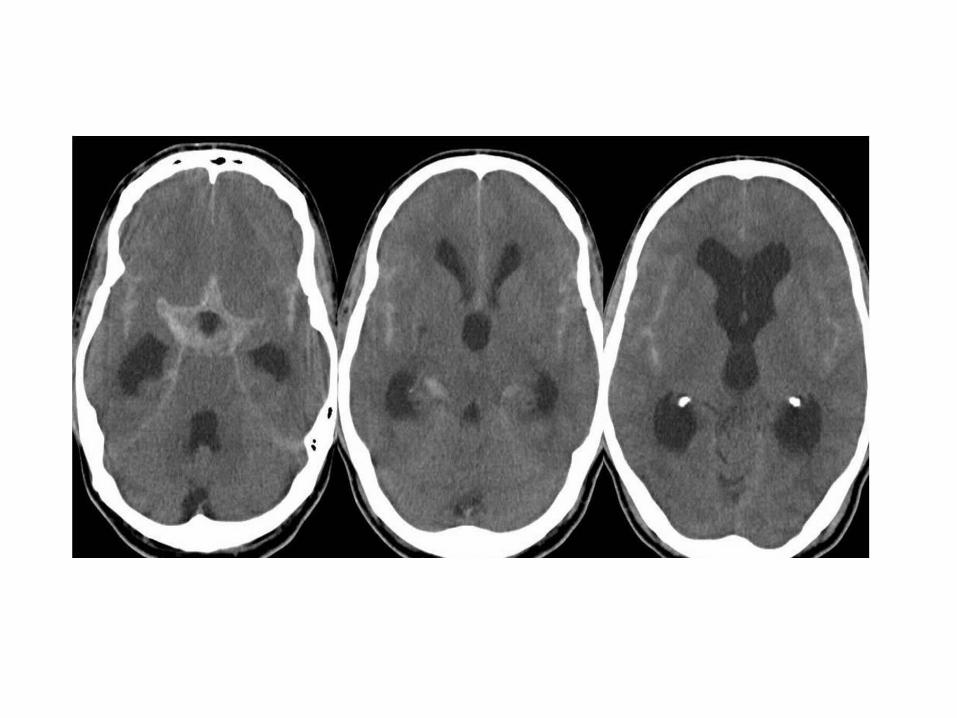
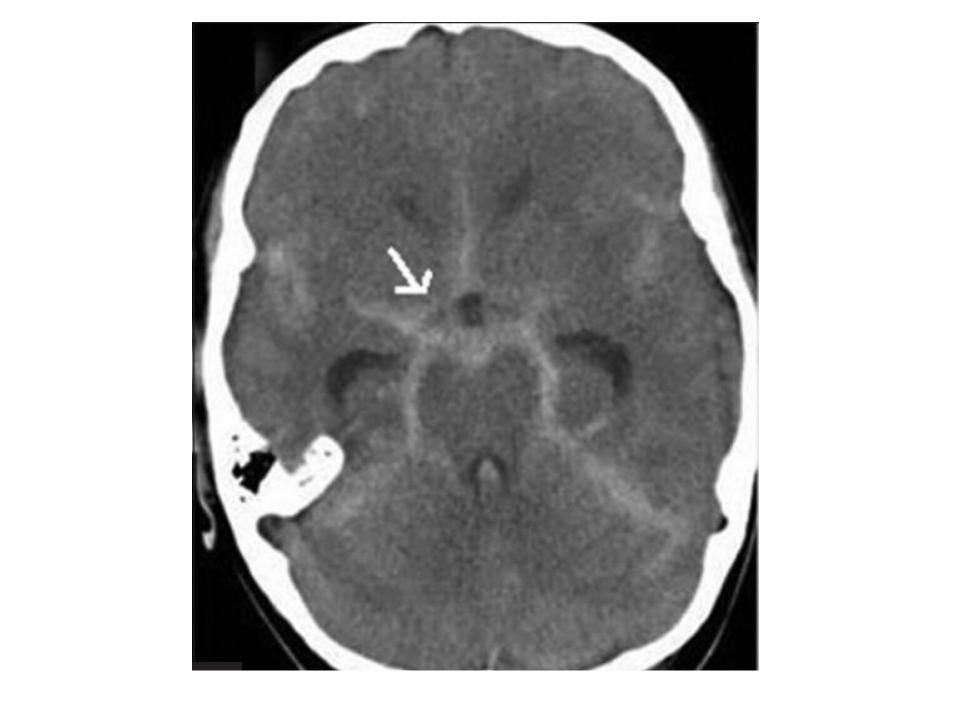

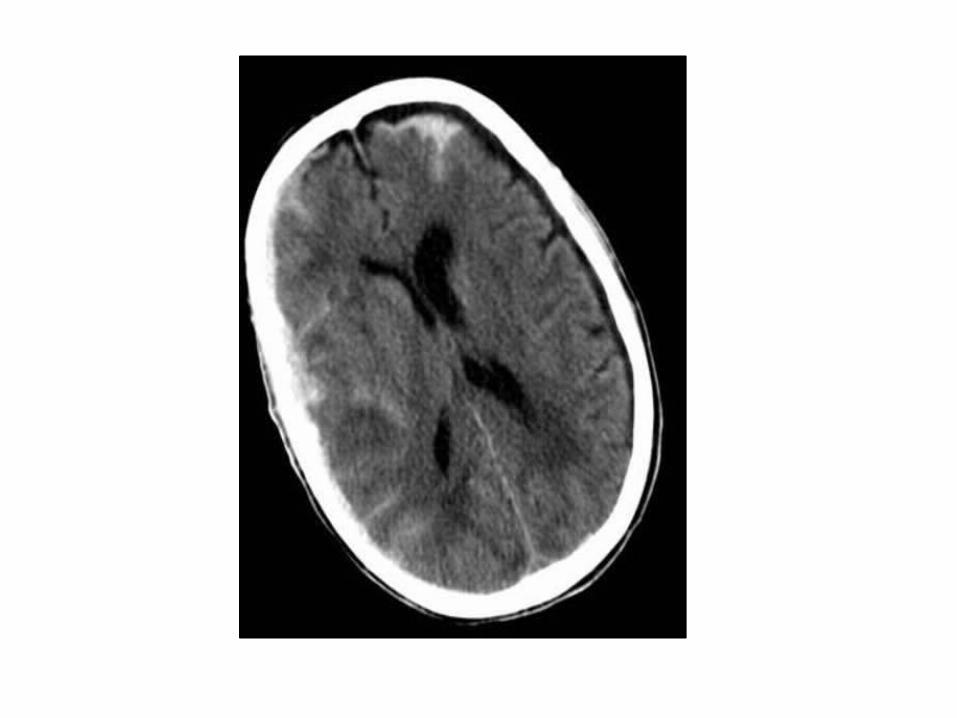
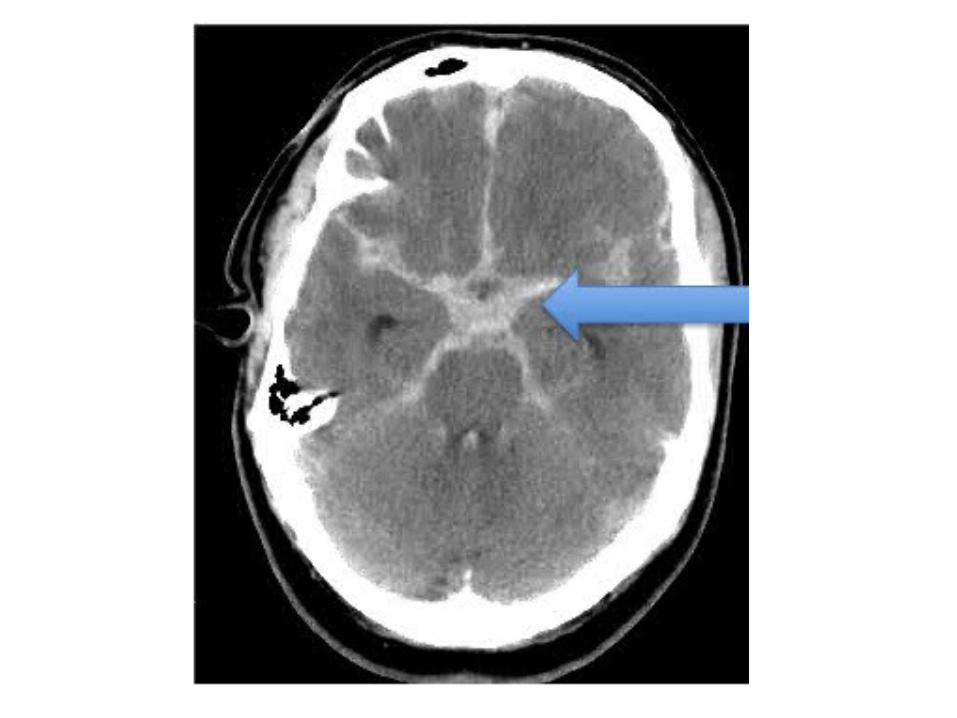
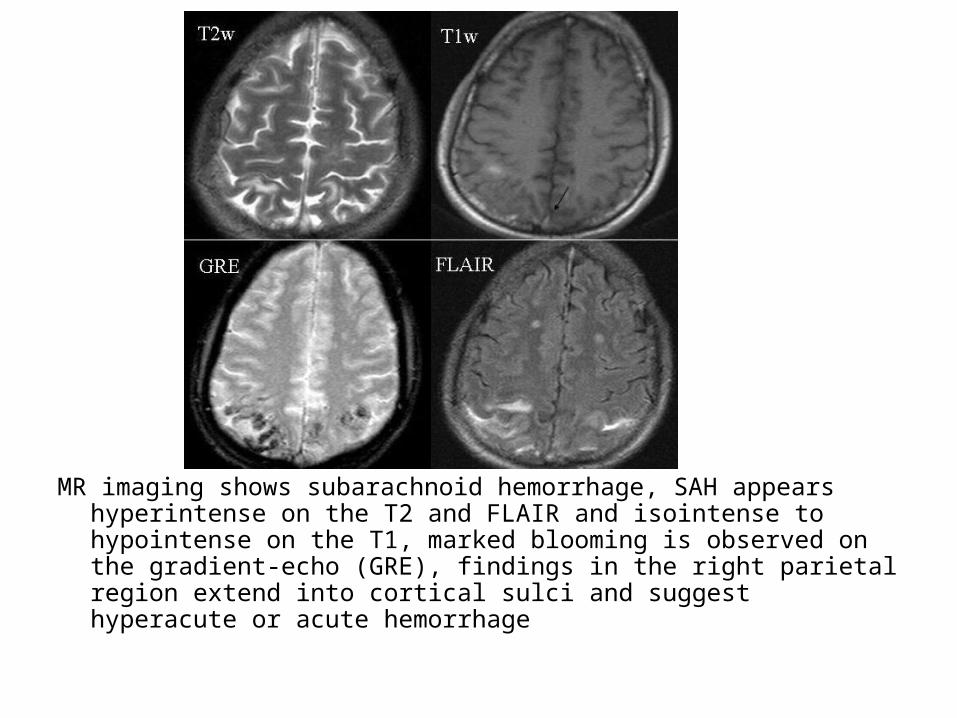
MR imaging shows subarachnoid hemorrhage, SAH appears hyperintense on the T2 and FLAIR and isointense to hypointense on the T1, marked blooming is observed on the gradient-echo (GRE), findings in the right parietal region extend into cortical sulci and suggest hyperacute or acute hemorrhage
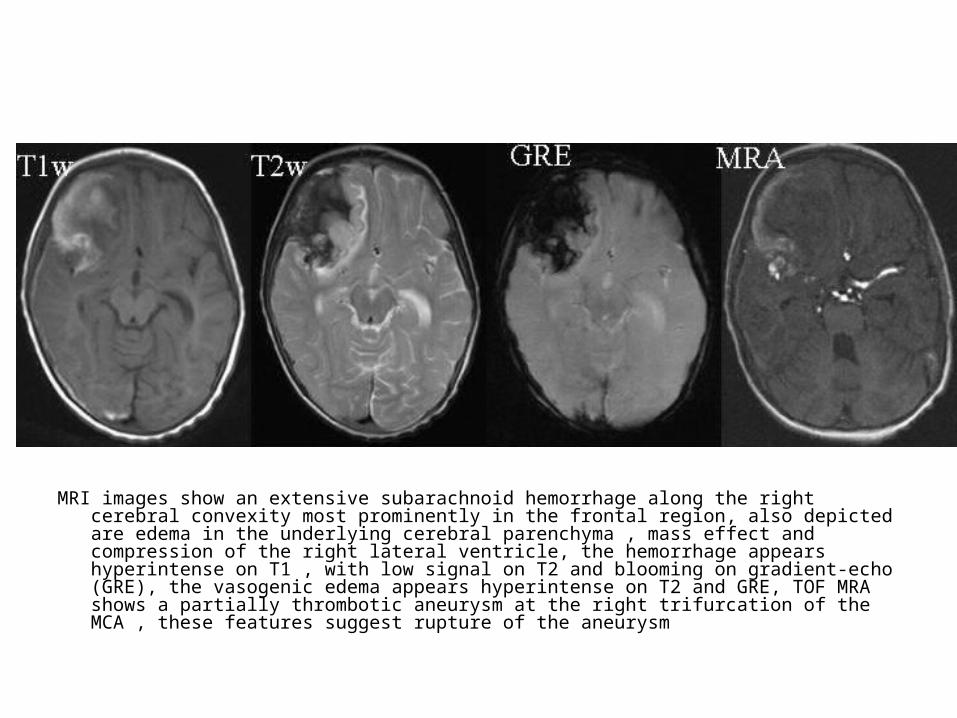
MRI images show an extensive subarachnoid hemorrhage along the right cerebral convexity most prominently in the frontal region, also depicted are edema in the underlying cerebral parenchyma , mass effect and compression of the right lateral ventricle, the hemorrhage appears hyperintense on T1 , with low signal on T2 and blooming on gradient-echo (GRE), the vasogenic edema appears hyperintense on T2 and GRE, TOF MRA shows a partially thrombotic aneurysm at the right trifurcation of the MCA , these features suggest rupture of the aneurysm
d) Intraventricular Hemorrhage (IVH) :-May be due to an extension of
intraparenchymal hemorrhage or from the reflux of blood from the subarachnoid spaces
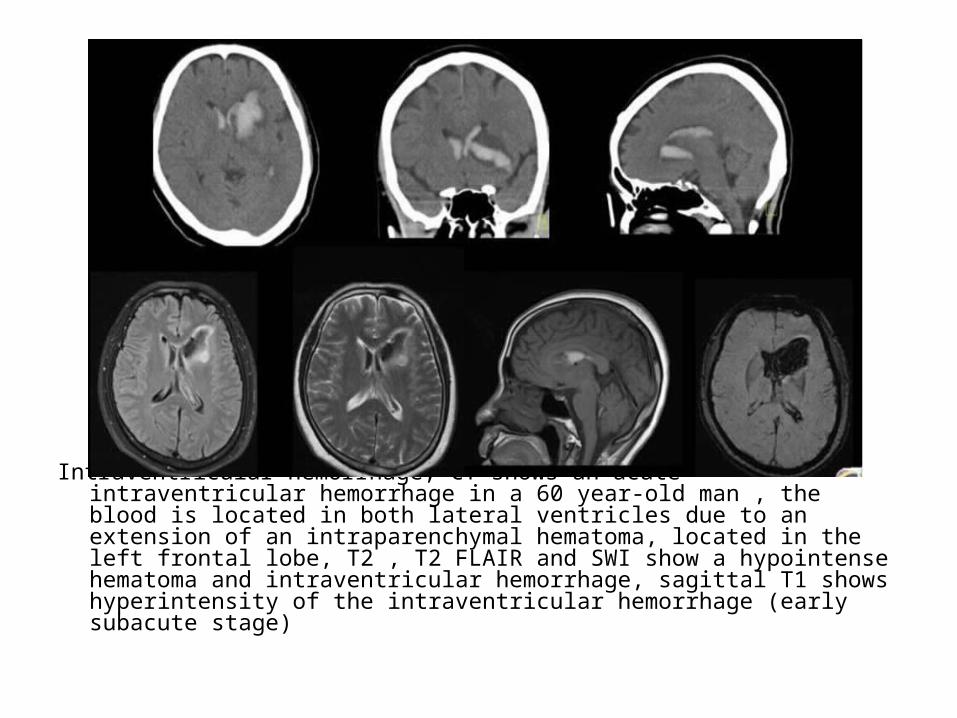
Intraventricular hemorrhage, CT shows an acute intraventricular hemorrhage in a 60 year-old man , the blood is located in both lateral ventricles due to an extension of an intraparenchymal hematoma, located in the left frontal lobe, T2 , T2 FLAIR and SWI show a hypointense hematoma and intraventricular hemorrhage, sagittal T1 shows hyperintensity of the intraventricular hemorrhage (early subacute stage)
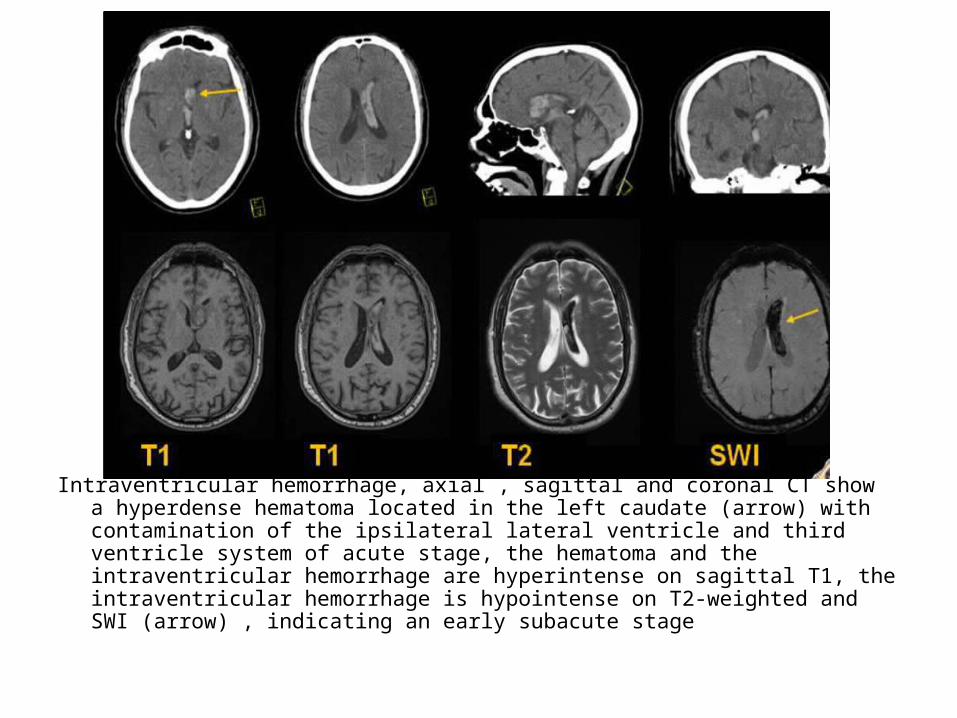
Intraventricular hemorrhage, axial , sagittal and coronal CT show a hyperdense hematoma located in the left caudate (arrow) with contamination of the ipsilateral lateral ventricle and third ventricle system of acute stage, the hematoma and the intraventricular hemorrhage are hyperintense on sagittal T1, the intraventricular hemorrhage is hypointense on T2-weighted and SWI (arrow) , indicating an early subacute stage
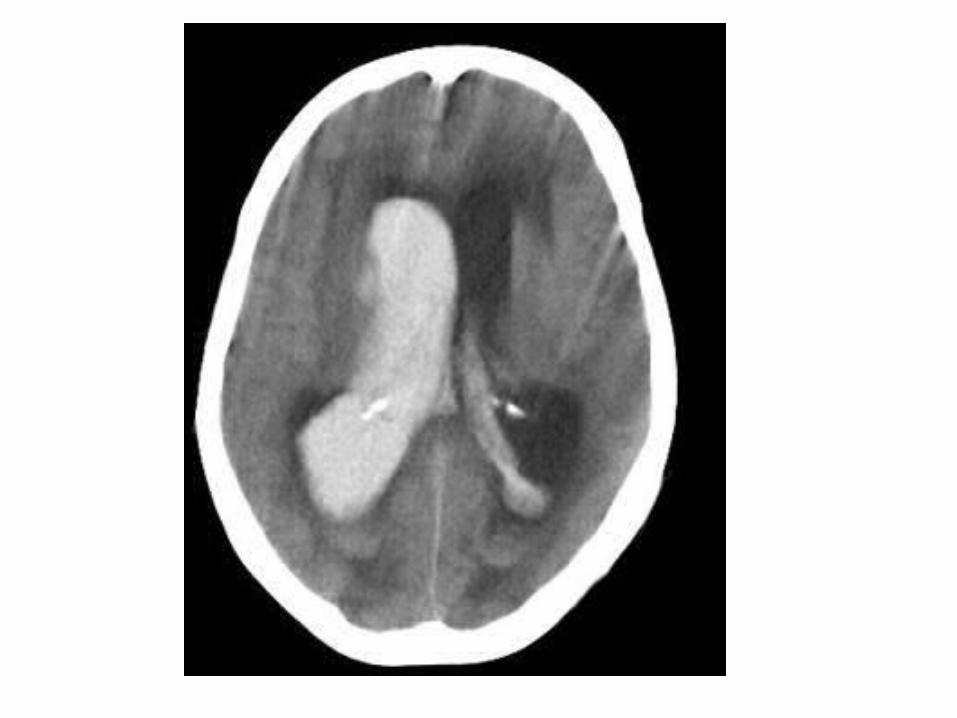
b) Staging of Hematoma :-The evolution of an hematoma has been divided
into 5 stages:1-Hyperacute hemorrhage: < 12 hrs of evolution2-Acute hemorrhage: 12 hrs to 48 hrs of evolution3-Early subacute hemorrhage: 2 days to 7 days of
evolution4-Late subacute hemorrhage: 8 days to 1 month5-Chronic hemorrhage: > 1 month
c) CT :1-Hyperacute stage2-Acute & Early subacute stages3-Late subacute stage4-Chronic stage

1-Hyperacute stage :-The extravasated blood has a heterogeneous
pattern with a density between of 40-60 Hounsfield units (HU) , this density is equally to the adjacent normal brain parenchyma
-It can be difficult to differentiate the density of the parenchyma and extravasated blood
2-Acute and early subacute stage :-In this phases there is going to be blood clot
retraction with increased density of the hematoma
-The hematoma is going to be detected as hyperdense in these phases (80 HU) with a hypodense halo due to vasogenic edema

Acute EDH
3-Late subacute stage :-The hematoma is isodense to the adjacent
normal brain parenchyma-This stage is characterized by the proteolysis of
the globin protein
4-Chronic stage :-In this phase , the hematoma is hypodense and
it is progressively reabsorbed-It can associate with atrophy of the surrounding
parenchyma and enlarged ventricles
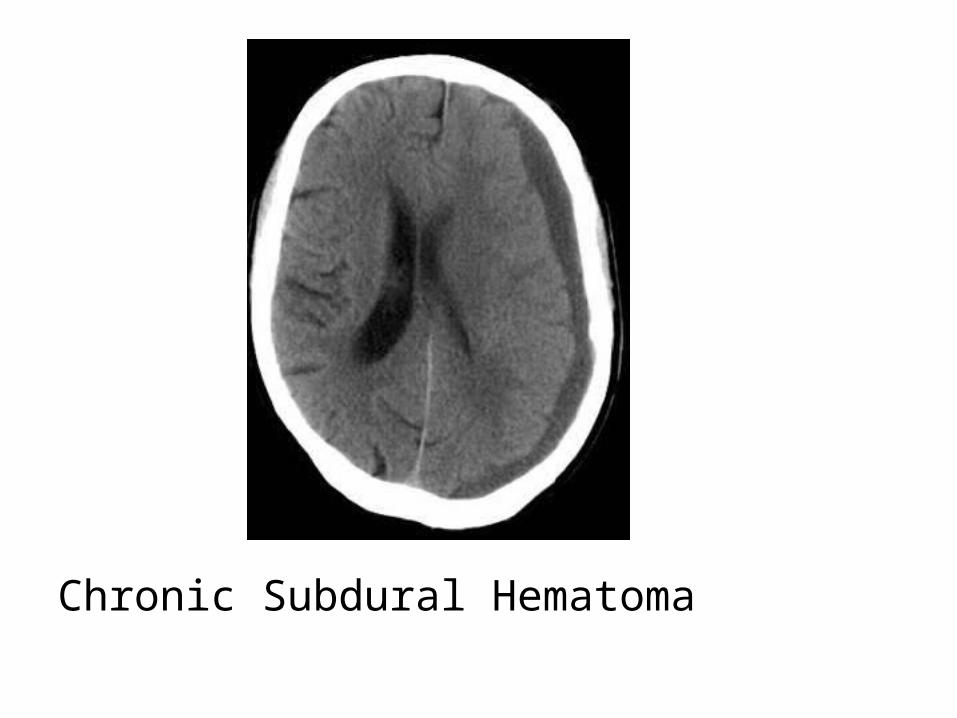
Chronic Subdural Hematoma

Axial CT in different patients, A: Acute hematoma: hyperdense hematoma of 48 hrs of evolution characterized by hyperdense blood surrounded by a hypodense halo due to vasogenic edema, B: Late Subacute hematoma: subdural hematoma isodense with the brain parenchyma in a 67 year-old-male (1 month of evolution), C: Chronic hematoma: 80 year-old male with hypodense collections located in both hemispheres corresponding to evolved subdural hematomas (5 months of evolution)

d) MRI :a) Pathophysiologyb) Staging
a) Pathophysiology :1-Diamagnetic materials2-Paramagnetic substances3-On MRI

1-Diamagnetic materials :-Diamagnetic materials are substances that do not
have unpaired electrons in the atomic and molecular orbitals
-These materials reduce the magnitude of an applied magnetic field
-More than 90% of human tissues including oxyhemoglobin are diamagnetic
2-Paramagnetic substances :-Are substances with unpaired electrons in their
atomic or molecular orbitals-These materials have no intrinsic magnetic field
in the absence of an applied magnetic field , but they can augment an applied field when they are exposed to it
-Examples of paramagnetic substances are copper , iron , manganese and gadolinium
3-On MRI :-The signal intensity of a hemorrhage depends
on both the chemical state of iron (ferrous or ferric) in the hemoglobin molecule and on the integrity of the RBC membrane
-Iron can be either diamagnetic or paramagnetic , depending on the state of its outer-orbital electrons
-In the paramagnetic state , iron alters the T1 and T2 relaxation times of water protons as a result of magnetic dipole-dipole interaction and susceptibility effects
-This dipole-dipole interaction shortens both T1 and T2 relaxation times with a greater effect on T1 than on T2
-A susceptibility effect is present when iron atoms are compartmentalized in the RBC membrane , there they cause inhomogeneity of the magnetic field with a resulting loss of phase coherence and with selective shortening of the T2 relaxation time
-After the RBC membrane degrades , the iron becomes more homogeneously distributed than before and this effect is nullified
-The variable appearance of hemorrhage on MRI depends on the structure of hemoglobin on its various oxidation products and on whether unpaired (i.e. paramagnetic ) electrons are present
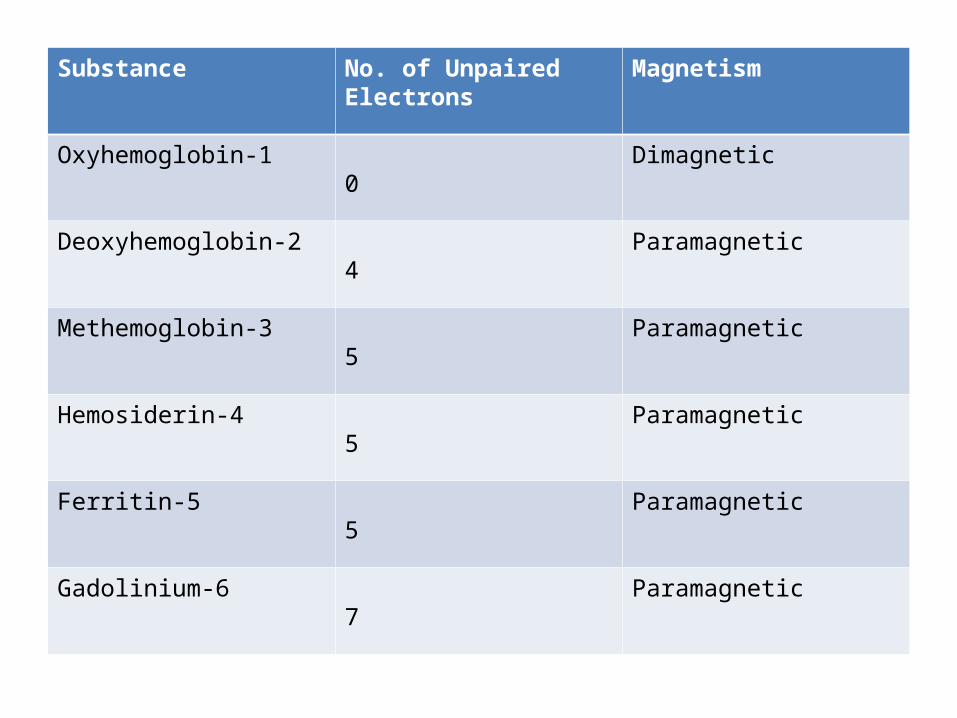
Substance No. of Unpaired Electrons Magnetism
1-Oxyhemoglobin 0 Dimagnetic
2-Deoxyhemoglobin 4 Paramagnetic
3-Methemoglobin 5 Paramagnetic
4-Hemosiderin 5 Paramagnetic
5-Ferritin 5 Paramagnetic
6-Gadolinium 7 Paramagnetic
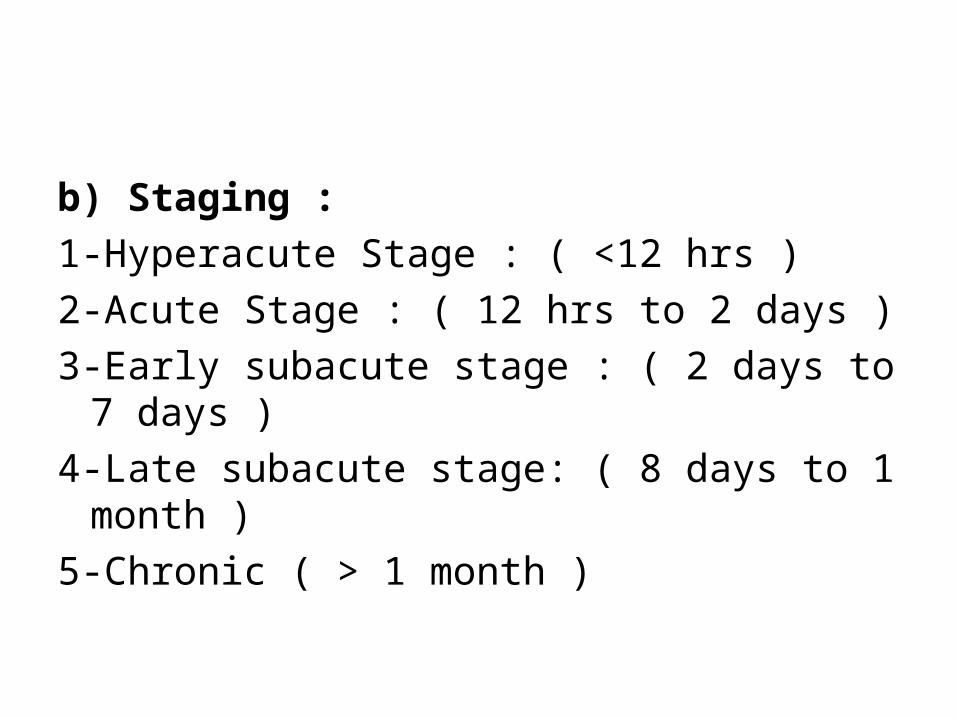
b) Staging :1-Hyperacute Stage : ( <12 hrs )2-Acute Stage : ( 12 hrs to 2 days )3-Early subacute stage : ( 2 days to 7 days )4-Late subacute stage: ( 8 days to 1 month )5-Chronic ( > 1 month )
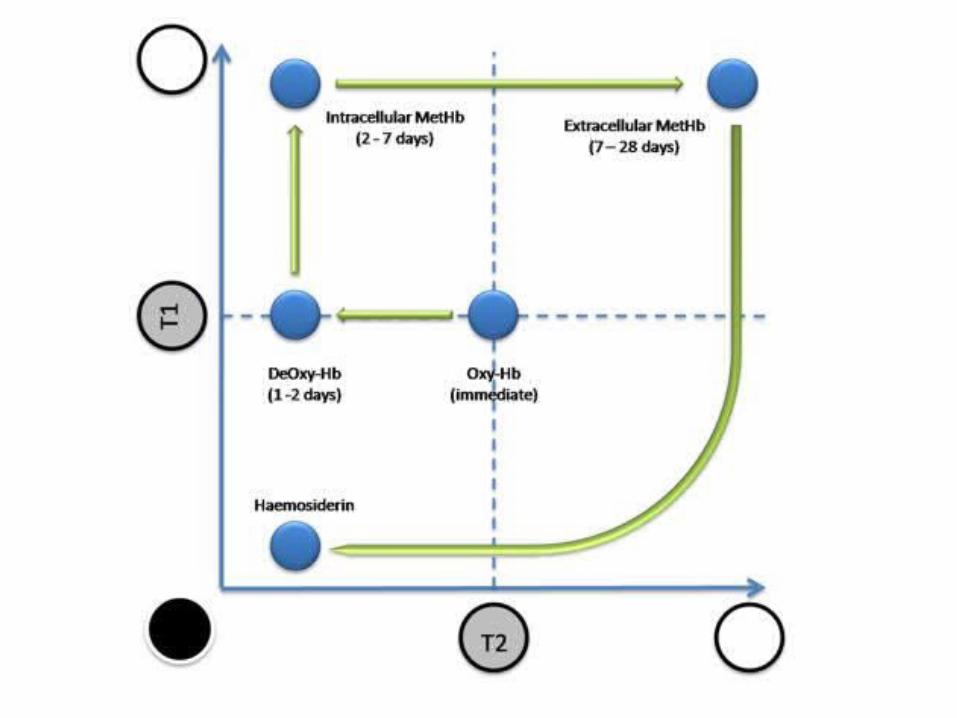
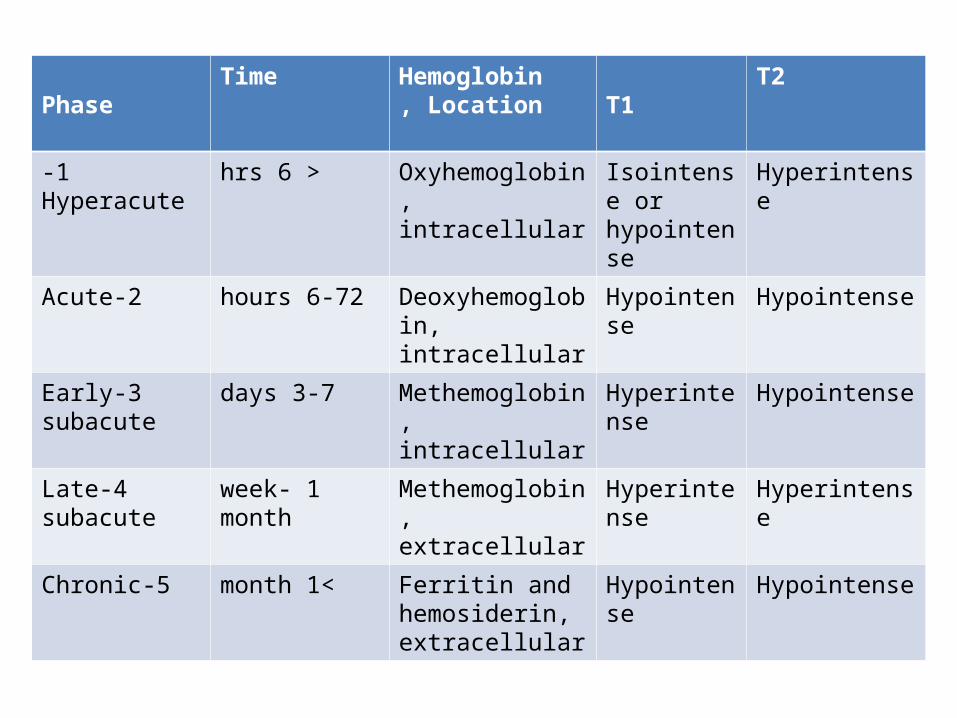
Phase Time Hemoglobin , Location
T1 T2
1-Hyperacute <6 hrs Oxyhemoglobin, intracellular
Isointense or hypointense
Hyperintense
2-Acute 6-72 hours Deoxyhemoglobin, intracellular
Hypointense Hypointense
3-Early subacute
3-7 days Methemoglobin, intracellular
Hyperintense Hypointense
4-Late subacute 1 week-month Methemoglobin, extracellular
Hyperintense Hyperintense
5-Chronic >1 month Ferritin and hemosiderin, extracellular
Hypointense Hypointense

1-Hyperacute Stage : (< 6 hrs)-Blood behaves as a fluid with 99% of
intracellular oxygenated hemoglobin or oxyhemoglobin
-In this phase the red blood cells are intact-Given that oxygenated hemoglobin has no
unpaired electrons , it behaves as a diamagnetic molecule

-For this reason on T1 , the hematoma is going to be isointense or hypointense
-On T2 , the hematoma is going to be hyperintense
-The key finding of a hyperacute hematoma is a peripheral rim of hypointensity on T2 due to deoxygenation of the most peripheral red cells , this peripheral dark rim is most conspicuous on GRE sequences


-Axial MR images show a hyperacute hematoma in the right external capsule and insular cortex in a known hypertensive patient
-Axial T1 shows isointense to hypointense lesion in the right temporoparietal region that is hyperintense on T2 and with susceptibility appearing as low signal intensity due to blood on gradient-echo (GRE)
-A small rim of vasogenic edema surrounds the hematoma
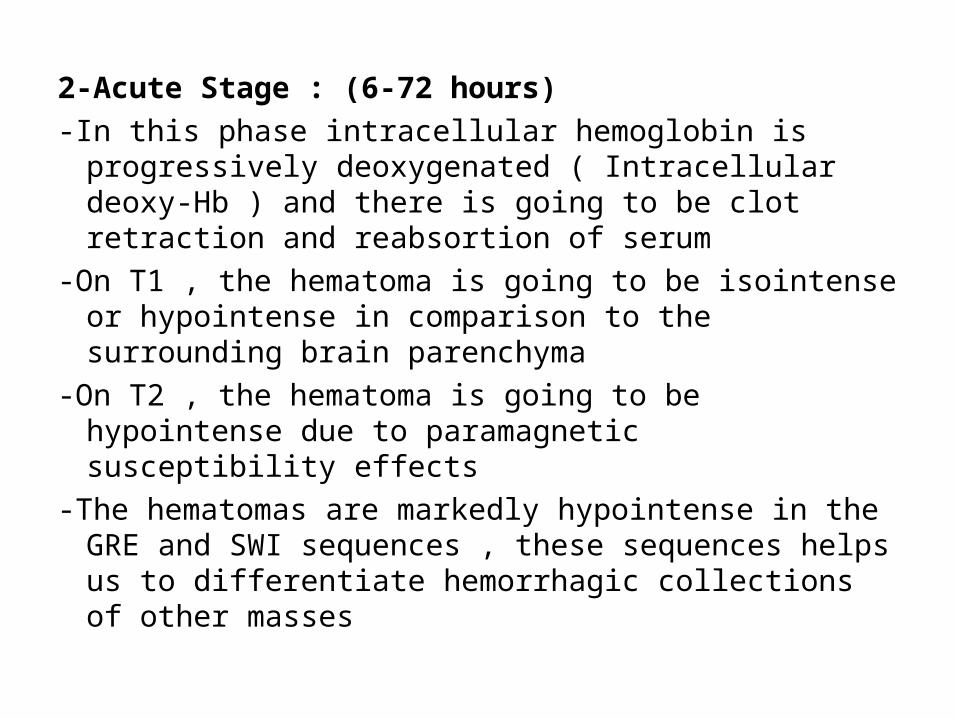
2-Acute Stage : (6-72 hours) -In this phase intracellular hemoglobin is progressively
deoxygenated ( Intracellular deoxy-Hb ) and there is going to be clot retraction and reabsortion of serum
-On T1 , the hematoma is going to be isointense or hypointense in comparison to the surrounding brain parenchyma
-On T2 , the hematoma is going to be hypointense due to paramagnetic susceptibility effects
-The hematomas are markedly hypointense in the GRE and SWI sequences , these sequences helps us to differentiate hemorrhagic collections of other masses

(a) Acute Hematoma , Sagittal T1 shows a isointense hematoma (arrows) surrounded by a hyperintense halo , (b) Axial T2 shows a hypointensity , it corresponds to an acute hematoma (8 hours of evolution) , there is also another hematoma of different time of evolution
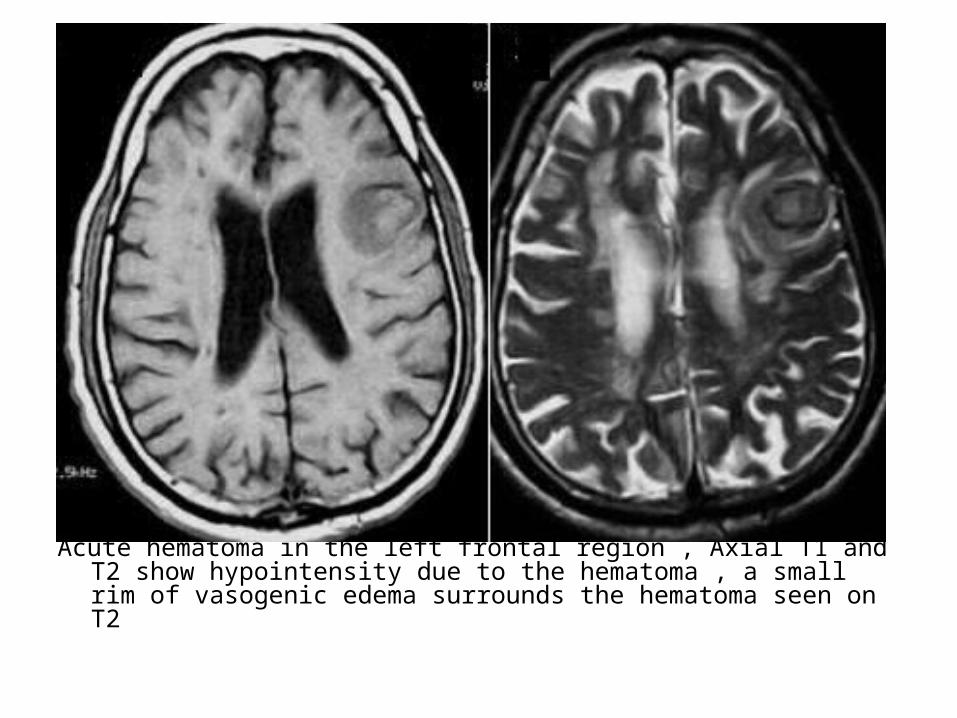
Acute hematoma in the left frontal region , Axial T1 and T2 show hypointensity due to the hematoma , a small rim of vasogenic edema surrounds the hematoma seen on T2
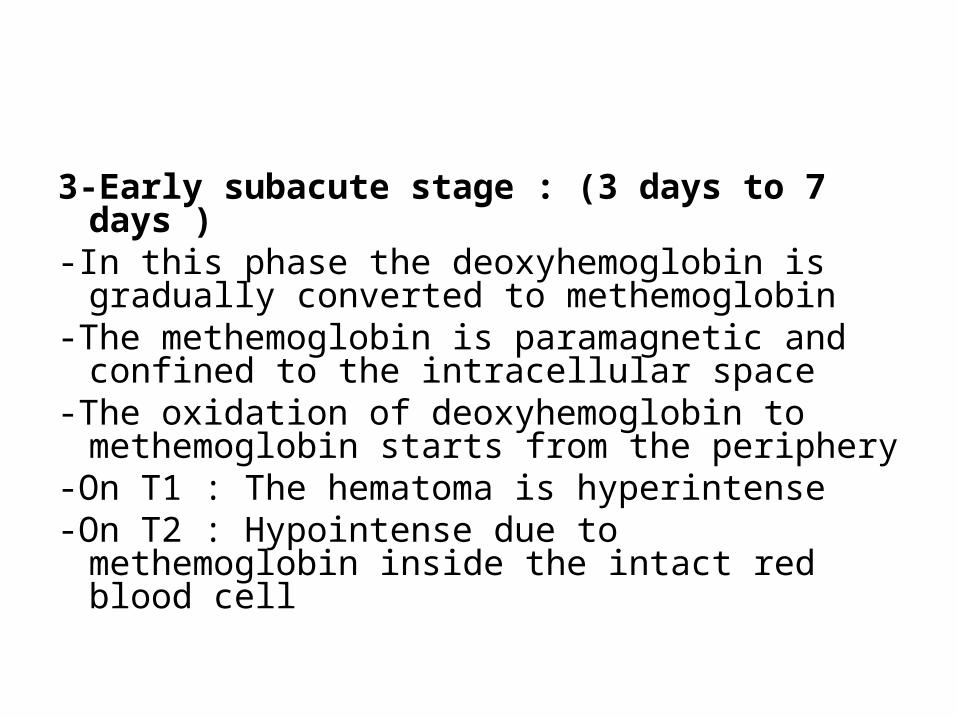
3-Early subacute stage : (3 days to 7 days )-In this phase the deoxyhemoglobin is gradually
converted to methemoglobin-The methemoglobin is paramagnetic and confined
to the intracellular space-The oxidation of deoxyhemoglobin to
methemoglobin starts from the periphery-On T1 : The hematoma is hyperintense-On T2 : Hypointense due to methemoglobin inside
the intact red blood cell

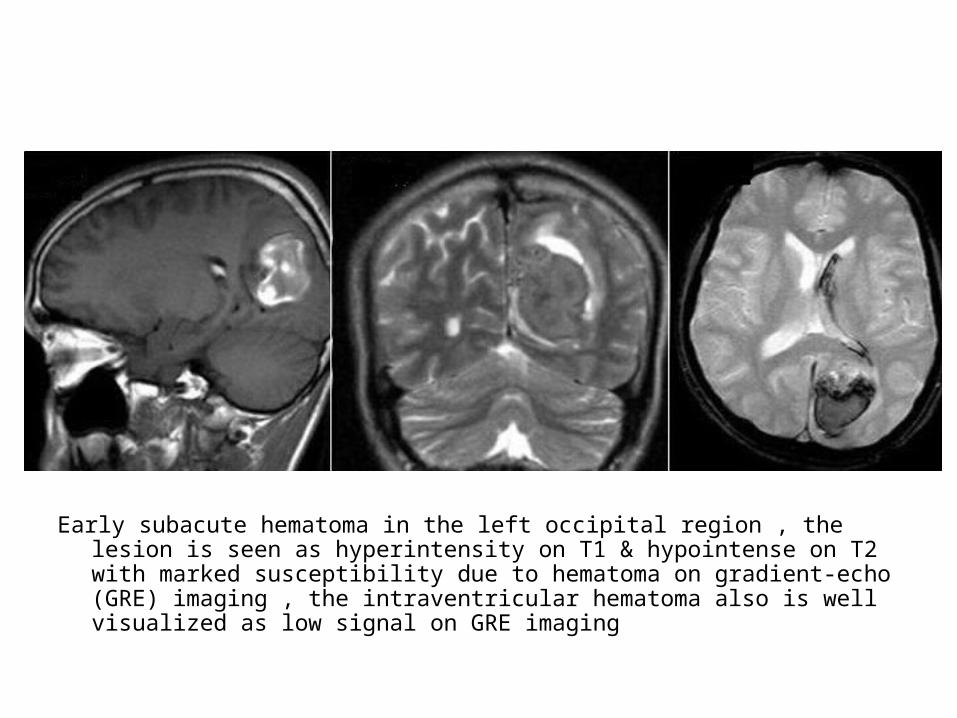
Early subacute hematoma in the left occipital region , the lesion is seen as hyperintensity on T1 & hypointense on T2 with marked susceptibility due to hematoma on gradient-echo (GRE) imaging , the intraventricular hematoma also is well visualized as low signal on GRE imaging

4-Late subacute stage: (1 week to 1 month)-In this phase , there is lysis of red blood cells
and methemoglobin is released to the extracellular space
-T1 : The hematoma is hyperintense-T2 : There is an increase in signal intensity of
the hematoma-The appearance of the hematoma in both
sequences is hyperintense
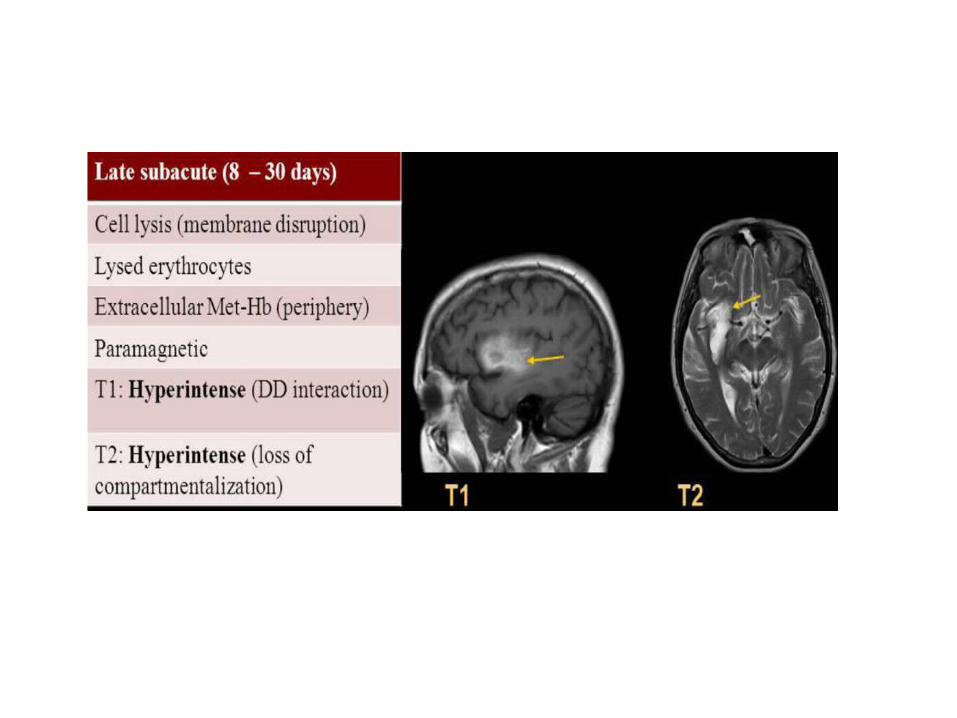
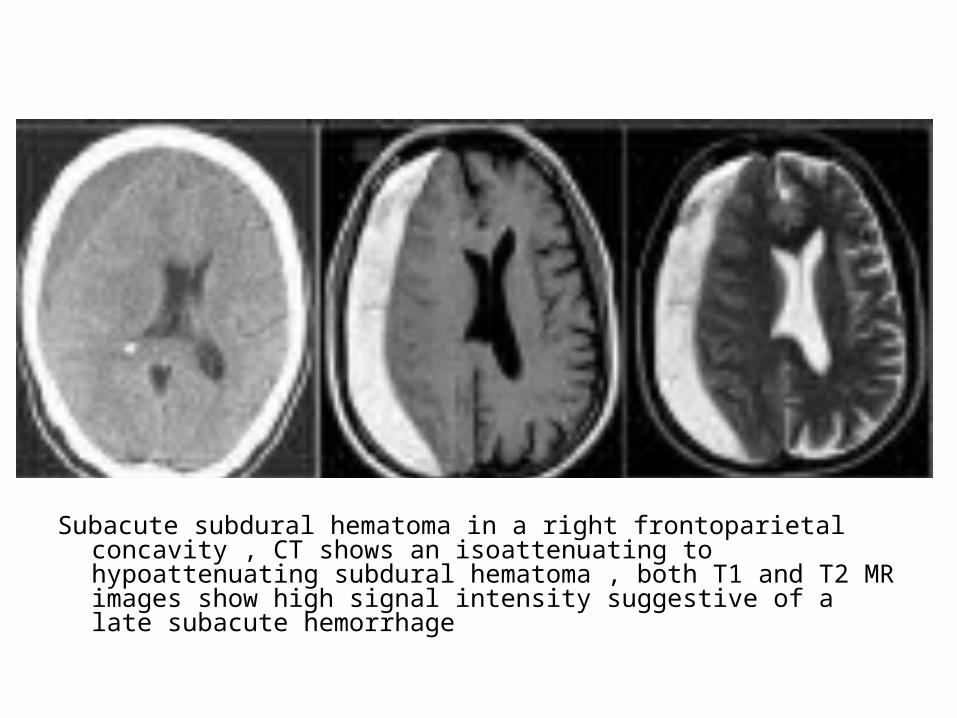
Subacute subdural hematoma in a right frontoparietal concavity , CT shows an isoattenuating to hypoattenuating subdural hematoma , both T1 and T2 MR images show high signal intensity suggestive of a late subacute hemorrhage
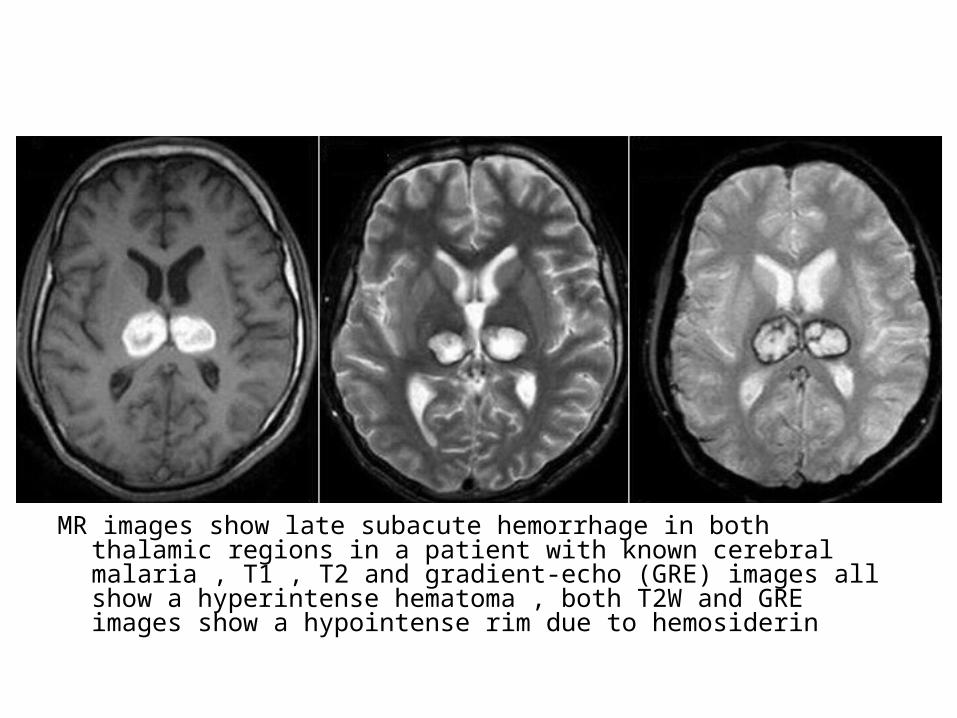
MR images show late subacute hemorrhage in both thalamic regions in a patient with known cerebral malaria , T1 , T2 and gradient-echo (GRE) images all show a hyperintense hematoma , both T2W and GRE images show a hypointense rim due to hemosiderin

5-Chronic phase : (> 1 month) -The liquid and the clot protein have been
degraded and reabsorbed almost completely-Due to hemosiderin have nuclei with unpaired
electrons , it is superparamagnetic , for this reason the hematoma is hypointense on T1 and T2
-On GRE and SWI sequences , it can be observed a persistent marked hypointense due to glial hemosiderin staining
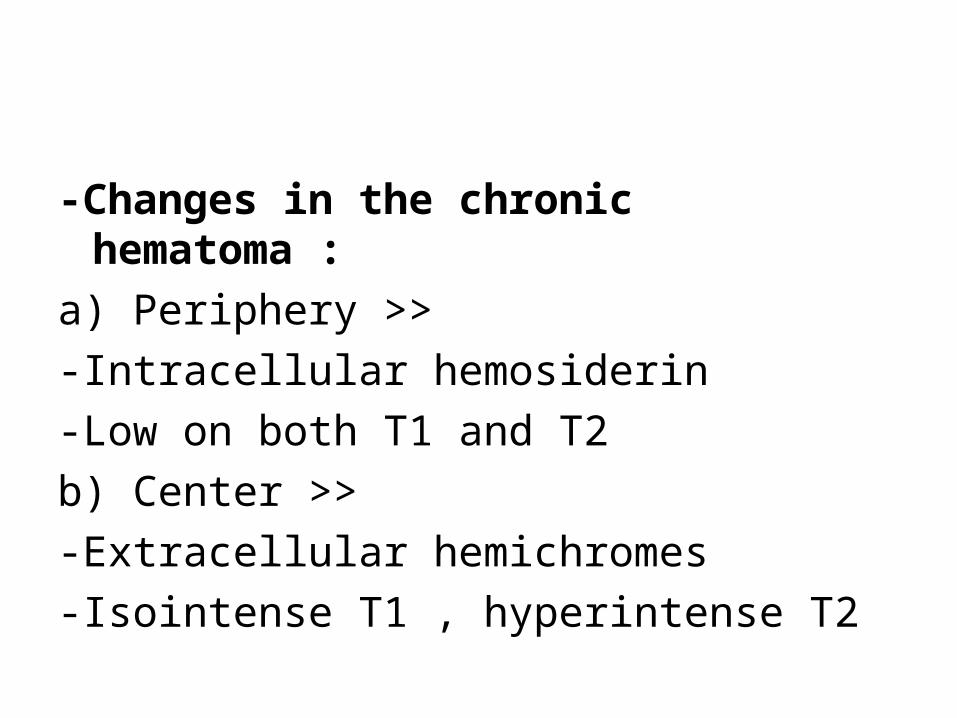
-Changes in the chronic hematoma :a) Periphery >>-Intracellular hemosiderin-Low on both T1 and T2b) Center >>-Extracellular hemichromes-Isointense T1 , hyperintense T2
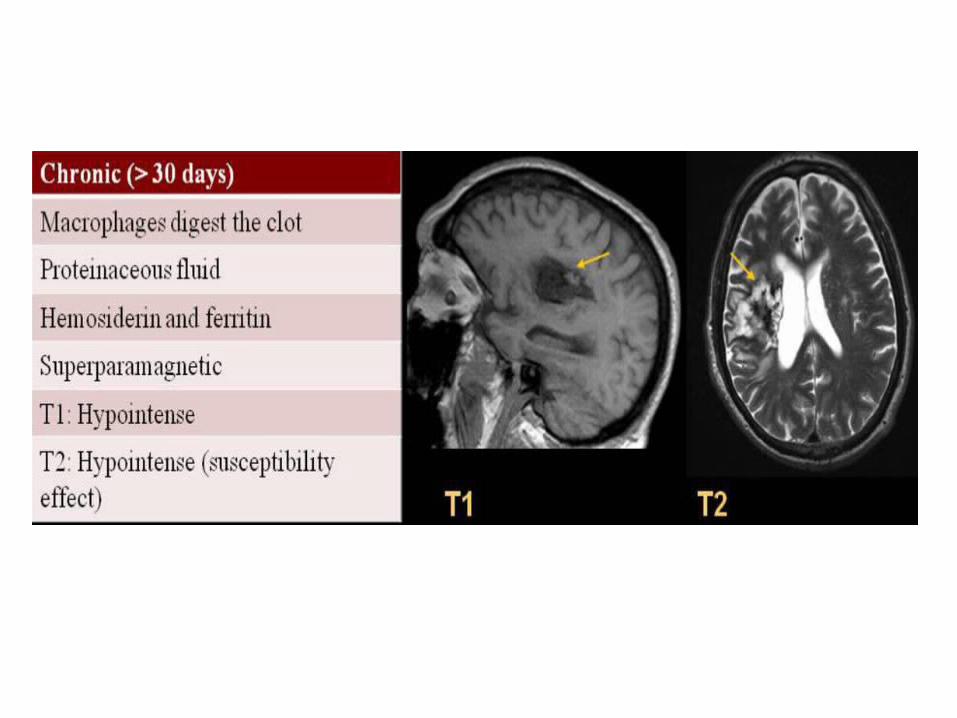
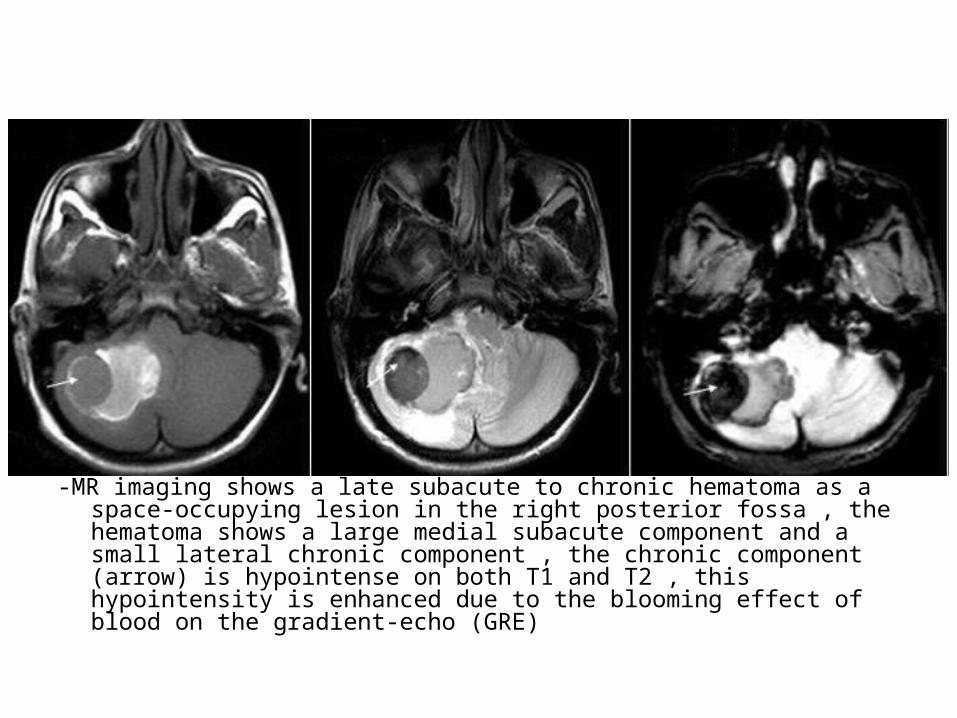
-MR imaging shows a late subacute to chronic hematoma as a space-occupying lesion in the right posterior fossa , the hematoma shows a large medial subacute component and a small lateral chronic component , the chronic component (arrow) is hypointense on both T1 and T2 , this hypointensity is enhanced due to the blooming effect of blood on the gradient-echo (GRE)
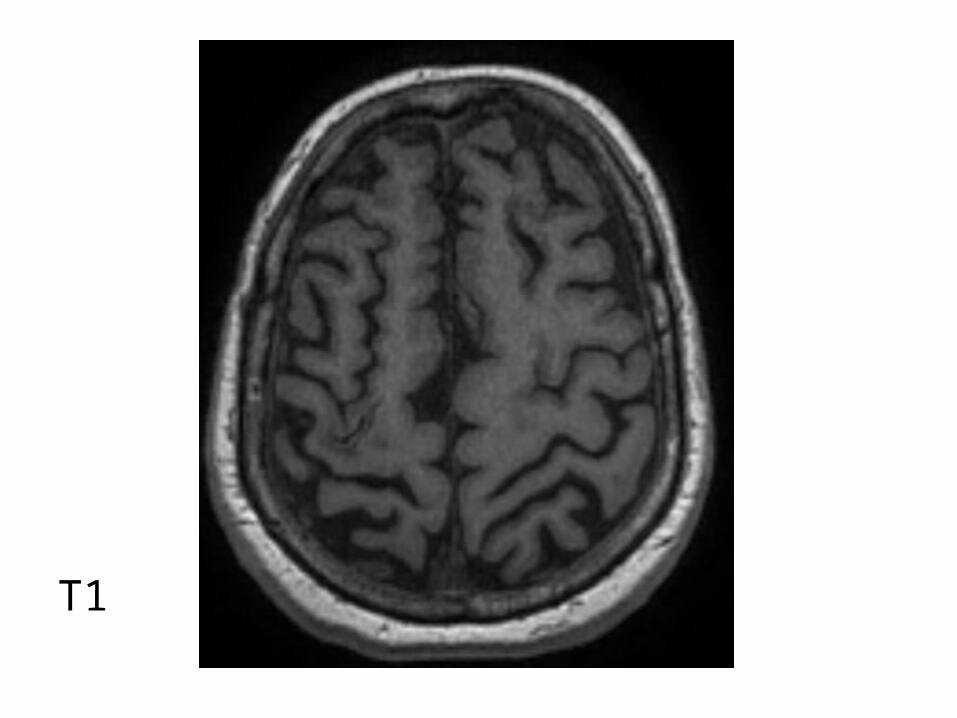
T1
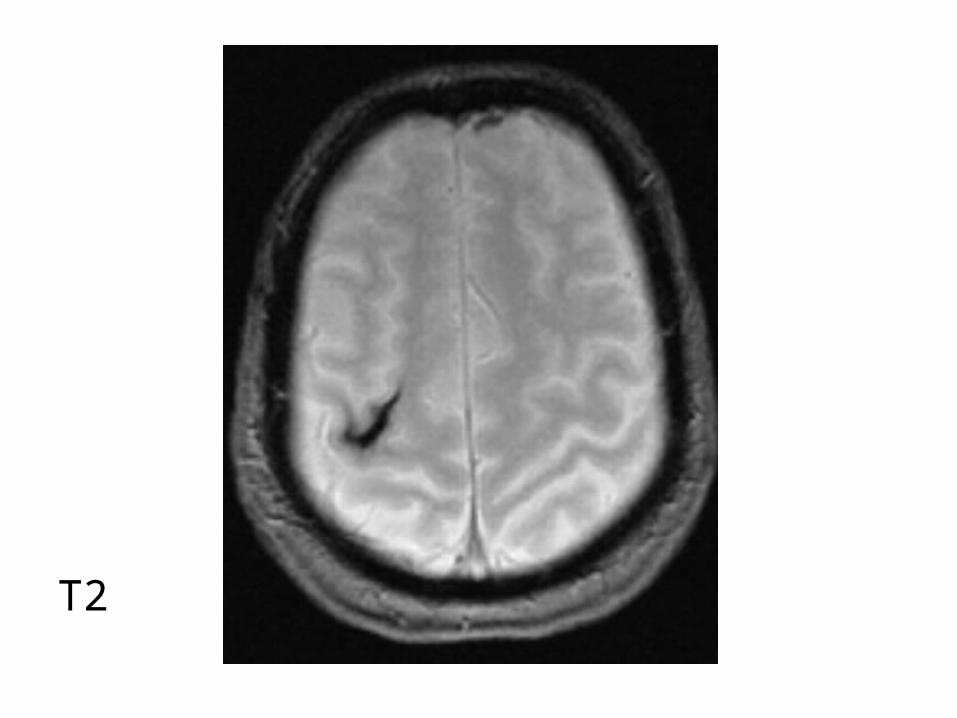
T2
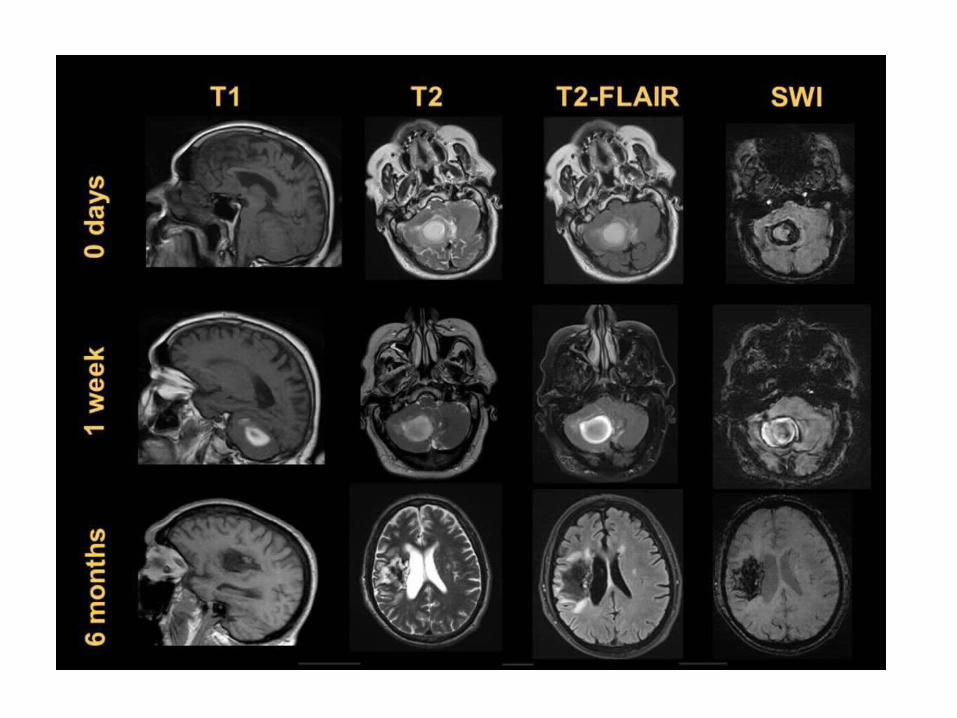

Top Related