


Languages
Pages
Legal


Western University Western University
Scholarship@Western Scholarship@Western
Electronic Thesis and Dissertation Repository
4-30-2014 12:00 AM
Diagnostic Accuracy of Tele-ophthalmology for Diabetic Diagnostic Accuracy of Tele-ophthalmology for Diabetic
Retinopathy Assessment: A Meta-analysis and Economic Analysis Retinopathy Assessment: A Meta-analysis and Economic Analysis
Andrea C. Coronado, The University of Western Ontario
Supervisor: Dr. William Hodge, The University of Western Ontario
A thesis submitted in partial fulfillment of the requirements for the Master of Science degree in
Epidemiology and Biostatistics
© Andrea C. Coronado 2014
Follow this and additional works at: https://ir.lib.uwo.ca/etd
Recommended Citation Recommended Citation Coronado, Andrea C., "Diagnostic Accuracy of Tele-ophthalmology for Diabetic Retinopathy Assessment: A Meta-analysis and Economic Analysis" (2014). Electronic Thesis and Dissertation Repository. 2282. https://ir.lib.uwo.ca/etd/2282
This Dissertation/Thesis is brought to you for free and open access by Scholarship@Western. It has been accepted for inclusion in Electronic Thesis and Dissertation Repository by an authorized administrator of Scholarship@Western. For more information, please contact [email protected].
DIAGNOSTIC ACCURACY OF TELE-OPHTHALMOLOGY FOR DIABETIC RETINOPATHY ASSESSMENT: A META-ANALYSIS AND ECONOMIC ANALYSIS
(Thesis format: Integrated Article)
by
Andrea Catalina Coronado
Graduate Program in Epidemiology and Biostatistics
A thesis submitted in partial fulfillment of the requirements for the degree of
Master of Science
The School of Graduate and Postdoctoral Studies The University of Western Ontario
London, Ontario, Canada
© Andrea C. Coronado, 2014

ii
Abstract
Tele-ophthalmology is a screening alternative that facilitates compliance to eye care
guidelines regardless of geographic constraints, promoting adequate delivery of health
services to underserved communities. We conducted a systematic review and meta-
analysis to assess the diagnostic performance of tele-ophthalmology (TO) programs for
the detection of diabetic retinopathy (DR), and used decision-tree modeling to explore
its cost-effectiveness compared to in-person examination in a semi-urban scenario.
From the 1,060 articles initially identified, 23 met inclusion criteria for data extraction.
The diagnostic performance of TO for the detection of any DR and referable DR met the
minimum diagnostic criteria by the Canadian Ophthalmological Society (sensitivity
>80%, specificity >90%). Interpretation of clinical significance is limited due to significant
heterogeneity. Considering a semi-urban scenario, the incremental cost per additional
case of any DR detected after the introduction of pharmacy-based TO was $314.1, being
more costly and more effective than in-person examination.
Keywords
Tele-ophthalmology, tele-medicine, diabetic retinopathy screening, digital photography,
diagnostic accuracy, meta-analysis, economic analysis, decision tree modeling.

iii
Co-Authorship Statement
Chapter 3 Estimating the Diagnostic Accuracy of Tele-ophthalmology for Diabetic
Retinopathy Screening: A Meta-analysis
Co-authorship Coronado AC, Singh H, Martin J, Costella J, Malvankar-Mehta MS, Xie B,
Hodge WG
Hodge WG and Coronado AC framed the study concept and study design. Coronado AC,
Singh H and Costella J participated in the literature search and article retrieval.
Coronado AC, Singh H and Hodge WG performed the data extraction and classification.
Data analysis and interpretation was conducted by Coronado AC, Martin J and Hodge
WG. Coronado AC, Martin J and Hodge WG were responsible of manuscript drafting and
initial revisions. Content feedback was provided by Malvankar-Mehta MS, Martin J, Xie B
and Hodge WG. Coronado AC and Hodge WG had full access to all of the data.
Chapter 4 Cost-effectiveness Analysis of Diabetic Retinopathy Screening With Pharmacy-
based Tele-ophthalmology Versus In-person Eye Examination
Co-authorship Coronado AC, Zaric GS, Martin J, Malvankar-Mehta MS, Hodge WG
Hodge WG and Coronado AC conceived the study. Coronado AC, Zaric GS and Hodge WG
conceptualized the decision-tree model. Cost data and effectiveness data was collected
by Coronado AC. Data analysis and interpretation was conducted by Coronado AC, Zaric
GS and Hodge WG. Coronado AC, Malvankar-Mehta MS and Hodge WG were
responsible of manuscript drafting and initial revisions. Content feedback was provided
by Malvankar-Mehta MS, Martin J, Zaric GS and Hodge WG. Coronado AC and Hodge
WG had full access to all of the data.

iv
Dedication
I dedicate this work to my nieces Daniela, Sofia & Isabel, and to my nephew Samuel.
Believe in yourselves and pursue your dreams with discipline and perseverance.
I will always be there to support you.
I love you immensely.
- AC. (2014)

v
Acknowledgments
I feel privileged to be a part of the Department of Epidemiology and Biostatistics at
Western University as a graduate student. The learning experience during my course
work and thesis has been an unparalleled one. I would like to acknowledge the
administrative staff and faculty for their great work.
I would like to thank my advisory committee member, Dr. Malvankar and all co-authors
for their valuable contributions during the development of these integrated projects.
Countless times I knocked on their doors with multiple questions for which they were
glad to provide direction and share their expertise. I would like to especially
acknowledge Janet Martin for her exceptional feedback during this project and her
endless support in all my academic endeavors.
To my friends in London a very heartfelt thank you, especially to Erin and Hilary, for the
memorable moments, excellent conversations and great advice. A special thank you to
Dr. Alan Donner for sharing his extraordinary knowledge about biostatistics and life with
me, during winter classes and coffee afternoons.
I would like to thank my family for their unconditional support and patience from the
beginning of this journey away from home. A very heartfelt thank you to my brother
Carlos Y and my sister Patricia for their advice and comfort when I needed it the most.
Above all, I would like to thank my parents Carlos and Feber. Your everlasting example
of impeccable discipline and perseverance is my inspiration to be the best person I can
possibly be.
Finally, I would like to express my sincerest gratitude and appreciation to my mentor,
Dr. William Hodge. His generous support and guidance motivated me to excel at all the
challenges during my thesis work and unfold my potential as a researcher. Thank you Dr.
H for transforming this journey into an extraordinary, fulfilling and memorable one.

vi
Table of Contents
Abstract ........................................................................................................................... ii
Co-Authorship Statement ............................................................................................... iii
Dedication ...................................................................................................................... iv
Acknowledgments ........................................................................................................... v
Table of Contents ........................................................................................................... vi
List of Tables ................................................................................................................... ix
Chapter 1 Introduction....................................................................................................1
1 Introduction ................................................................................................................2
1.1 Structure of thesis document ...............................................................................3
1.2 Literature cited ....................................................................................................3
Chapter 2 Literature review, Thesis rationale and Thesis objectives ..............................5
2.1 Literature review..................................................................................................6
2.1.1 Natural History of diabetic retinopathy ....................................................6
2.1.2 Epidemiology of diabetic retinopathy .......................................................8
2.1.3 Clinical assessment of diabetic retinopathy ............................................15
2.1.4 Digital retinal photography .....................................................................21
2.1.5 Tele-ophthalmology assessment of diabetic retinopathy ........................23
2.1.6 Concluding remarks ................................................................................26
2.2 Thesis rationale ..................................................................................................27
2.3 Thesis objectives ................................................................................................29
2.4 Literature cited ..................................................................................................30

vii
Chapter 3 Estimating the diagnostic accuracy of tele-ophthalmology for diabetic retinopathy screening: A meta-analysis ...................................................................47
3.1 Introduction .......................................................................................................48
3.2 Methods ............................................................................................................49
3.2.1 Literature search ....................................................................................49
3.2.2 Eligibility criteria .....................................................................................50
3.2.3 Article screening .....................................................................................50
3.2.4 Data extraction and quality assessment..................................................51
3.2.5 Data synthesis and statistical analysis .....................................................52
3.3 Results ...............................................................................................................55
3.3.1 Search results and study characteristics .................................................55
3.3.2 Quality assessment .................................................................................56
3.3.3 Meta-analysis .........................................................................................56
3.4 Discussion ..........................................................................................................59
3.4.1 Principal findings ....................................................................................59
3.4.2 Strengths and limitations ........................................................................62
3.5. Literature cited ..................................................................................................63
3.6 Tables and figures ..............................................................................................74
Chapter 4 Cost-effectiveness analysis of diabetic retinopathy screening with pharmacy-based tele-ophthalmology versus in-person eye examination ................84
4.1 Introduction .......................................................................................................85
4.2 Methods ............................................................................................................86
4.2.1 Study setting ..........................................................................................86
4.2.2 Decision-tree model and study interventions .........................................87
4.2.3 Identification and calculation of model probabilities ..............................88

viii
4.2.4 Identification and calculation of model costs ..........................................90
4.2.5 Cost-effectiveness evaluation and sensitivity analysis.............................91
4.3 Results ...............................................................................................................92
4.3.1 Base-case analysis ..................................................................................92
4.3.2 Sensitivity analyses .................................................................................93
4.4 Discussion ..........................................................................................................95
4.4.1 Cost-effectiveness of tele-ophthalmology ..............................................95
4.4.2 Sensitivity analyses .................................................................................95
4.4.3 Comparison to previous evidence ...........................................................96
4.4.4 Strengths and limitations ........................................................................97
4.4.5 Study applicability ..................................................................................98
4.5 References .........................................................................................................99
4.6 Tables and figures ............................................................................................ 110
Chapter 5 Integrated discussion.................................................................................. 116
5.1 Overview.......................................................................................................... 117
Appendix ..................................................................................................................... 125
Curriculum Vitae .......................................................................................................... 149

ix
List of Tables
Table 2.1 Validation categories for diabetic retinopathy tele-screeing programs……….26
Table 3.1 Characteristics of primary studies included in the Meta-analysis…………..……75
Table 3.2 QUADAS-2 assessment results………………………………………………………………………78
Table 3.3 Meta-analysis summary results per category….…………………………………………….80
Table 3.4 Subgroup analysis of potentially relevant covariates…………………………………….81
Table 4.1 Base-case model parameters and parameter ranges…………………………………..110
Table 4.2 Estimated cost for in-person examination and pharmacy-based tele-
ophthalmology……………………………………………………………………………………………………………111
Table 4.3 Cost ranges used for Deterministic Sensitivity Analysis……………………………….112
Table 4.4 Examination outcomes of pharmacy-based tele-ophthalmology and in-person
examination programs…………………………………………………………………………………………….…113
Table 4.5 incremental cost-effectiveness results for in-person examination versus
introduction of tele-ophthalmology……………………………………………………………………………113
Table 4.6 One way deterministic sensitivity analyses……………………………………………….114

x
List of Figures
Figure 2.1 Anatomy of the retina……………………………………………………………………………………6
Figure 2.2 Diabetic retinopathy disease severity stages………………………………………….……19
Figure 3.1 PRISMA flow diagram of study selection………………………………………………………72
Figure 3.2 QUADAS2 assessment………………………………………………………………………………….76
Figure 3.3 Paired forest plot of meta-analysis of studies (category 1).............................79
Figure 3.4 Paired forest plot of meta-analysis of studies (category 2).............................79
Figure 3.5 HSROC plot for category 1 and category 2 studies……………………………………….78
Figure 3.6 Meta-regression of log DOR on year of study……………………………………………...81
Figure 3.7 Funnel plot for category 1 and category 2 studies……………………………………....81
Figure 4.1 Fragment of decision tree………………………………………………………………………….110
Figure 4.2 Cost-effectiveness plane................................................................................111
Figure 4.3 Two-way sensitivity analysis………………………………………………………………………111

xi
List of Appendices
Appendix A. Meta-analysis of Observational Studies in Epidemiology (MOOSE)
Checklist..........................................................................................................................126
Appendix B. Preferred reporting items for Systematic reviews and Meta-analyses
(PRISMA) checklist..........................................................................................................128
Appendix C. Complete search strategy for primary databases......................................131
Appendix D. Data collection form..................................................................................135
Appendix E. Adapted QUADAS-2 criteria.......................................................................138
Appendix F. Paired forest plots (Sensitivity analyses of included studies).....................140
Appendix G. Decision tree model of tele-ophthalmology versus in-person
examination....................................................................................................................142
Appendix H. Search strategy (Medline and EMBASE)....................................................143
Appendix I. Calculation of model probabilities..............................................................144
Appendix J. Summary of probabilities incorporated in the economic model................146
Appendix K. Search strategy (Medline and EMBASE).....................................................149

xii
List of Abbreviations
AAO
American Academy of Ophthalmology
ATA American Telemedicine Association
CI Confidence Interval
COS Canadian Ophthalmological Society
DM Diabetes Mellitus
DOR Diagnostic Odds Ratio
DR Diabetic Retinopathy
ETDRS Early Treatment Diabetic Retinopathy Study
HSROC Hierarchical Summary Receiver Operator Characteristic curve
ICER Incremental Cost Effectiveness Ratio
MOOSE Meta-analysis of Observational Studies in Epidemiology
NPDR Non-proliferative diabetic retinopathy
PDR Proliferative Diabetic Retinopathy
PRISMA Preferred Reporting Items for Systematic Reviews and Meta-analysis
QALY Quality Adjusted Life Year
QUADAS Quality Assessment of Diagnostic Accuracy Studies
SVL Severe Vision Loss
WESDR Wisconsin Epidemiologic Study of Diabetic Retinopathy

1
Chapter 1 Introduction

2
1 Introduction
Diabetic retinopathy (DR) is a sight-threatening condition involving the retinal
microvasculature in type I and type II diabetic patients.1 Although treatments such as
laser photocoagulation and anti-VEGF therapy can mitigate the progression of DR, it
remains one of the main causes of vision loss and blindness in the working age
population in industrialized countries.2,3 Screening for DR is a key component for
timely treatment delivery, and it remains one of the main challenges to reduce cases
of vision loss.4,5 Diabetic patients tend to be non-compliant to eye examination
guidelines, as less than 50% attend annual screening as advised by the American
Academy of Ophthalmology.6,7 Low availability of eye care professionals to assess
DR, lack of awareness about the effects of diabetes on vision, and reluctance of
undergo a dilated eye examination are among the main reasons for
noncompliance.8,9
Tele-ophthalmology has emerged as a promising alternative to in-person eye
examination for DR screening.10 It uses digital photography and electronic
communications to promote eye examination in non-specialized settings, where the
patient and the specialist are in different geographical locations11. This system has
the potential to facilitate eye screening delivery to diabetic patients, while
transferring some of the workload of routine eye care examinations from specialists
to other settings.12
Achieving a high diagnostic accuracy is an important factor for success in a tele-
ophthalmology screening program.13 Factors such as pharmacologic dilation,
number of fields and population characteristics may influence the effectiveness of
the program.14 The first objective of the present study was to quantitatively
synthesize the evidence available regarding the diagnostic accuracy of tele-
ophthalmology strategies for DR screening, and shed some light about screening
factors that may play a role in the correct identification of patients with DR. The
second objective was to conduct a cost-effectiveness analysis of a pharmacy-based
tele-ophthalmology program in type I and II diabetic adults from non-urban locations
of Southern Ontario.

3
1.1 Structure of thesis document
In compliance with the standards outlined by Western University School of Graduate
and Postdoctoral studies, this thesis is presented in the integrated-article format. A
comprehensive review of the related literature is covered in Chapter 2. The work
comprising the thesis objectives is presented as two manuscripts. Chapter 3,
Estimating the Diagnostic Accuracy of Tele-ophthalmology for Diabetic Retinopathy
Screening: A meta-analysis, addresses the first objective, while Chapter 4, Cost-
effectiveness Analysis of diabetic Retinopathy Screening With Pharmacy-based Tele-
ophthalmology Versus In-person Examination, explores the second objective. Lastly,
Chapter 5, Integrated Discussion, summarizes the main findings of this thesis in its
global context.
1.2 Literature cited
1. COGAN DG, TOUSSAINT D, KUWABARA T. Retinal vascular patterns. IV. Diabetic retinopathy. Archives of ophthalmology. 1961;66:366–78. Available at: http://www.ncbi.nlm.nih.gov/pubmed/13694291. Accessed February 25, 2013.
2. Chistiakov DA. Diabetic retinopathy: pathogenic mechanisms and current treatments. Diabetes & metabolic syndrome. 5(3):165–72. Available at: http://www.ncbi.nlm.nih.gov/pubmed/22813573. Accessed February 25, 2013.
3. Rodriguez J, Sanchez R, Munoz B, et al. Causes of blindness and visual impairment in a population-based sample of U.S. Hispanics. Ophthalmology. 2002;109(4):737–43. Available at: http://www.ncbi.nlm.nih.gov/pubmed/11927431. Accessed January 22, 2013.
4. Gillow JT, Gray JA. The National Screening Committee review of diabetic retinopathy screening. Eye (London, England). 2001;15(Pt 1):1–2. Available at: http://www.ncbi.nlm.nih.gov/pubmed/11318268. Accessed March 31, 2013.
5. Squirrell DM, Talbot JF. Screening for diabetic retinopathy. JRSM. 2003;96(6):273–276. Available at: http://jrsm.rsmjournals.com/cgi/doi/10.1258/jrsm.96.6.273. Accessed May 10, 2012.
6. American Academy of Ophthalmology. Diabetic Retinopathy Preferred Practice Pattern Guidelines. San Francisco, CA; 2008:39. Available at: http://one.aao.org/CE/PracticeGuidelines/PPP_Content.aspx?cid=d0c853d3-219f-487b-a524-326ab3cecd9a.
7. Zheng Y, He M, Congdon N. The worldwide epidemic of diabetic retinopathy. Indian journal of ophthalmology. 60(5):428–31. Available at:

4
http://www.pubmedcentral.nih.gov/articlerender.fcgi?artid=3491270&tool=pmcentrez&rendertype=abstract. Accessed January 10, 2013.
8. Puent BD, Nichols KK. Patients’ perspectives on noncompliance with diabetic retinopathy standard of care guidelines. Optometry (St. Louis, Mo.). 2004;75(11):709–716. Available at: http://ovidsp.ovid.com/ovidweb.cgi?T=JS&PAGE=reference&D=emed6&NEWS=N&AN=15597813.
9. Moss SE, Klein R, Klein BE. Factors associated with having eye examinations in persons with diabetes. Archives of family medicine. 1995;4(6):529–34. Available at: http://www.ncbi.nlm.nih.gov/pubmed/7773429. Accessed April 9, 2013.
10. Yogesan K, Constable IJ, Eikelboom RH, Saarloos PP. Tele-ophthalmic screening using digital imaging devices. Australian and New Zealand Journal of Ophthalmology. 1998;26:S9–S11. Available at: http://doi.wiley.com/10.1111/j.1442-9071.1998.tb01385.x. Accessed April 7, 2013.
11. Kawasaki S, Ito S, Satoh S, et al. Use of Telemedicine in Periodic Screening of Diabetic Retinopathy. Telemedicine Journal and e-Health. 2003;9(3):235–239. Available at: http://ovidsp.ovid.com/ovidweb.cgi?T=JS&PAGE=reference&D=emed6&NEWS=N&AN=2003432464.
12. JN H, Craney L, Nagendran S, CS N. Towards comprehensive population-based screening for diabetic retinopathy: operation of the North Wales diabetic retinopathy screening programme using a central patient register and various screening methods. Journal of Medical Screening. 2006;13(2):87–92. Available at: http://search.ebscohost.com/login.aspx?direct=true&db=cin20&AN=2009220293&site=ehost-live.
13. Whited JD. Accuracy and reliability of teleophthalmology for diagnosing diabetic retinopathy and macular edema: a review of the literature. Diabetes technology & therapeutics. 2006;8(1):102–11. Available at: http://www.ncbi.nlm.nih.gov/pubmed/16472057. Accessed April 8, 2013.
14. E Z-GI, Ran Z. Telemedicine in diabetic retinopathy screening. International ophthalmology clinics. 2009;49(2):75–86. Available at: http://ovidsp.ovid.com/ovidweb.cgi?T=JS&PAGE=reference&D=medl&NEWS=N&AN=19349788.

5
Chapter 2 Literature review, Thesis rationale and Thesis objectives

6
2.1 Literature review
Diabetic retinopathy (DR) is a serious microvascular complication in diabetic patients,
which can have a sudden and debilitating impact on visual acuity, eventually leading
to blindness.1,2 Features of diabetic retinopathy begin with micro-aneurysms and
progress into exudative changes, ischemic changes, venous beading and abnormal
vessel growth.3 Improved medical care over the last three decades (intensive insulin
therapy and tight blood glucose control) has reduced the progress of vision-
threatening retinopathy.4 However, it remains a challenge to prevent retinopathy
and other complications before the onset of advanced stages of disease to provide a
timely treatment that could lead to reducing vision loss by 50%.5,6 To achieve this
goal, it is necessary to have scheduled regular eye examinations to ensure a reliable
detection at time when treatment (e.g. laser therapy, or anti-VEGF treatments) is
most effective. Lack of compliance to screening guidelines, limited availability of
retina specialists and ophthalmologists in several geographic areas and
socioeconomic barriers are the main challenges to improve visual outcomes in
diabetic patients.7,8
2.1.1 Natural History of diabetic retinopathy
Although fundamental causes are uncertain, exposure to elevated glucose and other
risk factors initiates a cascade of biochemical and physiological changes that take
place before the onset of vascular lesions in patients with clinically normal retinas.9
Normal vision relies on the perfect cell-cell communication among epithelial cells on
the retina, mainly neuronal, glial, microglial, vascular and pigmented cells (Figure
2.1).4 Vascular changes in diabetic patients such as increased retinal flow and
permeability of small vessels, if left uncontrolled, could lead to glucose-mediated
microvascular damage in retinal structures conducting to progressive vision loss.2
While the interval between diabetes diagnosis and development of any retinopathy
varies from 4 to 7 years ( or longer), functional and anatomic changes do occur
shortly after the onset of insulin-deficient diabetes, corresponding to the preclinical
retinopathy stage.10–12 During this stage, early histological changes such as pericyte
loss and basement membrane thickening are the main cellular events affecting

7
retinal function, but are only detectable by histological examination and cannot be
identified clinically. These changes affect the growth and repair of endothelial cells in
the retinal vascular system; pericyte loss in particular affects normal capillary
perfusion, which increases membrane permeability and causes extravasation of
intravascular fluid.9,13,14 To prevent the progression of this early phase to more
severe vascular lesions, it is recommended that patients with normal-appearing
retinas and good vision should already have a specific screening schedule as well as a
solid preventive treatment to control for other known risk factors that could
accelerate the onset of DR.3,4 These individuals also represent an important
therapeutic opportunity since they will have a better response to intensive therapy
and an increased chance to preserve vision loss.4
As preclinical retinopathy remains undetected, the combined effect of pericyte loss
and expression of angiogenic factors by nonvascular retinal cells leads to the onset of
clinical manifestations of nonproliferative diabetic retinopathy (NPDR), such micro-
aneurysms and intraretinal microvascular abnormalities localized within the retina
(IRMA).4,13 Other defects such as capillary dilation, nonperfusion and leakage are also
developed predominantly in the posterior fundus temporal to the macula,
compromising neuronal and glial cell integrity which in turn have a negative impact
in neurotransmission.4,15 As DR progresses, new retinal vessels in the optic disc are
formed as a consequence of the permanent expression of VEGF factor, cytokines and
other components involved in inflammatory response. When neovascularization and
retinal vasodilation beading takes place, the disease has progressed to proliferative
diabetic retinopathy (PDR). The cumulative effect of vascular and neural alterations
Figure 2.1 Anatomy of the retina

8
taking place in both the retina and optic nerve (e.g. macular edema, retinal
detachment, optic neuropathy and axonal degeneration) along with presence of
media opacities lead to vision loss.16
2.1.2 Epidemiology of diabetic retinopathy
Diabetic retinopathy is recognized as a public health problem among industrialized
nations, as it remains the main cause of blindness in people aged 20 to 74 years of
age. In north American adult type 2 diabetic patients older than 40 years, 40% have
retinopathy and 8% have progressed to vision-threatening retinopathy.17 Important
risk factors include hyperglycaemia, diabetes duration and concomitant
hypertension.18 Vision-loss rates have been decreasing over the past three decades,
due to the advent of photocoagulation treatment for DR patients and newer anti
VEGF treatments. However, a timely identification of at-risk patients is of great
importance for adequate treatment delivery.19
2.1.2.1 Prevalence
In many industrialized countries, DR is the most frequent cause of vision impairment
in both the elderly and the working-age population20. A recent meta-analysis
conducted by Yaw JWY and colleagues, revealed that the global age-adjusted
prevalence of any DR is 34.6% (95% CI: 34.5-34.8) among diabetic patients21. A
higher prevalence of any DR among type I DM patients was also found (77.3%), when
compared to that of type II DM counterparts (35.2%). Similarly, prevalence estimates
were higher in African-Americans (49.5%) and lower in Asians (19.1%); moreover, no
significant gender difference in DR prevalence was found 21. Other studies conducted
in United States and Australia have reported lower prevalence22. In United States the
estimated prevalence of any DR for diabetic individuals over 40 years is 28.5%,
whereas in Australia is 21.9% for individuals over 25 years with type II diabetes23,24.
Of important note, rural communities seem to have particularly high DR prevalence.
A study conducted in rural China named The Handan Eye Study, showed a
prevalence of any DR of 40% in diabetic patients over 30 years of age25.

9
Recent studies conducted in Canada have taken place in Alberta, James Bay and the
Metis Nation, revealing conflicting prevalence estimates. Studies such as The
Southern Alberta Study for Diabetic Retinopathy (SASDR)26 conducted in both urban
and rural areas revealed a prevalence of any DR of 40%, almost two-fold greater
than the one reported by Nathoo and colleagues (27.2%) for rural northern
Alberta27. Similarly, a study conducted in Alberta First Nations communities by
Rudnisky and colleagues using a tele-ophthalmology screening strategy, found a
prevalence of any DR of 20.71%28. Such differences might be due to selection bias or
might reflect a true difference in disease burden.
Although it has been proposed that native communities are more susceptible to
develop diabetes-derived vascular complications such as DR29,30, the SASDR study did
not find differences in prevalence of any DR between native and non-native
Canadians26.
2.1.2.2 Incidence
Very few population-based studies have reported the incidence of DR; the Wisconsin
Epidemiologic Study of Diabetic Retinopathy (WESDR) is perhaps the most widely
known31. This study conducted in the United States, included type I and II DM
patients from 11 counties in south central Wisconsin with the main objective of
providing a stable estimate of risk of DR according to age group (less than 30 years
and equal or older than 30 years)32. The results showed that, in a 10-year interval
the overall incidence of DR was 74%; 17% of patients diagnosed with DR at baseline
developed PDR during that same timeframe33. After 25 years of follow-up (1980-
1982 to 2005-2007), almost all patients with type I diabetes developed DR (97%)
from which 42% progressed to PDR34.
A recent study conducted in England by Jones and colleagues, included type I and II
diabetic patients screened by the Central Norfolk Diabetic Retinopathy Screening
Service between 1990 and 200635. At baseline, 20.5% of patients had at least pre-
proliferative retinopathy. Overall incidence rates of any DR after 5 and 10 years of
follow-up were 41.3% and 84.7%, respectively. Likewise, after 10 years of follow-up
11% of patients with pre-proliferative retinopathy at baseline developed PDR. Unlike

10
the WESDR study results, the incidence rate of PDR was lower, probably due to a
selective exclusion of high-risk patients that were referred to a specialist, and thus
removed from the screening cohort35.
While the trend of DR incidence for type I and II diabetic patients is not well
established, there is evidence that progression to PDR has been decreasing
throughout time6. A systematic review conducted by Wong and collaborators,
included 28 studies from 1975 to 2008 to determine temporal trends and rates of
progression of DR to PDR36. Among studies that reported the incidence rate after 4
years of follow-up, the pooled incidence of PDR was 11%. After stratifying by time
points, it was found that 19.5% of patients developed PDR in 1975-1985 in contrast
to just 2.6% in the 1986-2008 cohort36. Such difference might be partially explained
by the improvement in DR screening methods and treatment guidelines for diabetic
patients, as well as a better glycemic control in recent years37.
2.1.2.3 Risk of blindness and severe vision loss (SVL)
Vision loss is the most important functional consequence of DR. Despite the
availability of novel treatments to prevent severe vision impairment from DR, it is
clear that blindness from diabetes remains a public health concern in most
countries31,38. A meta-analysis conducted by Wong and associates, found a rate of
severe vision loss (visual acuity <5/200) of 2.6% in studies published between 1986
and 200836. Moreover, SVL was more likely to develop in patients with untreated DR
at baseline, which highlights the importance of an early diagnosis and a timely
intervention36,39,40. .
Also important is the burden of legal blindness (<20/200) and visual disability
(<20/70) due to advanced forms of DR. In the WESDR study for example, 3.6% of
insulin requiring participants were legally blind (visual acuity <20/200 in the better
eye) at the baseline examination34,41. Even mild forms of visual impairment have a
considerable impact on quality of life, as patients with impaired visual acuity report
low socialization,42 emotional distress and difficulties in physical function related to
driving and distance vision.43 As a result, these debilitating ramifications of loss in
visual acuity may lead to a significant reduction in the functional status of the

11
patient, taking a toll to society.9 Thus, prompt classification of DR and appropriate
treatment according to DR severity becomes crucial to reduce its progression and to
subside the impact on visual acuity.
Evidence of decreasing vision loss rates has been reported in recent studies 44. Klein
et al, reported a decrease in vision loss incidence rates in more recently diagnosed
type I diabetic patients (annual incidence rate 1.19% in early 1980’s vs. 0.30% in mid-
2000’s), which might be due to a combined effect of better glucose controls, timely
treatment interventions and a lower incidence of PDR45.
2.1.2.4 Risk factors
2.1.2.4.1 Modifiable factors
Hyperglycemia Glycemic control is currently considered an important predictive factor for DR,
although its influence in onset and progression of DR wasn’t established until early
1980’s.31,40 Epidemiological findings from large population studies such as WESDR,41
the Diabetes Control and Complications Trial (DCCT),46 and the UK Prospective
Diabetes Study (UKPDS)47 helped to determine whether the level of hyperglycemia
influences the risk of retinopathy. Specifically, evidence from the WESDR study
showed that for every 1% decrease in glycosylated hemoglobin A1 level (HbA1c)
there was an association with an 18% decrease in the 21-year progression to PDR in
insulin requiring subjects.34 This study also provided evidence that glycemic control
was a significant predictor of 10-year rate of PDR, in both type I and II diabetic
patients.48
Findings from the WESDR study were further confirmed by subsequent outcomes
from the DCCT (Type I DM patients) and the UKPDS (Type II DM patients) trials. In
the DCCT trial, it was proven that intensive glycemic control (median HbA1c, 7.2%)
led to a reduction of 76% (95% CI:62-85) in the development of DR among insulin-
requiring patients without DR at baseline.46 Similarly, patients in the intensive
glycemic treatment group had a lower progression rate from early to advance DR by
54% (95%CI: 39%-66%), as compared to patients in the conventional treatment
group. This means that subjects with HbA1c levels of 10% have a 5-fold increase risk

12
of DR progression, as compared to patients with 7% HbA1c levels.46,49,50 In line with
these findings, the UKPDS reported equivalent findings for type II diabetic patients.47
After 10 years of follow-up, patients in the treatment-intensive group (dietary
restriction plus medication) had a 25% (95%CI: 7%-40%) risk reduction of
microvascular events (including progression of DR), when compared with the
conventional treatment group (diet only).51,52 Levels of HbA1c were also lower in
treatment intensive patients (7% vs. 7.9%) than in their counterparts.52
Altogether, these studies provided evidence that intensive glycemic control is a
determinant factor for reducing the risk of development and progression of DR in
both type I and II diabetic patients. In fact, they founded the basis for the American
Diabetes Association guidelines for glycemic control to reach a target level of HbA1c
of 7% for diabetic patients.40
Hypertension It is hypothesized that hypertension might contribute to an increase of retinal blood
flow, which in turn promotes the onset of DR.53 Some epidemiologic studies have
found evidence of an association between hypertension and DR progression,
although its influence in DR onset is not well established yet, especially in type I
diabetic subjects.5,20 In the WESDR study, blood pressure was related to the
progression of PDR in insulin-dependent patients (HR, 1.3 per 10 mmHg; 95% CI:
1.16-1.46; p-value < 0.001), but hypertension at baseline was not associated with
incidence of DR (HR, 1.1; 95%CI: 0.86-1.44; p-value, 0.42) in type I diabetic patients.34
In contrast, the UKPDS study randomized eligible type II diabetic patients with
borderline or mild hypertension to receive tight blood pressure control (<150/<85
mmHg), or conventional control (<180/<105 mmHg).47 Patients having a tight control
had a 34% reduction (99%CI: 11%-50%) in the progression of DR, and a 35%
reduction in laser photocoagulation compared with patients in the conventional
control group52,54.
Other risk factors Results from some epidemiological studies have found that other modifiable factors
such as dyslipidemia, obesity and inflammatory markers are somewhat associated
with DR20,37. However, findings have been inconsistent and their particular role in the

13
pathogenesis of DR has not been yet elucidated. Although studies have failed to
demonstrate an association of DR progression and total cholesterol levels, data from
two large cohort studies55,56 have found that high serum lipids at baseline are related
to the development of hard retinal exudates. Specifically, increasing triglycerides and
lower HDL cholesterol were reported to be potential risk factors for the progression
of DR in type I diabetic patients57,58. Such findings were also confirmed by a cross-
sectional analysis of insulin-requiring European patients, in which subjects with
elevated triglyceride levels presented a doubled risk of DR progression, when
compared to patients in the lowest triglyceride quartile59.
The relationship between body mass index (BMI) or waist to hip ratio and DR
progression is still inconclusive. Some studies have found that higher BMI and neck
circumference are independently associated with the presence and severity of
DR60,61. In contrast, large scale studies such as WESDR have suggested a protective
role of BMI in DR progression among type I patients. It is evident that more research
is needed to clarify the role of obesity in DR onset and progression62. Similarly,
evidence regarding the role of inflammatory markers as risk factors for DR is at an
early stage, in which markers of inflammation such as C-reactive protein, interleukin-
6 and soluble intercellular adhesion molecule 1 have been associated with
retinopathy and proposed as novel therapeutic targets as well60,63. Compelling
epidemiologic evidence is necessary to understand the role of markers of
inflammation in DR pathogenesis and the possibilities of clinical use as therapeutic
targets for retinopathy prevention.
2.1.2.4.2 Non-modifiable factors
Duration of diabetes The role of diabetes duration in the development of DR is well established, and has
been consistently demonstrated in several studies.5,6,20,64,65 For instance, two
population studies conducted in the United States reported increased DR among
patients with ≥ 15 years of diabetes. The Los Angeles Latino Eye Study (LALES)
reported a four-fold increased incidence of DR in the first eye for patients with more
than 15 years of diabetes as compared to individuals with newly diagnosed
14
individuals (p=0.004).64 In line with these findings, Harris and collaborators showed a
higher prevalence of DR in type II diabetic patients with 15 or more years since
diagnosis versus subjects with less than 5 years of diabetes (36% and 11.8%
respectively, p <0.001).66
Ethnicity Research studies have demonstrated some disparity in the prevalence and severity
of DR among ethnic groups, which sometimes has been independent from other
known risk factors.6,67 Some studies conducted in the United States have reported
that members from Hispanic and African American communities have a greater risk
of DR when compared to non-Hispanic white counterparts.64,66,68 For example, the
Multi-ethnic study of Artherosclerosis (MESA) reported a higher DR prevalence (p=
0.01) among black and Hispanic people (36.7% and 37.4%, respectively) than in white
subjects (24.8%). Although ethnic origin was not an independent predictor of DR,
researchers have speculated that genetic factors might explain the excess risk of DR
in some ethnic groups.17,49,51,52 In a subsequent analysis, the DCCT study investigators
assessed familial associations and risk of DR in more than 300 participants69. It
showed an increased risk of severity of retinopathy among relatives of retinopathy-
positive patients when compared to relatives of retinopathy-negative subjects (OR=
3.1; p < 0.05).69
Altogether, such evidence suggests that differential genetic predisposition to
microvascular damage, or even intrinsic cultural factors among ethnic groups might
have an underlying role in the development of DR. However, greater exposure to
hyperglycemia and higher frequency of risk factors (i.e. poor glycemic control) in
African Americans and Hispanic individuals versus white subjects might also account
for reported differences in DR development among ethnic groups66.
Other non-modifiable risk factors It is speculated that hormone elevation levels occurring after puberty are positively
associated with retinopathy70. Studies conducted in the past two decades reported
that prepubertal duration of diabetes is related to increasing the delay in the onset
of microvascular complications, such as DR in insulin-requiring patients.71–73 A
15
subsequent analysis derived from the WESDR study, reported that diabetes duration
after menarche was associated with an increased risk of retinopathy compared with
diabetes duration prior menarche (OR=3.15; p< 0.05).71 Similarly, pregnancy has
been associated with an increased development and progression of DR, especially in
type I diabetic patients.74,75 In a longitudinal analysis derived from the DCCT study,
pregnant women (type I diabetes) had 1.6 to 2.4-fold increased risk of retinopathy
compared to non-pregnant counterparts, being the highest risk at the second
semester.76 Notwithstanding, DR developed during pregnancy shows a 30% to 50%
rate of spontaneous regression after delivery with no long-term consequences.77
2.1.3 Clinical assessment of diabetic retinopathy
2.1.3.1 Screening techniques
A comprehensive screening evaluation for DR should include intraocular pressure
and visual acuity estimations, as well as retina examinations for the presence of
neovascularization.78 The main potential screening modalities for DR assessment are
ophthalmoscopy (direct and indirect), fluorescein angiography, slit-lamp
biomicroscopy and mydriatic or non-mydriatic camera-based screening.79 According
to the Canadian Ophthalmology Society evidence-based guidelines, screening
alternatives for DR grading should accomplish a sensitivity of at least 80% and
specificity between 90% and 95%, if performed by a trained examiner.78 Likewise, a
widely used clinical standard proposed by the British Diabetic Association Working
Group in 1997 specifies that methods of screening for DR should match the 80% and
95% specificity standards, keeping in mind that lower effectiveness values imply
potential costs for the healthcare system and missed treatment opportunities.80
From the mentioned alternatives, ophthalmoscopy and slit-lamp biomicroscopy are
traditionally used for community-based screening. However, ophthalmoscopy shows
a significant variation on the effectiveness depending on the healthcare professional
that conducts the examination.81 For example, studies that evaluated the
effectiveness of screenings by optometrists and general practitioners showed that
sensitivity levels for detecting sight-threatening retinopathy ranged between 25%
and 80%, being optometrists more effective than general practitioners.82–84 Similarly,
studies using undilated ophthalmoscopy screening conducted by

16
nonophthalmologists reported poor performance, with a sensitivity as low as 50%
for the detection of PDR.81 Alternatively, the best screening approach for grading DR
is dilated slit-lamp biomicroscopy, assessed by a retina specialist or senior
ophthalmologist with a 90D or 78D lens. This technique has proven to be highly
effective, achieving sensitivity and specificity values of 87% and 94%,
respectively.83,85
2.1.3.2 Screening and prevention of DR
DR fulfills the World Health Organization (WHO) criteria for screening;86 these
criteria revolve around three critical components: Disease, screening test, diagnosis
and treatment.
Disease
DR is an important public health concern,87 with a recognizable presymptomatic
stage and a natural history well described in the literature.2 It is widely accepted that
DR presents a long preclinical phase that may last up to 7 years, during which the
patient cannot detect any vision changes.10-12 Usually, the patient seeks medical care
after severe retinal damage has occurred, for which treatment may not be effective. 9 Therefore, the detection of early stages of DR through screening facilitate adequate
treatment delivery, which is translated to cases of blindness prevented. For example,
some districts in Great Britain with long-standing DR screening programs have
reported that DR is no longer the main cause of blindness amongst working-age
individuals, as opposed to other settings that do not have a consistent screening
program in place.7
Screening test
Several screening methods can be used for DR examination. Screening typically
includes direct/indirect ophthalmoscopy, slit-lamp biomicroscopy or digital fundus
photography. Their performance may vary depending on use of pharmacologic
dilation, the grade of expertise of the examiner and threshold positivity. For the
detection of sight-threatening retinopathy, mydriatic digital fundus photography
results interpreted by an expert reader yield a sensitivity and specificity of over

17
80%.82 These screening techniques are not invasive and do not cause the patient any
harm; however, pharmacologic mydriasis may cause temporary blurred vision and
increase the risk of temporary open-angle glaucoma.39 Nevertheless, the benefits of
early detection of DR cases outweight the potential (and reversible) harm of open-
anle glaucoma.9
Diagnosis and treatment
Several landmark clinical trials32,88,89 have shown the clinical benefits of timely and
accurate screening that facilitates treatment delivery and prevents blindeness due to
DR. For example, the Diabetic Retinopathy Study (DRS) demonstrated that panretinal
photocoagulation reduces the risk of vision loss by 50% and 16% in patients with
macular edema and PDR, respectively.90 Such findings were later confirmed by the
ETDRS study in older-onset diabetic patients.91 Even novel therapies, such as anti-
VEGF treatments have shown improvement in visual acuity in patients with diabetic
macular edema, a serious complication derived from the progression of DR.92 More
recent studies on anti-VEGF treatments have shown that not only patients under this
therapy have a long-lasting improvement in visual acuity, but also have significant
regression of retinal neovascularization and reduced retinal thickness.93 Therefore,
an early intervention for DR treatment does translate in clinical improvement by
preventing cases of blindness and severe vision loss in patients with moderate PDR.90
In fact, evidence-based models have shown that with proper screening and
treatment, 6% of patients would be prevented from blindness within a year and up
to 34% within 10 years..
Finally, DR screening programs have proven to be cost-effective in economic
modelling studies, resulting in substantial budget savings for the healthcare
provider.94,95
Screening goals and challenges
The main goal of a screening program for DR is the detection of sight-threatening
disease, in which the detection of any retinopathy is of secondary benefit but may
act as an early proxy of the former.96 Examination guidelines have been developed

18
by organizations such as the American Academy of Ophthalmology (AAO)97 and the
American Diabetes Association (ADA)19 which have been largely based on
retinopathy severity. According to ADA’s latest guidelines, an immediate eye
examination is recommended for newly diagnosed type II diabetic patients, whereas
type I patients can have their first examination within 3 to 5 years of diagnosis.
Annual or biannual eye examination is recommended in absence of complications,
with more frequent examinations in case of abnormal findings.19 Likewise, the AAO
formulates the same differential recommendation for type I and II diabetic patients,
with an annual follow-up examination for both groups.97
Adherence to examination recommendations has been less than satisfactory, with a
30%-60% compliance rate that varies across different settings98. For instance,
adherence rates to vision guidelines in North America were less than 50% during the
past two decades;8 unfortunately, reported rates do not yet show an increasing
adherence trend over time.99 Studies also show that translation of research into
practice and adoption of examination guidelines have been delayed by compliance
barriers, in areas such as community education and finance.100 Among these studies,
the Diabetic Retinopathy Awareness Program (DRAP) trial101 conducted in the US,
reported a nonadherence rate to AAO and ADA guidelines of 30% (n= 813/2308). It
also suggested four main factors associated to poor compliance: healthcare provider,
population demographics, diabetes type and duration and education.101 Low
screening rates translates into negative implications for the quality of life of diabetic
patients, representing potential expenditures to their clinical care, lost productivity
and lost opportunities for vision loss prevention.8
Overall, this evidence supports the need to improve vision care practices in diabetic
patients, with greater emphasis on target groups at high-risk of nonadherence.100,101
These groups are typically from rural or remote areas and have a low level of
awareness about vision complications of diabetes; improved access to healthcare
(practice/provider performance) and more detailed information about DR
complications would increase screening attendance.102,103
2.1.3.3 Grading of diabetic retinopathy severity

19
Currently, there are many validated DR grading scales that are applied widely in
clinical and research settings, which are based on the identification of key
microvascular abnormalities from each DR stage (Figure 2.2).12,104,105 Among
available guidelines, the Airlie House classification is universally accepted in research
settings and publications, for it has demonstrated a satisfactory reproducibility and
validity.88 It is based on seven standard 30-degree photographic fields, yielding an
accurate representation of the retinal status; an extensive standard set of more than
11 DR definitions is employed to classify DR severity in patients.88 In spite of its use in
clinical trials as the “gold standard” for DR screening, the implementation of the
Modified Airlie House classification in the clinical setting and mass screening is
somewhat unpractical due to its complexity and meticulous definitions, which are
unnecessary and difficult to remember in clinical care.104,106 In fact, the American
Academy of Ophthalmology has found that most health professionals do not use the
full Airlie House classification scale due to its complexity.12
Consequently, several countries have adapted and simplified this classification for
general practice, resulting in a variety of validated guidelines, such as European field
guide, Winsconsin guidelines and EURODIAB protocol, which have been used in
different settings over the past decade (Figure 2.2).12,104,105 It is also common to find
published studies in which authors modify an existent grading guideline, or even
develop their own classification to grade severity of DR in their study patients.107,108
The lack of consensus regarding DR severity classification poses a challenge in
healthcare delivery and research, limiting the worldwide exchange of information
and data.109,110 For example, the comparison of screening strategies from different
settings would be inappropriate if each study used their own grading system. It also
affects the effective communication between and among primary care physicians,
nurses, ophthalmologists and other eye care providers, which would be improved if a
standard set of definitions of severity of diabetic retinopathy is universally
implemented.12,106,111

20
In an effort to providing a single standardized practical clinical DR severity scale for
worldwide use, the AAO launched a project in 2001 to develop an optimal DR scale,
resulting in the publication of the International Clinical Diabetic Retinopathy and
Diabetic Macular Edema Disease Severity Scales in 2003.12 Based on landmark
studies such as ETDRS88 and WESDR32, this scale comprises 5 different levels of DR
disease severity according to findings of IRMA and venous beading lesions (Figure
2.2). It is expected that the system will be implemented by ophthalmologists and
other healthcare providers, who can also promote its dissemination and future
incorporation of the International DR Scale in practice guidelines.12,78,112
2.1.3.4 Gold standard for diabetic retinopathy screening
From the existing screening alternatives, ETDRS 30-degrees 7-field stereo color 35
mm slides is considered the gold standard for detection of DR.94 This technique was
initially used in the DRS trial113 (1976), later expanded in the ETDRS trial88 (1991) and
validated in subsequent studies. It consists of a set of 7 photographs taken in
different areas of the eye, including stereoscopic photographs centered on optic
disc, macula, temporal to the macula, and upper and lower poles of the disc.88 This
method allows a detailed examination of various retinal abnormalities including
micro-aneurysms, soft exudates, hard exudates and retinal haemorrhages. However,
this technique is labour intensive, time consuming (it takes several weeks from data
Figure 2.2 Diabetic Retinopathy Disease Severity Scales. ETDRS= Early Treatment Diabetic Retinopathy Study DR= Diabetic Retinopathy NPDR= Non-proliferative Diabetic Retinopathy PDR= Proliferative Diabetic Retinopathy

21
acquisition to interpretation), and requires skilled photographers and sophisticated
photography equipment.114 Consequently, it becomes impractical for community
screening and is not universally used in routine clinical care.79
Despite these limitations, some experts consider the ETDRS photograph protocol as
the only accepted gold standard test for detecting diabetic retinopathy in
research,79,114,115 although this statement is not universally recognized. Validation
studies have demonstrated that slit-lamp examination by an experienced specialist is
equivalent to ETDRS photographs in the detection of referable retinopathy; hence,
slit-lamp biomicroscopy has been used as a reference standard as well. In a study
conducted by Scanlon and colleagues116 in which slit-lamp biomicroscopy performed
by an ophthalmologist was assessed against 7-field ETDRS photographs, sensitivity
and specificity values of 87.4% and 94.9%, respectively. Hence, authors concluded
that slit-lamp biomicroscopy if performed by an experienced ophthalmologist is
favourably compared with 7-field ETDRS photographs in the detection of referable
retinopathy.116 Other studies have also showed a high level of agreement (kappa
index > 0.75) between examination and 7-field ETDRS photographs for grading
severe forms of DR, with small number of disagreements of clinical significane.117,118
Given that a dual gold standard exists, diagnostic accuracy studies have reported the
use of either ETDRS photographs or slit-lamp biomicroscopy as the gold standard
test.115 Such contrast is explained by the fact that observational studies prefer slit-
lamp biomicroscopy as the reference standard to assess diagnostic accuracy of DR
screening alternatives, especially if the study is performed “in the field”. These
projects are often conducted in remote areas and isolated communities, where
transportation of the specialized equipment required for stereo 7-field ETDRS
photographs becomes impractical and unsuitable for large-scale screening.119,120
2.1.4 Digital retinal photography
During the past 30 years, digital photography has been introduced as an effective
alternative to ophthalmoscopy and traditional camera-based screening for DR
screening programs. With the advent of digital and mobile technology, it has
gradually become the preferred screening option, as digital cameras have technically
22
improved and become less expensive.121 In addition to the advantages of camera-
based screening (having an image record, review of disease progression and quality
assurance), digital images can be immediately assessed and better quality images
can be retaken if necessary.96 With digital cameras it is also possible to transmit the
images electronically to specialized centers where ophthalmologists can review them
and grade the presence and extent of DR.122
Given the advantages of digital retinal photography, a growing number of studies
have assessed its performance for DR screening in diverse settings; most results have
been promising, reporting a sensitivity and specificity of above 80%123–125 with some
exceptions, where effectiveness was lower than 60%.126 Such a contrast among
studies also show that the chosen technology (i.e type of camera, resolution, image
compression), number of fields taken and use of pharmacologic dilation might play
an important role on the effectiveness of digital retinal photography screening.127
Usually, nonmydriatic approaches have a lower sensitivity and a higher rate of
unreadable photographs than those using pharmacologic dilation. Baeza and
collaborators128 directly addressed this issue by assessing three different screening
strategies with and without pharmacologic dilation, using a nonmydriatic digital
camera. Compared with 7-field ETDRS photographs, strategies using mydriasis
achieved a sensitivity between 82%-85% and a specificity of 98% with a 2% failure
rate, whereas nonmydriatic approaches showed a sensitivity range of 67%-82% and a
specificity of 99% with a 16% failure rate.128 Of important note, the screening
strategy that used only one filed and no pharmacologic dilation had the worst
sensitivity (67%; 95%CI: 54%-80%).
In contrast, other studies have reported that the use of a single field does not affect
screening quality as long as pharmacologic dilation is used. A study conducted in
Canada119 evaluated the effectiveness of single field digital screening in an aboriginal
community at James Bay (Ontario), since this modality is very practical and easy to
perform in remote areas. Authors found that this single-field approach would be
impossible to conduct without pharmacologic dilation in this community, given the
high failure rate (> 50%). However when pharmacologic dilation was implemented,
the failure rate improve dramatically (1.5%) and effectiveness values for detecting

23
referable retinopathy met the Canadian Ophthalmological Society’s standards
(sensitivity >80%, specificity between 90% and 95%).119
Although there is some evidence of the importance of pharmacologic dilation and
number of fields used in digital photography screening for DR,128,129 the extent of this
influence and the interaction between both components is not well defined.81
Moreover, the role of other technical characteristics such as camera type, resolution,
image compression and storage on digital photography screening is unclear. So far,
current guidelines from the Canadian Society of Ophthalmology and the AAO
recommend that for digital photography screening, at least two 45° fields should be
taken with pharmacologic dilation if mydriatic cameras are used, and without pupil
dilation for the nonmydriatic camera models.78,79
2.1.5 Tele-ophthalmology assessment of diabetic retinopathy (telescreening)
Tele-ophthalmology is an area of telemedicine that allows the examination of
patient’s eye problems with the patient and eye care specialist located in different
geographical areas. This method is based on the exchange of medical information
from one site to another using electronic communications.114 It has been described
as a promising alternative that improves access to screening regardless of geographic
constraints; it also reduces travel time and cost while creating new screening
opportunities in underserved communities.130
Although considered futuristic and experimental during the early 80’s, tele-
ophthalmology has gradually evolved into a specialty that incorporates modern
technology with the potential of becoming an integral component of primary care of
diabetic patients.131 Diabetic retinopathy telehealth programs typically encompass
four elements of care: Image acquisition, image review and evaluation, patient care
supervision, and image (data) storage.132
Technical requirements may vary, depending of each screening program scope and
intent.133 In a general tele-ophthalmology program for DR screening (store-and-
forward model), retinal images are obtained with digital retinal cameras (mydriatic
or non-mydriatic) by a previously trained non-specialist in a remote place.114 The
data is then securely transferred to a reading center for evaluation, in which ocular
24
assessment is performed by an eye specialist or a certified reader; specifications
regarding image compression, bandwidth, encryption and error checking
mechanisms are tailored according to each screening program.132 Finally, findings are
reported back to the primary care physician with the recommendation regarding the
need for referral.134
In some cases images may be of poor quality due to presence of media opacities,
small pupil size or technical difficulties.129 In telescreening for DR, unreadable images
are considered positive findings and patients must be referred for a comprehensive
evaluation.135 To overcome this issue, the use of pharmacologic agents for pupil
dilation may be incorporated in the screening protocol. However, the use of
mydriatic agents by nonophthalmic personnel may represent an issue in that adverse
events such as angle-closure glaucoma might occur, requiring the need of specialized
personnel.119,136
2.1.5.1 General tele-ophthalmology guidelines
Tele-ophthalmology is a mature telehealth specialty with well-established standards
defined by the American Telemedicine Association (ATA), which seeks to improve
healthcare delivery through telecommunications and information technology, while
eliminating barriers to the use of telemedicine.132 According to the ATA, the main
goals of a tele-ophthalmology program for DR are to “reduce the incidence of vision
loss due to DR, improve access to diagnosis and management of DR, decrease the
cost of identifying patients with DR”.135 As clearly stated by the American
Telemedicine Association135 and the American Academy of Ophthalmology97, retinal
telemedicine examination is currently not intended to replace a comprehensive eye
examination by an experienced ophthalmologist, but to act as a first-line screening
tool for DR that will filter and reduce the volume of unnecessarily referred patients.
Tele-ophthalmology systems are categorized into three groups depending on image
transmission: Real-time, store-and-forward, and hybrid. Real time transmission
involves a two-way real time video connection, whereas in store-and-forward
teleconsultation the image is first captured with a digital camera in a fixed or mobile
telescreening unit and then sent forward via electronic communications.137 Hybrid is
25
the combination of the two former approaches.138 Current ocular telehealth practice
guidelines from the American Telemedicine Association are based on the store-and-
forward modality.135
2.1.5.2 Clinical validation of tele-ophthalmology systems
Both the AAO85 and the ATA135 have stressed the importance of performing pilot
studies for the validation of new tele-ophthalmology programs. This validation must
state the scope of the program, target population, aimed validation category and
technology used. Ideally, results should be published in a peer-review journal in
which sensitivity, specificity and agreement values are reported.132,139 It is
considered that the current benchmark for evaluating a tele-ophthalmology program
consists on the use of 7 field ETDRS photographs as the reference standard, and the
use of the International DR Disease Severity Scale as the guideline for DR
classification.12,88
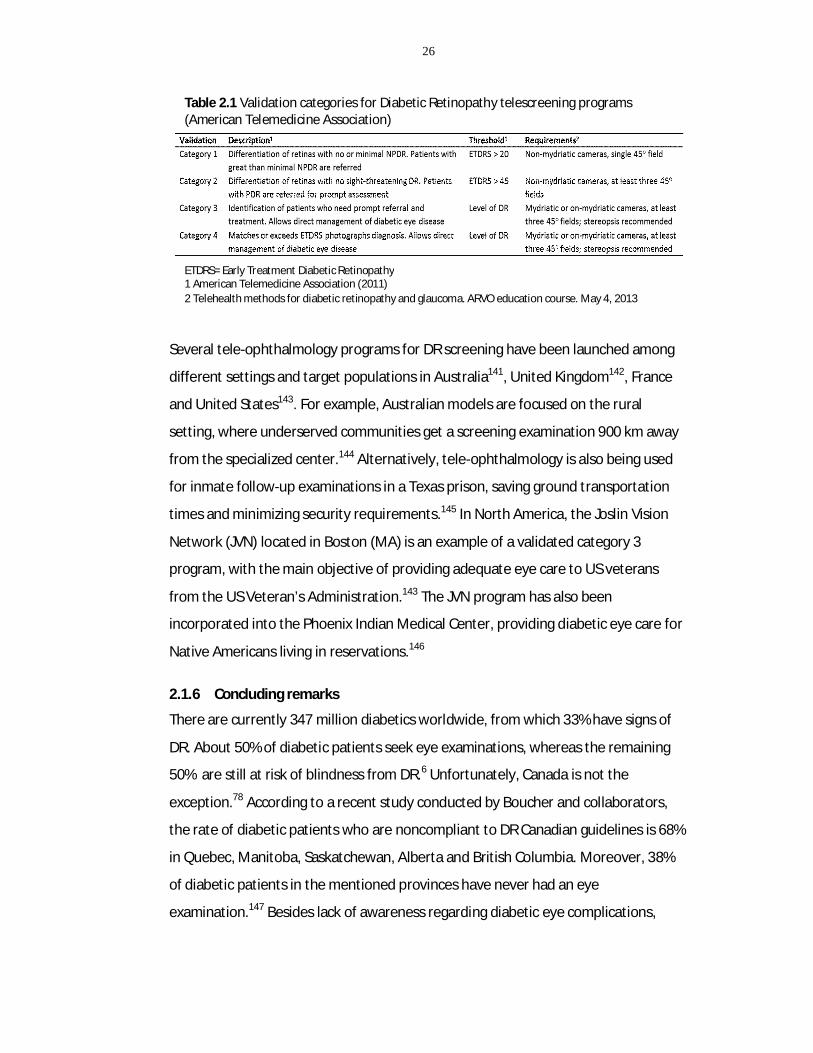
To outline a standard for the validation process, the ATA recently published the
second edition of “Telehealth practice recommendations for diabetic
retinopathy”135, in which four categories for validation of tele-ophthalmology
programs for DR are documented (Table 2.1). Each one differs in hardware and
software technology requirements, the level of expertise of staffing and support, and
clinical outcomes. Those programs with low thresholds for referral need not follow
strict DR classifications and technological requirements are simpler compared to
those programs that seek to discriminate level of DR.140 Independently of the
validation category, tele-ophthalmology programs should have less than 10% rate of
unreadable images.78
Currently, there are no tele-ophthalmology programs that meet category 4 criteria
which would allow the replacement of a comprehensive in person assessment.
However, mature tele-ophthalmology programs for DR screening in the US (more
than 10 years old) already have a category 3 validation in which level of DR is
assessed, instead of the simpler dichotomous classification of category 1 and 2
programs.132
26
Several tele-ophthalmology programs for DR screening have been launched among
different settings and target populations in Australia141, United Kingdom142, France
and United States143. For example, Australian models are focused on the rural
setting, where underserved communities get a screening examination 900 km away
from the specialized center.144 Alternatively, tele-ophthalmology is also being used
for inmate follow-up examinations in a Texas prison, saving ground transportation
times and minimizing security requirements.145 In North America, the Joslin Vision
Network (JVN) located in Boston (MA) is an example of a validated category 3
program, with the main objective of providing adequate eye care to US veterans
from the US Veteran’s Administration.143 The JVN program has also been
incorporated into the Phoenix Indian Medical Center, providing diabetic eye care for
Native Americans living in reservations.146
2.1.6 Concluding remarks
There are currently 347 million diabetics worldwide, from which 33% have signs of
DR. About 50% of diabetic patients seek eye examinations, whereas the remaining
50% are still at risk of blindness from DR.6 Unfortunately, Canada is not the
exception.78 According to a recent study conducted by Boucher and collaborators,
the rate of diabetic patients who are noncompliant to DR Canadian guidelines is 68%
in Quebec, Manitoba, Saskatchewan, Alberta and British Columbia. Moreover, 38%
of diabetic patients in the mentioned provinces have never had an eye
examination.147 Besides lack of awareness regarding diabetic eye complications,
Table 2.1 Validation categories for Diabetic Retinopathy telescreening programs (American Telemedicine Association)
ETDRS= Early Treatment Diabetic Retinopathy 1 American Telemedicine Association (2011) 2 Telehealth methods for diabetic retinopathy and glaucoma. ARVO education course. May 4, 2013

27
inaccessibility and difficulty of getting an appointment for screening is another main
reason for not getting a screening examination.138
Discrepancies in access to eye care are unlikely to subside in the future. As the
incidence of diabetes increases over 50%, the growth in the number of
ophthalmologists in North America is dismal (less than 2%).148 Consequently, an
increasing number of patients will require an eye care examination at least every
two years but even less eye specialists would be available to fulfill the demand for
eye care.106 Public health agencies will be unable to meet DR screening guidelines
relying exclusively on the traditional in-person examination.
2.2 Thesis rationale
As described previously, tele-ophthalmology is an emerging alternative for DR
monitoring, and is being explored in many geographic settings and across several
scenarios of in-place physician accessibility.114 Multiple studies have evaluated the
effectiveness of ongoing tele-ophthalmology programs by means of assessing
diagnostic accuracy estimates such as sensitivity, specificity and kappa values. The
methods and settings vary widely among studies; equipment specifications and cut-
off criteria also differ according with program needs and available technology.
To date, only three reviews have attempted to systematically summarize the
effectiveness of screening programs for DR monitoring.81,127,149 The first quantitative
review was published in 1996, before the advent of tele-ophthalmology for DR
care.149 Later, Hutchinson and colleagues81 published a systematic review on
effectiveness of screening tests for DR which included 20 studies from 1987 to 1999.
They concluded that mydriatic retinal photography was the most effective strategy
for DR screening, even when compared to direct and indirect ophthalmoscopy.81
However, the authors did not perform a meta-analysis to estimate the diagnostic
accuracy of mydriatic retinal photography. In one recent review, Bragge et al
reported a meta-analysis of tests designed to detect presence or absence of DR.127
Using a hierarchical logistic regression approach, the overall sensitivity and
specificity was 82.5% (95%CI: 75.6-87.9) and 88.4% (95%CI: 84.5-91.4),
respectively.127 The study was limited only to studies that assessed the presence of

28
any DR, whereas studies that evaluated the presence of referable retinopathy were
not quantitatively summarized. More importantly, methodological quality of
included studies was not assessed in this review.
Of note, none of these reviews were tailored to synthesize the evidence of tele-
ophthalmology programs; on the contrary, they assessed all DR examination
strategies besides digital photography. Their scope included many screening
methods such as in-person examination (ophthalmoscopy), film camera, and
polaroid camera, which are not suitable for telemedicine.135 Hence, evidence of the
effectiveness of tele-ophthalmology programs for DR assessment has been
accumulating with no conclusive remarks. Furthermore, the use of pharmacologic
dilation and number of fields necessary to maximize the effectiveness of tele-
ophthalmology screening still remains controversial.78,120 A systematic appraisal of
the literature considering the influence of mydriasis and number of fields on tele-
ophthalmology programs is deemed necessary.
Equally important is the estimation of the economic impact of these programs and
the potential long-term benefits that may justify such investment. Several cost-
effectiveness studies have assessed the impact of screening programs for diabetic
retinopathy, from which a small subset focused on the economic evaluation of tele-
ophthalmology technologies.94,145,150 A recent review of the economic evidence of
diabetic retinopathy151 included 13 cost-effectiveness studies that aimed to compare
key features of a DR screening program such as opportunistic screening as opposed
to systematic screening, screening frequency and incorporation of new effective (but
more costly) technologies for screening delivery. In general, studies have concluded
that the implementation of DR screening programs is cost-effective.152–154 However,
the clinical and economic effectiveness of tele-ophthalmology is still uncertain,
depending heavily on patient compliance, the workload for each retinal unit and the
scenario in which would be implemented (urban or non-urban).151,155,156
In Canada, well-developed tele-ophthalmology programs are operating in the
provinces of British Columbia, Vancouver and Quebec.78 With the goal of creating
new eye screening opportunities and promote regular attendance among diabetic
29
patients, most programs have been implemented in remote settings that do not
have ophthalmologists on-site.157,158 Although not a substitute for comprehensive
eye examination, tele-ophthalmology act as a filter to identify and timely refer
patients in need for a specialist examination.135
Interestingly, no telescreening initiative has been taken to improve eye care
coverage for diabetic patients in a non-urban setting. Given the significant capital
investment that such an initiative would demand, an economic analysis would aid to
explore whether tele-ophthalmology is the best alternative for this specific context.
2.3 Thesis objectives
This thesis encompasses two different, yet highly dependent studies. The overall aim
is to determine the diagnostic accuracy of tele-ophthalmology strategies for diabetic
retinopathy screening, and to explore the cost-effectiveness of a pharmacy-based
tele-ophthalmology screening program for detection of diabetic retinopathy in non-
urban Southern Ontario.
Objective 1 – Meta-analysis
a) To systematically identify, review and quantitatively synthesize the evidence
available pertaining to the diagnostic accuracy of tele-ophthalmology strategies for
DR screening in adults as compared to reference standards (7 field ETDRS
photographs or slit-lamp biomicroscopy).
b) To explore screening and study design factors that may influence the diagnostic
accuracy of tele-ophthalmology assessments such as pharmacologic dilation, number
of fields used, choice of reference standard and risk of patient selection bias.
Hypothesis Tele-ophthalmology programs meet the minimum effectiveness
requirements advised by the Canadian Ophthalmological Society (sensitivity over
80%, specificity between 90% and 95%).78

30
Objective 2 – Cost-effectiveness analysis
To explore the cost-effectiveness of a pharmacy-based tele-ophthalmology program
compared to primary care consultation (ophthalmoscopy) for diabetic retinopathy
screening in Southern Ontario (Chatham-Kent region).
2.4 Literature cited
1. Burditt AG, Caird FI, Draper GJ. The natural history of diabetic retinopathy. Q. J. Med. 1968;37(146):303–17. Available at: http://www.ncbi.nlm.nih.gov/pubmed/5656160. Accessed February 5, 2013.
2. Kohner EM. The evolution and natural history of diabetic retinopathy. Int. Ophthalmol. Clin. 1978;18(4):1–16. Available at: http://www.ncbi.nlm.nih.gov/pubmed/721378. Accessed February 5, 2013.
3. Antonetti DA, Klein R, Gardner TW. Diabetic retinopathy. N. Engl. J. Med. 2012;366(13):1227–39. Available at: http://www.ncbi.nlm.nih.gov/pubmed/22455417. Accessed August 1, 2012.
4. Antonetti DA, Barber AJ, Bronson SK, et al. Diabetic retinopathy: seeing beyond glucose-induced microvascular disease. Diabetes. 2006;55(9):2401–11. Available at: http://www.ncbi.nlm.nih.gov/pubmed/16936187. Accessed February 5, 2013.
5. Mohamed Q, Gillies MC, Wong TY. Management of diabetic retinopathy: a systematic review. JAMA. 2007;298(8):902–16. Available at: http://www.ncbi.nlm.nih.gov/pubmed/17712074. Accessed January 28, 2013.
6. Cheung N, Mitchell P, Wong TY. Diabetic retinopathy. Lancet. 2010;376(9735):124–36. Available at: http://www.ncbi.nlm.nih.gov/pubmed/20580421. Accessed July 16, 2012.
7. JN H, Craney L, Nagendran S, CS N. Towards comprehensive population-based screening for diabetic retinopathy: operation of the North Wales diabetic retinopathy screening programme using a central patient register and various screening methods. J. Med. Screen. 2006;13(2):87–92. Available at: http://search.ebscohost.com/login.aspx?direct=true&db=cin20&AN=2009220293&site=ehost-live.
8. Mukamel DB, Bresnick GH, Wang Q, Dickey CF. Barriers to compliance with screening guidelines for diabetic retinopathy. Ophthalmic Epidemiol. 1999;6(1):61–72. Available at: http://www.ncbi.nlm.nih.gov/pubmed/10384685. Accessed August 20, 2012.
9. Ciulla TA, Amador AG, Zinman B. Diabetic retinopathy and diabetic macular edema: pathophysiology, screening, and novel therapies. Diabetes Care.
31
2003;26(9):2653–64. Available at: http://www.ncbi.nlm.nih.gov/pubmed/12941734. Accessed February 5, 2013.
10. Engerman RL, Kern TS. Progression of incipient diabetic retinopathy during good glycemic control. Diabetes. 1987;36(7):808–12. Available at: http://www.ncbi.nlm.nih.gov/pubmed/3556280. Accessed February 25, 2013.
11. Sander B, Larsen M, Engler C, Lund-Andersen H, Parving HH. Early changes in diabetic retinopathy: capillary loss and blood-retina barrier permeability in relation to metabolic control. Acta Ophthalmol. 1994;72(5):553–9. Available at: http://www.ncbi.nlm.nih.gov/pubmed/7887152. Accessed February 25, 2013.
12. Wilkinson CP, Ferris FL, Klein RE, et al. Proposed international clinical diabetic retinopathy and diabetic macular edema disease severity scales. Ophthalmology. 2003;110(9):1677–82. Available at: http://www.ncbi.nlm.nih.gov/pubmed/13129861. Accessed February 23, 2013.
13. COGAN DG, TOUSSAINT D, KUWABARA T. Retinal vascular patterns. IV. Diabetic retinopathy. Arch. Ophthalmol. 1961;66:366–78. Available at: http://www.ncbi.nlm.nih.gov/pubmed/13694291. Accessed February 25, 2013.
14. Abrahamson DR. Recent studies on the structure and pathology of basement membranes. J. Pathol. 1986;149(4):257–78. Available at: http://www.ncbi.nlm.nih.gov/pubmed/2944999. Accessed February 25, 2013.
15. Kohner EM, Sleightholm M. Does microaneurysm count reflect severity of early diabetic retinopathy? Ophthalmology. 1986;93(5):586–9. Available at: http://www.ncbi.nlm.nih.gov/pubmed/3725317. Accessed February 25, 2013.
16. Lieth E, Gardner TW, Barber AJ, Antonetti DA. Retinal neurodegeneration: early pathology in diabetes. Clin. Experiment. Ophthalmol. 2000;28(1):3–8. Available at: http://www.ncbi.nlm.nih.gov/pubmed/11345341. Accessed March 4, 2013.
17. Kempen JH, O’Colmain BJ, Leske MC, et al. The prevalence of diabetic retinopathy among adults in the United States. Arch. Ophthalmol. 2004;122(4):552–63. Available at: http://www.ncbi.nlm.nih.gov/pubmed/15078674. Accessed August 9, 2012.
18. Klein R, Palta M, Allen C, Shen G, Han DP, D’Alessio DJ. Incidence of retinopathy and associated risk factors from time of diagnosis of insulin-dependent diabetes. Arch. Ophthalmol. 1997;115(3):351–6. Available at: http://www.ncbi.nlm.nih.gov/pubmed/9076207. Accessed January 28, 2013.
19. Standards of medical care in diabetes--2012. Diabetes Care. 2012;35 Suppl 1:S11–63. Available at: http://www.ncbi.nlm.nih.gov/pubmed/22187469. Accessed February 27, 2013.

32
20. Ding J, Wong TY. Current epidemiology of diabetic retinopathy and diabetic macular edema. Curr. Diab. Rep. 2012;12(4):346–54. Available at: http://www.ncbi.nlm.nih.gov/pubmed/22585044. Accessed August 1, 2012.
21. Yau JWY, Rogers SL, Kawasaki R, et al. Global prevalence and major risk factors of diabetic retinopathy. Diabetes Care. 2012;35(3):556–64. Available at: http://www.ncbi.nlm.nih.gov/pubmed/22301125. Accessed August 20, 2012.
22. Williams R, Airey M, Baxter H, Forrester J, Kennedy-Martin T, Girach A. Epidemiology of diabetic retinopathy and macular oedema: a systematic review. Eye (Lond). 2004;18(10):963–83. Available at: http://www.ncbi.nlm.nih.gov/pubmed/15232600. Accessed July 30, 2012.
23. Tapp RJ, Shaw JE, Harper CA, et al. The prevalence of and factors associated with diabetic retinopathy in the Australian population. Diabetes Care. 2003;26(6):1731–7. Available at: http://www.ncbi.nlm.nih.gov/pubmed/12766102. Accessed September 4, 2012.
24. Zhang X, Saaddine JB, Chou C-F, et al. Prevalence of diabetic retinopathy in the United States, 2005-2008. JAMA. 2010;304(6):649–56. Available at: http://www.pubmedcentral.nih.gov/articlerender.fcgi?artid=2945293&tool=pmcentrez&rendertype=abstract. Accessed September 4, 2012.
25. Liang YB, Friedman DS, Wong TY, et al. Prevalence and causes of low vision and blindness in a rural chinese adult population: the Handan Eye Study. Ophthalmology. 2008;115(11):1965–72. Available at: http://www.ncbi.nlm.nih.gov/pubmed/18684506. Accessed January 14, 2013.
26. Ross SA, McKenna A, Mozejko S, Fick GH. Diabetic retinopathy in native and nonnative Canadians. Exp. Diabetes Res. 2007;2007:76271. Available at: http://www.pubmedcentral.nih.gov/articlerender.fcgi?artid=2248248&tool=pmcentrez&rendertype=abstract. Accessed August 22, 2012.
27. Nathoo N, Ng M, Rudnisky CJ, Tennant MTS. The prevalence of diabetic retinopathy as identified by teleophthalmology in rural Alberta. Can. J. Ophthalmol. 2010;45(1):28–32. Available at: http://www.ncbi.nlm.nih.gov/pubmed/20130706. Accessed January 10, 2013.
28. Nathoo N, Ng M, Rudnisky CJ, Tennant MTS. The prevalence of diabetic retinopathy as identified by teleophthalmology in rural Alberta. Can. J. Ophthalmol. 2010;45(1):28–32. Available at: http://www.ncbi.nlm.nih.gov/pubmed/20130706. Accessed January 10, 2013.
29. Bruce SG. The impact of diabetes mellitus among the Métis of western Canada. Ethn. Health. 2000;5(1):47–57. Available at: http://www.ncbi.nlm.nih.gov/pubmed/10858939. Accessed January 12, 2013.

33
30. Macaulay AC, Montour LT, Adelson N. Prevalence of diabetic and atherosclerotic complications among Mohawk Indians of Kahnawake, PQ. CMAJ. 1988;139(3):221–4. Available at: http://www.pubmedcentral.nih.gov/articlerender.fcgi?artid=1268066&tool=pmcentrez&rendertype=abstract. Accessed January 12, 2013.
31. Klein BEK. Overview of epidemiologic studies of diabetic retinopathy. Ophthalmic Epidemiol. 14(4):179–83. Available at: http://www.ncbi.nlm.nih.gov/pubmed/17896294. Accessed January 13, 2013.
32. Klein R, Davis MD, Moss SE, Klein BE, DeMets DL. The Wisconsin Epidemiologic Study of Diabetic Retinopathy. A comparison of retinopathy in younger and older onset diabetic persons. Adv. Exp. Med. Biol. 1985;189:321–35. Available at: http://www.ncbi.nlm.nih.gov/pubmed/4036719. Accessed January 14, 2013.
33. Klein R, Klein BE, Moss SE, Cruickshanks KJ. The Wisconsin Epidemiologic Study of diabetic retinopathy. XIV. Ten-year incidence and progression of diabetic retinopathy. Arch. Ophthalmol. 1994;112(9):1217–28. Available at: http://www.ncbi.nlm.nih.gov/pubmed/7619101. Accessed January 14, 2013.
34. Klein R, Knudtson MD, Lee KE, Gangnon R, Klein BEK. The Wisconsin Epidemiologic Study of Diabetic Retinopathy: XXII the twenty-five-year progression of retinopathy in persons with type 1 diabetes. Ophthalmology. 2008;115(11):1859–68. Available at: http://www.pubmedcentral.nih.gov/articlerender.fcgi?artid=2761813&tool=pmcentrez&rendertype=abstract. Accessed January 14, 2013.
35. Jones CD, Greenwood RH, Misra A, Bachmann MO. Incidence and progression of diabetic retinopathy during 17 years of a population-based screening program in England. Diabetes Care. 2012;35(3):592–6. Available at: http://www.ncbi.nlm.nih.gov/pubmed/22279031. Accessed January 15, 2013.
36. Wong TY, Mwamburi M, Klein R, et al. Rates of progression in diabetic retinopathy during different time periods: a systematic review and meta-analysis. Diabetes Care. 2009;32(12):2307–13. Available at: http://www.pubmedcentral.nih.gov/articlerender.fcgi?artid=2782996&tool=pmcentrez&rendertype=abstract. Accessed January 15, 2013.
37. Zheng Y, He M, Congdon N. The worldwide epidemic of diabetic retinopathy. Indian J. Ophthalmol. 60(5):428–31. Available at: http://www.pubmedcentral.nih.gov/articlerender.fcgi?artid=3491270&tool=pmcentrez&rendertype=abstract. Accessed January 10, 2013.
38. Martin T. Going blind on our watch. Health Aff. (Millwood). 25(4):1121–6. Available at: http://www.ncbi.nlm.nih.gov/pubmed/16835194. Accessed January 22, 2013.

34
39. Bloomgarden ZT. Screening for and managing diabetic retinopathy: current approaches. Am. J. Health. Syst. Pharm. 2007;64(17 Suppl 12):S8–14. Available at: http://www.ncbi.nlm.nih.gov/pubmed/17720893. Accessed January 22, 2013.
40. Klein R, Klein BEK. Are individuals with diabetes seeing better?: a long-term epidemiological perspective. Diabetes. 2010;59(8):1853–60. Available at: http://www.pubmedcentral.nih.gov/articlerender.fcgi?artid=2911057&tool=pmcentrez&rendertype=abstract. Accessed August 8, 2012.
41. Klein R, Klein BE, Moss SE. How many steps of progression of diabetic retinopathy are meaningful? The Wisconsin epidemiologic study of diabetic retinopathy. Arch. Ophthalmol. 2001;119(4):547–553. Available at: http://ovidsp.ovid.com/ovidweb.cgi?T=JS&PAGE=reference&D=med4&NEWS=N&AN=11296020.
42. Wang JJ, Mitchell P, Smith W, Cumming RG, Attebo K. Impact of visual impairment on use of community support services by elderly persons: the Blue Mountains Eye Study. Invest. Ophthalmol. Vis. Sci. 1999;40(1):12–9. Available at: http://www.ncbi.nlm.nih.gov/pubmed/9888421. Accessed July 14, 2013.
43. AT B, Munoz B, Rodriguez J, et al. The impact of visual impairment and eye disease on vision-related quality of life in a Mexican-American population: Proyecto VER. Invest. Ophthalmol. Vis. Sci. 2002;(11):3393–3398.
44. Henricsson M, Tyrberg M, Heijl A, Janzon L. Incidence of blindness and visual impairment in diabetic patients participating in an ophthalmological control and screening programme. Acta Ophthalmol. Scand. 2009;74(6):533–538. Available at: http://doi.wiley.com/10.1111/j.1600-0420.1996.tb00729.x. Accessed September 6, 2012.
45. Klein R, Lee KE, Knudtson MD, Gangnon RE, Klein BEK. Changes in visual impairment prevalence by period of diagnosis of diabetes: the Wisconsin Epidemiologic Study of Diabetic Retinopathy. Ophthalmology. 2009;116(10):1937–42. Available at: http://www.pubmedcentral.nih.gov/articlerender.fcgi?artid=2757451&tool=pmcentrez&rendertype=abstract. Accessed November 20, 2012.
46. The effect of intensive treatment of diabetes on the development and progression of long-term complications in insulin-dependent diabetes mellitus. The Diabetes Control and Complications Trial Research Group. N. Engl. J. Med. 1993;329(14):977–86. Available at: http://www.ncbi.nlm.nih.gov/pubmed/8366922. Accessed January 28, 2013.
47. Kohner EM, Aldington SJ, Stratton IM, et al. United Kingdom Prospective Diabetes Study, 30: diabetic retinopathy at diagnosis of non-insulin-dependent diabetes mellitus and associated risk factors. Arch. Ophthalmol. 1998;116(3):297–

35
303. Available at: http://www.ncbi.nlm.nih.gov/pubmed/9514482. Accessed January 28, 2013.
48. Klein R, Klein BE, Moss SE, Cruickshanks KJ. Relationship of hyperglycemia to the long-term incidence and progression of diabetic retinopathy. Arch. Intern. Med. 1994;154(19):2169–78. Available at: http://www.ncbi.nlm.nih.gov/pubmed/7944837. Accessed January 28, 2013.
49. The absence of a glycemic threshold for the development of long-term complications: the perspective of the Diabetes Control and Complications Trial. Diabetes. 1996;45(10):1289–98. Available at: http://www.ncbi.nlm.nih.gov/pubmed/8826962. Accessed January 29, 2013.
50. The relationship of glycemic exposure (HbA1c) to the risk of development and progression of retinopathy in the diabetes control and complications trial. Diabetes. 1995;44(8):968–83. Available at: http://www.ncbi.nlm.nih.gov/pubmed/7622004. Accessed January 29, 2013.
51. Holman RR, Paul SK, Bethel MA, Matthews DR, Neil HAW. 10-year follow-up of intensive glucose control in type 2 diabetes. N. Engl. J. Med. 2008;359(15):1577–89. Available at: http://www.ncbi.nlm.nih.gov/pubmed/18784090. Accessed January 29, 2013.
52. Intensive blood-glucose control with sulphonylureas or insulin compared with conventional treatment and risk of complications in patients with type 2 diabetes (UKPDS 33). UK Prospective Diabetes Study (UKPDS) Group. Lancet. 1998;352(9131):837–53. Available at: http://www.ncbi.nlm.nih.gov/pubmed/9742976. Accessed January 29, 2013.
53. Patel V, Rassam S, Newsom R, Wiek J, Kohner E. Retinal blood flow in diabetic retinopathy. BMJ. 1992;305(6855):678–83. Available at: http://www.pubmedcentral.nih.gov/articlerender.fcgi?artid=1882919&tool=pmcentrez&rendertype=abstract. Accessed January 29, 2013.
54. Tight blood pressure control and risk of macrovascular and microvascular complications in type 2 diabetes: UKPDS 38. UK Prospective Diabetes Study Group. BMJ. 1998;317(7160):703–13. Available at: http://www.pubmedcentral.nih.gov/articlerender.fcgi?artid=28659&tool=pmcentrez&rendertype=abstract. Accessed January 29, 2013.
55. Davis MD, Fisher MR, Gangnon RE, et al. Risk factors for high-risk proliferative diabetic retinopathy and severe visual loss: Early Treatment Diabetic Retinopathy Study Report #18. Invest. Ophthalmol. Vis. Sci. 1998;39(2):233–52. Available at: http://www.ncbi.nlm.nih.gov/pubmed/9477980. Accessed December 1, 2012.
56. Retinopathy and nephropathy in patients with type 1 diabetes four years after a trial of intensive therapy. The Diabetes Control and Complications Trial/Epidemiology of Diabetes Interventions and Complications Research Group. N.

36
Engl. J. Med. 2000;342(6):381–9. Available at: http://www.pubmedcentral.nih.gov/articlerender.fcgi?artid=2630213&tool=pmcentrez&rendertype=abstract. Accessed February 1, 2013.
57. Lyons TJ, Jenkins AJ, Zheng D, et al. Diabetic retinopathy and serum lipoprotein subclasses in the DCCT/EDIC cohort. Invest. Ophthalmol. Vis. Sci. 2004;45(3):910–8. Available at: http://www.ncbi.nlm.nih.gov/pubmed/14985310. Accessed February 3, 2013.
58. Chew EY, Klein ML, Ferris FL, et al. Association of elevated serum lipid levels with retinal hard exudate in diabetic retinopathy. Early Treatment Diabetic Retinopathy Study (ETDRS) Report 22. Arch. Ophthalmol. 1996;114(9):1079–84. Available at: http://www.ncbi.nlm.nih.gov/pubmed/8790092. Accessed February 3, 2013.
59. Sjølie AK, Stephenson J, Aldington S, et al. Retinopathy and vision loss in insulin-dependent diabetes in Europe. The EURODIAB IDDM Complications Study. Ophthalmology. 1997;104(2):252–60. Available at: http://www.ncbi.nlm.nih.gov/pubmed/9052629. Accessed February 3, 2013.
60. Zhang L, Krzentowski G, Albert A, Lefebvre PJ. Risk of developing retinopathy in Diabetes Control and Complications Trial type 1 diabetic patients with good or poor metabolic control. Diabetes Care. 2001;24(7):1275–9. Available at: http://www.ncbi.nlm.nih.gov/pubmed/11423515. Accessed February 3, 2013.
61. Dirani M, Xie J, Fenwick E, et al. Are obesity and anthropometry risk factors for diabetic retinopathy? The diabetes management project. Invest. Ophthalmol. Vis. Sci. 2011;52(7):4416–21. Available at: http://www.ncbi.nlm.nih.gov/pubmed/21482643. Accessed February 3, 2013.
62. Cheung N, Wong TY. Obesity and eye diseases. Surv. Ophthalmol. 52(2):180–95. Available at: http://www.pubmedcentral.nih.gov/articlerender.fcgi?artid=2698026&tool=pmcentrez&rendertype=abstract. Accessed February 3, 2013.
63. Nguyen TT, Alibrahim E, Islam FMA, et al. Inflammatory, hemostatic, and other novel biomarkers for diabetic retinopathy: the multi-ethnic study of atherosclerosis. Diabetes Care. 2009;32(9):1704–9. Available at: http://www.pubmedcentral.nih.gov/articlerender.fcgi?artid=2732144&tool=pmcentrez&rendertype=abstract. Accessed February 3, 2013.
64. Varma R, Choudhury F, Klein R, Chung J, Torres M, Azen SP. Four-year incidence and progression of diabetic retinopathy and macular edema: the Los Angeles Latino Eye Study. Am. J. Ophthalmol. 2010;149(5):752–61.e1–3. Available at: http://www.pubmedcentral.nih.gov/articlerender.fcgi?artid=2905589&tool=pmcentrez&rendertype=abstract. Accessed January 13, 2013.

37
65. Moss SE, Klein R, Klein BE. The 14-year incidence of visual loss in a diabetic population. Ophthalmology. 1998;105(6):998–1003. Available at: http://dx.doi.org/10.1016/S0161-6420(98)96025-0. Accessed August 9, 2012.
66. Harris MI, Klein R, Cowie CC, Rowland M, Byrd-Holt DD. Is the risk of diabetic retinopathy greater in non-Hispanic blacks and Mexican Americans than in non-Hispanic whites with type 2 diabetes? A U.S. population study. Diabetes Care. 1998;21(8):1230–1235. Available at: http://care.diabetesjournals.org/cgi/doi/10.2337/diacare.21.8.1230. Accessed January 22, 2013.
67. Liew G, Klein R, Wong TY. The role of genetics in susceptibility to diabetic retinopathy. Int. Ophthalmol. Clin. 2009;49(2):35–52. Available at: http://www.pubmedcentral.nih.gov/articlerender.fcgi?artid=2746819&tool=pmcentrez&rendertype=abstract. Accessed February 4, 2013.
68. Wong TY, Klein R, Islam FMA, et al. Diabetic retinopathy in a multi-ethnic cohort in the United States. Am. J. Ophthalmol. 2006;141(3):446–455. Available at: http://www.pubmedcentral.nih.gov/articlerender.fcgi?artid=2246042&tool=pmcentrez&rendertype=abstract. Accessed February 4, 2013.
69. Clustering of long-term complications in families with diabetes in the diabetes control and complications trial. The Diabetes Control and Complications Trial Research Group. Diabetes. 1997;46(11):1829–39. Available at: http://www.ncbi.nlm.nih.gov/pubmed/9356033. Accessed February 4, 2013.
70. Little HL. The role of abnormal hemorrheodynamics in the pathogenesis of diabetic retinopathy. Trans. Am. Ophthalmol. Soc. 1976;74:573–636. Available at: http://www.pubmedcentral.nih.gov/articlerender.fcgi?artid=1311529&tool=pmcentrez&rendertype=abstract. Accessed February 5, 2013.
71. Klein BE, Moss SE, Klein R. Is menarche associated with diabetic retinopathy? Diabetes Care. 1990;13(10):1034–1038. Available at: http://care.diabetesjournals.org/cgi/doi/10.2337/diacare.13.10.1034. Accessed February 5, 2013.
72. Donaghue KC, Fairchild JM, Craig ME, et al. Do all prepubertal years of diabetes duration contribute equally to diabetes complications? Diabetes Care. 2003;26(4):1224–9. Available at: http://www.ncbi.nlm.nih.gov/pubmed/12663601. Accessed February 5, 2013.
73. Olsen BS, Sjølie AK, Hougaard P, et al. The significance of the prepubertal diabetes duration for the development of retinopathy and nephropathy in patients with type 1 diabetes. J. Diabetes Complications. 18(3):160–4. Available at: http://www.ncbi.nlm.nih.gov/pubmed/15145327. Accessed February 5, 2013.

38
74. Sheth BP. Does pregnancy accelerate the rate of progression of diabetic retinopathy?: an update. Curr. Diab. Rep. 2008;8(4):270–3. Available at: http://www.ncbi.nlm.nih.gov/pubmed/18631438. Accessed February 5, 2013.
75. Vestgaard M, Ringholm L, Laugesen CS, Rasmussen KL, Damm P, Mathiesen ER. Pregnancy-induced sight-threatening diabetic retinopathy in women with Type 1 diabetes. Diabet. Med. 2010;27(4):431–5. Available at: http://www.ncbi.nlm.nih.gov/pubmed/20536515. Accessed February 5, 2013.
76. Effect of pregnancy on microvascular complications in the diabetes control and complications trial. The Diabetes Control and Complications Trial Research Group. Diabetes Care. 2000;23(8):1084–1091. Available at: http://care.diabetesjournals.org/cgi/doi/10.2337/diacare.23.8.1084. Accessed February 5, 2013.
77. Axer-Siegel R, Hod M, Fink-Cohen S, et al. Diabetic retinopathy during pregnancy. Ophthalmology. 1996;103(11):1815–9. Available at: http://www.ncbi.nlm.nih.gov/pubmed/8942876. Accessed February 5, 2013.
78. Hooper P, Boucher MC, Cruess A, et al. Canadian Ophthalmological Society Evidence-based Clinical Practice Guidelines for the Management of Diabetic Retinopathy - executive summary. Can. J. Ophthalmol. 2012;47(2):91–6. Available at: http://www.ncbi.nlm.nih.gov/pubmed/22560411. Accessed June 16, 2012.
79. Williams GA, Scott IU, Haller JA, Maguire AM, Marcus D, McDonald HR. Single-field fundus photography for diabetic retinopathy screening: a report by the American Academy of Ophthalmology. Ophthalmology. 2004;111(5):1055–62. Available at: http://www.ncbi.nlm.nih.gov/pubmed/15121388. Accessed January 19, 2013.
80. British Diabetic Association. Retinal photographic screening for diabetic eye disease. A British Diabetic Association Report. London; 1997.
81. Hutchinson A, McIntosh A, Peters J, et al. Effectiveness of screening and monitoring tests for diabetic retinopathy - a systematic review. Diabet. Med. 2000;17(7):495–506. Available at: http://doi.wiley.com/10.1046/j.1464-5491.2000.00250.x. Accessed July 29, 2012.
82. Buxton MJ, Sculpher MJ, Ferguson BA, et al. Screening for treatable diabetic retinopathy: a comparison of different methods. Diabet. Med. 1991;8(4):371–7. Available at: http://www.ncbi.nlm.nih.gov/pubmed/1830260. Accessed April 15, 2013.
83. Gibbins RL, Owens DR, Allen JC, Eastman L. Practical application of the European Field Guide in screening for diabetic retinopathy by using ophthalmoscopy and 35 mm retinal slides. Diabetologia. 1998;41(1):59–64. Available at: http://www.ncbi.nlm.nih.gov/pubmed/9498631. Accessed February 14, 2013.

39
84. O’Hare JP, Hopper A, Madhaven C, et al. Adding retinal photography to screening for diabetic retinopathy: a prospective study in primary care. BMJ. 1996;312(7032):679–82. Available at: http://www.pubmedcentral.nih.gov/articlerender.fcgi?artid=2350501&tool=pmcentrez&rendertype=abstract. Accessed April 15, 2013.
85. Harding SP, Broadbent DM, Neoh C, White MC, Vora J. Sensitivity and specificity of photography and direct ophthalmoscopy in screening for sight threatening eye disease: the Liverpool Diabetic Eye Study. BMJ. 1995;311(7013):1131–5. Available at: http://www.pubmedcentral.nih.gov/articlerender.fcgi?artid=2551056&tool=pmcentrez&rendertype=abstract. Accessed August 20, 2012.
86. Wilson JM, Jungner YG. [Principles and practice of mass screening for disease]. Bol. Oficina Sanit. Panam. 1968;65(4):281–393. Available at: http://www.ncbi.nlm.nih.gov/pubmed/4234760. Accessed April 8, 2013.
87. Zimmer-Galler IE, Zeimer R. Telemedicine in diabetic retinopathy screening. Int. Ophthalmol. Clin. 2009;49(2):75–86. Available at: http://www.ncbi.nlm.nih.gov/pubmed/19349788. Accessed July 30, 2012.
88. Grading diabetic retinopathy from stereoscopic color fundus photographs--an extension of the modified Airlie House classification. ETDRS report number 10. Early Treatment Diabetic Retinopathy Study Research Group. Ophthalmology. 1991;98(5 Suppl):786–806. Available at: http://www.ncbi.nlm.nih.gov/pubmed/2062513. Accessed March 17, 2013.
89. Early worsening of diabetic retinopathy in the Diabetes Control and Complications Trial. Arch. Ophthalmol. 1998;116(7):874–86. Available at: http://www.ncbi.nlm.nih.gov/pubmed/9682700. Accessed January 29, 2013.
90. Photocoagulation treatment of proliferative diabetic retinopathy. Clinical application of Diabetic Retinopathy Study (DRS) findings, DRS Report Number 8. The Diabetic Retinopathy Study Research Group. Ophthalmology. 1981;88(7):583–600. Available at: http://www.ncbi.nlm.nih.gov/pubmed/7196564. Accessed April 8, 2013.
91. Photocoagulation for diabetic macular edema. Early Treatment Diabetic Retinopathy Study report number 1. Early Treatment Diabetic Retinopathy Study research group. Arch. Ophthalmol. 1985;103(12):1796–806. Available at: http://www.ncbi.nlm.nih.gov/pubmed/2866759. Accessed April 8, 2013.
92. Boscia F. Current approaches to the management of diabetic retinopathy and diabetic macular oedema. Drugs. 2010;70(16):2171–200. Available at: http://www.ncbi.nlm.nih.gov/pubmed/20964459. Accessed July 15, 2013.
93. Elman MJ, Aiello LP, Beck RW, et al. Randomized trial evaluating ranibizumab plus prompt or deferred laser or triamcinolone plus prompt laser for diabetic macular edema. Ophthalmology. 2010;117(6):1064–1077.e35. Available at:

40
http://www.pubmedcentral.nih.gov/articlerender.fcgi?artid=2937272&tool=pmcentrez&rendertype=abstract. Accessed July 15, 2013.
94. Javitt JC, Aiello LP. Cost-effectiveness of detecting and treating diabetic retinopathy. Ann. Intern. Med. 1996;124(1 Pt 2):164–9. Available at: http://www.ncbi.nlm.nih.gov/pubmed/8554212. Accessed May 29, 2012.
95. Javitt JC. Cost savings associated with detection and treatment of diabetic eye disease. Pharmacoeconomics. 1995;8 Suppl 1:33–9. Available at: http://www.ncbi.nlm.nih.gov/pubmed/10159001. Accessed April 8, 2013.
96. Gillow JT, Gray JA. The National Screening Committee review of diabetic retinopathy screening. Eye (Lond). 2001;15(Pt 1):1–2. Available at: http://www.ncbi.nlm.nih.gov/pubmed/11318268. Accessed March 31, 2013.
97. American Academy of Ophthalmology. Diabetic Retinopathy Preferred Practice Pattern Guidelines. San Francisco, CA; 2008:39. Available at: http://one.aao.org/CE/PracticeGuidelines/PPP_Content.aspx?cid=d0c853d3-219f-487b-a524-326ab3cecd9a.
98. Moss SE, Klein R, Klein BE. Factors associated with having eye examinations in persons with diabetes. Arch. Fam. Med. 1995;4(6):529–34. Available at: http://www.ncbi.nlm.nih.gov/pubmed/7773429. Accessed April 9, 2013.
99. Brechner RJ, Cowie CC, Howie LJ, Herman WH, Will JC, Harris MI. Ophthalmic examination among adults with diagnosed diabetes mellitus. JAMA. 1993;270(14):1714–8. Available at: http://www.ncbi.nlm.nih.gov/pubmed/8411502. Accessed April 9, 2013.
100. Will JC, German RR, Schuman E, Michael S, Kurth DM, Deeb L. Patient adherence to guidelines for diabetes eye care: results from the diabetic eye disease follow-up study. Am. J. Public Health. 1994;84(10):1669–71. Available at: http://www.pubmedcentral.nih.gov/articlerender.fcgi?artid=1615103&tool=pmcentrez&rendertype=abstract. Accessed April 9, 2013.
101. Schoenfeld ER, Greene JM, Wu SY, Leske MC. Patterns of adherence to diabetes vision care guidelines. Ophthalmology. 2001;108(3):563–571. Available at: http://linkinghub.elsevier.com/retrieve/pii/S016164200000600X. Accessed February 20, 2013.
102. Van Eijk KND, Blom JW, Gussekloo J, Polak BCP, Groeneveld Y. Diabetic retinopathy screening in patients with diabetes mellitus in primary care: Incentives and barriers to screening attendance. Diabetes Res. Clin. Pract. 2012;96(1):10–6. Available at: http://www.ncbi.nlm.nih.gov/pubmed/22137363. Accessed April 9, 2013.

41
103. Zhang X, Norris SL, Saadine J, et al. Effectiveness of interventions to promote screening for diabetic retinopathy. Am. J. Prev. Med. 2007;33(4):318–35. Available at: http://www.ncbi.nlm.nih.gov/pubmed/17888859. Accessed April 9, 2013.
104. Klein R, Klein BE, Magli YL, et al. An alternative method of grading diabetic retinopathy. Ophthalmology. 1986;93(9):1183–7. Available at: http://www.ncbi.nlm.nih.gov/pubmed/3101021. Accessed March 17, 2013.
105. Aldington SJ, Kohner EM, Meuer S, Klein R, Sjølie AK. Methodology for retinal photography and assessment of diabetic retinopathy: the EURODIAB IDDM complications study. Diabetologia. 1995;38(4):437–44. Available at: http://www.ncbi.nlm.nih.gov/pubmed/7796984. Accessed March 17, 2013.
106. Aiello LM. Perspectives on diabetic retinopathy. Am. J. Ophthalmol. 2003;136(1):122–35. Available at: http://www.ncbi.nlm.nih.gov/pubmed/12834680. Accessed January 22, 2013.
107. Jehanara A, P WT, Sven-Eric B, M AL, D CJ, A VR. The sensitivity and specificity of nonmydriatic digital stereoscopic retinal imaging in detecting diabetic retinopathy. Diabetes Care. 2006;29(10):2205–2209. Available at: http://ovidsp.ovid.com/ovidweb.cgi?T=JS&PAGE=reference&D=med4&NEWS=N&AN=17003294.
108. MTS T, MDJ G, CJ R, TR H, BJ H. Identification of diabetic retinopathy by stereoscopic digital imaging via teleophthalmology: a comparison to slide film. Can. J. Ophthalmol. Can. D Ophtalmol. 2001;(4):187–196.
109. Lecleire-Collet A, Erginay A, Gaudric A, Brasseur G, Massin P. Assessment of a diabetic retinopathy grading system designed for a method of screening using three color fundus photographs. Iovs. 2005;(Suppl. S):375.
110. Gangnon RE, Davis MD, Hubbard LD, et al. A severity scale for diabetic macular edema developed from ETDRS data. Invest. Ophthalmol. Vis. Sci. 2008;49(11):5041–5047. Available at: http://ovidsp.ovid.com/ovidweb.cgi?T=JS&PAGE=reference&D=emed8&NEWS=N&AN=18539929.
111. Fong DS, Aiello L, Gardner TW, et al. Retinopathy in Diabetes. Diabetes Care. 2004;27(90001):84S–87. Available at: http://care.diabetesjournals.org/cgi/doi/10.2337/diacare.27.2007.S84. Accessed August 9, 2012.
112. Pareja-Ríos A, Serrano-García MA, Marrero-Saavedra MD, et al. [Guidelines of clinical practice of the SERV (Spanish Retina and Vitreous Society): management of ocular complications of diabetes. Diabetic retinopathy and macular oedema]. Arch. Soc. Esp. Oftalmol. 2009;84(9):429–50. Available at: http://www.ncbi.nlm.nih.gov/pubmed/19809923. Accessed March 18, 2013.

42
113. Preliminary report on effects of photocoagulation therapy. The Diabetic Retinopathy Study Research Group. Am. J. Ophthalmol. 1976;81(4):383–96. Available at: http://www.ncbi.nlm.nih.gov/pubmed/944535. Accessed March 7, 2013.
114. E Z-GI, Ran Z. Telemedicine in diabetic retinopathy screening. Int. Ophthalmol. Clin. 2009;49(2):75–86. Available at: http://ovidsp.ovid.com/ovidweb.cgi?T=JS&PAGE=reference&D=medl&NEWS=N&AN=19349788.
115. Chew EY. Screening options for diabetic retinopathy. Curr. Opin. Ophthalmol. 2006;17(6):519–22. Available at: http://www.ncbi.nlm.nih.gov/pubmed/17065919. Accessed April 8, 2013.
116. Scanlon PH, Malhotra R, Greenwood RH, et al. Comparison of two reference standards in validating two field mydriatic digital photography as a method of screening for diabetic retinopathy. Br. J. Ophthalmol. 2003;87(10):1258–63. Available at: http://ovidsp.ovid.com/ovidweb.cgi?T=JS&PAGE=reference&D=med4&NEWS=N&AN=14507762. Accessed February 11, 2013.
117. Moss SE, Klein R, Kessler SD, Richie KA. Comparison between ophthalmoscopy and fundus photography in determining severity of diabetic retinopathy. Ophthalmology. 1985;92(1):62–7. Available at: http://www.ncbi.nlm.nih.gov/pubmed/2579361. Accessed April 10, 2013.
118. Emanuele N, Klein R, Moritz T, et al. Comparison of dilated fundus examinations with seven-field stereo fundus photographs in the Veterans Affairs Diabetes Trial. J. Diabetes Complications. 23(5):323–9. Available at: http://www.ncbi.nlm.nih.gov/pubmed/18406632. Accessed April 10, 2013.
119. Maberley D, Cruess AF, Barile G, et al. Digital photographic screening for diabetic retinopathy in the James Bay Cree. Ophthalmic Epidemiol. 2002;9(3):169–178. Available at: http://informahealthcare.com/doi/abs/10.1076/opep.9.3.169.1517. Accessed August 22, 2012.
120. Aptel F, Denis P, Rouberol F, Thivolet C. Screening of diabetic retinopathy: Effect of field number and mydriasis on sensitivity and specificity of digital fundus photography. Diabetes Metab. 2008;34(3):290–293. Available at: http://ovidsp.ovid.com/ovidweb.cgi?T=JS&PAGE=reference&D=emed8&NEWS=N&AN=2008397811.
121. Lamminen H, Voipio V, Ruohonen K, Uusitalo H. Telemedicine in ophthalmology. Acta Ophthalmol. Scand. 2003;81(2):105–109. Available at: http://www.blackwell-synergy.com/links/doi/10.1034/j.1600-0420.2003.00045.x. Accessed April 7, 2013.

43
122. Ronald K, K KBE. Screening for diabetic retinopathy, revisited. Am. J. Ophthalmol. 2002;134(2):261–263. Available at: http://ovidsp.ovid.com/ovidweb.cgi?T=JS&PAGE=reference&D=med4&NEWS=N&AN=12140033.
123. Maberley D, Cruess AF, Barile G, Slakter J. Digital photographic screening for diabetic retinopathy in the James Bay Cree. Ophthalmic Epidemiol. 2002;9(3):169–178. Available at: http://informahealthcare.com/doi/abs/10.1076/opep.9.3.169.1517. Accessed August 22, 2012.
124. Lopez-Bastida J, Cabrera-Lopez F, Serrano-Aguilar P. Sensitivity and specificity of digital retinal imaging for screening diabetic retinopathy. Diabet. Med. 2007;24(4):403–407. Available at: http://ovidsp.ovid.com/ovidweb.cgi?T=JS&PAGE=reference&D=med4&NEWS=N&AN=17298591.
125. Kirkpatrick JN, Scanlon P, Malhotra R, et al. Efficacy of Digital Diabetic Retinopathy Screening : A Population Based Survey. ARVO Annu. Meet. Abstr. Search Progr. Plan. 2002:4387.
126. Herbert HM, Jordan K, Flanagan DW. Is screening with digital imaging using one retinal view adequate? Eye. 2003;(4):497–500.
127. Peter B, L GR, Marisa C, et al. Screening for presence or absence of diabetic retinopathy: a meta-analysis. Arch. Ophthalmol. 2011;129(4):435–444. Available at: http://ovidsp.ovid.com/ovidweb.cgi?T=JS&PAGE=reference&D=medl&NEWS=N&AN=21149748. Accessed March 20, 2012.
128. Baeza M, Orozco-Beltrán D, VF G-G, et al. Screening for sight threatening diabetic retinopathy using non-mydriatic retinal camera in a primary care setting: to dilate or not to dilate? Int. J. Clin. Pract. 2009;63(3):433–438. Available at: http://search.ebscohost.com/login.aspx?direct=true&db=cin20&AN=2010191438&site=ehost-live.
129. Dervan EWJ, O’Brien PD, Hobbs H, Acheson R, Flitcroft DI. Targeted mydriasis strategies for diabetic retinopathy screening clinics. Eye (Lond). 2010;24(7):1207–12. Available at: http://www.ncbi.nlm.nih.gov/pubmed/20139914. Accessed January 31, 2013.
130. Hildebrand PL. Discovering optimal telemedicine strategies for evaluating diabetic retinopathy. Am. J. Ophthalmol. 2005;140(4):703–704. Available at: http://ovidsp.ovid.com/ovidweb.cgi?T=JS&PAGE=reference&D=emed7&NEWS=N&AN=2005465170.
131. Gutierrez G. Medicare, the Internet, and the future of telemedicine. Crit. Care Med. 2001;29(8 Suppl):N144–50. Available at: http://www.ncbi.nlm.nih.gov/pubmed/11496036. Accessed April 28, 2013.
44
132. Bursell S-E, Brazionis L, Jenkins A. Telemedicine and ocular health in diabetes mellitus. Clin. Exp. Optom. 2012;95(3):311–27. Available at: http://www.ncbi.nlm.nih.gov/pubmed/22594547. Accessed March 18, 2013.
133. Li Z, Wu C, Olayiwola JN, Hilaire DS, Huang JJ. Telemedicine-based digital retinal imaging vs standard ophthalmologic evaluation for the assessment of diabetic retinopathy. Conn. Med. 2012;76(2):85–90. Available at: http://www.ncbi.nlm.nih.gov/pubmed/22670358. Accessed June 18, 2012.
134. Cavallerano J, Lawrence MG, Zimmer-Galler I, et al. Telehealth practice recommendations for diabetic retinopathy. Telemed. J. E. Health. 2004;10(4):469–82. Available at: http://www.ncbi.nlm.nih.gov/pubmed/15689653. Accessed April 29, 2013.
135. Li HK, Horton M, Bursell S-E, et al. Telehealth practice recommendations for diabetic retinopathy, second edition. Telemed. J. E. Health. 2011;17(10):814–37. Available at: http://www.ncbi.nlm.nih.gov/pubmed/21970573. Accessed June 16, 2012.
136. Pandit RJ, Taylor R. Mydriasis and glaucoma: exploding the myth. A systematic review. Diabet. Med. 2000;17(10):693–9. Available at: http://www.ncbi.nlm.nih.gov/pubmed/11110501. Accessed January 19, 2013.
137. Tang RA, Morales M, Ricur G, Schiffman JS. Telemedicine for eye care. J. Telemed. Telecare. 2005;11(8):391–6. Available at: http://www.ncbi.nlm.nih.gov/pubmed/16356312. Accessed April 7, 2013.
138. Li HK. Telemedicine and Ophthalmology. Surv. Ophthalmol. 1999;44(1):61–72. Available at: http://linkinghub.elsevier.com/retrieve/pii/S0039625799000594. Accessed April 7, 2013.
139. Peter B, L GR, Marisa C, et al. Screening for presence or absence of diabetic retinopathy: a meta-analysis. Arch. Ophthalmol. 2011;129(4):435–44. Available at: http://www.ncbi.nlm.nih.gov/pubmed/21149748. Accessed March 20, 2012.
140. E Z-GI, Ran Z, Zimmer-Galler IE, Zeimer R. Telemedicine in diabetic retinopathy screening. Int. Ophthalmol. Clin. 2009;49(2):75–86. Available at: http://www.ncbi.nlm.nih.gov/pubmed/19349788. Accessed July 30, 2012.
141. B MD, J PA, Ian M. Screening for diabetic retinopathy in remote Australia: a program description and evaluation of a devolved model. Aust. J. Rural Health. 2003;11(5):224–230. Available at: http://ovidsp.ovid.com/ovidweb.cgi?T=JS&PAGE=reference&D=med4&NEWS=N&AN=14641219.
142. Peto T, Tadros C. Screening for diabetic retinopathy and diabetic macular edema in the United Kingdom. Curr. Diab. Rep. 2012;12(4):338–45. Available at: http://www.ncbi.nlm.nih.gov/pubmed/22729994. Accessed March 18, 2013.

45
143. Sanchez CR, Silva PS, Cavallerano JD, Aiello LP, Aiello LM. Ocular telemedicine for diabetic retinopathy and the joslin vision network. Semin. Ophthalmol. 2010;25(5-6):218–224. Available at: http://ovidsp.ovid.com/ovidweb.cgi?T=JS&PAGE=reference&D=emed9&NEWS=N&AN=2010644206.
144. Perednia DA, Allen A. Telemedicine technology and clinical applications. JAMA. 1995;273(6):483–8. Available at: http://www.ncbi.nlm.nih.gov/pubmed/7837367. Accessed May 15, 2013.
145. Aoki N, Dunn K, Fukui T, Beck JR, Schull WJ, Li HK. Cost-effectiveness analysis of telemedicine to evaluate diabetic retinopathy in a prison population. Diabetes Care. 2004;27(5):1095–101. Available at: http://www.mrw.interscience.wiley.com/cochrane/cleed/articles/NHSEED-22004000677/frame.html. Accessed April 29, 2013.
146. Wilson C, Horton M, Cavallerano J, Aiello LM. Addition of Primary Care-Based Retinal Imaging Technology to an Existing Eye Care Professional Referral Program Increased the Rate of Surveillance and Treatment of Diabetic Retinopathy. Diabetes Care. 2005;28(2):318–322. Available at: http://care.diabetesjournals.org/cgi/doi/10.2337/diacare.28.2.318. Accessed May 29, 2012.
147. Boucher MC, Desroches G, Garcia-Salinas R, et al. Teleophthalmology screening for diabetic retinopathy through mobile imaging units within Canada. Can. J. Ophthalmol. 2008;43(6):658–68. Available at: http://www.ncbi.nlm.nih.gov/pubmed/19020631. Accessed April 28, 2013.
148. Zimmer-Galler IE, Horton M. Telehealth methods for diabetic retinopathy and glaucoma: Clinical, Technical and business insights and strategies for sucessful tele-ophthalmology programs. In: Association for Research in Vision and Ophthalmology (ARVO) Education Course. Association for Research in Vision and Ophthalmology Inc.; 2013:1–117.
149. Bachmann M, Nelson S. Screening for diabetic retinopathy. A quantitative overview of the evidence, applied to the popuations of health authorities and boards. Bristol Univ. Healthc. Eval. unit. 1996:1–57.
150. Martin JD, Yidegiligne HM. The cost-effectiveness of a retinal photography screening program for preventing diabetic retinopathy in the First Nations diabetic population in British Columbia, Canada. Int. J. Circumpolar Health. 1998;57 Suppl 1:379–382. Available at: http://ovidsp.ovid.com/ovidweb.cgi?T=JS&PAGE=reference&D=med4&NEWS=N&AN=10093310.

46
151. Jones S, Edwards RT. Diabetic retinopathy screening: a systematic review of the economic evidence. Diabet. Med. 2010;27(3):249–56. Available at: http://www.ncbi.nlm.nih.gov/pubmed/20536486. Accessed May 11, 2012.
152. James M, Turner DA, Broadbent DM, Vora J, Harding SP. Cost effectiveness analysis of screening for sight threatening diabetic eye disease (Structured abstract). BMJ. 2000;320(7250):1627–1631. Available at: http://www.mrw.interscience.wiley.com/cochrane/cleed/articles/NHSEED-22000008197/frame.html.
153. Porta M, Rizzitiello A, Tomalino M, et al. Comparison of the cost-effectiveness of three approaches to screening for and treating sight-threatening diabetic retinopathy. Diabetes Metab. 1999;25(1):44–53. Available at: http://www.ncbi.nlm.nih.gov/pubmed/10335423. Accessed July 23, 2013.
154. James M, Turner DA, Broadbent DM, Vora J, Harding SP. Cost effectiveness analysis of screening for sight threatening diabetic eye disease. BMJ. 2000;320(7250):1627–31. Available at: http://www.pubmedcentral.nih.gov/articlerender.fcgi?artid=27406&tool=pmcentrez&rendertype=abstract. Accessed July 23, 2013.
155. Bjørvig S, Johansen MA, Fossen K. An economic analysis of screening for diabetic retinopathy. J. Telemed. Telecare. 2002;8(1):32–5. Available at: http://www.ncbi.nlm.nih.gov/pubmed/11809082. Accessed July 23, 2013.
156. Aoki N, Dunn K, Fukui T, Beck JR, Schull WJ, Li HK. Cost-effectiveness analysis of telemedicine to evaluate diabetic retinopathy in a prison population. Diabetes Care. 2004;27(5):1095–101. Available at: http://www.ncbi.nlm.nih.gov/pubmed/15111527. Accessed July 23, 2013.
157. Boucher MC, Desroches G, Garcia-Salinas R, et al. Teleophthalmology screening for diabetic retinopathy through mobile imaging units within Canada. Can. J. Ophthalmol. 2008;43(6):658–68.
158. Ng M, Nathoo N, Rudnisky CJ, Tennant MTS. Improving access to eye care: teleophthalmology in Alberta, Canada. J. Diabetes Sci. Technol. 2009;3(2):289–96. Available at: http://www.pubmedcentral.nih.gov/articlerender.fcgi?artid=2771508&tool=pmcentrez&rendertype=abstract. Accessed April 7, 2013.

47
Chapter 3 Estimating the diagnostic accuracy of tele-ophthalmology for diabetic retinopathy screening: A meta-
analysis
Co-authorship
Coronado AC, Singh H, Costella J, Malvankar-Mehta MS, Martin J, Xie B, Hodge WG

48
3.1 Introduction
Diabetic retinopathy (DR) occurs as a microvascular complication that affects the
blood vessels in the retina of diabetic patients, leading to a high risk of blindness if
left untreated.1 Although treatments for DR are effective, economic, and available
within the public health system, it remains the leading cause of legal and functional
blindness for working-age adults in industrialized nations, representing 4.8% of cases
of vision loss worldwide.2,3 Early detection by regular screening for DR is a key factor
for its timely treatment, helping to prevent blindness and other impaired visual
conditions in diabetic individuals.4 However, only 50% of patients with diabetes
mellitus (DM) follow the screening recommendations by the American Diabetes
Association.5
Within this context, tele-ophthalmology has emerged as a possible alternative that
facilitates compliance to evidence-based medicine, perhaps without geographic
constraints. It may improve consistency of healthcare in a cost-effective fashion.6–8
Tele-ophthalmology screening initiatives for DR have been tested and launched in
diverse settings as an attempt of providing specialized eye care to underserved
communities regardless geographic limitations, while also eliminating unnecessary
traveling for patients and specialists.9,10
Published studies have focused on the diagnostic accuracy of digital imaging
screening for DR in diverse settings for its use in store-and-forward tele-
ophthalmology strategies.9,11 A literature review reported that sensitivity and
specificity of telescreening for detecting DR has been consistently high, and
concluded that this model appeared to be a suitable test for DR assessment.12 Other
reviews have addressed the diagnostic accuracy of diverse screening methods for
DR, including digital camera, film camera, direct examination and polaroid camera
assessments.13,14 Nevertheless, evidence on diagnostic accuracy of DR screening
focused on tele-ophthalmology strategies has not been critically synthesized in a
systematic review or meta-analysis.
Likewise, research and validation studies have also explored the influence of tele-
ophthalmology components, namely, pharmacologic dilation, number of fields,

49
automated grading and image compression to assess their impact on screening
diagnostic accuracy.15–17 However, there has been much discussion about the most
effective method for detecting DR in the telemedicine context, since current
evidence on this topic is contradictory and sometimes inconclusive.18,19 Bringing
these studies together and synthesizing their results, will promote a better
understanding of their clinical usefulness and influence on the diagnostic
performance of tele-ophthalmology programs.
Furthermore, the choice of gold standard for tele-ophthalmology validation studies
has been a subject of debate among specialists,20 who claim that the current
recommendation (standard 7 field ETDRS photographs) is impractical in rural
settings.6,21 Given the current gaps in the literature and the need of evidence
synthesis on this field, the present meta-analysis seeks the following objectives: 1) to
systematically identify, review and quantitatively synthesize the evidence available
pertaining to the diagnostic accuracy of tele-ophthalmology strategies for DR
screening in adults as compared to reference standards, and 2) to explore screening
and design factors that influence the diagnostic accuracy of tele-ophthalmology
assessments, namely pharmacologic dilation, number of fields used, choice of
reference standard, type of diabetes and risk of patient selection bias. Hence, we
hypothesized that tele-ophthalmology programs meet the minimum effectiveness
requirements advised by the Canadian Ophthalmological Society (sensitivity over
80%, specificity between 90% and 95%).22
3.2 Methods
We conducted and reported this meta-analysis in compliance with the Meta-analysis
of Observational Studies (MOOSE) recommendations (Appendix A) and Preferred
Reporting Items for Systematic Reviews and Meta-analyses (PRISMA) guidelines
(Appendix B).
3.2.1 Literature search
A structured search was conducted among six different databases (Medline,
EMBASE, CINAHL, BIOSIS, Web of Science, Cochrane Library) from January 1998 to
June 2012 (last update on January 2013), without language restrictions. Free text key
50
words and medical subject headings were tailored to each of the electronic
databases, and included four main domains: diabetic retinopathy, diagnosis,
telemedicine and evaluation studies (see list of search terms for all databases in
Appendix C). A health information specialist (JC) contributed to the development of
the search strategy, in consultation with other team members including content
experts. Grey literature was addressed by manually searching electronic abstracts
and dissertations from The American Academy of Ophthalmology, the Association
for Research in Vision and Ophthalmology (ARVO) meetings. As a complementary
search, bibliographies of eligible studies and relevant systematic reviews retrieved in
the literature search were manually screened.23 All citations from each database
search were exported to the reference manager program EPPI version 4.3 (EPPI
Centre, Institute of Education, London, UK), for de-duplication and screening.
3.2.2 Eligibility criteria
Primary studies reporting sensitivity and specificity outcomes of a tele-
ophthalmology strategy for DR diagnosis were included; we focused on those studies
that explicitly reported sensitivity and specificity estimates for the detection of any
retinopathy and/or referable retinopathy amongst adult patients with type 1 or type
2 diabetes. In the present review, any approach that promoted the screening of DR
by store-and-forward transmission of digital images, with the patient and the
ophthalmologist being in different geographical settings was considered a tele-
ophthalmology strategy.6 The exclusion criteria were: (i) studies addressing pediatric
patients (< 18 years old), (ii) editorials, commentaries and opinion articles, (iii)
studies conducted in under-developed, developing or non-industrialized settings
(Latin America, Eastern Europe, Africa and most Asian countries), (iv) studies with a
reference standard different from 7 field ETDRS photographs or slit-lamp
biomicroscopy, v) studies with less than 20 fully-screened patients.
3.2.3 Article screening
The screening strategy involved a two-step process. First, titles and abstracts were
reviewed to identify potentially relevant articles. Next, full-text articles from
included citations were retrieved to closely assess inclusion and exclusion criteria.

51
Two reviewers (AC and HS) screened citations and full-text articles in an independent
fashion, and Cohen’s kappa coefficients were used to examine inter-rater
agreement. We interpreted kappa values as follows: 0.40 to 0.59 reflect fair
agreement, 0.60 to 0.74 reflect good agreement, and ≥0.75 reflect excellent
agreement.24,25 Discrepancies were reconciled by discussion and any remaining
disagreements were solved through consultation with an experienced
ophthalmologist (WH), who assessed study eligibility. Articles published in language
other than English were initially addressed by a translator (AC for Spanish articles,
WG for French articles and independent translator for German articles) who
examined the title and abstract and determined the study relevance based on first
level screening questions.
3.2.4 Data extraction and quality assessment
A data extraction form was created and piloted with a subset of eligible studies.
Based on the experience gained in the pilot study, the final version of the data
extraction form (see appendix D) was used to collect the following information:
Number of fully-screened patients; race or ethnicity; % type II diabetes; %
prevalence; duration of diabetes; visual acuity; reference standard used; grading
guideline used; cut-off criteria; index technology (i.e type of camera, resolution);
field positioning and number of fields; pupil dilation; stereopsis; % unreadable
images; screen display resolution; image compression. The main outcomes of
interest were sensitivity and specificity, and outcomes in the form of true positives
(TP), false positives (FP), true negatives (TN) and false negatives (FN) if available. In
cases where these values were not available, we derived the numbers from the
sample size, DR prevalence and reported sensitivity and specificity.26 Data was
extracted by one reviewer (AC) and relevant predictor and outcome variables
(sensitivity, specificity, prevalence and 2x2 tables, if available) were confirmed
independently by a second reviewer (HS). Finally, a 2x2 table was constructed based
on the data extracted from the studies, defining the patient as the unit of analysis.
Primary authors were contacted in cases where studies provided insufficient
information to reconstruct the 2x2 tables.

52
About half of the articles reported multiple results comparing different tele-
ophthalmology protocols (e.g. more than one estimate of diagnostic accuracy per
primary study). To avoid clustering effect,27 we used a hierarchical approach to
choose one comparison per study: (1) protocols using pharmacologic dilation and
two or more field images per eye (2) protocols without pharmacologic dilation with
two or more field images per eye (3) protocols with pharmacologic dilation and a
single field image per eye (4) protocols without pharmacologic dilation and a single
field image per eye.
Quality assessment was performed using the revised QUADAS2 (Quality Assessment
of Diagnostic Accuracy Studies) criteria, which was adapted specifically for this
review, as suggested by current guidelines (Appendix E).28 No attempt was made to
assign a score to the QUADAS2 items, as this tool is not intended to generate a
summary quality score.29,30 Instead, risk of bias of each study was assessed as high,
low or unclear across the four QUADAS2 domains (patient selection, administration
of the index test, reference standard and patient flow).
3.2.5 Data synthesis and statistical analysis
Categories for analysis
As planned in the study protocol, we stratified the data into two categories
according to cut-off criteria. Category 1 included studies that aimed to detect any
diabetic retinopathy (at least one microaneurysm observed); category 2 included
studies that aimed to detect referable retinopathy (defined differently across
studies). Accuracy estimated at multiple test cut-offs was available in many studies;
in these cases, studies contributed one set of data points per category.
Meta-analysis
A meta-analysis was conducted separately for each category using a hierarchical
bivariate random effects model, proposed by Reitsma et al.31 Instead of using the
diagnostic odds ratio, the bivariate approach uses sensitivity and specificity pairs as
the starting point of the analysis, preserving the two-dimensional nature of the
data.32 Besides accounting for heterogeneity beyond chance, the bivariate model has

53
the advantage of incorporating the negative correlation that may exist between
sensitivity and specificity, while accounting for variation within and between
studies.33,34 Summary sensitivity, specificity, positive/negative likelihood ratios
(LR+;LR -) and diagnostic odds ratio (DOR) were calculated for each category using
the bivariate method. Likelihood ratios are considered a useful measure for
clinicians. The LR- indicates how likely a negative test result is in a diseased person
compared to non-diseased person; conversely, LR+ estimates the frequency of a test
positive result in diseased compared to non-diseased individuals.35 The DOR is
calculated by LR+/LR- and it is interpreted as the odds of positivity in diseased versus
the odds of positivity in non-diseased. Values in DOR range from zero to infinity,
higher values indicate better discriminatory test performance.36
To graphically present the results, we plotted the hierarchical SROC (summary
receiver operating characteristic) graph for each category, which allows the
visualization of the test performance along different thresholds.37,38 This model
developed by Rutter and Gatsonis37 also accounts for variation within and between
studies, due to its hierarchical approach.39 Based on this model, we plotted the
individual and summary sensitivity and specificity pairs in an ROC graph where the y
axis indicates the index test’s sensitivity and the x axis equals 1-specificity. For
category 1 studies, we calculated the AUC (area under the curve) with the
corresponding 95% confidence region and 95% prediction region.40,41 If the AUC is
100% then the test discriminates perfectly between diseased and non-diseased
patients, whereas an AUC of 50% indicates poor diagnostic accuracy.42,43 Given that
category 2 studies use various thresholds of test positivity, the AUC was not
calculated.40
Heterogeneity
Initially, heterogeneity between studies was visually assessed through paired forest
plots. Cochran Q (X2 test) and I2 statistics were used to describe study dispersion
based on sensitivity and specificity estimates of included studies.44,45 Statistical
significance of Cochran Q test was assumed at a P value less than 0.10, due to the
power limitations of the test. I2 values of 25% 50% and 75% were considered of low,

54
moderate and high inconsistency, respectively.44 Hierarchical ROC curve was also
used to assess heterogeneity likely due to threshold effect. With the hierarchical
SROC plot we were able to assess the proportion of heterogeneity likely due to
threshold effect. A shoulder-like curve where studies are tangent to the ROC curve
indicates that the observed variability between studies may be due to a threshold
effect.46,47
Finally, potential sources of heterogeneity were explored using subgroup analysis.48
We defined a priori the following characteristics as potential relevant covariates:
Pharmacologic dilation (“yes/mixed” or “no”), number of fields captured per eye
(“single” or “multiple fields”), reference standard used (“7 field ETDRS photographs”
or “slit-lamp biomicroscopy”), type of diabetes (“type 1” or “type 2” diabetes) and
risk of patient selection bias according to QUADAS2 criteria (“uncertain/high risk” or
“low risk”).49 Due to the exploratory nature of covariate analysis and to the small
number of studies per covariate, a meta-regression was not undertaken for the
above mentioned covariates.50
As a way to evaluate the possible association of up-to-date technologies on the
diagnostic performance of tele-ophthalmology programs, we executed a random
effects meta-regression of the DOR as the outcome and year of publication as the
independent variable.51 Thus, we considered the year of publication as an indicator
of improvement in both digital photography technologies and learning experience
associated with tele-ophthalmology. We performed a t-test to assess the null
hypothesis of no effect of year of publication (i.e recent technologies) on the DOR.52
A P value <0.05 was considered statistically significant.
Sensitivity analysis and publication bias
We repeated the analysis including only studies that fully met QUADAS2 criteria in all
four domains (patient selection, administration of index test, reference standard and
patient flow). As a concern for publication bias, we performed a funnel plot based on
DOR of each study (in logarithm scale) and their respective standard error. Finally,
we tested for symmetry and small-study effect using a linear regression approach as

55
described by Egger et al.53–55 A P value less than 0.05 was considered statistically
significant for small study effect.56 This test was also used to numerically estimate
funnel plot asymmetry.
Statistical analysis was performed with Stata 12 (Stata Corp, Austin, TX USA). This
study was supported by a grant from the Ontario Innovation Fund. The founding
source had no role in the collection, analysis or interpretation of the data. Authors
have no industry funding source or industry conflict of interest to disclose.
3.3 Results
3.3.1 Search results and study characteristics
After removing duplicates, 1060 citations were initially screened from which 156
were shortlisted for full text assessment. A total of 22 articles met our criteria for
review;7,57–78 primary authors from two included studies74,77 were contacted for
further information from whom only one replied.74 Thus, one article was excluded
due to lack of sufficient information.77 Finally, one additional study was identified
through manual search of bibliographies of selected studies, for a total of 23
included studies for data collection and analysis. Inter-reviewer agreement for study
inclusion was excellent (Cohen’s k=0.83). The study identification and selection
process is described in Figure 3.1.
Characteristics of included studies are outlined in Table 3.1. The 23 studies included
a total of 5,541 fully screened patients, with a median study size of 149 (IQR 112).
Patients were mainly male (mean 54.2%), type II diabetic patients (mean 79%) of
median age 57 years (IQR 10.4 years). The median prevalence of any diabetic
retinopathy and referable retinopathy was 34.85% (IQR 15.2%), and 31% (IQR 41%)
respectively. The majority of tele-ophthalmologic protocols used a non-mydriatic
digital camera (69.6%), captured multiple field images per eye (52%) and used
pharmacologic mydriasis for pupil dilation (52%). Interestingly, only 44% of studies
used the recommended gold standard by the American Telehealth Association6 (7
field ETDRS photographs), whereas the remaining 56% used slit-lamp biomicroscopy
as the reference standard. Some studies evaluated the effectiveness of the tele-
ophthalmology program at different thresholds, with and without pharmacologic

56
dilation, and used different number of fields captured per eye, thus reporting
multiple diagnostic accuracy endpoints. The 23 final articles contributed to 31
sensitivity and specificity pairs in all.
3.3.2 Quality assessment
Studies varied in quality (Table 3.2, Figure 3.2). There were nine studies of low risk of
bias across all four domains of QUADAS2 criteria. Concerns about index technology
application were uniformly low for all studies in the quality assessment; similarly, all
studies adequately reported blinding of image readers. The two main issues arising
were related to the selection of patients and the analysis and/or interpretation
criteria of the index test. Patient selection was a concern in three studies,70,73,78
where patients were not enrolled on a consecutive or random basis. In addition,
three studies7,74,76 did not provide sufficient information to assess risk of patient
selection bias. Eight studies removed from the diagnostic accuracy analysis those
patients with uninterpretable results (ie. unreadable images), which may lead to
overoptimistic diagnostic accuracy outcomes.49 Similarly, some studies did not
report details about the data analysis, or whether they included or not the full
spectrum of patients.
Of note, less than 40% of included studies provided sufficient data about patient
race/ethnicity, visual acuity measures and image compression. Moreover, only 56%
of studies specified the type of diabetes. Thus, information regarding these
covariates was not summarized nor incorporated in the meta-analysis.
3.3.3 Meta-analysis
A wide range of results was observed among studies detecting any DR (category 1)
and referable DR (category 2). Figures 3.3 and 3.4 show individual accuracy
measures in a paired forest plot for each category. As anticipated in meta-analyses of
diagnostic accuracy studies,79 pooled results showed considerable heterogeneity
between included studies, which was statistically significant among both categories
(X2 P value <0.001). Inconsistency ranged from moderate to high, except for
sensitivity among studies detecting referable DR, where inconsistency was only
moderate (I2 71%; 95% CI: 57-86). The meta-analysis summary estimates were

57
obtained using the hierarchical bivariate approach, which is the recommended
method for synthesis of diagnostic accuracy studies in presence of significant
heterogeneity.80 However, summary estimates should still be cautiously interpreted
given the marked heterogeneity amongst studies.
Synthesis of results by category
Summary statistics (sensitivity, specificity, DOR, LR(+), LR(-)) and their corresponding
95% confidence intervals for both categories are outlined in Table 3.3.
Category 1. Detection of any DR
This category included all studies that aimed to detect any DR (at least one micro-
aneurysm or worse), which involved 16 studies for a total 3,167 fully screened
patients. After pooling the sensitivity and specificity of single studies using the
bivariate method, we obtained a combined sensitivity of 0.89 (95% CI: 0.81-0.93) and
combined specificity of 0.94 (95% CI: 0.89-0.96). As expected from pooling studies
with identical cut-off criteria, the proportion of heterogeneity likely due to threshold
effect was zero.
The accuracy of tele-ophthalmology for detecting any DR is graphically shown using
the hierarchical ROC curve that illustrates the summary point and the individual
study datapoints (Figure 3.5a). Using this approach, we found an AUC of 0.97 (95%
CI: 0.95-0.98) and a DOR of 113 (95% CI: 51-248). Although 60% of studies are
located towards the upper left of the graph indicating good test performance, the
presence of outliers influences the 95% prediction ellipse downwards.
Category 2. Detection of referable retinopathy
In this category, all studies that aimed to detect “referable DR” were included. Thus
we identified 15 studies, including 3,794 fully screened patients. The overall
sensitivity and specificity was 0.91 (95% CI: 0.87-0.94) and 0.92 (95% CI: 0.88-0.95),
respectively. According to the hierarchical bivariate model analysis, the proportion of
heterogeneity likely due to threshold effect was 0.13. However, this category
incorporates different thresholds which challenge the interpretation of a single

58
paired estimate provided by the bivariate method, as it indicates the performance of
an unknown average threshold. Moreover, the prevalence of referable DR was
widely spread among studies (prevalence range: 5% -77%; IQR 41%). Thus, it is more
adequate to base the analysis on the hierarchical SROC plot that allows assessing the
performance of the test taking all thresholds into account, and visualize individual
study results (Figure 3.5b).81 The distribution of the studies in the plot shows a
greater variability in specificity rather than sensitivity.
Subgroup analysis
Results from subgroup analysis are presented in Table 3.4. Due to the limited
number of studies available in category 1 (detection of any DR), covariance analysis
of studies that used a single field per eye was not possible. Otherwise, all remaining
a priori subgroup analyses were conducted.
Overall, specificity values remained constant across subgroups; sensitivity outcomes
varied considerably, especially among studies that aimed to detect any DR (category
1). For example, category 1 studies that used 7 field ETDRS fundus photographs as
the reference standard showed higher sensitivity (0.96; 95%CI: 0.93-1.00) compared
to their counterparts that chose slit-lamp biomicroscopy for gold standard
(0.84;95%CI: 0.76-0.91). Moreover, studies that did not use pharmacologic dilation
had a lower sensitivity compared to the overall calculated for the detection of any
DR (0.84 versus 0.89). However, such differences in sensitivity among the above
mentioned subgroups did not hold for category 2 studies (detection of referable DR).
Heterogeneity did not significantly improve across subgroups. Nevertheless, studies
that used 7 field ETDRS photographs as the reference standard were less
inconsistent compared to the overall estimate.
Meta-regression results for each category are represented in the bubble plots
(Figure 3.6). The magnitude of each circle is proportional to the inverse of the
within-study variance of the corresponding study. Only category 1 studies (detection
of any DR) showed a statistically significant association between year of publication
and increased DOR (p-value 0.002).

59
Sensitivity analyses and publication bias
Publication bias was visually assessed by an individual funnel plot per category
(Figure 3.7). The funnel plot is noticeably asymmetric among both categories, with
missing studies at the bottom left of the graph indicating potential publication bias
towards studies with positive results. For studies that detect any DR, Egger’s test for
small study effects was non-significant (p-value 0.072), discarding the influence of
small study effects in the asymmetry of the funnel plot. In contrast, evidence of small
study effects was found among studies detecting referable retinopathy (p-value
0.004).
When sensitivity analyses were performed for category 1 studies, summary
sensitivity endpoints of individual studies were significantly less heterogeneous
when studies with high risk of bias were excluded (Cochrane Q 8.79; P value 0.19)
(see Appendix F). Diagnostic accuracy and heterogeneity remained constant in
category 2 studies (detection of referable retinopathy).
3.4 Discussion
3.4.1 Principal findings
Considering the quantitative summary results from the present review, it appears
that tele-ophthalmology approaches meet the requested targets for an effective
diabetic retinopathy screening program, as recommended by the Canadian
Ophthalmological Society (sensitivity >0.80, specificity >0.90).22,82 In category 1,
which included studies with a common threshold value (detection of any DR),
summary estimates showed a satisfactory diagnostic performance (sensitivity 0.89,
specificity 0.94). In line with these findings, category 2 studies also showed high
diagnostic performance for the detection of referable retinopathy (sensitivity 0.91,
specificity 0.92). Although these are satisfactory outcomes, substantial heterogeneity
was observed in both categories (Cochrane test P <0.001), limiting both the clinical
interpretation and applicability of these summary estimates. Moreover, studies in
category 2 do not share a common cut-off value, as studies reported different
threshold definitions for the detection of referable DR. In such situation, a summary
estimate calculated from the bivariate model represents an average operating point

60
for an average unknown threshold, which has no clinical significance.80 The
interpretation of the hierarchical SROC plot for this category (Figure 3.5) has greater
importance as it adequately represents study information from different
thresholds.81
Exploration of potential sources of heterogeneity is of crucial importance in
systematic reviews.48,49 Thus, we performed subgroup analyses to identify potential
sources of variability previously suggested in the literature. This approach also
provided the appropriate framework to explore the influence of choice of reference
standard on the diagnostic performance of tele-ophthalmology programs. Among
category 2, we noted that studies using a single image approach had an inferior
diagnostic performance (sensitivity 0.82; specificity 0.86) compared to the overall
analysis (sensitivity 0.91;specificity 0.92) These findings resonate with previous
studies that used a single field photograph per eye for DR assessment and reported
sensitivity values as low as 0.71.83 With a single field photograph, pathologies at the
retinal periphery may be missed, which in turn influences the rate of false negatives
and affects the sensitivity of the screening test.71,72
We observed further differences in summary sensitivity endpoints among category 1
subgroups (Table 3.4). First, we observed that the choice of gold standard had some
impact on the sensitivity outcomes of the index test. Studies using 7 field ETDRS
photographs as the gold standard had greater sensitivity (0.96; 95%CI: 0.93-1.00)
compared to studies that chose ophthalmoscopy (0.84; 95%CI:0.76-0.91). Our finding
is of special importance, since 54% of included studies reported the use of
ophthalmoscopy as the reference standard for the evaluation of DR screening
programs, instead of the recommended gold standard by the American Telehealth
Association (7 field ETDRS photographs).6 Based on our results, researchers may take
into account that the choice of ophthalmoscopy over 7 field ETDRS photographs as
the gold standard may negatively affect the sensitivity performance of the index test
if it aims to detect early forms of DR.
Second, meta-regression analysis found that recently published studies were
associated with greater diagnostic accuracy for the detection of any DR. Such a trend
61
could be related to the continuous improvement of digital technologies that
facilitate the identification of subtle manifestations of DR such as micro-aneurysms.
Finally in the sensitivity analysis, we found that poor methodological quality also
accounts for some observed heterogeneity in pooled sensitivity results among
category 1 studies. After excluding studies with risk of bias as graded using QUADAS2
criteria, we found that heterogeneity of sensitivity estimates was no longer
significant (Cochran Q 8.79; P value 0.19), and inconsistency among studies was
reduced to 31.7% (moderate inconsistency). However, such difference was observed
only in sensitivity estimates of studies in category 1 and did not hold for studies in
category 2 (referable retinopathy).
It is important to note that in all screening programs there is certain degree of harm.
In the case of tele-ophthalmology, the potential harm related to the screening
process itself is generally innocuous. If dilation drops are used, there is a small risk
for temporal development of open angle glaucoma. However, the risk of this adverse
event is very low, 1 in 20,000 cases.87
Adverse effects of screening are also related to the occurrence of false positive or
false negative results. Patients with false positive tests undergo additional
unnecessary examinations such as ocular coherence tomography or fluorescein
angiography.12 Besides the psychological distress resulting from positive results,
confirmatory tests do not represent significant harm. Allergic reactions may occur
due to administration of sodium fluorescein during fluorescein angiography,
although serious complications are rare.88 False negative tests may translate to
missed opportunities for preventing severe vision loss.
According to our results, tele-ophthalmology screening for DR can accomplish
sensitivity and specificity estimates over 80% and 95%, respectively. Such diagnostic
performance is considered sufficient for supporting the early diagnosis of DR through
screening programs.88

62
3.4.2 Strengths and limitations
To our knowledge, this is the first meta-analysis that evaluates and summarizes the
diagnostic performance of tele-ophthalmology screening for the assessment of DR.
This meta-analysis has a number of strengths. We performed a robust literature
search in collaboration with an information specialist, which included a
comprehensive search of major scientific databases and reference lists of reviews
and articles. In addition, we selected studies according to strict inclusion criteria
assessed by two reviewers; we also assessed methodological quality of studies and
used two suitable statistical models for diagnostic meta-analysis in the presence of
heterogeneity and different thresholds.
There are some limitations to be considered when interpreting the study results. We
observed considerable heterogeneity among both study categories (Cochran Q P
value <0.001), which could be explained in part by threshold effect (for category 2
studies) and poor methodological quality of some studies (for category 1 studies).
According to our exploratory subgroup analysis, differences in the selection of
reference standard and number of fields taken per eye may also contribute for the
heterogeneity observed. However, subgroup analyses did not fully explained the
variability found, as results remained heterogeneous even after stratifying by pre-
defined covariates. Thus, in presence of substantial heterogeneity summary results
should be cautiously interpreted. Evidence of publication bias is also a concern when
interpreting summary results, as it might have an impact on study conclusions
leading to overoptimistic results. However, it has been debated that in the context of
reviews of diagnostic accuracy studies applying such tests for funnel plot asymmetry
often lead to a high type two error rate (publication bias is incorrectly indicated by
the test).84
This meta-analysis was also limited by lack of information provided in primary
studies. We observed that almost 45% of authors did not report important
population characteristics such as ethnicity, type of diabetes and diabetes duration.
Reporting of visual acuity was almost non-existent, as only three authors reported
visual acuity of their study population.64,69,70 Lack of information on visual acuity

63
precludes any estimation of relationships between diagnostic accuracy and
functional status. Similarly, some index test characteristics were also poorly
reported. For example, 65% of studies did not mention the digital image resolution
and 80% of studies did not provide information about image compression or image
formatting. These are index technology characteristics of important relevance in
image quality, which may influence the correct identification of DR cases.85,86
Because of the limited information provided on population and digital image
characteristics, future reporting of these research studies should give greater
attention to provide more complete information about population characteristics,
and detailed description of index technology devices. This will allow future reviews
to account for these important sources of variability.
In conclusion, this systematic review with meta-analysis suggests that tele-
ophthalmology tests used to assess any DR and referable DR yield satisfactory
sensitivity and high specificity. Of note, diagnostic accuracy estimates amongst
individual studies were highly variable, compromising the clinical significance of the
meta-analysis results which in turn should be cautiously interpreted.
3.5. Literature cited
1. Engerman RL. Pathogenesis of diabetic retinopathy. Diabetes. 1989;38(10):1203–6. Available at: http://www.ncbi.nlm.nih.gov/pubmed/2676655. Accessed July 30, 2012.
2. Ding J, Wong TY. Current epidemiology of diabetic retinopathy and diabetic macular edema. Current diabetes reports. 2012;12(4):346–54. Available at: http://www.ncbi.nlm.nih.gov/pubmed/22585044. Accessed August 1, 2012.
3. Congdon N, O’Colmain B, Klaver CCW, et al. Causes and prevalence of visual impairment among adults in the United States. Archives of ophthalmology. 2004;122(4):477–85. Available at: http://www.ncbi.nlm.nih.gov/pubmed/15078664. Accessed November 18, 2012.
4. Chew EY, Ferris FL, Csaky KG, et al. The long-term effects of laser photocoagulation treatment in patients with diabetic retinopathy: the early treatment diabetic retinopathy follow-up study. Ophthalmology. 2003;110(9):1683–1689. Available at: http://www.mrw.interscience.wiley.com/cochrane/clcentral/articles/455/CN-00440455/frame.html.
64
5. Anon. Standards of medical care in diabetes--2012. Diabetes care. 2012;35 Suppl 1:S11–63. Available at: http://www.ncbi.nlm.nih.gov/pubmed/22187469. Accessed February 27, 2013.
6. Li HK, Horton M, Bursell S-E, et al. Telehealth practice recommendations for diabetic retinopathy, second edition. Telemedicine journal and e-health : the official journal of the American Telemedicine Association. 2011;17(10):814–37. Available at: http://www.ncbi.nlm.nih.gov/pubmed/21970573. Accessed June 16, 2012.
7. Olson JA, Strachan FM, Hipwell JH, et al. A comparative evaluation of digital imaging, retinal photography and optometrist examination in screening for diabetic retinopathy. Diabetic Medicine. 2003;20(7):528–534. Available at: http://doi.wiley.com/10.1046/j.1464-5491.2003.00969.x. Accessed May 10, 2012.
8. Harding SP, Broadbent DM, Neoh C, White MC, Vora J. Sensitivity and specificity of photography and direct ophthalmoscopy in screening for sight threatening eye disease: the Liverpool Diabetic Eye Study. BMJ (Clinical research ed.). 1995;311(7013):1131–5. Available at: http://www.pubmedcentral.nih.gov/articlerender.fcgi?artid=2551056&tool=pmcentrez&rendertype=abstract. Accessed August 20, 2012.
9. Lamminen H, Voipio V, Ruohonen K, Uusitalo H. Telemedicine in ophthalmology. Acta Ophthalmologica Scandinavica. 2003;81(2):105–109. Available at: http://www.blackwell-synergy.com/links/doi/10.1034/j.1600-0420.2003.00045.x. Accessed April 7, 2013.
10. Tang RA, Morales M, Ricur G, Schiffman JS. Telemedicine for eye care. Journal of telemedicine and telecare. 2005;11(8):391–6. Available at: http://www.ncbi.nlm.nih.gov/pubmed/16356312. Accessed April 7, 2013.
11. P KR, Raman R, Manikandan M, Mahajan S, Paul PG, Sharma T. Patient satisfaction with tele-ophthalmology versus ophthalmologist-based screening in diabetic retinopathy. Journal of telemedicine and telecare. 2006;12(3):159–160. Available at: http://ovidsp.ovid.com/ovidweb.cgi?T=JS&PAGE=reference&D=emed7&NEWS=N&AN=16638238.
12. Whited JD. Accuracy and reliability of teleophthalmology for diagnosing diabetic retinopathy and macular edema: a review of the literature. Diabetes technology & therapeutics. 2006;8(1):102–11. Available at: http://www.ncbi.nlm.nih.gov/pubmed/16472057. Accessed April 8, 2013.
13. Peter B, L GR, Marisa C, et al. Screening for presence or absence of diabetic retinopathy: a meta-analysis. Archives of ophthalmology. 2011;129(4):435–44. Available at: http://www.ncbi.nlm.nih.gov/pubmed/21149748. Accessed March 20, 2012.

65
14. Hutchinson A, McIntosh A, Peters J, et al. Effectiveness of screening and monitoring tests for diabetic retinopathy - a systematic review. Diabetic Medicine. 2000;17(7):495–506. Available at: http://doi.wiley.com/10.1046/j.1464-5491.2000.00250.x. Accessed July 29, 2012.
15. Liesenfeld B, Kohner E, Piehlmeier W, et al. A telemedical approach to the screening of diabetic retinopathy: digital fundus photography. Diabetes Care. 2000;23(3):345–348. Available at: http://care.diabetesjournals.org/cgi/doi/10.2337/diacare.23.3.345. Accessed May 29, 2012.
16. Silva PS, Cavallerano JD, Aiello LM, Aiello LP. Telemedicine and diabetic retinopathy: moving beyond retinal screening. Archives of ophthalmology. 2011;129(2):236–42. Available at: http://www.ncbi.nlm.nih.gov/pubmed/21320974. Accessed May 10, 2012.
17. E Z-GI, Ran Z. Telemedicine in diabetic retinopathy screening. International ophthalmology clinics. 2009;49(2):75–86. Available at: http://ovidsp.ovid.com/ovidweb.cgi?T=JS&PAGE=reference&D=medl&NEWS=N&AN=19349788.
18. Moller F, Hansen M, Sjolie AK. Is one 60 degrees fundus photograph sufficient for screening of proliferative diabetic retinopathy?. Diabetes care. 2001;24(12):2083–2085. Available at: http://ovidsp.ovid.com/ovidweb.cgi?T=JS&PAGE=reference&D=med4&NEWS=N&AN=11723087.
19. Gresset JA, Boucher MC, Angioi-Duprez K, Olivier S, Perrier M. Comparison of Two, Three and Four 45 - Degree Image Fields with the Topcon Crw6 Non - Mydriatic Camera for the Screening of Diabetic Retinopathy. ARVO Annual Meeting Abstract Search and Program Planner. 2003:3954.
20. Zimmer-Galler IE, Horton M. Telehealth methods for diabetic retinopathy and glaucoma: Clinical, Technical and business insights and strategies for sucessful tele-ophthalmology programs. In: Association for Research in Vision and Ophthalmology (ARVO) Education Course. Association for Research in Vision and Ophthalmology Inc. 2013:1–117.
21. Maberley D, Cruess AF, Barile G, Slakter J. Digital photographic screening for diabetic retinopathy in the James Bay Cree. Ophthalmic Epidemiology. 2002;9(3):169–178. Available at: http://informahealthcare.com/doi/abs/10.1076/opep.9.3.169.1517. Accessed August 22, 2012.
22. Hooper P, Boucher MC, Cruess A, et al. Canadian Ophthalmological Society Evidence-based Clinical Practice Guidelines for the Management of Diabetic Retinopathy - executive summary. Canadian journal of ophthalmology. Journal

66
canadien d’ophtalmologie. 2012;47(2):91–6. Available at: http://www.ncbi.nlm.nih.gov/pubmed/22560411. Accessed June 16, 2012.
23. Greenhalgh T, Peacock R. Effectiveness and efficiency of search methods in systematic reviews of complex evidence: audit of primary sources. BMJ (Clinical research ed.). 2005;331(7524):1064–5. Available at: http://www.pubmedcentral.nih.gov/articlerender.fcgi?artid=1283190&tool=pmcentrez&rendertype=abstract. Accessed May 28, 2013.
24. Orwin R. Evaluating coding decisions. In: Cooper H, Hedges L, eds. The handbook of research synthesis. Russell Sage Foundation; 1994.
25. Reed JF. Homogeneity of kappa statistics in multiple samples. Computer methods and programs in biomedicine. 2000;63(1):43–6. Available at: http://www.ncbi.nlm.nih.gov/pubmed/10927153. Accessed June 16, 2013.
26. Knottnerus JA, Weel C van, Muris JW. Evidence base of clinical diagnosis: evaluation of diagnostic procedures. BMJ: British Medical Journal. 2002;324(7335):477.
27. Gimenez T, Braga MM, Raggio DP, Deery C, Ricketts DN, Mendes FM. Fluorescence-based methods for detecting caries lesions: systematic review, meta-analysis and sources of heterogeneity. PloS one. 2013;8(4):e60421. Available at: http://www.pubmedcentral.nih.gov/articlerender.fcgi?artid=3617206&tool=pmcentrez&rendertype=abstract. Accessed May 27, 2013.
28. Whiting PF, Rutjes AWS, Westwood ME, et al. QUADAS-2: a revised tool for the quality assessment of diagnostic accuracy studies. Annals of internal medicine. 2011;155(8):529–36. Available at: http://www.ncbi.nlm.nih.gov/pubmed/22007046. Accessed March 15, 2012.
29. Whiting P, Harbord R, Kleijnen J. No role for quality scores in systematic reviews of diagnostic accuracy studies. BMC medical research methodology. 2005;5:19. Available at: http://www.pubmedcentral.nih.gov/articlerender.fcgi?artid=1184082&tool=pmcentrez&rendertype=abstract. Accessed June 14, 2012.
30. Jüni P, Witschi A, Bloch R, Egger M. The hazards of scoring the quality of clinical trials for meta-analysis. JAMA : the journal of the American Medical Association. 1999;282(11):1054–60. Available at: http://www.ncbi.nlm.nih.gov/pubmed/10493204. Accessed June 5, 2013.
31. Reitsma JB, Glas AS, Rutjes AWS, Scholten RJPM, Bossuyt PM, Zwinderman AH. Bivariate analysis of sensitivity and specificity produces informative summary measures in diagnostic reviews. Journal of clinical epidemiology. 2005;58(10):982–90. Available at: http://www.ncbi.nlm.nih.gov/pubmed/16168343. Accessed March 19, 2013.
67
32. Riley RD, Abrams KR, Sutton AJ, Lambert PC, Thompson JR. Bivariate random-effects meta-analysis and the estimation of between-study correlation. BMC medical research methodology. 2007;7:3. Available at: http://www.pubmedcentral.nih.gov/articlerender.fcgi?artid=1800862&tool=pmcentrez&rendertype=abstract. Accessed April 10, 2013.
33. Riley RD, Abrams KR, Lambert PC, Sutton AJ, Thompson JR. An evaluation of bivariate random-effects meta-analysis for the joint synthesis of two correlated outcomes. Statistics in medicine. 2007;26(1):78–97. Available at: http://www.ncbi.nlm.nih.gov/pubmed/16526010. Accessed March 19, 2013.
34. Riley RD, Thompson JR, Abrams KR. An alternative model for bivariate random-effects meta-analysis when the within-study correlations are unknown. Biostatistics (Oxford, England). 2008;9(1):172–86. Available at: http://www.ncbi.nlm.nih.gov/pubmed/17626226. Accessed May 28, 2013.
35. Grimes DA, Schulz KF. Refining clinical diagnosis with likelihood ratios. Lancet. 365(9469):1500–5. Available at: http://www.ncbi.nlm.nih.gov/pubmed/15850636. Accessed July 8, 2013.
36. Glas AS, Lijmer JG, Prins MH, Bonsel GJ, Bossuyt PMM. The diagnostic odds ratio: a single indicator of test performance. Journal of Clinical Epidemiology. 2003;56(11):1129–1135.
37. Rutter CM, Gatsonis CA. A hierarchical regression approach to meta-analysis of diagnostic test accuracy evaluations. Statistics in medicine. 2001;20(19):2865–84. Available at: http://www.ncbi.nlm.nih.gov/pubmed/11568945. Accessed March 19, 2013.
38. Rutter CM, Gatsonis CA. Regression methods for meta-analysis of diagnostic test data. Academic radiology. 1995;2 Suppl 1:S48–56; discussion S65–7, S70–1 pas. Available at: http://www.ncbi.nlm.nih.gov/pubmed/9419705. Accessed March 19, 2013.
39. Dinnes J, Deeks J, Kirby J, Roderick P. A methodological review of how heterogeneity has been examined in systematic reviews of diagnostic test accuracy. Health technology assessment (Winchester, England). 2005;9(12):1–113, iii. Available at: http://www.ncbi.nlm.nih.gov/pubmed/15774235. Accessed March 21, 2013.
40. Harbord RM, Whiting P. metandi: Meta-analysis of diagnostic accuracy using hierarchical logistic regression. Stata Journal. 2009;9(2):211–229.
41. Harbord RM, Deeks JJ, Egger M, Whiting P, Sterne JAC. A unification of models for meta-analysis of diagnostic accuracy studies. Biostatistics (Oxford, England). 2007;8(2):239–51. Available at: http://www.ncbi.nlm.nih.gov/pubmed/16698768. Accessed March 19, 2013.

68
42. Irwig L, Tosteson AN, Gatsonis C, et al. Guidelines for meta-analyses evaluating diagnostic tests. Annals of internal medicine. 1994;120(8):667–76. Available at: http://www.ncbi.nlm.nih.gov/pubmed/8135452. Accessed March 19, 2013.
43. Deeks JJ. Systematic reviews in health care: Systematic reviews of evaluations of diagnostic and screening tests. BMJ (Clinical research ed.). 2001;323(7305):157–62. Available at: http://www.pubmedcentral.nih.gov/articlerender.fcgi?artid=1120791&tool=pmcentrez&rendertype=abstract. Accessed March 19, 2013.
44. Higgins JPT, Thompson SG, Deeks JJ, Altman DG. Measuring inconsistency in meta-analyses. BMJ (Clinical research ed.). 2003;327(7414):557–60. Available at: http://www.pubmedcentral.nih.gov/articlerender.fcgi?artid=192859&tool=pmcentrez&rendertype=abstract. Accessed May 28, 2013.
45. Higgins JPT, Thompson SG. Quantifying heterogeneity in a meta-analysis. Statistics in medicine. 2002;21(11):1539–58. Available at: http://www.ncbi.nlm.nih.gov/pubmed/12111919. Accessed February 28, 2013.
46. Arends LR, Hamza TH, Van Houwelingen JC, Heijenbrok-Kal MH, Hunink MGM, Stijnen T. Bivariate random effects meta-analysis of ROC curves. Medical decision making : an international journal of the Society for Medical Decision Making. 28(5):621–38. Available at: http://www.ncbi.nlm.nih.gov/pubmed/18591542. Accessed March 19, 2013.
47. Irwig L, Macaskill P, Glasziou P, Fahey M. Meta-analytic methods for diagnostic test accuracy. Journal of clinical epidemiology. 1995;48(1):119–30; discussion 131–2. Available at: http://www.ncbi.nlm.nih.gov/pubmed/7853038. Accessed January 28, 2013.
48. Lijmer JG, Bossuyt PMM, Heisterkamp SH. Exploring sources of heterogeneity in systematic reviews of diagnostic tests. Statistics in medicine. 2002;21(11):1525–37. Available at: http://www.ncbi.nlm.nih.gov/pubmed/12111918. Accessed March 19, 2013.
49. Whiting P, Rutjes AWS, Reitsma JB, Glas AS, Bossuyt PMM, Kleijnen J. Sources of variation and bias in studies of diagnostic accuracy: a systematic review. Annals of internal medicine. 2004;140(3):189–202. Available at: http://www.ncbi.nlm.nih.gov/pubmed/14757617. Accessed November 22, 2012.
50. Hedges L V, Pigott TD. The power of statistical tests in meta-analysis. Psychological methods. 2001;6(3):203–17. Available at: http://www.ncbi.nlm.nih.gov/pubmed/11570228. Accessed March 21, 2013.
51. Higgins JPT, Thompson SG. Quantifying heterogeneity in a meta-analysis. Statistics in medicine. 2002;21(11):1539–58. Available at: http://www.ncbi.nlm.nih.gov/pubmed/12111919. Accessed May 22, 2013.

69
52. Knapp G, Hartung J. Improved tests for a random effects meta-regression with a single covariate. Statistics in medicine. 2003;22(17):2693–710. Available at: http://www.ncbi.nlm.nih.gov/pubmed/12939780. Accessed July 29, 2013.
53. Sterne JA, Egger M. Funnel plots for detecting bias in meta-analysis: guidelines on choice of axis. Journal of clinical epidemiology. 2001;54(10):1046–55. Available at: http://www.ncbi.nlm.nih.gov/pubmed/11576817. Accessed April 5, 2013.
54. Sterne JA, Gavaghan D, Egger M. Publication and related bias in meta-analysis: power of statistical tests and prevalence in the literature. Journal of clinical epidemiology. 2000;53(11):1119–29. Available at: http://www.ncbi.nlm.nih.gov/pubmed/11106885. Accessed April 10, 2013.
55. Harbord RM, Egger M, Sterne JAC. A modified test for small-study effects in meta-analyses of controlled trials with binary endpoints. Statistics in medicine. 2006;25(20):3443–57. Available at: http://www.ncbi.nlm.nih.gov/pubmed/16345038. Accessed April 10, 2013.
56. Egger M, Davey Smith G, Schneider M, Minder C. Bias in meta-analysis detected by a simple, graphical test. BMJ (Clinical research ed.). 1997;315(7109):629–34. Available at: http://www.pubmedcentral.nih.gov/articlerender.fcgi?artid=2127453&tool=pmcentrez&rendertype=abstract. Accessed March 18, 2013.
57. Jehanara A, P WT, Sven-Eric B, M AL, D CJ, A VR. The sensitivity and specificity of nonmydriatic digital stereoscopic retinal imaging in detecting diabetic retinopathy. Diabetes care. 2006;29(10):2205–2209. Available at: http://ovidsp.ovid.com/ovidweb.cgi?T=JS&PAGE=reference&D=med4&NEWS=N&AN=17003294.
58. Diaz B, M, Guillen G, et al. [Validity of the non-mydriatic camera for diabetic retinopathy screening and analysis of retinopathy risk indicators]. Validez de la camara no midriatica en el cribado de la retinopatia diabetica y analisis de indicadores de riesgo de la retinopatia. 2004;79(9):433–441. Available at: http://ovidsp.ovid.com/ovidweb.cgi?T=JS&PAGE=reference&D=med4&NEWS=N&AN=15389364.
59. Carole BM, A GJ, Karine A, Sebastien O. Effectiveness and safety of screening for diabetic retinopathy with two nonmydriatic digital images compared with the seven standard stereoscopic photographic fields. Canadian journal of ophthalmology. Journal canadien d’ophtalmologie. 2003;38(7):557–568. Available at: http://ovidsp.ovid.com/ovidweb.cgi?T=JS&PAGE=reference&D=med4&NEWS=N&AN=14740797.
60. Chun Dal W, Bauer RM, P WT, Dick John S.B. II, Kraig Bower S. Evaluation of digital fundus images as a diagnostic method for surveillance of diabetic retinopathy. Military medicine. 2007;172(4):405–410. Available at:
70
http://search.ebscohost.com/login.aspx?direct=true&db=cin20&AN=2009569500&site=ehost-live.
61. Y LD, S BM, J BR, M GD. The sensitivity and specificity of single-field nonmydriatic monochromatic digital fundus photography with remote image interpretation for diabetic retinopathy screening: a comparison with ophthalmoscopy and standardized mydriatic color photography. American journal of ophthalmology. 2002;134(2):204–213. Available at: http://ovidsp.ovid.com/ovidweb.cgi?T=JS&PAGE=reference&D=med4&NEWS=N&AN=12140027.
62. Lopez-Bastida J, Cabrera-Lopez F, Serrano-Aguilar P. Sensitivity and specificity of digital retinal imaging for screening diabetic retinopathy. Diabetic medicine : a journal of the British Diabetic Association. 2007;24(4):403–407. Available at: http://ovidsp.ovid.com/ovidweb.cgi?T=JS&PAGE=reference&D=med4&NEWS=N&AN=17298591.
63. Maberley D, Cruess AF, Barile G, et al. Digital photographic screening for diabetic retinopathy in the James Bay Cree. Ophthalmic Epidemiology. 2002;9(3):169–178. Available at: http://informahealthcare.com/doi/abs/10.1076/opep.9.3.169.1517. Accessed August 22, 2012.
64. Massin P, Erginay A, Mehidi B, et al. Evaluation of a new non-mydriatic digital camera for detection of diabetic retinopathy. Diabetic medicine : a journal of the British Diabetic Association. 2003;20(8):635–641. Available at: http://ovidsp.ovid.com/ovidweb.cgi?T=JS&PAGE=reference&D=med4&NEWS=N&AN=12873290.
65. Eduardo MF, Moll V, Sacramento M, et al. Validation of the electronic mailing of retinographs of diabetic patients in order to detect retinopathy in primary care. Atencion Primaria. 2008;(3):119–123.
66. Phiri R, Keeffe JE, Harper CA, Taylor HR. Comparative study of the polaroid and digital non-mydriatic cameras in the detection of referrable diabetic retinopathy in Australia. Diabetic medicine : a journal of the British Diabetic Association. 2006;23(8):867–872. Available at: http://ovidsp.ovid.com/ovidweb.cgi?T=JS&PAGE=reference&D=med4&NEWS=N&AN=16911624.
67. J RC, S TMT, Ezekiel W, Andrew T, J HB, J GMD. Web-based grading of compressed stereoscopic digital photography versus standard slide film photography for the diagnosis of diabetic retinopathy. Ophthalmology. 2007;114(9):1748–1754. Available at: http://ovidsp.ovid.com/ovidweb.cgi?T=JS&PAGE=reference&D=med4&NEWS=N&AN=17368543.

71
68. Scanlon PH, Malhotra R, Thomas G, et al. The effectiveness of screening for diabetic retinopathy by digital imaging photography and technician ophthalmoscopy. Diabetic Medicine. 2003;20(6):467–474. Available at: http://doi.wiley.com/10.1046/j.1464-5491.2003.00954.x. Accessed May 10, 2012.
69. W TDS, Tay-Kearney FML, Yogesan K. Light and portable novel device for diabetic retinopathy screening. Clinical and Experimental Ophthalmology. 2012;(1):E40–E46.
70. Schiffman RM, Jacobsen G, Nussbaum JJ, et al. Comparison of a digital retinal imaging system and seven-field stereo color fundus photography to detect diabetic retinopathy in the primary care environment. Ophthalmic surgery, lasers & imaging : the official journal of the International Society for Imaging in the Eye. 2005;36(1):46–56. Available at: http://ovidsp.ovid.com/ovidweb.cgi?T=JS&PAGE=reference&D=med4&NEWS=N&AN=15688971.
71. Aptel F, Denis P, Rouberol F, Thivolet C. Screening of diabetic retinopathy: Effect of field number and mydriasis on sensitivity and specificity of digital fundus photography. Diabetes and Metabolism. 2008;34(3):290–293. Available at: http://ovidsp.ovid.com/ovidweb.cgi?T=JS&PAGE=reference&D=emed8&NEWS=N&AN=2008397811.
72. Baeza M, Orozco-Beltrán D, VF G-G, et al. Screening for sight threatening diabetic retinopathy using non-mydriatic retinal camera in a primary care setting: to dilate or not to dilate? International Journal of Clinical Practice. 2009;63(3):433–438. Available at: http://search.ebscohost.com/login.aspx?direct=true&db=cin20&AN=2010191438&site=ehost-live.
73. Li K H, Florez-Arango J, Hubbard D L, Adol E, P DR, A KE. Grading diabetic retinopathy severity from compressed digital retinal images compared with uncompressed images and film. Retina (Philadelphia, Pa.). 2010;30(10):1651–1661. Available at: http://ovidsp.ovid.com/ovidweb.cgi?T=JS&PAGE=reference&D=medl&NEWS=N&AN=20921928.
74. Stela V, Elisa B, Francesca M, et al. Screening for diabetic retinopathy: 1 and 3 nonmydriatic 45-degree digital fundus photographs vs 7 standard early treatment diabetic retinopathy study fields. American journal of ophthalmology. 2009;148(1):111–8. Available at: http://www.ncbi.nlm.nih.gov/pubmed/19406376. Accessed May 28, 2012.
75. Robbins AS, Hurley LD, Dudenhoefer EJ, Chao SY. Performance characteristics of digital fundus photography as a screening test for diabetic retinopathy in a low-risk population. Diabetes Technology and Therapeutics. 2001;3(2):193–200. Available at: http://ovidsp.ovid.com/ovidweb.cgi?T=JS&PAGE=reference&D=emed5&NEWS=N&AN=2001250808.
72
76. Herbert HM, Jordan K, Flanagan DW. Is screening with digital imaging using one retinal view adequate? Eye (Basingstoke). 2003;(4):497–500.
77. D CJ, Paul AL, A CA, et al. Nonmydriatic digital imaging alternative for annual retinal examination in persons with previously documented no or mild diabetic retinopathy. American journal of ophthalmology. 2005;140(4):667–673. Available at: http://ovidsp.ovid.com/ovidweb.cgi?T=JS&PAGE=reference&D=med4&NEWS=N&AN=16083842.
78. Hansen AB, Hartvig NB, Jensen MS, Borch-Johnsen K, Lund-Andersen H, Larsen M. Diabetic retinopathy screening using digital non-mydriatic fundus photography and automated image analysis. Acta ophthalmologica Scandinavica. 2004;82(6):666–672. Available at: http://ovidsp.ovid.com/ovidweb.cgi?T=JS&PAGE=reference&D=med4&NEWS=N&AN=15606461.
79. Deeks J, Bossuyt P, Gatsonis C. Chapter 10: Analysing and presenting results. In: Cochrane Handbook for Systematic Reviews of Diagnostic Test Accuracy. The Cochrane Collaboration; 2010.
80. P M, C G, Deeks JJ, Harbord RM, Y T. Cochrane Handbook for Systematic Reviews of Diagnostic Test Accuracy Version 1.0. 2010:61. Available at: http://srdta.cochrane.org/.
81. Dukic V, Gatsonis C. Meta-analysis of diagnostic test accuracy assessment studies with varying number of thresholds. Biometrics. 2003;59(4):936–46. Available at: http://www.ncbi.nlm.nih.gov/pubmed/14969472. Accessed March 21, 2013.
82. Moss SE, Klein R, Kessler SD, Richie KA. Comparison between ophthalmoscopy and fundus photography in determining severity of diabetic retinopathy. Ophthalmology. 1985;92(1):62–7. Available at: http://www.ncbi.nlm.nih.gov/pubmed/2579361. Accessed April 10, 2013.
83. Williams GA, Scott IU, Haller JA, Maguire AM, Marcus D, McDonald HR. Single-field fundus photography for diabetic retinopathy screening: a report by the American Academy of Ophthalmology. Ophthalmology. 2004;111(5):1055–62. Available at: http://www.ncbi.nlm.nih.gov/pubmed/15121388. Accessed January 19, 2013.
84. Deeks JJ, Macaskill P, Irwig L. The performance of tests of publication bias and other sample size effects in systematic reviews of diagnostic test accuracy was assessed. Journal of clinical epidemiology. 2005;58(9):882–93. Available at: http://www.ncbi.nlm.nih.gov/pubmed/16085191. Accessed June 18, 2013.
85. Basu A, Kamal AD, Illahi W, Khan M, Stavrou P, Ryder RE. Is digital image compression acceptable within diabetic retinopathy screening? Diabetic medicine : a journal of the British Diabetic Association. 2003;20(9):766–771. Available at:

73
http://ovidsp.ovid.com/ovidweb.cgi?T=JS&PAGE=reference&D=emed6&NEWS=N&AN=12925059.
86. Conrath J, Erginay A, Giorgi R, et al. Evaluation of the effect of JPEG and JPEG2000 image compression on the detection of diabetic retinopathy. Eye (London, England). 2007;21(4):487–493. Available at: http://ovidsp.ovid.com/ovidweb.cgi?T=JS&PAGE=reference&D=med4&NEWS=N&AN=16456597.
87. Pandit RJ, Taylor R. Mydriasis and glaucoma: exploding the myth. A systematic review. Diabet. Med. 2000;17(10):693–699. Available at: http://doi.wiley.com/10.1046/j.1464-5491.2000.00368.x.
88. Ciulla TA, Amador AG, Zinman B. Diabetic retinopathy and diabetic macular edema: pathophysiology, screening, and novel therapies. Diabetes Care. 2003;26(9):2653–64. Available at: http://www.ncbi.nlm.nih.gov/pubmed/12941734. Accessed February 5, 2013.

74
3.6 Tables and figures
Figure 3.1 PRISMA flow diagram of study selection (systematic review)

75
Table 3.1. Characteristics of primary studies included in the Meta-analysis
Citation Country N (fully-screened)
Mean age
(years) Male (%)
Type II diabetes
(%) Gold standard Cut-off
criteria DR
prevalence
Ahmed J., et al (2006) United States 156 60 54.5% 97.9% Ophthalmoscopy Any DR 15.8%*
Aptel F., et al (2008) France 79 52.4 0.89 (men/women) 62% Ophthalmoscopy Any DR 25.3%
Baeza M., et al (2004)+ Spain 188 68.5 34.7% 100% Ophthalmoscopy
Any DR 41.25% Referable
DR 14.3%
Baeza M., et al (2009)+ Spain 216 68.5 43.7% 90% 7 field ETDRS
photographs
Any DR 37.2%* Referable
DR 14.3%
Boucher MC., et al (2003) Canada 79 59.9 49% NR 7 field ETDRS
photographs
Any DR 63.30% Referable
DR 53.10%
Chun DW., et al (2007) United States 120 NR 50.8% NR Ophthalmoscopy Any DR 32.5%*
Hansen AB., et al (2004) Denmark 83 47 60.2% 27.0% 7 field ETDRS
photographs Referable
DR 74.7%*
Herbert HM., et al (2003) United Kingdom 145 NR NR 73% Ophthalmoscopy Any DR 26.0%
Li HK., et al (2010) United States 76 59.4 37.6% NR 7 field ETDRS photographs
Any DR 82.9% Referable
DR 77.6%*
Lin DY., et al (2002) United States 197 NR 58.0% NR 7 field ETDRS Referable 36.6%*
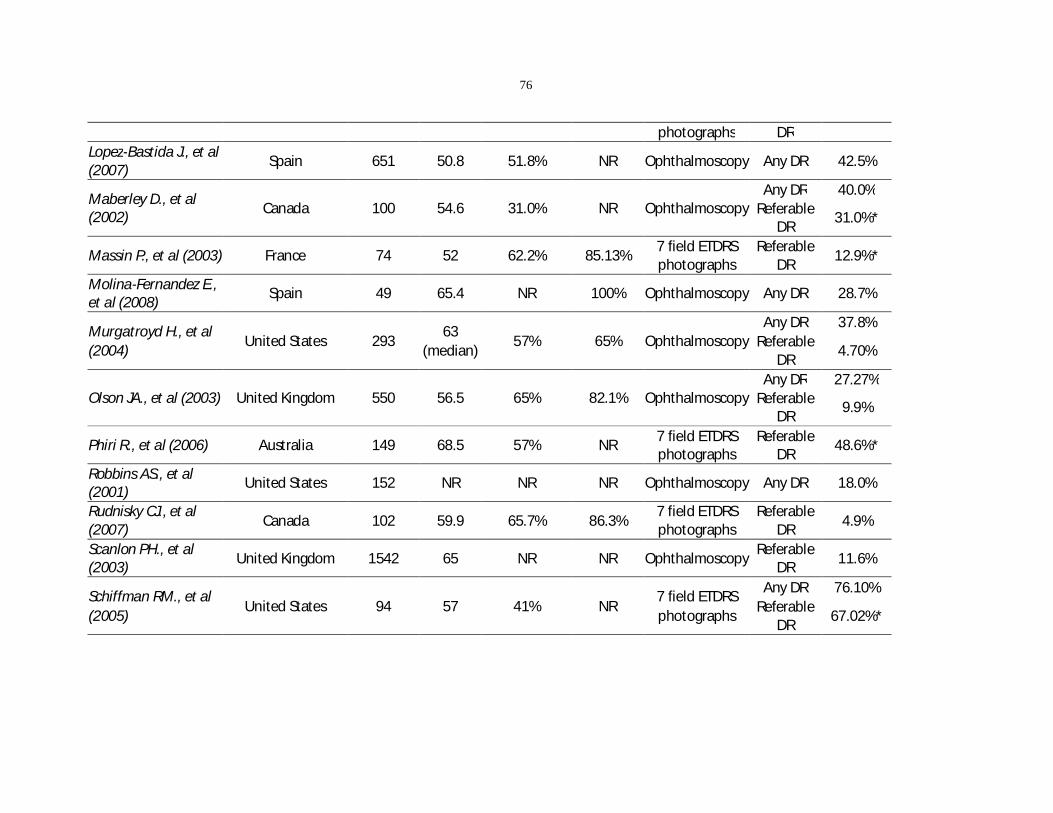
76
photographs DR Lopez-Bastida J., et al (2007) Spain 651 50.8 51.8% NR Ophthalmoscopy Any DR 42.5%
Maberley D., et al (2002) Canada 100 54.6 31.0% NR Ophthalmoscopy
Any DR 40.0% Referable
DR 31.0%*
Massin P., et al (2003) France 74 52 62.2% 85.13% 7 field ETDRS photographs
Referable DR 12.9%*
Molina-Fernandez E., et al (2008) Spain 49 65.4 NR 100% Ophthalmoscopy Any DR 28.7%
Murgatroyd H., et al (2004)
United States 293 63
(median) 57% 65% Ophthalmoscopy
Any DR 37.8% Referable
DR 4.70%
Olson JA., et al (2003) United Kingdom 550 56.5 65% 82.1% Ophthalmoscopy Any DR 27.27%
Referable DR 9.9%
Phiri R., et al (2006) Australia 149 68.5 57% NR 7 field ETDRS photographs
Referable DR 48.6%*
Robbins AS., et al (2001) United States 152 NR NR NR Ophthalmoscopy Any DR 18.0%
Rudnisky CJ., et al (2007) Canada 102 59.9 65.7% 86.3%
7 field ETDRS photographs
Referable DR 4.9%
Scanlon PH., et al (2003) United Kingdom 1542 65 NR NR Ophthalmoscopy Referable
DR 11.6%
Schiffman RM., et al (2005)
United States 94 57 41% NR 7 field ETDRS photographs
Any DR 76.10% Referable
DR 67.02%*

77
Ting DS., et al (2012) Australia 136 53.9 NR 71% Ophthalmoscopy Any DR 31.3% Vujosevic S., et al (2009) Italy 55 57.1 60% 67.3% 7 field ETDRS
photographs Referable
DR 51.4%
* Prevalence calculated from reported 2x2 tables DR= Diabetic retinopathy NR= Not reported Ophthalmoscopy examination included slit-lamp biomicroscopy performed by experienced ophthalmologist or retina specialist +Studies may contain overlapping patient populations

78
Table 3.2 QUADAS2 assessment results
Citation, year PATIENT SELECTION
INDEX TEST
REFERENCE STANDARD
FLOW AND TIMING
Ahmed J., et al (2006) Low Low Low High
Aptel F., et al (2008) Low High Low Low
Baeza M., et al (2004) Low Low Low Low
Baeza M., et al (2009) Low Low Low Low
Boucher MC., et al (2003) Low Low Low Low
Chun DW., et al (2007) Low Low Low High
Hansen AB., et al (2004) High Low Low Low
Herbert HM., et al (2003) Unclear Low Low Low
Li HK., et al (2010) High Low Low Low
Lin DY., et al (2002) Low Low Low Unclear
Lopez-Bastida J., et al (2007) Low Low Low Low
Maberley D., et al (2002) Low Low Low Low
Massin P., et al (2003) Low Low Low Unclear
Molina-Fernandez E., et al (2008) Low Low Low Low
Murgatroyd H., et al (2004) Low Low Low High
Olson JA., et al (2003) Unclear Low Low Low
Phiri R., et al (2006) Low Low Low Low
Robbins AS., et al (2001) Low Unclear Low High
Rudnisky CJ., et al (2007) Low Low Low Low
Scanlon PH., et al (2003) Low Low Low Unclear
Schiffman RM., et al (2005) High Low Low Low
Ting DS., et al (2012) Low Low Low Low
Vujosevic S., et al (2009) Unclear Unclear Low Low
Figure 3.2 QUADAS2 assessment (risk of bias by domain)
0% 50% 100%
Patient Selection
Index Test
Reference Standard
Flow and Timing
Proportion of studies with risk of bias (high, low, unclear)
QUADAS-2 Domain
Low
Unclear
High

79
Figure 3.3. Paired forest plot of meta analyses of studies included in category 1 (detection of any DR)
Figure 3.4. Paired forest plot of meta-analyses of studies included in category 2 (detection of referable DR)
SENSITIVITY (95% CI)
Q =154.39, df = 15.00, p = 0.00
I2 = 90.28 [86.64 - 93.93]
0.89[0.81 - 0.93]
0.59 [0.42 - 0.74]
0.86 [0.57 - 0.98]
0.90 [0.84 - 0.95]
0.93 [0.81 - 0.99]
0.85 [0.70 - 0.94]
0.92 [0.88 - 0.95]
0.83 [0.76 - 0.89]
0.88 [0.79 - 0.95]
0.75 [0.55 - 0.89]
0.84 [0.64 - 0.95]
0.95 [0.75 - 1.00]
0.38 [0.22 - 0.56]
0.98 [0.89 - 1.00]
0.98 [0.91 - 1.00]
0.99 [0.92 - 1.00]
0.85 [0.75 - 0.92]0.85 [0.75 - 0.92]
StudyId
COMBINED
Chun MDW et al., 2007
Molina-Fernandez et al., 2005
Murgatroyd H., et al, 2004
Ting SW et al., 2011
Maberley D et al., 2002
Lopez-Bastida et al., 2007
Olson JA et al., 2002
Baeza DM et al., 2004
Robbins AS et al., 2001
Ahmed J et al., 2006
Aptel F et al., 2008
Herbert HM et al., 2003
Boucher MC et al., 2003
Li HK et al., 2010
Schiffman RM et al., 2005
Baeza DM et al., 2009
0.2 1.0SENSITIVITY
SPECIFICITY (95% CI)
Q =183.44, df = 15.00, p = 0.00
I2 = 91.82 [88.91 - 94.74]
0.94[0.89 - 0.96]
1.00 [0.96 - 1.00]
0.97 [0.85 - 1.00]
0.90 [0.86 - 0.94]
0.98 [0.93 - 1.00]
0.80 [0.68 - 0.89]
0.96 [0.93 - 0.98]
0.79 [0.75 - 0.83]
0.95 [0.89 - 0.98]
0.85 [0.77 - 0.91]
0.86 [0.79 - 0.92]
0.98 [0.91 - 1.00]
0.95 [0.90 - 0.99]
0.81 [0.64 - 0.93]
0.92 [0.64 - 1.00]
1.00 [0.85 - 1.00]
0.94 [0.89 - 0.97]0.94 [0.89 - 0.97]
StudyId
COMBINED
Chun MDW et al., 2007
Molina-Fernandez et al., 2005
Murgatroyd H., et al, 2004
Ting SW et al., 2011
Maberley D et al., 2002
Lopez-Bastida et al., 2007
Olson JA et al., 2002
Baeza DM et al., 2004
Robbins AS et al., 2001
Ahmed J et al., 2006
Aptel F et al., 2008
Herbert HM et al., 2003
Boucher MC et al., 2003
Li HK et al., 2010
Schiffman RM et al., 2005
Baeza DM et al., 2009
0.6 1.0SPECIFICITY
SENSITIVITY (95% CI)
Q = 49.41, df = 14.00, p = 0.00
I2 = 71.67 [56.91 - 86.43]
0.91[0.87 - 0.94]
0.91 [0.75 - 0.98]
0.93 [0.82 - 0.98]
0.78 [0.66 - 0.87]
0.88 [0.82 - 0.92]
1.00 [0.69 - 1.00]
0.97 [0.85 - 1.00]
0.95 [0.87 - 0.99]
0.79 [0.49 - 0.95]
0.89 [0.71 - 0.98]
0.95 [0.87 - 0.99]
0.86 [0.76 - 0.93]
0.80 [0.28 - 0.99]
0.94 [0.79 - 0.99]
0.81 [0.62 - 0.94]
0.97 [0.88 - 1.00]0.97 [0.88 - 1.00]
Author , year / citation
COMBINED
Maberley D et al., 2002/100
Olson JA et al., 2002/545
Lin DL et al., 2002/197
Scanlon PH et al., 2003/1542
Massin P et al., 2003/74
Boucher MC et al., 2003/79
Hansen AB et al., 2004/83
Murgatroyd H et al., 2004/293
Baeza DM et al., 2004/188
Schiffman RM et al., 2005/94
Phiri R et al., 2006/149
Rudnisky CJ et al., 2007/102
Baeza DM et al., 2009/216
Vujosevic S et al., 2009/55
Li HK et al., 2010/76
0.3 1.0SENSITIVITY
SPECIFICITY (95% CI)
Q =170.06, df = 14.00, p = 0.00
I2 = 91.77 [88.73 - 94.81]
0.92[0.88 - 0.95]
0.82 [0.71 - 0.91]
0.87 [0.84 - 0.90]
0.86 [0.79 - 0.92]
0.86 [0.84 - 0.88]
0.85 [0.74 - 0.92]
0.95 [0.85 - 0.99]
0.95 [0.76 - 1.00]
0.95 [0.92 - 0.97]
0.99 [0.96 - 1.00]
0.81 [0.63 - 0.93]
0.71 [0.60 - 0.81]
0.99 [0.94 - 1.00]
0.98 [0.95 - 0.99]
0.93 [0.76 - 0.99]
0.94 [0.71 - 1.00]0.94 [0.71 - 1.00]
Author , year / citation
COMBINED
Maberley D et al., 2002/100
Olson JA et al., 2002/545
Lin DL et al., 2002/197
Scanlon PH et al., 2003/1542
Massin P et al., 2003/74
Boucher MC et al., 2003/79
Hansen AB et al., 2004/83
Murgatroyd H et al., 2004/293
Baeza DM et al., 2004/188
Schiffman RM et al., 2005/94
Phiri R et al., 2006/149
Rudnisky CJ et al., 2007/102
Baeza DM et al., 2009/216
Vujosevic S et al., 2009/55
Li HK et al., 2010/76
0.3 1.0SPECIFICITY
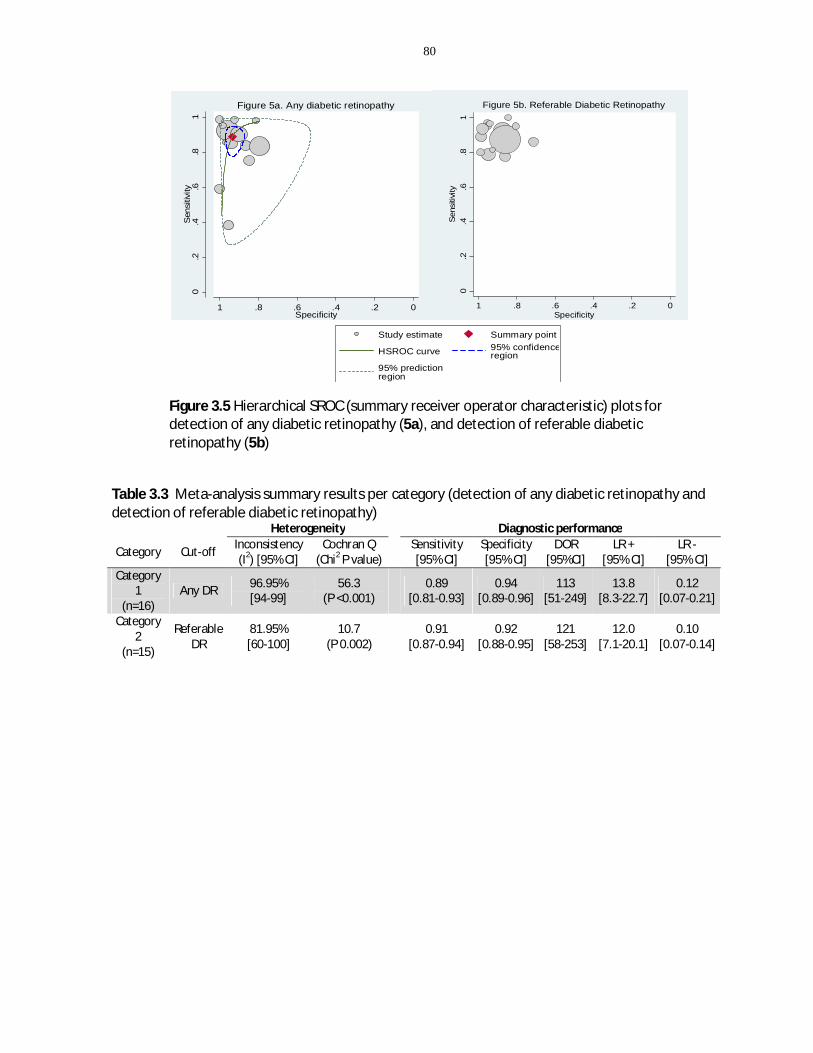
80
Figure 3.5 Hierarchical SROC (summary receiver operator characteristic) plots for detection of any diabetic retinopathy (5a), and detection of referable diabetic retinopathy (5b)
Table 3.3 Meta-analysis summary results per category (detection of any diabetic retinopathy and detection of referable diabetic retinopathy) Heterogeneity Diagnostic performance
Category Cut-off Inconsistency (I2) [95% CI]
Cochran Q (Chi2 P value)
Sensitivity [95% CI]
Specificity [95% CI]
DOR [95%CI]
LR + [95% CI]
LR - [95% CI]
Category 1
(n=16) Any DR 96.95%
[94-99] 56.3
(P <0.001) 0.89
[0.81-0.93] 0.94
[0.89-0.96] 113
[51-249] 13.8
[8.3-22.7] 0.12
[0.07-0.21]
Category 2
(n=15)
Referable DR
81.95% [60-100]
10.7 (P 0.002)
0.91 [0.87-0.94]
0.92 [0.88-0.95]
121 [58-253]
12.0 [7.1-20.1]
0.10 [0.07-0.14]
0.2
.4.6
.81
Sen
sitiv
ity
0.2.4.6.81Specificity
Figure 5a. Any diabetic retinopathy
Study estimate Summary point
HSROC curve 95% confidenceregion
95% predictionregion
0.2
.4.6
.81
Sen
sitiv
ity
0.2.4.6.81Specificity
Figure 5b. Referable Diabetic Retinopathy

81
Table 3.4. Subgroup analyses of potentially relevant covariates to explore heterogeneity
Number
of Heterogeneity
Sensitivity Specificity
studies Inconsistency (I2)
Cochrane Q (Chi2)
(95% CI) (95% CI)
Detection of any diabetic retinopathy
Overall analysis 16 97%
(94-99) 56.3
(<0.001) 0.89
(0.81-0.93)
0.94 (0.89-0.96)
Pharmacologic dilation
Yes/mixed 11 92% (82-100)
22.3 (<0.001)
0.91 (0.82-0.95)
0.95 (0.92-0.97)
No 4 94% (88-99)
30.4 (<0.001)
0.84 (0.66-0.93)
0.91 (0.68-0.98)
Number of fields
Multiple 13 56% (0-100)
4.5 (0.052)
0.91 (0.88-0.95)
0.93 (0.90-0.97)
Single* 3 - - - - Gold standard
7-field ETDRS photographs 4 72%
(37-100) 6.99
(0.015) 0.96
(0.93-1.00) 0.93
(0.86-1.00)
Slit-lamp biomicroscopy 12 97% (93-99)
50.65 (<0.001)
0.84 (0.76-0.91)
0.94 (0.90-0.97)
Risk of patient selection bias
Low risk 12 90% (79-100)
19.3 (<0.001)
0.88 (0.82-0.95)
0.94 (0.89-0.97)
Uncertain/High risk 4 95% (90-99)
38.3 (<0.001)
0.92 (0.57-0.99)
0.94 (0.78-0.98)
Detection of referable diabetic retinopathy Overall analysis 15 82% 10.7 0.91
0.92

82
(60-100) (0.002) (0.87-0.94) (0.88-0.95) Pharmacologic dilation
Yes/mixed 8 74%
(42-100) 7.6
(0.011) 0.92
(0.88-0.95) 0.95
(0.88-0.98)
no 7 60%
(10-100) 5.0
(0.041) 0.87
(0.82-0.93) 0.89
(0.82-0.96) Number of fields
Multiple 11 72%
(38-100) 7.2
(0.014) 0.93
(0.89-0.95) 0.94
(0.89-0.97)
Single 4 79%
(95-100) 9.5
(0.004) 0.82
(0.74-0.88) 0.86
(0.75-0.93) Gold standard
7-field ETDRS photographs 10 69%
(29-100) 6.29
(0.022) 0.92
(0.88-0.95) 0.93
(0.88-0.97)
Slit-lamp biomicroscopy 5 77%
(47-100) 8.23
(0.008) 0.89
(0.84-0.95) 0.92
(0.86-0.98) Risk of patient selection bias
Low risk 10 84%
(65-100) 12.2
(0.001) 0.88
(0.84-0.92) 0.93
(0.87-0.97)
Uncertain/High risk 5 0%
(0-100) 0.004
(0.499) 0.94
(0.90-0.96) 0.88
(0.85-0.90) * Covariate analysis could not be conducted for this subgroup given the small number of studies (n <4)

83
Figure 3.6 Meta-regression of log diagnostic odds ratio (DOR) on year of study (independent variable) for A. Detection of any diabetic retinopathy and B. Detection of referable diabetic retinopathy
Figure 3.7 Funnel plot of standard error of log diagnostic odds ratio (logDOR) by logDOR for each study category to illustrate possible publication bias. Egger’s p-value < 0.05 indicates presence of small study effects
23
45
67
log
DO
R
2000 2002 2004 2006 2008 2010Year
B. Category 2 studies (Referable DR) A. Category 1 studies (Any DR) 2
34
56
78
log
DO
R
2000 2002 2004 2006 2008 2010Year
p- value 0.002 p- value 0.236
Egger’s test p-value 0.072 Egger’s test p-value 0.004
A. Category 1- Any Diabetic Retinopathy B. Category 2- Referable Diabetic Retinopathy

84
Chapter 4 Cost-effectiveness analysis of diabetic retinopathy screening with pharmacy-based tele-ophthalmology versus in-
person eye examination
Co-authorship
Coronado, AC; Zaric, GS; Martin, J; Malvankar-Mehta, MS; Hodge, WG

85
4.1 Introduction
Diabetic retinopathy (DR) is a sight threatening complication in patients with diabetes
mellitus, and is usually asymptomatic in early stages1–3. According to recent
investigations, 2.5% of diabetic patients worldwide suffer severe vision loss derived
from DR, being this the leading cause of blindness among working-aged individuals.4,5
Regular eye examination is fundamental to detect DR progression and to promote
timely therapeutic interventions.6 Laser photocoagulation for example, is an effective
treatment for DR with 52% of patients experiencing reduction of severe vision loss if
they receive treatment after timely diagnosis of sight-threatening DR.7,8
Unfortunately, less than 50% of diabetic patients follow the eye examination guidelines
by the American Academy of Ophthalmology9, resulting in lost opportunities to prevent
severe vision loss by means of adequate treatment delivery.5,10,11 Besides non-
modifiable factors, limited availability of eye care specialists, travelling difficulties and
time constraints are also well-known reasons for non-adherence in non-urban areas.12–
15
Within this context, pharmacy-based tele-ophthalmology has emerged as a possible
alternative that may facilitate compliance with evidence-based recommendations and
reduce barriers to specialized eye care.16–18 In this program, retinal digital images are
captured in a local pharmacy and securely transmitted electronically to a specialized
reading centre, where photographs are graded by an eye specialist.19 Patients with signs
of DR can then be referred to an eye-care professional for comprehensive assessment.20
Thus, the workload of routine eye examination is transferred to other (presumably less
expensive) settings, optimizing the use of specialized eye-care services. In addition, this
approach eliminates unnecessary traveling for patients and eye care professionals, and
it may improve the consistency of community-based eye care delivery without
geographic constraints.17,21

86
Cost-effectiveness of new technologies should be explored before implementation in
specific settings in order to facilitate estimation of the eventual costs of introducing new
technologies, as well as their potential benefits compared with competing
alternatives.22 Amongst cost-effectiveness studies conducted in the DR screening arena,
few have evaluated tele-ophthalmology as an alternative for in-person examination.23–27
Thus, the objective of this study was to estimate the cost-effectiveness of mobile tele-
ophthalmology screening compared to primary care examination for the diabetic
population residing in non-urban areas of Southwestern Ontario (Canada). Our primary
interest was to assess the additional cost per case detected of any diabetic retinopathy
with pharmacy-based tele-ophthalmology on an annual basis from the health system
perspective. Unlike previous studies, we consider a more realistic scenario in which the
tele-ophthalmology program would not entirely replace in-person examination, while
also accounting for the effects of performing a dilated or non-dilated examination with
tele-ophthalmology.
4.2 Methods
4.2.1 Study setting
The economic analysis was designed for the South-western Ontario context, specifically
non-urban areas at the Erie-St. Clair Local Health Integration Network (LHIN).28 Such
non-urban areas have limited specialized eye-care and diabetic care, in which a
pharmacy-based tele-ophthalmology system may be of benefit, as it would help
reaching diabetic individuals who otherwise would not get an eye examination.29 As of
2011, the census subdivision contemplated in this study (Chatham-Kent) reported a
total of 103,671 habitants (population density of 14.2 people per km2), from which
10,354 are type I or type II diabetic persons over 20 years old.30,31 An explicitly urban
model (ie Toronto) was not chosen based on the assumption that in-person exams
would be relatively easy to access in this setting. An explicitly rural model (Canada’s far
north) was not chosen since tele-ophthalmology may be the only alternative in such

87
locations. However, there is true equipoise in understanding the cost-effectiveness of
this program in a context such as the Erie-St Clair LHIN.
4.2.2 Decision-tree model and study interventions
A decision-tree was elaborated using TreeAge Pro Suite 2013 (TreeAge Software, Inc,
Williamstown, Massachusetts), to compare primary care examination (comparator
program) versus pharmacy-based tele-ophthalmology (intervention program). 32 A
simplified diagram of the decision-tree is provided in Figure 4.1 (for the full model, refer
to appendix G). In the analytical framework, we assumed that the pharmacy-based tele-
ophthalmology program coexisted along with the reference program, increasing the
volume of DR examinations (Figure 4.1, arm 2) but did not entirely replace in-person
examination. This assumption aligns to the purpose of the tele-ophthalmology program
to complement existing eye-care services.
The model was tailored for a mixed cohort of adults with type I or type II diabetes. The
outcome of interest was the detection of any diabetic retinopathy, manifested by at
least one micro-aneurysm (ETDRS ≥ 20).33 This health outcome was chosen based on the
goal of identifying both early and advanced stages of DR, which would promote an
appropriate follow-up or timely treatment, if necessary.
Our interest focused on the potential ability of pharmacy-based tele-ophthalmology to
strengthen diabetic retinopathy screening coverage at a reasonable cost. Thus, our
analysis was restricted to the correct detection of DR cases, as opposed to incorporating
treatment effects and disease progression into the model. A heath care system
perspective was adopted, where consequences and direct costs pertaining to each
program were included based on a 12-month time frame.
Intervention: Pharmacy-based tele-ophthalmology
The economic model was designed for the evaluation of a category 1 tele-
ophthalmology screening program, used to identify patients with no (or minimal) DR

88
and patients with more than minimal DR.16 We considered the introduction of a part-
time mobile retinal unit, operating on a rotational basis among regional pharmacies at
the main municipalities of Chatham-Kent. In this model, clinical history and 45 degree
digital photographs were taken from each eye by an ophthalmic photographer and
pharmacologic dilation with tropicamide or phenilephrine was optional. Readable digital
images were sent via electronic communications to the reading center at St. Joseph’s
hospital in London (ON) for assessment by a retina specialist. Patients with positive
findings were referred to a retina specialist for a diagnostic confirmation with
angiography and optical coherence tomography. Similarly, patients with unclear fundus
photographs were referred to in-person examination with the retina specialist for
further assessment.
Comparator: In-person examination (primary care)
The primary care screening was defined as a dilated fundus examination performed by a
primary care eye specialist (either an optometrist or ophthalmologist). Patients with
positive results were referred to a retina specialist for a comprehensive eye examination
with angiography and optical coherence tomography.
4.2.3 Identification and calculation of model probabilities
Probabilities used in the base-case model are shown in Table 4.1. Prevalence of any DR
(22.5%) was calculated using public reports by the Public Health Agency of Canada and
the National Coalition for Vision Health.34,35 Screening rate with the reference program
in Arm 1 (P(ref)) was considered to be identical to the eye examination rate after
diagnosis of diabetes in Ontario (51.1%).36 After the introduction of the new screening
intervention (appendix G, Arm 2), the patient had two screening alternatives (in-person
examination or telescreening) and would choose according to preference for one or the
other. The option of no screening was also included in both arms of the model. Hence,
to calculate the screening rate of tele-ophthalmology examinations (P(tele)), we used the
following formula that considered the increased screening compliance after the

89
introduction of tele-ophthalmology (V) and the proportion of screening examinations
with tele-ophthalmology based on screening preference (T), as follows
P(tele)= T ( P(ref) х V ) , V ≥ 1, P(tele) <1 (1)
In this equation, “P(ref) х V” is the overall screening rate for Arm 2, and “P(tele)” is the
proportion of those examinations from Arm 2 that correspond to tele-ophthalmology
screening.
Both patients’ preferences (T) and screening compliance after tele-ophthalmology (V)
were derived from published literature. For this purpose, a structured literature search
was performed among Medline and EMBASE databases using the subject headings
“telemedicine”, “mobile health units”, “mass screening”, “early diagnosis”, “community
pharmacy service” (appendix H). Priority was given to studies from primary care
screening services using mobile screening units in urban or semi-urban settings. For the
base-case model, the volume increase in DR examinations after tele-screening (V) was
set to 10%, with 40% of patients favoring pharmacy-based telescreening examination
over the comparator.18,37,38 Hence, the base-case screening probability for the tele-
ophthalmology arm (Figure 4.1, Arm 2) was 0.562. For detailed calculations of model
probabilities, refer to appendix I.
Estimates of the diagnostic performance of tele-ophthalmology were obtained from a
recent meta-analysis39 that separately reported the summary results according to
diagnostic threshold. Therefore, we used the summary sensitivity and specificity
corresponding to the assessment of any DR, and derived the diagnostic performance of
in-person examination from one of the included studies.40 We also used this data to
calculate the proportion of unreadable images with tele-ophthalmology with and
without pharmacologic dilation. Finally, the proportion of dilated examinations was
obtained from a study that used pharmacy-based tele-ophthalmology for DR screening
across Canadian provinces.41 It was assumed that pupil dilation with tropicamide or

90
phenylephrine was performed by the pharmacist at the patient’s discretion. All
probabilities used in the economic model are outlined in appendix J
4.2.4 Identification and calculation of model costs
Data sources for estimates of costs included published literature, market prices,
vendor’s quotations, official government reports and administrative information from
St. Joseph’s Healthcare in London (ON). Only direct costs were incorporated into the
model and presented in 2013 Canadian dollars.
Cost information is provided in Table 4.2. Equipment for the tele-ophthalmology
program consisted of a non-mydriatic digital fundus camera, a carrying case, an
adjustable table, a laptop and reading software. Costs related to equipment and
maintenance were obtained directly from the vendor and was given a 5 year life
(written communication, 2013). Capital costs were annualized at a 5% discount rate per
year, corresponding to the rate for Ontario government bonds.42 In contrast, capital
costs for in-person examination were not included, as the ophthalmoscope and lens are
already bought and routinely used for any eye examination.
Traveling costs of the mobile retinal unit consisted on van rental cost (including
insurance) and fuel expenses for traveling across the Chatham-Kent municipality. Rental
costs estimates were provided from the vendor; fuel costs were obtained from the
Ontario Ministry of Energy report and reflected the cost per gallon in Ontario.43
Pharmacy overhead costs were calculated from the annual Pharmacy Trends Reports,
which provided information on annual operating expenses per square foot among
Canadian pharmacies.44 Thus, we adjusted the cost to the part-time use of pharmacy
space in 2013 Canadian dollars.
Technician costs for tele-ophthalmology were based on current prevailing wages
provided by administrators at St. Joseph’s Hospital in London (written communication,
2013). To estimate the labor cost per patient assessment, a structured literature search
was conducted with Medline and EMBASE to find economic studies on DR screening

91
that reported information on average minutes of labor cost per patient. Subject
headings included “diabetic retinopathy”, “diagnostic imaging”, “cost allocation”,
“healthcare costs” (appendix K). Six studies calculated the average minutes spent by
personnel for taking and/or assessing eye photographs, which varied between 5 and 15
minutes.24,45–49 Based on this information, we extrapolated the cost per hour of
technician labour to the cost per patient assessment with the tele-ophthalmology
program.
In-person consultation fees for major eye examination were obtained from the Schedule
of Benefits of Physician Services by the Ontario Ministry of Health and Long-term care.50
The ophthalmic reader fee was based on the tele-consultation fee provided by the
Alberta Healthcare Insurance Plan for pediatricians and related subspecialties.51 It was
assumed that an Ontario tele-consultation fee for DR assessment would resemble that
of Alberta for tele-consultation in pediatric specialties. Patient referral costs and
consumables costs were obtained from vendors’ quotations and administrative
information from St. Joseph’s Health Care (London, ON).
4.2.5 Cost-effectiveness evaluation and sensitivity analysis
Two measures of effectiveness were analyzed in this study; (1) cases of any DR detected
(true positives) and (2) cases correctly diagnosed (including true positives and true
negatives). A case of DR was defined as any DR beyond very mild non-proliferative DR,
corresponding to a Modified Airlie House Classification ≥20 on the reference standard.33
Cost- effectiveness was calculated as total cost divided by number of cases detected (or
number of cases correctly diagnosed). Thus, the Incremental Cost Effectiveness Ratio
(ICER) was calculated as the extra cost needed to generate (1) an additional case of DR
or (2) an additional case correctly diagnosed after the implementation of pharmacy-
based tele-ophthalmology.52
Deterministic Sensitivity Analysis

92
Parameters considered as potential drivers of the model were included in sensitivity
analysis, and were assigned plausible ranges based on 95% confidence intervals or
upper and lower 25% limits around the base-case value. For simplicity we limited the
reporting of sensitivity analyses to the cost per case detected per year.
One way sensitivity analyses were conducted for most data elements to investigate the
extent to which each variable’s uncertainty affected the model results. Variables
considered for one-way sensitivity analysis with their respective ranges are listed in
Table 4.1 (model probabilities) and Table 4.3 (model costs). A multi-way sensitivity
analysis was also performed, where model parameters were varied simultaneously to
generate extreme scenarios.
4.3 Results
4.3.1 Base-case analysis
In the base-case analysis we considered a tele-ophthalmology program that achieved a
10% volume increase in patient compliance, with a 0.18 probability of unreadable
images and pharmacologic dilation in 33% of examinations. Considering a population of
10,354 diabetic patients, the tele-ophthalmology program would correctly detect
additional 136 cases compared to in-person examination only (Table 4.4). Cost-
effectiveness was assessed as (1) cost per case detected, and (2) cost per case correctly
diagnosed. For (1) the cost-effectiveness of in-person examination and tele-
ophthalmology was $510 and $478.3, respectively, whereas for (2) was $107 for in-
person examination and $73.2 for tele-ophthalmology. The incremental cost-
effectiveness (ICER) was $314.1 per additional case detected and $102 per additional
case correctly diagnosed (Table 4.5). In both instances the programs were non-
dominant; hence, tele-ophthalmology was always more costly, but more effective than
in-person examination. (Figure 4.2).

93
4.3.2 Sensitivity analyses
Sensitivity analyses assessed uncertainties of model parameters, including diagnostic
accuracy, DR prevalence, compliance and costs. Results of multiple one-way sensitivity
analyses are outlined in Table 4.6. We found that the model was stable with regards to
sensitivity, specificity and prevalence variations. Similar to a previous study,53 workforce
wages played a significant role in the cost-effectiveness of both screening programs. In
the case of tele-ophthalmology, we observed that the ICER doubled its base-case value
when the image reader’s fee (retina specialist) increased from $31.6 to $55.4 per
patient. This parameter is an important source of uncertainty since Ontario currently
does not have a tele-ophthalmology code that could serve as a reference for the model.
For the base-case scenario we used a proxy code from the Alberta Schedule of Medical
Benefits (code 03.05JJ).54 This code is used by pediatricians (including subspecialties) if
they provided a five minute evaluation or consultation by telephone or other
telecommunication methods, which is similar to the service a retina specialist would
provide in a category 1 tele-ophthalmology program.
Conversely, if the in-person examination fee increased from $51.1 to $78 per person,
tele-ophthalmology program dominated at a cost of $603 per true positive case
detected compared to $737 per case detected with in-person examination.
Other influential variables in the tele-ophthalmology program included the proportion
of unreadable images (without pupil dilation) and the grader fee. When the proportion
of unreadable images increased to 0.43, the ICER also increased to $411.2 per additional
case detected per year. Similarly, when the tele-ophthalmology grader fee per patient
incremented up to 25%, the ICER also increased to $633.9 per additional case detected
per year.
A two-way sensitivity analysis was conducted to estimate the joint influence of
screening volume and patients’ preferences on the cost-effectiveness of pharmacy-
based tele-ophthalmology. As expressed in equation (1), both parameters were used to
calculate the screening rate for both programs under the assumption that the two

94
screening alternatives were available to the patients after the introduction of tele-
ophthalmology (Arm 2). We defined a tele-ophthalmology preference range from 10%
to 100% and considered a volume increase of 10% (base-case) 15% and 20%. Tele-
ophthalmology remained non-dominant in all combinations (Figure 4.3). Of note, the
lowest ICER was achieved when all screened patients used pharmacy-based tele-
ophthalmology ($192 per additional case detected per year).
In the extreme scenario analyses, both costs and probabilities were manipulated to
generate alternative settings that would represent the best and the worst scenario for
the introduction of pharmacy-based tele-ophthalmology. In the best-case scenario,
influential parameters were defined as follows: patient preference for tele-screening
increased to 0.70 (assuming all patients had a dilated examination), tele-screening
diagnostic performance was defined according to upper 95% confidence intervals for
sensitivity and specificity (Se 91%, Sp 97%), while in-person examination was set to its
lowest diagnostic performance (Se 67% Sp 79%). Also, the rate of unreadable images for
tele-ophthalmology was fixed at its lowest value (3.3%). Finally, fees corresponding to
the tele-ophthalmology coordinator, ophthalmic photographer and the retina expert
grading were reduced by 15% ($20.5, $20.5 and $23.75 respectively). We found that
tele-ophthalmology dominated at $367.6 per case detected per year, being less costly
and more effective than in-person examination ($575.1 per case detected per year).
Alternatively, the worst case scenario was fixed under the poorest diagnostic
performance for tele-screening (Se 76%; Sp 90%) and the best sensitivity and specificity
values for in-person examination (Se 83%; Sp 86%), the highest rate of unreadable
images (43.5%) and a 15% increase in the coordinator, eye photographer and retina
expert fee ($34.21, $34.21 and $55.21, respectively). In this scenario, tele-
ophthalmology remained undominated although the incremental cost-effectiveness was
four times higher than the base-case ($1,393 per additional case detected per year).

95
4.4 Discussion
4.4.1 Cost-effectiveness of tele-ophthalmology
The detection of DR by means of tele-ophthalmology programs has proven to be a cost-
effective alternative amongst isolated communities, generating savings through lower
transportation and personnel costs.17,25 In terms of total annual costs, the introduction
of tele-ophthalmology was more expensive than in-person examination but detected
15% more cases of any DR at $314.1 per additional case. In the Chatham-Kent context,
this was translated to 528 more patients attending eye examination, and 136 additional
DR cases detected.
A previous study assessed the cost-effectiveness of systematic photographic screening
versus opportunistic eye examination in the UK.46 Adjusted to 2013 Canadian dollars,
the incremental cost per additional DR case detected was $83, which was regarded as
cost-effective within the British healthcare system. In comparison, the incremental cost-
effectiveness of tele-ophthalmology may be too high to consider its implementation in a
semi-urban context. However, if an exclusive use of tele-ophthalmology is assumed, the
ICER would be reduced to $192 per case detected, almost half of the base-case value
and closer to the acceptable cost-effectiveness estimate reported by James and
colleagues.46
4.4.2 Sensitivity analyses
Sensitivity analyses showed an important influence of healthcare specialists’ fees for in-
person examination and interpretation of retinal images. As expected, the ICER
increased as the fee of retinal image readers increased up to 15% its base-case value.
Alternatively, when in-person examination cost reached $78 per patient, tele-
ophthalmology became less costly and more effective, dominating over in-person
examination.
Undilated tele-screening examinations showed a higher rate of unreadable images,
which affected the incremental cost-effectiveness of the program. Although pupil

96
dilation may improve image quality and lower the costs, it may prevent patients for
getting screened at the pharmacy, as reported in previous studies.41,55 Hence, the option
of including pharmacologic dilation will depend on the overall goal of the tele-
ophthalmology program.16 For example, if the primary concern is to assess more
patients, then a program without pharmacologic dilation would be convenient, at the
expense of increasing the proportion of unreadable images.
4.4.3 Comparison to previous evidence
In contrast to our findings, other studies have reported tele-ophthalmology to be highly
cost-effective or even dominant at the base-case analysis.24,56,57 However, comparisons
of our results with prior published studies are not straightforward due to differences in
effectiveness outcomes and model assumptions. For instance, Whited and collaborators
used data from three US agencies to build nine economic models based on the Joslin
Vision tele-ophthalmology system.24 Tele-ophthalmology dominated clinic-based
ophthalmoscopy in seven models, and was cost-effective at extra $1,618 (2004 US
dollars) per additional case treated in the remaining two models. In contrast to our
model, this study assumed an exclusive initial use of the tele-ophthalmology alternative,
and its diabetic population was eight to twenty times bigger than in Chatham-Kent,
assuring maximum efficiency of both labor and equipment.
In the Canadian context, Maberley et al.,25 evaluated the introduction of a tele-
ophthalmology system in a First Nations community, where retina specialists traveled
twice a year to make eye-examinations. Similarly, Aoki et al., assessed the introduction
of a tele-ophthalmology program in a remote US prison versus current practice
consisting on sporadic eye examinations by eye specialists.56 Both studies assessed the
cost-effectiveness of an alternative tele-ophthalmology program in terms of quality-
adjusted life-years (QALY), and found tele-ophthalmology to be dominant over current
practice.25,56 The context in which these studies were framed differs greatly from the
semi-urban scenario used in our model, as they assumed an exclusive use of the tele-
ophthalmology program. Costs of in-person examinations are superior in remote areas,

97
as usually includes transportation costs of either patients or healthcare personnel to
meet eye-screening needs. Hence, the capital cost of the tele-ophthalmology program is
by far justified in isolated communities through lower personnel and transportation
costs.
4.4.4 Strengths and limitations
To our knowledge, this is the first study that models the introduction of a tele-screening
program in a semi-urban population without considering exclusive initial use of this
technology. Although the exclusivity assumption is commonly used in cost-effectiveness
analyses, it is very unlikely that a new tele-ophthalmology program would entirely
replace in-person examination in a context where primary care professionals are
permanently available.18,19 We also contemplated key variables of tele-ophthalmology
systems such as need for pharmacologic dilation and rate of unreadable images, and
evaluated their influence on the cost-effectiveness of a category 1 tele-ophthalmology
program.16
Our model has some limitations worth noting. First, the present study was tailored to
the Chatham-Kent community. Patient pool size and prevalence was captured from
provincial reports; costs were derived from provincial information and administrative
data from St. Joseph’s healthcare in London (ON). Although aligned with the study
objectives, such specificity limits the applicability of these results to other settings.
However, the model structure of this analysis can be used in upcoming studies for the
evaluation of DR screening programs in similar geographic contexts. Second, the study
was conducted from a healthcare payer perspective, and indirect costs were not
included. Nonetheless, a societal perspective would likely favor the implementation of
tele-ophthalmology due to the inclusion of travel costs avoided and reduced time away
from work.59 Third, we used number of true positive cases detected (and number of
cases correctly diagnosed) as our effectiveness outcome. Although this is a clinically
intuitive measure that provides useful insight regarding the comparative cost-
effectiveness of interventions, it does not reflect the full effectiveness of the program as

98
it does not take into consideration the therapeutic endpoint (e.g cases of blindness
averted, prevention of SVL). It also limited the direct comparison of our results with
other studies that used preference-based measures (e.g QALYs).
4.4.5 Study applicability
This study opens the discussion as if the benefits of mobile tele-ophthalmology in semi-
urban areas are equivalent to those benefits observed in remote populations. In a semi-
urban community, the implementation of tele-ophthalmology would be almost three
times more expensive compared to a context where the tele-ophthalmology program is
assumed to be exclusive. Although our results suggest increased benefits of tele-
ophthalmology versus in-person examination in terms of more patients being screened
and additional DR cases being detected, the incremental cost of $314 per case may be
considered too high to be implemented in a publicly funded healthcare system. This is
largely due to the fact that the healthcare payer would still have to support in-person
examination in addition to the new telescreening program, especially during early
stages of program execution.
If stakeholders are interested in investing on a telescreening program in a semi-urban
context, a comprehensive discussion about potential strategies to reduce screening
costs should be in order.60 From the sensitivity analyses, we found that eye specialist
fees and pupil dilation are the most influential factors in the cost-effectiveness of the
tele-ophthalmology program. Given that pharmacologic dilation reduces the proportion
of unnecessary referrals due to unreadable images, a program with pupil dilation to all
patients will improve cost-effectiveness. Also, the automated detection of DR lesions is
an alternative to the manual assessment of digital images by a specialist.61
It is worth noting that our interpretation is based on the incremental cost per case
detected. Clinical outcomes such as cases of SVL averted or cases of blindness prevented
were out of the scope of this study. Economic studies based on rural communities have
found an increased benefit of tele-ophthalmology in terms of clinical outcomes and
quality of life.25,47,62,63 It is possible that tele-ophthalmology may offer great benefits in

99
terms of cases of SVL averted or QALYs in a semi-urban context, which would justify the
initial investment in equipment and labor. Further studies should expand on the analysis
based on these important clinical endpoints to gain a better understanding about the
overall benefits of tele-ophthalmology in the semi-urban context.
4.5 References
1. Klein R, Klein BE, Moss SE, Cruickshanks KJ. The Wisconsin Epidemiologic Study of
diabetic retinopathy. XIV. Ten-year incidence and progression of diabetic retinopathy.
Archives of ophthalmology. 1994;112(9):1217–28. Available at:
http://www.ncbi.nlm.nih.gov/pubmed/7619101. Accessed January 14, 2013.
2. Wong TY, Mwamburi M, Klein R, et al. Rates of progression in diabetic retinopathy
during different time periods: a systematic review and meta-analysis. Diabetes care.
2009;32(12):2307–13. Available at:
http://www.pubmedcentral.nih.gov/articlerender.fcgi?artid=2782996&tool=pmcentrez
&rendertype=abstract. Accessed January 15, 2013.
3. Yau JWY, Rogers SL, Kawasaki R, et al. Global prevalence and major risk factors of
diabetic retinopathy. Diabetes care. 2012;35(3):556–64. Available at:
http://www.ncbi.nlm.nih.gov/pubmed/22301125. Accessed August 20, 2012.
4. Chew EY, Ferris FL, Csaky KG, et al. The long-term effects of laser photocoagulation
treatment in patients with diabetic retinopathy: the early treatment diabetic
retinopathy follow-up study. Ophthalmology. 2003;110(9):1683–1689. Available at:
http://www.mrw.interscience.wiley.com/cochrane/clcentral/articles/455/CN-
00440455/frame.html.
5. Porta M, Bandello F. Diabetic retinopathyA clinical update. Diabetologia.
2002;45(12):1617–34. Available at:
http://www.springerlink.com/content/xub5ger6417g9m24/. Accessed August 16, 2012.

100
6. Hooper P, Boucher MC, Cruess A, et al. Canadian Ophthalmological Society Evidence-
based Clinical Practice Guidelines for the Management of Diabetic Retinopathy -
executive summary. Canadian journal of ophthalmology. Journal canadien
d’ophtalmologie. 2012;47(2):91–6. Available at:
http://www.ncbi.nlm.nih.gov/pubmed/22560411. Accessed June 16, 2012.
7. Mohamed Q, Gillies MC, Wong TY. Management of diabetic retinopathy: a systematic
review. JAMA : the journal of the American Medical Association. 2007;298(8):902–16.
Available at: http://www.ncbi.nlm.nih.gov/pubmed/17712074. Accessed August 11,
2013.
8. Hazin R, Barazi MK, Summerfield M. Challenges to establishing nationwide diabetic
retinopathy screening programs. Current Opinion in Ophthalmology. 2011;22(3):174–
179. Available at:
http://ovidsp.ovid.com/ovidweb.cgi?T=JS&PAGE=reference&D=emed10&NEWS=N&AN
=2011222852.
9. American Academy of Ophthalmology. Diabetic Retinopathy Preferred Practice
Pattern Guidelines. San Francisco, CA; 2008:39. Available at:
http://one.aao.org/CE/PracticeGuidelines/PPP_Content.aspx?cid=d0c853d3-219f-487b-
a524-326ab3cecd9a.
10. Brechner RJ, Cowie CC, Howie LJ, Herman WH, Will JC, Harris MI. Ophthalmic
examination among adults with diagnosed diabetes mellitus. JAMA : the journal of the
American Medical Association. 1993;270(14):1714–8. Available at:
http://www.ncbi.nlm.nih.gov/pubmed/8411502. Accessed April 9, 2013.
11. Liu WJ, Lee LT, Yen MF, et al. Assessing progression and efficacy of treatment for
diabetic retinopathy following the proliferative pathway to blindness: implication for
diabetic retinopathy screening in Taiwan. Diabetic medicine : a journal of the British
Diabetic Association. 2003;20(9):727–733. Available at:

101
http://ovidsp.ovid.com/ovidweb.cgi?T=JS&PAGE=reference&D=emed6&NEWS=N&AN=
12925052.
12. Li-Sheng C, Ching-Yao T, Tzeng-Ying L, et al. Feasibility of tele-ophthalmology for
screening for eye disease in remote communities. Journal of telemedicine and telecare.
2004;10(6):337–341. Available at:
http://ovidsp.ovid.com/ovidweb.cgi?T=JS&PAGE=reference&D=med4&NEWS=N&AN=1
5603631.
13. Bahaadinbeigy K, Yogesan K, Wootton R. A survey of the state of telemedicine in
Western Australia. Journal of telemedicine and telecare. 2010;16(4):176–80. Available
at: http://www.ncbi.nlm.nih.gov/pubmed/20511567. Accessed March 1, 2013.
14. Yogesan K, Constable IJ, Eikelboom RH, Saarloos PP. Tele-ophthalmic screening using
digital imaging devices. Australian and New Zealand Journal of Ophthalmology.
1998;26:S9–S11. Available at: http://doi.wiley.com/10.1111/j.1442-
9071.1998.tb01385.x. Accessed April 7, 2013.
15. Maberley D, Cruess AF, Barile G, Slakter J. Digital photographic screening for diabetic
retinopathy in the James Bay Cree. Ophthalmic Epidemiology. 2002;9(3):169–178.
Available at: http://informahealthcare.com/doi/abs/10.1076/opep.9.3.169.1517.
Accessed August 22, 2012.
16. Li HK, Horton M, Bursell S-E, et al. Telehealth practice recommendations for diabetic
retinopathy, second edition. Telemedicine journal and e-health : the official journal of
the American Telemedicine Association. 2011;17(10):814–37. Available at:
http://www.ncbi.nlm.nih.gov/pubmed/21970573. Accessed June 16, 2012.
17. Tang RA, Morales M, Ricur G, Schiffman JS. Telemedicine for eye care. Journal of
telemedicine and telecare. 2005;11(8):391–6. Available at:
http://www.ncbi.nlm.nih.gov/pubmed/16356312. Accessed April 7, 2013.

102
18. Olayiwola JN, Sobieraj DM, Kulowski K, Hilaire S, D, Huang JJ. Improving diabetic
retinopathy screening through a statewide telemedicine program at a large federally
qualified health center. Journal of health care for the poor and underserved.
2011;22(3):804–816. Available at:
http://ovidsp.ovid.com/ovidweb.cgi?T=JS&PAGE=reference&D=medl&NEWS=N&AN=21
841280.
19. Bursell S-E, Brazionis L, Jenkins A. Telemedicine and ocular health in diabetes
mellitus. Clinical & experimental optometry : journal of the Australian Optometrical
Association. 2012;95(3):311–27. Available at:
http://www.ncbi.nlm.nih.gov/pubmed/22594547. Accessed March 18, 2013.
20. Kumar S, Yogesan K, Constable IJ. Telemedical diagnosis of anterior segment eye
diseases: validation of digital slit-lamp still images. Eye. 2009;(3):652–660.
21. Lamminen H, Voipio V, Ruohonen K, Uusitalo H. Telemedicine in ophthalmology.
Acta Ophthalmologica Scandinavica. 2003;81(2):105–109. Available at:
http://www.blackwell-synergy.com/links/doi/10.1034/j.1600-0420.2003.00045.x.
Accessed April 7, 2013.
22. Marshall DA, Douglas PR, Drummond MF, et al. Guidelines for conducting
pharmaceutical budget impact analyses for submission to public drug plans in Canada.
PharmacoEconomics. 2008;26(6):477–95. Available at:
http://www.ncbi.nlm.nih.gov/pubmed/18489199. Accessed January 9, 2012.
23. Rein DB, Wittenborn JS, Zhang X, et al. The cost-effectiveness of three screening
alternatives for people with diabetes with no or early diabetic retinopathy. Health
services research. 2011;46(5):1534–61. Available at:
http://www.mrw.interscience.wiley.com/cochrane/cleed/articles/NHSEED-
22011001586/frame.html. Accessed November 7, 2012.

103
24. Whited JD, Datta SK, Aiello LM, et al. A modeled economic analysis of a digital
teleophthalmology system as used by three federal healthcare agencies for detecting
proliferative diabetic retinopathy (Structured abstract). Telemedicine and e-Health.
2005;11(6):641–651. Available at:
http://www.mrw.interscience.wiley.com/cochrane/cleed/articles/NHSEED-
22006000425/frame.html.
25. Maberley D, Walker H, Koushik A, Cruess A. Screening for diabetic retinopathy in
James Bay, Ontario: a cost-effectiveness analysis. CMAJ : Canadian Medical Association
journal = journal de l’Association medicale canadienne. 2003;168(2):160–4. Available at:
http://www.pubmedcentral.nih.gov/articlerender.fcgi?artid=140424&tool=pmcentrez&
rendertype=abstract. Accessed August 12, 2013.
26. Davies R, Roderick P, Canning C, Brailsford S. The evaluation of screening policies for
diabetic retinopathy using simulation (Structured abstract). Diabetic Medicine.
2002;19(9):762–770. Available at:
http://www.mrw.interscience.wiley.com/cochrane/cleed/articles/NHSEED-
22002001589/frame.html.
27. James M, Turner DA, Broadbent DM, Vora J, Harding SP. Cost effectiveness analysis
of screening for sight threatening diabetic eye disease. BMJ (Clinical research ed.).
2000;320(7250):1627–31. Available at:
http://www.pubmedcentral.nih.gov/articlerender.fcgi?artid=27406&tool=pmcentrez&r
endertype=abstract. Accessed July 23, 2013.
28. Health System Intelligence Project (HSIP). Population Profile: Erie-St.Clair LHIN.
Available at:
http://www.health.gov.on.ca/transformation/providers/information/resources/profiles
/profile_eriestclair.pdf.
29. Booth GL, Polsky JY, Gozdyra G, Cauch-Dudek K, Kiran T, Shah BR, Lipscombe LL GR.
Regional Measures of Diabetes Burden in Ontario. Toronto; 2012. Available at:

104
http://www.ices.on.ca/webpage.cfm?site_id=1&org_id=68&morg_id=0&gsec_id=0&ite
m_id=7448&type=report.
30. Booth G, Polsky J, Gozdyra P, et al. Regional Measures of Diabetes Burden in
Ontario. 2012.
31. Statistics Canada. Focus on Geograpgy Series, 2011 Census. In: Statistics Canada
Catalogue no. 98-310XWE2011004. Ottawa; 2012.
32. Barton P, Bryan S, Robinson S. Modelling in the economic evaluation of health care:
selecting the appropriate approach. Journal of health services research & policy.
2004;9(2):110–8. Available at: http://www.ncbi.nlm.nih.gov/pubmed/15099459.
Accessed October 3, 2013.
33. Anon. Grading diabetic retinopathy from stereoscopic color fundus photographs--an
extension of the modified Airlie House classification. ETDRS report number 10. Early
Treatment Diabetic Retinopathy Study Research Group. Ophthalmology. 1991;98(5
Suppl):786–806. Available at: http://www.ncbi.nlm.nih.gov/pubmed/2062513. Accessed
March 17, 2013.
34. Public Health Agency of Canada. Diabetes in Canada: Facts and figures from a public
health perspective. Ottawa; 2011. Available at: http://www.phac-aspc.gc.ca/cd-
mc/publications/diabetes-diabete/facts-figures-faits-chiffres-2011/highlights-saillants-
eng.php#chp1.
35. National Coalition for Vision Health. Foundations for a Canadian Vision Health
Strategy.; 2007:108.
36. Buhrmann R, Assaad D, Hux JE, Tang M, Sykora K. Diabetes and the Eye. In: Hux J,
Booth G, Slaughter P, Laupacis A, eds. Diabetes in Ontario: An ICES Practice Atlas.;
2003:193–208.

105
37. Wilson PJ, Ellis JD, MacEwen CJ, Ellingford A, Talbot J, Leese GP. Screening for
diabetic retinopathy: a comparative trial of photography and scanning laser
ophthalmoscopy. Ophthalmologica. Journal international d’ophtalmologie. International
journal of ophthalmology. Zeitschrift fur Augenheilkunde. 2010;224(4):251–257.
Available at:
http://ovidsp.ovid.com/ovidweb.cgi?T=JS&PAGE=reference&D=medl&NEWS=N&AN=20
145421.
38. Taylor CR, Merin LM, Salunga AM, et al. Improving diabetic retinopathy screening
ratios using telemedicine-based digital retinal imaging technology: the Vine Hill study.
Diabetes care. 2007;30(3):574–8. Available at:
http://www.ncbi.nlm.nih.gov/pubmed/17327323. Accessed May 10, 2012.
39. Coronado AC, Singh H, Martin J, Costella J, Malvankar-Mehta M, Hodge W.
Estimating the diagnostic accuracy of tele-ophthalmology for diabetic retinoapthy
screening: A meta-analysis. 2013:30.
40. Olson JA, Strachan FM, Hipwell JH, et al. A comparative evaluation of digital imaging,
retinal photography and optometrist examination in screening for diabetic retinopathy.
Diabetic Medicine. 2003;20(7):528–534. Available at:
http://doi.wiley.com/10.1046/j.1464-5491.2003.00969.x. Accessed May 10, 2012.
41. Boucher MC, Desroches G, Garcia-Salinas R, et al. Teleophthalmology screening for
diabetic retinopathy through mobile imaging units within Canada. Canadian journal of
ophthalmology. Journal canadien d’ophtalmologie. 2008;43(6):658–68. Available at:
http://www.ncbi.nlm.nih.gov/pubmed/19020631. Accessed April 28, 2013.
42. Walker D, Kumaranayake L. Allowing for differential timing in cost analyses:
discounting and annualization. Health policy and planning. 2002;17(1):112–8. Available
at: http://www.ncbi.nlm.nih.gov/pubmed/11861593. Accessed October 8, 2013.

106
43. Ontario Ministry of Energy. Ontario prices 2013 - cents per litre. 2013. Available at:
http://www.energy.gov.on.ca/en/fuel-prices/fuel-price-data/?fuel=reg&yr=2013.
44. Canadian Pharmacists Association, Canadian Association of Chain Drugstores. 10th
Annual Pharmacy Trend Report. Canada; 2003.
45. Gomez-Ulla F, Alonso F, Aibar B, Gonzalez F. A comparative cost analysis of digital
fundus imaging and direct fundus examination for assessment of diabetic retinopathy.
Telemedicine journal and e-health : the official journal of the American Telemedicine
Association. 2008;14(9):912–8. Available at:
http://www.ncbi.nlm.nih.gov/pubmed/19035800. Accessed October 9, 2013.
46. James M, Turner DA, Broadbent DM, Vora J, Harding SP. Cost effectiveness analysis
of screening for sight threatening diabetic eye disease (Structured abstract). BMJ.
2000;320(7250):1627–1631. Available at:
http://www.mrw.interscience.wiley.com/cochrane/cleed/articles/NHSEED-
22000008197/frame.html.
47. Sender Palacios MJ, Monserrat Bagur S, Badia Llach X, Maseras Bover M, De la
Puente Martorell ML, Foz Sala M. [Non mydriatic retinal camera: cost-effectiveness
study for early detection of diabetic retinopathy]. Medicina clínica. 2003;121(12):446–
52. Available at: http://www.ncbi.nlm.nih.gov/pubmed/14572368. Accessed October 9,
2013.
48. Lairson DR, Pugh JA, Kapadia AS, Lorimor RJ, Jacobson J, Velez R. Cost-effectiveness
of alternative methods for diabetic retinopathy screening. Diabetes care.
1992;15(10):1369–77. Available at: http://www.ncbi.nlm.nih.gov/pubmed/1425103.
Accessed October 9, 2013.
49. Porta M, Rizzitiello A, Tomalino M, et al. Comparison of the cost-effectiveness of
three approaches to screening for and treating sight-threatening diabetic retinopathy.

107
Diabetes & metabolism. 1999;25(1):44–53. Available at:
http://www.ncbi.nlm.nih.gov/pubmed/10335423. Accessed October 9, 2013.
50. Ministry of Health and Long-Term Care. Schedule of Benefits, Physician Services
Under the Health Insurance Act.; 2013.
51. Anon. Alberta Health Care Insurance Plan. Medical procedure list as of 01 April
2012.; 2012.
52. Rudmik L, Drummond M. Health economic evaluation: important principles and
methodology. The Laryngoscope. 2013;123(6):1341–7. Available at:
http://www.ncbi.nlm.nih.gov/pubmed/23483522. Accessed February 20, 2014.
53. MJS P, SM B, XB L, et al. Non mydriatic retinal camera: cost-effectiveness study for
early detection of diabetic retinopathy. Medicina clinica. 2003;121(12):446–452.
Available at:
http://ovidsp.ovid.com/ovidweb.cgi?T=JS&PAGE=reference&D=med4&NEWS=N&AN=1
4572368.
54. Anon. Alberta Health Care Insurance Plan. Medical procedure list as of 01 April
2012.; 2012.
55. Hulme SA, Tin-U A, Hardy KJ, Joyce PW. Evaluation of a district-wide screening
programme for diabetic retinopathy utilizing trained optometrists using slit-lamp and
Volk lenses. Diabetic medicine : a journal of the British Diabetic Association.
2002;19(9):741–745. Available at:
http://ovidsp.ovid.com/ovidweb.cgi?T=JS&PAGE=reference&D=med4&NEWS=N&AN=1
2207810.
56. Aoki N, Dunn K, Fukui T, Beck JR, Schull WJ, Li HK. Cost-effectiveness analysis of
telemedicine to evaluate diabetic retinopathy in a prison population. Diabetes care.
2004;27(5):1095–101. Available at:
108
http://www.mrw.interscience.wiley.com/cochrane/cleed/articles/NHSEED-
22004000677/frame.html. Accessed April 29, 2013.
57. David M, Andrew M, Dawn H, Angela C, Laura H, Naresh M. A comparison of digital
retinal image quality among photographers with different levels of training using a non-
mydriatic fundus camera. Ophthalmic epidemiology. 2004;11(3):191–197. Available at:
http://ovidsp.ovid.com/ovidweb.cgi?T=JS&PAGE=reference&D=med4&NEWS=N&AN=1
5370551.
58. García Serrano MJ, Asensi Blanch A, Farré Marimon JM, et al. [User satisfaction with
teleophthalmology with nonmydriatic camera for diabetic retinopathy screening].
Gaceta sanitaria / S.E.S.P.A.S. 23(4):322–5. Available at:
http://www.ncbi.nlm.nih.gov/pubmed/19286279. Accessed August 8, 2013.
59. Stefánsson E, Bek T, Porta M, Larsen N, Kristinsson JK, Agardh E. Screening and
prevention of diabetic blindness. Acta ophthalmologica Scandinavica. 2000;78(4):374–
85. Available at: http://www.ncbi.nlm.nih.gov/pubmed/10990036. Accessed February
10, 2014.
60. Zimmer-Galler IE, Horton M. Telehealth methods for diabetic retinopathy and
glaucoma: Clinical, Technical and business insights and strategies for sucessful tele-
ophthalmology programs. In: Association for Research in Vision and Ophthalmology
(ARVO) Education Course. Association for Research in Vision and Ophthalmology Inc.
2013:1–117.
61. D AM, M RJ, R RS, et al. Automated Early Detection of Diabetic Retinopathy.
Ophthalmology. 2010;(6):1147–1154.
62. Kirkizlar E, Serban N, Sisson JA, Swann JL, Barnes CS, Williams MD. Evaluation of
telemedicine for screening of diabetic retinopathy in the Veterans Health
Administration. Ophthalmology. 2013;120(12):2604–10. Available at:
http://www.ncbi.nlm.nih.gov/pubmed/24084501. Accessed February 14, 2014.

109
63. Javitt JC, Aiello LP. Cost-effectiveness of detecting and treating diabetic retinopathy.
Annals of internal medicine. 1996;124(1 Pt 2):164–9. Available at:
http://www.ncbi.nlm.nih.gov/pubmed/8554212. Accessed May 29, 2012.

110
4.6 Tables and figures
Table 4.1. Base case model parameters and parameter ranges
Parameter Value Range
(interval for DTA)
Source
Fixed Data Elements Diabetic population in study
setting 10,354
patients - Booth GL et al, 2012
Eye examination rate with current practice 0.511 - Buhrmann, Assaad, Hux, Tang, &
Sykora, 2003
Volume increase of screening compliance after tele-
ophthalmology is implemented
10% increase -
Olayiwola et al., 2011; Vargas-Sánchez, Maldonado-Valenzuela, Pérez-Durillo, González-Calvo, & Pérez-Milena, n.d
Variable Data Elements Prevalence of any DR in Canada
0.225 0.169 to 0.281
National Coalition for Vision Health, 2007; Public Health Agency of Canada,
2011 a) Screening intervention parameters (tele-ophthalmology)
Figure 4.1 Illustration of a portion of decision tree showing competing alternatives for diabetic retinopathy screening. Arm 1 corresponds to current practice (in-person examination); Arm 2 corresponds to the new intervention evaluated in the model (pharmacy-based tele-ophthalmology)
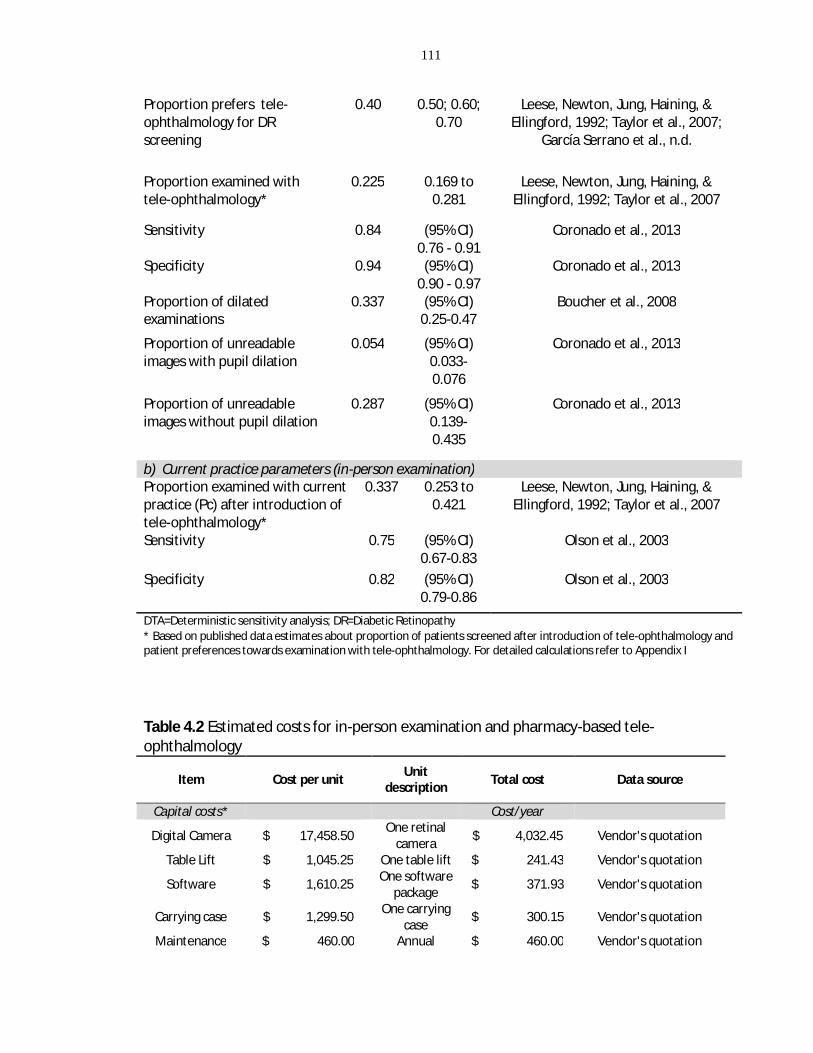
111
Proportion prefers tele-ophthalmology for DR screening
0.40 0.50; 0.60; 0.70
Leese, Newton, Jung, Haining, & Ellingford, 1992; Taylor et al., 2007;
García Serrano et al., n.d.
Proportion examined with tele-ophthalmology*
0.225 0.169 to 0.281
Leese, Newton, Jung, Haining, & Ellingford, 1992; Taylor et al., 2007
Sensitivity 0.84 (95% CI) 0.76 - 0.91
Coronado et al., 2013
Specificity 0.94 (95% CI) 0.90 - 0.97
Coronado et al., 2013
Proportion of dilated examinations
0.337 (95% CI) 0.25-0.47
Boucher et al., 2008
Proportion of unreadable images with pupil dilation
0.054 (95% CI) 0.033-0.076
Coronado et al., 2013
Proportion of unreadable images without pupil dilation
0.287 (95% CI) 0.139-0.435
Coronado et al., 2013
b) Current practice parameters (in-person examination) Proportion examined with current practice (Pc) after introduction of tele-ophthalmology*
0.337 0.253 to 0.421
Leese, Newton, Jung, Haining, & Ellingford, 1992; Taylor et al., 2007
Sensitivity 0.75 (95% CI) 0.67-0.83
Olson et al., 2003
Specificity 0.82 (95% CI) 0.79-0.86
Olson et al., 2003
DTA=Deterministic sensitivity analysis; DR=Diabetic Retinopathy * Based on published data estimates about proportion of patients screened after introduction of tele-ophthalmology and patient preferences towards examination with tele-ophthalmology. For detailed calculations refer to Appendix I
Table 4.2 Estimated costs for in-person examination and pharmacy-based tele-ophthalmology
Item Cost per unit Unit description Total cost Data source
Capital costs* Cost/year Digital Camera $ 17,458.50 One retinal
camera $ 4,032.45 Vendor's quotation
Table Lift $ 1,045.25 One table lift $ 241.43 Vendor's quotation
Software $ 1,610.25 One software package $ 371.93 Vendor's quotation
Carrying case $ 1,299.50 One carrying case $ 300.15 Vendor's quotation
Maintenance $ 460.00 Annual $ 460.00 Vendor's quotation

112
maintenance Camera transportation costs Cost/year
Van rent $ 91.07 One cargo van $ 1,092.84 Vendor's quotation
Fuel $ 1.27 One litre $ 76.26 Ontario Ministry of
Energy, Ontario prices 2013
Overhead costs† Cost/year
Pharmacy overhead costs $ 155.00
Annual expenditures
per square foot
$ 775.00 10th annual Pharmacy Trends Report, 2004
Labour costs Cost/patient Tele-ophthalmology
coordinator $ 24.18 Hourly wage£ $ 4.03ɸ St. Joseph's Hospital
administrative data
Photographer $ 24.18 Hourly wage£ $ 6.05ɸ St. Joseph's Hospital administrative data
Grader (ophthalmologist) $ 31.66 Consultation
per patient $ 31.66 Alberta Healthcare Insurance plan
Eye care specialist $ 51.10 Consultation
per patient $ 51.10 Ontario Ministry of
Health and Long-term Care
Consumables Cost/patient Referral to retina
specialist $ 111.31 Examination per patient $ 111.31 St. Joseph's Hospital
administrative data Dilation drops-
Tropicamide 1% $ 16.15 Cost per unit (15 ml) $ 0.54 St. Joseph's Hospital,
pharmacy data Dilation drops- phenylephrine
2.5% $ 4.82 Cost per unit
(5 ml) $ 0.120 St. Joseph's Hospital, pharmacy data
Chin covers $ 56.50 Cost per pack (500) $ 0.113 Vendor's quotation
*Annualized based on a 5-year life equipment and a 5% depreciation rate †Based on average annual pharmacy overhead expenditures for 5 square feet, adjusted to infla on £Based on a part-time annual salary of $21,762. ɸPart-time salary was extrapolatedaccording to the number of patients per hour. Workload estimation was defined based on literature searches (see appendix K)
Table 4.3 Cost ranges used for Deterministic Sensitivity Analysis
Item Unit description Cost Value or Range†
(for DSA)
Capital costs Digital Camera One retinal camera $ 17,458.50 $ 29,798.10 Labour costs Tele-ophthalmology coordinator
Consultation per patient Hourly wage $24.18
Photographer Consultation per patient Hourly wage $24.18

113
Grader (ophthalmologist)
Consultation per patient $ 31.66 $ 23.75 to $ 55.41
Eye care specialist Consultation per patient $ 51.10 $ 38.33 to $ 89.43
† Range based on upper and lower 25% limits
Table 4.4 Examination outcomes of pharmacy-based tele-ophthalmology and in-person examination programs per 10,354 diabetic patients in the study model
In-person examination
Introduction of tele-ophthalmology
Patient compliance (%) 51.1% 56.2% True positive 893 1029 True negative 3362 3914 False positive 738 595 False negative 298 280 Total patients screened 5291 5819
Table 4.5 Incremental cost-effectiveness results for in-person examination versus introduction of tele-ophthalmology
Screening stategy
Cost per patient
Incremental cost per patient
Effectiveness (case
detected)
Incremental effectiveness ICER Dominance
In-person screening
(primary care) $43.98 0.086
Undominated
Introduction of Tele-
ophthalmology $49.22 $5.24 0.103 0.017 $314.1 Undominated

114
Figure 4.2 Cost-effectiveness plane. In-person examination versus introduction of tele-ophthalmology
Figure 4.3 Two way sensitivity analysis. Influence of tele-ophthalmology preference and increased patience compliance after introduction of tele-ophthalmology on the incremental cost-effectiveness ratio (ICER)
100.00150.00200.00250.00300.00350.00400.00450.00500.00
0.1 0.2 0.3 0.4 0.5 0.6 0.7 0.8 0.9 1ICER
($/c
ase
dete
cted
per
yea
r)
Tele-ophthalmology preference
Deterministic Sensitivity AnalysisΔ V= Volume increase of screened patients after introduction of tele-
ophthalmology
Δ V=10%Δ V=15%

115
Table 4.6 One-way deterministic sensitivity analysis results
Parameter Base-case value Range
ICER ($/case detected per
year) Prevalence of any diabetic retinopathy 0.225 0.169 to 0.281 $ 394.4 to $ 265.89
Patient preference for pharmacy-based tele-ophthalmology 0.40 0.40 to 0.70 $ 314.15 to $ 236.56
Diagnostic accuracy in-person examination
Sensitivity 0.75 0.67 to 0.83 $ 282.0 to $ 361.2 Specificity 0.82 0.79 to 0.86 $ 287.0 to $ 350.2
Diagnostic accuracy tele-ophthalmology Sensitivity 0.84 0.76 to 0.91 $ 405.9 to $ 304.9 Specificity 0.94 0.90 to 0.97 $ 350.9 to $ 286.6
Proportion of dilated examinations (tele-ophthalmology) 0.337 0.25 to 0.47 $ 333.9 to $ 321.5
Rate of unreadable images (tele-ophthalmology)
With pupil dilation 0.054 0.033 to 0.076 $ 306.6 to $ 321.5
Without pupil dilation 0.287 0.139 to 0.435 $ 209.9 to $ 411.2 Grader fee per patient (tele-ophthalmology) $31.66
$ 23.75 to $ 55.41 $ 207.6 to $ 633.9
Tele-ophthalmology coordinator fee per patient $4.03 $3.02 to $5.04 $300 to $327.8
Ophthalmic photographer $6.05 $4.54 to $7.56 $300.05 to $327.8
In-person consultation $51.10
$ 38.33 to $ 89.43
Tele-ophthalmology dominates at $ 77
Referral to retina specialist $111.31 $ 83.48 to $ 139.14 $ 252.5 to $ 375.8

116
Chapter 5 Integrated discussion

117
5.1 Overview
This chapter outlines the thesis results and implications, and when appropriate it
expands on the methodology used and interpretation of results. In summary, the
purpose of this thesis was twofold: To assess the diagnostic accuracy of tele-
ophthalmology for DR screening, and incorporate these findings in an economic model
to explore the cost-effectiveness of a pharmacy-based tele-ophthalmology program in a
semi-urban area.
5.2 Integrated discussion of thesis results
Chapter 3 of this thesis examined the diagnostic accuracy of tele-ophthalmology
strategies for DR screening in adults as compared to reference standards. We conducted
a systematic review in multiple databases from 1998 to 2012 (last update March 2013),
and performed a meta-analysis categorizing results according to diagnostic threshold
reported.
Results suggested that tele-ophthalmology programs fulfilled the minimum
effectiveness requirements advised by the Canadian Ophthalmological Society
(sensitivity over 80%, specificity between 90% and 95%).1 For the detection of referable
DR, we observed that the use of a single field per eye had a negative influence in the
diagnostic performance of tele-ophthalmology programs, whereas the use of multiple
photographic fields improved both sensitivity and specificity. For the detection of early
DR forms, we found that the choice of reference standard affected the study results, in
that studies that used 7-field fundus photographs (as advised by the American
Telemedicine Association2) showed better sensitivity compared to studies that selected
ophthalmologic examination as the reference. This is supported by previous evidence
that shows that inaccurate reference standards underestimate the diagnostic accuracy
of a test, being sensitivity more affected than specificity estimates.3,4 We also observed
that diagnostic performance for the detection of any DR improved over time. This is
likely attributed to advances of digital camera technologies and data transmission

118
techniques, as a better resolution facilitates the identification of earlier signs of DR,
reducing the number of false negatives.5
In Chapter 04, we explored the cost-effectiveness of pharmacy-based tele-
ophthalmology for diabetic retinopathy screening in semi-urban Southwestern Ontario.
Given that summary accuracy estimates were calculated for the detection of both any
DR and referable retinopathy, we decided to address the cost-effectiveness of a
category 1 tele-ophthalmology program, corresponding to the detection of any DR.2
These estimates were more suitable for the economic model than the results of
referable DR, since the definition of “any DR” was consistent amongst studies (ETDRS
≥20). Also, the summary prevalence was less variable across these studies compared to
studies that used referable retinopathy as screening threshold, and resembled that of
the Chatham-Kent population. Similarly, we used the meta-analysis information to
calculate the weighted average of unreadable images according to use of pharmacologic
dilation and incorporated these values into the economic model.
We found that pharmacy-based tele-ophthalmology was more costly, but more effective
than in-person examination, at $478.3 per case detected and an incremental cost-
effectiveness of $314.15 per additional case detected. Sensitivity analyses showed that
unreadable images and physician’s fees (for both in-person examination and tele-
ophthalmology) influenced cost-effectiveness outcomes. In our model we discarded the
assumption of exclusive initial use of tele-ophthalmology, as this situation would be
highly unlikely in a semi-urban area where eye care specialists are permanently
available. However, if we consider this assumption, the incremental cost-effectiveness
decreases to $73.23 per additional case detected.
5.3 Thesis limitations and knowledge gaps in current literature
Meta-analyses of diagnostic test accuracy studies are particularly challenging as they
usually incorporate primary studies that differ in study design, levels of quality and
definition of test positivity.6 Hence, greater variability is expected amongst diagnostic

119
accuracy studies versus clinical trial studies.7 As commented in chapter 03, we detected
substantial heterogeneity across studies, explored by means of subgroup analyses.
Amongst studies that detected any DR (category 1), heterogeneity was partially
explained by the differential use of reference standard and pharmacologic dilation.
Variability of the summary sensitivity was significantly reduced when low quality studies
were excluded from the analysis (Base-case I2=90; Q=154 vs. I2=31; Q=8.8) , reflecting
the influence of study design deficiencies on accuracy estimates. Hence, methodological
differences in study design, data collection and reporting of diagnostic accuracy
estimates may account for part of heterogeneity observed in the meta-analysis results
(methodological bias).8,9
In contrast to our findings amongst category 1 studies (detection of any DR),
considerable heterogeneity remained unexplained even after subgroup and sensitivity
analyses on studies that detected referable DR (category 2). In this case, heterogeneity
could be partially explained by a threshold effect, since authors in this category used
diverse guidelines (or even personal criteria) to define test positivity. There may be
other significant sources of heterogeneity that we could not address in our analysis due
to the small number of primary studies within subgroups, or lack of adequate reporting
in primary studies (discussed below).
Variability due to clinical characteristics was not addressed in this thesis, as this
information was poorly reported in primary studies. For instance, only 50% of studies
presented information about ethnicity, type of diabetes and duration of diabetes. Lack
of clinical and demographic information limits the interpretation of the actual
usefulness of tele-ophthalmology screening program. This also impacts the
interpretability of the economic analysis findings; it could be possible that some patient
subgroups may have greater benefit from a pharmacy-based tele-screening program. In
addition to the lack of reporting of clinical characteristics, index technology details such
as camera resolution, image compression, screen display size and resolution were not
described in most studies, restricting the assessment of the potential effect of these

120
technological features on the diagnostic performance of screening programs in the
public health setting. However, we were able to evaluate the influence of number of
photographic fields per eye and pharmacologic dilation on the diagnostic performance
of tele-ophthalmology programs, which have been subject of intense debate amongst
experts regarding their relevance on the diagnostic yield of this procedure.10,11
Although methodological quality of primary studies was satisfactory, we detected a high
risk of patient selection bias and risk of bias due to exclusion of patients with
uninterpretable test results. Most of excluded patients presented comorbidities (e.g
cataracts) that restricted image interpretation. An inadequate selection of patients, as in
this case, may lead to an overestimation of sensitivity and specificity.12 Even though this
is considered a source of bias by some authors, evidence regarding the effect of
exclusion of patients due to uninterpretable results is very limited, and a definitive
association with inflated diagnostic accuracy estimates has not been demonstrated.13
In the economic analysis, we chose the detection of any DR as the threshold for test
positivity, which by definition corresponds to a Category 1 telehealth program.2 The
main objective of this program is to increase adherence to screening standards amongst
diabetic patients, and serve as a platform for surveillance and education of those
individuals at risk of developing DR. However, direct management and treatment of
potential cases of severe vision loss correspond to more complex telemedicine
programs that use additional features such as stereopsis that permit an accurate
categorization of DR severity levels, including detection of diabetic macular edema.14
Hence, the interpretation of the cost-effectiveness estimates is limited to the
incremental cost per additional case detected and the incremental cost per case
correctly diagnosed.
Although macular edema is a very important complication from DR, tele-ophthalmology
programs without stereopsis (e.g Category 1 and 2 telehealth programs) are technically
limited to assess this condition.2 However, several studies have found that early clinical
signs of DR detected in tele-ophthalmology examinations may act as proxy indicators for

121
clinically significant macular edema.15,16 From the meta-analysis, we examined primary
studies that reported diagnosis of macular edema, and found that 32 out of 33 cases
were detected along with DR cases.17–19 Hence, a combination of digital photography
and visual acuity estimation may be useful to evaluate the presence of clinically
significant macular edema in a category 1 telehealth program. Validation studies must
be conducted to explore this alternative.
5.4 Conclusions and future directions
Our study indicated that diagnostic performance of tele-ophthalmology programs is
satisfactory and fulfills Canadian Ophthalmological Society’s criteria for DR screening
(sensitivity >80%, specificity between 90% and 95%)1. However, the clinical significance
of these findings is somewhat inconclusive due to the presence of significant
heterogeneity, which remained partially unexplained after subgroup and sensitivity
analyses. Hence, careful judgment should be exercised when interpreting the
applicability of these summary estimates in clinical practice.
Of note, we found lack of reporting of important clinical characteristics and technology
features, which in turn limited the assessment of these variables in the meta-analysis.
This is an issue of paramount importance that should be addressed by investigators and
journal editors, as an adequate reporting of these features will warrant a
comprehensive examination of sources of variation in future reviews.20
Although the diagnostic performance of tele-ophthalmology was satisfactory, the cost-
effectiveness of a pharmacy-based tele-ophthalmology program in a semi-urban
population is unclear. While this program was more effective than in-person
examination, an additional cost of $314.1 per case detected may be too high from the
healthcare payer perspective. Hence, this economic analysis opens the discussion as if
the benefits of mobile tele-ophthalmology in semi-urban areas are equivalent to those
benefits observed in remote populations. Prospective studies will provide more insight
on the impact of such programs on prevention of severe vision loss and quality of life in
a semi-urban setting.
122
5.5 References
1. Hooper P, Boucher MC, Cruess A, et al. Canadian Ophthalmological Society Evidence-
based Clinical Practice Guidelines for the Management of Diabetic Retinopathy -
executive summary. Can. J. Ophthalmol. 2012;47(2):91–6. Available at:
http://www.ncbi.nlm.nih.gov/pubmed/22560411. Accessed June 16, 2012.
2. Li HK, Horton M, Bursell S-E, et al. Telehealth practice recommendations for diabetic
retinopathy, second edition. Telemed. J. E. Health. 2011;17(10):814–37. Available at:
http://www.ncbi.nlm.nih.gov/pubmed/21970573. Accessed June 16, 2012.
3. Boyko EJ, Alderman BW, Baron AE. Reference test errors bias the evaluation of
diagnostic tests for ischemic heart disease. J. Gen. Intern. Med. 1988;3(5):476–481.
Available at: http://link.springer.com/10.1007/BF02595925. Accessed February 25,
2014.
4. Phelps CE, Hutson A. Estimating Diagnostic Test Accuracy Using a “Fuzzy Gold
Standard.” Med. Decis. Mak. 1995;15(1):44–57. Available at:
http://mdm.sagepub.com/cgi/doi/10.1177/0272989X9501500108. Accessed February
25, 2014.
5. Sonnad SS, Langlotz CP, Schwartz JS. Accuracy of MR imaging for staging prostate
cancer: a meta-analysis to examine the effect of technologic change. Acad. Radiol.
2001;8(2):149–57. Available at: http://www.ncbi.nlm.nih.gov/pubmed/11227643.
Accessed February 25, 2014.
6. Tatsioni A, Zarin DA, Aronson N, et al. Challenges in systematic reviews of diagnostic
technologies. Ann. Intern. Med. 2005;142(12 Pt 2):1048–55. Available at:
http://www.ncbi.nlm.nih.gov/pubmed/15968029. Accessed March 19, 2013.
7. Leeflang MMG, Deeks JJ, Gatsonis C, Bossuyt PMM. Systematic reviews of diagnostic
test accuracy. Ann. Intern. Med. 2008;149(12):889–97. Available at:
http://www.pubmedcentral.nih.gov/articlerender.fcgi?artid=2956514&tool=pmcentrez
&rendertype=abstract. Accessed February 13, 2014.

123
8. Lijmer JG, Bossuyt PMM, Heisterkamp SH. Exploring sources of heterogeneity in
systematic reviews of diagnostic tests. Stat. Med. 2002;21(11):1525–37. Available at:
http://www.ncbi.nlm.nih.gov/pubmed/12111918. Accessed March 19, 2013.
9. Becker DM, Philbrick JT, Bachhuber TL, Humphries JE. D-dimer testing and acute
venous thromboembolism. A shortcut to accurate diagnosis? Arch. Intern. Med.
1996;156(9):939–46. Available at: http://www.ncbi.nlm.nih.gov/pubmed/8624174.
Accessed March 24, 2014.
10. Wendt von, G, Ronnholm P, Heikkila K, Summanen P. A comparison between one-
and two-field 60 degree fundus photography when screening for diabetic retinopathy.
Acta Ophthalmol. Scand. 2000;78(1):14–20. Available at:
http://ovidsp.ovid.com/ovidweb.cgi?T=JS&PAGE=reference&D=med4&NEWS=N&AN=1
0726781.
11. Hsi-Kung K, Hsin-Hung H, Rue-Tsuan L. Screening for diabetic retinopathy by one-
field, non-mydriatic, 45 degrees digital photography is inadequate. Ophthalmologica.
2005;219(5):292–296. Available at:
http://ovidsp.ovid.com/ovidweb.cgi?T=JS&PAGE=reference&D=med4&NEWS=N&AN=1
6123556.
12. Whiting PF, Rutjes AWS, Westwood ME, et al. QUADAS-2: a revised tool for the
quality assessment of diagnostic accuracy studies. Ann. Intern. Med. 2011;155(8):529–
36. Available at: http://www.ncbi.nlm.nih.gov/pubmed/22007046. Accessed March 15,
2012.
13. Whiting PF, Rutjes AWS, Westwood ME, Mallett S. A systematic review classifies
sources of bias and variation in diagnostic test accuracy studies. J. Clin. Epidemiol.
2013;66(10):1093–104. Available at: http://www.ncbi.nlm.nih.gov/pubmed/23958378.
Accessed February 25, 2014.
14. Boucher MC, Nguyen QT, Angioi K. Mass community screening for diabetic
retinopathy using a nonmydriatic camera with telemedicine. Can. J. Ophthalmol.
2005;40(6):734–742. Available at:

124
http://ovidsp.ovid.com/ovidweb.cgi?T=JS&PAGE=reference&D=emed7&NEWS=N&AN=
2006019797.
15. Whited JD. Accuracy and reliability of teleophthalmology for diagnosing diabetic
retinopathy and macular edema: a review of the literature. Diabetes Technol. Ther.
2006;8(1):102–11. Available at: http://www.ncbi.nlm.nih.gov/pubmed/16472057.
Accessed April 8, 2013.
16. Liesenfeld B, Kohner E, Piehlmeier W, et al. A telemedical approach to the screening
of diabetic retinopathy: digital fundus photography. Diabetes Care. 2000;23(3):345–348.
Available at: http://care.diabetesjournals.org/cgi/doi/10.2337/diacare.23.3.345.
Accessed May 29, 2012.
17. Maberley D, Cruess AF, Barile G, et al. Digital photographic screening for diabetic
retinopathy in the James Bay Cree. Ophthalmic Epidemiol. 2002;9(3):169–178. Available
at: http://informahealthcare.com/doi/abs/10.1076/opep.9.3.169.1517. Accessed
August 22, 2012.
18. Jehanara A, P WT, Sven-Eric B, M AL, D CJ, A VR. The sensitivity and specificity of
nonmydriatic digital stereoscopic retinal imaging in detecting diabetic retinopathy.
Diabetes Care. 2006;29(10):2205–2209. Available at:
http://ovidsp.ovid.com/ovidweb.cgi?T=JS&PAGE=reference&D=med4&NEWS=N&AN=1
7003294.
19. Massin P, Erginay A, Mehidi B, et al. Evaluation of a new non-mydriatic digital
camera for detection of diabetic retinopathy. Diabet. Med. 2003;20(8):635–641.
Available at:
http://ovidsp.ovid.com/ovidweb.cgi?T=JS&PAGE=reference&D=med4&NEWS=N&AN=1
2873290.
20. Reitsma JB, Moons KGM, Bossuyt PMM, Linnet K. Systematic reviews of studies
quantifying the accuracy of diagnostic tests and markers. Clin. Chem. 2012;58(11):1534–
45. Available at: http://www.ncbi.nlm.nih.gov/pubmed/22991421. Accessed February
26, 2014.

125
Appendix

126
Appendix A. Meta-analysis of Observational Studies in Epidemiology (MOOSE) checklist
Reporting background should include Page Problem definition 48 Hypothesis statement 48 Description 48 Type of exposure or intervention used 48, 49 Type of study designs used 49 Study population 49 Reporting of search strategy should include Qualifications of searches (e.g. librarians and investigators) 49, 50 Search strategy, including time period included in the synthesis and keywords
48, Appendix C
Effort to include all available studies, including contact with authors 49,50 Databases and registries searched 48 Search software used, name and version, including special features 49 Use of hand searching (e.g. reference lists of obtained articles) 49 List of citations located and those excluded including justification 72 Method of addressing articles published in languages other than English 50 Method of handling abstracts and unpublished studies - Description of any contact with authors 54 Reporting methods should include Description of relevance or appropriateness of studies assembled for assessing the hypothesis to be tested
50
Rationale for the selection and coding of data (eg, sound clinical principles or convenience)
50
Documentation of how data were classified and coded (eg, multiple raters, blinding, and interrater reliability) 49,50
Assessment of confounding (eg, comparability of cases and controls in studies where appropriate)
-
Assessment of study quality, including blinding of quality assessors; stratification or regression on possible predictors of study results 51
Assessment of heterogeneity 52,53 Description of statistical methods (eg, complete description of fixed or random effects models, justification of whether the chosen models account for predictors of study results, dose-response models, or cumulative meta-analysis) in sufficient detail to be replicated
51, 52
Provision of appropriate tables and graphics 72-81 Reporting of results should include Graphic summarizing individual study estimates and overall estimate 78, 79 Table giving descriptive information for each study included 73 Results of sensitivity testing (eg, subgroup analysis) 81 Indication of statistical uncertainty of findings 61 Reporting of discussion should include

127
Quantitative assessment of bias (eg, publication bias) 53 Justification for exclusion (eg, exclusion of non–English-language citations) 54 Assessment of quality of included studies 55 Reporting of conclusions should include Consideration of alternative explanations for observed results 60, 61 Generalization of the conclusions (ie, appropriate for the data presented and within the domain of the literature review)
61
Guidelines for future research 61 Disclosure of funding source 54

128
Appendix B. Preferred Reporting Items for Systematic Reviews and Meta-analyses (PRISMA) checklist
Section/topic # Checklist item Reported on page #
TITLE Title 1 Identify the report as a systematic review, meta-analysis, or both. 46 ABSTRACT
Structured summary 2
Provide a structured summary including, as applicable: background; objectives; data sources; study eligibility criteria, participants, and interventions; study appraisal and synthesis methods; results; limitations; conclusions and implications of key findings; systematic review registration number.
-
INTRODUCTION
Rationale 3 Describe the rationale for the review in the context of what is already known. 48
Objectives 4 Provide an explicit statement of questions being addressed with reference to participants, interventions, comparisons, outcomes, and study design (PICOS).
48
METHODS Protocol and registration 5 Indicate if a review protocol exists, if and where it can be accessed (e.g., Web address), and, if available,
provide registration information including registration number. -
Eligibility criteria 6 Specify study characteristics (e.g., PICOS, length of follow-up) and report characteristics (e.g., years considered, language, publication status) used as criteria for eligibility, giving rationale.
49
Information sources 7 Describe all information sources (e.g., databases with dates of coverage, contact with study authors to
identify additional studies) in the search and date last searched. 48, 49
Search 8 Present full electronic search strategy for at least one database, including any limits used, such that it could be repeated.
App. C
Study selection 9 State the process for selecting studies (i.e., screening, eligibility, included in systematic review, and, if applicable, included in the meta-analysis).
49
Data collection process 10 Describe method of data extraction from reports (e.g., piloted forms, independently, in duplicate) and
any processes for obtaining and confirming data from investigators. 49, 50

129
Data items 11 List and define all variables for which data were sought (e.g., PICOS, funding sources) and any assumptions and simplifications made.
50
Risk of bias in individual studies
12 Describe methods used for assessing risk of bias of individual studies (including specification of whether this was done at the study or outcome level), and how this information is to be used in any data synthesis.
53
Summary measures 13 State the principal summary measures (e.g., risk ratio, difference in means). 52
Synthesis of results 14 Describe the methods of handling data and combining results of studies, if done, including measures of
consistency (e.g., I2) for each meta-analysis. 52, 53
Risk of bias across studies 15 Specify any assessment of risk of bias that may affect the cumulative evidence (e.g., publication bias,
selective reporting within studies). 53, 54
Additional analyses 16 Describe methods of additional analyses (e.g., sensitivity or subgroup analyses, meta-regression), if done,
indicating which were pre-specified. 53
RESULTS
Study selection 17 Give numbers of studies screened, assessed for eligibility, and included in the review, with reasons for exclusions at each stage, ideally with a flow diagram.
72
Study characteristics 18 For each study, present characteristics for which data were extracted (e.g., study size, PICOS, follow-up
period) and provide the citations. 73
Risk of bias within studies 19 Present data on risk of bias of each study and, if available, any outcome level assessment (see item 12). 77, 78, 83
Results of individual studies
20 For all outcomes considered (benefits or harms), present, for each study: (a) simple summary data for each intervention group (b) effect estimates and confidence intervals, ideally with a forest plot.
78, 79
Synthesis of results 21 Present results of each meta-analysis done, including confidence intervals and measures of consistency. 79
Risk of bias across studies 22 Present results of any assessment of risk of bias across studies (see Item 15). 77, 78
Additional 23 Give results of additional analyses, if done (e.g., sensitivity or subgroup analyses, meta-regression [see 81, 82
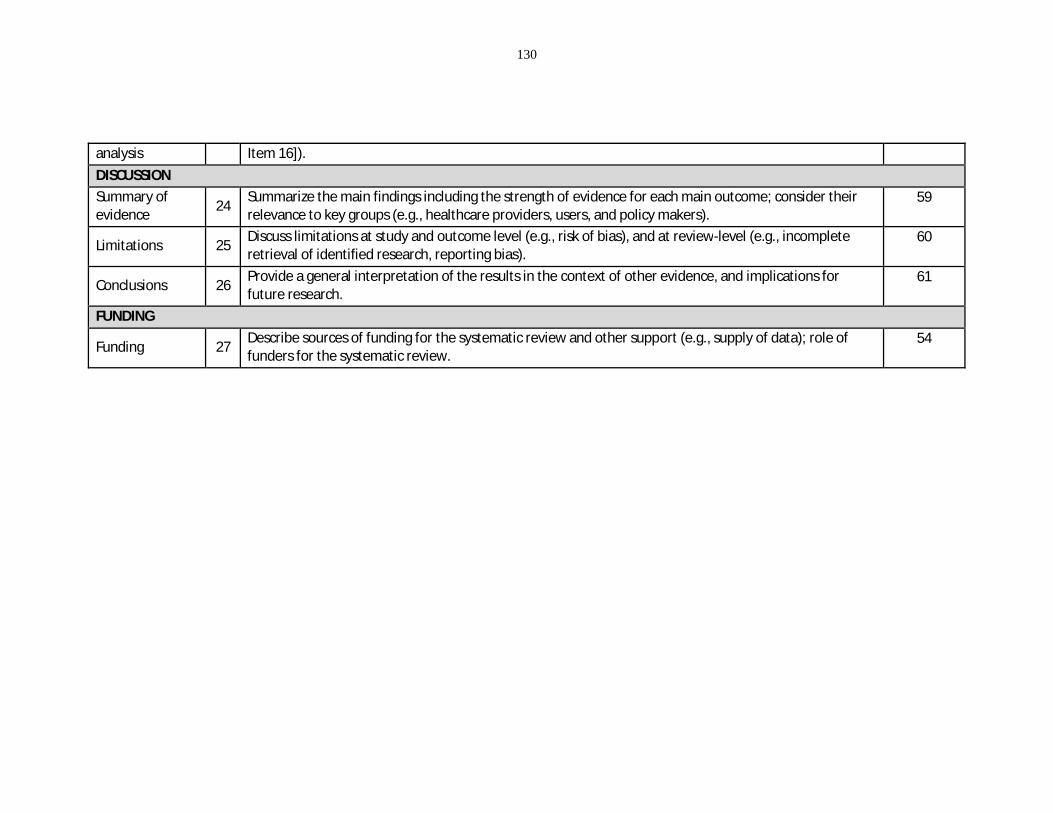
130
analysis Item 16]). DISCUSSION Summary of evidence 24 Summarize the main findings including the strength of evidence for each main outcome; consider their
relevance to key groups (e.g., healthcare providers, users, and policy makers). 59
Limitations 25 Discuss limitations at study and outcome level (e.g., risk of bias), and at review-level (e.g., incomplete retrieval of identified research, reporting bias).
60
Conclusions 26 Provide a general interpretation of the results in the context of other evidence, and implications for future research.
61
FUNDING
Funding 27 Describe sources of funding for the systematic review and other support (e.g., supply of data); role of funders for the systematic review.
54

131
Appendix C Complete search strategies for primary databases
C.1. Medline search strategy (OVID)
C.2. EMBASE search strategy (OVID) # Search terms 1 Diabetic Retinopathy/ or retina macula edema/ or eye fundus/ 2 (diabetic retinopath$ or diabetic maculopath$ or macular edema or macular
oedema or macula edema or macula oedema or fovea edema or fovea oedema or fundus oculi).mp.
3 (fundus adj5 (eye or retina$)).mp. 4 1 or 2 or 3 5 exp Diagnosis/ or diagnostic imaging/ 6 diagnos$.mp. 7 5 or 6
# Search terms 1 Diabetic Retinopathy/ or macular edema/ or fundus oculi/ 2 (diabetic retinopath$ or diabetic maculopath$ or macular edema or macular
oedema or fovea edema or fovea oedema or fundus oculi).mp. [mp=title, abstract, original title, name of substance word, subject heading word, protocol supplementary concept, rare disease supplementary concept, unique identifier]
3 (fundus adj10 (eye or retina$)).mp. [mp=title, abstract, original title, name of substance word, subject heading word, protocol supplementary concept, rare disease supplementary concept, unique identifier]
4 1 or 2 or 3 5 exp Diagnosis/ or diagnostic imaging/ 6 diagnos$.mp. [mp=title, abstract, original title, name of substance word,
subject heading word, protocol supplementary concept, rare disease supplementary concept, unique identifier]
7 5 or 6 8 telemedicine/ or telepathology/ or photography/ or vision screening/ 9 (telescreen$ or automated screen$ or digital imag$ or tele-screen$ or
teleophthalmology or tele-ophthalmology or digital screen$ or photograph$ or vision screen$ or image anal$ or telemedicine or telepathology or teleconsult$ or tele-consult$ or telehealth).mp.
10 8 or 9 11 exp "Sensitivity and Specificity"/ or comparative effectiveness research/ or exp
evaluation studies as topic/ 12 (sensitiv$ and specificit$).mp. 13 evaluation studies.pt. 14 evaluation stud$.mp. 15 11 or 12 or 13 or 14 16 1 and 7 and 10 and 15 17 Limit 16 to yr=”1998-Current”

132
8 telemedicine/ or teleconsultation/ or telehealth/ or telepathology/ or exp medical photography/ or image analysis/ or vision test/
9 (telescreen$ or automated screen$ or digital imag$ or tele-screen$ or telehealth or teleconsult$ or tele-consult$ or teleophthalmology or tele-ophthalmology or digital screen$ or medical photograph$ or vision screen$ or image anal$ or telemedicine or telepathology).mp.
10 8 or 9 11 "Sensitivity and Specificity"/ or Comparative Studies/ or Comparative
Effectiveness/ or Evaluation/ 12 (sensitiv$ and specificit$).mp. 13 (Comparative stud$ or comparative effectiveness or evaluat$).mp. 14 11 or 12 or 13 15 4 and 7 and 10 and 14 16 limit 20 to yr="1998 -Current"
C.3. BIOSIS search strategy (Web of Knowledge)
C.4. Web of Science search strategy (Web of knowledge)
# Search terms #1 “diabetic retinopath*” or ”diabetic maculopath*” or “macular edema” or
“macular oedema” or “fovea edema” or “fovea oedema” or “fundus oculi” #2 fundus same (eye or retina*)
# Search terms #1 “diabetic retinopath*” or ”diabetic maculopath*” or “macular edema” or
“macular oedema” or “fovea edema” or “fovea oedema” or “fundus oculi” #2 fundus same (eye or retina*) #3 #1 or #2 #4 Concept Codes=(Pathology - Diagnostic) OR Topic=(diagnos*) #5 Concept Codes=(Methods - Photography OR Public health - Health services
"and" medical care) #6 telescreen* or “automated screen*” or “digital imag*” or tele-screen* or
teleophthalmology or tele-ophthalmology or “digital screen*” or photograph* or “vision screen*” or “image anal*” or telemedicine or telehealth or telepathology or teleconsult* or ”tele-consult*”
#7 #5 or #6 #8 “comparative stud*" or "evaluation research" or "evaluation stud*" or
"comparative effectiveness" or (sensitiv* SAME specific*) #9 #8 AND #7 AND #4 AND #3
Timespan=1998-2012. Databases=BIOSIS Previews. Lemmatization=On

133
#3 #1 or #2 #4 diagnos* #5 telehealth or teleconsult* or “tele-consult*” or telescreen* or "automated
screen*" or "digital imag*" or “tele-screen*” or teleophthalmology or tele-ophthalmology or "digital screen*" or photograph* or "vision screen*" or "image anal*" or telemedicine or telepathology
#6 “comparative stud*" or "evaluation research" or "evaluation stud*" or "comparative effectiveness" or (sensitiv* SAME specific*)
#7 #6 AND #5 AND #4 AND #3
C.5. Cochrane library search strategy (Wiley online library) # Search terms #1 MeSH descriptor Diabetic Retinopathy, this term only #2 MeSH descriptor Macular Edema, this term only #3 MeSH descriptor Fundus Oculi, this term only #4 “diabetic retinopathy” or “diabetic retinopathies” or “diabetic maculopathy”
or “diabetic maculopathies” or macular edema or macular oedema or fovea edema or fovea oedema or fundus oculi NEED “ “ around all phrases, eg “fovea edema”
#5 Fundus NEAR/5 (eye OR retina*) #6 #1 or #2 or #3 or #4 or #5 #7 MeSH descriptor Diagnosis explode all trees #8 MeSH descriptor Diagnostic Imaging, this term only #9 diagnos* #10 #7 or #8 or #9 #11 MeSH descriptor Telemedicine, this term only #12 MeSH descriptor Telepathology, this term only #13 MeSH descriptor Photography, this term only #14 MeSH descriptor Vision screening, this term only #15 telemedicine or telehealth or teleconsult or teleconsultation or "tele-consult"
or "tele-consultation" or telescreen or telescreening or "automated screen" or "automated screening" or "digital images" or "digital imaging" or "digital image" or "tele-screen" or "tele-screening" or teleophthalmology or "tele-ophthalmology" or "digital screen" or "digital screening" or photography or photographic or "vision screening" or "vision screen" or "image analysis" or telepathology
#16 #11 or #12 or #13 or #14 or #15 #17 MeSH descriptor Sensitivity and Specificity explode all trees #18 MeSH descriptor Comparative Effectiveness Research, this term only #19 MeSH descriptor Evaluation Studies as Topic explode all trees #20 (evaluation studies):pt #21 (sensitiv* and specificit*) or "comparative effectiveness" OR "evaluation

134
study" or "evaluation studies" or evaluat* #22 #17 OR #18 OR #19 OR #20 OR #21 #23 #6 and #10 and #16 and #22 from 1998 to 2012
C.6. CINAHL Search strategy (EBSCO host)
# Search terms S1 MH "Diabetic Retinopathy" S2 diabetic retinopath* or diabetic maculopath* or macular edema or macular
oedema or fovea edema or fovea oedema or fundus oculi NEED “ “ around all phrases, eg “macular edema”
S3 fundus N10 (eye or retina*) S4 S1 or S2 or S3 S5 MH "Diagnosis" OR MH "Diagnosis, Eye+" OR MH "Diagnostic Imaging" S6 Diagnos* S7 S5 or S6 S8 MH "Telehealth" OR MH "Telemedicine" OR MH "Remote Consultation" OR
MH "Telepathology" OR MH "Photography" OR MH "Digital Imaging" OR MH "Vision Screening"
S9 telescreen* or automated screen* or digital imag* or tele-screen* or teleophthalmology or tele-ophthalmology or digital screen* or photograph* or vision screen* or image anal* or telehealth or telepathology or telemedicine or teleconsult* or “tele-consult*” or “remote consult*” NEED “ “ around all phrases, eg “automated screen*”
S10 S8 or S9 S11 MH "Sensitivity and Specificity" OR MH "Comparative Studies" OR MH
"Evaluation Research" OR MH "Summative Evaluation Research" S12 sensitiv* and specificit* S13 evaluation stud* NEED “ “ around all phrases, S14 S11 or S12 or S13 S15 S4 and S7 and S10 and S14 S16 S4 and S7 and S10 and S14
Limiters - Published Date from: 19980101-20121231
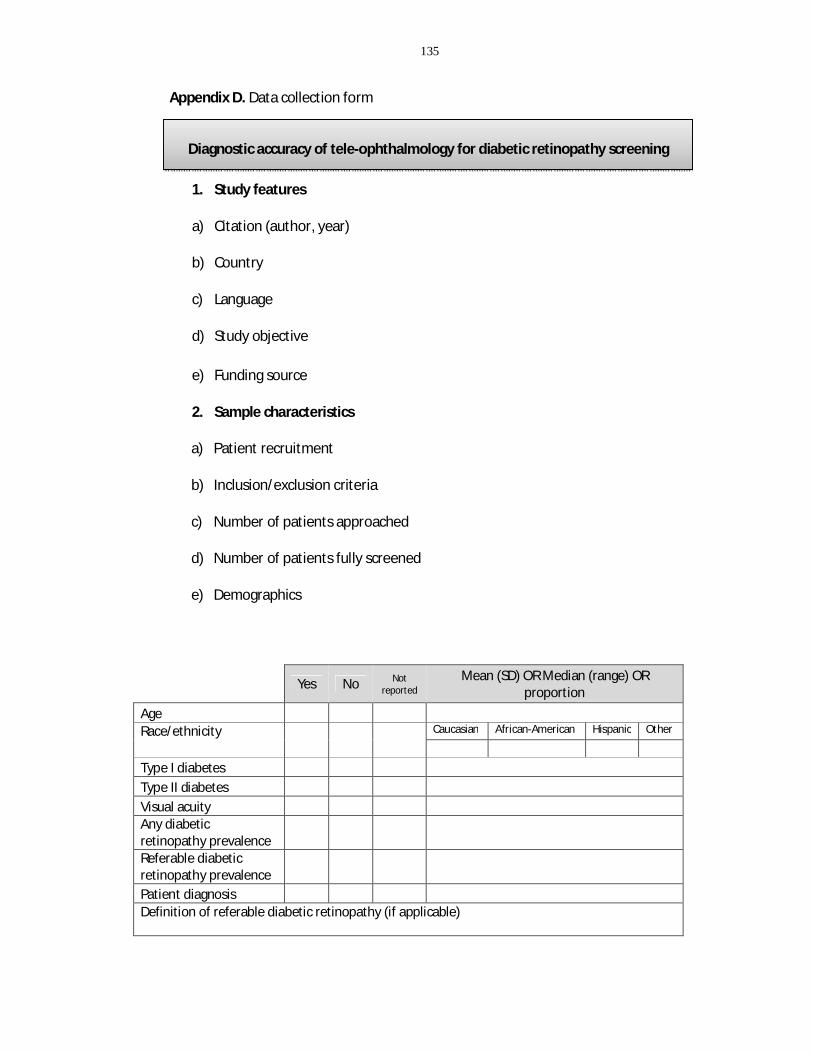
135
Appendix D. Data collection form
1. Study features
a) Citation (author, year)
b) Country
c) Language
d) Study objective
e) Funding source
2. Sample characteristics
a) Patient recruitment
b) Inclusion/exclusion criteria
c) Number of patients approached
d) Number of patients fully screened
e) Demographics
Yes No Not
reported Mean (SD) OR Median (range) OR
proportion Age Race/ethnicity Caucasian African-American Hispanic Other
Type I diabetes Type II diabetes Visual acuity Any diabetic retinopathy prevalence Referable diabetic retinopathy prevalence Patient diagnosis Definition of referable diabetic retinopathy (if applicable)
Diagnostic accuracy of tele-ophthalmology for diabetic retinopathy screening

136
f) Unit of study
3. Screening details
a) Reference standard used
7-field ETDRS photographs
Slit-lamp biomicroscopy Not reported
b) Grading guideline used
Modified Airlie House Classification
European Field Guide International Clinical Diabetic Retinopathy Scale
Other (please specify) Not reported
c) Index technology i. Fundus camera
Camera brand Camera resolution
ii. Image acquisition (be as specific as possible)
Technician:
Certified photographer Nurse
Eye care professional Other (please specify)
Not reported
Number of fields taken per eye: One Two
Three
Eye Patient
Not reported

137
Four Five
More than five Not reported
Field positioning: Stereopsis
Yes No
Not reported Pupil dilation
Yes/mixed No
Not reported
Mydriatic agent (if applicable):
iii. Image quality
Yes No Not reported
Proportion OR compression ratio
Unreadable images (%) Image compression
4. Diagnostic accuracy
5. Additional comments of the reviewer
Sensitivity (95% CI)
Specificity (95% CI) TP FN FP TN
Any Diabetic Retinopathy Referable Diabetic Retinopathy

138
Appendix E. Adapted QUADAS2 criteria Phase 1: State the review question Author: Index test(s): Reference standard: Unit of study: Phase 2: Draw a flow diagram for the primary study Phase 3: Risk of bias judgments DOMAIN 1: Patient selection
a. Describe methods of patient selection:
b. Signaling questions
Grading: If at least one “No”, then Risk of bias is HIGH. If at least one “Unclear”, then Risk of bias is “UNCLEAR”.
1) Was a consecutive or random sample of patients enrolled?
Yes No Unclear
2) Did the study avoid inappropriate exclusions? Yes No Unclear
Could the selection of patients have introduced bias? RISK:
HIGH LOW UNCLEAR
DOMAIN 2: Index test(s) Please complete for each index test
a. Describe the index test and how it was conducted and interpreted:
b. Signalling questions
Grading: If at least one “No”, then Risk of bias is HIGH. If at least one “Unclear”, then Risk of bias is “UNCLEAR”.
3) Were the index test results interpreted without knowledge of the results of the reference standard? Yes No Unclear
4) If a threshold was used, was it pre-specified? Yes No Unclear
Could the conduct or interpretation of the index test have introduced bias? RISK:
HIGH LOW UNCLEAR
DOMAIN 3: Reference standard
a. Describe the reference standard and how it was conducted and interpreted:
b. Signalling questions Grading: If at least one “No”, then Risk of bias is HIGH. If at least one “Unclear”, then Risk of bias is “UNCLEAR”.
5) Is the reference standard likely to correctly classify the target condition? Yes No Unclear

139
6) Were the reference standard results interpreted without knowledge of the results of the index test? Yes No Unclear
Could the reference standard, its conduct, or its interpretation have introduced bias? RISK:
HIGH LOW UNCLEAR
DOMAIN 4: Flow and timing
a. Describe any patients who did not receive the index test(s) and/or reference standard or who were excluded from the 2x2 table (refer to flow diagram)
b. Describe the time interval or any interventions between index test(s) and the reference standard
c. Signaling questions Grading: If at least one “No”, then Risk of bias is HIGH. If at least one “Unclear”, then Risk of bias is “UNCLEAR”.
7) Was there an appropriate interval link between index test(s) and reference standard? Yes No Unclear
8) Did all patients receive the same reference standards? Yes No Unclear
9) Were all patients included in the analysis?
Yes No Unclear
Could the patient flow have introduced bias? RISK: HIGH/LOW/UNCLEAR
HIGH LOW UNCLEAR

140
Appendix F. Paired forest plots – Sensitivity analyses of included studies per category (category 1, detection of any diabetic retinopathy; category 2, detection of referable diabetic retinopathy)
SENSITIVITY (95% CI)
Q = 8.79, df = 6.00, p = 0.19
I2 = 31.77 [0.00 - 90.05]
0.90[0.87 - 0.93]
0.88 [0.79 - 0.95]
0.85 [0.75 - 0.92]
0.98 [0.89 - 1.00]
0.92 [0.88 - 0.95]
0.85 [0.70 - 0.94]
0.86 [0.57 - 0.98]
0.93 [0.81 - 0.99]0.93 [0.81 - 0.99]
StudyId
COMBINED
Baeza DM et al., 2004
Baeza DM et al., 2009
Boucher MC et al., 2003
Lopez-Bastida et al., 2007
Maberley D et al., 2002
Molina-Fernandez et al., 2005
Ting SW et al., 2011
0.6 1.0SENSITIVITY
SPECIFICITY (95% CI)
Q = 34.53, df = 6.00, p = 0.00
I2 = 82.62 [70.69 - 94.56]
0.94[0.89 - 0.97]
0.95 [0.89 - 0.98]
0.94 [0.89 - 0.97]
0.81 [0.64 - 0.93]
0.96 [0.93 - 0.98]
0.80 [0.68 - 0.89]
0.97 [0.85 - 1.00]
0.98 [0.93 - 1.00]0.98 [0.93 - 1.00]
StudyId
COMBINED
Baeza DM et al., 2004
Baeza DM et al., 2009
Boucher MC et al., 2003
Lopez-Bastida et al., 2007
Maberley D et al., 2002
Molina-Fernandez et al., 2005
Ting SW et al., 2011
0.6 1.0SPECIFICITY
Figure 1a Category 1 studies – sensitivity analysis excluding studies with high/uncertain risk of bias as graded by QUADAS2 criteria
SENSITIVITY (95% CI)
Q = 64.43, df = 8.00, p = 0.00
I2 = 87.58 [80.80 - 94.37]
0.91[0.83 - 0.96]
0.84 [0.64 - 0.95]
0.95 [0.75 - 1.00]
0.85 [0.75 - 0.92]
0.59 [0.42 - 0.74]
0.98 [0.91 - 1.00]
0.92 [0.88 - 0.95]
0.86 [0.57 - 0.98]
0.99 [0.92 - 1.00]
0.93 [0.81 - 0.99]0.93 [0.81 - 0.99]
StudyId
COMBINED
Ahmed J et al., 2006
Aptel F et al., 2008
Baeza DM et al., 2009
Chun MDW et al. , 2007
Li HK et al., 2010
Lopez-Bastida et al., 2007
Molina-Fernandez et al., 2005
Schiffman RM et al., 2005
Ting SW et al., 2011
0.4 1.0SENSITIVITY
SPECIFICITY (95% CI)
Q = 53.39, df = 8.00, p = 0.00
I2 = 85.02 [76.39 - 93.64]
0.97[0.93 - 0.98]
0.86 [0.79 - 0.92]
0.98 [0.91 - 1.00]
0.94 [0.89 - 0.97]
1.00 [0.96 - 1.00]
0.92 [0.64 - 1.00]
0.96 [0.93 - 0.98]
0.97 [0.85 - 1.00]
1.00 [0.85 - 1.00]
0.98 [0.93 - 1.00]0.98 [0.93 - 1.00]
StudyId
COMBINED
Ahmed J et al., 2006
Aptel F et al., 2008
Baeza DM et al., 2009
Chun MDW et al., 2007
Li HK et al., 2010
Lopez-Bastida et al., 2007
Molina-Fernandez et al., 2005
Schiffman RM et al., 2005
Ting SW et al., 2011
0.6 1.0SPECIFICITY
Figure 1b Category 1 studies – sensitivity analysis excluding studies published prior 2005

141
Appendix F. (Continued)
SENSITIVITY (95% CI)
Q = 8.79, df = 6.00, p = 0.19
I2 = 31.77 [0.00 - 90.05]
0.90[0.87 - 0.93]
0.88 [0.79 - 0.95]
0.85 [0.75 - 0.92]
0.98 [0.89 - 1.00]
0.92 [0.88 - 0.95]
0.85 [0.70 - 0.94]
0.86 [0.57 - 0.98]
0.93 [0.81 - 0.99]0.93 [0.81 - 0.99]
StudyId
COMBINED
Baeza DM et al., 2004
Baeza DM et al., 2009
Boucher MC et al., 2003
Lopez-Bastida et al., 2007
Maberley D et al., 2002
Molina-Fernandez et al., 2005
Ting SW et al., 2011
0.6 1.0SENSITIVITY
SPECIFICITY (95% CI)
Q = 34.53, df = 6.00, p = 0.00
I2 = 82.62 [70.69 - 94.56]
0.94[0.89 - 0.97]
0.95 [0.89 - 0.98]
0.94 [0.89 - 0.97]
0.81 [0.64 - 0.93]
0.96 [0.93 - 0.98]
0.80 [0.68 - 0.89]
0.97 [0.85 - 1.00]
0.98 [0.93 - 1.00]0.98 [0.93 - 1.00]
StudyId
COMBINED
Baeza DM et al., 2004
Baeza DM et al., 2009
Boucher MC et al., 2003
Lopez-Bastida et al., 2007
Maberley D et al., 2002
Mol ina-Fernandez et al., 2005
Ting SW et al., 2011
0.6 1.0SPECIFICITY
Figure 2a Category 2 studies – sensitivity analysis excluding studies with high/uncertain risk of bias as graded by QUADAS2 criteria
SENSITIVITY (95% CI)
Q = 23.62, df = 5.00, p = 0.00
I2 = 78.84 [62.21 - 95.46]
0.92[0.86 - 0.96]
0.94 [0.79 - 0.99]
0.97 [0.88 - 1.00]
0.86 [0.76 - 0.93]
0.80 [0.28 - 0.99]
0.95 [0.87 - 0.99]
0.81 [0.62 - 0.94]0.81 [0.62 - 0.94]
StudyId
COMBINED
Baeza DM et al., 2009
Li HK et al., 2010
Phiri R et al., 2006
Rudnisky CJ et al., 2007
Schiffman RM et al., 2005
Vujosevic S et al., 2009
0.3 1.0SENSITIVITY
SPECIFICITY (95% CI)
Q = 67.81, df = 5.00, p = 0.00
I2 = 92.63 [88.27 - 96.98]
0.94[0.83 - 0.98]
0.98 [0.95 - 0.99]
0.94 [0.71 - 1.00]
0.71 [0.60 - 0.81]
0.99 [0.94 - 1.00]
0.81 [0.63 - 0.93]
0.93 [0.76 - 0.99]0.93 [0.76 - 0.99]
StudyId
COMBINED
Baeza DM et al., 2009
Li HK et al., 2010
Phiri R et al., 2006
Rudnisky CJ et al., 2007
Schiffman RM et al., 2005
Vujosevic S et al., 2009
0.6 1.0SPECIFICITY
Figure 2b Category 2 studies – sensitivity analysis excluding studies published prior 2005

142
Appendix G. Decision tree model for tele-ophthalmology versus in person examination

143
Appendix H. Search strategy (Pubmed and EMBASE). Compliance after introduction of mobile units for eye assessment and patient preferences for screening with mobile units
H.1 Medline
Search terms
1 *Telemedicine/ or exp Mobile Health Units/ or exp Community Pharmacy Services/
2 (tele-medicine or tele-screening or telescreening or mobile health unit$ or community pharmac$ service$).mp.
3 1 or 2
4 Eye diseases/ or Ophthalmology/ or Retinal Diseases/ or Retina/pa or exp Diabetic Retinopathy/
5 (eye disease$ or retinal disease$ or retina$ or diabetic retinopath$).mp.
6 4 or 5
7 Mass Screening/ or diagnosis/ or early diagnosis/
8 3 and 6 and 7
H.2 Embase
Search terms
1 telediagnosis/ or telemedicine/ or preventive health service/
2 (telediagnos$ or telemedicine or tele-medicine or telescreening or tele-screening or preventive health service$).mp.
3 1 or 2
4 eye disease/ or retina disease/ or diabetic retinopathy/
5 (eye disease$ or retina disease$ or retina$ or diabetic retinopath$).mp.
6 4 or 5
7 diagnosis/ or early diagnosis/ or exp mass screening/
8 3 and 6 and 7

144
Appendix I. Calculation of model probabilities I.1 Calculation of screening probabilities for in-person examination (Arm 1) and tele-ophthalmology (Arm 2)
I.1.1 In-person examination (Arm 1)
P(ref)= 0.511 Ontario examination rate of diabetic patients one year after receiving a diabetes diagnosis (Buhrmann et al., 2003)
Proportion of non-compliant patients is defined as 1- P(ref) = 0.489
I.1.2 Tele-ophthalmology screening (Arm 2) From the literature search (Appendix H) it is assumed a 10% volume increase (V) of screening examinations after introduction of mobile retinal screening (Olayiwola JN et al., 2011).
We have the following screening rate after introduction of tele-ophthalmology
P(Arm 2)= P(ref) х V
Where,
V= Volume increase of screening examinations after introduction of mobile retinal screening.
P(Arm 2)= 0.511 x 1.10= 0.5621
I.1.2.1 Proportion of tele-ophthalmology examinations within Arm 2
To calculate the proportion of examinations with tele-ophthalmology within Arm 2 we have the following
P(tele)= T ( P(ref) х V ) , V ≥ 1, P(tele) <1
Where,
T= Proportion of patients that accept a tele-ophthalmology examination
From the literature search (Appendix H) we assumed that 40% of screened patients accepted a tele-ophthalmology examination (T), and the remaining 60% preferred the in-person examination.

145
P(tele)= 0.40 (0.5621)= 0.2248
I.1.2.2 Proportion of in-person examinations within Arm 2
The proportion of in-person examinations (P(inp)) is defined as
P(inp)= P(Arm 2) - P(tele)
P(inp)= 0.3373
I.1.2.3 Proportion of non-compliant patients
Proportion of non-compliant patients is defined as
P(nc)= 1- P(Arm2)
P(nc)= 0.4379

146
Appendix J. Summary of probabilities incorporated in the economic model
Notation Details Value
Base tree
p Patients screened with current practice (Arm 1) 0.511 1-p Patients not screened (Arm 1) 0.489 q Patients would prefer in-person examination over
tele-ophthalmology 0.60
1-q Patients would prefer tele-ophthalmology 0.40 p(n) Patients screened after implementation of tele-
ophthalmology (Arm 2) 0.5621
[p(n)]*[q] Patients screened with in-person examination (Arm 2)
0.3373
[p(n)]*[1-q] Patients screened with tele-ophthalmology (Arm 2)
0.2248
1-[(6)+(7)] Patients not screened (after tele-ophthalmology) 0.4379 In-person examination se_primary Test "+" (among diseased) 0.75 1-[se_primary] Test "-" (among diseased) 0.25 sp_primary Test "-" (among non-diseased) 0.82 1-[sp_primary] Test "+" (among non-diseased) 0.18 Tele-ophthalmology d Patients with dilated examination 0.337 1-d Patients with undilated examination 0.663 u_d Unreadable images with pupil dilation 0.0547 1-[u_d] Readable images with pupil dilation 0.9453 u_nod Unreadable images without dilation 0.2874 1-[u_nod] Readable images without dilation 0.7126 se_tele Test "+" (among diseased) 0.89 1-[se_tele] Test "-" (among diseased) 0.11 sp_tele Test "-" (among non-diseased) 0.94 1-[sp_tele] Test "+" (among non-diseased) 0.06 DR_yes Proportion with any DR (prevalence) 0.225 1-[DR_yes] Not diseased 0.775

147
Appendix K. Search strategy (Medline, Embase) K.1 Medline
# Search terms
1 Diabetic Retinopathy/ or macular edema/ or fundus oculi/
2 (diabetic retinopath$ or diabetic maculopath$ or macular edema or macular oedema or fovea edema or fovea oedema or fundus oculi).mp.
3 1 or 2
4 exp Diagnosis/ or diagnostic imaging/
5 (diagnos$ or screen$).mp.
6 4 or 5
7 "costs and cost analysis"/ or "cost allocation"/ or cost-benefit analysis/ or exp "cost control"/ or health care costs/ or direct service costs/ or employer health costs/ or hospital costs/ or exp health expenditures/ or Decision Trees/ or markov chains/
8 (cost-effective$ or cost effective$ or cost-benefit or cost benefit or decision tree$ or markov model$ or economic analys$).mp.
9 7 or 8
10 3 and 6 and 9
11 Diabetic Retinopathy/ec [Economics]
12 10 or 11 K.2 Embase
# Search terms
1 Diabetic Retinopathy/ or retina macula edema/ or eye fundus/
2 (diabetic retinopath$ or diabetic maculopath$ or macular edema or macular oedema or macula edema or macula oedema or fovea edema or fovea oedema or fundus oculi).mp.
3 1 or 2
4 exp Diagnosis/ or diagnostic imaging/
5 diagnos$.mp.
6 4 or 5
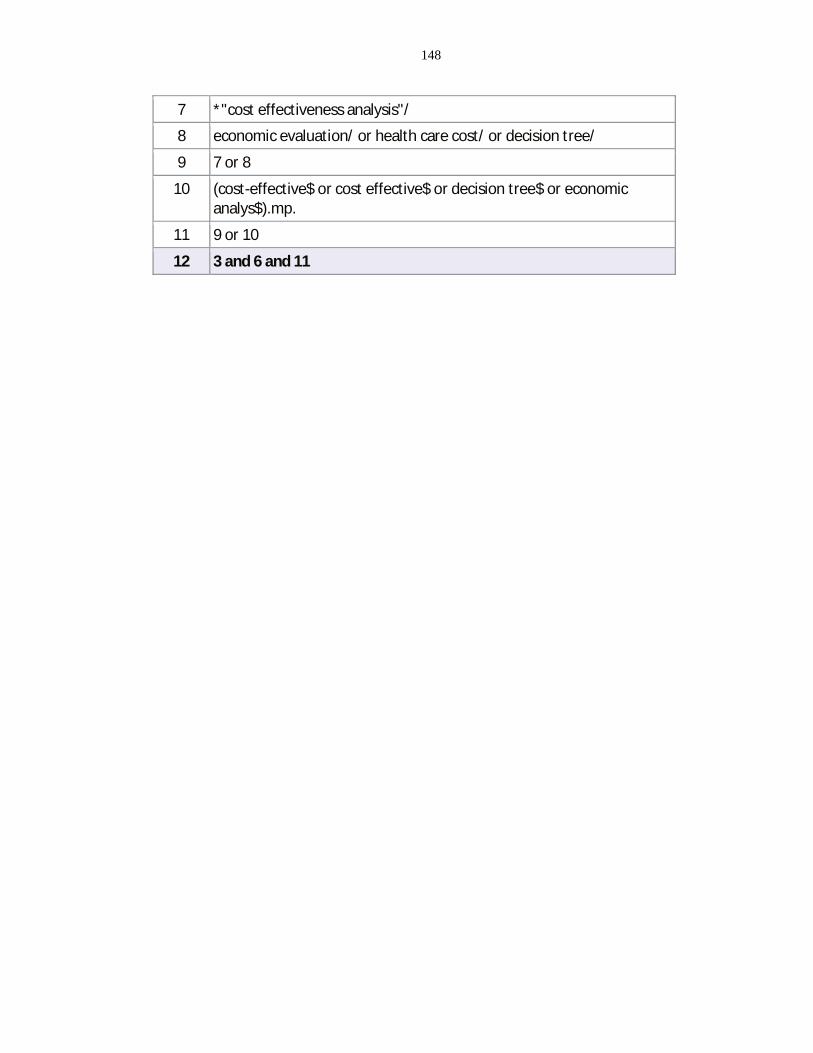
148
7 *"cost effectiveness analysis"/
8 economic evaluation/ or health care cost/ or decision tree/
9 7 or 8
10 (cost-effective$ or cost effective$ or decision tree$ or economic analys$).mp.
11 9 or 10
12 3 and 6 and 11

149
Curriculum Vitae
Name: Andrea Catalina Coronado
Post-secondary Education and Degrees:
Western University London, Canada 2011-2014 M.Sc
Universidad de Los Andes Bogota, Colombia 2005-2010 B.Sc (Hons)
Honours and Awards: Best Science Student Research Presentation Ophthalmology Research Day – Western University 2012
Ontario Graduate Scholarship (OGS) Ministry of Training, Colleges and Universities 2012-2013
Schulich Graduate Scholarship Western University 2011-2013
Peer Reviewed Abstracts:
"Effectiveness of Telemedicine Strategies for Diabetic Retinopathy Diagnosis: A Systematic Review". Association for Research in Vision and Ophthalmology (ARVO) Annual Meeting. Seattle, Washington State (US). May 5th-9th, 2013 Presenter
“Influence of Pupil Dilation on Tele-screening Strategies for Diabetic Retinopathy Assessment”. Canadian Society of Epidemiology and Biostatistics (CSEB) Biennial Conference. St. John’s, Newfoundland (Canada). June 25th-27th, 2013 Presenter
Top Related