


Languages
Pages
Legal

DEVELOPMENTAL STATE AND AGRICULTURE FOR DEVELOPMENT: LESSONS FOR GHANA FROM EAST ASIA
A DISSERTATION IN Economics
And Geosciences
Presented to the Faculty of the University of Missouri-Kansas City
In partial fulfillment of the requirements for the degree
DOCTOR OF PHILOSOPHY
By
RICHARD B. DADZIE
B.A., Whitworth University, 2005
Kansas City, Missouri
2011

© 2011
RICHARD B. DADZIE
ALL RIGHTS RESERVED

ii
DEVELOPMENTAL STATE AND AGRICULTURE FOR DEVELOPMENT: LESSONS FOR GHANA FROM EAST ASIA
Richard B. Dadzie, Candidate for the Doctor of Philosophy Degree
University of Missouri-Kansas City, 2011
ABSTRACT
Comparative studies between Sub-Saharan Africa and East Asia have shown
divergence in economic growth and development. This study argues that in order for Sub-
Saharan Africa to make progress in its quest for development, countries in the region must
carefully and seriously study the development experiences of late-industrializing economies
in East Asia. They must adopt where possible those practices that led to their structural
transformation and economic success. The case of Ghana and Malaysia provide an excellent
example of two nations similar at independence but different today. In explaining their
divergence, economy-wide and sector-specific comparisons are made to highlight their
experiences and formulate lessons for Ghana’s development. Fieldwork in Central Region,
Ghana and Sarawak, Malaysia is used as a backdrop to discuss agricultural transformation
and rural development. In explaining the divergent development experiences of these two
nations, the analytical toolset of heterodox development economists is extensively used.
Concepts such as the developmental state, embedded autonomy and social legitimacy are
used to highlight the role of the state in the process of economic change, and theories of
modern money and institutional adjustment are discussed in relation to the creation of a
Ghanaian developmental state.

iii
APPROVAL PAGE
The faculty listed below, appointed by the Dean of the School of Graduate Studies have
examined a dissertation titled “Developmental State and Agriculture for Development: Lessons
for Ghana from East Asia”, presented by Richard B. Dadzie, candidate for the Doctor of
Philosophy degree, and certify that in their opinion it is worthy of acceptance.
Supervisory Committee
Mathew Forstater, Ph.D., Committee Chair Department of Economics
L. Randall Wray, Ph.D.
Department of Economics
Jan Kregel, Ph.D. Department of Economics
Steven L. Driever, Ph.D.
Department of Geosciences
Max J. Skidmore, Ph.D. Department of Political Science
Viviana Grieco, Ph. D. Department of History

iv
CONTENTS ABSTRACT ............................................................................................................................ ii
TABLES .................................................................................................................................. v
ILLUSTRATIONS .................................................................................................................. vii
ACKNOWLEDGEMENTS .....................................................................................................viii
Chapter
1. INTRODUCTION ....................................................................................................... 1
2. BACKGROUND TO GHANA AND MALAYSIA .................................................... 6
3. ECONOMIC DEVELOPMENT IN COMPARATIVE PERSPECTIVE: THE
CASE OF GHANA AND MALAYSIA ...................................................................... 17
4. DEVELOPMENTAL STATE AND ECONOMIC DEVELOPMENT ....................... 31
5. AGRICULTURAL TRANSFORMATION, RURAL DEVELOPMENT
AND THE DEVELOPMENTAL STATE: A COMPARATIVE
ANALYSIS OF THE CENTRAL REGION, GHANA
AND SARAWAK, MALAYSIA .................................................................................. 59
6. CONCLUSIONS AND DIRECTIONS FOR FUTURE RESEARCH ........................104
APPENDIX
A. QUESTIONNAIRE ............................................................................................... 123
B. OTHER INTERVIEW QUESTIONS .................................................................... 130
C. HIGHLIGHTS OF WASHINGTON CONSENSUS ............................................. 131
BIBLIOGRAPHY .............................................................................................................. 132
VITA .................................................................................................................................. 144

v
TABLES
Table Page
1. Population, Ghana and Malaysia (in millions) ...........................................................12
2. Growth Rates of Real GDP and Real GDP per Capita ...............................................22
3. Key Indicators .............................................................................................................24
4. Selected Social Indicators ...........................................................................................25
5. Ghana-Structure of the Economy ................................................................................26
6. Malaysia-Structure of the Economy ...........................................................................26
7. Ghana-Share of Labor Force in Agriculture, Industry and Sciences ..........................26
8. Malaysia-Share of Labor Force in Agriculture, Industry and Services ......................26
9. Similarities between the Developmental State and Development Thought prior
to WWII ......................................................................................................................52
10. Selected Agricultural Indicators for Ghana and Malaysia ..........................................60
11. Differences between Conventional and Focused Ethnography ..................................61
12. Main Crops Cultivated in Ghana .................................................................................63
13. Average and Achievable Yields ...................................................................................67
14. Estimated Production if Yields Reached Achievable Levels .....................................67
15. Annual Fish Production by Source, 1970-2006 ..........................................................68
16. Aquaculture by Region ...............................................................................................69
17. Cages, Pens and Reservoirs ........................................................................................70
18. Estimated Livestock Populations ................................................................................70
19. Malaysia’s Self Sufficiency Levels in Food Commodities .........................................74
20. Aquaculture by State ...................................................................................................77
21. Estimated Livestock Population .................................................................................78
22. Characteristics of Agriculture in the Central Region and Sarawak ............................85
23. Farm Sizes ...................................................................................................................87
24. Land Ownership and Rights ........................................................................................90
25. Effectiveness of Agricultural Extension Officers .......................................................91
26. Facilitators and Inhibitors of Agricultural Transformation in Central Region ...........93
27. Facilitators and Inhibitors of Agricultural Transformation in Sarawak ......................99

vi
28. Lessons from Sarawak, Malaysia and the Desired Future Path for the Central
Region, Ghana ...........................................................................................................101

vii
ILLUSTRATIONS
Figure Page
1. Map of Ghana .............................................................................................................10
2. Map of Malaysia .........................................................................................................10
3. Ecological Zones, Ghana ............................................................................................11
4. Ecological Zones, Malaysia ........................................................................................11
5. Population Age Composition for Ghana and Malaysia 1960 and 2007 ......................13
6. Distribution of Income-Ghana and Malaysia ..............................................................14
7. Trends in Rural-Urban Populations Ghana and Malaysia 1960-2007 ........................15
8. Urbanization Across Time and Income Levels ...........................................................16
9. Growth Rate of Real GDP per Capita .........................................................................22
10. Real GDP per Capita, 1960-2008 ..............................................................................23
11. Gross Capital Formation ............................................................................................24
12. Predatory, Developmental and Intermediate States ...................................................40
13. Agro-ecological Zones of Ghana ...............................................................................64
14. Soil Map of Ghana .....................................................................................................65
15. Planted Area of Selected Crops in Ghana, 1961-2009 ..............................................66
16. Production of Selected Crops in Ghana, 1961-2009 ..................................................66
17. Fish Landings by Source in Ghana, 2000-2006 .........................................................69
18. Agro-ecological Zones, Peninsular Malaysia ............................................................72
19. Agro-ecological Zones, East Malaysia ......................................................................73
20. Map of Dominant Soils in Malaysia ..........................................................................73
21. Planted Area of Selected Crops in Malaysia, 1975-2009 ..........................................75
22. Production of Selected Crops in Malaysia, 1975-2009 .............................................75
23. Trend in Marine Fish Landings in Malaysia, 1970-2008 ..........................................76
24. Map of Central Region, Ghana ..................................................................................79
25. Map of Sarawak, Malaysia ........................................................................................81
26. Estimated Crop Area of Sarawak, 2008 .....................................................................82
27. The Sarawak Poultry Complex ..................................................................................98

viii
ACKNOWLEDGEMENTS
I would like to thank my family particularly Joe & Miyuki Dadzie, and Valerie K.
Strickland. I would also like to thank the School of Graduate Studies at UMKC, faculty in the
economics department notably Dr. James Sturgeon and Dr. Peter Eaton for their support
during my years in Kansas City. A special debt of gratitude is owed to members of my
committee Dr. Max J. Skidmore, Dr. Viviana Grieco, Dr. Steven Driever, Dr. Jan Kregel, Dr.
L. Randall Wray and notably my chair Dr. Mathew Forstater. A special thank you is
extended to Dr. Richard E. Schatz for his support since my undergraduate days. Finally, I
would like to thank all my friends in Kansas City-MO, Cape Coast and Accra, Ghana and
Kuching, Kota Samarahan and Lawas, Malaysia.

1
CHAPTER 1
INTRODUCTION
“The 21st century will be shaped by what happens not just in Rome or Moscow or Washington, but by what happens in Ghana as well […] Africa’s future is up to Africans”-(President Obama’s speech delivered to the Ghanaian Parliament in Accra, July 11th, 2009)
The geography of economic development over the past fifty years presents
fascinating and disturbing facts about the progress of countries in various regions of the
world. The growth and development of many countries in East Asia1
In recognizing the need for such analyses, scholars know the importance of historical,
cultural, geographical and sociological similarities and differences to the adoption of
successful policy initiatives across countries. Researchers and policymakers are also fully
aware that policies that are adopted must have the potential of being adapted to fit the
specific conditions of the countries where they are to be implemented.
has been phenomenal
and the limited progress in sub-Saharan Africa (SSA) has been baffling, frustrating and
disturbing for scholars and policymakers. The search for successful and replicable policies
from the East Asian experience has been ongoing and many scholars recognize the need for
country and sector-specific analysis of development experiences if important and replicable
lessons are to be found.
The growth and development of Ghana and Malaysia since their independence
presents a unique opportunity for such country and sector-specific analysis because of the
similarities of the two nations especially at independence. A comparison of these two
1 East Asia is broadly defined to include first tier countries (South Korea, Taiwan, Hong Kong and Singapore) and second tier nations (Malaysia, Thailand and Indonesia). It is important to note that this definition of East Asia does not conform to the geographical definition of the region; however, analytically East Asia is used to refer to these countries plus Japan in publications (see World Bank 1993).

2
countries today shows a divergence of development, the achievement of structural
transformation in Malaysia and the continued struggle of the Ghanaian economy.
Chapter 2 provides a background to Ghana and Malaysia and highlights the historical
and geographical similarities between the two nations. The dynamics of the overall
population and the rural-urban population is presented.
Chapter 3 focuses on the divergent development paths of the two nations by carefully
studying structural change. An overview of the two economies is provided, followed by a
review of the literature on the economic development of Ghana (and SSA) and Malaysia (and
East Asia). Major explanations for the divergent growth trajectories are discussed. The
purpose of this literature review is not only to identify explanations of divergence, but also to
shed light on the limited country and sector-specific analyses of SSA and East Asian
development and to encourage more of such research.
Chapter 4 is the theoretical backbone of this dissertation. A thorough discussion of
the developmental state and economic development is undertaken from a historical
perspective. Major themes in development thinking before and after World War II (WWII)
are discussed. Insights from the historical analysis are used in a discussion on reclaiming
policy space in SSA.
Chapter 5 provides sector-specific analysis of agriculture using the Central Region of
Ghana and the Malaysian state of Sarawak as a case study. Comparisons of agricultural
development are undertaken and lessons for agriculture in Ghana’s Central Region are
identified. Discussions in this chapter draw on field work in the two regions.
Chapter 6 concludes the dissertation. The discussion uses heterodox perspectives to
discuss issues of replication of the East Asian developmental state in Ghana and SSA. The

3
challenges and promises Ghana faces as it seeks to achieve its development goals are
discussed. Using a modern money perspective, I deem financing the developmental state to
be theoretically possible. Directions of future research are highlighted followed by
concluding remarks.
It is important to note that chapters two and three provide country-specific analysis,
chapter four provides the glue to the dissertation with the discussion of the developmental
state and chapter five offers an example of the developmental state at work by discussing
agricultural transformation and stagnation.
1.1 Purpose of Study
With a per capita real GDP of $713 in 2010, Ghana continues to struggle to develop
an economy that has always showed so much promise. For many individuals, the promise of
hope and progress that independence brought has been naught and hollow. Countries that
were once considered contemporaries like Malaysia and South Korea, have far outpaced
Ghana. The overall objective of this work is to present evidence on the divergence of the
development paths of Ghana and Malaysia and to ascertain replicable lessons for Ghana as
the country moves forward.
The focus on Ghana and Malaysia is not meant to obfuscate the important lessons that
can be learnt from the experiences of other countries in East Asia. A secondary but
complimentary objective is to identify the keys to successful structural change particularly in
the area of agricultural transformation and development. The objective of this work does not
assume a one-size fits all development policy. Rather, it recognizes the path dependency of
development experiences. The objective, however, assumes that for Ghana to be successful
4
in transforming its economy it must look to countries that have successfully achieved
structural change and development in the last five decades.
In achieving this objective, best practices that explain the success of Malaysia and
many countries in East Asia will be identified. The role of the state is highlighted. It will be
demonstrated that although no one model of East Asian development exists, several
important themes rooted in the history of development thinking can be found and often, these
themes run counter those generally accepted in conventional discussions of development2
1.2 Methodology
.
The method of this dissertation is qualitative. Descriptive and historical analysis of
literature and data is used in addition to a case study based on a focused ethnographic study
in Ghana and Malaysia. Comparative analyses are used throughout this dissertation.
Fieldwork in the Central Region of Ghana and Sarawak, Malaysia provide additional
comparative analysis and fill gaps in data. Critical analyses of development theory and
thinking since the Tudor plan of fifteenth century England until the modern period is used to
provide the theoretical basis for the dissertation. Theoretical foundations of the dissertation
are based on the work of heterodox development economists whose contributions have
broadened the understanding of the role of the state in structural and economic change
particularly in East Asia over the last five decades.
The choice of qualitative methods was influenced by the purpose of the dissertation.
First, this method allows me to learn from the perceptions of individuals I come in contact
with in both nations. Second, the issue of unequal availability and quality of data is mitigated
with this methodology. As is usually the case in developing countries, readily available data
2 The foundations of development thinking can be traced to Tudor England through Arthur Lewis up to the development experiences of East Asian countries over the last 50 plus years.
5
is hard to come by3
. This methodology allows me to add to the scant data as well as enrich
the research by adding humanness to it.
3 The data problem is particularly daunting in Ghana. For Malaysia, data on development indicators and agricultural statistics are readily available online at the website of the Jabatan Perangkaan (Department of Statistics) and Jabatan Pertanian (Department of Agriculture).

6
CHAPTER 2
BACKGROUND TO GHANA AND MALAYSIA
“Within the developing world itself there are marked differences in levels of poverty. If we compare the years 1985 and 2000, the number of people in poverty (as defined by the World Bank) has fallen most sharply in East Asia […] in sub-Saharan Africa, however, slow economic growth and rapid population growth have meant a significant increase in levels of poverty”- (Hodder 2000)
Ghana and Malaysia are many miles apart, but the historical, geographical and socio-
cultural similarities between two nations bring them closer. While some of the similarities are
not perfect, they present an interesting case of two nations with similar conditions that have
diverged in their growth and development. It also points to an even important fact, which is
that for Ghana to develop its economy, it must try to mimic the Malaysian model in ways that
fit with its own economy (Asare and Wong 2004, Khan 2009 and Ocampo, J., KS, Jomo.,
and Vos, R 2007).
The purpose of this chapter is to provide an introduction and background to these
two nations using the development geography approach developed by Rupert Hodder and
many other geographers. Development geography studies standards of living, quality of life,
social and spatial inequalities within and between countries by carefully looking at history,
population dynamics (demography), dynamics of rural-urban populations and agglomeration
and the role of the state in economic development (Hodder 2000, Scott and Garofoli 2007).
2.1 Historical and Geographical Introduction
Ghana and Malaya (now peninsular Malaysia) gained their independence from Britain
on March 6th, 1957 and August 31st, 1957 respectively. After various negotiations present-
day Malaysian states of Sarawak and Sabah and now independent Singapore joined Malaya

7
on July 10th, 1963 to form the Federation of Malaysia1
Modern Ghana was once a collection of British territories with the centerpiece being
the Gold Coast Colony. After World War II (WWII), parts of German controlled Togoland
were ceded to the British to form the modern day Volta Region of Ghana. The push for
independence was intensified after riots on February 28th, 1948 in Accra and the actions of
Dr. Kwame Nkrumah and other nationalists from the United Gold Coast Convention against
the British colonial administration led to independence in 1957
(Rawlins 1965, Reece 2004 and
Encyclopedia of Malaysia: Volume 11, 2007).
2
The Malaysian struggle for independence intensified in the period around WWII
when the superiority of the British was put into doubt especially after the Japanese overrun
the peninsular and the northern territories of Borneo. The Japanese invasion and occupation
in 1941 spurred nationalism across what is now Malaysia. The ruthlessness and brutality of
Japanese rule brought unity as well as division among the various ethnic groups in Malaysia.
However, the tireless efforts of Dato Onn Bin Ja’afar, Tunku Abdul Rahman and others led
.
1 Sarawak was ceded to Britain in 1946 after about 100 years of rule by the Brooke family and a short period under Japanese occupation during World War II. Sabah was controlled by the North Borneo Company. On August 9th, 1965, Singapore was no longer a member of Malaysia and subsequently became its own country. 2 The riots of 1948 occurred after African ex-servicemen who fought on behalf of Britain during WWII were killed at Christianborg castle by an English as the veterans attempted to request their pensions which were 3 years past due. The superiority of the English was also in serious doubt after WWII. Dr. Nkrumah who arrived in the Gold Coast around this time at the call of the United Gold Coast Convention had countless run-ins with then Governor Arden- Clarke. Arden-Clarke documented his meetings with Dr. Nkrumah and the difficulties Britain faced as Ghana fought for her independence (See “Gold Coast into Ghana: Some Problems of Transition”, International Affairs, 34(1): 49-56 and 1958 “Eight Years of Transition in Ghana”, African Affairs, 57(226): 29-37). In his documents, Governor Arden-Clarke remarked about the pious but yet ferocious nature of Dr. Nkrumah and other nationalists. Governor Arden-Clarke also provides another unique similarity between Ghana and Malaysia since he served as the first governor of Sarawak after Vyner Brooke relinquished control over the territory.

8
to “Merdeka” (independence) in 19573
Circa independence, the two nations were agricultural and commodity-based
economies largely serving British colonial purposes. Ghana’s economy was defined by cocoa
cultivation and gold mining and Malaysia’s economy was largely dependent on rubber
production and tin mining. More than half of the labor force in both nations was engaged in
the production of primary products; with a significant portion of their exports heading to
Britain as would have been the case during the colonial era.
.
Socio-culturally, Ghana and Malaysia are similar. Ethnic, linguistic and religious
diversity exists in both nations. Ethnically, there are over 20 groups in both nations. In
Ghana, the major groups are the Akan (45%), Mole-Dagbon (15%), Ewe (12%) and Ga
Adangme (7%). In Malaysia, the major groups are the Melayu or Malay (51%), Chinese
(24%), Indians (mostly Tamil; 8%). Minor ethnic groups in Ghana include the Guan, Gurma,
Grusi and Nzema. In Malaysia minor ethnic groups include the Kelabits, Bidayuhs, Kayans,
Penans and Lun Bawungs.
Linguistically, various languages are spoken in both nations and most citizens speak
one or more of the native languages and some English. The official language of Ghana and
Malaysia is English and Bahasa Malaysia, respectively although English is the second
official language of Malaysia. Religious diversity characterizes both nations. In Ghana
Christianity accounts for over 60% of the religious population and Islam and native religions
are freely practiced. In Malaysia, Islam is the official religion but constitutional provisions
3 Armed resistance on the Peninsular begun with the Perak War in 1875 after the death of colonialist J. W. W. Birch. Uprisings in Pahang (1891-1895), North Borneo now Sabah (1895), Kelantan (1915), Terengganu (1928) and the revolt against colonization in Sarawak (1949) were all important events in the struggle for statehood in Modern Malaysia (see Encyclopedia of Malaysia: Government and Politics, p. 6-22). Japanese rule in Malaysia was ruthless and barbaric in several instances. Sook Ching (clean–up) initiated and carried out by Japanese forces was blamed on Colonel Masanobu Tsuji. This “clean-up” referred to the massacre of many Chinese mostly in Singapore and the peninsular.

9
allow the practice of other religions like Christianity, which is especially common among
native peoples of Borneo like the Lun Bawungs. Buddhism, Hinduism, Confucianism and
Taoism are also practiced in Malaysia (Bodomo 1996, Ghana 2000 Population and Housing
Census, Encyclopedia of Malaysia: Volume 9, 10, 12 and 13, Reece 2004 and Yearbook of
Statistics Malaysia 2008).
Geographically, Ghana and Malaysia are located near the equator and in the tropics.
Their capital cities are Accra and Kuala Lumpur. Ghana is located almost at the geographical
center of world’s geographical grid at 5 degrees north and 2 degrees west with the Greenwich
meridian going through the city of Tema. Malaysia is located at 2 degrees 30 minutes north
and 112 degrees 30 minutes east. The two nations are located in West Africa and Southeast
Asia respectively. The estimated population in 2010 was 24 million for Ghana and 28 million
for Malaysia. Ghana shares a border to the north with Burkina Faso, to the east with Togo
and to the west with Côte d’Ivoire. The Gulf of Guinea provides important marine resources
and global access via sea routes for Ghana. Peninsular Malaysia shares a border to the north
with Thailand and to the south with Singapore. Eastern Malaysia forms the northern portion
of the Island of Borneo and shares a southern border with Kalimantan, Indonesia. The South
China Sea provides marine resources for Malaysia and the Strait of Malacca form an
important waterway for the nation as it provides the easiest route to the Indian Ocean.
The total land area of Ghana is 238,535 sq. km (92,099 sq. miles) with a coastline of
335 miles. Peninsular and East Malaysia combine for a total land area of 329,845 sq. km
(127,354 sq. miles) with a coastline of 2,905 miles. The most important geographical feature
of Ghana’s land area is the Volta Lake which runs north to south in the eastern half of the
country and covers 8,502 sq. km (3,283 sq. miles). Malaysia’s terrain is characterized by

10
mountainous interior and coastal lowlands. The highest point in Ghana is the 2,625 feet
above-sea-level Mount Afadjato in the Volta Region. Mount Kinabalu in Sabah is the highest
point in Malaysia and sits at 13,435 feet above sea level in Sabah. Figures 1 and 2 are maps
of Ghana and Malaysia.
Figure 1: Map of Ghana retrieved from,
http://images.nationmaster.com/images/motw/africa/ghana_rel95.jpg
Figure 2: Map of Malaysia retrieved from www.biologie.uni-hamburg.de/.../malaysia.htm

11
Ecologically, the two nations are similar. They both have tropical forests (rain and
moist semi-deciduous) covering most of their land area. Ghana has more varied ecological
zones than Malaysia implying that the agricultural capabilities of Ghana will likely be more
varied than Malaysia’s. Figure 3 and 4 show the various ecological zones of the two nations.
Figure 3: Ecological Zones, Ghana. Adapted from www.fao.org
Figure 4: Ecological Zones, Malaysia. Adapted from www.fao.org
LEGEND
Tropical Rainforest
Tropical Moist Deciduous Rainforest
Water
Tropical Dry Forest
LEGEND
Tropical Rainforest
Water

12
2.2 Population Dynamics
The relationship between population growth and economic development is not
completely clear but in recent years, there appears to be a consensus position. First,
population growth is not the primary cause of low levels of living, gross inequalities, or the
limited freedom of choice that characterize much of the developing world. Second, the
problem of population is not simply one of numbers, but rather involves the quality of life
and material well-being. Third, rapid population growth does serve to intensify problems of
underdevelopment and makes the prospects for development much more difficult (Cassen
1994, Todaro and Smith 2009, p. 302-303). Table 1 presents information on the population
levels by decades for the two nations.
Table 1: Population (in millions) 1960 1970 1980 1990 2010 Ghana 6.8 8.7 10.7 15.6 23.8 Malaysia 8.1 10.9 13.8 18.1 28.3 Source: World Development Report 2000/2001 and World Development Indicators. Average population growth rates for Ghana and Malaysia were 3% for the 1960s and 70s and 2.4% and 2.3% respectively for Ghana and Malaysia afterwards. The population age composition has changed for both countries from 1960 to present.
The data shows that dependency ratios were identical in 1960 but different in 2007. Figure 5
shows that in 1960 53% of Ghana’s population was supporting the remaining 47% and in
Malaysia, 51% of the population was supporting the remaining 49% who were too young or
too old. In 2007, 58% of the Ghanaian population was supporting the remaining 42% and
65% of the Malaysian population was supporting the remaining 35%.
The phenomenon in Figure 5 has dual implications for both countries. For Ghana, it
implies that in the short period, dependency ratios are high, since a smaller portion of the
population is supporting a comparatively bigger portion, however, in the long period; Ghana

13
has the potential to add more of its citizens to its active population (ages 15-64). In the
Malaysian case, the reverse is true. In the short period, a smaller portion of the population
has be to supported by the working age population but in the long period (say 20 years into
the future), the aged population (65 years and above) will be increasing faster than the
growing population (0-14 years) and thus fewer citizens will be added to its labor force in
comparison to Ghana.
Figure 5: Population Age Composition. Calculations based on various editions of World Development Indicators, World Tables and Yearbook of Statistics-Malaysia 2008 Figure 6 is a Lorenz curve showing the distribution of income across various quintiles
of the population of both countries over a 10 year period. Gini4
4 Gini closer to 0 implies that incomes are more equally distributed across the population. Gini closer to 1 implies that incomes are more unequally distributed across the population.
indices are calculated for
each of the periods. For Ghana in 1997, the Gini was 0.327 and in 2006 it was 0.428. For
Malaysia, the Gini was 0.485 in 1995 and 0.379 in 2004. Based on the evidence from 1960
and 2007, income distribution across the population of Ghana worsened and improved in
Malaysia.
0
20
40
60
80
100
Ghana 1960 Malaysia 1960 Ghana 2007 Malaysia 2007
44 45 38 30
53 51 58 65
3 4 4 5
Population Age Composition for Ghana and Malaysia 1960 and 2007
Ages 0-14 Ages 15-64 Ages 65+

14
Figure 6: Distribution of Income for Ghana and Malaysia. Calculations based on various editions of World Development Indicators and World Tables
2.3 Dynamics of Rural-Urban Populations
Urbanization in the last decade of the 20th century was spearheaded by Asia and
Africa. Rural-urban migration in countries in these parts of the world has been very
aggressive. African and Asian cities have increasingly become major players in the global
economy and poverty, once considered a rural issue has become increasingly urban.
Historically, the preconditions that have supported urbanization have been two-fold. First
surplus products needed to sustain populations in the non-agricultural sector has to be
available. Second, social and infrastructural development must be high enough to support a
larger population. In developing countries in Asia and Africa, urbanization and agricultural
productivity have gone hand in hand. For example, cities in Malaysia and Indonesia grew on
the basis of rubber and oil palm production and cities in Ghana have grown on the basis of
cocoa production (Clark 1996 and 1998, Todaro and Smith 2009).
0
10
20
30
40
50
60
70
80
90
100
0% Lowest 20% Second 20% Third 20% Fourth 20% Highest 20%
Lorenz Curves for Ghana and Malaysia
Ghana 1997 Ghana 2006 Malaysia 1995 Malaysia 2004
Line of Equality

15
The dynamics of rural urban populations for Ghana and Malaysia have been similar
and both have become more urban. Figure 7 presents evidence on the trends in rural and
urban populations. In the 1960s, both nations had less than 30% of their population in urban
areas, but 50 plus years later more than 50% of the population of these nations were in urban
areas (Ghana 50.2% and Malaysia 70.4% in 2008). In Ghana, the urban population surpassed
the rural population in 2007 and Malaysia, this urbanization of the population occurred in the
1990s.
Figure 7: Trends in Rural and Urban Populations of Ghana and Malaysia, 1960-2007. Calculations following Todaro and Smith 2009, Chapter 7 and based data retrieved from various editions of World Development Indicators and World Development Reports. The urbanization of poverty is evident across major African cities. Figure 8, presents
evidence on urbanization across time and income levels. The relationship between the urban
population and real GDP per capita (in 2005 US dollars) is plotted for both countries to show
minimal variation between real GDP per capita and the urban population in Ghana. In
Malaysia, however, as urban populations rose, so did real GDP per capita. It could be
inferred that, rural-urban migration in Ghana has yielded minimal income gains on average
0.002.004.006.008.0010.0012.0014.0016.0018.0020.00
0.00
2.00
4.00
6.00
8.00
10.00
12.00
14.00
1960 1970 1980 1990 2000 2007
Popu
latio
n (m
illio
ns)
Trends in Rural and Urban Populations
Urban Ghana Rural Ghana Rural Malaysia Urban Malaysia

16
for the average Ghanaian and has yielded positive income gains on average for the average
Malaysian.
Figure 8: Urbanization across Time and Income Levels for Ghana and Malaysia. Calculations followed Todaro and Smith 2009, Chapter 7 and data retrieved from various editions of World Development Indicators, World Development Reports and Alan Heston, Robert Summers and Bettina Aten, Penn World Table Version 6.3, Center for International Comparisons of Production, Income and Prices at the University of Pennsylvania, August 2009.
Chapter three follows this overview of the two nations by discussing the divergence
in their development experiences since their independence. This chapter reviews specific
literature on the subject and provides evidence of the divergence. An explanation of the
divergence is also provided and discussed.
0.010.020.030.040.050.060.070.080.0
0.0
10.0
20.0
30.0
40.0
50.0
60.0
0 2000 4000 6000 8000 10000 12000 14000 16000 18000 20000
Urb
an P
opul
atio
n (a
s a %
of t
otal
pop
ulat
ion)
Real GDP Per Capita (2005 US $)
Urbanization Across Time and Income Levels
Ghana Malaysia

17
CHAPTER 3
ECONOMIC DEVELOPMENT IN COMPARATIVE PERSPECTIVE: THE CASE OF GHANA AND MALAYSIA SINCE INDEPENDENCE
“Rapid and sustained economic growth in the most successful developing countries has involved a process of late industrialization in which the production structure has shifted from the primary sector to manufacturing, alongside a progressive move from less to more technology- and capital-intensive activities both within and across sectors, allowing countries to build competitiveness in a range of activities established in more advanced countries […] such a process of sustained rapid growth has generally been absent in SSA”- (Akyuz and Gore 2001)
The development path of Ghana and Malaysia since their independence provides an
excellent example of the divergence of development between SSA and East Asia. The goal of
this chapter is to review literature on this divergence, present evidence of the divergence and
discuss factors that help explain it.
The discussion in this chapter should prompt Ghanaians in two ways. First, it should
remind them of the mistakes made thus far and second, it should encourage them about the
chances1
3.1 Review of Literature
of development especially if they draw on the experiences of Malaysia and East
Asia.
Recently, interest in comparative studies of development between Ghana and
Malaysia has been on the rise. Contributions by Asare and Wong (2004) and Khan (2009)
have been important in this regard. Ghana’s National Development Planning Commission
(GNDPC) has also added to the interest by way of chapter 1 of its seven year plan published
in 2008. Comparative studies between SSA and East Asia have also been on the rise. The
United Nations Conference on Trade and Development (UNCTAD) provided excellent
1 Especially with the stable democracy that is now 19 years old and the recent discovery of commercial quantities of oil.
18
analyses in their “African Development in Comparative Perspective” (1999) and “Economic
Development in Africa Series” (2001-2007). The Cambridge Journal of Economics (2001)
also released a special edition of the journal dedicated solely to comparative studies of
development between SSA and East Asia.
Asare and Wong (2004) presented evidence on the similarities and differences
between the two nations. They argued that the main factors explaining divergence was
political instability, poor human development, lack of a diversified economy and a domestic
entrepreneurial group, and the negative impact of the West African regional economy. Little
advice on policy actions for Ghanaian development is offered. The authors conclude by
focusing their discussion on what donor countries and agencies can do to assist Ghana.
Khan (2009) focused on the political instability explanation for divergence. His
analysis focused on the connections between politics and economic development. Excellent
historical and political backgrounds to the two nations are presented. The study lacks in data
and evidence on divergence. Khan concluded that while Malaysia had maintained a stable
political environment which had been instrumental in the execution of development plans,
Ghana’s political stability had been sporadic at best.
Chapter 1 of the GNDPC’s seven year development plan (2008) discussed the
development of Ghana and Malaysia in a comparative perspective. The chapter suggested
that the main reason for the slow pace of Ghana’s development had been the lack of
adherence to national development plans. Evidence is presented to show that ad hoc planning
and poor implementation of development plans has contributed to Ghana’s poor development
record. Malaysia’s success in executing development plans is highlighted along with the
active role of the state in structural change and economic transformation.

19
On a regional scale and using a heterodox perspective, Akyuz and Gore (2001)
provided analyses of divergence between SSA and East Asia. They argued that conventional
explanations of poor economic performance in SSA in the post-independence period (1957- )
failed to pay adequate attention to the causal mechanisms of growth, decline and stagnation.
They noted that many African countries experienced investment booms after independence;
however the inability to sustain investment levels contributed to their failure to establish a
virtuous cycle of growth where savings, investment and exports were interconnected2
The external vulnerability of African economies due to their reliance on primary
products and post-colonial policy dilemmas are argued to have contributed to the continent’s
poor development. Two arguments used by mainstream economists to explain poor economic
development in SSA are identified and discredited by the authors
.
3
The authors reached three important conclusions. The first was that the central policy
task for countries in SSA should be to raise rates of private investment in productive activity,
and establish a strong nexus between savings, investment and exports. The second was that
SSA should learn from East Asia but must recognize the structural differences between the
. They argued that these
reasons failed to account for the complex interplay of internal and external factors in the
African growth and development experience.
2 They showed that in East Asia the engine of structural change was the rapid pace of capital accumulation made possible only through high rates of investment and the strong nexus between investment and profits. Profits provided simultaneously the incentives of firms to reinvest and their capacity to finance new investment. Investment raised the profits by enlarging the stock of productive capital. The role of foreign and domestic savings is discussed and the savings-investment-exports nexus is argued to have provided the necessary virtuous cycle needed for growth and development. 3 The roots of the first reason can be found in the Berg Report (1981) which focused on the policy mistakes made by states in SSA. This report demonized the African state and provided ammunition to neoliberal policy measures which were carried out in SSA. The second reason is rooted in the works of Sachs (1997) and Easterly (1997). The argument of these scholars dwelled on deep rooted institutional and structural constraints including geography, ethno-cultural divisions and demography. Trezzini (2001) argued that ethnic divisions allowed for an increased role of the state in order to achieve its developmental goals in Malaysia. He also argued that there is no direct relationship between ethnic divisions and economic development. He stressed that if that were the case then Malaysia should be nowhere near its current levels of development.

20
regions. The third conclusion was that an active role for the government is necessary4
“Economic Development in Africa: Reclaiming Policy Space” was the eighth
publication in UNCTAD’s Economic Development in Africa Series. This 2007 publication
discussed issues of domestic resource mobilization and ways to improve it in SSA.
Suggestions for raising and channeling domestic savings into productive enterprise are
discussed. It is argued that financial systems of SSA are simply not up to the task of
supporting private enterprise since huge portions of the population do not use banks and
other financial entities (the report estimated that in Ghana only 5-6% of the population has
access to the banking sector).
. In
addition to their conclusions, the authors noted that a major lesson from the East Asian
development experience for SSA was that institutional capacities for growth and
development are built up through a learning process and that institutional capacities are
socially engineered phenomena.
The developmental state advocated by UNCTAD is discussed in chapter 3. It is
argued that the actions of such states in East Asia played an important role in their resource
mobilization for development. It is argued that mobilization of resources for development in
SSA depends on the ability of states in SSA to achieve the developmental state status reached
by many states in East Asia. The challenges of nurturing such states in SSA are highlighted.
It is argued that simply replicating the so-called East Asian model will not suffice. It was
suggested that policy initiatives must be made with an awareness of international and
geopolitical influences since some of these may run counter to national development goals.
4 This role must go beyond the minimalist state of neoclassical economists and must include a bold vision of development that incorporates a comprehensive and realistic assessment of institutional capacities.

21
UNCTAD’s study asserts in the strongest terms that errors from policy initiatives
must be expected and welcomed as learning opportunities by states in SSA if they are to
develop as their counterparts in East Asia did. Like Akyuz and Gore (2001), the report
accepts that institutional capacities for growth and development are socially engineered.
One of the most important conclusions of this report was that;
Advocating the use of government policy to correct some of the egregious excesses of the market is not tantamount to a return to statist or protectionist economic policies. Rather it is a call to move away from the preoccupations with policies based on the ideological divide of laissez-faire and dirigisme to a set of more refined and eclectic policy measures that combine features of both, but tailored to the specific development challenges or circumstances of each country. In other words, it is a move to a kind of a la carte development policy menu […] a developmental state must be committed to a development ideology as a long-term predictable strategy. The escape of sub-Saharan Africa from poverty may be more challenging in the present circumstances than for East Asia, but fatalism is unwarranted, and the means of escape could yet be found in the developmental state paradigm (p. 86 and p. 88).
The review of the literature highlights two important facts. First, a serious commitment to
development in SSA is needed and second, a new form of developmentalism that draws on
the experiences of East Asia must be adopted.
3.2 Divergence in the Ghanaian and Malaysian Economies
When Ghana and Malaysia achieved their independence in 1957, they were perfect
examples of archetypal single crop economies. Ghana was (and is still) well known for its
cocoa. Malaysia was famous for its natural rubber. These two crops along with mining
activities accounted for more than half of the foreign exchange earnings for both nations
(Clark 1998).
In the post-independence era, the connection between savings, investment and exports
and the growth in real GDP (in absolute and per capita terms) has been dismal for Ghana and
astounding for Malaysia. Table 2 shows average growth rates for real GDP and real GDP per

22
capita. In Ghana, the period 1971-1990 were characterized by low growth. Over the same
period in Malaysia, growth rates were above 5% percent and the highest average growth rates
were close to 8%. Growth rates in Malaysia have been over 5% for more than four decades, a
feat achieved in Ghana starting from 2001-2008.
Table 2: Growth Rates of Real GDP and Real GDP per Capita (%), period averages Real GDP 1961-70 1971-80 1981-90 1991-2000 2001-2008 Ghana 3.04 0.52 2.28 4.3 5.58 Malaysia 6.49 7.87 6.03 7.3 5.07 Real GDP per Capita 1957-67 1968-77 1978-87 1988-97 1998-2008 Ghana 0.26 5.09 -0.64 0.46 3.18 Malaysia 2.72 6.53 3.13 7.13 3.34 Source: World Development Indicators and Alan Heston, Robert Summers and Bettina Aten, Penn World Table Version 6.3, Center for International Comparisons of Production, Income and Prices at the University of Pennsylvania, August 2009
Figure 9, shows the trend in real GDP growth. Growth rates have been mostly
positive for Malaysia except for notably deviations in 1999 during the Asian financial crisis
and in 2001 in the global economic recession. Negative growth rates are also observed in the
mid 1950s, 1970s and 1980s. In Ghana, growth rates have been wildly erratic.
Figure 9: Growth Rate of Real GDP per Capita. Calculations based on Alan Heston, Robert Summers and Bettina Aten, Penn World Table Version 6.3, Center for International Comparisons of Production, Income and Prices at the University of Pennsylvania, August 2009
-40-30-20-10
010203040
1957
1959
1961
1963
1965
1967
1969
1971
1973
1975
1977
1979
1981
1983
1985
1987
1989
1991
1993
1995
1997
1999
2001
2003
2005
2007
Growth Rate of Real GDP (% of GDP), 1957 - 2007
Ghana Malaysia

23
Figure 10 shows the trend in per capita incomes. It reveals an astounding divergence
in the income levels of the two countries from 1960-2008. In 1960, average incomes were
$179 and $300 in Ghana and Malaysia respectively. In 2008, average incomes were $713
and $8,209.
Figure 10: Real GDP per Capita 1960-2008. Calculations based on World Development Indicators 2009
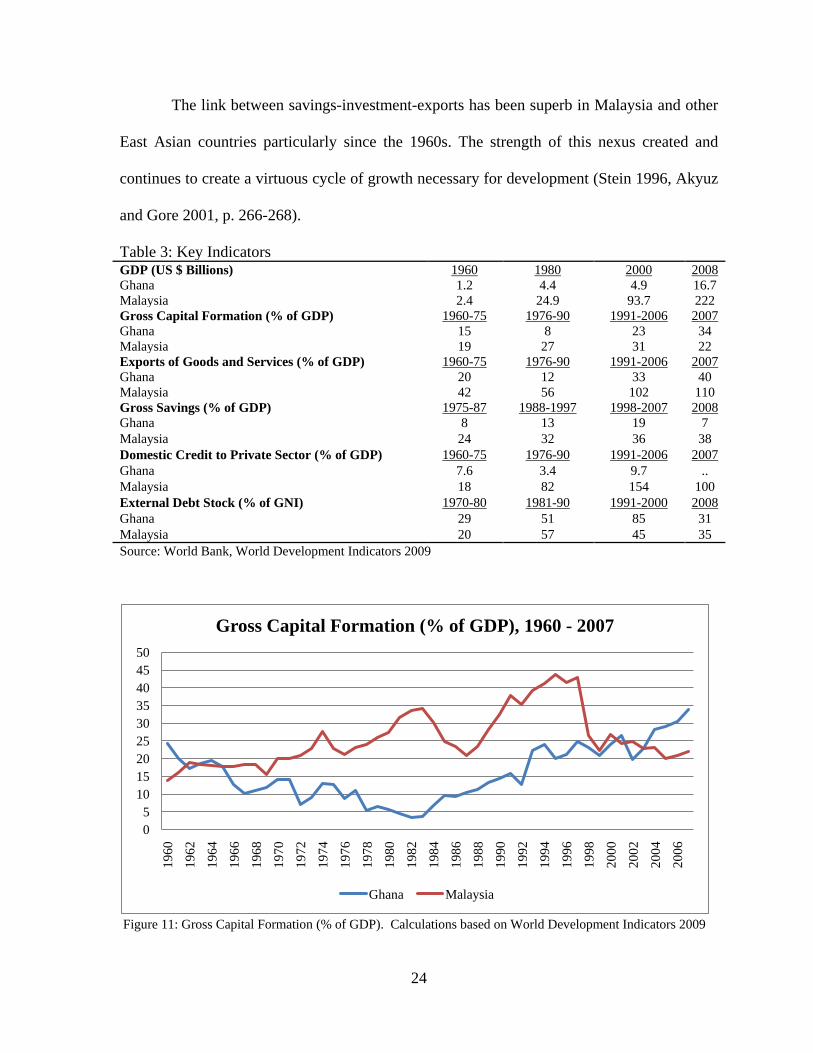
Table 3 presents evidence on GDP, investment, savings and exports. In 1960, the
GDP of Malaysia was twice that of Ghana, but in 2008, it was thirteen times larger. Gross
capital formation (a proxy for investment) was identical in the first fifteen years after
independence, but since the 1970s, Malaysia has outpaced Ghana in the addition of new fixed
assets to the economy (as shown in figure 11). Savings rates have also been higher in
Malaysia. The role of exports in the Malaysian (and East Asian) development experience is
well documented. Since the 1960s, exports as a percent of GDP have risen each decade up to
the current period. Comparatively, the role of exports in Ghana has been minor and largely
restricted to the exports of crude agricultural products.
0100020003000400050006000700080009000
1960
1962
1964
1966
1968
1970
1972
1974
1976
1978
1980
1982
1984
1986
1988
1990
1992
1994
1996
1998
2000
2002
2004
2006
2008
Cur
rent
US
$
Real GDP per Capita, 1960-2008
Ghana Malaysia
24
The link between savings-investment-exports has been superb in Malaysia and other
East Asian countries particularly since the 1960s. The strength of this nexus created and
continues to create a virtuous cycle of growth necessary for development (Stein 1996, Akyuz
and Gore 2001, p. 266-268).
Table 3: Key Indicators GDP (US $ Billions) 1960 1980 2000 2008 Ghana 1.2 4.4 4.9 16.7 Malaysia 2.4 24.9 93.7 222 Gross Capital Formation (% of GDP) 1960-75 1976-90 1991-2006 2007 Ghana 15 8 23 34 Malaysia 19 27 31 22 Exports of Goods and Services (% of GDP) 1960-75 1976-90 1991-2006 2007 Ghana 20 12 33 40 Malaysia 42 56 102 110 Gross Savings (% of GDP) 1975-87 1988-1997 1998-2007 2008 Ghana 8 13 19 7 Malaysia 24 32 36 38 Domestic Credit to Private Sector (% of GDP) 1960-75 1976-90 1991-2006 2007 Ghana 7.6 3.4 9.7 .. Malaysia 18 82 154 100 External Debt Stock (% of GNI) 1970-80 1981-90 1991-2000 2008 Ghana 29 51 85 31 Malaysia 20 57 45 35 Source: World Bank, World Development Indicators 2009
Figure 11: Gross Capital Formation (% of GDP). Calculations based on World Development Indicators 2009
05
101520253035404550
1960
1962
1964
1966
1968
1970
1972
1974
1976
1978
1980
1982
1984
1986
1988
1990
1992
1994
1996
1998
2000
2002
2004
2006
Gross Capital Formation (% of GDP), 1960 - 2007
Ghana Malaysia

25
A careful look at figure 11 shows that from 1960-1965, Ghana added more fixed
assets to its economy than Malaysia but since 1966, Malaysia outpaced Ghana until about
2003. Thirty-seven years of infrastructural development in Malaysia through investments in
fixed assets has contributed to its current development level.
Improvement in the quality of life is also an important indicator of economic
development. Table 4 presents data on selected social indicators of development. These
indicators provide insights into the state of education, health facilities and infrastructure in
these countries. Life expectancy, literacy rates and percentage of roads paved in Ghana are
well below the levels in Malaysia. Infant mortality is about 8 times higher in Ghana and for
children under the age of 5, 14% of them are afflicted by malnutrition. The social indicators
presented show that the quality of life is much higher in Malaysia.
Table 4: Selected Social Indicators of Development Most Recent Estimates (latest year available, 2002-08) Ghana Malaysia Life Expectancy at Birth (years) 57 74 Infant Mortality (per 1000 live births) 51 6 Child Malnutrition (% of children under 5) 14 .. Access to an improved water source (% of population) 80 99 Literacy (% of population age 15 +) 65 92 Roads Paved (% of total roads) 15 79 Source: World Bank, World Development Indicators 2009: Country at a glance series
3.3 Structural Change in the Ghanaian and Malaysian Economies
Structural change is an important indicator of development and evidence of it is best
shown by looking at the contributions (in terms of value added to GDP) and the share of
labor force engaged in agricultural, industrial and service activities in an economy. The
ability of an economy to move from largely agricultural to industrial and service oriented
activities reflects structural change. Tables 5 and 6 show the structure of the two economies
and tables 7 and 8 show share of the labor force employed by each sector.
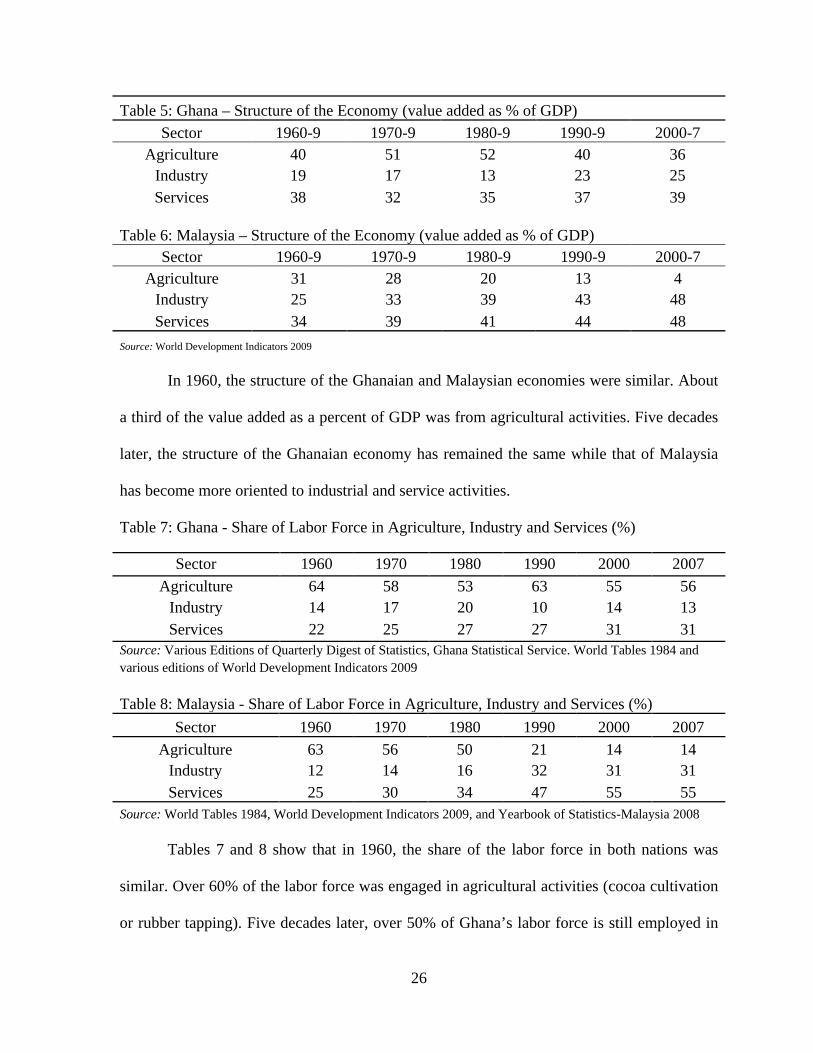
26
Table 5: Ghana – Structure of the Economy (value added as % of GDP) Sector 1960-9 1970-9 1980-9 1990-9 2000-7
Agriculture 40 51 52 40 36 Industry 19 17 13 23 25 Services 38 32 35 37 39
Table 6: Malaysia – Structure of the Economy (value added as % of GDP) Sector 1960-9 1970-9 1980-9 1990-9 2000-7
Agriculture 31 28 20 13 4 Industry 25 33 39 43 48 Services 34 39 41 44 48
Source: World Development Indicators 2009
In 1960, the structure of the Ghanaian and Malaysian economies were similar. About
a third of the value added as a percent of GDP was from agricultural activities. Five decades
later, the structure of the Ghanaian economy has remained the same while that of Malaysia
has become more oriented to industrial and service activities.
Table 7: Ghana - Share of Labor Force in Agriculture, Industry and Services (%)
Sector 1960 1970 1980 1990 2000 2007 Agriculture 64 58 53 63 55 56
Industry 14 17 20 10 14 13 Services 22 25 27 27 31 31
Source: Various Editions of Quarterly Digest of Statistics, Ghana Statistical Service. World Tables 1984 and various editions of World Development Indicators 2009
Table 8: Malaysia - Share of Labor Force in Agriculture, Industry and Services (%) Sector 1960 1970 1980 1990 2000 2007
Agriculture 63 56 50 21 14 14 Industry 12 14 16 32 31 31 Services 25 30 34 47 55 55
Source: World Tables 1984, World Development Indicators 2009, and Yearbook of Statistics-Malaysia 2008 Tables 7 and 8 show that in 1960, the share of the labor force in both nations was
similar. Over 60% of the labor force was engaged in agricultural activities (cocoa cultivation
or rubber tapping). Five decades later, over 50% of Ghana’s labor force is still employed in

27
agricultural activities compared to Malaysia’s 14%. Tables 5-8, show that structural change
has occurred in Malaysia and not in Ghana. This change in Malaysia has been accompanied
by advances in the distribution of income as shown in figure 6 of chapter 2. A rising tide
seems to have lifted all boats in Malaysia.
3.4 Why Divergence? – An Explanation
The review of literature and evidence presented shows two nations similar at
independence, but different five decades later. From the literature, factors explaining the
divergence have included political instability and corruption, the absence of a connection
between savings, investment and exports, poor investment in human development, a lack of
diversification in economic activities, an absence of an entrepreneurial class, poor regional
spillover effects and influence from the regional economy, and the role of foreign direct
investment in building up capacities in various sectors of the economy especially in industry.
Asare and Wong (2004) and Khan (2009) stressed the importance of political
instabilities to the divergence of development between Ghana and Malaysia. Political
instability in Ghana started with a coup d’état against the government of Dr. Kwame
Nkrumah in 1966. Subsequent coup d’états in 1972, 1978 and 1981 interrupted efforts to
build a stable atmosphere for the pursuit of development goals. Years of coup d’états have
corresponded with declines in real GDP. Real GDP declined by 2.5% following the 1972 and
1978 coups and in 1982, a 6.9% decline in real GDP was experienced after the 1981 coup
d’état. In Malaysia, the only blemish on political stability occurred on May 13th, 1969. Ethnic
violence between Chinese and Malay groups in Kuala Lumpur, then part of the state of
Selangor threatened political stability. In the aftermath of the events of May 13th, government
28
was strengthened and various incarnations of the same party (now Barisan Nasional) has won
every election (BBC, “Two countries’ contrasting tales”, April 4th, 2005).
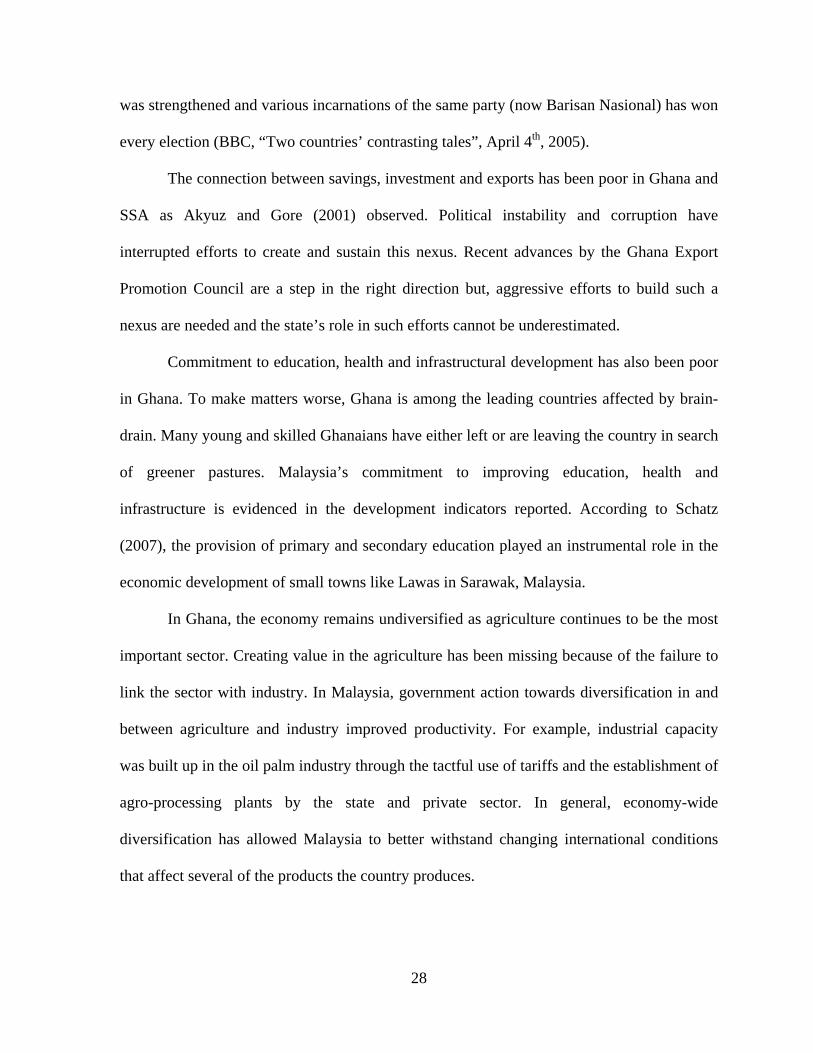
The connection between savings, investment and exports has been poor in Ghana and
SSA as Akyuz and Gore (2001) observed. Political instability and corruption have
interrupted efforts to create and sustain this nexus. Recent advances by the Ghana Export
Promotion Council are a step in the right direction but, aggressive efforts to build such a
nexus are needed and the state’s role in such efforts cannot be underestimated.
Commitment to education, health and infrastructural development has also been poor
in Ghana. To make matters worse, Ghana is among the leading countries affected by brain-
drain. Many young and skilled Ghanaians have either left or are leaving the country in search
of greener pastures. Malaysia’s commitment to improving education, health and
infrastructure is evidenced in the development indicators reported. According to Schatz
(2007), the provision of primary and secondary education played an instrumental role in the
economic development of small towns like Lawas in Sarawak, Malaysia.
In Ghana, the economy remains undiversified as agriculture continues to be the most
important sector. Creating value in the agriculture has been missing because of the failure to
link the sector with industry. In Malaysia, government action towards diversification in and
between agriculture and industry improved productivity. For example, industrial capacity
was built up in the oil palm industry through the tactful use of tariffs and the establishment of
agro-processing plants by the state and private sector. In general, economy-wide
diversification has allowed Malaysia to better withstand changing international conditions
that affect several of the products the country produces.

29
The role of domestic entrepreneurial activity in economic development is crucial no
matter how that entrepreneurship arises. Unlike Ghana, domestic entrepreneurship in
Malaysia is truly unique because it is overwhelmingly dominated Chinese entrepreneurs5
The Association of Southeast Asian Nations (ASEAN) has been an important
economic bloc for Malaysia. Many of the countries in the bloc have showed tremendous
progress in recent years. At the very least, ASEAN has presented to Malaysia and the world a
stable region for which to trade and do business with. Besides ASEAN, countries in northeast
Asia, particularly Japan and South Korea have provided excellent examples of growth and
development for Malaysia. Dr. Mahathir Mohammed’s Look East initiative drew some
inspiration from the progress made by other East Asian nations. In contradistinction to
ASEAN, the Economic Community of West African States (ECOWAS) has spent most of its
.
While there is no reason to believe that a particular group of people are inherently endowed
with certain entrepreneurial proclivities, the role of the Chinese in Malaysia is truly
phenomenal. Their entrepreneurship is perhaps because of the non-bumiputera (non-sons of
the soil) or non-preferred status that they occupy in Malaysia. In other parts of East Asia,
domestic entrepreneurial activity has been aggressively created and/or driven by state action
by creating the institutional framework that engenders and supports such entrepreneurship.
5 After waves of migration to Malaysia, the Chinese have taken over and controlled economic activity all over Malaysia. Petty trading, automotive repairs, civil engineering, cement production, and any other activity that one may think of is more likely than not going to be owned by a Chinese entrepreneur. In the case that it is not owned by a Chinese, there is a high possibility that Chinese individuals will be involved in the technical staff responsible for the execution of tasks. In their discussion of the Chinese in Sarawak, Malaysia, T’ien, Ju-K’ang (1997), trace the origins of the industriousness of current day Malaysian Chinese to their ancestors who travelled up large and dangerous rivers like the Rajang to establish shop-houses. Many of these shop-houses remain today, even in traditionally Malay societies along the coastline and in the interior regions of Borneo. In my travels through Sarawak, Malaysia, I was truly amazed to find Chinese shop-houses, restaurants, plywood firms etc in places like Tebudu (along the Indonesian border), Santubong, Kuala Lawas (traditionally Malay community), Trusan (near Lawas Town). In Kuching and Kota Samarahan, Sarawak, it appeared that Chinese entrepreneurs owned nearly all sendirian berhads (enterprises).

30
time on issues of civil strife and political turmoil. The region also hosts many of the world’s
poorest nations.
The role of foreign direct investment (FDI) in Malaysia’s economic development is
well documented. “Generally, FDI has played an important role in the development of the
manufacturing sector in Malaysia [and] Malaysia received substantial amounts of FDI […]
higher than other ASEAN-4 countries namely Thailand, Indonesia and the Philippines” (Tsen
2005, p. 92-94). FDI inflows helped Malaysia to build up necessary capacities in agriculture
and industry as well as improve its export performance in several sectors.
On the contrary, FDI flows to Ghana have been limited for many reasons including
the political risk that international investors associate with the West African sub-region.
Abor, Adjasi and Hayford (2008) analyzed FDI data from 1991-2002 to show that changes in
policy to encourage FDI in growth enhancing sectors like agriculture can improve
development in Ghana by boosting export performance.
In conclusion, development indicators for Ghana and Malaysia have shown
divergence. Further understanding of East Asian development is required if Ghana is to learn
from that experience. A deeper analysis of the role of the state in the process of economic
change must be understood to provide a complete understanding of the divergence observed.
Chapter 4 is dedicated to this task and discusses the role of the developmental state in
economic development.

31
CHAPTER 4
DEVELOPMENTAL STATE AND ECONOMIC DEVELOPMENT
“Wealth creation is no longer considered just a function of nature and markets; effective statecraft is involved as well. Eliciting entrepreneurship and facilitating the creation of new productive capacities require a more complicated involvement in the affairs of citizenry than simply eliciting loyalty and good behavior. The capacity required for what I will call the states ‘transformative role’ is correspondingly greater”-(Evans 1995)
Economic development1
Defining the appropriate role of the state in development and social progress has been
a central concern of policymakers since the beginning of capitalism and the rise of
development economics after WWII made this aspect of economics even more important
(Chang 2003). Earliest scholars and practitioners of development focused on ways through
which government-engineered growth could be achieved given the superiority of Keynesian
economics
as a bona fide field in economics was born after WWII. The
focus of this new field was to broaden the understanding on the necessary steps to increase
capital accumulation and the general well-being of war ravaged countries in Europe as well
as Japan. The rise of newly independent countries particularly in Africa increased the
importance of this new field. In the earliest literature on development, little emphasis was
placed on how development in these countries had occurred in the past and what lessons that
past held for the future.
2
1 Arthur Lewis’s “Economic Development with Unlimited Supplies of Labor” was influential in the birth of development economics. Lewis also served as Ghana’s chief economic adviser from 1957-58.
but, the declining importance of Keynesianism and the rise of neoliberalism in
the 1970s shifted the focus of scholarly work in economic development towards market (in
2 Simon Kuznets (1971) and others attempted to provide a detailed account of past development patterns, however, their efforts were not the main focus of the newly found field in economics. The dominant theoretical force in the post WWII era was Keynesianism given its triumphs during the Great Depression. Given that Keynesianism was blowing through the air, most of the early theories of economic development were heavily influenced by the contributions of John. M. Keynes (see Toye 2003).

32
the neoclassical sense) inspired growth (Chang 2003, Toye 2003, Jomo KS and Reinert, E
2005 and Fine 2006).
The discussion in this chapter is geared towards reintroducing the role of the state in
development. This chapter will discuss the developmental state theory widely accepted by
heterodox development economists and shed light on development thought prior to the 1940s
and 1950s. The goal of this chapter two fold. First to reiterate the importance of the
developmental state paradigm to countries like Ghana and many others in SSA gripped by
the cold hands of underdevelopment and second, to identify important features of
development throughout the history of development policy making.
4.1 Developmental State Paradigm
Chalmers Johnson3
Castells (1992) added to the concept by providing a definition of the developmental
state. He stated that “a state is developmental when it establishes as its principle of
legitimacy, its ability to promote and sustain development, understanding by development
the combination of steady high rates of economic growth and structural change in the
productive system, both domestically and in its relationship to the international economy” (p.
56).
(1982) argued that credit for the exceptional development of
Japan after WWII should go to the tactful government policies dating back at least to the
1920’s. He also praised the work of Castells (1992) and Onis (1991) as advancing and
refining the concept of the developmental state (Johnson 1999, p. 36).
Onis (1991) summarized literature on the developmental state in his article “The
Logic of the Developmental State”. His summary of Johnson (1982), Deyo (1987), Amsden
3 His “MITI and the Japanese Miracle: the Growth of Industrial Policy, 1925-1975” was the seminal work in developmental state theory. He also coined the term developmental state to refer to the policies of the Japanese state that led to rapid industrialization and economic development.

33
(1989) and Wade (1990) provided a better understanding of the “institutional and
sociopolitical basis underlying the capacity of the East Asian states to implement effective
and coherent development strategies” (p.110). He concluded that “the logic of developmental
state rests precisely on the combination of bureaucratic autonomy with an unusual degree of
public-private cooperation” (p. 115).
What then are the attributes of the developmental state? Below are excerpts from
Johnson’s seminal 1982 work revealing the defining attributes of the developmental state.
1. The developmental state is CONSISTENT in its pursuit of development objectives.
There is an unwavering COMMITMENT to development. He noted the following:
[A] State’s first priority will define its essence…for more than 50 years the Japanese state has given its priority to economic development. Some of the Japanese states priorities for economic development, such as the imperialism of the Pacific War, were disastrous, but that does not alter the fact that its priorities have been consistent (p. 305-306).
Overcoming the depression required economic development, war preparation and war fighting required economic development, postwar reconstruction required economic development, and independence from U.S. aid required economic development. The means to achieve development for one cause ultimately proved to be equally good for other causes. There are striking continuities among the state’s various policy tools over the prewar and postwar years (p. 308).
2. The developmental state is an ACTIVIST state. It is not an overseer but rather an
active participator in the development process. Trial and error, soliciting private
sector involvement and engaging the private sector to ensure the achievement of
development goals is its biggest priority. The development state EVOLVES in light
of the changing needs of the society in which it is embedded in. Change is welcomed
so long as it does not detract from the overall developmental objective.

34
All states intervene in their economies for various reasons…The United States is a good example of a state in which the regulatory orientation predominates, whereas Japan is a good example of a state in which the developmental orientation predominates. A regulatory, or market-rational, state concerns itself with the forms and procedures – the rules, if you will – of economic competition, but it does not concern itself with substantive matter (p.17-19).
The fundamental problem of state-guided, high-growth system is that of the relationship between the state bureaucracy and privately owned business…Japan developed and attempted to implement three different solutions to this problem – namely, self-control, state control, and cooperation. None of them is perfect, but each is preferable to pure laissez faire or state socialism as long as forced development remains the top priority of the state (p. 309-310).
3. The developmental state is WELL-STAFFED, RISK-TAKING, LEGITIMATE and
DEMOCRATIC4
The first element of the [Japanese] model is the existence of a small, inexpensive, but elite state bureaucracy staffed by the best managerial talent available in the system. The second element…is a political system in which the bureaucracy is given sufficient scope to take initiative and operate effectively. The third element…is the perfection of market-conforming methods of state intervention in the economy. The fourth and final element…is a pilot program like MITI (p. 314-320).
.
Johnson’s description of the Japanese economic miracle received mixed reviews
among academics and policymakers. In academic circles, many considered his work as
heresy. Hollerman (1983) and Yamamura (1983) argued that “economists will incidentally
quibble with some of Johnson’s formulations” and that “Johnson has unnecessarily alienated
many economists” (referring to neoclassical economists). Beason and Weinstein (1995) also
4 According to Johnson (1982), in the first element of the Japanese model, the duties of the bureaucratic staff include the identification of industries to be developed (industrial structure policy), the best means of rapidly developing the chosen industries (industrial rationalization policy) and to oversee competition in those sectors to ensure their economic health and effectiveness as well as their focus on the overall developmental agenda. In the second element of the model, he showed that the legislative and judicial branches of government were restricted to safety valve functions. Thus their roles were to ensure compliance, while the role of bureaucratic staff was to assist in the building up of entrepreneurial capacities in the economy. In the third element of the model, Johnson highlighted the importance of the creation of governmental financial institutions to provide credit to entrepreneurs as strategic capabilities were being established and grown. Finally in the fourth element, he stresses the internal democracy that existed in MITI. See pages 314-320 for more details on the four elements identified by Johnson.

35
criticized the role of the Japanese government in its economic miracle. They argued that
Japanese industrial policy transferred resources from high to low growth sectors and added
that ‘industrial policy stories are fundamentally unconvincing for most economists’ because
they are rarely supported with data.
In spite of the criticism Johnson’s worked received, his ideas served as a foundation
for research on the role of the state in the economic development of other East Asian
countries. Amsden (1989), Castells (1992), Wade (1990), Evans (1995) and many others
have built on the developmental state theory of Chalmers Johnson to help broaden the
understanding on the role of the state in East Asian development.
Amsden (1989) discussed South Korea’s developmental state. In chapter 4 of her
seminal work “Asia’s Next Giant”, she made a case for the Korean state as an entrepreneur
of last resort and showed that even though the canons of conventional economic theory were
violated by Korea, its economy was able to grow at astounding rates. Like Johnson, Amsden
credited the judicious use of intervention from the Korean state for their economic
transformation. As an example of government intervention, Amsden used the example of the
creation of the Pohang Iron and Steel Company (POSCO)5
5 In the 1970s and 80s, POSCO became one of the largest producers of steel products in the world and surpassed all of the steel producers in the US. POSCO was also efficient haven’t benchmarked and borrowed production technologies from Nippon Steel in Japan. Further, POSCO was able to capture over half of the market share for imported steel from Japan. The Kwangyang Steel plant also made tremendous strides in making Korean one of the world’s leading producers of steel products. See Amsden 1989 (p. 295-297). Kwan S. Kim (1995) argued that Korea’s development success was brought forth by a neo-mercantilist model which was characterized by a series of government interventions which go beyond the minimalist advocated by neoclassical and market-oriented economists.
. She showed that POSCO was
instrumental in making Korea a world power in the production of steel and steel products all
of which helped the country’s automotive and shipbuilding industries. Amsden noted that the
strength of the Korean bureaucracy allowed for excellent relationships to be established

36
between the state and industry (chaebols). Further, the bureaucracy was staffed with the
brightest students from the top universities across the country.
According to Castells (1992) East Asian developmental states succeeded because of
their ability to construct an efficient and technocratic state apparatus. He stressed that “the
fundamental element in the ability of developmental states to fulfill their project [of
development] was their political capacity to impose and internalize their logic on societies”
(p. 64). Thus the ability to control state-society relationships was essential to success in these
nations.
Wade (1990) discussed the central role of the Kuomintang government in the
economic transformation of Taiwan. He showed that Taiwanese institutions like the Council
on Economic Planning and Development (CEPD) and the Industrial Development Bureau
(IDB), acted like Japan’s MITI. Bureaucrats, planners, engineers and technicians from the
top universities in Taiwan formed the staff at these institutions. The main objective of the
CEPD and IDB was to ensure that public and private sector activity was in accordance with
national development plans. He showed that state-owned enterprises (SOE’s) were used at a
great extent but not to the detriment of private sector activity. As in Korea, SOE’s were
instruments of industrial and economic development. Wade added that strategic interventions
in increasing return sectors and the ability of the state to govern6 the market created the
atmosphere for rapid accumulation and development7
As a response to the rising tide of literature on the role of the state in the economic
transformation of East Asia, the World Bank published its famous East Asian Miracle:
.
6 Wade argued that the Taiwanese state was involved in a variety of sectors and its ability to “filter out” unnecessary investments ensured that the developmental focus was always intact and that private sector activities were governed in such a way as to maximize the social benefit. The bureaucracy was crucial and an apt civil service was essential to the execution and success of the governments’ initiatives. 7 Also see Brautigam (1996, p. 173).

37
Economic Growth and Public Policy in 1993. The treatise accepted the role of the state in the
economic transformation of first and second tier East Asian economies but argued that this
role had been overemphasized in some circles. The report argued further that if East Asian
states did not intervene as much as they did, development in the region would have been
even faster especially since they had the basics right, a claim vehemently opposed by the
work of Evans (1995), Stein (1996), Fine and Jomo KS (2005) and Chang (2002, 2003, 2007
and 2008).
Evans (1995) critically assessed the neo-utilitarian view of the state accepted by
mainstream economists. He argued that this model was simplistic, asocial and insufficient in
explaining the dealings of the state in the process of economic transformation especially in
East Asia and suggested that a newer model based on the insights of economists like Polanyi,
Gerschenkron and Hirschmann was needed. He suggested a comparative institutional
approach and introduced the concept of embedded autonomy. Evans (1995) argued that;
What the comparative institutional tradition offers is a spelling out of some roles that the state might be called on to fulfill if the process of economic transformation is to move forward, and some suggestions as to what kind of institutional characteristics might be necessary for the state to have a chance at playing these roles (p. 32)
Evans identified four important roles that the state might be called on to fulfill. They
are custodial, demiurge, midwife and husbandry roles. As a custodian, the state serves as a
regulator and provides caretaking in the sense of protection and policing. The neoclassical
‘minimalist state plays the custodial role’ (p. 78). In the demiurge role, the state becomes
directly involved in the production activities. The states’ involvement may be complementary
to private enterprise although it is often a complete replacement for private enterprise.
“Playing demiurge implies strong assumptions about the inadequacy of private capital” and

38
“SOE’s are the concrete embodiments of demiurge” (p. 79). As Amsden (1989) showed with
the example of POSCO, the role of demiurge was particularly important in Korea.
Rather than playing the role of demiurge, Evan’s argues that the state can assist
entrepreneurs in risk taking. The state can achieve this by guaranteeing credit and by helping
reduce the uncertainty that surrounds the activity. Wade (1990) and Brautigam (1996)
presented several examples of the careful use of credit by the Taiwanese state to promote
private sector entrepreneurial activity. This role of the state is referred to as midwifery by
Evans.
The fourth role described by Evans is husbandry. This role involves cultivating,
nurturing and prodding those entrepreneurial activities that have been awakened by the
‘midwife’ state. Husbandry is a more refined midwifery role. Midwife involves drawing
entrepreneurs into particular sectors, and the role of husband takes those entrepreneurs
further to make to make them successful. Husbandry is less demanding than midwifery
because it represents more of a public-private initiative but it is more difficult because of the
risk of vested interests capturing the state (p. 80-81).
Evans argued that the ability of states’ to effectively execute their roles depended on
the ‘embedded autonomy’ they had. Embeddedness “implies a concrete set of connections
that link the state intimately and aggressively to particular social groups to whom the state
shares a joint project of transformation” (p. 59). Autonomy refers to the states’ ability to
“provide institutionalized channels for the continual negotiation and renegotiation of goals
and policies” (p. 59). Thus embedded autonomy requires strong state-society relationships, a
strong commitment to developmental goals and a strong and efficient bureaucracy with the
ability to execute those goals.

39
To further explain his concept, Evans discussed three different states: predatory,
developmental and intermediate. The predatory state “preys on its citizenry, terrorizing them,
despoiling their common patrimony, and providing little in the way of services in return” (p.
45). The predatory state is a strong state, but what it is lacking is the bureaucracy necessary
for it to execute its roles. The predatory state is also autonomous if we define autonomy as
the ability simply do whatever it wants, however, this autonomy is not embedded because it
is not shaped by societal forces. Evans noted that neoclassical economists often lump all
states in with the predatory state8
In the developmental state, “individual maximization must take place via conformity
to bureaucratic rules rather than via exploitation of individual opportunities presented by the
invisible hand” (p. 49). The developmental state has a strong and efficient bureaucracy that
allows for exceptional delivery of services that engender, support and sustain private sector
ingenuity to meet overarching developmental goals. Further, the developmental state is
embedded in the society, but is also autonomous.
and unfairly judge the state as well as its capacity to bring
about development.
The intermediate state lies between the predatory and the developmental states’.
Embeddedness and autonomy in this state is stronger that the predatory state but less than the
developmental state. “Imbalance could take the form of either excessive clientelism or an
inability to construct joint projects with potential industrial elites” and “joint projects may be
possible in certain sectors or certain periods but degenerate into clientelism or isolated
autonomy in other sectors or other periods” (p. 60). Thus in the intermediate state there is
incoherence and inconsistency of policies.
8 Many states in SSA bear close resemblance to the predatory state. These states are often embedded along ethnic and tribal lines rather than national lines. Evans noted further that the generalization that all states will tend towards the predatory state is misguided especially if we look at East Asian states.

40
Figure 12, below shows the policy spaces of the predatory, developmental and
intermediate states. Let the following be true;
E: Embedded and A: Autonomy, Then (E ∩ A) represents ‘Embedded Autonomy’. In the
predatory state, there is no intersection of embeddedness and autonomy. This feature is
common in most states in SSA. In the developmental state, the intersection of embeddedness
and autonomy is what allows the state to carry out its roles effectively. The size of the
intersection of E and A distinguishes the developmental and intermediate states. (E ∩ A) for
intermediate state < (E ∩ A) for developmental state as shown in the third diagram.
Figure 12: Predatory, Developmental and Intermediate States. Based on Evans (1995)
Mkandawire (2001) and Ikpe (2008) have also advanced knowledge on
developmental states. In Thinking about Developmental States in Africa, Mkandawire (2001),
sought to clarify the characteristics of the developmental state and ponder on its possibility in
SSA. He noted that the developmental state should “not be deified into some kind of
omnipotent and omniscient leviathan that always gets what it wants” (p. 291). He stressed the
Predatory State
E
A
Developmental State
E
A
Intermediate State
A
E

41
importance of the social engineering process that created developmental states and dispelled
attacks by neoclassical theorists that developmental state theory was a call to dirigisme.
Mkandawire presented convincing arguments on the possibility of democratic
developmental states in SSA. He pointed to the fact that during the 1960’s, SSA had states
that were developmental in their aspirations as well as in their economic performance. He
argued that developmental states were consistent with democracy and democratic
developmental states such as Botswana and Mauritius pointed to their possibility in SSA9
Ikpe (2008) made very important contributions to the discussion of developmental
states. She asserted that the developmental state paradigm continues to be a powerful tool in
explaining structural change in developing countries even in the era of globalization (which
pushes for a greater role of the market over the state). She noted that dynamism has
characterized the developmental state especially in the era of globalization. “Rather than
postulating the death knell for the developmental state, one may observe the evolution of the
DSP’s scope as an analytical tool” (p. 7)
.
Ikpe took the discussion of the developmental state further by engaging the issue of
the developmental state and the agriculture10
9 Using Botswana and the island nation of Mauritius as examples, Mkandawire presented evidence on the growth rate of real GDP in SSA and East Asia to show the superior performance of many countries in SSA.
. She contended that the successes of
developmental states were heavily based on the ability of their states to channel surplus
generated in the agricultural sector into the industrial sector. Drawing on the insights of Clute
(1982), Akyuz, Chang and Kozul-Wright (1998) and Francks (1999), she argued that
agricultural development is very important to the developmental state’s ability to implement
industrial policy and achieve structural transformation. She noted that the recognition of this
10 Ikpe sought to reintroduce the discussion of agricultural development with the developmental state especially since most scholars of developmental states tend to focus on industry.

42
fact was especially crucial in SSA given the continued importance of the sector to many
countries in the region.
In addition to her emphasis on agriculture, Ikpe made an important theoretical
contribution with her argument that;
The term developmental state is premised upon outcomes and…is an ex-post accolade following economic success […] rapid and sustained economic growth and the structural transformation of the economy as evidenced by the experiences of Japan, South Korea and Taiwan (p. 5)
Lastly, Ikpe argued that the relevance of the developmental state paradigm in SSA suffers
because many countries in SSA simply do not have an example of a developmental state to
emulate11
4.2 Thoughts on Development Prior to World War II
.
Regarding thoughts about development, “what happened after World War II was only
a separation (rather than a birth) of ‘development economics’ from the body of economics in
general” (Szentes 2002, p. 156). The roots of development thinking and its entire tool of
analysis can be traced back to William Petty and his experiences in and around the Cromwell
period in Ireland (Goodacre 2005). A careful look at the classical development economics of
Arthur Lewis, Albert Hirschmann and others shows an astonishing continuity of thought
since the mercantile period (Jomo KS and Reinert 2005).
4.3 Mercantilist Thought on Economic Development
Mercantilism was dominant until Adam Smith sharply criticized its logic and
usefulness in his Wealth of Nations (1776). In the mercantile period, government-created
11 Asare & Wong (2004) made a similar argument in their discussion of divergent development between Ghana and Malaysia. Also it is important to note that Mkandawire’s (2001) assertion that developmental states are possible in Africa and that Botswana is an example to be emulated is in contradistinction to Ikpe’s argument on the lack of valid examples in Africa.

43
monopolies ruled and the exchange of goods and services through international trade was
important. The accumulation of bullion and a focus on exports rather than imports were
essential to national wealth. The mercantile system was an import substitution system, the
main goal of which was to create and sustain comparative advantages in areas of the
economy where increasing returns to scale existed. Once comparative advantages were
achieved, free trade was to follow (Porter 1990, Reinert, E and Reinert, S 2005).
In the context of development, mercantilist thought pointed to three important facts
about the development process. First, mercantilism involved setting national benchmarks.
Second, it involved the identification of backward and forward linkages in and between
various sectors of the economy. Development was activity-specific, and targeting those
activities with the most connections to other sectors of the economy was important. Third
mercantilist thought justified the protection of local industry on the grounds that it created
employment, wealth and the capacity for the country to increase its accumulation.
National Benchmarking
“One of the key tools of mercantilism, as well as its inspiration, was benchmarking
successful and less successful nations” (Reinert, E and Reinert, S 2005, p. 6). Using Spain
and the Dutch Republic and accounts from mercantilists and scholars of mercantilism,
Reinert, E and Reinert, S (2005) showed that the Spanish economic failure and the success of
the Dutch served as important benchmarks for England and other nations in Europe.
Appropriate policy initiatives and actions from the Spanish and Dutch experiences were
carefully studied for their adoption in England and elsewhere. Josiah Child, a former
Governor of the British East India Company and a staunch advocate for mercantilism argued

44
that the economic progress of the Dutch, presented a great opportunity for England. Child
(1668[1959]) noted that;
The prodigious increase of the Netherlanders in their domestick and forreign trade, riches, and multitude of shipping, is the envy of the present, and may be the wonder of all future generations: and yet the means whereby they have thus advanced themselves, are sufficiently obvious, and in a great measure imitable by most other Nations, but more easily by us of this Kingdom of England (p. 41). If we intend to have trade of the world, we must imitate the Dutch, who make the worst as well as the best of all manufactures that we may be in a capacity of serving all markets, and all humors (Child 1693, p. 90 in Jomo KS and Reinert, E 2006, p.7)
Mercantilist scholars all realized that benchmarking successful nations with similar
characteristics was an important piece to development. The thoughts of these scholars point
to need for national development planning based on successful experiences of similar
countries.
Activity-Specific Development and Backward and Forward Linkages
Mercantilist scholars recognized that some activities were more beneficial for capital
accumulation and development than others. “It was clear to most astute observers that the
wealth of Holland rested on the synergic interdependence of manufacturing, long-distance
trade and fisheries, where ‘one factor gave strength to the other and vice versa” (Serra
[1613], in Jomo KS and Reinert, E 2005, p. 8). Furthermore, “starting in the 1700s, great
emphasis was put on the beneficial synergies between manufacturing and agriculture: only
where there was manufacturing, was there successful agriculture” (Reinert, E and Reinert, S
2005, p. 9).
Industrial Protection
Industrial protection in the mercantile system was context specific. “Protecting
manufacturing industry could be the right thing to do in one context, while promoting free

45
trade could be the right thing in another” (Reinert, E and Reinert, S 2005, p. 10). Once
government-granted monopolies were deemed necessary for development, they were
aggressively pursued with the goal of creating comparative advantages. Once comparative
advantages were gained, protectionist tendencies were abandoned and firms were allowed to
participate in international trade. Protection and support particularly for the manufacturing
sector were justified on the grounds of wealth and employment creation. The overriding goal
of mercantilism was to align public and private vested interests by encouraging “nations into
increasing return industries that create virtuous circles of development” (Reinert, E and
Reinert, S 2005, p. 9).
According to Reinert, E and Reinert, S (2005), the three principles discussed above
are an absolute must for any country wishing to progress from poor to rich. The context in
which these principles can be applied will be different thus the recognition of changing
international conditions is important. Reinert, E and Reinert, S (2005) argued additionally
that mercantilist thought on development in the right context has been proven right time after
time whether in Holland and England in the 15th-17th centuries or in Japan, Korea and
Taiwan in the 20th centuries12
4.4 Classical Political Economy and Development Economics
.
Adam Smith, Mercantilism and Economic Development
Adam Smith is credited for his fierce attack on mercantilism (especially in his Wealth
of Nations). However, a careful look at all of Smith’s work in regard to mercantilist thought
and development presents a confused Adam Smith who is arguable at best “a misunderstood
12 Reinert, E & Reinert, S (2005) summarized the insights as follows: (i) national wealth cannot be created or based on raw material production in the absence of a manufacturing/increasing returns sector; (ii) an inefficient manufacturing/increasing returns sector provides a much higher standard of living than no manufacturing sector. Large-scale deindustrialization is therefore a crime to prosperity. They further argued that the services sector is also complimentary to primary sectors and can be wealth enhancing.

46
mercantilist” (Reinert and Reinert 2005, p. 15). Smith was a supporter of the Navigations
Acts which were designed to protect English manufactures from the Dutch. He argued for the
wisdom embedded in these Acts in spite of them being protectionist. Such support was
inconsistent with his push for free markets domestically and internationally.
When The Theory of Moral Sentiments (1759) and the Wealth of Nations (1776) are
taken together, Smith’s view on development is riddled with contradictory positions. Smith
wished for the United Kingdom to be as prosperous as Holland and thus pushed for different
policies at different times to reflect that desire. In spite of his contradictory positions, Smith’s
message on the division of labor, capital accumulation and the role of the state in the
economy have had tremendous implications for the conduct and practice of development13
David Ricardo, Comparative Advantage and Development Economics
(Reinert, E and Reinert, S 2005, p. 15 and Peet and Hartwick 2009, p. 30-33).
Ricardo’s theory of comparative advantage underlay his push for free trade and
reflected his thought on development. Using the example of two countries (England and
Portugal) and two goods (cloth and wine), he demonstrated the advantages that would accrue
to each country if they specialized in the production of those goods in which they have the
lowest opportunity cost or comparative advantage.
Growth and economic development come from Ricardo’s system because any
inefficiency particularly in the area of wasted time and effort in the production of goods in
which a country does not have the lowest opportunity cost will be simply eliminated. Ricardo
recognized that manufactures yielded more wealth than agriculture especially when marginal
13 In the Theory of Moral Sentiments, Smith is an ardent supporter of the government particularly with regards to its role in adding and promoting new manufactures but in his critique of the mercantile system, he takes the position suggesting his rejection of the economic system being supported by that same government. See Reinert, E & Reinert, S (2005, p. 17-18).

47
land was being brought under cultivation. In his chapter “On Machinery” in the last edition
of his Principles of Political Economy and Taxation, that the incidence of machinery had the
potential to increase the incidence of poverty while worsening the plight of the working
classes since the source of income for the capitalist and workers differed14
John S. Mill, Ethics and Development Economics
(Ricardo
[1821]1973, Patnaik 2005, Peet and Hartwick 2009).
John Stuart Mill’s view on development can be seen from his writings On Liberty
(1859), Utilitarianism (1863) and in his Principles of Political Economy (1909). Mill
accepted Bentham’s utility theory and agreed that the encroachment of the government on
individual’s rights to pursue their own happiness was never justified unless in the pursuit of
an individuals’ happiness, they harm others and pose a danger to civil society. The
government was to be a minimalist government which guaranteed that individual rights will
be protected at all cost (Mill 1859 and 1863).
In his Principles of Political Economy, Mill made one of his most important
contributions to classical political economy. He argued that state intervention was necessary
especially in the area of distribution. He recognized that such redistributive efforts had to be
society-specific if they were to be effective. Furthermore, Mill’s recognized the antagonism
between workers and capitalists. He argued for an increased participation of workers in the
accumulation process, improved child labor laws, increased education, worker ownership of
factories and worker-capitalist partnerships. “Mill was a radical liberal who believed that 14 If workers and capitalists are rewarded from different sources and income inequality is likely, then there is room for the state to attempt to resolve some of these income discrepancies. One could take it further and argue that the state will be needed to protect society from the accumulation process that has improved its situation but yet threatens its very existence as Karl Polanyi did in his “A Great Transformation”. It is important to note that serious critiques of Ricardo’s comparative advantage and variants of it (like the Hecksher-Ohlin model) have rendered it a contentious theory. The model ‘contains a logical fallacy when used to argue that mutual benefit necessarily results from trade’, because it ‘assumes that both goods can be produced in both countries’ (Patnaik 2005, p. 31-41).
48
capitalism would eventually give way to cooperativism” (Peet and Hartwick 2009, p. 40). His
contribution brought questions of ethics, general well-being and distribution of wealth more
to the fore. Mill’s would be more interested in the social indicators of development.
Karl Marx and Development Economics
According to Patnaik (2005), Karl Marx was perhaps the first development economist
because he not only studied development under capitalism but also the development of
capitalism. Marx’s thought on development emerges from the articles he wrote on British
rule in India for the New York Daily Tribune in 1853 and later in his chapter on The Modern
Theory of Colonization (Capital, Volume 1).
In these writings, Marx pointed out that colonization was an extension of the arm of
capitalist whose quest for surplus value had no boundaries. The draining of surplus from
India was immense with little obligations on the part of England. As Marx noted;
India alone has to pay £5 million in tribute for good government, interest and dividends on British capital, etc., not counting the sums sent home annually by officials as savings of their salaries or by English merchants as part of their profits in order to be invested in England (Marx [1887]1974 in Patnaik 2005, p. 71).
Furthermore Marx in a letter to N. F. Danielson (on February 19th, 1881) described surplus
drain from India as “a bleeding process with a vengeance” (Habib, 1963 in Patnaik 2005, p.
71).
In spite of these harsh observations of Marx regarding the drainage of surplus, he
noticed that the process of development in India necessitated the provision of basic
infrastructure such as roads, railways. He also noticed that in the process of transforming
India into a viable raw material production center for English manufacturing firms,
tremendous destruction and exploitation of people occurred. Traditional social systems such
as the self-sufficient village community where agriculture and industry were intertwined

49
were destroyed (Patnaik 2005, p. 68). Marx’s perspective on development brings to the fore
the negative aspects of the penetration of social formations distinct from capitalism by
capitalist interests.
4.5 Italian Origins of Development Economics
Development thought in Italy emerged in the 13th century with the realization that
manufactures and industry enhanced national wealth at a much faster pace than agriculture.
“Of the four largest European cities in 1500, only Paris was not in Italy” (Vries 1984, p. 35).
Also, “other countries of Europe adopted the economic practices of the Italian city-states”
(Wallerstein 1974 and 1980 and Reinert, S 2005, p.24). The decline15
Key features of the scholarly works directed at developing Italy are similar to the
views of mercantilist scholars discussed earlier. Italian scholars knew that industry and
manufacturing needed institutional support particularly from the government if they were to
grow and become an important part of the economy. For example, the Duke served as the
‘entrepreneur of last resort’ in the silk industry of northern Italy since it was difficult for
individuals to enter that industry (Reinert, S 2005, p. 28). This is similar to the demiurge role
advocated by Evans (1995).
of Italy as an economic
power and the movement of the country into the semi-periphery necessitated a search for new
approaches to development (Cippola 1970, p. 196-214 and Wallerstein 1980).
Italian scholars contended that the engine of growth and development laid in the
synergic relationships between industry, services and agriculture. Thus protecting industry
15 The decline was so severe and represented more than a 50% decline in the industrial activity in cities like Venice, Como, Milan, Genoa, Cremona, Florence and many others. For example in “Milan at the beginning of the seventeenth century there were between sixty and seventy firms making wollen cloths, with an overall output averaging 15,000 cloths a year. By 1709 there was but a single firm with an average annual production of around 100 cloths (Cipolla 1970, p.197). The decline in industrial activity in Italy coincided with the rise of Dutch, English and French economies and a movement of the core from Italy farther west. See Cipolla 1970 and Reinert, S 2005.

50
and identifying these synergic relationships dominated the work and views of these scholars.
Serra (1613) noted that the growth of industry helped cities and urban areas by virtue of
agglomeration economies.
He said;
The number of manufactures also benefits the city, in which diverse causes produce a great gathering of people, not only because of the manufactures (which would then be the cause of it all), but insofar as the two causes reinforce one another: that is to say that the number of manufactures increases the desirability of the place, as well as the volume of urban traffic, while on the other hand the number of manufactures in turn is a product of the said traffic and gathering of people (Serra 1613, p. 18 in Reinert, S 2005, p. 31).
Pietro Verri’s axioms16
4.6 German Origins of Development Economics
of development emphasized the need for industrial protection. He
argued that the judicious use of tariffs was necessary if industrial capacity and comparative
advantages were to be built up across Italy.
“German economics was that of a backward nation attempting to catch up with its
wealthier neighbours” (Reinert, E 2005, p. 48). German thought on development holds
important insights for many countries around the world who find themselves in the situation
Germany was in three to four centuries ago and again after WWII.
The German economic tradition was born out of the occupations of its scholars (many
of whom were involved in public service in various small states across Germany). This
tradition shared the belief of the mercantilists and Italians that the state was an important
facilitator of growth and development and occasionally needed to serve as an entrepreneur of
16 On manufactured goods, Verri argued that tariffs on exported manufactured goods were bad for commerce and tariffs on imported manufactured goods were good for commerce. On raw materials he argued that tariffs on imported raw materials needed for domestic industry were bad for commerce while tariffs on exported raw materials needed for domestic industry were good (Verri [1764]1998 in Reinert, S 2005, p.38-39)

51
last resort17
1. Erfahrungswissenschaft and Praxisnahe: actions and policies must be based on
experience and must be close to reality. There is little to no room for metaphysical
speculation and high abstraction
(Reinert, E 1999, p. 282). The main characteristics of the German tradition in
economics as it relates to development thought can be summarized from the work of
Dreschler (2004) and Reinert, E (2005). They are;
18
2. Strukturzusammenhange: structural coherence and interdependencies characterize the
economic system and understanding such interdependencies is a key step in the
development process.
. History matters and the realization and
understanding of the role of cumulative causation and context specific policies are
important. Qualitative ‘verstehen’ approaches to policy making are favored and a
non-mechanical understanding to the world is preferred (Dreschler 2004).
3. Gottesahnlichkeit: there is embedded in man, entrepreneurship and creativity. Man is
always thinking and finding new ways to match experiences with existing knowledge
to create new things19
4. Technology, new knowledge and a focus on production are keys to economic growth
and development. A focus on the production of high value manufactures was
important.
. From this conception, economic progress and harmony is man-
made through hard work and commitment. “Passivity” is more likely to create
‘spontaneous disorder’ than ‘spontaneous order’” (Reinert, E 2005, p. 52).
17 “The state is something through which, rather than against which, individual liberty and progress are gained” (Reinert, E 2005, p. 51). 18 Ricardo’s work was criticized as being highly abstract and full of metaphysical speculation (Reinert, E 2005) 19 This notion is similar to Veblen’s idle curiosity.
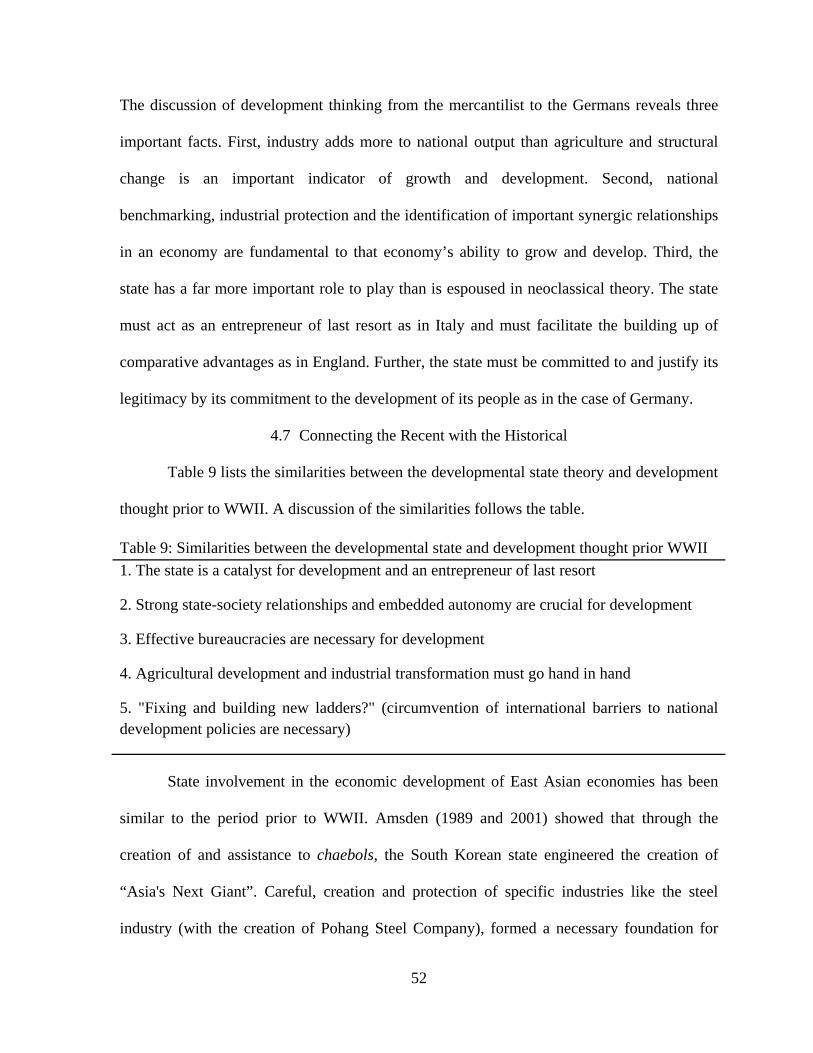
52
The discussion of development thinking from the mercantilist to the Germans reveals three
important facts. First, industry adds more to national output than agriculture and structural
change is an important indicator of growth and development. Second, national
benchmarking, industrial protection and the identification of important synergic relationships
in an economy are fundamental to that economy’s ability to grow and develop. Third, the
state has a far more important role to play than is espoused in neoclassical theory. The state
must act as an entrepreneur of last resort as in Italy and must facilitate the building up of
comparative advantages as in England. Further, the state must be committed to and justify its
legitimacy by its commitment to the development of its people as in the case of Germany.
4.7 Connecting the Recent with the Historical
Table 9 lists the similarities between the developmental state theory and development
thought prior to WWII. A discussion of the similarities follows the table.
Table 9: Similarities between the developmental state and development thought prior WWII 1. The state is a catalyst for development and an entrepreneur of last resort
2. Strong state-society relationships and embedded autonomy are crucial for development
3. Effective bureaucracies are necessary for development
4. Agricultural development and industrial transformation must go hand in hand
5. "Fixing and building new ladders?" (circumvention of international barriers to national development policies are necessary)
State involvement in the economic development of East Asian economies has been
similar to the period prior to WWII. Amsden (1989 and 2001) showed that through the
creation of and assistance to chaebols, the South Korean state engineered the creation of
“Asia's Next Giant”. Careful, creation and protection of specific industries like the steel
industry (with the creation of Pohang Steel Company), formed a necessary foundation for

53
other sectors to grow. National benchmarking is also evident in East Asia’s development
experience. Malaysia's Looking East Policy, promulgated by Dr. Mahathir Mohammed is an
example. Wade (1995), Brautigam (1996) and Chang (2006), have showed that states in East
Asia, governed their markets (promoting and yet protecting market participants) in a manner
far broader than the minimalist neoclassical state.
National benchmarking was an important part of state development policy. As Child
(1693) noted, imitating Dutch policies on commerce and industry was necessary for
England's development prospects. Cipolla (1970), presented convincing evidence to show
that Dukes and other state officials served as entrepreneurs of last resort in northern Italy to
build up certain industrial capacities. Chang (2002) showed that industrial protection via the
tactful use of tariffs played an important role in the industrial transformation and economic
development of England and the United States. He noted further that contrary to popular
belief, these countries have not been as free market as has been portrayed. Finally, state
development policy was sector and activity specific in many instances prior to WWII.
Sectors that maximized backward and forward linkages and created the most value were
aggressively promoted, protected and developed (for example shipping in Holland and steel
manufacturing in South Korea).
State-society relationships have also been very similar. As Reinert (2005) showed,
German development had as a basis a strong state-society relationship20
20 Migdal (1988) has an interesting discussion on the dynamics of state-society relationships including an argument that state strength is only acquired after “series of wrenching social dislocations” (p. 271). Castells (1990) shares this opinion (p. 58)
. This relationship
ensured the necessary commitment towards national development objectives from the state
and society. Polanyi (1944[2001]) points to such relationships with his discussion of the role
of the Tudor government in England. In Japan, Korea, Taiwan, Singapore and Malaysia these

54
relationships have been extremely strong. As Johnson (1982) pointed out, policies of the
Meiji period were crucial to establishing such relationships in Japan. The presidency of Park
Chung Hee (South Korea), the activities of Kuomintang regime of Chang Kai-Shek, the
governance of Singapore by Lee Kuan Yew and the governance of Dr. Mahathir Mohammed
(and his relationship between Malays and Bumiputeras [mostly Malays] and the Malaysian
state) have all been very strong. In varying degrees, these states have had the requisite
embedded autonomy needed for them to execute their roles.
Some state-society relationships have been characterized by repression, oppression
and racism towards some social groups however, they have been embedded enough to allow
them to pursue developmental goals (see Jomo KS, 2001 in Stiglitz and Yusuf "Rethinking
the East Asian Miracle" for more details particularly on Southeast Asia).
Reinert, E (2005) showed that the German bureaucracy was made up of well educated
civil servants who were well trained to execute state functions. Johnson (1982), Amsden
(1989), Wade (1990) and many others have shown that bureaucracies in East Asian countries
particularly in Japan, South Korea and Taiwan were efficient because they recruited the best
and brightest students from the top universities to staff agencies responsible for the conduct
of development policy. The discussion of effective bureaucracies has often been attacked
with the argument of corruption in the civil service, however as Castells (1990) pointed out
that;
Corruption was widespread in South Korea, significant in Taiwan, much more limited (but present) in Hong Kong and Singapore. And yet the South Korean state or the KMT (Kuomintang) state were able to operate with a high level of efficiency, served by well-trained civil servants, and organized flexible lines that changed according to the needs of each stage of development (p. 63-64).

55
His observation is true in the case of Malaysia where corruption at the top levels of
government appear to not permeate the lower levels of the civil service. Petty corruption is
rare and basic state functions run smoothly and for the most part effectively.
Chang (2003) argued that Friedrich List's Kicking Away the Ladder is what
characterized the development experience of now industrialized countries. That is violation
of laws of free trade were used at various stages in the development of the UK, US and many
other European countries however, in the aftermath of their development, a push for free
trade and free markets is pursued to maintain and continue their existence as dominant
economic powers in the world. Thus after climbing the ladder towards growth and
development, these countries kicked away the ladder to prevent others from climbing it. The
point of relevance here is that international conditions of trade and labor etc were violated by
many countries and the experience of East Asia was no different. In fact Alice Amsden noted
that, ‘getting prices wrong’ and in general getting the precepts of conventional economic
theory wrong was what led to the rapid industrialization of South Korea.
Grabel and Chang (2004, pp. 202-205) and Ikpe (2008, p. 17) showed that although
current international conditions imposed by the World Trade Organization (WTO) and others
made it difficult for countries to pursue certain initiatives, these initiatives were not
impossible. For example, Kearney (1990) and Meisenhelder (1997) showed that in the case
of Mauritius, bilateral agreements with European countries for the export of sugar and sugar
products, aided in the structural transformation of the island nation. They showed that
Mauritius secured preferred status for its sugar and through time increased capacity for sugar
processing, thereby replacing the export of crude sugar with processed sugar and a reliance
on raw material production with manufacturing.

56
The discussion in preceding sections of this chapter has looked at the developmental
state theory and development thought from a historical perspective. It has also highlighted
advancements in the developmental state paradigm since Johnson (1982). The discussion so
far has shown that development thought and practice since WWII is akin to that of East
Asian developmental states.
Two important facts emerge from the discussion so far. First the developmental state
offers the best description of the development experience since mercantilism. Second, for
nations looking to develop their economies like Ghana, the principles of the developmental
state and the adherence to heterodox approaches to development offer the best opportunity.
4.8 Rediscovering the Role of the State in Development: Lessons from East Asia
If the developmental state best characterizes the development experience of now and
late industrializing countries as has been argued so far, then a reclamation of the state and its
roles must be the way forward especially for countries toiling in the trenches of poverty
(UNCTAD 2007).
Wade (1990) offered ten important lessons from the East Asian experience. Even
though not all of these lessons are applicable given regional differences between SSA and
East Asia, they offer important insights and are thus worthy of discussion. They are;
1. Use national policies to promote industrial investment within the national
boundaries, and to channel more of this investment into industries whose growth is
important for the economy’s future growth.
In SSA (Ghana), industries such as agro-processing present a great opportunity since
significant portions of the population remain employed in the agricultural sector and the
sector accounts for more than a third of the value added to GDP.
2. Use protection to help create an internationally competitive set of industries.

57
3. If the wider strategy calls for heavy reliance on trade, give high priority to export
promotion policies.
4. Welcome multinational companies, but direct their sales toward exports and inputs
purchases towards local suppliers
5. Promote a bank-based financial system under close government control.
6. Carry out trade and financial liberalization gradually, in line with a certain sequence
of steps.
Many countries in SSA (including Ghana), have already experienced various levels of
liberalization during the period of structural adjustment, however, these liberalizations have
not yielded the anticipated results (Stein 1996, Akyuz and Gore 2001 and SAPRIN 2004)
7. Establish a “pilot agency” or “economic general staff” within the central
bureaucracy whose policy heartland is the industrial and trade profile of the economy
and its future growth path.
Such an agency must be well staffed with the best and brightest, adequately remunerated, and
independent enough as to carry out its duties regardless of the change of government
(especially in the era of pro-democracy initiatives in SSA). Japan’s MITI described by
Johnson (1982) is an excellent example of such an agency.
8. Develop effective institutions of political authority before the system is democratized.
Of course, this lesson is historically specific to East Asia and is very difficult to replicate in
SSA. As Mkandawire (2001) argued, developmental states that have democratic foundations
are going to be the norm. Thus the creation of developmental states in SSA especially in
Ghana must integrate multi-party politics and streamline the politics of development to
ensure the continuity of development plans and policies.

58
9. Develop corporatist institutions as or before the system is democratized.
10. Make piecemeal reforms even in soft states so as create an institutional configuration
better able to support a modest industrial policy.
The successful replication of these depends entirely on the commitment of the replicating
nations. Ghana, has a unique opportunity to become the next (democratic) developmental
state, however embedded autonomy must be achieved, statecraft must be reorganized, and far
more importantly, a tangible and serious national agenda of development must be the driving
force of current and future governments. Chapter 5 discusses the role of the developmental
state in agricultural development using Ghana and Malaysia as case studies. The role of the
Malaysian developmental state and lessons for Ghanaian agriculture will be highlighted.

59
CHAPTER 5
AGRICULTURAL TRANSFORMATION, RURAL DEVELOPMENT AND THE DEVELOPMENTAL STATE: A COMPARATIVE ANALSYIS OF THE CENTRAL
REGION OF GHANA AND SARAWAK, MALAYSIA
“It is in the agricultural sector that the battle for long-term economic development will be won or lost”-(Myrdal 1968)
5.1 Introduction
Agriculture’s importance to economic development has long been recognized by
scholars and policymakers. In SSA, the relevance and potential of agriculture is well
documented1
Population growth coupled with rising food insecurities has made the need for
agricultural transformation pertinent in SSA. In recognition of this, research and efforts by
international organizations such as the World Bank, FAO and Gates Foundation have
increased over the years. Mirroring agricultural transformation in East Asia has been an
important part of such efforts. Understanding the interplay of private and public initiatives
that deepened the relationship between agriculture and other sectors of East Asian economies
while contributing to their economic development has served as a point of reference for many
countries in SSA because of the similar initial conditions that existed between the two
regions in the early 1960s (Karshenas 2001, p. 317).
. Many of the countries are agriculture based and have more than half of their
labor force and about a third of their valued added to GDP generated by the agricultural
sector.
1 In 2000, the FAO with the assistance of the Japanese government commissioned the Role of Agriculture Project to study agriculture’s role in poverty alleviation, food security, population dynamics and economic development in agriculture based economies. Also an important part of the Gates Foundation’s Global Development Program is agricultural development. Furthermore in 2009 budget of the Government of Ghana, there was a re-focus and commitment (at least on paper) to agricultural issues. Scholarly works by Kajisa et al. (1997), Boratav (2001), Karshenas (2001) and Sauber (2009) have all added to the discussion on agricultural development in Africa. Finally, the World Development Report (2008), focused solely on agricultures’ impact on development especially in agricultural based economies.

60
The case of Ghana and Malaysia is an archetypal example of agricultural
transformation and stagnation. Similarities and differences of their initial and current
conditions are presented in table 10. The table shows that rural agricultural populations were
similar in the 1960s but dramatically different in 2008 and agricultural productivity per
worker which is the ratio of agricultural value added to the number of workers in agriculture
has risen fastest in Malaysia. The difference in 1990-92 was $93 but in 2003-2005, that
margin rose to $205.
Table 10: Selected Agricultural Indicators for Ghana and Malaysia
I II III
Rural Pop (%) Employment (%)
Ag. Productivity per worker (in 2000 $)
1960 2008 1960 2008 1990-92 2003-2005
Ghana 76.7 49.9 64 56 293 320 Malaysia 73.4 29.4 63 14 386 525 Source: World Development Indicators 2009 The remainder of this chapter provides a comparative analysis of agricultural
transformation and rural development using Ghana and Malaysia as examples. The role of
the developmental state in agricultural transformation is discussed and lessons from the
Malaysian experience are highlighted so that they can be adopted where applicable in Ghana.
All comparative analysis is based on field research and observations in the two countries
from October to December 2009 and July through August 2010.
5.2 Methodology
To add a human perspective and to address issues of data deficiency especially in
Ghana, a focused ethnographic study of stakeholders in agriculture was undertaken2
2 Focused ethnographic studies are common in medical research and community based studies. It is my believe that if the goal is to learn from a small group of people the causal mechanisms of an activity or an event in their
. Focused

61
ethnography differs from traditional ethnography because the topic of interest is specific and
the focus is on the common behaviors and experiences that result from the shared features
and interests of the participants. This method fits this dissertation given the specificity of the
topic (agricultural transformation) and its focus on the common features of participants
(farmers, fishermen, livestock keepers, scholars and policymakers in agriculture). This type
of ethnography shines the spotlight on small elements in a society to help understand the
unique experiences of individuals in that society (Mack et al. 2005, Richards et al. 2007).
Table 11 highlights the differences between conventional and focused ethnography.
Table 11: Differences between Conventional and Focused Ethnography Conventional Ethnography Focused Ethnography Long-term Field Visits Short-term Field Visits Experientially Intensive Data/Analysis Intensity Time Extensity Time Intensity Writing Recording Solitary Data Collection and Analysis Data Session Groups Open Focused Social Fields Communicative Activities Participant Role Field-Observer Insider Knowledge Background Knowledge Subjective Understanding Conservation Notes Notes and Transcripts Coding Coding and Sequential Analysis Source: Knoblauch, Hubert (2005, September). Focused Ethnography [30 paragraphs]. Forum: Qualitative Social Research [On-line Journal], 6 (3), Art. 44. Available at: http://www.qualitative-research.net/fqs-texte/3-05/05-3-44.htm [Date of Access: 11/17/2010] Critics of focused ethnography argue that conclusions reached by such studies are
superficial given the short time period involved but as Knoblauch (2005) contends, the
duration of such studies is compensated for by another type of intensity: data and time.
community, then this type of ethnography holds the best answers. See Gove et al. 1994. The first part of field work was based in the Central Region of Ghana and the second was based in Sarawak, Malaysia.

62
Questionnaires, focus groups and field-observations based on short field visits were
extensively used. Field visits involved day trips to oil palm plantations and processing plants,
cocoa, citrus, cassava and plantain farms, pineapple plantations and sorting facilities, pepper
and rubber gardens, small scale copra processing, wet and dry paddy fields, marine and
inland fisheries sites, poultry farms, piggeries and cattle ranches, aquaculture workshops,
national farmers day celebrations and village and community markets.
Data collected was analyzed using simple statistical methods. Data was cross-checked
where permissible with published data for consistency. A thematic analysis was used to
identify the main issues faced by participants. Verbal consent was sought from all
interviewees and data was stored and kept in line with institutional review board standards.
Appendix A and B are the questionnaires and other interview questions used during field
research.
5.3 Agriculture in the Ghanaian Economy Ghana’s agricultural sector employs 56% of the working population and contributes
36% of the value added to GDP. Cocoa is the most important crop and occupies a strategic
position in the political economy of Ghanaian agriculture. The crop has been the symbol of
Ghanaian agriculture since colonial times and in the 1960s, Ghana accounted for 33% of
world cocoa production. Up to the 1980s, cocoa accounted for 45% of foreign exchange
earnings and 65% of total exports. Since the 1980s, Ghana’s dominance in cocoa has
declined dramatically as countries like Cote D’Ivoire, Malaysia, Indonesia and Brazil have
increased their production of the crop (Appiah 2004, Oduro 2000 and Essegbey 2009).
Crop farming accounts for an estimated 77% of all agricultural activities with
fisheries and livestock and non-crop sectors accounting for 13% and 10% respectively.

63
Agricultural activities occur in six agro-ecological zones: coastal, guinea and sudan
savannahs, tropical rainforest, semi-deciduous rainforests and a transition zone of semi-
deciduous forests and grasslands. Variegated climatic conditions allow for the cultivation of
many crops. Industrial crops such as cocoa and oil palm are cultivated in the forest regions.
Roots, tubers, legumes and cereals are grown in the transitory zone, guinea and Sudan
savannahs and the semi-deciduous forests. Fruit, vegetables and horticultural crops do well in
the coastal plains. Table 12, shows the main crops cultivated in Ghana.
Table 12: Main Crops Cultivated in Ghana Group Crops Cereals Maize, Millet, Sorghum, Rice Industrial Crops Cocoa, Oil Palm, Coffee, Cotton, Tobacco, Shea Nut, Cola nut Legumes Cowpea, Bambara nut, Groundnut, Soybean Fruits Papaya, Avocado, Mango, Cashew, Watermelon, Banana (Plantain) Vegetables Tomato, Eggplant, Onion, Pepper, Okra, Cabbage, Lettuce, Carrot Roots and Tubers Yam, Cassava, Cocoyam, Sweet Potato
Source: FAO, Fertilizer Use by Crop in Ghana, 2004, p. 5
Climatic conditions provide varied rainfall patterns across the country. Growing
periods are longest in the rainforests and shortest in the coastal plains and northern
savannahs. Figure 13 shows growing periods across Ghana. The Western region has the
longest growing period and largest rainfall totals. Rainfall totals are lowest in the Greater
Accra Region, along the coast line and in the upper east and west regions. The Central
Region has varied growing periods. In the interior, growing period is as high as 330 days
and along the coast they are as low as 180 days. This variety allows for most crop groups to
be cultivated in different parts of the region.

64
Figure 13: Agro-ecological zones of Ghana. Source: FAO, Fertilizer Use by Crop in Ghana, 2005, p. 3
Agricultural activity occurs on 7.1 of the available 13.5 million hectares of cultivable
agricultural land. Smallholder agriculture dominates and most cultivation is rain-fed. About
90% of farm sizes are between 2-5 hectares and the potential for irrigation is tremendous as
only an estimated 11,000 hectares of grassland are irrigated. Soil conditions in the country
are favorable as acrisols and luvisols are the major soil types. For example ferric and orthic
acrisols make up more than 95% of the soils in the Central Region. Acrisols, luvisols,
gleysols, oxisols and podzols are generally good to moderate in the cultivation of various
crops including industrial tree crops such as cocoa and oil palm. These soils occur in a
variety of vegetations but one constant is large quantities of rainfall (FAO 2004).

65
Figure 14: Soil Map of Ghana. Source: FAO, Fertilizer Use by Crop, 2005, p. 4 In spite of the tremendous potential for agriculture, productivity levels have generally
been low. Figure 15 and 16 look at the area harvested and production data for some of the
main crops. Area under cultivation has grown very slowly. For example area cultivated of
cocoa peaked at 2 million hectares in 2004 and current levels are similar to those of the early
1960s. Oil palm has grown six fold to 352,800 hectares and cassava has grown eight fold to
about 885,800 hectares. Paddy has also grown significantly. In absolute terms, production
levels have increased the fastest for cassava and oil palm. In recent years, government action
via the President’s Special Initiative on cassava starch has transformed the crop into an
industrial crop and boosted production levels (Essegbey 2009, p. 63).

66
Figure 15: Planted Area of Selected Crops in Ghana, 1961-2009 (Data on cocoa for 2009 is missing). Source: FAOSTAT and Ministry of Food and Agriculture, Ghana
Figure 16: Production of Selected Crops in Ghana, 1961-2009 (data on cocoa for 2009 is missing). Source: FAOSTAT and Ministry of Food and Agriculture, Ghana
Tables 13 and 14 are simulated data based on average yield and achievable yield data
for selected crops. Table 13 shows that even though yields have increased for nearly all crops
since the 1970s, less than 50% of potential yields were realized. Cocoyam and plantains were
the only crops to reach more than 75% of achievable yields.
0
500000
1000000
1500000
2000000
2500000
1961
1963
1965
1967
1969
1971
1973
1975
1977
1979
1981
1983
1985
1987
1989
1991
1993
1995
1997
1999
2001
2003
2005
2007
2009
Planted Area of Selected Crops in Ghana, 1961 - 2009 (in hectares)
Cassava Cocoa Oil Palm Rice (paddy)
02000000400000060000008000000
100000001200000014000000
1961
1963
1965
1967
1969
1971
1973
1975
1977
1979
1981
1983
1985
1987
1989
1991
1993
1995
1997
1999
2001
2003
2005
2007
2009
Production of Selected Crops in Ghana, 1961 - 2009 (in metric tons)
Cassava Cocoa Oil Palm Rice (paddy)

67
Cassava has enjoyed increased production in recent years but was at only 50% of potential3
Table 13: Average and Achievable Yields (in metric tons per hectare)
.
Crop Average Yield
Achievable Yields % of Yields Achieved in 2000s 1970-79 1980-89 1990-99 2000s
Maize 1 1.1 1.4 1.5 5 30 Rice 1 0.9 1.8 2.1 6.5 32 Millet 0.6 0.6 0.8 0.8 2 40 Sorghum 0.8 0.7 1 1 2 50 Cassava 7.9 7.2 11.2 11.8 28 42 Yam 5.3 5.2 11.7 12.5 20 62 Cocoyam 4.7 4.5 6.8 6.5 8 81
Plantain 5.8 5.5 7.6 8.7 10 87 Sources: Statistics, Research and Information Directorate (SRID), Ministry of Food and Agriculture, Accra. National Development Planning Commission, Seven Year Development Plan (2008-2015), Chapter 5 and Asuming-Brempong and Nyanteng 2003, p. 21.
Table 14: Estimated Production if Yields reached Achievable Levels (in thousands of metric tons)
Crop Average Production from 2005-2007 Production if Potential Achieved Maize 1246 4153 Rice (Paddy) 269 833 Millet 168 420 Sorghum 295 590 Cassava 9978 23676 Yam 4125 6600 Cocoyam 1679 2066 Plantain 2682 3083 Source: Calculations based on data retrieved from Statistics, Research and Information Directorate (SRID) at the Ministry of Food and Agriculture, Accra, The Ghana Statistical Service, Accra. National Development Planning Commission, Seven Year Development Plan (2008-2015), Chapter 5, Asuming-Brempong and Nyanteng 2003 and FAOSTAT
Fisheries resources in Ghana can be found along the country’s 342 mile coastline and
the 1.1 million hectares of inland waters (most of which is the Volta Lake) plus aquaculture.
Aquaculture is a relatively new, but this source of fish is growing fast. There are ponds in
3 Achieving potential yields are heavily dependent on near perfect conditions; however, action towards achieving at least 75% of the potential will make a tremendous difference in production levels. Irrigation, fertilizer use, demand conditions and purposeful government action towards particular crops can all influence yields. Estimated figures in table 14 are speculative, however, the point remains that achieving levels higher than current levels are possible.

68
eight of the ten regions (Fisheries Commission, Accra 2008). Like crop farming, the
exploitation of fisheries resources is mostly done by small scale fishermen along coastal
towns in four coastal regions. The port city of Tema in the Greater Accra Region remains the
commercial fishing capital of the nation4
As global fish stocks have declined, so have marine fish landings in Ghana. Landings
of the Atlantic Tuna and other pelagic species have declined tremendously (Ghana Marine
Fisheries Research Department, 2007 and firsthand accounts of 31 small scale fishermen
interviewed between 11/03/2009 and 11/28/2009). Fisheries statistics are reported in table
15-17. Periodic averages in table 15 show an increase in total landings by marine and inland
fisheries. However, as figure 17 shows, landings from 2000-2006 have been declining for
both sources in line with global trends. Table 16 shows that less than 500 hectares is
currently being used for aquaculture. Fish farming employs an estimated 2,869 people across
eight regions. Data on other fish culture is presented in table 17. In 2008, fish cages could be
found in the Eastern and Greater Accra regions. Fish pens were only in the Volta region.
Reservoirs covered about 9,184 hectares and could be found in six regions.
. Landings for marine fisheries in Axim and
Sekondi-Takoradi in the Western region and Moree, Elmina and Winneba in the Central
region form an important part of marine fishing.
Table 15: Annual Fish Production by Source, 1970-2006 (5-Year Averages in Metric Tons) 1970-74 75-79 1980-84 85-89 1990-94 95-99 2000-2006 Marine 184000 213000 225000 302000 317000 312000 332422 Inland 38000 40000 42000 57000 56000 73000 81363 Total 222000 253000 267000 359000 373000 385000 413785
Source: Fisheries Commission, Accra-Ghana
4 Korean and Chinese fishing companies dominate commercial fishing in Ghana. Even though most commercial vessels are operated by Koreans and Chinese these vessels have what one fisherman referred to as “puppet Ghanaian managers” who secure licenses et cetera for Korean and Chinese firms. The fisherman also commented on the quality of the fish that reaches landing sites: “big fish are stored by the Chinese and Koreans, and juvenile fish not discarded in open sea are sold to local fish mongers”, Interview conducted on 11/3/2009.

69
Figure 17: Fish Landing by Source in Ghana, 2000-2006. Source: Statistics, Research and Information Directorate, Ministry of Food and Agriculture, Accra. Table 16: Aquaculture by Region (2008)
Region Number of Fish Farmers
Number of Ponds
Number of Functional Ponds
Number of non-functional ponds
Total Surface Area in Hectares
Ashanti 304 746 746 0 118.71 Brong Ahafo 333 761 761 0 138.63 Central 253 633 610 23 39.91 Eastern 107 311 311 0 20.35 Greater Accra 64 233 207 26 39.5 Volta 143 308 54 54 67.35 Western 1650 2550 2550 0 59.1 Upper East 15 25 25 0 7.52
Total 2869 5567 5264 103 491.07 Source: Fisheries Commission, Accra, Ghana
380000315530
88000 74331
0
50000
100000
150000
200000
250000
300000
350000
400000
2000 2001 2002 2003 2004 2005 2006
Marine and Inland Fish Landings, 2000-2006 (in metric tonnes)
Marine Inland
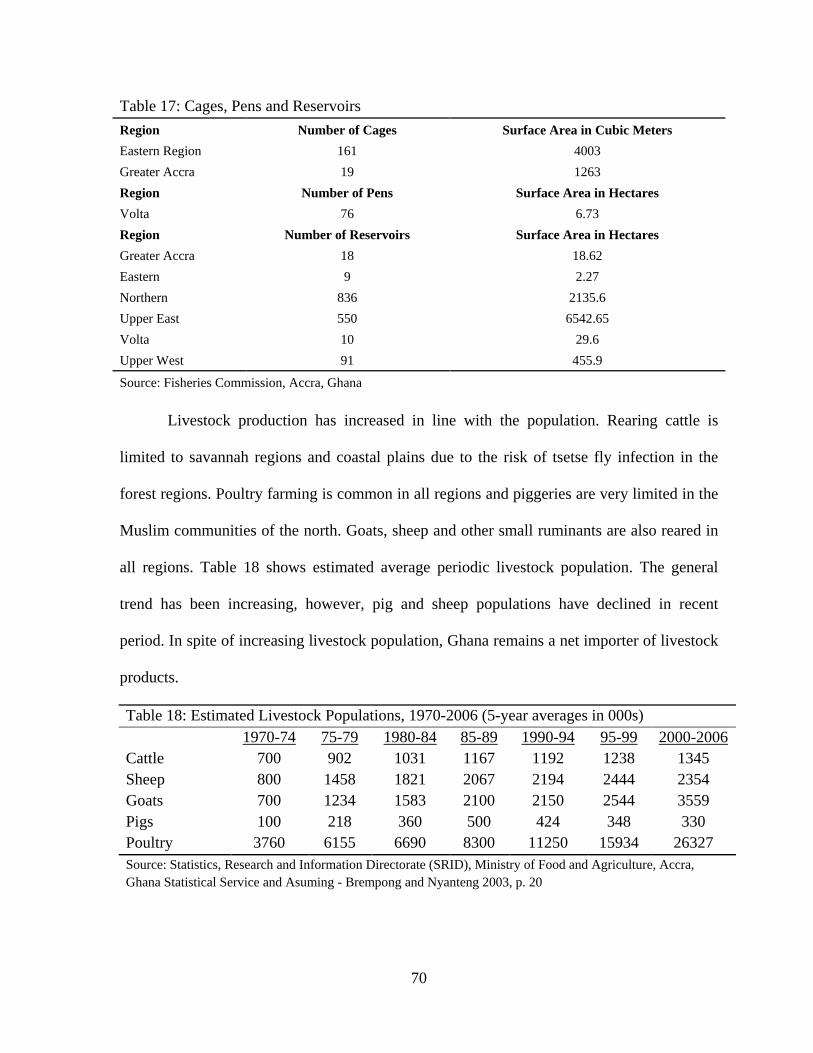
70
Table 17: Cages, Pens and Reservoirs Region Number of Cages Surface Area in Cubic Meters Eastern Region 161 4003 Greater Accra 19 1263 Region Number of Pens Surface Area in Hectares Volta 76 6.73 Region Number of Reservoirs Surface Area in Hectares Greater Accra 18 18.62 Eastern 9 2.27 Northern 836 2135.6 Upper East 550 6542.65 Volta 10 29.6 Upper West 91 455.9
Source: Fisheries Commission, Accra, Ghana
Livestock production has increased in line with the population. Rearing cattle is
limited to savannah regions and coastal plains due to the risk of tsetse fly infection in the
forest regions. Poultry farming is common in all regions and piggeries are very limited in the
Muslim communities of the north. Goats, sheep and other small ruminants are also reared in
all regions. Table 18 shows estimated average periodic livestock population. The general
trend has been increasing, however, pig and sheep populations have declined in recent
period. In spite of increasing livestock population, Ghana remains a net importer of livestock
products.
Table 18: Estimated Livestock Populations, 1970-2006 (5-year averages in 000s)
1970-74 75-79 1980-84 85-89 1990-94 95-99 2000-2006
Cattle 700 902 1031 1167 1192 1238 1345 Sheep 800 1458 1821 2067 2194 2444 2354 Goats 700 1234 1583 2100 2150 2544 3559 Pigs 100 218 360 500 424 348 330 Poultry 3760 6155 6690 8300 11250 15934 26327 Source: Statistics, Research and Information Directorate (SRID), Ministry of Food and Agriculture, Accra, Ghana Statistical Service and Asuming - Brempong and Nyanteng 2003, p. 20

71
5.4 Agriculture in the Malaysian Economy The relative importance of agriculture to the Malaysian economy has decreased since
independence. Value added to GDP by agriculture has declined to 4% in the 2000s.
Employment in agriculture has declined to an estimated 14% of the working population
(Department of Statistics-Malaysia, 2009). Declines in value added to GDP and share of
employment has not meant that the sector has become unproductive. Rather, it has become
more entwined with industry and services and continues to be an important part of the overall
economy. Natural rubber once the face of Malaysian agriculture has given way to oil palm
which is by far the most important crop in Malaysia today. Cocoa was important in the 1980s
but its significance has declined tremendously5
Industrial crop cultivation in complemented by other crop farming in pepper, paddy,
fruit crops and vegetables. Livestock keeping, fisheries and other non-crop sectors
particularly logging are very important to Malaysia. The main agro-ecological zone in
Malaysia is the tropical rainforest. The major regions characteristically have similar rainfall
patterns, lengths of growing period and thermal patterns during the growing seasons. The
highest rainfall totals are in Sarawak and Sabah (Malaysia Meteorological Service
Department, 2009, and FAO 2004, p. 1).
. Crop farming is undertaken by smallholders,
commercial plantations, estates and government land development schemes such as the
Federal Land Development Authority (FELDA). Plantation agriculture accounts for the
majority of crop farming.
The terrain of peninsular and East Malaysia is characterized by coastal lowlands
which slowly transition into mountainous inland territories. Unlike Ghana, fewer portions of
5 Area harvested of cocoa peaked in 1989 at an estimated 414,236 hectares. In 2009, the estimated area was only 20,561 hectares (Department of Statistics-Malaysia, 2009 and FAOSTAT).

72
the Malaysian landscape are isotropic. The interior of East Malaysia is very mountainous
especially as the country meets Kalimantan (Indonesia). Crop groups cultivated in Malaysia
are similar to those in Ghana but superior rainfall totals give Malaysia an edge in the
cultivation of certain crops.
Figure 18 and 19 show agro-ecological zones for peninsular and East Malaysia (only
Sarawak6
). Figure 18 shows areas of histosols in the peninsular. Histosols are typically found
in swampy forests and mangroves and thus it is no surprise that they are found close to the
South China Sea and straits of Melaka (Malacca). Histosols are very poor soils for cultivation
(FAO 2004). Regions in the south of the peninsular in the state of Johor for example are
characterized as being without a regular dry season, an indication of the regularity of rainfall.
In figure 19, undulating hills and other anisotropic terrain are common.
Figure 18: Agro-ecological zones of peninsular Malaysia. Source: FAO, Fertilizer Use by Crop in Malaysia, 2004, p. 7
6 Conditions in Sabah are similar with respect to the agro-ecology (FAOSTAT 2004).

73
Figure 19: Agro-ecological zones of East Malaysia. Source: Department of Agriculture-Sarawak in
FAO, Fertilizer Use by Crop in Malaysia, 2004, p. 10 Cultivable agricultural land in Malaysia is estimated to be about 14 million hectares; slightly
larger than agricultural land in Ghana. Soil conditions in Malaysia are not the best. Heavy
rainfall leads to tremendous leaching and the continued exposure of forest lands particularly
in Sarawak and Sabah due to logging have worsened matters. Figure 20 shows the dominant
soils of Malaysia. Coastal regions are characterized by histosols (including peat soils) which
are cultivable in very limited circumstances. Acrisols characterize most country and are
generally suitable for cultivating a variety of crops but more importantly tree crops.
Figure 20: Map of Dominant Soils in Malaysia. Source: FAO, Fertilizer Use by Crop in Malaysia, 2004, p. 8

74
Climatic and soil conditions have contributed to extraordinary agricultural
productivity in Malaysia. The country is largely self-sufficient in most food commodities.
Table 19 shows estimated self sufficiency levels in a variety of food commodities. Of the ten
commodities listed, self sufficiency is achieved in six with near sufficiency in rice.
Table 19: Malaysia's Self Sufficiency Levels in Food Commodities (in percentages) Commodity 2010 Rice 90 Fruits 138 Vegetables 108 Fisheries 104 Beef 24 Mutton 10 Poultry 122 Eggs 115 Pork 132 Milk 5 Source: Murad, W., Mustapha, N., and Siwar, C 2008, p. 612 and Ninth Malaysia Plan (2006-2010)
Figure 21 shows the area harvested of selected crops in Malaysia. The decline of
rubber and the increase in the cropped area of oil palm is amazing. Planted area of oil palm
surpassed natural rubber in 1989 and has grown seven times since 1975. Area harvested of
natural rubber has declined by 747,000 hectares since 1975. Area planted of paddy, coconuts
and cocoa have all declined. A drive towards monoculture is evident in the data as more land
is being brought under oil palm cultivation particularly in Sarawak and Sabah7
7 In 2009, Sarawak had the largest number of immature oil palm in Malaysia at an estimated 193,746 hectares (MPOB, 2009)
. Figure 22
shows production data for the selected crops in figure 20. Oil palm has grown the fastest with
an estimated 2009 production of 83 million metric tons. Paddy was estimated at 2,353,000
metric tons, natural rubber at 1,072,400 and cocoa at 27,955 metric tons. Paddy and oil palm

75
outputs have been on the rise while natural rubber and cocoa have been declining
(FAOSTAT, Malaysia Palm Oil Board, Malaysia Cocoa Board and Malaysia-Yearbook of
Statistics 2008).
Figure 21: Planted Area of Selected Crops in Malaysia, 1975-2009. Sources: Malaysia Palm Oil Board, Malaysian Cocoa Board, Malaysia-Yearbook of Statistics 2008 and FAOSTAT
Figure 22: Production Estimates for Selected Crops in Malaysia, 1975-2009. Sources: Malaysia Palm Oil Board, Malaysian Cocoa Board, Malaysia-Yearbook of Statistics 2008 and FAOSTAT. Oil palm output can be referenced with the primary axis (on the left) and the output of other crops can be referenced using the secondary axis (on right).
0
1000000
2000000
3000000
4000000
5000000
1975 1977 1979 1981 1983 1985 1987 1989 1991 1993 1995 1997 1999 2001 2003 2005 2007 2009
Planted Area of Selected Crops in Malaysia, 1975-2009 (in hectares)
Natural Rubber Cocoa Oil Palm Rice (paddy)
0
500000
1000000
1500000
2000000
2500000
3000000
0100000002000000030000000400000005000000060000000700000008000000090000000
1975
1977
1979
1981
1983
1985
1987
1989
1991
1993
1995
1997
1999
2001
2003
2005
2007
2009
Production of Selected Crops in Malaysia, 1975-2009 (in tons)
Oil Palm Natural Rubber Cocoa Rice (paddy)
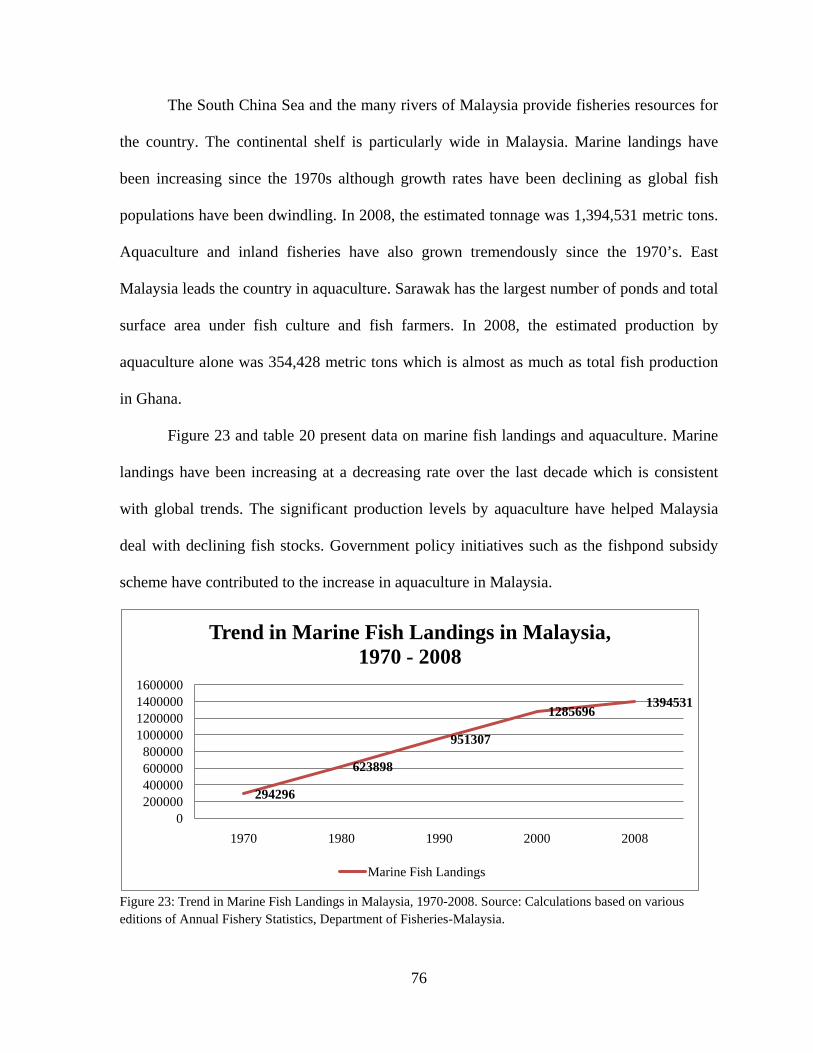
76
The South China Sea and the many rivers of Malaysia provide fisheries resources for
the country. The continental shelf is particularly wide in Malaysia. Marine landings have
been increasing since the 1970s although growth rates have been declining as global fish
populations have been dwindling. In 2008, the estimated tonnage was 1,394,531 metric tons.
Aquaculture and inland fisheries have also grown tremendously since the 1970’s. East
Malaysia leads the country in aquaculture. Sarawak has the largest number of ponds and total
surface area under fish culture and fish farmers. In 2008, the estimated production by
aquaculture alone was 354,428 metric tons which is almost as much as total fish production
in Ghana.
Figure 23 and table 20 present data on marine fish landings and aquaculture. Marine
landings have been increasing at a decreasing rate over the last decade which is consistent
with global trends. The significant production levels by aquaculture have helped Malaysia
deal with declining fish stocks. Government policy initiatives such as the fishpond subsidy
scheme have contributed to the increase in aquaculture in Malaysia.
Figure 23: Trend in Marine Fish Landings in Malaysia, 1970-2008. Source: Calculations based on various editions of Annual Fishery Statistics, Department of Fisheries-Malaysia.
294296
623898
951307
12856961394531
0200000400000600000800000
1000000120000014000001600000
1970 1980 1990 2000 2008
Trend in Marine Fish Landings in Malaysia, 1970 - 2008
Marine Fish Landings

77
Table 20: Aquaculture by state (2008)
State Number of Fish Farmers
Number of Freshwater Ponds
Total Surface Area (in hectares)
Perlis 117 345 26.14 Kedah 599 2032 169.86 Pulau Pinang/Penang 53 468 61.12 Perak 1226 3099 944.61 Selangor 329 1331 308.58 Negeri Sembilan 897 1864 309.5 Melaka 184 466 71.52 Johor 228 1862 208.54 Pahang 765 1636 272.31 Terengganu 531 1290 181.05 Kelantan 645 1757 151.55 Total Peninsular Malaysia 5574 16150 2704.78 Sarawak 9374 15754 1479 Sabah 5743 14178 732 Total East Malaysia 15117 29932 2211 Total Malaysia 20691 46082 4915.78 Source: Annual Fisheries Statistics 2008, Department of Fisheries, Malaysia.
Like Ghana, Malaysia’s livestock population has grown in line with growing demand
for livestock products. Poultry is the largest livestock group because of cultural and religious
reasons8
8 Halal (no pork) food operators in many parts of Malaysia ensure that chicken (ayam in Malay) and other poultry form the most important meat requirement. In most Chinese communities pork is served and in the rural communities of Sarawak, pork and wild boar (babi hutan) continue to be an important part of the dietary needs of the community.
. The largest stocks of animals are on the peninsular. For instance, in 2008 it was
estimated that Sarawak and Sabah had only 6.25% of the national cattle population
(Malaysia-Yearbook of Statistics 2008, p. 65). Table 21 presents data on the estimated
livestock population of Malaysia. Pigs mostly consumed by the Chinese and native groups of
Sarawak and Sabah have increased over the years. Sheep and buffaloes have decreased while
goat populations have seen resurgence in recent period. Chicken and other poultry have
grown extremely fast over the last two decades.

78
Table 21: Estimated Livestock Population, 1970-2008 1970 1980 1990 2000 2008 Cattle 325522 549522 667720 733892 796550 Goats 368776 342119 331278 237634 335952 Pigs 1086236 1837004 2678083 1807590 2027561 Sheep 39213 61283 205409 157070 110415 Buffaloes 310402 285339 205163 142042 127646
Chicken (1000 head) 37000 50800 57000 123650 190000 Source: FAO STAT, Malaysia Yearbook of Statistics 2008, p. 65-66
5.5 The Case for Central Region, Ghana and Sarawak, Malaysia
Country-wide analysis of agriculture is a big task for any individual researcher. In this
dissertation, the analysis is focused on the Central Region of Ghana and Sarawak, Malaysia9
Central Region, Ghana and Sarawak, Malaysia are not the bread baskets of their
respective nations but they are strong contributors to agricultural output. In one sense they
are average to better than average agricultural locations. Each of the two areas has all three
constitutive sub-sectors of agriculture (crops, fisheries and livestock) and this played an
important role in them being chosen for this comparative analysis. Similar crops are also
cultivated in both areas.
.
The choice of these two locations is based on their unique roles in the agricultural sectors of
their respective countries, the climatic and soil conditions (largely acrisols), the progress and
potential of agriculture and the relative ease of research (I had contacts with institutions in
both regions which assisted with fieldwork).
9 Although the research focuses on these two areas, I travelled to other regions and states of the respective countries. In Ghana, I traveled to the Greater Accra, Eastern, Ashanti and Western regions. In Malaysia, I traveled to the Peninsular and visited Kuala Lumpur, Putrajaya and parts of Selangor. I also visited several parts of Sabah including its main city of Kota Kinabalu.

79
5.5.1 Central Region, Ghana
Ghana’s Central Region is divided into seventeen districts for administrative
purposes. The seat of regional government is Cape Coast. Figure 24 shows a map of the
region with districts identified. The Agona, Gomoa and Upper Denkyira districts were
recently realigned to bring the total districts in the region to seventeen. Komenda-Edina-
Eguafo-Abirem, Cape Coast Municipal, Abura-Asebu-Kwamankese, Mfantseman, Gomoa
and Awutu-Effutu-Senya districts make up the 104 mile coastline of the region.
Figure 24: Map of Central Region of Ghana. Source: retrieved from http://ghana-
net.com/Documents/776px-Central_Ghana_districts.png on November 10th, 2010.
The land capability and technical potential for agriculture in the region is immense.
Total agricultural land is estimated at 1,454,569 hectares of which only 454,569 is currently
under cultivation mostly by smallholders. Grasslands in the coastal plains allow for livestock
keeping and rivers Offin and Pra, several lagoons, and the Atlantic Ocean provide fisheries
resources. Marine fish landings in the region account for 25% of Ghana’s total fish output.
Fish farming and non-traditional agricultural activities like bee-keeping and snail farming are
also on the rise.

80
In 2008, there were estimated 253 fish farmers, 610 functional ponds with a surface
area of over 40 hectares, and 300 snail farmers in the region. The terrain of the region is
isotropic with isolated hills and the highest point is 300 ft above sea level. The agro-
ecological zones of the region are coastal savannah which quickly transition into moist semi-
deciduous and tropical rainforests (Population and Housing Census-Central Region, Ghana
Statistical Service, 2000 and CEDECOM 2009).
The main crops cultivated in the region include cocoa, oil palm, cassava, plantains,
maize, coconuts, citrus, pineapples and other fruit crops such as papaya. Agro-processing
facilities for oil palm and fruits are available in the region. The region is the leading producer
of citrus in the nation and among the leaders in cassava and oil palm production. In spite of
the potential for progress, economic and social conditions in the region are very poor and the
region ranks among the top four by national poverty standards. Many rural communities lack
potable water, hospital facilities and other basic social amenities. Rural development and
structural change has been minimal. Agriculture is the main occupation of most individuals
and the sector employs over two-thirds of working population and accounts for an estimated
52.3% of the economic output of the region. Agricultural development holds the key for long
term economic development in the Central Region.
5.5.2 Sarawak, Malaysia Malaysia’s Sarawak was carved out by the dynastic Brooke family starting in the mid
19th century (Rawlins 1965, Reece 2004). Administratively, it is divided into eleven divisions
with the city of Kuching in the Kuching Division as the capital. Figure 25 shows Sarawak
and its constitutive divisions. The state shares the island of Borneo with the state of Sabah to

81
the northeast and Kalimantan (Indonesia) to the south. Brunei Darussalam is nestled in the
northeastern corner of Sarawak between the Miri and Limbang divisions.
Figure 25: Map of Sarawak, Malaysia. Retrieved from http://dayakbaru.com/weblog08/2008/04 The land capability and technical potential for agriculture in Sarawak is heavily hampered by
the terrain of the state. Of the 12.3 million hectare land area, only 3.5 million can be
considered as having any potential for agricultural activity. As Schatz (2007) notes, “there is
a scarcity of good agricultural land” in Sarawak. Mass et al. (1986) noted that;
Of the land suitable for agriculture, about 1.64 million hectares are classed as marginal and consists mainly of hilly land suitable only for small-holders using hand tools for rubber or subsistence crops, leaving 1.84 million hectares as moderately suitable to suitable for commercial agriculture. Of the latter, only 207,000 hectares are free of some serious limitations to agriculture and are level enough for the employment of modern farm tillage and harvesting machinery (in Schatz 2007, p. 15).
In spite of the dearth of good land, acrisols suitable for agriculture can be found in most of
Sarawak. Coastal regions are characterized by marginal peat soils and other histosols. Terrain
and soil conditions make Sarawak’s agricultural capabilities with regards to soil conditions
similar to the Central Region of Ghana.
The South China Sea and the many large rivers (like the Rajang and Sarawak rivers)
provide immense fisheries resources. Aquaculture is a significant provider of employment

82
and fish for the state. In 2008 there were some 9,734 fish farmers operating 15,754 ponds
that covered 1,479 hectares. Although not the premier marine fishing state, landings in
Sarawak were estimated to be over 150,000 metric tons.
Similar to the rest of the nation, the main crop cultivated in Sarawak is oil palm. In
2009, the cropped area for oil palm was estimated at 839,748 hectares10
Figure 26 shows the estimated crop area of Sarawak’s in 2008. As noted oil palm
accounts for the majority of the planted area and more land area is being brought under oil
palm cultivation.
. Cocoa, paddy (dry
and wet), natural rubber, cassava (tapioca), coconuts, plantains, pineapples, melons, and fruit
crops like papaya are all cultivated in Sarawak. Durian a fruit native to Sarawak is of
significant importance to the state. Sarawak is also famous for its peppers (Agricultural
Statistics of Sarawak, 2008).
Figure 26: Estimated Crop Area of Sarawak in 2008. Source: Agricultural Statistics of Sarawak, 2008
Crops grown in Sarawak are similar to those cultivated in Ghana’s Central Region.
Fishponds grow tilapia and catfish as in the Central Region and besides buffaloes, animals
raised in both regions are similar. Even though agricultural transformation and rural 10 The rate of growth of oil palm in Sarawak is fascinating. In 1963, there were no oil palm plantations or significant area under cultivation. In 2005 about 543,398 hectares was estimated to be under cultivation and in a matter of four years in 2009, that estimate grew by an amazing 300,000 plus hectares (Schatz 2007 and MPOB, 2009).
Fruit Trees3%
Cocoa1%
Oil Palm65%
Spices0%
Coconut2%
Sago5%
Rice (Paddy)10%
Pepper1%
Rubber13%
Vegetables0%
Other0%
Estimated Crop Area of Sarawak, 2008Fruit TreesCocoaOil PalmSpicesCoconutSagoRice (Paddy)PepperRubberVegetablesOther

83
development have been achieved in Sarawak, the state is considered backward by many
Malaysians especially from the peninsular. Many consider it to be a primitive sparsely
populated place full of jungles and rivers. Structural change and rural development has been
achieved in Sarawak and agriculture’s role in this cannot be overstated. Currently, agriculture
contributes less than 11% to the GDP of Sarawak and employs less than 30% of its work
force. Social amenities are by and large available in all areas including most villages
(kampongs). Potable water, accessible roads (except in the interior mountainous regions) and
health facilities11
Given the similarities and agricultural capabilities of the two regions, Sarawak’s
experience with agricultural transformation and rural development can yield important
lessons for Ghana’s Central Region and perhaps Ghana as a whole. Adoption of lessons
highlighted must be undertaken after careful scrutiny of structural and socio-cultural
differences that exist between the two regions. A cookie-cutter approach will simply not
work and is not being advocated here.
are available in most kampongs (Schatz 2007).
5.6 Transformation versus Stagnation in Agriculture: A Case Study of Sarawak, Malaysia and Central Region, Ghana
Agricultural transformation is the process by which the structure of production shifts
from subsistence-based smallholder production towards a more specialized commercial-
based production. It is characterized by a movement away from the cultivation of small plots
(less than 10 hectares) to industrial size plots supported by processing and storage facilities
that allow for value addition to crude products. Agricultural transformation is an important
part of the process of structural transformation because of the backward and forward linkages
11 In the 1960s agriculture employed about 82% of the workforce and contributed about 40% to Sarawak’s GDP (Schatz 2007).

84
that it exposes and enhances between agriculture, industry and services that ultimately
culminate in increased economic output (Timmer 1997, Argwings-Kodhek et al. 2002).
Agriculture has been of great importance to Sarawak, Malaysia and Central Region,
Ghana for many years. Agricultural transformation has contributed significantly to rural
development and poverty eradication in Sarawak, Malaysia. Stagnation in the sector has
deepened poverty in the Central Region of Ghana. In comparing and contrasting the two
regions, important institutional, technological and environmental factors that have helped or
hindered agricultural transformation will be highlighted with the goal of bringing to the fore
important lessons for agricultural development in Ghana’s Central Region.
The analysis in this section draws on evidence gathered from field research and the
notion that agricultural transformation depends on improvements in three key areas: (1)
Technology, (2) Institutional Capacity and (3) Coordination12
Drawing on field research and the three key areas discussed, Table 22 highlights the
major characteristics of agriculture in the Central Region and Sarawak followed by
comparative discussion based on evidence from field research.
. Technology refers to
production processes, storage capacities, research and development and distribution.
Institutional capacity for change refers to the ability of governmental institutions to
encourage progress through purposeful and timely action, infrastructure development and
support services that encourage entrepreneurship and creativity. Coordination refers to the
guiding hand of facilitators of change such as the government and donor agencies.
Coordination is necessary to ensure that uncertainty in the sector is reduced and the focus is
on increasing productivity, incomes and standards of living through agricultural
transformation.
12 These areas are adapted from the methodology of Kajisa et al. 1997.

85
Table 22: Characteristics of Agriculture in the Central Region and Sarawak
Characteristics Central Region, Ghana Sarawak, Malaysia
TECHNOLOGY Farm technology Processing capacity Storage capacity Research and development
Smallholders (simple tools). Limited for most agric output. Very Limited. Very Limited.
Plantations. Capital-intensive. High. Very high.
INSTITUTIONAL CAPACITY Agricultural policy Supporting infrastructure Land Tenure
FASDEP 2007. Very poor access roads to rural farming communities. Customary land tenure where chiefs control the majority of the land.
NAP 1-3. Roads excellent unless disrupted by mountains. Land divided into government, private and native customary lands.
COORDINATION Access to Credit Inputs Marketing
Very poor. Interest rates between 20-50%. Low fertilizer use, limited use of modern inputs and poor extension services. Poor access to domestic, regional and external markets. Out-growing opportunities limited to selected crops.
Very good. Interest rates around 6%. Credit schemes available to farmers. High fertilizer use, use of highest yield varieties are been used and high use of modern technologies. Contract based marketing of industrial crops thereby guaranteeing demand for output. Easy access to markets.
PERFORMANCE Productivity Rural development and poverty
Low. Low, region ranks among the highest in national poverty standards.
High for most crops. Rural development achieved in most areas.
At their birth as bona fide domains, smallholder agriculture accounted for nearly all
agricultural activity in Sarawak and the Central Region. Smallholders cultivating 2-5 hectares
with simple agricultural tools accounted for nearly all production. Fisheries were exploited
with traditional canoes and watercraft and livestock were kept using traditional methods. The
use of high yield varieties, fertilizer, and terrain preparing machinery were negligible. Four
86
decades plus into their future reveal divergence in agricultural and rural development.
Success in Sarawak, Malaysia has occurred through purposeful government action at various
points. Such action has been directed towards agriculture and at times into other areas that
have supported agricultural development. Carefully placed and implemented agricultural
policies have transformed the state from smallholder agriculture to a largely plantation based
agricultural state. This transformation has contributed to social transformation. Sarawak has
become more urban and structurally transformed with rising incomes in nearly all
employments (Schatz 2007).
5.7 Factors behind Agricultural Stagnation in Central Region, Ghana
After its creation just before the 1970 population census, growth in agriculture in the
Central Region has been poor. Output growth has lagged behind population growth, and
structural change and rural development have been missing. Rural incomes largely dependent
on agriculture have remained low13
5.7.1 Technology
(CEDECOM 2009). While agricultural stagnation can be
explained by the methods of agricultural activity, the absence of government policy
initiatives and the neglect of the sector have contributed to the lack of progress in the sector.
As the way of doing things, technology in the Central Region has seen little change.
From a Veblenian perspective, agents of change have struggled to triumph over past binding
methods of agriculture rooted in history, myths and legends. Most farm sizes are between 2-5
hectares and continue to be cultivated with simple tools. Table 23, shows the farm sizes of
twenty-eight crop farmers interviewed across the region. Of the 6 who could be considered
commercial farmers, only 3 cultivated their entire land holdings.
13 It is estimated that about 67% of the regions’ 1.6 million people live in rural areas and agriculture employs an estimated 58% of the regional workforce (Ghana Statistical Service 2005).

87
Table 23: Farm Sizes Size Number of Farms Farm ≤ 5 Hectares 20 5 Hectares < Farm < 20 Hectares 2 Farm ≥ 20 Hectares 6 Source: Field Study October-December 2010 Of the 31 fishermen interviewed in four coastal fish landings sites, none owned
modern commercial fishing vessels. Small dug-out canoes powered by outboard engines
formed the majority of sea-faring watercraft. Of the 22 livestock keepers interviewed only
four could be considered as commercial. The average poultry farmer kept less than 1000
birds. Most owners of small ruminants such as goats and sheep kept less than 20 animals and
cattle herders on average kept a herd of about 40 animals.
Processing capacity for the regions’ output of oil palm, citrus, pineapples and other
crops are very limited. The Twifo-Oil Palm Plantation (TOPP)14
Post harvest management via storage facilities are extremely limited and remain an
important reason for food insufficiency in the region especially in the rainy season when
and processing plant
remains the only modern facility in the region. Traditional processing techniques are still
common among smallholders although some serve as out-growers for processing plants like
TOPP. Limited processing and sorting facilities for pineapples can be found in the town of
Bodwiase in the Awutu-Effutu-Senya district. Facilities for cassava, one of the region’s most
important crops is limited to the Ayensu Starch factory also in the Awutu-Effutu-Senya
district. Processing facilities for animal products are very limited and there are no fisheries
processing facilities in the region. Traditional methods of smoking and salting fish remain the
main fish preservation and processing technique.
14 Twifo Oil Palm Plantation is located in the Twifo-Hemang Lower Denkyira district of the region. The plantation owns an estimated 4,234 hectares. Outgrowing smallholders are a source of fresh fruit bunches for this plantation. Smaller processing plants are located in Agona Duakwa.

88
many roads are impassable. Field observations in the citrus capital of the region (Abura-
Asebu-Kwamankese district) showed that a significant amount of the region’s citrus never
leaves. Oranges in particular were observed on roadsides in hot and humid conditions (Field
Study October-December 2009).
Research and development is very limited. Research is centralized at the Ministry of
Food and Agriculture in Accra. Farmers, fishermen and livestock keepers in the region
continue to use primitive methods because of their lack of knowledge of new techniques.
Information transfer is poor for most agricultural processes. For example, fishermen in the
region continued to combine various mesh sizes in hopes of increasing their catch15
5.7.2 Institutional Capacity
. The
poor transmission of knowledge from research centers in Accra to the farthest corners of the
region has contributed to the continued use of less productive technology. Localized research
and new and efficient partnerships between public and private entities need to be encouraged
and established. For example, knowledge at the University of Cape Coast barely makes it out
of Cape Coast to rural farming communities.
Commitment to agricultural policy has been very poor as different governments
implement different policies. The Food and Agriculture Sector Development Policy II
(FASDEP), published in 2007 is the guiding authority for agriculture in the country and
region. FASDEP acknowledges that the biggest challenge to the achievement of outlined
policies is budgetary. The FAO noted that;
15 Combined mesh sizes often lead to the capture of juvenile fish, thereby affecting fish stocks in subsequent periods.

89
Most agricultural projects depend on donor sources for funding. For example, in the 2002 budget of MOFA, the Government of Ghana’s contribution was 33 percent and the remaining 67 percent was expected to come from donor sources. Donor funding is used largely to implement projects, while government’s contribution is used to mostly pay staff salaries, wages, travel allowances and other emoluments (2004a, p. 37).
Agriculture supporting infrastructure such as access roads to rural farms is very poor.
Pot holes and unpaved roads prolong otherwise short trips from producing areas to market
centers. Rural electrification remains poor as less than 50% of the region has access to often
interrupted electricity service. The absence of regular power supply is a big hindrance to
increasing the processing capacity in the region. Social amenities are also poor as many in
the region do not have toilet facilities, good potable drinking water and health facilities. The
ratio of doctor to patient is estimated at 1:36,233 (Ghana Statistical Service 2005).
Land tenure is described by many scholars of African and Ghanaian agriculture as
one of the most debilitating factors of agricultural transformation. In the region as in many
areas of the country, tenure is defined along customary lines and local chieftains control the
majority of the land. Before field research, I was convinced that the literature was correct,
however field research revealed otherwise. Although the majority of crop farmers worked on
inherited land, those who purchased land did not find the tenure system to be a hindrance. In
fact many found that once their ideas were presented to local chieftains’, extra land was
offered to them at discounted rates on condition that the majority of workers will be hired
from the local community and that the farmer will engage the local community in mutually
advantageous ways. Table 24, shows the distribution of land ownership and rights among the
28 crop farmers interviewed. If tenure was a strong debilitating factor, one would expect the
number of purchased land to be much lower.

90
Table 24: Land Ownership and Rights Mode Number of Farmers Inheritance 14 Communal/Family Land 3 Purchased 10 Leased or Rented 1 Source: Field Study October-December 2010
5.7.3 Coordination
Access to credit was described by all 81 interviewees as the biggest hindrance to
agricultural development in the region. When asked if it was easy to obtain funds, the answer
was a resounding no. Fishermen and livestock keepers contended that credit was not
available to them. Individuals who managed to get loans faced interest rates between 25 and
50% with no grace periods. Credit to agriculture from the banking sector is very limited. For
example in 2002, it was estimated that 2% of all loans made by commercial banks went to
agriculture related activities. Evidence from field work suggested that that trend continues.
High rates of lending to the agricultural sector inhibit progress (FAO 2004, Essegbey 2009
and Field Visits 2009). Farmer’s schemes that include finance are extremely limited and
many government support programs for the agriculture have been scrapped in the era of
market liberalization. Essegbey (2009), noted;
With laissez-faire market ideas prevailing in Ghana, government economic policies have generally been liberal. While such policies enhance competition and stimulate innovation, they sometimes inhibit innovation (p. 84).
The use of farm inputs such as fertilizer and modern farm machinery is limited.
District offices rent out limited equipment at steep prices and the average farmers’ tool set is
limited to simple tools like the cutlass (machete). Agricultural requisites like day-old chicks
for poultry farmers are difficult to come by. Farmers have to travel to Accra or Kumasi to

91
acquire such inputs16. Quality feed for poultry is also difficult to come by. Many farmers
preferred to produce their own feed using local materials which may not offer the best
nutrition for animals. In aquaculture, the availability of fingerlings and quality fish feed was
sharply criticized at a fish farmers workshop held in the Twifo-Hemang Lower Denkyira
district (Field Study, November 2009). In addition to poor coordination of inputs and other
agricultural requisites, the effectiveness of extension services can be greatly improved. Crop
farmers and livestock keepers had the highest satisfaction rates for the extension services
they had received. Marine fishermen were highly dissatisfied. Table 25 shows the ratings of
the effectiveness of extension officers. 49% (40/81) approved of extension services, 13%
(11/81) were neutral and 37% (30/81) were dissatisfied17
Table 25: Effectiveness of Agricultural Extension Officers
.
Crop Farming Satisfied 17
Neutral 8 Dissatisfied 3 Fisheries
Satisfied 4 Neutral 3 Dissatisfied 24 Livestock
Satisfied 19 Neutral 0 Dissatisfied 3 Source: Field Study October-December 2010
16 Accra is 88 miles from Cape Coast and Kumasi is 140 miles. From interior towns like Diaso in the Upper Denkyira district, Accra is over 190 miles most of which is on primitive roads that are impassable with heavy rainfall. 17 Before field work I anticipated that extension services would be one of the most important factors explaining agricultural stagnation in the Central Region. I expected dissatisfaction to be very high, however, field work revealed otherwise. Improvements can be made to extension services by properly equipping officers and monitoring their performance. One disgruntled cocoa farmer intimated that their farm was often not sprayed with the necessary chemicals needed to protect the crop because of officers’ failure to appear at the farm. The sale of pesticides etc is highly regulated mostly because of fear of these chemicals being indiscriminately used. Workshops by extension services could help alleviate such issues and increase farmers’ access to these inputs.

92
Access to domestic and international markets is poor and outgrowing opportunities
are limited to industrial tree crops particularly oil palm. Cooperatives and contractual
agreements between commercial and smallholder farmers could guarantee markets for
smallholder output and increase production and processing capabilities. Poor access to
markets put smallholder farmers at the mercy of middlemen from urban centers. Further, the
desire to produce beyond subsistence levels is hampered since farmers often end up selling
excess produce at extremely low prices because failure to do so means watching most of their
yields rot. As one farmer noted;
Last year [referring to 2008], a lot of my plantain and cassava had to be sold very cheap in the local market just to get rid of them. If I had waited another week to send them to Cape Coast, they would have all gone bad (Field Study 2009, Interview conducted, 10/30/2009).
Poultry farmers and other livestock keepers also struggle to sell their output. This is
particularly disturbing because the number of outlets that could use the products of these
farmers is immense. Many hotels, resorts and recreational sites are located in the region
because of its unique abundance of historical and tourist sites but the influx of foreign animal
products has disrupted the market for local farmers18
. Table 26, summarizes the facilitators
and inhibitors of agricultural transformation observed during field visits.
18 Many poultry farmers argued strongly against the overwhelming influx of foreign frozen chicken, eggs and other animal products into restaurants and hotels within the region. They accepted that they do not possess the capacity to meet the demand of these establishments but struggled to understand why many of them could not even sell their output to local firms. Many relied on demand from establishments outside the region particularly Accra. Owners of piggeries had their largest demand from firms in Accra (Field Study 2009).

93
Table 26: Facilitators and Inhibitors of Agricultural Transformation in the Central Region, Ghana Facilitators Inhibitors
• Public policy (especially Ministry of Food and Agriculture, Central Region Development Commission)
• Extension Services • Donor initiatives
• Poor and very limited access to credit
• Poor infrastructure • Poor market demand • Poor technology and
transmission of agricultural knowledge and processes
• Limited inter-sector linkages • Excessive influx of foreign
agricultural products • Public policy19
5.8 Factors behind Agricultural Transformation in Sarawak, Malaysia When Sarawak joined Malaysia in 1963, it was well renowned for its agriculture. An
estimated 81.6% of its labor force was employed in agriculture and the sector contributed
about 40% to the state’s GDP. Agricultural and structural transformation has brought
agriculture to less than a third of Sarawak’s labor force while contributing less than 10% to
its GDP. Highly diversified subsistence production has given way to specialized commercial
plantation style cultivation of major industrial crops (most importantly, oil palm). The
population dynamics of the state has also changed as previously needed rural agricultural
labor have moved to prosperous cities like Kuching, Sibu, Miri, Bintulu and others.
While agricultural transformation can be explained by the purposeful action of
entrepreneurs across the state, credit must be given to the tactful albeit often controversial
government action and policies at the federal and state levels. These policies have influenced
Sarawak’s agriculture since it became a part of Malaysia (Jomo KS 2001, Schatz 2007,
Morrison et al. 2006 and McCarthy et al. 2009).
19 Public policy is a significant inhibitor because of the lack of an actionable agricultural policy.

94
5.8.1 Technology
Timmer (1997) argued that in the process of agricultural transformation, farm level
diversification decreases, commercialization increases and so does international trade in
agricultural products and food consumption. His discussion fits Sarawak well. The way of
doing things in Sarawak’s agriculture has changed drastically. Highly diversified smallholder
agriculture has declined and specialized commercial production has increased with the use of
heavy equipment, fertilizer and other modern agricultural inputs. Most farms observed were
commercial in nature and were in the 1,000 plus hectare range. Smallholder farms typically
cultivated crops like peppers on hillsides. Livestock and fisheries production is also on a
commercial basis20
Processing capacity has increased as oil palm mills are strategically located
throughout the state. For example Tradewinds Plantation Berhad Group owns four mills in
Kuching, Mukah, Miri and Limbang divisions. These mills are furnished with fresh fruit
bunches from about twenty-five plantations that cultivate nearly 50,000 hectares of oil palm.
Sarawak Plantation Berhad operates two mills in the Mukah and Miri divisions and currently
controls an estimated 52,071 hectares of oil palm.
.
Storage capacity and research and development by federal and state governments, and
private entities are at a very high level. For example about 13% of Sarawak’s soils are peat
soils (a type of histosol) largely considered as marginal to unsuitable. Research and
20 Field visits to fishing towns in the Kuching and Limbang divisions yielded no significant results. I expected to observe many small scale fisheries activities however to my surprise many fishermen were operating fish ponds and other fish culture. Marine landings showed little activity although some commercial type fishing vessels were observed in the Kuching division. Discussions with residents from Bintulu and other coastal areas reaffirmed the fact that traditional marine fishing the type of which was observed in Ghana was on the decline. Field visits to the Kuching, Samarahan and Sri Aman divisions showed that livestock facilities often operated their own feed mills and were clearly commercial with respect to the livestock populations. Smallholder livestock facilities were observed near the Indonesian border in the town of Tebudu and surrounding areas (Field Visits 2010).

95
development by the state government through the Tropical Peat Laboratory in Kuching is
geared towards identifying ways to improve the cultivation of sago in these soils21
5.8.2 Institutional Capacity
.
Support for agriculture in Sarawak has been provided for by the actions of the federal
and state governments’. Five year development plans involving the marriage of the state
(local and federal) and private actors since independence has been instrumental in
agricultural development. State policies have provided generous opportunities and incentives
for the private sector to lead the development process (Morrison 1997).
At the federal level, 3 National Agricultural Policies (NAP) were introduced in 1984,
1992 and 1998 respectively. The first NAP was concerned with increasing the planted area of
export crops such as oil palm and cocoa. Increasing yields through modernization and
infrastructure development were also important hallmarks of this initial policy.
The second NAP was similar to the first because of its desire to increase cropped area
and yields. This policy focused on identifying, deepening and maximizing the benefits from
inter-sector linkages. Agro-industry was aggressively pursued to add value to crude products.
Finance and various credit instruments to engender private sector interest were introduced
and international policy was geared towards protecting Malaysian output within the bounds
of international law.
The third NAP was similar to its predecessors and was introduced after the Asian
Financial Crisis of 1997. The goal was to bring agricultural policy in line with new
developments in the Malaysian economy. New strategic approaches and policy thrust to
21 Sago is a starch extracted from the sago palm which grows on Sarawak’s coastline. In “Government will continue peat soil research”, Sarawak Tribune, October 12, 2010, the state government reaffirmed its commitment towards better understanding the dynamics of the soil and how best to use it to the advantage of the state. See Sulaiman et al. 2005 for more details on peat soil research in Sarawak.
96
enhance the economic contribution and growth of the sector were highlighted. Enhancing
food security, creating new sources of growth within the sector and further deepening of
inter-sector linkages were key features of this policy (Kajisa et al. 1997, Harron et al. 2001
and Ismail 2007).
Sarawak Land Development Board (SLDB), established in 1972, and the Sarawak
Land Consolidation and Rehabilitation Authority (SALCRA), established in 1976 have been
influential in the process of agricultural transformation in Negeri Sarawak (State of
Sarawak). The actions of SLDB and SALCRA have contributed to the rapid expansion of oil
palm in Sarawak. These institutions are deeply entwined with the very fragile issue of land
tenure in Sarawak22
Unlike SLDB, SALCRA had no ambitions of achieving racial harmony. SALCRA’s
main objective is developing native customary land for the benefit of the owners who have
native customary rights to the land. These owners upon successful repayment of development
costs would be granted legal title to the land. It is important to note that in West Malaysia,
. SLDB sought to achieve improved multi-racial relations (between the
main ethnic groups: Ibans, Malays and Chinese) through land development schemes that
would grant titles to participant citizens once development costs were recouped. The
institution failed as a freeze on title issuance was put in place and Chinese and Malay
communities targeted for participation declined (Awang, Z 1986 and McCarthy et al. 2009).
22 Before field visits in Sarawak, I did not anticipate land tenure issues to be as critical and fragile as they turned out to be. Several individuals that discussed land issues spoke of it with so much passion especially those with rural roots and ties to native communities across the state. McCarthy et al. 2009, “Oil Palm Expansion on the Malaysian and Indonesian Frontiers”, Geographical Journal, 175 (2):112-123 offers an excellent and succinct description of the situation in their description of the history and evolution of the Land Code of 1958 and more importantly how the provisions under that policy are been tested under the neoliberal era where the push for land for oil palm cultivation has been simply mind-blowing. The Land Code is discriminatory as Chinese Sarawakians many generations removed from mainland China can still not acquire certain lands. Native customary rights to land are the most contentious of all forms of tenure because they are based on the shifting cultivation and community based definitions of use rights etc. As many scholars of Sarawak land issues have shown, in practice native lands have been viewed as an encumbrance on state land and therefore have been exploited without much consideration for native culture and rights.

97
the Federal Land Development Authority (FELDA) served a similar function as SALCRA.
Government schemes in Sarawak have contributed to a focused direction in agriculture. In
addition to SLDB and SALCRA, the Sarawak Land Custody and Development Authority
(SLCDA) have worked as a matchmaker for land-based initiatives by the private sector
(Morrison et al. 2006). The dominance of private interests in Sarawak’s commercial
agriculture has been facilitated at various stages by federal and/or state policies. For example
the growth of oil palm processing in Malaysia was greatly influenced by the governments’
imposition of higher duties on the export of crude palm oil in the mid 1970s (Goppal 1999,
Jomo KS et al. 1999).
5.8.3 Coordination Access to credit in Sarawak is relatively easy when compared to Ghana’s Central
Region. Various government run schemes help guarantee finance to many farmers. Demand
for farm output is often guaranteed through public and private schemes governed by legally
enforceable contracts. For example the Sarawak Economic Development Corporation
(SEDC) and its agencies established a poultry farmer’s scheme that combines stable market
demand with hands-on experience and the necessary credit and subsidies needed for the
scheme to be successful (Morrison et al. 1997, p. 195).
Small-scale contract farming in Sarawak’s poultry sector provides an excellent
example of the coordination activities that have contributed to agricultural transformation in
the state. Figures 27 shows Sarawak’s poultry complex. The big six firms are all based in
Kuching. Poultry production in the state has grown as a result of government supported
private sector activities and active government action through import controls on day-old
chicks (Ching 1999).

98
Typical contracts in the private and public sectors involve the supply of day-old
chicks and the purchase of full grown birds from scheme participants 45-58 days. Bird s are
processed and used in public services such as schools, hospitals and the police service.
Private sector schemes provide the final product to supermarkets. A major difference
between the public and private sector schemes is that the public scheme is directed at
bringing the rural poor typically bumiputeras out of poverty. Affirmative action like the
poultry scheme is available in fisheries and crop farming as well. In spite of the critique
against such programs, they have generally succeeded in increasing productivity and have
been an instrument for addressing the uneven opportunities that rural Sarawakians face
(Morrison et al. 2006, p. 203).
Figure 27: The Sarawak Poultry Complex. Source: Morrison et al. 2006, p. 197 Coordination of productive capacities in Sarawak’s agriculture is very high as
agricultural requisites necessary for boosting production are readily available for use by
farmers either through local production or imports. As an example, over the period 1999-
2008, the state imported an estimated 595,045 metric tons of manufactured fertilizers and
Subsidized factors of production for SEDC
Guaranteed price for SEDC growers
Quality control and import regulation
Maximum price control
Day-old chicks breeding
Feed
Veterinary services
Finance
Medicine Farm construction materials (including tools and equipment)
Schools, police, army and hospitals
Free market (supermarkets, restaurants, hotels, wholesalers)
Siak Liang
“Big 6”: Ayam Makota Central Cold Storage Gulf Pacific K&L Farming Siak Liang Sea Horse
Poultry farmers
Under public contract (10%)
Under private contract (85%)
Free market production (5%)
Inputs Production Processing Retail
Imports
99
604,026 metric tons of crude fertilizers. Total imports had an estimated value of 2.2 billion
ringgit ($600 million). The state also exported an estimated 610,546 metric tons of
manufactured and crude fertilizers with an estimated value of nearly 1 billion ringgit ($303
million). Potassium based fertilizers are the most common because of their use on oil palm
plantations. Land preparation, harvesting and other agricultural machinery are regularly
imported into Sarawak to support the sectors’ development (Department of Agriculture
Sarawak, 2008).
Table 27 summarizes the facilitators and inhibitors of agricultural transformation
observed during field work. Facilitators have had a strong impact on Sarawak’s agriculture
but issues of land tenure pose a great threat to Sarawak especially with the expansion of oil
palm and logging activities. Land conflicts between private developers (often with
government backing) and Dayaks (native rural communities) over what constitutes native
customary land have being a source of controversy in the post-independence Sarawak. These
conflicts and the drive towards monoculture in oil palm pose different sets of challenges for
Sarawak’s agriculture. The intersection of the drive towards monoculture and the political
economy of land tenure need further analysis (Jomo KS et al. 2004, Ngidang 1997 and 2005,
Schatz 2007, McCarthy et al. 2009).
Table 27: Facilitators and Inhibitors of Agricultural Transformation in Sarawak Facilitators Inhibitors
• Federal and state governments o Infrastructure o Agricultural and land schemes
like poultry farmers and fishpond schemes, SALCRA etc
• Research and development
• Land tenure (conflation of government, private and native customary lands)

100
5.9 Lessons from Comparative Analysis and Fieldwork Agricultural transformation and rural development requires purposeful government
action that creates the necessary environment for successful private engagement in the sector.
In Malaysia, the developmental state has been able to achieve such transformation by
executing its custodial, demiurge, midwife and husbandry roles. Embedded autonomy has
allowed for policy initiatives to be carried out effectively. Field research revealed that
government policy allows for the ease of private sector involvement in agriculture.
An actionable national development policy must be established prior to any sector
policies in Ghana’s Central Region. A continuous drive towards the achievement of
embedded autonomy is essential for agricultural transformation. Table 28 summarizes the
characteristics of Sarawak’s agricultural transformation and lays out a desired future path for
the agricultural transformation of Ghana’s Central Region. Lessons identified and all
assertions made in Table 28 are based on field visits.

101
Table 28: Lessons from Sarawak, Malaysia and the Desired Future Path for the Central Region of Ghana EXPERIENCE OF SARAWAK DESIRED PATH FOR
CENTRAL REGION, GHANA TECHNOLOGY Farm-Level Processing Management Structure
Highly mechanized cultivation of high yield varieties. Monoculture of oil palm. Modern fish landings and advanced aquaculture. Advanced poultry farming. Capital intensive. Highly mechanized especially for industrial crops like oil palm. Private companies and government controlled estates under schemes like SALCRA.
Highly mechanized cultivation of high yield varieties. Polyculture (region wide) in oil palm, cassava, cocoa and fruit crops. Modernized fisheries and livestock sub-sectors. Capital intensive. Out-grower supply of agro-industries. Cooperatives and private companies. Government support via the President’s Special Initiative.
INSTITUTIONAL CAPACITY Research Institutions Supporting Infrastructure
Public research with spillovers from private sector. Consistent development and agricultural planning. Land tenure very cumbersome. Accessible road networks. High quality nurseries. Excellent storage facilities.
Public research. Support for private research. Actionable development plans and commitment to agriculture. Land reform and increased partnership between chieftains, government and private sector. Accessible road networks. Improved nurseries. Improved storage facilities.
COORDINATION Inputs Demand Conditions
High fertilizer use. Modernized livestock and fisheries. Contract farming. Stable incomes.
Increased fertilizer use. Improved irrigation in coastal plains. Use of modern inputs in livestock and fisheries. Increased contract farming. Increased out-grower opportunities that guarantee stable prices. Public demand for certain output
PERFORMANCE Productivity Environmental Impacts Extension Services
Moderate to High. Very high as the drive towards monoculture in oil palm has led to increased deforestation. Moderate to high.
Increasing until high. Sustainable environmental practices that include the use of organic fertilizers and the preservation of national forests. Improved extension services.
102
The drive towards monoculture in Sarawak is strongly discouraged for Ghana’s
Central Region. Polyculture at the regional level is desired given the varied agricultural
capabilities of the region. The region can improve its cultivation of oil palm, cocoa,
pineapples, oranges, farmed fish and animal products by drawing on the experience of
Sarawak, however it is encouraged that it strives to achieve some parity in its agricultural
land use. For example oil palm cultivation could be improved and centered in the Upper and
Lower Denkyira districts. Cassava production could be improved and centered in the Agona
and Awutu-Effutu-Senya districts and pineapples and citrus cultivation could be centered in
other parts of the region and so on.
Achieving the desired path for Ghana’s Central Region will require public research
for increased productivity, public initiatives for market creation and improvement and public
commitment towards the enhancement of smallholder livelihoods. The need for public
involvement is a not a call for dirigisme but rather for the developmental state. Public
initiatives should have mechanisms that allow for the role of the state to change as
agricultural transformation progresses (Kajisa et al. 1997, p.16).
In addition to the experience of Sarawak, scholars of Southeast and East Asian
agriculture have shown that public initiatives that combined the roles of the developmental
state played an instrumental role in the agricultural transformation of many countries in the
region.
Government initiatives to build public institutions and infrastructure were particularly important. The establishment of strong agricultural research, extension, and other support institutions, along with a steady commitment to strengthening the rural infrastructure, provided the essential foundation for the productivity growth in agriculture and the commercialization of the rural economy [in Taiwan] (Gabre-Madhin and Johnston. 2002, p. 60)
103
Private sector involvement is crucial to agricultural transformation however the guiding and
creating hand of government is an important condition that must be present for continued
progress. Public action engenders the necessary private participation needed for
transformation, stability and progress in agriculture. Sarawak, Malaysia and East Asia in
general present excellent examples of desirable government action in agriculture.
Chapter 6 concludes this dissertation by discussing three important issues; first, is
with regards to whether the developmental state is replicable; second, considers whether we
can we build a Ghanaian developmental state and what challenges face such a notion and
third, considers the characteristics of a developmental state that has as its theoretical basis the
modern money approach.

104
CHAPTER 6
CONCLUSIONS AND DIRECTIONS FOR FUTURE RESEARCH
“Economic development is a structural process[…]markets are a major locus of this process, but the state has a strategic role in providing the appropriate institutional framework to support this structural process[…]in the context of globalization, economic development requires a national development strategy which seizes global opportunities[…]economic development should be financed essentially with domestic savings[…]although the Schumpeterian side of the development process and strategic industrial policy are relevant, the demand side is where the major bottlenecks unfold[…] to achieve long term development economic policies should pursue full employment as its primary goal, while assuring price and financial stability”-(Ten Theses on New Developmentalism, 2010)
6.1 Introduction
The ability of the developmental state to promote agricultural transformation and
economic development has been discussed in chapters 4 and 5. It has been shown that
competent bureaucracies and strong state-society relationships allow for the necessary
embedded autonomy needed to execute the developmental roles of the state. Building the
developmental state requires a social engineering process based on a shared commitment
from the government, private sector and all other agents in the economic system.
Governments must establish credibility if the private sector is to believe that their actions will
be developmental and beneficial to them. Actions needed to establish such credibility go
beyond the governments’ role of custodian advocated by mainstream economists. Huff,
Dewit and Oughton (2001) illustrated using a game-theoretic approach that cooperation
between private actors and the state does not occur until state credibility towards
developmental objectives have been established.
If entrepreneurs and the private sector need such assurances of credibility, then it
follows that other agents (for example workers) need such credibility in order for them to

105
fully engage in developmental activities within the country. In East Asia, credibility allowed
states to promote and execute successive national development plans with the general
backing of the majority of public. Given the historical record of East Asia since the early
1960s the concept of the developmental state must become an important analytical tool
through which economists and policymakers interested in issues of development in SSA
conduct their own research and formulate policy prescriptions (Fritz and Menocal 2007).
Developmental state theory has faced a multitude of critiques since its inception in
the early 1980s. Critiques leveled against it have ranged from the inadequacy of supporting
data to its historical specificity to East Asia. This concluding chapter addresses some of these
critiques and outlines directions for future research. The remainder of the chapter is
organized as follows. The next section addresses the issue of replicability of East Asian
development strategies. This is followed by a discussion on the promises and challenges to
building a Ghanaian developmental state. Financing the developmental state is discussed by
critiquing some of the tenets of the Washington Consensus and the orthodox view of
economics and money. Heterodox perspectives such as the modern money approach are
discussed and summarizing remarks and directions for future research are highlighted.
6.2 Replicability and Institutional Adjustment: Insights from Ha-Joon Chang and John Fagg Foster
Chang (2003 and 2006) noted that the replicability of East Asian development
success has been a controversial issue in the debate over the economic transformation of that
region. In the neoclassical framework where free trade and free markets dominate, adopting
policies wholesale and implementing them elsewhere faces little theoretical challenges since
‘getting prices right’ et cetera will undoubtedly lead to economic growth and development.
Experiences with structural adjustment and the contributions of non-mainstream economists

106
(like Alice Amsden, etc.) have shown that the neoclassical policy prescriptions cannot yield
sustained economic growth and development. Scholars in the heterodox tradition have also
shown that ‘getting prices wrong’ (Amsden 1989 and 2001), ‘governing the market’ (Wade
1990) and ‘embedded autonomy’ (Evans 1995) are the best descriptors of East Asian
development.
If getting prices wrong, governing the market and embedded autonomy best explain
development success in modern history, can these tenets be replicated in SSA and in
particular in Ghana? On the surface, replication may appear intractable, however, a careful
redefinition of what replication means coupled with a flexible theory that allows for the
integration of replicable themes make the replication of East Asia’s development strategies a
possibility in Ghana and elsewhere in SSA.
6.2.1 Arguments against the Replicability of the East Asian Model Arguments against the replicability of the East Asian model have centered around
three main issues. First, is that most developing countries around the world do not have the
requisite bureaucracies needed to achieve developmental state status; second, is that current
global conditions are so entrenched in free trade policies that they do not permit developing
countries to employ strategies used by now industrialized and late industrializing countries;
third, is the perspective that the Confucian work ethic is so deeply woven into the history of
East Asia and this simply cannot be replicated elsewhere (Chang 2003, p.119-120, 2006, p.
47-52: Chang and Grabel 2004, p. 66-70).
6.2.2 Replication: A Redefinition Arguments by critics of replicability are unconvincing when matched against the
historical record. Ha-Joon Chang and many others have shown that competent bureaucracies

107
are socially engineered through tireless commitment and government investment in education
and training of civil servants to increase their capacities to properly execute developmental
goals1
Replication means to copy and reproduce. In the context of SSA (Ghana) and East
Asia (Malaysia), copying and reproduction must recognize the uniqueness in geopolitics,
culture, history and current as well as anticipated future conditions. “In fact, if there is one
lesson to be drawn from the East Asian economies that is transferrable everywhere, it is that
the growth of a late-developing country depends critically on how successfully it can engage
in the importation, adaptation, assimilation and innovation of institutions, not just
technologies” (Chang 2003, p.120).
. Further, while current conditions may be restrictive to developing nations, loopholes
exist and countries like Mauritius and Botswana have used them over the years.
Confucianism which is credited for economic development in the region was once criticized
“for holding East Asia back” (Chang 2003, p. 119). Prior to 1950, several aspects of
Confucianism impeded growth but after that period certain aspects of it have been re-
channeled to enhance growth and development.
6.2.3 Implementing Replicable Policies and Lessons The ability to effectively engage in the importation, adaptation and assimilation of
institutions depends on the success of institutional adjustment. In his discussion of land use
planning, Foster (1981) put forth a theory of institutional adjustment that holds great promise
for the replication of East Asian development strategies. His theory is made up of the
principles of technological determinism or instrumental primacy, recognized interdependence
and minimal dislocation. All principles must be taken as a whole when institutional 1 Chang 2006 argued that competent bureaucracies were not part and parcel of the initial conditions of East Asia. He further argued that Korea sent its bureaucrats to the Philippines and Pakistan for training until the late 1960s (Mkandawire 2001, Chang 2003 & 2006, and Chang & Grabel 2004)

108
adjustment is being considered since all principles must be at work for effective adjustment
to occur.
The principle of technological determinism is concerned with the question of whether
the proposed action will yield the greatest summation of economic values. It is also
concerned with the technical aspects of effecting that change and asserts that members of
society must have some basic capability of effecting that change. In other words the capacity
to effect change must be present. Instrumental primacy asserts that social problems can be
resolved only by adjusting the institutional structures in such a way as to minimize the
negative obstructions posed to the adjustment by past binding actions deeply rooted in
history and culture.
Recognized interdependence in Foster’s theory refers to the fact that social problems
affect everyone and so does the solution to these problems thus an adjustment to an
institution may have far reaching consequences beyond the scope of that institution alone.
Foster noted further that this principle implies that the immediate pattern of any institutional
adjustment must be specified by the pattern of interdependencies recognized by members of
the institution. Effective institutional adjustment will be achieved if the recognition of
interdependencies is high. Cooperation between all members of the institution being adjusted
and members of other institutions will be highest if there is proper recognition of inter-
institution linkages.
Foster’s principle of minimal dislocation argues that members of society will be
affected in different ways by institutional adjustment. More importantly, people benefitting
from the status quo will be averse to change and those suffering from it will be in favor of it.
Recognizing the differing impacts of the change and working towards minimizing its

109
negative effects is the underlining message of this principle. He adds that “this principle does
not require an absence of dislocation, but rather a minimum” (p. 1002). Foster added that
informing society of why adjustment is necessary is crucial to minimizing the dislocation that
is bound to occur.
In sum, Foster’s theory of institutional adjustment stresses three important facts. First,
societies effecting change must have the potential or capability to effect that change; second,
they must recognize that there are important inter-institutional and sector interdependencies
that may influence the implementation as well as the impact of the change; and third,
implementing a change will affect different members of society in different ways, thus care
must be taken to minimize the dislocation.
In the context of this dissertation, replicating East Asian development strategy in
Ghana is possible if it is informed by Foster’s insights. Technological determinism in Ghana
will imply that commitment from all agents in the economy must be of the highest level if the
greatest economic values can be achieved. Can Ghana actually replicate Malaysia’s
development success? Does the nation have the capabilities to effect such a change?
Historical evidence and the promise of the future will suggest an affirmative answer to these
questions.
Ghana has shown characteristics of developmentalism in its history and during
periods of adherence to development plans, economic progress occurred. Since
independence, 10 national development plans (on paper at least) have spanned 52 years of
which only 30 years have been implemented at the lowest level. In the years soon after
independence when development plans were implemented to the letter, the nation boasted of

110
rapid economic growth and development2
Future oil revenues and the proper management thereof coupled with continued
political stability in a continent marred with political disarray makes Ghana’s capacity to
actually effect change very promising. The Malaysian and East Asian experience shows that
development planning and a committed adherence to such plans is an important part of the
development process. This is an important lesson that should and can be replicated in
Ghana
. Agencies like the National Development Planning
Commission, Ministry of Food and Agriculture and the Central Region Development
Commission must be given the necessary institutional support to allow for the execution of
their duties. Building and/or fully utilizing the capacity that exists within these institutions
will allow Ghana to satisfy the requirements of Foster’s principle of instrumental primacy.
3
Recognizing interdependencies will include the identification of backward and
forward linkages between the agriculture, industrial and service sectors. Recognizing that
changes made to anyone one of these sectors will affect all other sectors is important.
Agricultural development has been shown to be crucial to poverty reduction and economic
development and methods of achieving it in Sarawak, Malaysia provide important lessons
that must be learned (see Chapter 5 for more details). Decision making that solicits input
from all sectors is necessary. The success of any adopted sector specific policies will depend
on how much recognized interdependencies were acknowledged. Malaysia has been
successful in linking agriculture with industry through various agro-industry initiatives,
.
2 Data in chapter 3 show that in the first decade after independence, development indicators for Ghana and Malaysia were on par and in certain instances, better in Ghana. 3 Since 1992, multi-party elections have been held and opposition parties have taken turns to govern. The next step will be to ensure that developmental goals are not shattered every time there is a change in government. These goals will only be achieved if the relationship between the state and important elites leads to developmental outcomes. “A democracy that heavily invests in the improvement of people’s health, education, and capacity so that they can participate effectively” regardless of what government is in power is absolutely necessary (Ake 1996, p. 132).

111
provision of finance for private entrepreneurs and the availability of a public option.
Examples of such linkages were discussed in chapter 5 when the Sarawak poultry complex
and the activities of SALCRA in oil palm were mentioned.
Minimizing the dislocation that will occur with the adoption of any strategies requires
broad national level knowledge about the country’s development agenda and why that
agenda is necessary. At the sector level, communication about sector plans is crucial. Simply
put Ghanaians must have a general knowledge of the direction the country is heading if
replication efforts are to succeed. Individuals in power positions such as chiefs must be
educated on the benefits of change.
Replication and institutional adjustment as defined by Ha-Joon Chang and John Fagg
Foster respectively make East Asian style developmental states a possibility in places like
Ghana. Adapting strategies to fit specific needs and integrating those strategies with Foster’s
principles in mind will yield favorable results towards development since they factor into
development planning, implementation and evaluation the social aspects of policy change.
6.3 Building the Ghanaian Developmental State: Promises and Challenges As discussed in other chapters, building the developmental state requires commitment
from everyone in the various sectors of the economy but more importantly from those in state
institutions. The state must carry out what it advertises if the goodwill necessary for
development is to be established. In East Asia, once the government said it was going to do
something, it did it (Huff, Dewit and Oughton 2001). In Ghana and other nations in the
developing world, building the developmental state will require the government doing what it
says plus the execution of various strategies to attract and retain high quality staff for public

112
service. Such strategies will help repair the negative image typically associated with the civil
service and increase their capacity to effect change4
Prospects for building a developmental state in Ghana are bright but several
challenges exist. Factors favoring developmental state creation include a stable culture of
democracy and peaceful political transitions, future income stream through oil revenues,
relatively good system of education in comparison to other nations in SSA and relatively low
international indebtedness especially since the completion of the Heavily Indebted Poor
Countries initiative. Challenges include an inept public service which has bred a culture of
mediocrity, regional instabilities and past-binding customs that hinder progress.
(Kauyza 2008).
There are no specific guidelines for the creation of developmental states however
certain key features must be pursued with various strategies. Competent bureaucracies can be
achieved through the recruitment of a highly skilled and professional staff. Recruiting and
retention will be possible only if wages and perks in the public sector are higher than or
comparable to the private sector. At the sector level, progress can be achieved through
public-private initiatives that reward entrepreneurship while ensuring that risk taking is in
line with general developmental goals. This can be achieved through the midwifery and
husbandry roles of the state. The case of Korea, Taiwan, Malaysia and elsewhere are
excellent examples.
The President’s Special Initiative started under the John Agyekum Kuffour
presidency was a step in the right direction and similar projects must be enacted with the
4 The image of the public service in Ghana and many other SSA countries is very negative. The public service is associated with low wages, corruption, nepotism and poor job security. In the period 1986-1990, an estimated 41,000 civil service jobs were lost largely due to structural adjustment policies. Reductions in personnel size were not accompanied by pay reform, thus remaining staff were not properly incentivized to carry out additional functions. Building the developmental state will require substantial efforts in transforming the image of these institutions (Kauzya 2008).

113
necessary oversight and commitment to ensure their success. All in all building the
developmental state in Ghana will require recognition of the fact that ‘the state will be as
developmental as the people that serve within its institutions’ (Kauzya 2008, p. 18).
6.4 Financing the Developmental State One of the most recent debates on developmental states has surrounded how they are
financed. Sindzingre (2007) correctly noted that the structure and organization of taxation are
crucial aspects of state formation. Tax policy delineates the relationship between a state and
its citizens. Tax policy helps define redistributive programs, the size and power of social
groups, and the basis of state action and legitimacy.
Deeply embedded in the understanding of how developmental states are financed is
an appreciation of the origins of money and the role of the government in the process of
taxation. If money is neutral in its effects and taxes represent a simple exercise to increase
funds for government expenditure, then development finance should be straightforward,
however, taxes represent complex social relationships whose roots can be traced to what
drives the existence of money in the modern capitalist economy. Orthodox and heterodox
views on the origins of money differ greatly and so are their conclusions on development
finance. Evidence from East Asian developmental states is consistent with the heterodox
view since broad and mass tax collection was forgone in favor of targeted taxation, the use of
subsidies and the collusion of government and private entities to raise developmental funds.
6.4.1 Origins of Money in Orthodox Economics In orthodox economics, modern fiat money emerges from the evolution of barter
because of the double coincidence of wants which create high transactions costs. Fiat money
is the natural progression from barter because it reduces these transactions costs and allows
114
for the seamless operation of the market system through which all of society’s problems are
efficiently resolved. The market system is deemed impartial and unprejudiced in its
allocation of scarce resources. Money is neutral and the more complex capitalist economies
become, the more abstract and intangible money becomes. Money is asocial; it is not
historically contingent and does not represent a deeper social contract between the state and
society. Simply put, money does not matter. What matters is the exchange that it facilitates
(Wray 1998 and 2010).
Given the neutral role of money, the most important responsibility of Central Banks is
to control the money supply through various means including altering of required reserve
ratios and printing money. Money supply is exogenously determined and agents in the
economic system like banks respond to actions of the Central Bank by making loans
available and vice versa. The neutrality of money is absolute especially when agents are
informed of upcoming actions of the Central Bank. In other words money is neutral in the
short and long run and changes occur to the economic system only when the Central Bank
reneges on what it said it will do.
Inflation is simply a monetary phenomena and controlling it involves the control of
the money supply. Drawing on the quantity theory of money, monetarists argued that if real
GDP at its natural rate and the velocity of money are stable (constant), then the only variable
that can influence the general rise in the price level is the exogenous increase in the money
supply. If inflation is targeted and targets are well communicated to agents in the economy,
then for the most part, inflation can be kept under wraps.
Such views on money as discussed are deeply embedded in the ten reforming
guidelines of the Washington Consensus (see Appendix C). Orthodox views of money,

115
international trade and the supremacy of free markets were the building blocks of this
consensus. As a hard complier to the policy prescriptions of the Washington Consensus,
Ghana reformed its taxation, liberalized its markets, deregulated its economy and removed
many subsidies. Building a tax reform to increase the tax base informed the introduction of
the Value Added Tax (VAT) in Ghana and elsewhere (Brautigam, Fjelstad and Moore 2008).
In spite of their adoption in many parts of the developing world, “the evidence of the
past 15 years has demonstrated that attempting to implement the 10 reforms of the
Washington Consensus has ultimately proven to be a disaster for developing nations”
(SAPRIN, 2004, Davidson 2004, p. 207). The orthodox view drawing on the insights of
monetarists and orthodox development economists can be summarized as follows:
1. Money emerges out of barter to reduce transactions costs.
2. Money supply is exogenous and inflation is always and everywhere a monetary
phenomenon.
3. No historically contingent relationship between taxes and money. Taxes are asocial.
4. Free markets and free trade hold the key to economic growth and development.
6.4.2 Origins of Money in Heterodox Economics In heterodox economics, the origin of money is situated in the historical and socially
contingent relationships between states and societies. Money’s role in the economy is much
more sophisticated. Money is much more than a facilitator of exchange and a reducer of
transactions costs. Money is what makes the world go round. Money is associated with the
nation-state (e.g. the Ghanaian Cedi, Malaysian Ringgit and US Dollar) and is intimately

116
related to the history of the people. Many heterodox scholars have rejected outright the
orthodox description of the origins and role of money in the economic system5
“The heterodox alternative locates money’s origin in credit and debt relations, with
the money account emphasized as the numeraire in which liabilities are measured” (Wray
2010, p. 40-41). Taxes drive money in the sense that authorities (the state, Kingdom etc) levy
obligations and declare that which they will accept to satisfy those obligations. In order for
citizens to satisfy these obligations, they must accomplish tasks that will place them in a
situation that allows for the accumulation of that which is necessary for the payment of debts.
At the individual level, debt obligations between private parties are satisfied through various
forms of money however, the ultimate form of money that has the final authority is that of
the state (Bell 2001). In colonial SSA, poll and hut taxes were an important way in which the
colonial state was entwined with the process of accumulation as well as with the society over
which it exerted its authority (Forstater 2005).
.
Money in heterodoxy is thus a creature of the state (Lerner, 1947). It is not a
spontaneous ‘thing’ that emerges to allow peoples’ lives to be easy. It is the single most
important entity in the capitalist economy. It is not neutral and this non-neutrality is central to
the capitalist accumulation process and thus to the process of growth and development.
Unlike orthodoxy, inflation in the economic system arises because of factors more complex
than the simple increasing of the money supply by the exogenous Central Bank6
5 Innes (1913 & 1914), Knapp (1924), Lerner (1943 & 1947), Ingham (2000), Bell (2000 and 2001), and Wray (1998 & 2010) are a few examples of scholarly work dedicated to providing a better understanding of the origins and functions of money in the modern capitalist economy.
. First and
foremost, money supply is endogenous because Central Banks simple respond to individuals’
demands for money needed for the pursuance of their various economic activities.
6 Inflation may arise because of struggles between capital and labor. If labor is stronger (i.e. via unions etc, then wages may rise faster which will in turn increase costs for producers and ultimately for the price of their output.

117
The heterodox view of money leads to different conclusions about the role of money,
the state, and the political economy of taxation. It also presents a more realistic explanation
as to why tax reform under the Washington Consensus simply failed in the attempt to
increase overwhelmingly the tax base and tax revenues. The heterodox view of money asserts
that the state’s ability to tax is one of the foremost reasons for the existence of money.
Modern money has thus emerged from the evolution of state-society relationships of which
taxes are an integral part.
Brautigam, Fjeldstad and Moore (2008) presented various discussions on the role of
taxation in state-building. They showed at various instances that the efficacy of tax policies is
affected by state-society relationships especially between powerful interest groups and the
state. As an example, Joshi and Ayee (2008) in Brautigam et al. (2008) discussed
associational taxation in the context of the informal sector which represents significant
portions of the economies of many developing nations. Using examples from Ghana’s VAT
and the powerful role of the Ghana Private Road Transport Union (GPRTU), they showed
that political connections between the union and the political party in power eventually
allowed for the institution of VAT after its initial failure. Money matters and so does taxes.
The heterodox view drawing on insights from Post Keynesians particularly L. Randall Wray
and others can be summarized as follows:
1. Money emerges out of debt and credit relations.
2. Money is not neutral in any way. It is in fact the most important entity of the entire
capitalist economic system.
118
3. Taxes drive money and they represent important social relationships between the
authorities and everyone else. Taxes are social acts and for them to be important in
the development process they must be treated as such.
4. Money supply is endogenous. Central Banks simply respond to the needs of
individuals and entities in the economic system.
5. There is no such thing as free markets and free trade. Governed markets and unfair
trade are closer to reality.
6.5 Evidence from East Asian Developmental States Evidence from East Asian developmental states run counter to the orthodox view of
money and the Washington Consensus. East Asian developmental states have shown that
policy reforms result from “complex, lengthy and endogenous processes […] they have used
heterodox economic policies, for example state intervention in the economy and even
political rent-seeking, but these policies were tuned to growth and market sanctions, i.e.
export performance” (Sindzingre 2007, p. 616).
Gomez and Jomo KS (1999) made a strong argument for the incidence of patronage
in the Malaysian economy. While highlighting the biased nature of contracting, business
opportunities etc for the rising Malay bourgeoisie, they noted how significant Malaysia’s
New Economic Policy of 1971 had transformed the country’s economic system to one
characterized by political patronage. In spite of this patronage, a rising tide appears to have
lifted all boats in Malaysia. Many have realized their incomes rise over time and their
standards of living improve significantly.
Sindzingre (2007) makes several important observations about the nature of
development finance in East Asia. Her observations run counter to the Washington

119
Consensus prescriptions and reaffirm the theme in this dissertation that tactful government
intervention and policy initiatives are desperately needed and required for economic
transformation in SSA. Using the example of land reform in South Korea, she noted that East
Asian states reduced inequality using various sets of targeted policies and incentives7
In addition to Sindzingre’s observations, tariff policies in East Asia continue to be
consistent with policies advocated by mercantile, German and Italian economists as
discussed in chapter 4. Tariffs remain a judicious way of enhancing local industrial activity
as outlined in chapter 4. Simple mean tariffs
. For
example taxation was designed with delicate social issues in mind. She also stressed that
developmental states did not have large governments but rather focused their attention on the
provision of incentives to spur private sector initiatives. For example in 2004, subsidies
accounted for 31% of government expense in Malaysia and in 2007 it accounted for 58% of
government expense in South Korea (World Development Indicators 2009). These figures
run counter to the second principle of the Washington Consensus which stressed the removal
of subsidies.
8
in South Korea were estimated at 20.8% for
primary products (possibly needed for local industry). Tariffs were at 6.6% for manufactured
products that could be used to bolster local industry. Trade liberalization per Washington
Consensus would require these tariffs rates to be much closer to 0 in both directions for all
products, however nations that have successfully achieved higher growth rates and economic
development have failed to do so even as of the last decade.
7 Sindzingre also noted that the reduction of inequality allows for the developmental state to be legitimatized. Figure 6 on the distribution of income in chapter 2 thus shows the legitimization of Malaysia by way of their Gini Index. 8 These are un-weighted averages of effectively applied rates or most favored nation rates for all products subject to tariffs calculated for all traded goods (World Development Indicators 2009)

120
6.6 Implications for Financing the Developmental State As the East Asian development experience has and continues to show, heterodox
principles of economics and development best explain how countries in catch-up situations
can quickly transform their economies. The overwhelming evidence from their experience
shows that principles of sound finance should be replaced by alternatives that draw on
functional finance and modern money. Functional finance will allow sovereign nations with
sovereign currencies the flexibility to enact policies that fund development projects. By
adopting functional finance, government intervention will be judged solely on the basis of its
impact on greater society. In short, intervention will be judged based on its developmental
outcomes.
For example, if investment in building up agricultural capacity leads to increased
productivity and output, then the spending that allowed for such improvements to occur
should be viewed as beneficial and vice versa. If productivity gains are not attained by that
spending, then it should be taken as part of the social engineering (trial and error) process
that yields developmental states, and the state should withdraw support for such activities
within a given time frame (Lerner 1943 and 1947, and Mkandawire 2001). The ability of the
state to withdraw that spending is what will make it developmental.
In sum, the following perspectives hold tremendous weight for development finance
in places like Ghana and SSA.
1. Taxes drive money; taxes are an intricate part of the social relations between states
and societies and tax policy must be crafted with that in mind.
2. Targeted taxation and redistribution are important for developmental states.

121
3. Functional finance should drive government development expenditure decisions and
failure of government policy should not imply an abandonment of functional finance.
4. Neoclassical prescriptions under the Washington Consensus do not yield favorable
results and were not adopted by nations that have recently transformed their
economies (East Asia countries).
5. Domestic savings, financial stability and human resource improvements must be
pursued aggressively for sustained economic growth.
6.7 Summarizing Remarks and Directions for Future Research Divergence in economic growth and development has characterized the development
experiences of SSA and East Asia. In countries like Ghana and Malaysia where initial
conditions have been similar, divergence has still persisted. This dissertation has argued
using historical, analytical and qualitative methodologies that one of the most important
facilitators of growth and development was the committed and focused attempts by the state
to achieve economic transformation. It has been shown that replication of East Asian
strategies are possible if there is a serious commitment to develop.
The dissertation has reiterated the message of several heterodox development
economists and has added to their scholarly work by providing a country and sector-specific
analysis of development and agricultural transformation. It is hoped that this dissertation will
become an important example for others interested in studying comparative development
between East Asia and SSA. The hope is that similar research will bring forth further lessons
for economic development in Ghana and SSA.
Future research should delve deeper into the issue of land tenure and agricultural
transformation. A comparative discussion will prove useful as it will highlight similarities

122
and differences in African and Asian land tenure and show their implications for economic
development. Comparative analysis of fisheries, crop farming and livestock will also be
useful as will the analysis of contract farming. Youth employment and gender issues as they
relate to agricultural transformation should also be explored. In addition to these issues, the
implications of John Fagg Foster’s theory of institutional adjustment, financing the
developmental state and modern money for the developmental state should be explored
further since they can provide important insights for scholars interested in the prospects of
building developmental states in Africa.
The hope is that this dissertation has at the very least reiterated and shown that East
Asia’s development experience holds the key for SSA. It is hoped that the broad discussion
plus the method of research used will be an important insight for scholars. Lastly, the hope is
that more of such comparative studies of economic development will be conducted.

123
Appendix A: Questionnaire
PART I (General Information about Participant’s Occupation)
1. What type of agricultural activity is the participant engaged in? [1 = Crop Farming; 2 = Fishing (river, sea or fish farm); 3 = Livestock; 4 = Crop Farming and Livestock; 5 = Crop Farming and Fishing; 6 = All the Above]
/_______ /
2. What is the nature of the participants’ business enterprise? [1 = Small – Holder; 2 = Mid – Sized; 3 = Large]
/ ______ /
3. Does the participant employ others to work in the enterprise? [1 = Yes; 2 = No]
/ ______ /
a. If YES how many people are employed? / ______ /
b. Is it difficult to recruit workers? [1 = Yes; 2 = No; 3 = Sometimes (Please Explain)]
/ ______ /
4. How are workers in the enterprise compensated? [1 = Wages; 2 = Share of the Output; 3 = Wages and Share of the Output]
/ ______ /
a. If wages are paid, what is the typical wage for a worker per day? GH Cedis/day / ______ /
PART II (Occupation – Specific Information)
Crop Farming
1. What crops do you cultivate each year on this farm?
2. Is your farm mechanized? [1 = Yes; 2 = No]
/ _______ /
a. If YES, what type of equipment do you have?

124
3. What is the size of your farm? [1 = < 5 Hectares; 2 = 5 – 10 Hectares; 3 = 11 – 20 Hectares; 4 = > 20 Hectares]
/ _______ /
Do you use fertilizer on your farm?
[1 = Yes; 2 = No; 3 = Sometime ago but not now; 4 = Never but would like to]
/ _______ /
a. If YES, where do you get your fertilizer from? [1 = Ministry of Agriculture; 2 = Elsewhere (Explain if Possible)]
/ _______ /
b. If YES, are you trained on the proper application of fertilizer? [1 = By Extension Officer; 2 = By Other Farmers; 3 = By Trial and Error]
/ _______ /
4. What is the source of seeds for your farm? [1 = Ministry of Agriculture; 2 = Previous Output from Your Farm; 3 = Other Farmers]
/ _______ /
a. If seeds are from the Ministry of Agriculture, are they free? [1 = Yes; 2 = No (Explain if Possible)]
/ _______ /
5. Have you seen an improvement in the yields of the seeds over the years? [1 = If Yes for Which Crops; 2 = If No for Which Crops; 3 = Not Sure]
/ _______ /
6. Is your farm irrigated? [1 = Yes; 2 = No]
/ _______ /
a. If NO, has your farm suffered over the years because of irregular rainfall? [1 = Yes; 2 = No]
/ _______ /

125
7. Who buys your produce?
[1 = Ministry of Agriculture; 2 = Marketing Board; 3 = General Public; 4 = Other]
/ _______ /
8. How do you get your produce to the buyers? [1 = I Deliver; 2 = Buyer Comes to Farm; 3 = Some Combination of 1 and 2; 4 = Sell in Local Market; 5 = Sell to Middlemen (including State agency)]
/ _______ /
a. Do the conditions of the roads interfere with your ability to sell your output? [1 = Yes; 2 = No; 3 = Sometimes]
/ _______ /
b. Over the years have the conditions of the roads to your farm improved? [1 = Yes; 2 = No; 3 = Conditions have worsened]
/ _______ /
9. How did you start your farm? [1 = Inherited; 2 = Took Loan; 3 = Family Business; 4 = Bought Land with Savings]
/ _______ /
10. Have you considered expanding your farm recent years? [1 = Yes; 2 = No]
/ _______ /
a. If YES, can you easily get the funds to expand your farm? [1 = Yes (Please Explain Source); 2 = No]
/ _______ /
11. What is your overall perspective on the crop farming business? [Please explain trends, weaknesses and opportunities that you see]

126
Fisheries
1. Identify type of fishing activity [1 = Sea Fishing; 2 = River Fishing; 3 = Fish Farm]
/ _______ /
a. If fish farm, where do you receive your stock? [1 = Ministry of Agriculture; 2 = Private Hatchery]
/ _______ /
2. What is the size of the fishing enterprise? [1 = 1 Canoe; 2 = 1 < Canoes ≤ 10; 3 = Commercial Fishing]
/ _______ /
a. If using canoes or other small boats, do they have outboard motors? [1 = Yes; 2 = No]
/ _______ /
b. If commercial fishing, how many trawlers and fishing boats are there? [1 = More than 1 but less than 5; 2 = More than 5]
/ _______ /
3. What type of fish do you usually catch? [1 = Herring; 2 = Tilapia; 3 = Salmon; 4 = Tuna; 5 = Mackerel; 6 = Other]
/ _______ /
a. Do you prefer a particular catch over the other? [1 = If Yes Which Type; 2 = No]
/ _______ /
4. Who buys your fish? [1 = Fish Mongers and Private Individuals; 2 = Processing Plant; 3 = Both]
/ _______ /
a. How do your buyers receive the fish? [1 = I deliver; 2 = Buyers come to me; 3 = Both]
/ _______ /

127
5. Are there refrigeration facilities in your town to ensure proper storage of fish? [1 = Yes; 2 = No; 3 = Some but Inadequate]
/ _______ /
6. Do you receive or have you in the past received training on better fishing techniques? [1 = Yes; 2 = No]
/ _______ /
a. If YES, who performed training? [1 = Ministry of Agriculture; 2 = Other Agency (explain)]
/ _______ /
b. If NO, would you prefer training? [1 = Yes; 2 = No]
/ _______ /
7. How did you start your fishing business? [1 = Inherited; 2 = Took Loan; 3 = Family Business; 4 = With Own Savings]
/ _______ /
8. Have you considered expanding your fishing business? [1 = Yes; 2 = No]
/ _______ /
a. If YES, can you easily get the funds to expand? [1 = Yes (Please Explain); 2 = No]
/ _______ /
9. What is your overall perspective on the fishing business? [Please explain trends, weaknesses and opportunities that you see]
Livestock
1. Identify what animals are being raised
[1= Poultry; 2 = Cattle; 3 = Pigs; 4 = Small Ruminants (Goats, Sheep); 5 = Other]
/ _______ /
2. How many animals do you have?

128
[1= < 100; 2 = 100 < Animals < 500; 3 = 500 < Animals < 1000; 4 = > 1000 Animals]
/ _______ /
3. Where do you get feed for your animals?
[1 = Ministry of Agriculture; 2 = Private Company; 3 = Prepare Own Feed]
/ _______ /
a. If cattle, do you provide feed for them? [1 = Yes; 2 = No]
/ _______ /
b. If NO how do they eat? (Please explain)
5. Who buys your animals? [1 = Individuals; 2 = Abattoirs; 3 = Both]
/ _______ /
a. How do your buyers receive the animals? [1 = I Deliver; 2 = Buyers Come to Me; 3 = Both]
/ _______ /
6. Do you have training on handling disease outbreaks in your livestock? [1 = Yes; 2 = No]
/ _______ /
a. If YES how did you receive this training? [1 = Ministry of Agriculture; 2 = other livestock owners; 3 = through experience]
/ _______ /
b. Are disease outbreaks frequent in your livestock? [1 = Yes; 2 = No]
/ _______ /
7. Have you considered expanding your business? [1 = Yes; 2 = No]
129
/ _______ /
a. If YES, can you easily get the funds to expand? [1 = Yes (Please Explain); 2 = No]
/ _______ /
8. What is your overall perspective on the livestock business?
[Please explain trends, weaknesses and opportunities that you see]
PART III (Investigator Observation)
1. Is there a thriving local economy close to the agricultural activity? (Describe in detail what that local economy is?
2. Are there any visible environmental impacts that could be a result of the agricultural activity?
3. What was the composition of labor for each agricultural activity?

130
Appendix B: Other Interview Questions
1. In your experience as an expert on Ghana’s economy (or Agricultural Sector), what would you identify as the major changes that have occurred in the economy or sector since independence?
2. What sectors of the Ghanaian economy do you think have lacked in growth and development and what sectors do you think hold the key to development and the achievement of the Millennium Development Goals?
3. What is your opinion of the agricultural sector? What do you think are the keys to developing this sector? What challenges would you say affect the productivity of the sector? What ways do you think these challenges can be circumvented?
4. What future do you see for agriculture in Ghana? In the broader context of development, what prospects do you see for Ghana?
5. What steps do you think need to be taken for the overall development of Ghana? Who does this responsibility fall on? Can you identify a specific role for the state in development?
6. In the 1960’s, Ghana was compared to several East Asian countries like Malaysia, South Korea and Taiwan. However, in the present period Ghana’s development is nowhere near these countries. In your opinion, what do you think is the most important factor that can explain Ghana’s poor development record? Do you think learning from these countries (Malaysia, Taiwan etc) and adopting practical lessons can help? (If so, what is the best way to do this?)
7. Any other thoughts?

131
Appendix C: Highlights of Washington Consensus
1. Fiscal Discipline
2. Restructuring of public expenditures from indiscriminate subsidies to basic health and education
3. Tax reform to broadens the tax base
4. Liberalizing interest rates
5. A competitive exchange rate
6. Trade liberalization
7. Liberalization of inward foreign direct investment
8. Privatization of state enterprises
9. Abolition of regulations that impede entry and exit of firms and market competition
10. Securing property rights
132
BIBLIOGRAPHY Abor, J., Adjasi, C. K. D., and Hayford, M-C. 2008. How Does Foreign Direct Investment
Affect the Export Decisions of Firms in Ghana, African Development Review, 20(3): 446-465.
Ake, Claude. 1984. A Political Economy of Africa. New York: Longman Inc. Ake, Claude. 1996. Democracy and Development in Africa. Washington DC: The Brookings
Institution.
Akyuz, Y ., Chang, Ha-Joon and Kozul-Wright, R. 1998. New Perspectives on East Asian Development. Journal of Development Studies, 34(6)
Akyuz, Y and Gore, C. 2001. African Economic Development in a Comparative Perspective.
Cambridge Journal of Economics , 25(3): 265-288. Alan Heston, Robert Summers and Bettina Aten, Penn World Table Version 6.3, Center for
International Comparisons of Production, Income and Prices at the University of Pennsylvania, August 2009.
Amsden, A. 1989. Asia's Next Giant: South Korea and Late Industrialization. Oxford
University Press. Amsden, A. 2001. The Rise of the Rest: Challenges to the West from Late-Industrializing
Economies. Oxford University Press. Amsden, A. 2007. Escape from Empire: The Developing World's Journey through Heaven
and Hell. Cambridge, Mass: The MIT Press. Appiah, M. R. 2004. Impact of Cocoa Research Innovations on Poverty Alleviation in
Ghana. Accra: Ghana Academy of Arts and Sciences. Arden-Clarke, Charles. 1958. Eight Years of Transition in Ghana. African Affairs, 57(226):
29-37. Arden-Clarke, Charles. 1958. Gold Coast into Ghana: Some Problems of Transition.
International Affairs , 49-56. Asare, Benjamin. and Wong, Alan. 2004. An Economic Development of Two Countries:
Ghana and Malaysia. West Africa Review , 5. Associated Press. July 2009. President Obama's Speech to Ghanaian Parliament. Available
from http://www.huffingtonpost.com/2009/07/11/obama-ghana-speech-full-t_n_230009.html.
133
Athukorala, P., and Menon, J. 1995. Development with Foreign Investment: Malaysia, Australian Economic Review, 109: 9-22
BBC. 2005. Two Countries Contrasting Tales. Available from http://news.bbc.co.uk/2/hi/africa/4398537.stm.
Beason, R. and Weinstein D. 1995. The MITI Myth. American Enterprise , 6(4):84. Bell, S. 2000. Do Taxes and Bonds Finance Government Spending?. Journal of Economic
Issues, 34 (September 2000): 603-620
Bell, S. 2001. The Role of the State and the Hierarchy of Money. Cambridge Journal of Economics, 25 (May 2001): 149-163
Bodomo, A. 1996. On Language and Development in Africa: The Case of Ghana. Nordic
Journal of African Studies , 5(2): 31-53. Boratav, K. 2001. Movements of Relative Agricultural Prices in Sub-Saharan Africa.
Cambridge Journal of Economics , 25(3): 395-416. Brautigam, D. 1996. The State as Agent: Industrial Development in Taiwan, 1952-72. In
Asian Industrialization and Africa: Studies in Policy Alternatives to Structural Adjustment, ed. Howard Stein, 145-182. New York: St. Martin's Press.
Brautigam, D., Fjeldstad, O-H, and Moore, M. 2008. Taxation and State-Building in
Developing Countries: Capacity and Consent. New York: Cambridge University Press Byres, Terence. 2002. Agriculture and Development: The Dominant Orthodoxy and an
Alternative View. In Rethinking Development Economics, ed. Ha-Joon Chang (pp. 235-254). New York: Anthem Press.
Cassen, Robert. 1994. Population and Development: Old Debates, New Conclusions. New
Jersey: Transaction Publishers. Castells, Manuel. 1992. Four Asian Tigers with a Dragon Head. In States and Development
in the Asian Pacific Rim, eds. Richard P. Appelbaum and Jeffrey Henderson, 33-70. Newbury Park, CA: Sage Publications.
CEDECOM. 2009. Central Region Profile.Cape Coast Chang, Ha-Joon. 2003. Kicking Away the Ladder: Development Strategy in Historical
Perspective. New York: Anthem Press. Chang, Ha-Joon .ed. 2003. Rethinking Development Economics. New York: Anthem Press.
134
Chang, Ha-Joon. 2006. The East Asian Development Experience: The Miracle, the Crisis and the Future. New York: Zed Books.
Chang, Ha-Joon. 2007. Institutional Change and Economic Development. Tokyo: United
Nations University Press. Chang, Ha-Joon. and Grabel, Ilene. 2004. Reclaiming Development: An Alternative
Economic Policy Manual . New York: Zed Books. Chenery, H. and Taylor, L. 1968. Development Patterns Among Countries and Over Time.
Review of Economics and Statistics, 50(4):391-416. Child, Josiah. 1693 [2010]. A New Discourse on Trade. Gale ECCO. Child, Josiah. 1668 [1959]. Brief Observations Concerning Trade, and Interest of Money. In
Sir Josiah Child: Merchant Economist, ed. W. Letwin (pp. 40-58). Cambridge, Mass: Harvard University Printing Office.
Ching, C. 1999. New Trend(s) in Poultry Production and Processing. Senior Officers
Conference - Santubong. Kuching: Department of Agriculture, Sarawak. Ching, P. W. 2006. The Development of Malaysian Economy. Selangor: Prentice Hall. Cipolla, C. M. 1970. The Economic Decline of Empires. London: The Camelot Press Ltd. Clark, David. 1996. Urban World/Global City. New York: Routledge. Clark, David. 1998. Interdepedent Urbanization in an Urban World: An Historical Overview.
The Geographical Journal , 164(1):85-95. Clute, R. 1982. The Role of Agriculture in African Development. African Studies Review,
25(4)
Davidson, Paul. 2004-2005. A Post Keynesian View of the Washington Consensus and How to Improve It. Journal of Post Keynesian Economics, 27(2): 207-230
Department of Agriculture Sarawak. 2008. Agricultural Statistics of Sarawak. Kuching, Malaysia: Department of Agriculture Sarawak.
Department of Statistics. 2005. Agriculture Census . Putrajaya: Department of Statistics
Malaysia. Department of Statistics. 2006. Economic Census: Agriculture. Putrajaya, Malaysia:
Department of Statistics Malaysia.

135
Department of Statistics. 2006. Economic Census: Manufacturing. Putrajaya, Malaysia: Department of Statistics Malaysia.
Department of Statistics. 2008. Annual Rubber Statistics. Putrajaya, Malaysia: Department of
Statistics Malaysia. Department of Statistics. 2008. Yearbook of Statistics. Putrajaya, Malaysia: Department of
Statistics Malaysia. Department of Statistics. 2009. Annual National Accounts: Gross Domestic Product.
Putrajaya, Malaysia: Department of Statistics, Malaysia. Deyo, Frederic. ed. 1987. The Political Economy of the New Industrialism. Ithaca: Cornell
University Press. Dreschler, W. 2004. Natural versus Social Sciences: On Understanding in Economics. In
Globalization, Economic Development and Inequality: An Alternative Perspective, ed. Erik Reinert, 71-87. Northampton, Mass: Edward Elgar.
Easterly, W and Levine, R. 1997. Africa's Growth Tragedy: Policies and Ethnic Divisions.
Quarterly Journal of Economics , CXII, 1203-50. Essegbey, G. 2009. Ghana: Cassava, Cocoa, and Poultry. In Agribusiness and Innovation
Systems in Africa, eds. Kurt Larsen, Kim Ronald and Theus Florian, 63-86. Washington DC: World Bank.
Evans, P., Rueschemeyer, D., and Skocpol, T. eds. 1985. Bringing the State Back In. New
York: Cambridge University Press. Evans, P. 1995. Embedded Autonomy: States & Industrial Transformation. Princeton, NJ:
Princeton University Press. Fine, B. and KS, Jomo. eds. 2006. The New Development Economics after the Washington
Consensus. New York: Zed Books. Food and Agriculture Organization. 2004a. Fertilizer Use by Crop in Ghana. Rome: FAO. Food and Agriculture Organization. 2004b. Fertilizer Use by Crop in Malaysia. Rome: FAO. Forstater, Mathew. 2005. Taxation and Primitive Accumulation: The Case of Colonial
Africa. Research in Political Economy,22: 51-65. Foster, John Fagg. 1981. An Approach to Land Use Planning in Changing Technology.
Journal of Economic Issues, 15(4):985-1007.

136
Francks, P., Boestel, J., and Kim H. C. 1999. Agriculture and Economic Development in East Asia: From Growth to Protectionism in Japan, Korea and Taiwan. London: Routledge.
Fritz, V. and Menocal, A. R. 2007. Developmental States in the New Millenium: Concepts and Challenges for a New Aid Agenda, Development Policy Review, 25(5):531-552.
Gabre-Madhin, Z, E., & Johnston, B. F. 2002. Accelerating Africa's Structural
Transformation: Lessons from East Asia. In Perspectives on Agricultural Transformation: A View from Africa, eds. Thomas S. Jayne, Isaac J. Minde, & Gem Argwings-Kodhek, 49-82. Hauppage,NY: Nova Science Publishers.
Ghana National Development Planning Commission. 2008. Long Term National
Development Plan (Seven Year Development Plan 2008-2015), Volume 1: Towards a Development Policy Framework. Cantoments-Accra: National Development Planning Commission.
Ghana Statistical Service. 2002. 2000 Population & Housing Census. Accra: Statistical
Service. Ghana Statistical Service. 2003. Ghana Directory of Industrial Establishments. Accra:
Statistical Service. Ghana Statistical Service. 2005. Population Data Analysis Report: Vol I, Socio-Economic
and Demographic Trends. Accra: Statistical Service. Ghana Statistical Service. 2006. Health, Nutrition and Environment Statistics: 2005 Report.
Accra: Statistical. Gomez, Edmund. T., and KS, Jomo 1999. Malaysia's Political Economy:Politics, Patronage
and Profits. New York: Cambridge University Press Goodacre, Hugh. 2005. William Petty and Early Colonial Roots of Development Economics.
In The Pioneers of Development Economics: Great Economists on Development, ed. Jomo KS, 10-30. New York: Zed Books.
Gopal, J. 1999. Malaysia's Oil Palm Refining Industry: Policy, Growth, Technical Change,
and Competitiveness. In Industrial Technology Development in Malaysia,eds. Jomo KS, G. Felker, Rasiah & Rajah, 360-395). New York: Routledge.
Gove, S., and Pelto, G.H.1994. Focused Ethnographic Studies in WHO Programme for the
Acute Respiratory Infections, Medical Anthropology, 15 (4): 409-424
Harron, H. M., Shamsudin, M. N., and Latif, I. A. 2001. Challenges for Agribusiness: A Case for Malaysia. Chang Mai, Thailand: Multicropping Center, Chang Mai University.
Hodder, Rupert. 2000. Development Geography. New York: Routledge.

137
Hollerman, L. 1983. Review of MITI and the Japanese Miracle by Chalmers Johnson. Journal of Asian Studies , 42(2):414-415.
Huff, W. G., Dewit, G., and Oughton C. 2001. Building the Developmental State: Achieving Economic Growth through Co-operative Solutions: A Comment on Bringing Politics Back In
Ikpe, Eka. 2008. The Relevance of the Developmental State Paradigm in an Era of Globalisation. International Initiative for Promoting Political Economy Workshop. Procida, Italy.
Innes, A. Mitchell., 1913. What is Money?. Banking Law Journal, 30 (5)
Innes, A. Mitchell. 1914. The Credit Theory of Money. Banking Law Journal, 31(2)
Jayne, T. S., Minde, I. J., and Argwings-Kodhek, G. eds. 2002. Perspectives on Agricultural Transformation: A View from Africa. Hauppauge, NY: Nova Science Publishers.
Johnson, Chalmers. 1982. MITI and the Japanese Miracle: The Growth of Industrial Policy,
1925-1975. Stanford, CA: Stanford University Press. Johnson, Chalmers. 1994. Japan Who Governs?- The Rise of the Developmental State. New
York : W. W. Norton and Company . Johnson, Chalmers. 1999. The Developmental State: An Odyssey of a Concept. In
Developmental State. ed. Meredith Woo-Cummings, 32-60. Ithaca: Cornell University Press.
Johnston, B. F., and Kilby, P. 1975. Agriculture and Structural Transformation: Economic
Strategies in Late-Developing Countries. New York: Oxford University Press. Joshi, A and Ayee, J. 2008. Associational Taxation: A Pathway into the Informal Sector?. In
Taxation and State-Building in Developing Countries: Capacity and Consent.eds. Deborah Brautigam, Odd-Helge Fjelstad and Mick Moore, 183-211. New York: Cambridge University Press.
Ju-K'ang, T. 1997. The Chinese of Sarawak. Kuching: The Sarawak Press Sdn. Bhd. Kajisa,K., Maredia, M and Boughton, D. 1997. Transformation Versus Stagnation in the Oil
Palm Industry: A Comparison between Malaysia and Nigeria. East Lansing: Department of Agricultural Economics-Michigan State University.
Karshenas, M. 2001. Agriculture and Economic Development in Sub-Saharan Africa and
Asia. Cambridge Journal of Economics , 25(3): 315-342.

138
Kauzya, John-Mary 2008. Building a Developmental State: Strategies for Attracting and Retaining High Quality Staff in the Public Service in Africa, 30th Africa Association for Public Administration and Management (AAPAM) Annual Roundtable Conference. Accra, Ghana
Kearney, R. 1990. Mauritius and the NIC Model Redux, or, How Many Cases Make a
Model? Journal of Developing Areas , 24:195-216. Khan, J. 2009. A Tale of Two Countries: Ghana and Malaysia's Divergent Development
Paths. Available from allacademic: http://www.allacademic.com/meta/p282005_index.html
Knoblauch, Hubert. 2005. Focused Ethnography [30 paragraphs]. Forum: Qualitative Social
Research [On-line Journal], 6 (3), Art. 44. Available at: http://www.qualitative-research.net/fqs-texte/3-05/05-3-44.htm [Date of Access: 11/17/2010]
Knapp, George Friedrich. 1924. The State Theory of Money. Abridged edition, translated by H. M. Lucas and J. Bonar. New York: Macmillan and Co.
KS, Jomo. 2001. Rethinking the Role of Government Policy in Southeast Asia. In Rethinking the East Asian Miracle, eds. Joseph E Stiglitz, and S. Yusuf , 461-508. New York: Oxford University Press.
KS, Jomo. 2005. The Pioneers of Development Economics: Great Economists on
Development. New York: Zed Books. KS, Jomo and Reinert, E. eds. 2005. The Origins of Development Economics: How Schools
of Thought Have Addressed Development. New York: Zed Books. KS, Jomo., Chang, Y., and Khoo, K. 2004. Deforesting Malaysia: The Political Economy
and Social Ecology of Agricultural Expansion and Commerical Logging. New York: Zed Books.
Kuznets, Simon. 1971. Economic Growth of Nations:Total Output and Production Structure.
Cambridge, MA: Harvard University Press. Kwan, K. S. 1995. The Korean Miracle (1962-80) Revisited: Myths and Realities in
Strategies and Development. In Asian Industrialization and Africa: Studies in Policy Alternatives to Structural Adjustment, ed. Howard Stein, 87-144. New York: St. Martins Press.
Lerner, Abba. P., 1943. Money as a Creature of the State. American Economic Review, 37(2)
Lerner, Abba. P., 1947. Functional Finance and the Federal Debt. Social Research

139
Lewis, Arthur. 1954. Economic Development with Unlimited Supplies of Labour. Manchester School , 22:139-91.
Mack, N., Woodsong, C., MacQueen, K., Guest, G., and Namey, E. 2005. Qualitative
Rsearch Methods: A Data Collector's Field Guide, Research Triangle Park, NC: Family Health International
Makoto, K. 1988. Myths about MITI . Tokyo Business Today , p. 64. McCarthy, J., and Cramb, R. A. 2009. Policy Narratives, Landholder Engagement, and Oil
Palm Expansion on the Malaysian and Indonesian Frontiers. The Geographical Journal , 175: 112-123.
Meisenhelder, T. 1997. The Developmental State in Mauritius. Journal of Modern African
Studies , 35:279-297. Migdal, J. S. 1988. Strong Societies and Weak States. Princeton, NJ: Princeton University
Press. Ministry of Food and Agriculture, Ghana. (2007). Food and Agriculture Sector Development
Policy. Accra: Ministry of Food and Agriculture. Mkandawire, T. 2001. Thinking about Developmental States in Africa. Cambridge Journal
of Economics , 25(3):289-313. Morrison, P. S. 1997. Transforming the Periphery: The Case of Sarawak, Malaysia. In Asia-
Pacific: New Geographies of the Pacific Rim, eds. R. Watters and T. McGee, 302-317. London: Hurst and Company.
Morrison, P. S., Murray, W. E., and Ngidang, D. 2006. Promoting Indigenous
Enterpreneurship through Small-Scale Contract Farming: The Poultry Sector in Sarawak, Malaysia. Singapore Journal of Tropical Geography , 27: 191-206.
Murad, W. M., Mustapha, N.H.N and Siwar, C. 2008. Review of Malaysian Agricultural
Policies with Regards to Sustainability, American Journal of Environmental Sciences, 4(6): 608-614
Myrdal, G. 1968. Asian Drama: An Inquiry into the Poverty of Nations, Vol. II. New York: Pantheon.
Ngidang, D. 1997. Native Customary Land Rights, Public Policy, Land Reforms and Plantation Development. Borneo Review, VIII, 63-80.
Ngidang, D. 2005. Deconstruction and Reconstruction of Native Customary Land Tenure in
Sarawak. Southeast Asian Studies, 43(1): 41-75.

140
Nyanteng, V. K., and Asuming-Brempong, S. 2003. The Role of Agriculture in Food Security in Ghana. Role of Agriculture Project International Conference. Rome: FAO.
Ocampo, Jose A., and KS, Jomo and Vos, R. 2007. Growth Divergences: Explaining
Differences in Economic Performance. New York: Zed Books. Oduro, A. D. 2000. Performance of the External Trade Sector Since 1970. In E. Aryeetey, J.
Harrigan, and M. Nissanke, Economic Reforms in Ghana: The Miracle and the Mirage. Oxford, UK: James Currey.
Onis, Ziya. 1991. The Logic of the Developmental State. Comparative Politics , 24(1):109-
126. Patnaik, P. 2005. Karl Marx as a Development Economist. In The Pioneers of Development
Economics: Great Economists on Development, ed. Jomo KS, 31-41. New York: Zed Books.
Peet, R. and Hartwick, E. 2009. Theories of Development: Contentions, Arguments and
Alternatives. New York: The Guildford Press. Polanyi, Karl. 1944 [2001]. A Great Transformation. Boston: Beacon Press. Porter, M. 1990. The Competitive Advantage of Nations. New York: McMillan. Rawlins, J. 1965. Sarawak 1839-1966. New York: St. Martins Press. Reece, B. 2004. The White Rajahs of Sarawak: A Borneo Dynasty. Singapore: Archipelago
Press. Reinert, E. and Reinert, S. 2005. Mercantilism and Economic Development: Schumpeterian
Dynamics, Institution-Building and International Benchmarking. In The Origins of Development Economics:How Schools of Thought Have Addressed Development, eds. Jomo KS and Erik Reinert, 1-23, New York: Zed Books.
Reinert, Erik. 1999. The Role of the State in Economic Growth. Journal of Economic
Studies, 26:4-5. Reinert, Erik. 2004. Globalization, Economic Development and Inequality: An Alternative
Perspective. Northampton, Mass: Edward Elgar. Reinert, Erik. 2005. German Economics as Development Economics: From the Thirty Years'
War to World War II. In The Origins of Development Economics: How Schools of Thought Have Addressed Development, eds. Jomo KS,and Erik Reinert, 48-68. New York: Zed Books.
141
Reinert, S. 2005. The Italian Tradition in Political Economy: Theories and Policies of Development in the Semi-Periphery of the Enlightenment. In The Origins of Development Economics: How Schools of Thought Have Addressed Development, eds. Jomo KS and Erik Reinert, 24-47. New York : Zed Books.
Ricardo, D. 1821[1973]. On the Principles of Political Economy and Taxation. eds. Pierro
Sraffa and Maurice. Dobb, New York: Cambridge University Press. Richards, L., and Morse, J. 2007. Read Me First for a User's Guide to Qualitative Methods.
Thousand Oaks, CA: Sage Publications. Rucipero, Rubens. 2001. African Economic Development in a Comparative Perspective.
Cambridge Journal of Economics , 25(3):263. Sachs, J and Warner, A. 1997. Sources of Slow Growth in African Economies. Journal of
African Economies , 6: 335-376. Sarawak Star Tribune. October 12, 2010. Government Will Continue Peat Soil Research.
Available from http://tribune.my/prime/3227-ss--government-will-continue-peat-soil-research.html
Sao Paulo School of Economics of Getulio Vargas Foundation. 2010. Ten Theses on New
Developmentalism. Sao Paulo, Brazil: Structuralist Development Macroeconomics Center
SAPRIN. 2004. Structural Adjustment: The Policy Roots of Economic Crisis, Poverty and
Inequality. New York: Zed Books. Sauber, M. 2009. Africa's Lost Comparative in Advantage in Agriculture: Economic
Development and Stagnation in a Monetary Production Economy with Low Agricultural Productivity. INFER Annual Conference. Stirling, UK.
Schatz, Richard. 2007. Structural Transformation and Rural Development in Sarawak,
Malaysia, 1963-2006. The Sarawak Musuem Journal , LXIII, No. 84. Scott, A. and Garofoli, G. 2007. Development on the Ground: Clusters, Networks and
Regions in Emerging Economies. New York: Routledge. Sindzingre, A 2007. Financing the Developmental State: Tax and Revenue Issues,
Development Policy Review, 25(5): 615-632 Stein, Howard. ed. 1996. Asian Industrialization and Africa: Studies in Policy Alternatives
for Structural Adjustment. New York: St Martins Press. Stein, Howard. 2003. Rethinking African Development. In Rethinking Development
Economics, ed. Ha-Joon. Chang, 153-178. New York: Anthem Press.

142
Stiglitz, Joseph. E., and Yusuf, S. eds. 2001. Rethinking the East Asian Miracle. New York: Oxford University Press.
Sulaiman, W. et al 2005. Sago Performance on Deep and Shallow Peats and Its Implications
on Agronomic Sustainability. Kuching, Malaysia: CRAUN Research Sdn Bhd. Szentes, T. 2005. Development in the History of Economics. In The Origins of Development
Economics: How Schools of Thought Have Addressed Development,eds. Jomo KS and Erik Reinert, 146-158. New York: Zed Books.
The Encyclopedia of Malaysia. Volumes 9-13. Singapore: Archipelago Press. Timmer, C. P. 1997. Farmers and Markets: The Political Economy of New Paradigms.
American Journal of Agricultural Economics , 79: 621-627. Todaro, M. and Smith, S. 2002. Economic Development. New York: Addison-Wesley. Todaro, M. and Smith, S. 2009. Economic Development. London: Pearson. Toye, John. 2003. Changing Perspective in Development Economics. In Rethinking
Development Economics, ed. Ha-Joon Chang, 21-40. New York: Anthem Press. Tradewinds Plantation Berhad. 2010. Rising to the Challenge. Kuala Lumpur, Malaysia:
Tradewinds Plantation Berhad. Trezzini, Bruno. 2001. Embedded State Autonomy and Legitimacy: Piecing together the
Malaysian Development Puzzle. Economy and Society , 30(3): 324-353. Tsen, W. H. 2005. The Determinants of Foreign Direct Investment in the Manufacturing
Industry of Malaysia. Journal of Economic Cooperation, 26 (2): 91-110
UNCTAD. 1999. African Development in a Comparative Perspective. Trenton, New Jersey: First Africa World Press.
UNCTAD. 2007. Reclaiming Policy Space: Domestic Resource Mobilization and
Developmental States. New York: United Nations. Vries, Jan de. 1984. European Urbanization 1500-1800. Cambridge, Mass: Harvard
University Press. Wade, Robert 1990. Governing the Market: Economic Theory and the Role of Government in
East Asian Industrialization. Princeton, NJ: Princeton University Press. Wallerstein, Immanuel. 1974. The Modern World System I: Capitalist Agriculture and the
Origins of European World Economy in the Sixteenth Century. San Diego: Academic Press.

143
Wallerstein, Immanuel. 1980. The Modern World System II: Mercantilism and the Consolidation of the European World Economy, 1600-1750. Boston: Academic Press.
Wray, L. Randall., 1998. Understanding Modern Money: The Key to Full Employment and
Price Stability. Northampton, Mass: Edward Elgar Publishers.
Wray, L. Randall. 2010. Alternative Approaches to Money. Theoretical Enquiries in Law, 11(1)
World Bank. 1981. Accelerated Development in Sub-Saharan Africa: An Agenda for Action. Washington DC: World Bank.
World Bank. 1982. Agriculture and Economic Development. Washington DC: Oxford
University Press. World Bank. 1993. East Asian Miracle: Economic Growth and Public Policy. Washington
DC: Oxford University Press. World Bank. 1994. Adjustment in Africa: Reforms, Results and the Road Ahead. Washington
DC: Oxford University Press. World Bank. 1998. World Bank Indicators. Washington DC: World Bank. World Bank. 2006. World Development Indicators. Washington DC: The World Bank. World Bank. 2008. Agriculture for Development. Washington DC: Oxford University Press. World Bank. 2009. World Development Indicators. Washington DC: World Bank. Yamamura, K. 1983. Review of MITI and the Japanese Miracle by Chalmers Johnson.
Journal of Japanese Studies , 9(2):211.

144
VITA
Richard Blankson Dadzie was born on February 19, 1983 in Accra, Ghana. He
moved to the United States in 2001 to begin his undergraduate degree. In 2005, Richard
graduated with a Bachelors degree in Economics from Whitworth University in Spokane,
WA. After working for a year in retail management, Richard enrolled as a graduate
student at the University of Missouri-Kansas City and worked as a Graduate Teaching
Assistant in the Department of Economics. During his time at the University of Missouri-
Kansas City, he has been a Preparing Future Faculty Fellow and a Dissertation Research
Fellow. After graduation Richard will teach as an Assistant Professor of Economics and
Finance in the Division of Social Sciences at the University of Hawaii-West Oahu.
Top Related