


Languages
Pages
Legal


Development of High Performance Lightweight Concrete Mixes
for Prestressed Bridge Girders
by
John Andrew Heffington, B.S.C.E
Thesis
Presented to the Faculty of the Graduate School of
The University of Texas at Austin
in Partial Fulfillment
of the Requirements
for the Degree of
Master of Science in Engineering
The University of Texas at Austin
May 2000

Development of High Performance Lightweight Concrete Mixes
for Prestressed Bridge Girders
Approved by Supervising Committee:
Ned H. Burns
John E. Breen
Dedication
To Kelly, Mom, Dad, and Sam
Acknowledgements
First, thanks to God for blessing me with this job and chance to write this
thesis.
Second, I want to thank Kelly for dealing with me while I wrote this
thesis. Writing a thesis and being in love do not go together easily, but she has
made it a great experience.
Third, thanks to Mom, Dad, and Sam who pushed me to go to graduate
school. It definitely was the right decision.
Fourth, I need to thank Dr. Ned Burns and Dr. John Breen. I have been
blessed to work under these two professors while I was here at the University of
Texas. I have enjoyed their guidance and learning under them.
Also, I have to thank Rob Kolozs for being my partner on this project.
When we first met, I never imagined we would be tearing up the lab together with
concrete bowling and concrete rock toss. Working with Rob has been a great
experience.
Another thanks goes to Dan Thatcher, who worked hard to get up to speed
on the project and was able to take over with minimal problems.
iv

Many thanks go to the Texas Department of Transportation for funding
the project and especially Tom Rummell and Mary Lou Ralls for believing in
lightweight concrete.
At the Construction Materials Research Group, thanks to Mike Rung for
teaching Rob and me how to mix concrete and obey ASTM standards. Also,
thanks to all the workers who helped.
At Ferguson, thanks go to Mike, Wayne, Blake, and Ray who managed to
survive Rob and me. Also, thanks to all the people who made the roadie to San
Marcos to test our beams, Tony, Michele, Anton, Dave, Keith, Brent, and
Jonathan.
Also, Heldenfels is appreciated for letting us run around their precast
plant.
A huge thanks goes to Don Reeves and Texas Industries. Their assistance
has been invaluable to us while we did this project.
Finally, thanks to all the other graduate students who made Ferguson an
enjoyable place to spend my time everyday.
v

May 3,2000
vi

Abstract
Development of High Performance Lightweight Concrete Mixes
for Prestressed Bridge Girders
John Andrew Heffington, M.S.E.
The University of Texas at Austin, 2000
Supervisors: Ned H. Burns and John E. Breen
High performance lightweight concrete allows new options in the use of
prestressed bridge girders. Three iterations of concrete mix designs were
performed to develop two concrete mixes for use, one with psi at 28
days and the other with psi at 28 days. Compressive strength, modulus
of elasticity, tensile strength, and flexural strength tests were carried out on each
of the mixes.
6000' =cf
8000' =cf
Two mixes were chosen which satisfied the specifications. Creep and
shrinkage tests were carried out on both. Also, two 40-foot pretensioned bridge
girders were fabricated from the 6000 psi mix and three 40-foot pretensioned
vii
bridge girders were fabricated from the 8000 psi mix. The 6000 psi mix
performed well in both strength and workability tests, allowing it to be specified
as a 7000 psi mix. The 8000 psi mix performed marginally, not reaching strength
and being difficult to work. It can be specified as a 7500 psi mix.
viii
Table of Contents
List of Tables ........................................................................................................ xiv
List of Figures ..................................................................................................... xvii
List of Figures ..................................................................................................... xvii
Chapter 1: Introduction ........................................................................................... 1
1.1 Basics of Lightweight Concrete ............................................................... 1
1.2 History of Use of Lightweight Concrete .................................................. 3
1.3 Potential Use of Lightweight Concrete in Prestressed Bridge Girders .... 4
1.4 Objectives ................................................................................................. 6
1.5 Scope ........................................................................................................ 8
1.6 Organization of this Report ...................................................................... 8
Chapter 2: Literature Review ................................................................................ 10
2.1 General research on High strength Lightweight Concrete ..................... 10
2.1.1 Martinez Morales (1982) ............................................................ 11
2.1.2 Shideler (1957) ........................................................................... 12
2.1.3 Zhang and Gjørv (1993) ............................................................. 13
2.1.4 Burg, Cichanski, and Hoff (1998) .............................................. 14
2.1.5 Nilsen and Aïtcen (1992) ........................................................... 15
2.1.6 Zhang and Gjørv (1991) ............................................................. 16
2.1.7 Mircea, Ioani, Filip, and Pepenar (1994) ................................... 16
2.1.7 Reichard (1967) .......................................................................... 17
2.2 Performance of Lightweight Concrete in Prestressed Members ............ 18
2.2.1 Lightweight Aggregate Bridge Construction and Performance in Europe .................................................................................... 18
2.2.1.1 Mays and Barnes (1991) ............................................... 18
2.2.1.2 Laamanen (1993) ............................................................ 19
2.2.1.3 Melby, Jordet, and Hansvold (1993) .............................. 20
ix

2.2.1.4 Sandvik (1993) ............................................................... 21
2.2.2 Lightweight Concrete Bridge Performance in United States ..... 21
2.2.2.1 Hanson ............................................................................ 21
2.2.2.2 Jennings and Brewer, Florida Department of Transportation (FDOT,1964) ............................................ 22
2.2.2.3 Murillo, Thomas, and Smith (1994) ............................... 23
2.2.2.4 Vaysburd (1996) ............................................................. 24
2.2.3 Lightweight Concrete Bridge Performance in Texas ................. 26
Chapter 3: Mix Designs ......................................................................................... 28
3.1 First Iteration .......................................................................................... 28
3.1.1 Decisions on Materials to Use .................................................... 28
3.1.1.1 Type of Cement .............................................................. 29
3.1.1.2 Type of Fine Aggregate .................................................. 29
3.1.1.3 Type of Coarse Aggregate .............................................. 30
3.1.1.4 Type of Fly Ash .............................................................. 31
3.1.1.5 Type of Admixtures ....................................................... 31
3.1.2 Initial Variables .......................................................................... 32
3.1.2.1 Water/Cement Ratio ....................................................... 33
3.1.2.2 Amount of Fly Ash ......................................................... 34
3.1.2.3 Coarse Aggregate Factor ................................................ 35
3.1.3 Procedures .................................................................................. 36
3.1.3.1 Preparation of the Aggregate .......................................... 36
3.1.3.2 Production of Concrete ................................................... 37
3.1.4 Initial Results .............................................................................. 39
3.1.4.1 Compressive Strengths ................................................... 40
3.1.4.2 Modulus of Elasticity ..................................................... 45
3.1.4.3 Flexural and Tensile Properties ...................................... 48
3.2 Second Iteration ...................................................................................... 52
x
3.2.1 Modification of Variables .......................................................... 52
3.2.1.1 Water/Cement Ratio ....................................................... 53
3.2.1.2 Coarse Aggregate Factors .............................................. 53
3.2.1.3 Types of Aggregate ........................................................ 54
3.2.2 Procedures .................................................................................. 59
3.2.3 Results ........................................................................................ 61
3.2.3.1 Workability Issues .......................................................... 61
3.2.3.2 Yield Issues .................................................................... 63
3.2.3.3 Mechanical Properties .................................................... 64
3.3 Third Iteration ........................................................................................ 71
3.3.1 Modification of Variables .......................................................... 71
3.3.1.1 Amount of Cement and Water/Cement Ratio ................ 72
3.3.1.2 Chemical Admixtures ..................................................... 73
3.3.2 Procedures .................................................................................. 74
3.3.3 Properties .................................................................................... 74
3.3.3.1 Workability ..................................................................... 74
3.3.3.2 Mechanical Properties .................................................... 76
Chapter 4: 6000 psi Mix ........................................................................................ 82
4.1 Mix Proportions ...................................................................................... 82
4.2 Properties ................................................................................................ 83
4.2.1 Workability ................................................................................. 83
4.2.1.1 Slump ............................................................................. 83
4.2.1.2 Finishability .................................................................... 85
4.2.1.3 Consistency .................................................................... 86
4.2.2 Mechanical Properties ................................................................ 86
4.2.2.1 Compressive Strength .................................................... 87
4.2.2.2 Modulus of Elasticity ..................................................... 88
4.2.2.3 Tensile Strength .............................................................. 90
xi
4.2.3 Creep and Shrinkage .................................................................. 91
4.2.3.1 Creep .............................................................................. 91
4.2.3.2 Shrinkage ........................................................................ 95
4.3 Jobsite Performance ............................................................................... 96
4.3.1 Workability ................................................................................. 97
4.3.2 Compressive Strength .............................................................. 100
4.3.3 Tensile Strength ........................................................................ 102
Chapter 5: 8000 psi Mix ...................................................................................... 105
5.1 Mix Proportions .................................................................................... 105
5.2 Properties .............................................................................................. 106
5.2.1 Workability ............................................................................... 106
5.2.1.1 Slump ........................................................................... 107
5.2.1.2 Finishability .................................................................. 108
5.2.2 Mechanical Properties .............................................................. 108
5.2.2.1 Compressive Strength .................................................. 108
5.2.2.3 Modulus of Elasticity ................................................... 109
5.2.2.3 Split Cylinder Tensile Strength .................................... 112
5.2.2 Creep and Shrinkage ................................................................ 114
5.2.3.1 Creep ............................................................................ 114
5.2.3.2 Shrinkage ...................................................................... 116
5.3 Jobsite Performance ............................................................................. 117
5.3.1 Workability ............................................................................... 117
5.3.2 Compressive Strength .............................................................. 122
5.3.3 Flexural and Split Cylinder Tensile Strength ........................... 123
Chapter 6: Conclusions ....................................................................................... 126
6.1 Summary .............................................................................................. 126
6.2 Conclusions .......................................................................................... 127
6.2.1 6000 psi Mix ............................................................................. 127
xii

6.2.2 8000 psi Mix ............................................................................. 128
6.3 Implementation ..................................................................................... 129
6.4 Recommendations for Future Study ..................................................... 131
Appendix A: Mix Designs ................................................................................... 132
Appendix B: Test Results for Mixes ................................................................... 136
Appendix C: Creep Data Sheets .......................................................................... 143
References ........................................................................................................... 151
Vita .................................................................................................................... 155
xiii
List of Tables
Table 3.1 Water/Cement Ratios and Cementitious Material Amounts for First
Iteration ......................................................................................................... 34
Table 3.2 Test Regimen for Concrete Specimens .................................................. 39
Table 3.3 Water/Cement Ratios for Second Iteration ........................................... 53
Table 3.4 Water/Cement Ratios and Coarse Aggregate/Fine Aggregate
Proportions for Secondary Five Mixes ......................................................... 54
Table 3.5 Average Superplasticizer Dosage Rates for Mixes with Three
Aggregates ..................................................................................................... 62
Table 3.6 Average Yields for Identical Mixes Produced with Three Aggregates . 63
Table 3.7 Amount of Cementitious Material per Cubic Yard for Final Iteration
Mixes ............................................................................................................. 72
Table 3.8 Dosage Rates of Superplasticizer for Third Iteration ........................... 75
Table 4.1 Mix Proportions per Cubic Yard of 6000 psi Mix ................................. 82
Table 4.2 Five Month Creep plus Shrinkage Performance of 6000 psi Mix ......... 94
Table 5.1 Mix Proportions per Cubic Yard for 8000 psi Mix ............................. 105
Table 5.2 Four Month Creep Plus Shrinkage Behavior of 8000 psi Concrete ... 115
Table 5.3 Summary of Workability Results for 8000 psi Mix in Field ................ 118
Table 6.1 Recommended Mix Proportions for 6000 psi Mix .............................. 129
Table 6.2 Recommended Mix Proportions for 7500 psi Mix .............................. 130
xiv
Table A.1 Mix Designs in First Iteration ............................................................ 133
Table A.2 Mix Designs for Second Iteration ....................................................... 134
Table A.3 Mix Designs for Third Iteration .......................................................... 135
Table B.1 Results for Mix Designs in First Iteration .......................................... 137
Table B.1 (cont.) Results for Mix Designs in First Iteration ............................... 138
Table B.2 Results for Mix Designs in Second Iteration ...................................... 139
Table B.2 (cont.) Results for Mix Designs in Second Iteration ........................... 140
Table B.3 Results for Mix Designs in Third Iteration ......................................... 141
Table B.3 (cont.) Results for Mix Designs in Third Iteration ............................. 142
Table C.1 Creep Plus Shrinkage Data for 6000 psi Cylinder #1 Loaded at 2 Days
..................................................................................................................... 144
Table C.2 Creep Plus Shrinkage Data for 6000 psi Cylinder #2 Loaded at 2 Days
..................................................................................................................... 145
Table C.3 Creep Plus Shrinkage Data for 6000 psi Cylinder #1 Loaded at 7 Days
..................................................................................................................... 146
Table C.4 Creep Plus Shrinkage Data for 6000 psi Cylinder #2 Loaded at 7 Days
..................................................................................................................... 147
Table C.5 Creep Plus Shrinkage Data for 8000 psi Cylinder #1 Loaded at 2 Days
..................................................................................................................... 148
xv
Table C.6 Creep Plus Shrinkage Data for 8000 psi Cylinder #2 Loaded at 2 Days
..................................................................................................................... 149
Table C.7 Creep Plus Shrinkage Data for 8000 psi Cylinder #1 Loaded at 7 Days
..................................................................................................................... 150
xvi
List of Figures
Figure 3.1 Aggregate Soaking in Tub Before Drying ........................................... 37
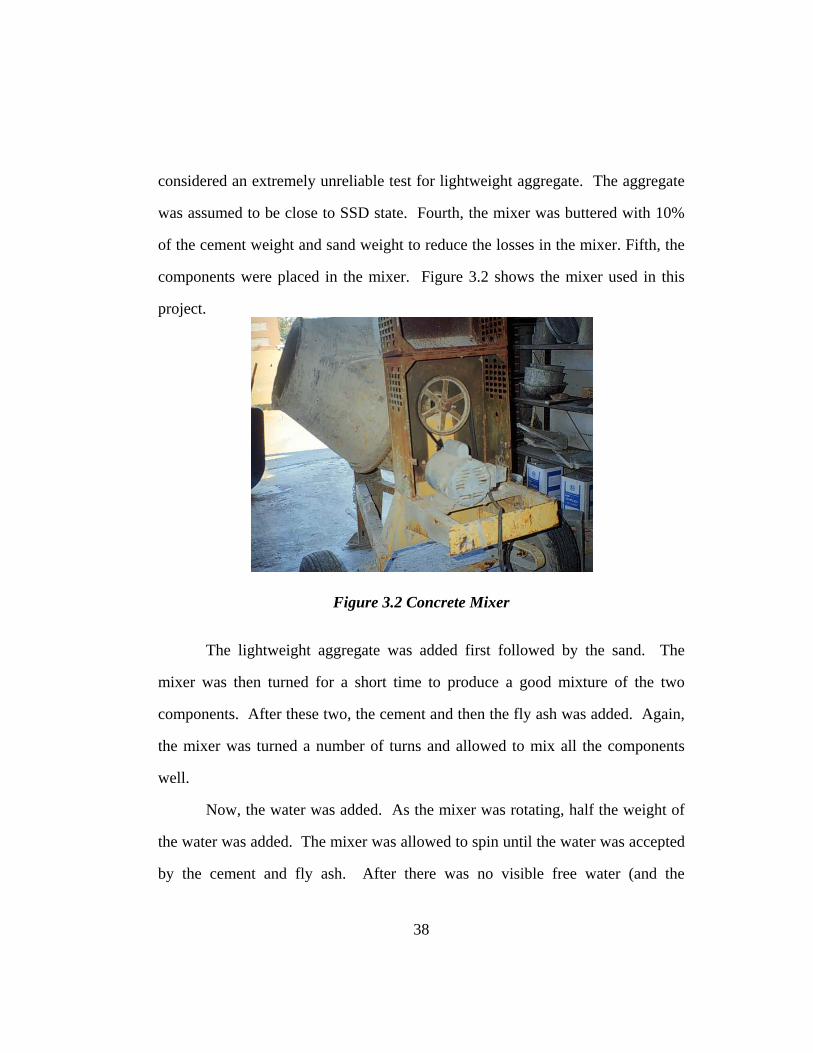
Figure 3.2 Concrete Mixer .................................................................................... 38
Figure 3.3 Apparatus for Compressive Test ......................................................... 40
Figure 3.4 Compressive Strengths of Initial 6000 psi Mixes ................................ 41
Figure 3.5 Compressive Strength of Repeated Mixes in Initial Series .................. 43
Figure 3.6 Compressive Strengths of 8000 psi Concrete Mixes ........................... 44
Figure 3.7 Test Setup for Modulus of Elasticity .................................................... 46
Figure 3.8 Modulus of Elasticity for 6000 psi Mixes in First Iteration ................ 47
Figure 3.9 Modulus of Elasticity of 8000 psi Initial Concrete Mixes ................... 48
Figure 3.10 Test Setup for Splitting Tensile Test .................................................. 49
Figure 3.11 Machine Used for Modulus of Rupture Tests .................................... 49
Figure 3.12 Tensile and Flexural Tests for Initial 6000 psi Mixes ....................... 50
Figure 3.13 Tensile Properties for Initial 8000 psi Mixes .................................... 51
Figure 3.14 Apperance and Maximum Size of Clodine Aggregate ....................... 55
Figure 3.15 Grading Curve for Clodine Aggregate .............................................. 56
Figure 3.16 Appearance and Maximum Size of Streetman Aggregate ................. 57
Figure 3.17 Grading Curve for Streetman Aggregate .......................................... 57
Figure 3.18 Appearance and Maximum Size of Western Aggregate .................... 58
Figure 3.19 Grading Curve for Western Aggregate ............................................. 59
xvii

Figure 3.20 Drying of Aggregate on Screened Bed .............................................. 60
Figure 3.21 Age-Strength Curves for 0.28 Water/Cement Ratio Mixes from
Second Iteration Mix Designs ....................................................................... 65
Figure 3.22 Age-Strength Curves for 0.26 Water/Cement Ratio Mixes from
Second Iteration Mix Designs ....................................................................... 66
Figure 3.23 MOR Results for Mixes from Second Iteration of Mix Designs ........ 67
Figure 3.24 Splitting Tensile Results from Mixes Produced in Second Iteration of
Mix Designs ................................................................................................... 68
Figure 3.25 Weights of the Mixes in Second Iteration of Mix Designs ................. 70
Figure 3.26 Age-Strength Curves for 6000 psi Mixes in Third Iteration .............. 77
Figure 3.27 Age-Strength Curves for 8000 psi Mixes for Third Iteration ............ 78
Figure 3.28 Splitting Tensile Strengths of Mixes in Third Iteration ..................... 79
Figure 3.29 Unit Weights of Mixes from Third Iteration ...................................... 81
Figure 4.1 Sidewinder at Heldenfels Precast Plant .............................................. 84
Figure 4.2 Age-Strength Compressive Strength Relationship for 6000 psi Mix ... 87
Figure 4.3 Comparison of Moduli of Elasticity days for 6000 psi Mix ................ 89
Figure 4.4 Comparison of Splitting Tensile Values for 6000 psi Concrete .......... 91
Figure 4.5 Creep Cylinders ................................................................................... 92
Figure 4.6 Early Age Creep Plus Shrinkage of Cylinders .................................... 93
Figure 4.7 Shrinkage of 6000 psi Mix ................................................................... 95
xviii

xix
Figure 4.8 Slump of First Batch of 6000 psi Concrete ......................................... 98
Figure 4.9 Slump of Second Batch of 6000 psi Concrete ...................................... 99
Figure 4.10 Finish of Girder Made with 6000 psi Mix Concrete ....................... 100
Figure 4.11 Age-Strength Curve of 6000 psi Mix ............................................... 101
Figure 4.12 Comparison of MOR Data for 6000 psi Mix ................................... 103
Figure 4.13 Comparison of Splitting Tensile Data for 6000 psi Mix ................. 104
Figure 5.1 Age-Strength Relationship of 8000 psi Mix ....................................... 109
Figure 5.2 Relation of Moduli of Elasticity Values to Code Values ................... 110
Figure 5.3 Comparison of Modulus of Elasticity for 8000 psi Concrete ............ 111
Figure 5.4 Comparison of 8000 psi Mix Split Tensile Values to Other Studies . 113
Figure 5.5 Creep Plus Shrinkage Behavior of 8000 psi Concrete Mix ............... 115
Figure 5.6 Shrinkage Results for 8000 psi Mix ................................................... 116
Figure 5.7 Slump for First Batch of 8000 psi Concrete ...................................... 118
Figure 5.8 Slump for Second Batch of 8000 psi Concrete .................................. 119
Figure 5.9 Slump for Third Batch of 8000 psi Concrete ..................................... 119
Figure 5.10 Finish of Girder with 8000 psi Concrete Mix ................................. 121
Figure 5.11 Age-Strength Curve for 8000 psi Concrete Used in Beams ............ 122
Figure 5.12 Flexural Strength of 8000 psi Mix Compared to Other Values ...... 124
Figure 5.13 Splitting Tensile Strength of 8000 psi Mix Compared to Other Values
..................................................................................................................... 124

Chapter 1: Introduction
1.1 BASICS OF LIGHTWEIGHT CONCRETE
Concrete plays a large role in each of our everyday lives. As the most
popular material for bridge structures in Texas, it is seen everywhere in the state.
Its combination of superior mechanical properties and inexpensive price
(compared to other materials such as composites) make it a popular material.
Concrete in its most basic form is comprised of four components: cement,
fine aggregate, coarse aggregate, and water. The cement, fine aggregate, and
water combine to form the mortar which binds the coarse aggregate into a
material which takes the shape of the form into which it is poured, hardening into
a very strong solid for a beam or column element in a bridge structure [1].
For these main ingredients, there are some typical choices. For the
cement, a hydraulic gray cement generally is used. Sand is usually the fine
aggregate. The coarse aggregate generally is a river gravel or crushed limestone
depending on the local geology and supply of rock for the concrete. Also,
chemical admixtures can be added to change the fresh and hardened concrete
properties to the engineer’s liking.
Numerous variations and modifications can be made to these simple
ingredients. Admixtures such as silica fume and fly ash can be added in
replacement of cement to provide differing mechanical and chemical properties.
1

Also, lightweight aggregates such as expanded clays and shales can be used in
place of the coarse aggregate.
This thesis is a portion of the Center for Transportation Research (CTR)
Project 0-1852 sponsored by the Texas Department of Transportation (TxDOT)
that focuses on possible applications for high performance lightweight concrete in
bridge girders. Lightweight concrete receives its name because its hardened
weight is 80% or less of the weight of normal weight concrete [2]. Two different
types of lightweight concrete exist: all-lightweight concrete and sand-lightweight
concrete. They differ in the type of fine aggregate used. All-lightweight concrete
uses a lightweight fine aggregate while sand-lightweight uses natural sand as the
fine aggregate.
The majority of the weight savings in lightweight concrete comes from the
coarse aggregate. Lightweight concrete uses aggregate that must be manufactured
or modified in some way. Most lightweight aggregates are expanded clays or
shales. The clay and shale are mined from the ground and then placed in a kiln.
While in the kiln, the clay or shale expands due to the heat. This creates a hard,
porous aggregate which weighs 40-50% less than typical coarse aggregate [1].
This project focuses on the use of high strength lightweight concrete in
pretensioned concrete highway bridge girders. Sand-lightweight concrete was
chosen for the concrete due to its ability to reach higher strengths than the all-
lightweight aggregate [2].
2
1.2 HISTORY OF USE OF LIGHTWEIGHT CONCRETE
Lightweight concrete has been widely used over the last fifty years. One
of its first uses was during World War I, when the United States built
experimental ships out of the material since availability of metal was limited at
that time [3]. Also, the San Francisco-Oakland Bay Bridge used lightweight
concrete in its deck in 1936 [4].
During the 1950s, lightweight concrete grew in popularity [5]. During this
time, many of the original attempts at building structures out of this material were
made. From these attempts, much was learned about the mechanical properties of
lightweight concrete. Furthermore, lightweight concrete proved its usefulness to
structural designers and engineers as a reliable material which could be used in
special situations [1].
The popularity of lightweight concrete grew throughout the 1960s with
many highway departments choosing to try lightweight concrete in various
applications, such as decks and prestressed girders [6]. Its use was temporarily
set back in the energy crisis in the 1970s and 1980s due to the increase in cost of
expanding the aggregate.
At the present time, lightweight concrete has again become a popular
structural material. Many engineers have started to use it as it has proved to be an
economical choice for many jobs where member dead weight is the largest
component of the load to be resisted. Building slabs have become a popular
application for lightweight concrete use.
3

In prestressed construction, production of double tee members for parking
garages often uses lightweight concrete. The reduced weight of lightweight
concrete allows shipment of two members on a truck, reducing costs to the
provider [7].
At the moment, use of lightweight concrete is generally restricted to
applications where a large mass of concrete is needed but where structural
demands in flexure and shear are fairly low. Use of lightweight concrete in other
applications has been minimal.
1.3 POTENTIAL USE OF LIGHTWEIGHT CONCRETE IN PRESTRESSED BRIDGE GIRDERS
Within the last few years, high performance concrete has grown in
popularity in the materials world. Due to improvements in concrete technology
made possible by advanced admixtures, substantially more strength and durability
characteristics are being demanded of concrete. This high performance concrete,
which generally includes high strength concrete, has been utilized in many
different applications [8].
Recently, a project was undertaken at The University of Texas at Austin
where very high strength normal weight concrete mixes ranging from 6000 psi to
15000 psi were developed for prestressed concrete bridge girders [9]. The bridge
girders were actually produced in regional casting yards and placed into service in
a couple of bridges in Texas [10]. I-shaped girders were produced for a bridge in
4
San Angelo while U-shaped girders ware produced for an overpass in Houston.
The performance of these bridges has been excellent. The use of higher strength
concrete has allowed the use of fewer girders in each span, increasing the
economy of these projects.
These successes led to the question of whether high strength, high
performance lightweight concrete could be used for prestressed girders in Texas.
The success of the high performance normal weight concrete girders indicated
that use of high performance lightweight concrete might be feasible.
Experience with lightweight concrete bridge girders has been minimal.
Quite a few bridges have been constructed using lightweight concrete. However,
usage has generally been restricted to the deck. A couple of bridges have been
constructed of all lightweight concrete but these generally were of lower strength
concrete and did not focus on high strength, high performance lightweight
concrete.
There are numerous reasons that justify a serious look at high strength,
high performance lightweight concrete for bridge girders. First is the obvious
reduction in weight. A 20% reduction in weight allows a smaller section to be
used since dead weight demand has been significantly reduced. If a smaller
section is not chosen, a longer span can be used [1]. Lightweight concrete girders
are well suited for use in applications where spans must be long due to restrictions
on the placement of supports. The second advantage is the higher strength.
Higher strength concrete also allows a smaller section to be used. However, since
sections are standardized according to the American Association of State
5

Highway Transportation Officials (AASHTO) geometries, a higher compressive
strength concrete will allow girders to be used at a larger spacing per span,
reducing the number of girders. Use of fewer girders usually means a reduction
in cost, resulting in a lower cost project. However, it must be noted that the
higher compressive strength of the girders is created with the use of more cement
per cubic yard. Therefore, the girders will cost more per linear foot than the
average normal weight concrete girder with the same strength. This increase in
cost needs to be balanced with the decrease in cost due to the use of fewer girders
at longer spans and spacings to determine what is the most efficient.
As is obvious, prestressed girders made of high strength, high performance
concrete hold a lot of possible advantages over normal weight concrete.
However, their feasibility must still be proven.
1.4 OBJECTIVES
The main objective of this portion of Project 0-1852 was to determine
whether high strength high performance lightweight concrete mix designs could
be developed with = 6000 psi and = 8000 psi for use in prestressed concrete
girders. Also, the equilibrium unit weight needed to be not more than 122 pounds
per cubic foot (pcf). The equilibrium unit weight is the weight of the concrete at
ambient conditions after the concrete has been allowed to shed water [2]. To
determine this, a variety of tasks were undertaken:
'cf '
cf
6

a) Literature discussing high strength lightweight concrete was located
and evaluated. Of most interest was literature that investigated the use of
lightweight concrete in precast bridges using an expanded clay or shale aggregate.
It was hoped that this literature would give a general idea of possible mix designs
along with possible expectations for the lightweight concrete and its performance.
Also, hopefully, this literature would show the approximate difficulty of
developing high strength concrete mixes.
b) Previous use of lightweight concrete in Texas was studied. Since
this project was sponsored by the Texas Department of Transportation (TxDOT),
it was natural to see whether TxDOT had used lightweight concrete and how well
the concrete had performed in the state. This research would give a good idea of
the characteristics of Texas lightweight concrete.
c) Two mix designs were to be developed for use in prestressed
bridge girders. These mixes were to have the following characteristics:
Both mixes should use 1/2 to 3/4 inch maximum size commercially
available aggregate within the state of Texas. Also, both mixes should have a
equilibrium unit weight not more than 122 pound per cubic foot (pcf).
One mix should have a 28 or 56 day compressive strength of 6000 psi and
the other should have a 28 or 56 day compressive strength of 8000 psi. Both
should achieve 3500 psi in 24 to 48 hours to permit early release in pretensioning
applications. Also, the tensile behavior of both mixes should be obtained along
with the creep and shrinkage behavior. These tests would give the full
documentation of the important design properties of the concrete mix.
7
d) The concrete should be workable enough for reasonable placement
in pretensioned girder forms.
1.5 SCOPE
The research undertaken during this portion of Project 0-1852 was
concerned with developing and refining of two concrete mixes for use in
prestressed concrete girders. To accomplish this, a total of 35 concrete mixes
were created and fabricated in the laboratory of the Construction Materials
Research Group at The University of Texas at Austin.
Tests were performed on specimens of these mixes to determine the
compressive strength, modulus of elasticity, and tensile strength. The unit weight
was also measured. These tests gave a good understanding of the behavior of
these lightweight concretes.
Then, when the most promising concrete mixes were determined, creep
and shrinkage specimens were created and tested to ascertain the creep and
shrinkage behavior of the two concrete mixes used for fabrication of precast
prestressed concrete beams which were tested at Ferguson Structural Engineering
Laboratory at The University of Texas at Austin.
1.6 ORGANIZATION OF THIS REPORT
This report is divided into six chapters.
8
The first chapter gives a general background of lightweight concrete as
well as the reasons for performing this study. Furthermore, the objectives of the
study are defined as well as the scope.
The second chapter provides a review of the pertinent literature regarding
high strength high performance lightweight concrete. Also, reports dealing with
the use of lightweight concrete in bridges are summarized.
The third chapter documents the iteratative process used to arrive at the
final two mixes specified for lightweight concrete with ' = 6000 psi and ' =
8000 psi strengths. The procedures used as well as the results from each portion
of the study are given and discussed. Also, the thought process of how the two
concrete mixes were chosen is given.
cf cf
The fourth chapter documents the behavior of the 6000 psi mix. All
pertinent mechanical properties are given and discussed along with the mix
design.
The fifth chapter documents the behavior of the 8000 psi mix. Similar to
Chapter 4, this chapter gives the pertinent mechanical properties along with the
mix design.
The sixth and final chapter summarizes the research and gives the
specifications for the two final mixes. The conclusions are presented here along
with possible implementation guidelines. Furthermore, recommended topics for
possible future research are presented.
9
Chapter 2: Literature Review
To gain perspective on the use of lightweight concrete around the world,
available literature from The University of Texas at Austin library as well as from
a Texas Industries, Incorporated (TxI) collection of items was reviewed. This
literature provided an overview of previous work done on lightweight concrete as
well as its uses in prestressed bridge girders.
2.1 GENERAL RESEARCH ON HIGH STRENGTH LIGHTWEIGHT CONCRETE
Lightweight concrete has been used for various applications in many
states. However, much recent research has focused on high performance
concrete, which includes high strength concrete. This research has progressed as
normal weight concrete has also been pushed to achieve new standards of strength
and workability. Also, new developments in petroleum platform construction
have further shaped the development and understanding of these concrete
mixtures. Following is a discussion of papers on the development of high
strength lightweight concrete as well as the mechanical properties and workability
aspects. The focus will be on mixes developed using expanded clays as the
coarse aggregate.
10
2.1.1 Martinez Morales (1982) [2]
This study, performed at Cornell University, was one of the first studies
that looked at the mechanical properties of lightweight concrete in depth. They
tested three different types of lightweight concrete, low strength with < 4000
psi, moderate strength with 4000 psi < < 6000 psi, and high strength with
> 6000 psi. Due to the focus of this report, only results from the high strength
concrete mixes will be presented.
'cf
'cf '
cf
The concrete developed in their study utilized Type I cement and also used
all lightweight aggregate, which differed somewhat from the conditions seen in
the current study. The amount of cement was 10 sacks per yard (945 pounds),
similar to the final total cementitious material for the 8000 psi concrete developed
later in the current project.
The following tests were performed on the concrete mixes: compressive
strength, modulus of elasticity, modulus of rupture, and splitting tensile strength.
For compressive strength, their concrete averaged approximately 8000 psi.
The high strength lightweight concrete also exhibited a faster strength gain than
did the other varieties of concrete. 3500 psi was achieved at one day of age. The
modulus of elasticity ranged from 2,500,000 to 3,000,0000 psi for all the
cylinders tested.
Modulus of rupture values averaged around 800 psi for moist cured
condition and 430 psi for dry cured conditions. This showed the importance of
keeping specimens wet before testing, along with the importance of moist curing
11

on tensile strength. Splitting tensile results averaged 560 psi for wet cured and
365 psi for dry cured specimens.
Also, the authors proposed various curve fit expressions for static modulus
of elasticity, modulus of rupture, and splitting tensile strength to complement
accepted AASHTO equations [12]. Following are the Martinez expressions along
with the companion AASHTO expression:
For modulus of elasticity, Martinez 5.1' )145/)(100000040000( ccc wfE += Equation 2.1
AASHTO '5.133 ccc fwE = Equation 2.2
(The AASHTO equation is AASHTO Equation 8.7.1 [12].)
For modulus of rupture, Martinez '5.6 cr ff = Equation 2.3
AASHTO '3.6 cr ff = Equation 2.4
(The AASHTO equation is from AASHTO 8.15.2.1.1 [12].)
For splitting tensile strength, Martinez '' 5 csp ff = Equation 2.5
AASHTO '' 5 csp ff = Equation 2.6
(The AASHTO equation is arrived at indirectly from AASHTO 8.15.5.2.4
[12].)
2.1.2 Shideler (1957) [5]
Shideler presented one of the first comprehensive studies on lightweight
concrete. He tested both normal strength and high strength concrete. The high
12

strength concrete had psi. He tested for compressive strength,
modulus of elasticity, creep, drying shrinkage, bond, and flexural strength. Eight
lightweight aggregates were used in the testing.
7000' >cf
Shideler found he could produce concrete with psi using an
expanded clay. He was able to exceed 3500 psi at 2 days using this aggregate.
Also, he found the modulus of elasticity to be between 2,000,000 psi and
3,000,000 psi for high strength concrete using expanded clay depending on
whether the concrete was wet or dry.
8000' >cf
Modulus of rupture was 600 psi at 28 days for the expanded clay
aggregate. He also found that creep of the various lightweight concrete was
greater than creep for comparable normal weight concrete.
Overall, Shideler found that performance of the lightweight concrete was
good and structural grade concrete could be produced with each of the aggregates
he tested.
2.1.3 Zhang and Gjørv (1993) [13]
Lightweight aggregate has been often in Norway due to its use in offshore
oil platforms. Zhang and Gjørv have studied some of this lightweight concrete.
They developed nine lightweight concrete mixes for use. They utilized
silica fume as the pozzolanic admixture. The worst performing concrete still
achieved a compressive strength of 8310 psi at 28 days. All mixes were 6000 psi
by 3 days.
13
Zhang and Gjørv hypothesized that the lightweight aggregate strength
control maximum strength of the mix. The cement content, silica fume, and sand
have lesser effects.
2.1.4 Burg, Cichanski, and Hoff (1998) [14]
Since lightweight concrete has often been used in offshore oil platforms,
some high strength lightweight mixes have been developed. Burg, et al were able
to develop one using just cement and fly ash as the cementitious material.
The mix contained 700 lbs of cement and 200 lbs of fly ash per cubic yard
of concrete. The fine aggregate was natural sand. The mix achieved a strength of
8500 psi at 90 days. At three days, the concrete had an approximate strength of
6800 psi. Although it is not noted explicitly in the paper, the concrete apparently
achieved a strength above 3500 psi at one day of age.
As for other properties, the concrete had a modulus of elasticity of
4,000,000-4,500,000 psi at 90 days. The authors evaluated both Equations 2.1
and 2.2 with the data and verified that Equation 2.1 was the better fit for the
modulus of elasticity data.
The splitting strength was between 250 and 500 psi for dry curing and
500-700 psi for moist curing, which exceeded Equation 2.4.
Also, the permeability of the concrete was rated as moderate. When the
authors compared the value to one from normal weight concrete, the permeability
was nearly the same. From this data, the authors concluded that this particular
14
mix was suitable for the arctic environment for which they were designing the
mix.
2.1.5 Nilsen and Aïtcen (1992) [15]
Nilsen and Aïtcen looked at the properties of high strength concrete
containing various types of aggregates. In this current report, the results for
concrete with lightweight aggregate will be the focus.
The lightweight concrete was made with an expanded shale for the coarse
aggregate and natural sand for the fine aggregate. Silica fume was used as an
admixture to help produce the strength that was needed. Also, Type III Portland
cement was used. The two mixes performed produced concrete with compressive
strengths of 13100 and 10700 psi, respectively at 28 days of age. Also, both
concretes attained 8500 psi and 7000 psi at one day of age, well more than the
3500 psi needed for the current project.
They found that the AASHTO code Equation 8.7.1 [12] (Equation 2.2 in
this report) for lightweight concrete modulus of elasticity underestimated the
modulus of elasticity, a finding that agrees with previous research by Martinez.
As for drying shrinkage, lightweight concrete performed similarly to
normal weight concrete. No advantage could be seen to either one of the two
concretes.
15

2.1.6 Zhang and Gjørv (1991) [16]
Zhang and Gjørv also produced another paper dealing with the properties
of high strength lightweight concrete.
This paper dealt with many of the same mixes that were discussed in
Section 2.1.2. However, this paper had a different focus than the earlier one.
The conclusions of interest were:
a) The ratio of tensile strength to compressive strength in lightweight
concrete is less than the same ratio in normal weight concrete.
b) The strength of the lightweight aggregate is the primary factor
controlling the strength of high strength lightweight concrete.
2.1.7 Mircea, Ioani, Filip, and Pepenar (1994) [17]
Along with the mechanical properties of strength, modulus of elasticity,
and tensile strength, the durability of lightweight concrete must be understood.
The authors tested 260 reinforced and prestressed beams under different
aggressive environments for durability. The beams were made of both
lightweight and normal weight concrete and were precracked.
The beams were then placed in various environments and allowed to sit
for ten years. After ten years, the beams were analyzed and loaded to failure to
see if they maintained their strength.
The conclusions were that the lightweight concrete performed as well as
the normal weight concrete. The density of the lightweight concrete decreased
2.2% while the normal weight companion tests decreased 2.0%. Also, both mixes
16
of concrete increased in modulus of elasticity with the lightweight gaining 12%
while the normal weight gained 25%. For the strength, the lightweight concrete
increased 17-25% while the normal weight gained 7-15%. Overall, the results
were similar with neither concrete performing poorly.
Also, higher cement contents generally proved to reduce the size of the
cracking inside the beams. Since high cement contents generally portend higher
strength concrete, this means that the higher strength beams were able to resist
crack growth better.
2.1.7 Reichard (1967) [18]
Reichard published one of the first studies on creep and shrinkage of
lightweight aggregate concrete. His work is still the basis for the lightweight
concrete creep and shrinkage recommendation by ACI Committee 213 [33].
Reichard found that shrinkage of lightweight aggregate concrete ranged
from 0.02% to 0.08% of the total length at 90 days. The average was
approximately 0.05%. At 2 years, the shrinkage ranged from 0.04% to 0.09%
with an average approximately 0.07%. Lightweight concrete generally plateaued
around 150 days of age. Very little drying shrinkage would occur after this time
period.
Reichard also tested creep and shrinkage together. For this behavior, he
found that it ranged from 0.06% to 0.14% of the total length at 90 days. At 2
years, the creep ranged from 0.09% to 0.22%. The average at 2 years was
approximately 0.16% of the total length.
17

Reichard also showed that creep plus shrinkage increased as cement
content was increased. It was approximately linear, with the creep plus shrinkage
equaling 0.28% of the total length at 1 year for cement contents of 700 pounds per
cubic yard, a similar amount to that expected in the current project.
2.2 PERFORMANCE OF LIGHTWEIGHT CONCRETE IN PRESTRESSED MEMBERS
Lightweight concrete has been used in bridges around the world.
Different parts of the bridge structure have been fabricated with lightweight
concrete. Results have been mixed.
2.2.1 Lightweight Aggregate Bridge Construction and Performance in Europe
European countries and especially Norway have built many bridges with
lightweight concrete. They have had success with the material. Following are
some examples.
2.2.1.1 Mays and Barnes (1991) [19]
Mays and Barnes looked at the performance of many lightweight concrete
structures in the United Kingdom. Of most interest is their discussion of
lightweight concrete bridge structures in place.
18
Overall, the structures were all in good shape. They showed some wear
and tear, but when compared to adjacent normal weight concrete structures built
at about the same time, the lightweight concrete structures actually outperformed
the normal weight structures. Also, measured chloride levels in the lightweight
concrete were lower at larger depths than in normal weight concrete structures.
The performance was satisfactory for all the bridge structures.
2.2.1.2 Laamanen (1993) [20]
In his report, Laamanen discusses the Sundbru bridge in Eidsvoll, Norway
which used high strength lightweight concrete. The bridge, built in 1991-1992,
utilized natural sand and lightweight aggregate Leca, an expanded clay.
Overall performance of the concrete in the bridge was excellent. The
compressive strength of the concrete averaged to 9700 psi at 28 days, achieved
with the use of silica fume as an admixture. The modulus of elasticity was
3,080,000 at psi at 28 days. The weight of the concrete averaged between 115
pounds per cubic foot (pcf) and 118 pcf for the equilibrium unit weight.
Measured chloride and freeze-thaw resistance indicated that the concrete
performed as well as comparable normal weight concrete. Overall, the
performance of this bridge was a success.
19
2.2.1.3 Melby, Jordet, and Hansvold (1993) [21]
In 1988, Norway introduced a new standard for design of concrete
structures with higher limits for concrete strength. This new standard encouraged
designers to use higher strength concrete in their structures.
Since high strength lightweight concrete had become a viable option due
to the introduction of water-reducing admixtures and silica fumes, designers
chose it for two bridges in Norway, Sandhornøya and Støvset.
Both bridges were long-span cantilever bridges. Sandhornøya had a
midspan of 505 ft and was the first bridge in Norway where lightweight concrete
was used in the superstructure.
The concrete performed satisfactorily. The strength was adequate (no
exact values given) while the modulus of elasticity was 3,260,000 psi at 28 days,
larger than usual for lightweight concrete. After five years, the concrete was
inspected for its performance. The structural state of the bridge was good with
some cracking. It was theorized by the authors that the cracking was caused by
the inferior curing conditions faced by the bridge. Specifically, the bridge was
cured in low temperatures in the middle of the winter. Also, the concrete proved
to be very resistant to chloride penetration.
Overall, the lightweight concrete proved to be economical for use in long-
span bridges. The author concluded that as long as steps are taken to monitor the
bridge since durability of lightweight concrete is not fully understood, then
lightweight concrete makes a good choice for a bridge material.
20
2.2.1.4 Sandvik (1993) [22]
Sandvik provided an overview of bridges built in Norway with lightweight
concrete since 1987. Eight bridges had been constructed using high strength
lightweight aggregate concrete. All are found in marine environment. Some of
the bridges included in his study are also found in the previous papers of fellow
Norwegians.
Overall, Sandvik found the use of high strength lightweight concrete to be
minimal due to the unfamiliarity of designers with the material. However, in
those bridges where it was used, the performance has been comparable to that of
the normal weight concrete with no major problems reported with any of the
bridges.
2.2.2 Lightweight Concrete Bridge Performance in United States
Lightweight concrete has been widely used in bridges in the United States
since the 1960s. Most experiences have been good as lightweight concrete has
performed similarly to normal weight concrete.
2.2.2.1 Hanson [23]
Hanson wrote an early paper discussing the use of lightweight concrete for
prestressed concrete construction. He focused on the expanded shale aggregate
which was available in the Rocky Mountain area.
21

The main advantages of lightweight concrete, Hanson concluded, were the
ability to produce smaller sections due to the decrease in weight of the concrete.
Also, another advantage was the decreased transportation cost, as a lower weight
will allow more units to be placed on a truck for transfer.
However, substantial attention was focused on the strength of the concrete.
Due to the desire of precast manufacturers to release their forms in one day, a
concrete mix must be developed which has sufficient strength at one day to allow
for release. Also, Hanson suggests that a lightweight concrete mix must also have
an adequate modulus of elasticity, as this will help reduce camber of the unit, a
significant problem with lightweight concrete prestressed members.
2.2.2.2 Jennings and Brewer, Florida Department of Transportation (FDOT,1964) [6]
One of the first documented experiences with lightweight concrete in the
United States is from FDOT. FDOT faced a problem in that it wanted to replace a
steel truss bridge which spanned 120 feet. They wanted to continue to use the
bridge but replace the structure with prestressed concrete. The 120 foot span was
considered to be too long for typical normal weight concrete prestressed girder
construction. Therefore, it was decided to try lightweight concrete for the
substructure, superstructure, and deck.
In the bridge, the girders were American Association of State Highway
Transportation Officials (AASHTO) Type IV girders. Six girders supported each
span of a 28 foot wide deck.
22
The lightweight aggregate used was Solite, an expanded clay. The
specification for the lightweight concrete was that it had to have an equilibrium
unit weight less than 120 pcf. The concrete performed well above minimum
standards. The prestressed girder concrete tested at 6500 psi at 28 days.
Although release strengths are not mentioned, it is noted that the concrete checked
out well above the minimum design strengths. The deck concrete tested at 4000
psi at 7 and 5000 psi at 28 days.
The biggest problem encountered during the construction of this bridge
was the variation in moisture condition of the coarse aggregate. Florida officials
chose to handle this problem by sprinkling the stockpiled aggregate for 24 hours
prior to production of the concrete.
2.2.2.3 Murillo, Thomas, and Smith (1994) [24]
Another advantage of lightweight concrete for segmental bridges is in the
seismic area. Lightweight concrete can alleviate two problems faced by normal
weight segmental concrete bridges; the lateral forces induced by ground motions
which shake the foundations of elevated superstructures and the out-of-phase
oscillations of the superstructure.
Their paper discussed the choice of lightweight concrete for a 1.2 mile
long bridge located in California between the cities of Benicia and Martinez. The
bridge has been designed to withstand a 7.3 magnitude earthquake on the Richter
scale.
23
The lightweight concrete box girder bridge turned out to be the most
economical bridge of the four surveyed, costing $8 to $42 million less than the
others. The concrete chosen had natural sand as the fine aggregate and an
expanded shale as the coarse aggregate. The spans were 528 feet in the center and
335 feet on the ends.
Increasing the prestress placed into the girders, thereby increasing the
camber, combatted the reduced modulus of elasticity of the lightweight concrete.
Also, the box girders are prestressed longitudinally, transversely, and vertically.
This three-dimensional prestressing provided for a relatively crack-free structure.
Overall, performance of the bridge was expected to be more than
adequate, providing increased seismic resistance for a smaller cost.
2.2.2.4 Vaysburd (1996) [4]
In his article in Concrete International, Vaysburd looked at durability of
lightweight concrete structures. By comparing the mechanical properties of
lightweight concrete to normal weight concrete, he found that lightweight
concrete actually should perform better than normal weight concrete in resisting
crack formation.
Vaysburd found that the lower modulus of elasticity, higher drying
shrinkage, and and higher creep values of lightweight concrete compared to
normal weight concrete gave lightweight concrete the ability to sustain greater
tensile strains. Because of this, the lightweight concrete actually would have
24

more crack resistance. Also, tests have shown that lightweight concrete has lower
permeability values than comparable normal weight concrete.
Furthermore, lightweight concrete generally has more cement per cubic
yard than normal weight concrete. Therefore, this delays the carbonation and
steel depassivation (the start of corrosion) by having more calcium hydroxide
available.
To back these findings, Vaysburd looked at two bridges which used
lightweight concrete in their decks in the United States. The first example, the
William Preston Lane, Jr. Memorial Bridge in Maryland was constructed in 1952
with an expanded shale deck. An inspection in 1975 showed that the lightweight
concrete had outperformed the normal weight concrete in the bridge. Therefore,
the remaining normal weight decks were replaced with lightweight concrete.
Also, The San Francisco-Oakland Bay Bridge was constructed in 1936 with an
expanded shale deck while the lower deck of the bridge was reconstructed with an
expanded shale deck in the early 1960s. The lightweight decks showed some
chloride contamination in the top inch of the exposed surfaces. However, the
chloride levels at the steel layer had not reached a worrisome level. On the other
hand, the parts of the bridge using normal weight concrete were in need of
replacement due to spalling.
25

2.2.3 Lightweight Concrete Bridge Performance in Texas
From internal information provided by the Texas Department of
Transportation (TxDOT), use of lightweight concrete in Texas bridges has been
fairly minimal. Most, if not all, of the experience with lightweight concrete has
been limited to use in decks.
Typical of the use of lightweight concrete is its use in the Rainbow Bridge
over the Neches River. The width of the deck needed to be expanded to meet
specifications. However, engineers did not want to increase the dead load on the
structure. Therefore, lightweight concrete was chosen since it allowed engineers
to obtain the width of the deck they wanted without increasing dead load.
Overall, performance of lightweight concrete has been comparable to that
of normalweight concrete. Most of the elements constructed of lightweight
concrete are rated at 6 or 7 on the BRINSAP scale, meaning satisfactory
performance with some signs of wear.
Perhaps the worst performance came in the Pierce Elevated in Houston.
Lightweight concrete was used in the deck and had terrible performance. There
were large problems with spalling and cracking of the deck. However, it has been
speculated that these problems with performance grew out of bad construction
practices. Investigations showed that the concrete was constructed without the
minimum cover needed for pretection of the steel bars from corrosion. Therefore,
the bars corroded and spalled, cracking the concrete.
26
Otherwise, overall performance of lightweight concrete in Texas has been
good. Whenever suitable construction practices have been followed, lightweight
concrete has proved to be an appropriate choice of material.
27
Chapter 3: Mix Designs
3.1 FIRST ITERATION
In order to produce concrete with the proper specifications for the project,
many different mix designs had to be created and tested. The initial mix designs
were chosen to provide a wide variety of materials and amounts. It was planned
that later mix designs would focus on refining specific promising mixes.
Also, these initial iterations provided a chance to practice using the
lightweight aggregate. Lightweight aggregate requires different preparation
procedures than typical aggregates such as crushed limestone and river gravel due
to the high moisture amounts that lightweight aggregates absorb.
Therefore, these initial mix designs served two purposes. First, they gave
the approximate mix proportions for use in the project and second, they helped the
project staff learn the appropriate methods for mixing lightweight concrete.
3.1.1 Decisions on Materials to Use
Concrete is comprised of four distinct components: cementitious materials
(includes cement and/or pozzolonic admixtures), coarse aggregate, fine aggregate,
and water. However, in these basic categories, a multitude of options exist from
which the materials can be chosen.
However, a couple of general rules guided the process. First, the materials
had to be widely available inside the state of Texas. Precast operators, the people
who eventually would utilize the mix designs, must be able to obtain the
28
aggregates in a timely manner. Second, the mix designs needed to be as simple as
possible. Therefore, exotic admixtures or materials that are not familiar to
precasters should not be used. These mixes also needed to be easily reproducible.
3.1.1.1 Type of Cement
Since this lightweight concrete was being used in a precast environment,
high early-strength values were necessary so that the strands could be released in
approximately 24 hours. The precast plant where the beams for this project were
fabricated requires that concrete be at least 3500 psi before release of strands.
Because of these early high strength requirements, Type III cement was chosen.
Type III cement is the typical cement used in precast plants due to its high
strength gain at early ages.
Many cement manufacturers exist around Central Texas. However, only
one company makes Type III cement and packages it in small enough quantities
for laboratory use. Therefore, the Alamo Cement plant north of San Antonio
provided the cement for the laboratory mix designs in this project. The brand
name of the cement was Alamo Red Bag. Alamo provides much of the cement
for the precast plants around Central Texas.
3.1.1.2 Type of Fine Aggregate
Since the concrete was required to have an equilibrium unit weight no
more than122 pcf, this allowed the use of sand as the fine aggregate of choice. It
29
was felt that a fine aggregate made up of lightweight materials would not provide
the performance needed to reach the high strength specifications. Since a sand-
lightweight concrete easily fell within the weight specifications, sand became the
lightweight fine aggregate of choice.
The sand used in the early stages of the project was Colorado River sand
from Capital Aggregates. Midway through the project, a new shipment of sand
was obtained. Due to a sand shortage in the Austin area, a new supplier was
located, suggested by Capital Aggregates. The sand from the new supplier was
also Colorado River sand, similar to the earlier type.
3.1.1.3 Type of Coarse Aggregate
Once again, availability of aggregates constrained the choices for
lightweight aggregates. In the state of Texas at the present time, apparently only
one company produces lightweight aggregate, Texas Industries, Inc. (TxI). They
produce two separate lightweight aggregates, Clodine and Streetman. Clodine is
an expanded clay while Streetman is an expanded shale. Discussions with
CoreSlab Industries, a precast manufacturer of double-tee members for parking
garages, showed that they used Streetman for use in manufacture of double-tee
members. However, use of Clodine is also widespread in manufacture of
lightweight concrete and slabs.
From these two choices, Clodine was available to us from a local ready-
mix concrete plant, Rainbow Industries. They were willing to provide small
amounts of aggregate at any time when needed. The aggregate had a maximum
30

size of 3/4 inch and was well-graded. Therefore, Clodine was used as the initial
lightweight aggregate.
3.1.1.4 Type of Fly Ash
A Class C fly ash was used in all the mixes that utilized fly ash. Fly ash
was used due to the excellent permeability characteristics of concrete
incorporating fly ash. The fly ash was also obtained from Rainbow Industries as
they again were willing to contribute fly ash to the project.
Class C fly ash was chosen due to its widespread availability in Texas.
Also, its ability to aid in the formation of late-age strength was desirable since
Type III cement generally slows in its late-age strength production compared to
Type I cement.
3.1.1.5 Type of Admixtures
A major concern was the workability of the concrete. Since these specific
mixes of concrete needed to be used in a precast environment, this concrete
needed to have a large slump.
Generally, large slumps are achieved in concrete through the use of more
water in the mix. However, more water in a mix reduces the strength. Therefore,
admixtures were chosen to produce the necessary slump to cast these beams.
The admixtures needed to serve two purposes. Due to the large amount of
cement expected in these initial mixes, these mixes have a higher temperature
31
than normal mixes. With an increased temperature, the concrete would
experience rapid slump loss. Therefore, a retardant would be needed to slow
down the set times. Since the laboratory had access to Daratard-17 by Grace, this
was the retardant chosen.
The second purpose was to produce the slump needed for these mix
designs. Again, due to the large amount of cement, small slumps were expected.
Therefore, a superplasticizer was needed to increase the slump to the target of 7 to
9 inches. ADVA Superflow was the choice. Again, this can be attributed to its
ready availability.
Both these admixtures are widely available throughout Texas from Grace.
Many precast plants around Austin use Grace admixtures.
3.1.2 Initial Variables
After the initial decisions about which materials would be used,
proportions had to be decided. To do this, existing literature was reviewed to
provide some ideas about possible proportions for high strength mixes. Also,
local precasters were contacted to determine any possible high strength
lightweight mixes that they used. A local precaster used a blended coarse
aggregate with crushed limestone and lightweight aggregate [6]. However, use of
this was ruled out because the mix was too heavy.
Furthermore, most literature indicated that silica fume was a key
admixture in creating high strength concrete. However, it had been decided not to
use silica fume due to its high cost and low availability compared to fly ash.
32
Therefore, most of the first mixes were based on prior experiences. Consultation
with Dr. Ramon Carrasquillo provided the mixes developed for the first part of
the project.
The mix designs for all the mixes are presented in Appendix A of this
paper.
3.1.2.1 Water/Cement Ratio
Although water/cement ratio does not play as large a role in strength in
lightweight concrete as it does in normal weight concrete, it still is a significant
quantity. Due to its widespread use in the field of concrete design and its
familiarity to most people in the field, it is a convenient measure for controlling
concrete strength since it usually gives a rough idea of the resultant compressive
strength of the concrete.
For these initial mixes, prior experience and previous literature provided a
guide to initial values of the water/cement ratio. From these, values in the range
of 0.30 to 0.35 were chosen. Obviously, workability is a prime issue. Therefore,
the water/cement ratios needed to be as large as possible to maximize workability
and minimize use of superplasticizer. Table 3.1 presents the water/cement ratios
used in the first portion of this project.
33

Table 3.1 Water/Cement Ratios and Cementitious Material Amounts for First Iteration
Mix Number
Water/Cement Ratio
Pounds Cementitious Material/Cubic Yard
1 0.35 600 2 0.35 600 3 0.35 600 4 0.35 600 5 0.35 600 6 0.35 600 7 0.35 600 8 0.35 600
H-1 0.32 800 H-2 0.32 800 H-3 0.32 800 H-4 0.32 800
3.1.2.2 Amount of Fly Ash
Using fly ash was not a foregone conclusion in these mixes. Prior
documentation [37] has shown that fly ash reduces early-age strength of concrete
significantly. Since one of the main emphases of these concrete mixes was to
obtain high early-age strength, fly ash could have created a problem.
Therefore, these initial mixes were made both with fly ash and without fly
ash. The proportion was chosen to be 25% replacement with fly ash by weight of
cement.
34

3.1.2.3 Coarse Aggregate Factor
Another goal of these early mixes was to ascertain the amount of coarse
aggregate that is needed to produce a workable mix and the required proportion
between the sand and lightweight aggregate. In normal weight high strength
concrete made with crushed limestone or river gravel, the concrete gains a
significant portion of its strength from the aggregate. However, in lightweight
concrete, the aggregate does not contribute significantly to the strength. Although
very weak aggregate could detract from the strength, increasing the amount of
lightweight aggregate in the matrix does not effectively increase the strength or
the stiffness.
Due to this reason, workability became the main concern when
proportioning the coarse aggregate. The proper proportion between coarse and
fine aggregate had to be found in order to give the proper finishing characteristics
and adequate slump. Also, since sand serves as a binder in concrete, there had to
be an ample amount to hold the concrete together.
For these initial mixes, two separate proportions were chosen for the
coarse aggregate and the sand. It was hoped that these two proportions would
provide the extreme range on the possible behavior. In other words, one mix
would have about the maximum amount of sand (making it “sandy”) that could be
used before the concrete would become too sticky while the other would have the
maximum amount of lightweight aggregate (making the mix “rocky” or “coarse”).
35
3.1.3 Procedures
For production of the concrete, ASTM procedures were followed. This
was done in order to have the best possible comparison between previously
published data and the data in this project.
3.1.3.1 Preparation of the Aggregate
The aggregate presented the most difficulties during the mixing of the
concrete. Most users of lightweight aggregate wet down the aggregate for at least
24 hours prior to placement in concrete mixer. In most precast and ready-mix
concrete plants, aggregate is placed in a stockpile and then a sprinkler wets the
pile for at least 24 hours. The aggregate then will be somewhere between the
saturated surface dry (SSD) state and the saturated state.
Production of concrete at the laboratory presented a large problem. First,
no facilities were available to allow use of a sprinkler that would reach the
stockpile of aggregate. The closest practical procedure would have been to
submerge the aggregate until loading it into the mixer. However, this was not
desired since the aggregate would then be too wet before placement in the mixer.
Also, most literature on the subject of lightweight aggregate concrete has had the
aggregate added while in a moist condition [2,16].
Because of these problems, it was decided to submerge the aggregate in
tubs of water for 24 hours prior to mixing of the concrete. If possible, the
aggregate would begin soaking in the tubs 72 hours prior to concrete mixing.
Figure 3.1 shows the aggregate soaking in the tub.
36

Figure 3.1 Aggregate Soaking in Tub Before Drying
Approximately an hour before mixing, the aggregate was removed from
the tubs and then placed on a concrete deck outside. The water not soaked up by
the aggregate or clinging to the surface drained away from the aggregate with the
help of the sun and wind. The aggregate was then added to the mixer.
3.1.3.2 Production of Concrete
Concrete was produced in accordance with ASTM Procedure C685 [25].
First, a moisture content of the sand was taken so that the water could be
adjusted to account for the absorption capacity of the sand. Second, the amounts
of cement, fly ash, sand, and water were weighed out. The scale had an accuracy
of 0.1 pound, more than ample when dealing with the size of proportions in this
project.
Third, the aggregate was weighed out. No moisture contents were taken
since the ASTM test for moisture content in normal weight aggregate is
37
considered an extremely unreliable test for lightweight aggregate. The aggregate
was assumed to be close to SSD state. Fourth, the mixer was buttered with 10%
of the cement weight and sand weight to reduce the losses in the mixer. Fifth, the
components were placed in the mixer. Figure 3.2 shows the mixer used in this
project.
Figure 3.2 Concrete Mixer
The lightweight aggregate was added first followed by the sand. The
mixer was then turned for a short time to produce a good mixture of the two
components. After these two, the cement and then the fly ash was added. Again,
the mixer was turned a number of turns and allowed to mix all the components
well.
Now, the water was added. As the mixer was rotating, half the weight of
the water was added. The mixer was allowed to spin until the water was accepted
by the cement and fly ash. After there was no visible free water (and the
38
aggregate and mortar was starting to clump), the rest of the water was added
slowly as the mixer was spinning. This was done to aid complete mixing of the
concrete.
After the water was completely added, the mixer was spun for three
minutes. The concrete was then allowed to rest for three minutes. Then, the
concrete was spun for another two minutes. At the end of the two minutes, a
slump test on the concrete was taken.
After the slump test was taken, superplasticizer was added in 2 fluid ounce
increments until concrete with the slump desired was produced.
The concrete was then emptied into a wheelbarrow. Specimens were then
prepared in accordance with ASTM standards depending on need.
3.1.4 Initial Results
To accurately document the behavior of the test specimens, the test
regimen in Table 3.2 was developed.
Table 3.2 Test Regimen for Concrete Specimens
Days Compressive Strength
Modulus of Elasticity
Modulus of Rupture
Splitting Tensile Strength
1 X X X X 3 X 7 X 28 X X X X
39

This test regimen allowed for full investigation of the mix designs. Since
these mixes were intended for pretensioned concrete, the focus was on high early-
age strength, namely 1 day strength. The three-day and seven-day strength tests
allowed for further refinement of the concrete strength curve. Finally, the 28 day
test finished the test regimen. Since most concrete data are based on 28 day
strengths, this seemed to be the most logical place to finish the testing.
3.1.4.1 Compressive Strengths
All compressive strength tests followed ASTM Test Procedure C39 [26].
The cylinders were moist-cured until the time of the test. The apparatus used in
the test is shown in Figure 3.3.
Figure 3.3 Apparatus for Compressive Test
40
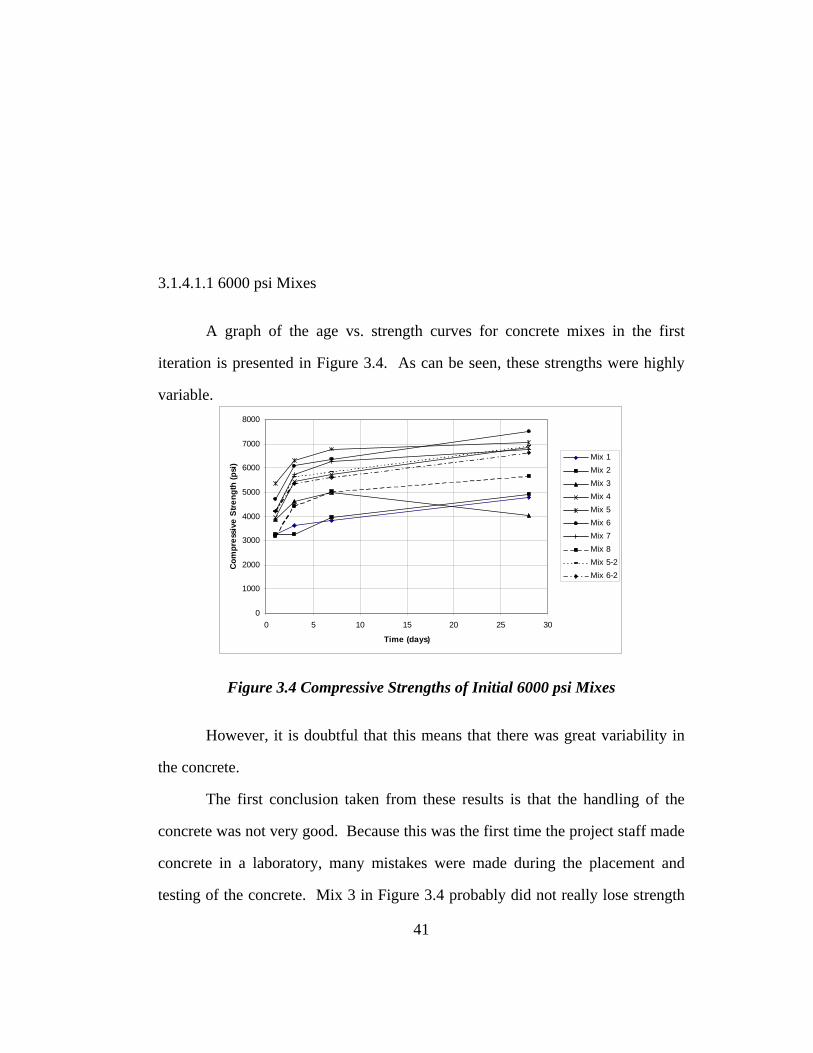
3.1.4.1.1 6000 psi Mixes
A graph of the age vs. strength curves for concrete mixes in the first
iteration is presented in Figure 3.4. As can be seen, these strengths were highly
variable.
0
1000
2000
3000
4000
5000
6000
7000
8000
0 5 10 15 20 25 30
Time (days)
Com
pres
sive
Stre
ngth
(psi
)
Mix 1Mix 2Mix 3Mix 4Mix 5Mix 6Mix 7Mix 8Mix 5-2Mix 6-2
Figure 3.4 Compressive Strengths of Initial 6000 psi Mixes
However, it is doubtful that this means that there was great variability in
the concrete.
The first conclusion taken from these results is that the handling of the
concrete was not very good. Because this was the first time the project staff made
concrete in a laboratory, many mistakes were made during the placement and
testing of the concrete. Mix 3 in Figure 3.4 probably did not really lose strength
41

as it matured from 7 to 28 days. Therefore, some type of error existed in the
placement or the testing of the concrete.
Because of these problems, Mixes 1-3 hold no significance.
Coincidentally, they are the three weakest mixes. They were the first three mixes
produced. They really should be considered learning mixes.
The other mixes were better controlled and gave good results.
Most interestingly, all of the concrete except for Mix 8 reached the desired
6000 psi at 28 days. These results show that 6000 psi lightweight concrete can be
reached easily.
Also, the 1 day compressive strengths indicated satisfactory strength. As
previously mentioned, the concrete needed to be at least 3500 psi at one day to
allow the precast plant to release the prestress. As can be seen in Figure 3.4, most
of the significant mixes reached this goal in one day.
However, these same mixes needed repeatability to be considered
candidates for use in the beams. Therefore, two mixes were chosen to be
repeated.
Figure 3.5 shows the results of two mixes which were repeated in
comparison with their original results.
42
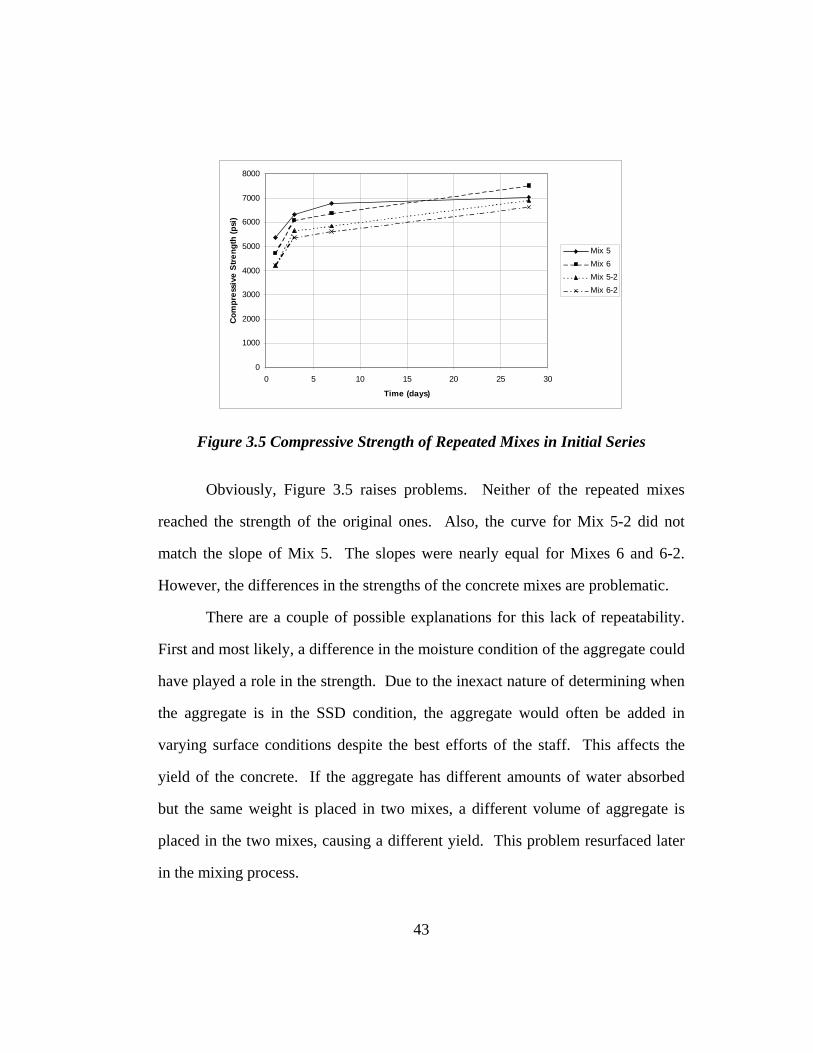
0
1000
2000
3000
4000
5000
6000
7000
8000
0 5 10 15 20 25 30
Time (days)
Com
pres
sive
Stre
ngth
(psi
)
Mix 5Mix 6Mix 5-2Mix 6-2
Figure 3.5 Compressive Strength of Repeated Mixes in Initial Series
Obviously, Figure 3.5 raises problems. Neither of the repeated mixes
reached the strength of the original ones. Also, the curve for Mix 5-2 did not
match the slope of Mix 5. The slopes were nearly equal for Mixes 6 and 6-2.
However, the differences in the strengths of the concrete mixes are problematic.
There are a couple of possible explanations for this lack of repeatability.
First and most likely, a difference in the moisture condition of the aggregate could
have played a role in the strength. Due to the inexact nature of determining when
the aggregate is in the SSD condition, the aggregate would often be added in
varying surface conditions despite the best efforts of the staff. This affects the
yield of the concrete. If the aggregate has different amounts of water absorbed
but the same weight is placed in two mixes, a different volume of aggregate is
placed in the two mixes, causing a different yield. This problem resurfaced later
in the mixing process.
43

Second, the temperature and the ambient conditions could have caused a
difference in the strength. On the warmer days when Mixes 5 and 6 were
produced, the ambient air temperatures promote the reaction of the cement and
the water, perhaps creating more strength.
3.1.4.1.2 8000 psi Mixes
The 8000 psi mixes had many disappointing results. They did not reach
the strengths necessary to be considered a success. Figure 3.6 shows the
compressive strengths of the concrete that were expected to be 8000 psi.
0
1000
2000
3000
4000
5000
6000
7000
8000
0 5 10 15 20 25 30
Time (days)
Com
pres
sive
Str
engt
h (p
si)
Mix H1
Mix H2
Mix H3Mix H4
Figure 3.6 Compressive Strengths of 8000 psi Concrete Mixes
The 8000 psi concrete mixes did not reach the required strengths for
acceptance. All the mixes were at least 1000 psi short of the target. Since all of
the concrete mixes used exactly the same amount of cement in the mix, the results
44
were pretty consistent, as would be expected. Obviously, it was not enough
cement to produce the required strength.
The fly ash did not play much of a role in strength formation. Mixes H2
and H4 both had fly ash replacement at 25% of the weight of cement. Due to
inconsistency of Mix H4 compared to the other concrete mixes, this probably is
insignificant. Therefore, looking at Mix H2 compared to Mix H1, fly ash barely
reduces the compressive strength.
The aggregate also does not play a large role in strength formation. Mixes
H3 and H4 had much more coarse aggregate than did Mixes H1 and H2. The
strength did not suffer at either end of the spectrum. Obviously, workability is
going to play the largest role in determining the appropriate mix proportions.
3.1.4.2 Modulus of Elasticity
Another significant property was the elastic modulus. The modulus was
determined using ASTM Test Procedure C469 [27]. The test setup is shown in
Figure 3.7.
45

Figure 3.7 Test Setup for Modulus of Elasticity
The modulus was tested at 1 and 28 days. One day was chosen since this
was when the concrete would be stressed due to pretensioning while the 28 day
test would provide the elastic modulus used for service conditions.
Since bridge girders generally remain in the elastic range, this test holds a
great deal of importance when calculating deflections and loss of prestress. Also,
lightweight concrete generally has a reduced elastic modulus when compared to
normal weight concrete. It was important to know the reduction in elastic
modulus.
Figure 3.8 presents the modulus of elasticity results for the first batch of
mixes.
46
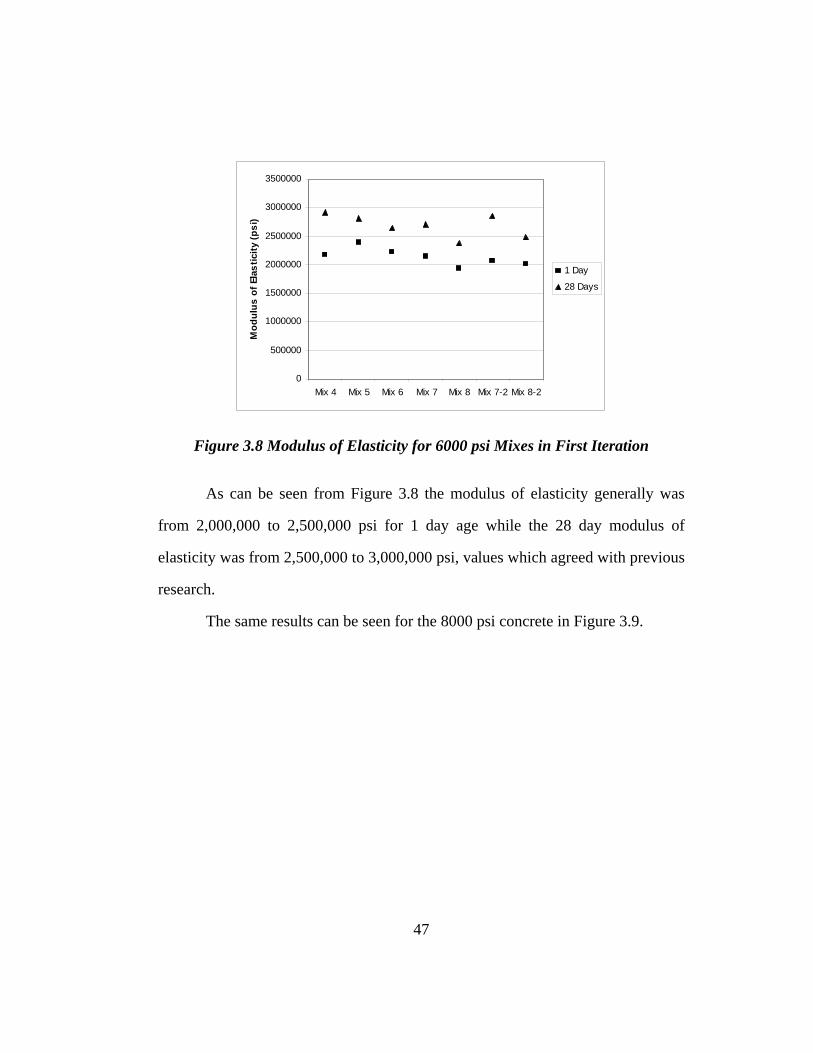
0
500000
1000000
1500000
2000000
2500000
3000000
3500000
Mix 4 Mix 5 Mix 6 Mix 7 Mix 8 Mix 7-2 Mix 8-2
Mod
ulus
of E
last
icity
(psi
)
1 Day
28 Days
Figure 3.8 Modulus of Elasticity for 6000 psi Mixes in First Iteration
As can be seen from Figure 3.8 the modulus of elasticity generally was
from 2,000,000 to 2,500,000 psi for 1 day age while the 28 day modulus of
elasticity was from 2,500,000 to 3,000,000 psi, values which agreed with previous
research.
The same results can be seen for the 8000 psi concrete in Figure 3.9.
47
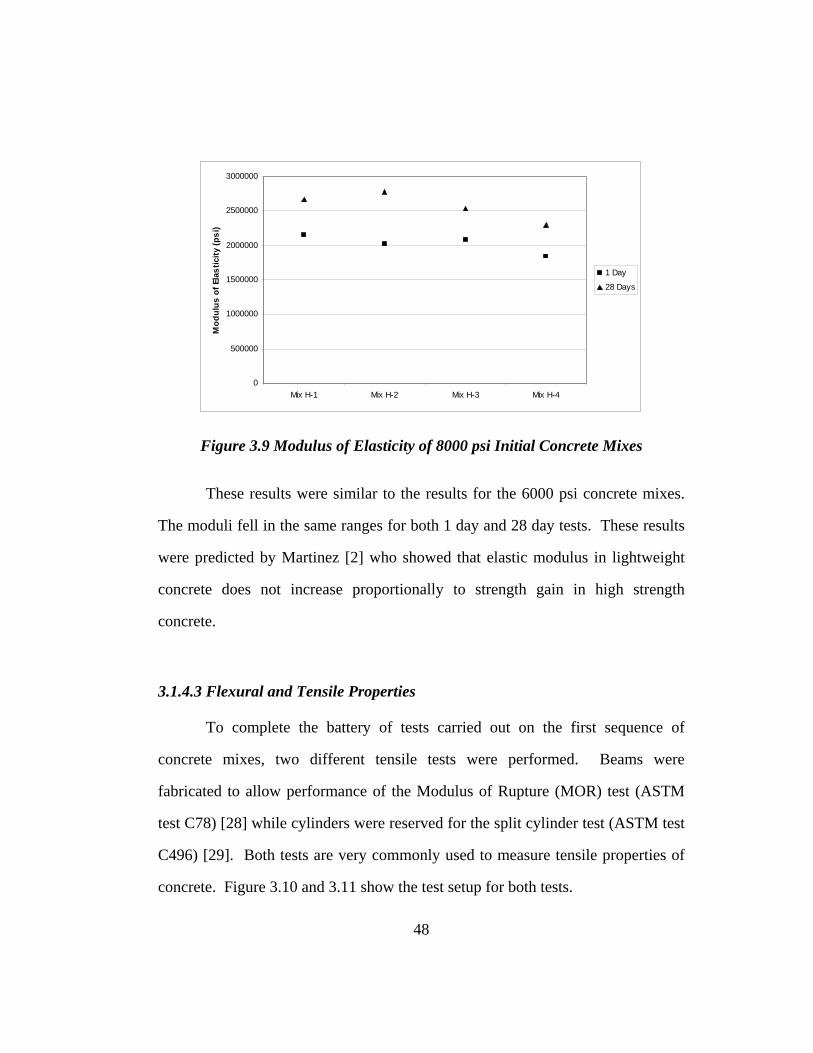
0
500000
1000000
1500000
2000000
2500000
3000000
Mix H-1 Mix H-2 Mix H-3 Mix H-4
Mod
ulus
of E
last
icity
(psi
)
1 Day
28 Days
Figure 3.9 Modulus of Elasticity of 8000 psi Initial Concrete Mixes
These results were similar to the results for the 6000 psi concrete mixes.
The moduli fell in the same ranges for both 1 day and 28 day tests. These results
were predicted by Martinez [2] who showed that elastic modulus in lightweight
concrete does not increase proportionally to strength gain in high strength
concrete.
3.1.4.3 Flexural and Tensile Properties
To complete the battery of tests carried out on the first sequence of
concrete mixes, two different tensile tests were performed. Beams were
fabricated to allow performance of the Modulus of Rupture (MOR) test (ASTM
test C78) [28] while cylinders were reserved for the split cylinder test (ASTM test
C496) [29]. Both tests are very commonly used to measure tensile properties of
concrete. Figure 3.10 and 3.11 show the test setup for both tests.
48
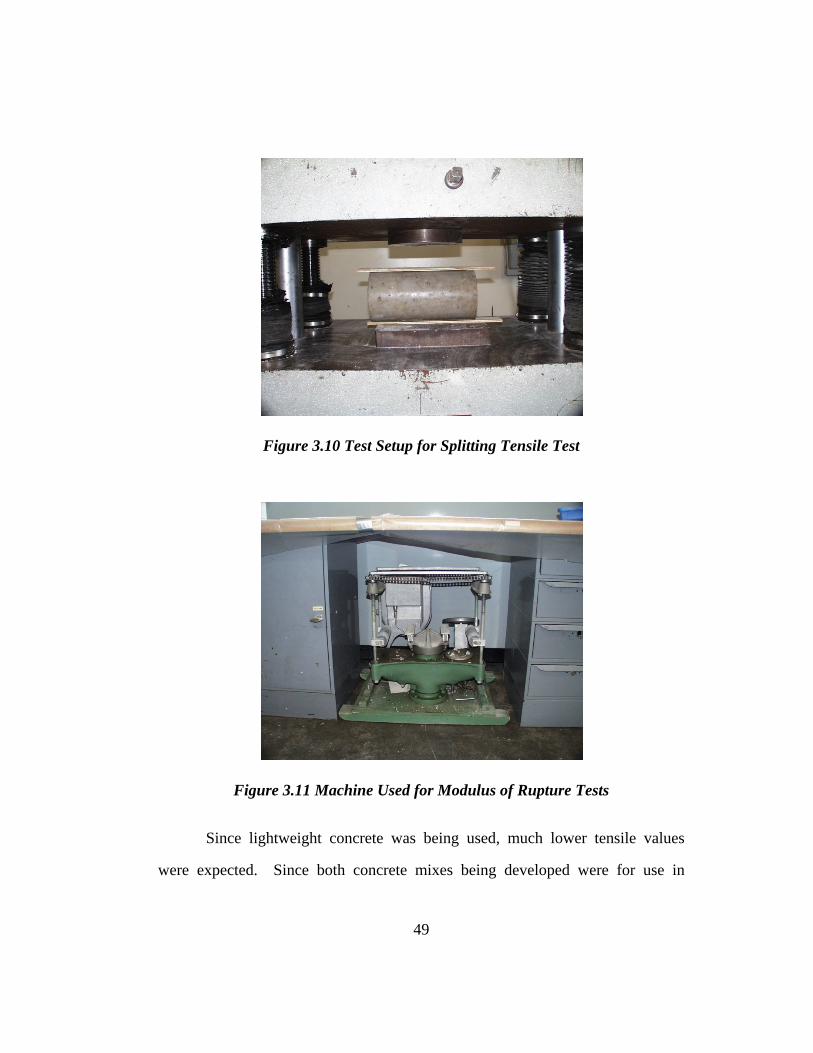
Figure 3.10 Test Setup for Splitting Tensile Test
Figure 3.11 Machine Used for Modulus of Rupture Tests
Since lightweight concrete was being used, much lower tensile values
were expected. Since both concrete mixes being developed were for use in
49
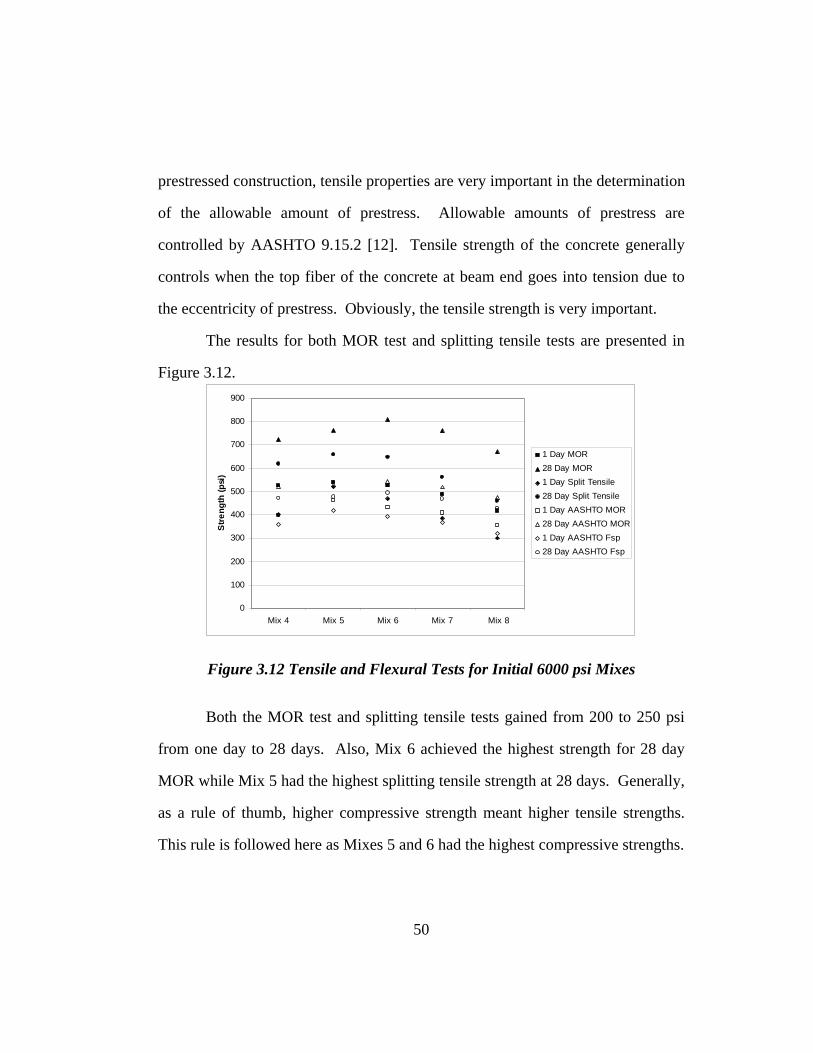
prestressed construction, tensile properties are very important in the determination
of the allowable amount of prestress. Allowable amounts of prestress are
controlled by AASHTO 9.15.2 [12]. Tensile strength of the concrete generally
controls when the top fiber of the concrete at beam end goes into tension due to
the eccentricity of prestress. Obviously, the tensile strength is very important.
The results for both MOR test and splitting tensile tests are presented in
Figure 3.12.
0
100
200
300
400
500
600
700
800
900
Mix 4 Mix 5 Mix 6 Mix 7 Mix 8
Str
engt
h (p
si)
1 Day MOR28 Day MOR1 Day Split Tensile28 Day Split Tensile1 Day AASHTO MOR28 Day AASHTO MOR1 Day AASHTO Fsp28 Day AASHTO Fsp
Figure 3.12 Tensile and Flexural Tests for Initial 6000 psi Mixes
Both the MOR test and splitting tensile tests gained from 200 to 250 psi
from one day to 28 days. Also, Mix 6 achieved the highest strength for 28 day
MOR while Mix 5 had the highest splitting tensile strength at 28 days. Generally,
as a rule of thumb, higher compressive strength meant higher tensile strengths.
This rule is followed here as Mixes 5 and 6 had the highest compressive strengths.
50
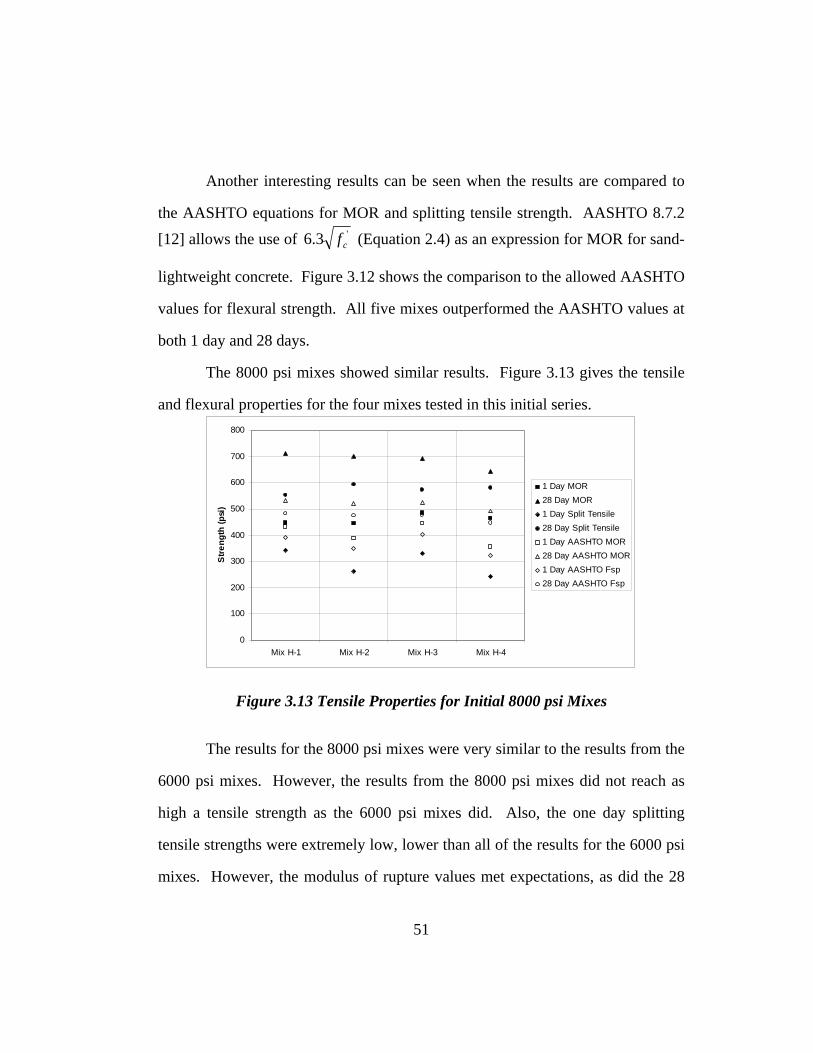
Another interesting results can be seen when the results are compared to
the AASHTO equations for MOR and splitting tensile strength. AASHTO 8.7.2 [12] allows the use of '3.6 cf (Equation 2.4) as an expression for MOR for sand-
lightweight concrete. Figure 3.12 shows the comparison to the allowed AASHTO
values for flexural strength. All five mixes outperformed the AASHTO values at
both 1 day and 28 days.
The 8000 psi mixes showed similar results. Figure 3.13 gives the tensile
and flexural properties for the four mixes tested in this initial series.
0
100
200
300
400
500
600
700
800
Mix H-1 Mix H-2 Mix H-3 Mix H-4
Str
engt
h (p
si)
1 Day MOR28 Day MOR1 Day Split Tensile28 Day Split Tensile1 Day AASHTO MOR28 Day AASHTO MOR1 Day AASHTO Fsp28 Day AASHTO Fsp
Figure 3.13 Tensile Properties for Initial 8000 psi Mixes
The results for the 8000 psi mixes were very similar to the results from the
6000 psi mixes. However, the results from the 8000 psi mixes did not reach as
high a tensile strength as the 6000 psi mixes did. Also, the one day splitting
tensile strengths were extremely low, lower than all of the results for the 6000 psi
mixes. However, the modulus of rupture values met expectations, as did the 28
51

day splitting tensile tests. All values were satisfactory for the 28 day strengths.
They also outperformed the AASHTO values for the modulus of rupture.
These results from the initial mixes of the concrete indicated that the
tensile strength of the concrete should not be a main concern in the further
iterations of the concrete mix design.
3.2 SECOND ITERATION
Once the initial iteration was complete, the approximate proportions for
the 6000 psi mix were known. However, the approximate mix proportions for the
8000 psi still needed to be found. Therefore, the main goal was to refine the 6000
psi mix while increasing the cement content for the 8000 psi mix to reach the
needed strength.
Five mixes were developed for test during this iteration. Although five
mixes does not seem like a large number, these mixes were done three times
apiece due to the addition of a new variable to the test program.
3.2.1 Modification of Variables
During this iteration, a new variable, coarse aggregate type, was added
while the older variables were refined.
52
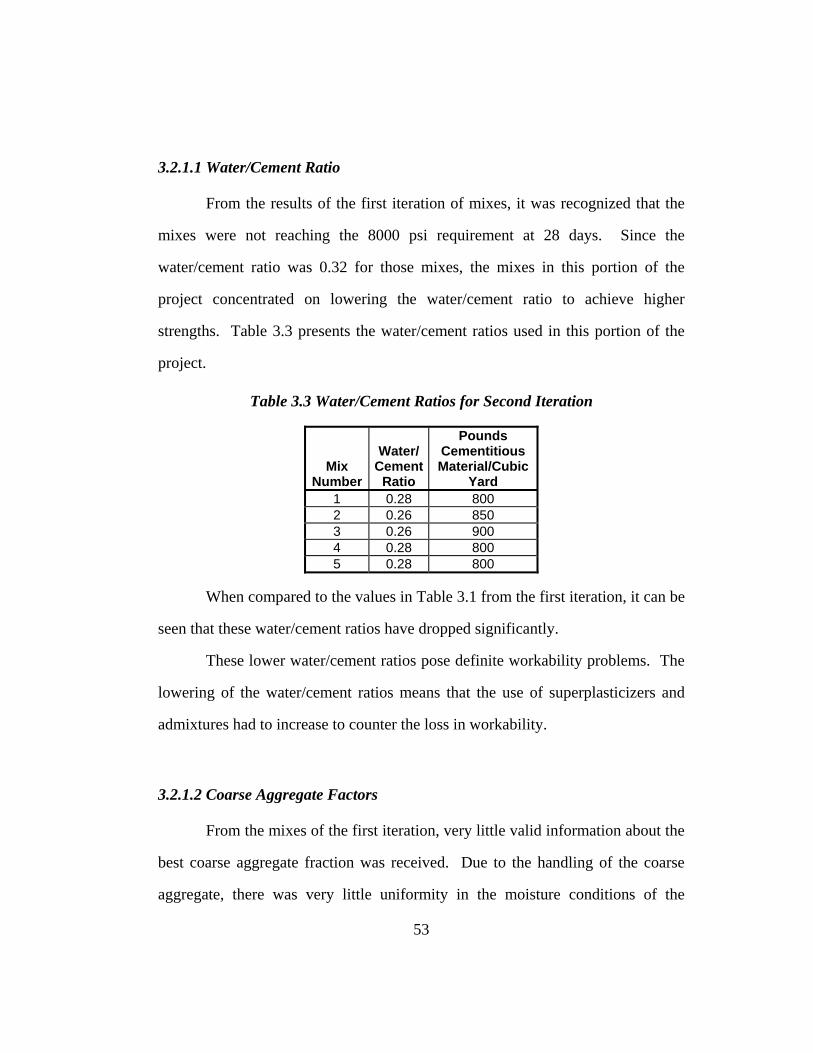
3.2.1.1 Water/Cement Ratio
From the results of the first iteration of mixes, it was recognized that the
mixes were not reaching the 8000 psi requirement at 28 days. Since the
water/cement ratio was 0.32 for those mixes, the mixes in this portion of the
project concentrated on lowering the water/cement ratio to achieve higher
strengths. Table 3.3 presents the water/cement ratios used in this portion of the
project.
Table 3.3 Water/Cement Ratios for Second Iteration
Mix Number
Water/
Cement Ratio
Pounds Cementitious Material/Cubic
Yard 1 0.28 800 2 0.26 850 3 0.26 900 4 0.28 800 5 0.28 800
When compared to the values in Table 3.1 from the first iteration, it can be
seen that these water/cement ratios have dropped significantly.
These lower water/cement ratios pose definite workability problems. The
lowering of the water/cement ratios means that the use of superplasticizers and
admixtures had to increase to counter the loss in workability.
3.2.1.2 Coarse Aggregate Factors
From the mixes of the first iteration, very little valid information about the
best coarse aggregate fraction was received. Due to the handling of the coarse
aggregate, there was very little uniformity in the moisture conditions of the
53
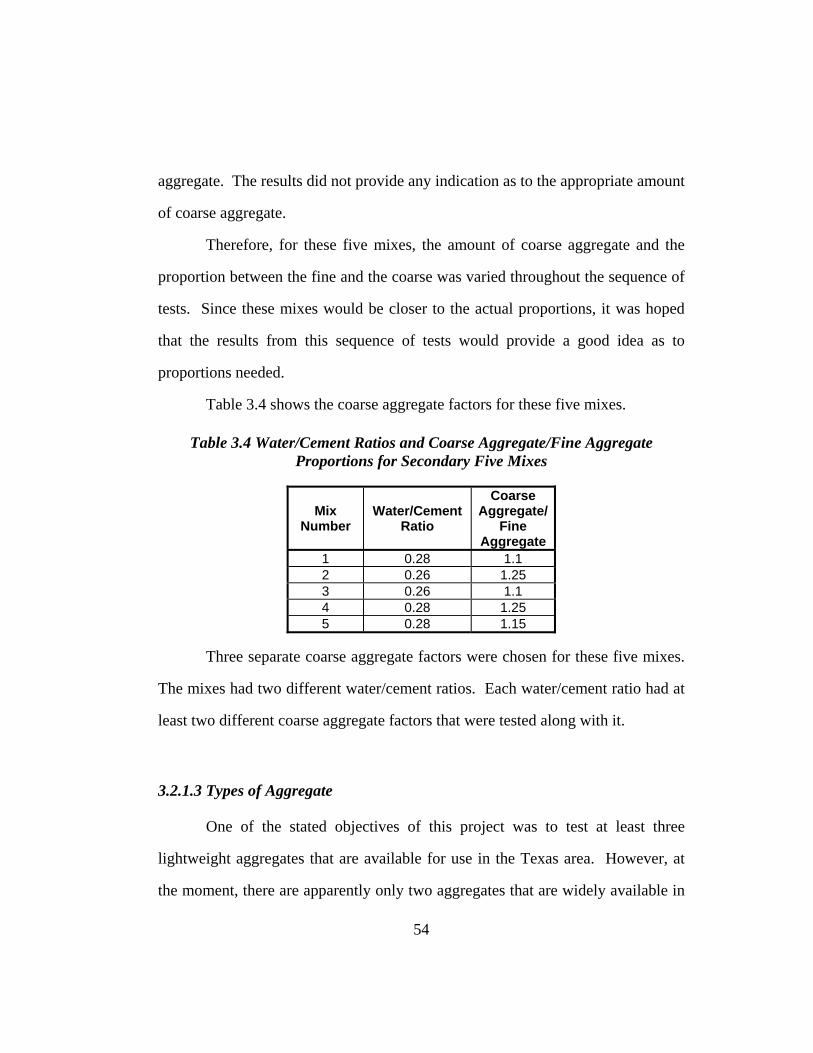
aggregate. The results did not provide any indication as to the appropriate amount
of coarse aggregate.
Therefore, for these five mixes, the amount of coarse aggregate and the
proportion between the fine and the coarse was varied throughout the sequence of
tests. Since these mixes would be closer to the actual proportions, it was hoped
that the results from this sequence of tests would provide a good idea as to
proportions needed.
Table 3.4 shows the coarse aggregate factors for these five mixes.
Table 3.4 Water/Cement Ratios and Coarse Aggregate/Fine Aggregate Proportions for Secondary Five Mixes
Mix
Number
Water/Cement
Ratio
Coarse Aggregate/
Fine Aggregate
1 0.28 1.1 2 0.26 1.25 3 0.26 1.1 4 0.28 1.25 5 0.28 1.15
Three separate coarse aggregate factors were chosen for these five mixes.
The mixes had two different water/cement ratios. Each water/cement ratio had at
least two different coarse aggregate factors that were tested along with it.
3.2.1.3 Types of Aggregate
One of the stated objectives of this project was to test at least three
lightweight aggregates that are available for use in the Texas area. However, at
the moment, there are apparently only two aggregates that are widely available in
54

Texas. These are Clodine and Streetman, both manufactured by Texas Industries
(TxI).
In order to satisfy the requirement, a third aggregate needed to be
obtained. With the help of TxI, a third aggregate was imported from Colorado.
Three shipments of aggregates were delivered to Ferguson Structural Engineering
Laboratory and stockpiled outside. The three aggregates used were Clodine,
Streetman, and Western.
Clodine is an expanded clay from the TxI plant south of Houston, Texas.
It comes in a variety of maximum aggregate sizes ranging from 3/8 inch to 3/4
inch. Figure 3.14 shows the appearance and maximum size of the aggregate.
Figure 3.14 Apperance and Maximum Size of Clodine Aggregate
The Clodine had a maximum size of 3/4 inch and was well-graded. Figure
3.15 presents the grading curve for this aggregate.
55
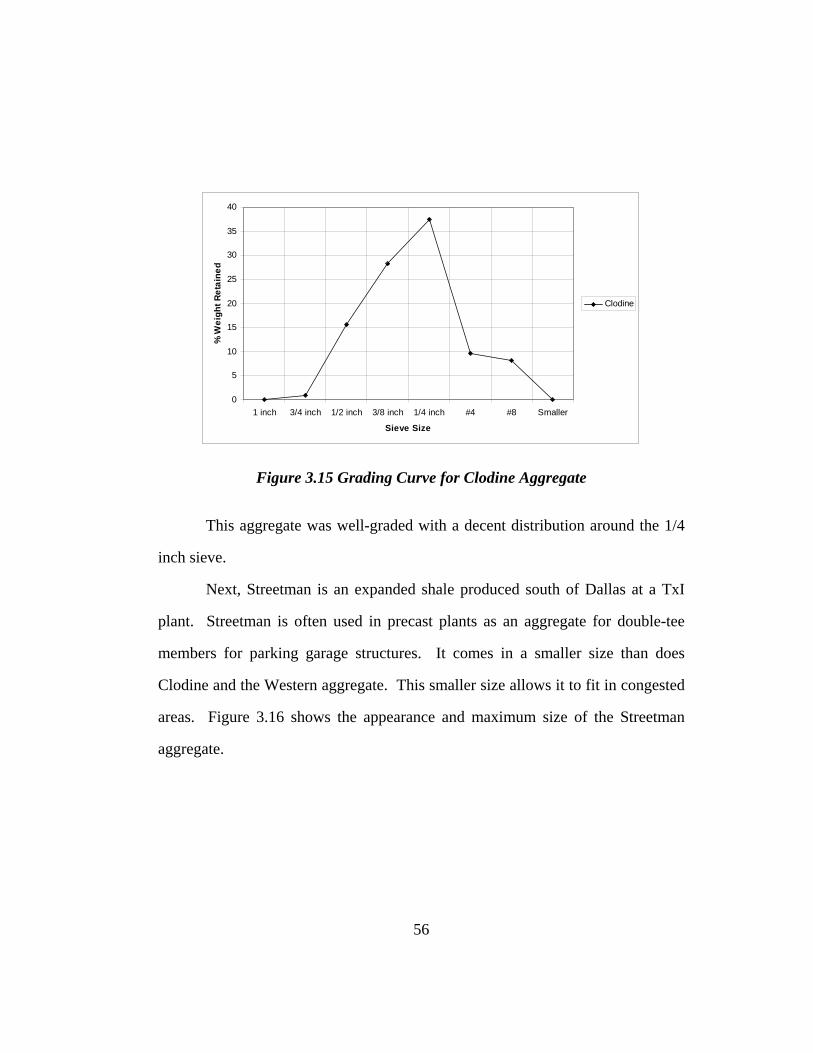
0
5
10
15
20
25
30
35
40
1 inch 3/4 inch 1/2 inch 3/8 inch 1/4 inch #4 #8 Smaller
Sieve Size
% W
eigh
t Ret
aine
d
Clodine
Figure 3.15 Grading Curve for Clodine Aggregate
This aggregate was well-graded with a decent distribution around the 1/4
inch sieve.
Next, Streetman is an expanded shale produced south of Dallas at a TxI
plant. Streetman is often used in precast plants as an aggregate for double-tee
members for parking garage structures. It comes in a smaller size than does
Clodine and the Western aggregate. This smaller size allows it to fit in congested
areas. Figure 3.16 shows the appearance and maximum size of the Streetman
aggregate.
56
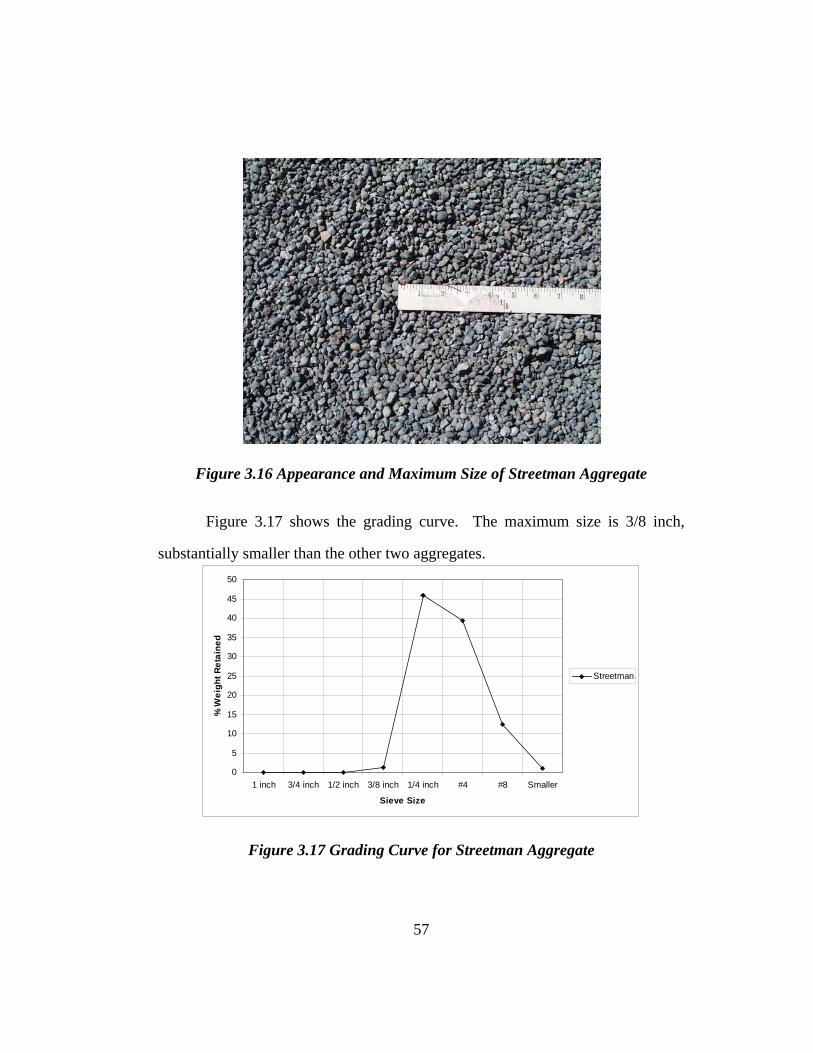
Figure 3.16 Appearance and Maximum Size of Streetman Aggregate
Figure 3.17 shows the grading curve. The maximum size is 3/8 inch,
substantially smaller than the other two aggregates.
0
5
10
15
20
25
30
35
40
45
50
1 inch 3/4 inch 1/2 inch 3/8 inch 1/4 inch #4 #8 Smaller
Sieve Size
% W
eigh
t Ret
aine
d
Streetman
Figure 3.17 Grading Curve for Streetman Aggregate
57
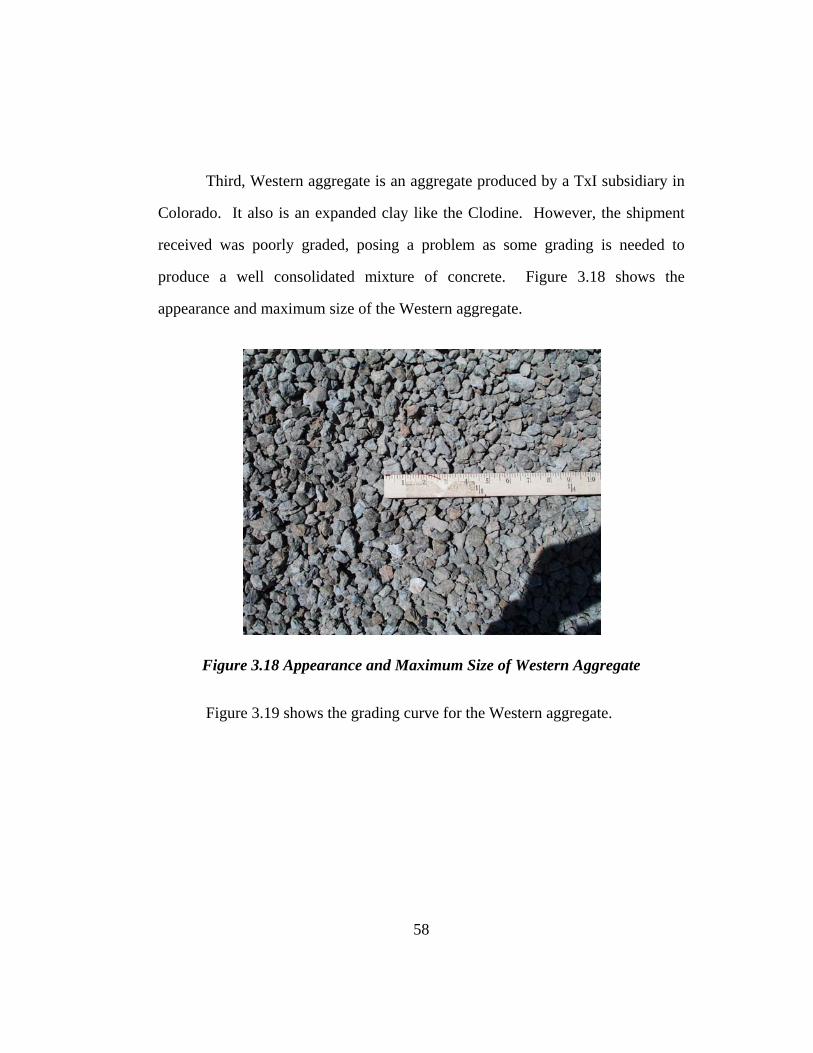
Third, Western aggregate is an aggregate produced by a TxI subsidiary in
Colorado. It also is an expanded clay like the Clodine. However, the shipment
received was poorly graded, posing a problem as some grading is needed to
produce a well consolidated mixture of concrete. Figure 3.18 shows the
appearance and maximum size of the Western aggregate.
Figure 3.18 Appearance and Maximum Size of Western Aggregate
Figure 3.19 shows the grading curve for the Western aggregate.
58

0
5
10
15
20
25
30
35
40
45
50
1 inch 3/4 inch 1/2 inch 3/8 inch 1/4 inch #4 #8 Smaller
Sieve Size
% W
eigh
t Ret
aine
d
Western
Figure 3.19 Grading Curve for Western Aggregate
The distribution of the Western aggregate was not very good. Almost all
the aggregate was caught on the 1/2 inch and 3/8 inch sieves.
3.2.2 Procedures
The same ASTM procedures were followed in the making of the concrete
for this portion of the test program. However, there was one major change in the
way the concrete was produced.
During the first iteration series of concrete production, the coarse
aggregate was allowed to dry in the sun on a concrete deck. This left the
aggregate exposed to both wind and sun, the two major environmental drying
agents. This caused the aggregate to often be in widely varying moisture states
when it was added.
59

Therefore, with the help of Don Reeves from TxI, a new system was
developed in which the aggregate was dried to a consistent moisture state.
First, the aggregate was soaked in tubs for at least 24 hours. Then, the
aggregate was placed in rectangular wooden beds with a screen bottom. The
aggregate was also covered with black plastic sheeting to protect against wind and
rain. Aggregate is shown drying in Figure 3.20. The aggregate was allowed to
dry for an hour.
Figure 3.20 Drying of Aggregate on Screened Bed
During this hour, the other concrete materials were batched. After the
hour was up, a dry rodded unit weight (DRUW) was taken. The DRUW was
checked against previous DRUWs taken during the test program. If the aggregate
was within 2% of the previous DRUWs, it was allowed to proceed. If the
aggregate was too wet, the aggregate was allowed to dry for fifteen minutes and
the DRUW was checked after this period of time. The aggregate never became
60
too dry with this practice. Since DRUW is based on a constant volume, the
coarse aggregate was at a consistent moisture state and was allowed to proceed.
3.2.3 Results
The results were much more meaningful for this set of mixes due to the
increased care shown in preparing the coarse aggregate and in mixing the
concrete. The results overall were consistent and provided a good basis for
further development of concrete.
3.2.3.1 Workability Issues
Since all three aggregate were expected to achieve approximately the same
compressive strength, workability played a large role in differentiating the three
aggregates. Workability was judged by how much superplasticizer was required
to achieve the same slump as well as how well the concrete flowed after 30-45
minutes in the wheelbarrow.
Although quick placement is expected for mixes at the precast plant, the
ability to remain reasonably workable for a 30 minute period played a large role
in determining the best mix. The concrete needed to be placed in the forms, flow
easily around the strands, and fill in the spaces without honeycombing. An overly
stiff mix would not be able to do this.
To look at one aspect of workability, Table 3.5 presents the amount of
superplasticizer added for every 100 pounds of cement.
61

Table 3.5 Average Superplasticizer Dosage Rates for Mixes with Three Aggregates
AggregateDosage Rate
(fl. oz./100 cwt.)
Western 4.70 Clodine 4.63
Streetman 5.06
Since all these mixes were dosed until they had the same amount of slump,
approximately 9 inches, this table gives the average dosage rate needed to force
the concrete mix to that point.
Table 3.5 shows that the mixes made with the Western and Clodine
aggregates needed approximately the same dosage rate to reach the target slump
while the Streetman needed about 6% more superplasticizer. The mixes with
Western and Clodine aggregates were initially more workable before the addition
of superplasticizer which brought all the mixes to the same point of workability.
Since Streetman had a smaller maximum size than did the Western and
Clodine aggregates, an equal weight of Streetman would have more surface area
than a comparable weight of Western or Clodine. Therefore, the Streetman
aggregate is able to absorb more mixing water in the mix, which causes the lower
initial slump.
Also, another interesting observation was the fact that all three mixes had
increased cohesiveness after thirty minutes. This observation is anecdotal as no
test was performed to verify this. However, both project staff members noted the
difficulty in placing concrete with all three aggregate after thirty minutes had
62
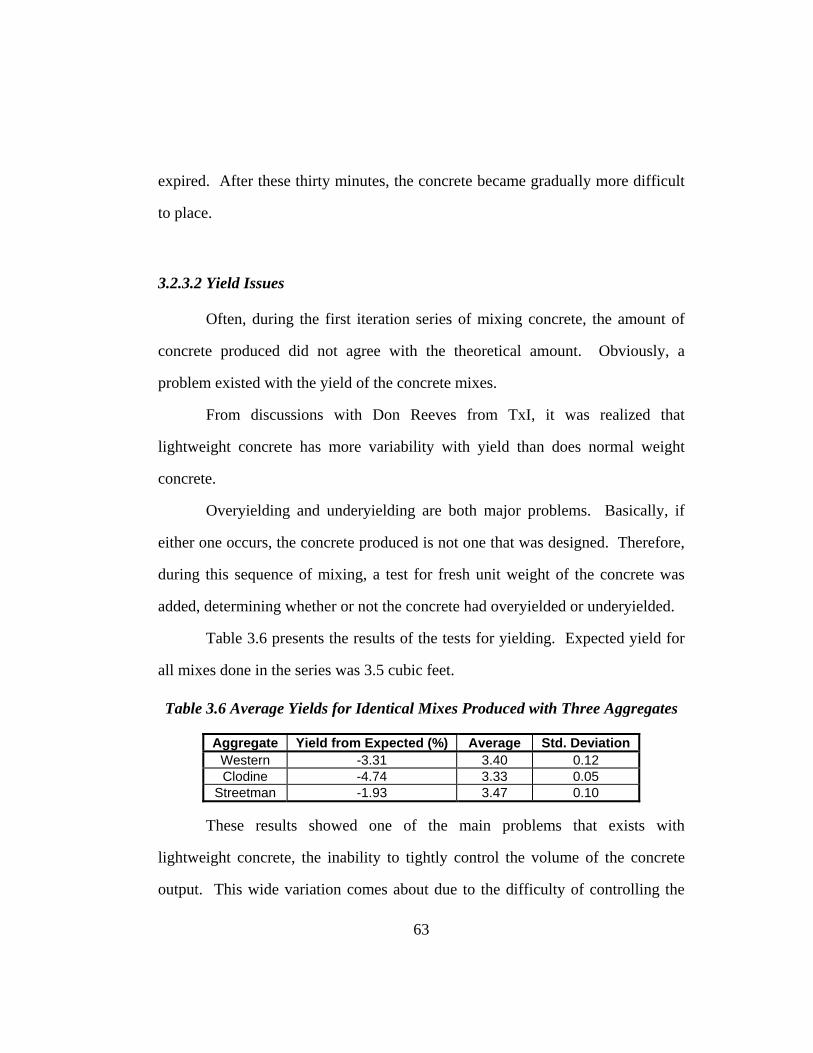
expired. After these thirty minutes, the concrete became gradually more difficult
to place.
3.2.3.2 Yield Issues
Often, during the first iteration series of mixing concrete, the amount of
concrete produced did not agree with the theoretical amount. Obviously, a
problem existed with the yield of the concrete mixes.
From discussions with Don Reeves from TxI, it was realized that
lightweight concrete has more variability with yield than does normal weight
concrete.
Overyielding and underyielding are both major problems. Basically, if
either one occurs, the concrete produced is not one that was designed. Therefore,
during this sequence of mixing, a test for fresh unit weight of the concrete was
added, determining whether or not the concrete had overyielded or underyielded.
Table 3.6 presents the results of the tests for yielding. Expected yield for
all mixes done in the series was 3.5 cubic feet.
Table 3.6 Average Yields for Identical Mixes Produced with Three Aggregates
Aggregate Yield from Expected (%) Average Std. Deviation Western -3.31 3.40 0.12 Clodine -4.74 3.33 0.05
Streetman -1.93 3.47 0.10
These results showed one of the main problems that exists with
lightweight concrete, the inability to tightly control the volume of the concrete
output. This wide variation comes about due to the difficulty of controlling the
63
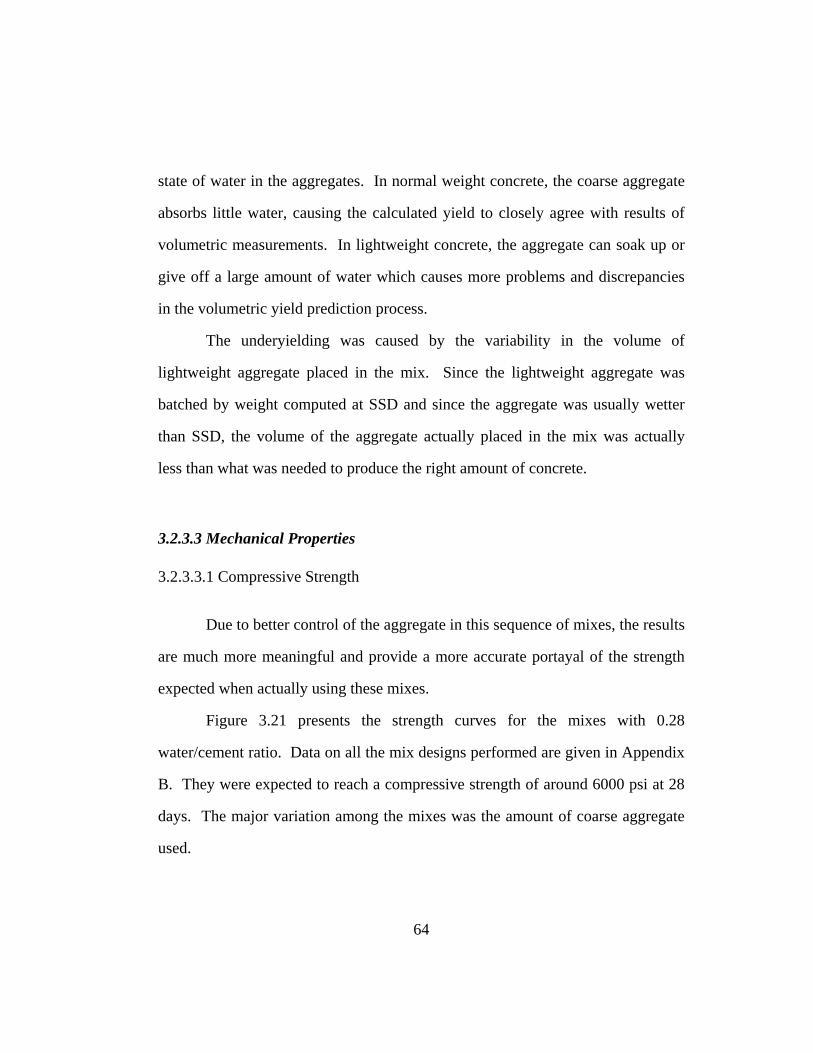
state of water in the aggregates. In normal weight concrete, the coarse aggregate
absorbs little water, causing the calculated yield to closely agree with results of
volumetric measurements. In lightweight concrete, the aggregate can soak up or
give off a large amount of water which causes more problems and discrepancies
in the volumetric yield prediction process.
The underyielding was caused by the variability in the volume of
lightweight aggregate placed in the mix. Since the lightweight aggregate was
batched by weight computed at SSD and since the aggregate was usually wetter
than SSD, the volume of the aggregate actually placed in the mix was actually
less than what was needed to produce the right amount of concrete.
3.2.3.3 Mechanical Properties
3.2.3.3.1 Compressive Strength
Due to better control of the aggregate in this sequence of mixes, the results
are much more meaningful and provide a more accurate portayal of the strength
expected when actually using these mixes.
Figure 3.21 presents the strength curves for the mixes with 0.28
water/cement ratio. Data on all the mix designs performed are given in Appendix
B. They were expected to reach a compressive strength of around 6000 psi at 28
days. The major variation among the mixes was the amount of coarse aggregate
used.
64

0
1,000
2,000
3,000
4,000
5,000
6,000
7,000
8,000
9,000
0 5 10 15 20 25 30
Time (days)
Com
pres
sive
Stre
ngth
(psi
)
Mix 1-CMix 1-WMix 1-SMix 4-CMix 4-WMix 4-SMix 5-CMix 5-W
Figure 3.21 Age-Strength Curves for 0.28 Water/Cement Ratio Mixes from Second Iteration Mix Designs
Several important results are shown in Figure 3.22. First, the mixes
produced with Western aggregates had much lower strengths at all ages than did
the mixes produced with the other two aggregates. Also, the Western aggregate
mixes did not gain as much strength from 7 to 28 days as did the other two
aggregates.
Second, Mix 4 seemed to perform the best of all the mixes. Both 4-C and
4-S produced the highest two strengths at all dates when strength was measured.
Another notable fact was the strength that was eventually achieved. These two
mixes almost reached 8000 psi at 28 days and were over 5000 psi at one day.
They both easily satisfied the strength requirement for the 6000 psi mix.
65

The greater strength in the 6000 psi mix seems to be related to the amount
of coarse aggregate. In Mix 4, the coarse aggregate/fine aggregate proportion was
the highest. If this trend holds up, there perhaps could be problems since a high
amount of lightweight aggregate could pose workability problems..
Figure 3.22 shows the results from the 0.26 water/cement ratio mixes.
0
1,000
2,000
3,000
4,000
5,000
6,000
7,000
8,000
9,000
0 5 10 15 20 25 30
Time (days)
Com
pres
sive
Stre
ngth
(psi
)
Mix 2-CMix 2-WMix 3-CMix 3-WMix 3-SMix 2-S
Figure 3.22 Age-Strength Curves for 0.26 Water/Cement Ratio Mixes from Second Iteration Mix Designs
Some of the observations from the 0.28 water/cement ratio mixes hold true
for these mixes. The mixes made with Western aggregates underperformed again.
They were significantly lower than the mixes made with Clodine and Streetman.
The strength development by the mixes with Clodine and Streetman were
extremely similar to Mix 1,4, and 5 from this iteration. The maximum strength
varied from 7500 to 8000 psi while the 1 day strength varied were from 4500 to
5000 psi. These all satisfy the 6000 psi specifications quite easily.
66
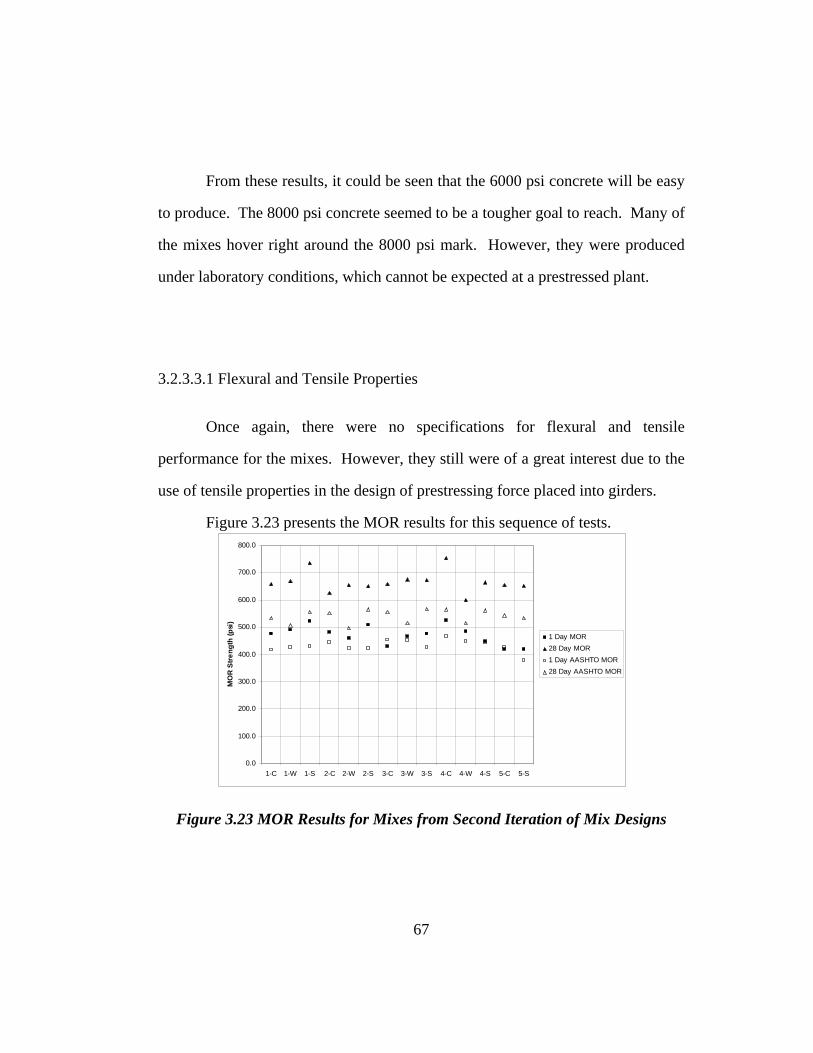
From these results, it could be seen that the 6000 psi concrete will be easy
to produce. The 8000 psi concrete seemed to be a tougher goal to reach. Many of
the mixes hover right around the 8000 psi mark. However, they were produced
under laboratory conditions, which cannot be expected at a prestressed plant.
3.2.3.3.1 Flexural and Tensile Properties
Once again, there were no specifications for flexural and tensile
performance for the mixes. However, they still were of a great interest due to the
use of tensile properties in the design of prestressing force placed into girders.
Figure 3.23 presents the MOR results for this sequence of tests.
0.0
100.0
200.0
300.0
400.0
500.0
600.0
700.0
800.0
1-C 1-W 1-S 2-C 2-W 2-S 3-C 3-W 3-S 4-C 4-W 4-S 5-C 5-S
MO
R St
reng
th (p
si)
1 Day MOR28 Day MOR1 Day AASHTO MOR28 Day AASHTO MOR
Figure 3.23 MOR Results for Mixes from Second Iteration of Mix Designs
67

There really is not much of a pattern in these results. The mixes all
performed relatively equally, especially when the inaccuracy of the test is
considered.
All of these mixes had MOR values from 425 to 500 psi at 1 day and 650
to 700 psi at 28 days. Although no pattern could be discerned, the consistency is
heartening since it indicated reasonable flexural strength can be expected from
these mixes.
Also, the mixes outperformed the AASHTO equation for MOR at both 1
day and 28 days, showing that the mixes behaved well in flexure and that the
AASHTO equation is conservative.
Figure 3.24 presents the splitting tensile results from these mixes.
0.0
100.0
200.0
300.0
400.0
500.0
600.0
700.0
800.0
1-C 1-W 1-S 2-C 2-W 2-S 3-C 3-W 3-S 4-C 4-W 4-S 5-C 5-S
Mixes
Split
ting
Tens
ile S
treng
ht (p
si)
1 Day Fsp
28 Day Fsp
1 Day AASHTO Fsp
28 Day AASHTO Fsp
Figure 3.24 Splitting Tensile Results from Mixes Produced in Second Iteration of Mix Designs
Again, as in the MOR tests, no strong patterns developed. There was no
correlation between MOR and tensile strength. However, one small pattern did
68

emerge during these tests. The concrete made with Clodine aggregate generally
produced better results than the concrete made with the other two aggregates. In
all five mixes, the concrete made with Clodine produced the strongest concrete in
the splitting tensile test.
In modulus of rupture and compressive strength, the Streetman aggregate
matched the Clodine aggregate in performance. Split tensile strength is the first
indication that the Clodine aggregate performed better than the Streetman
aggregate in any of the mechanical properties measured. Along with the results
from the workability measures, the Clodine aggregate emerged from this
sequence of tests as the favored aggregate for use in the concrete for prestressed
applications.
3.2.3.3.3 Unit Weight Results
For the first iteration of concrete mixes produced, this measure was not
taken. However, after recognition of the problems with yield as well as the fact
that the specifications called for concrete to be of equilibrium weight not more
than 122 pounds per cubic foot (pcf), the weight of the concrete was taken at four
different times, fresh, 7 days, 28 days, and equilibrium.
Figure 3.25 presents the results.
69
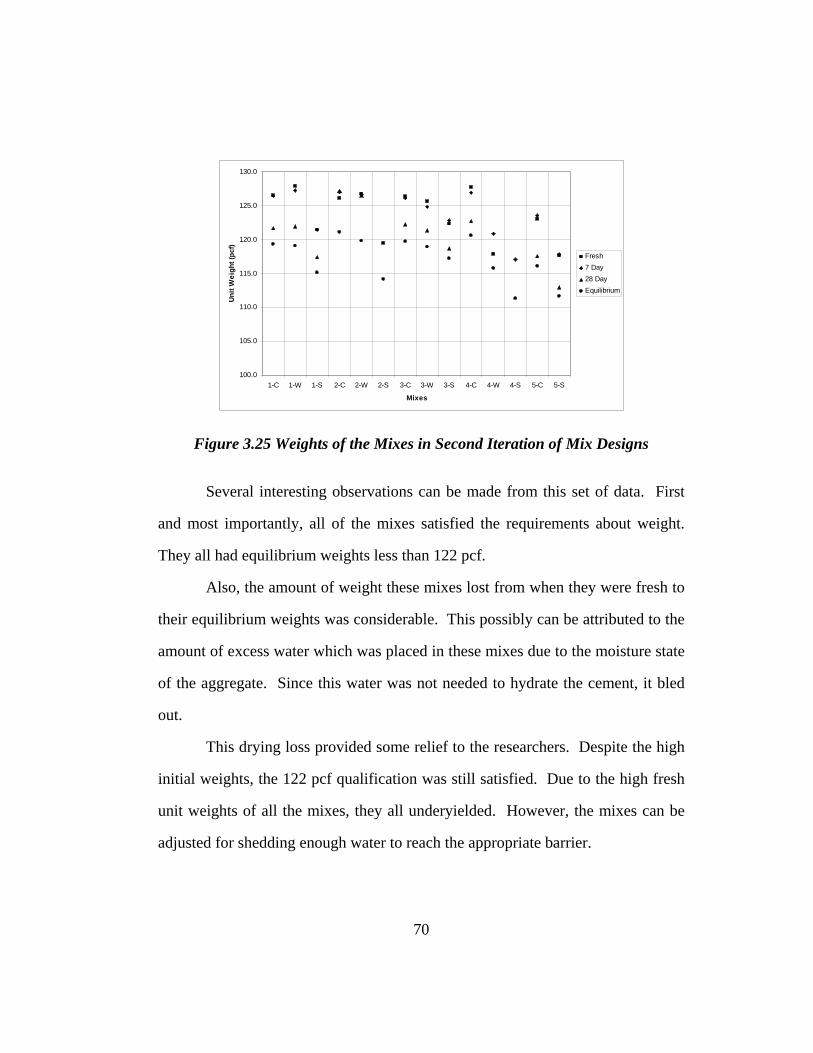
100.0
105.0
110.0
115.0
120.0
125.0
130.0
1-C 1-W 1-S 2-C 2-W 2-S 3-C 3-W 3-S 4-C 4-W 4-S 5-C 5-S
Mixes
Uni
t Wei
ght (
pcf)
Fresh7 Day28 DayEquilibrium
Figure 3.25 Weights of the Mixes in Second Iteration of Mix Designs
Several interesting observations can be made from this set of data. First
and most importantly, all of the mixes satisfied the requirements about weight.
They all had equilibrium weights less than 122 pcf.
Also, the amount of weight these mixes lost from when they were fresh to
their equilibrium weights was considerable. This possibly can be attributed to the
amount of excess water which was placed in these mixes due to the moisture state
of the aggregate. Since this water was not needed to hydrate the cement, it bled
out.
This drying loss provided some relief to the researchers. Despite the high
initial weights, the 122 pcf qualification was still satisfied. Due to the high fresh
unit weights of all the mixes, they all underyielded. However, the mixes can be
adjusted for shedding enough water to reach the appropriate barrier.
70
3.3 THIRD ITERATION
After completion of the first two iterations, the 6000 psi mix design was
close to finalization while the 8000 psi mix design still had not been obtained.
The first two iterations had narrowed down some decisions such as the aggregate
that would be used for the project. Also, it provided excellent experience in
producing concrete to ASTM standards. Therefore, on this third iteration, it was
expected that the final mix design would be designed and produced.
3.3.1 Modification of Variables
Perhaps the biggest decision that was made after the second iteration
involved choice of aggregate. The results overwhelmingly suggested that Clodine
provided the best mix of strength and workability for the project. Due to its larger
size than Streetman, the Clodine required less superplasticizer to be workable.
However, its larger size did not take away its ability to gain strength where it was
extremely competitive with the Streetman aggregate in producing the strength that
was needed.
Also, the second iteration gave good indications about the amount of
cement that would be needed to reach the 8000 psi barrier. The 6000 psi barrier
had easily been reached, but 8000 psi still needed to be achieved. It was obvious
from the concrete results that more cement would be needed and therefore, a
lower water/cement ratio.
71

3.3.1.1 Amount of Cement and Water/Cement Ratio
From the previous two iterations, it was apparent that the water/cement
ratio had been narrowed down to between 0.25 and 0.30 for both 6000 psi and
8000 psi mixes. Also, the 6000 psi barrier had easily been reached, leaving the
remaining decisions how to find a workable mix for use in the precast
environment.
However, the 8000 psi target was still posing problems. Although some of
the mixes from the second iteration had exceeded 8000 psi, they had not exceeded
it by enough to say with confidence that the mixes were 8000 psi mixes.
Therefore, some additional strength was still needed.
Due to the inadequate strength, the next order of business was to increase
the amount of cement in the mixes from the previous maximum of 800 pounds of
cement per cubic yard. Therefore, this sequence of mixes looked to increase the
amount of cement to reach the 8000 psi barrier.
Table 3.7 presents the amount of cement in the final sequence of mixes.
Table 3.7 Amount of Cementitious Material per Cubic Yard for Final Iteration Mixes
Mix Number Lbs. Cementitious Material/Cubic Yard
Water/Cement Ratio
Mix F-1 550 0.36 Mix F-2 600 0.35 Mix F-3 600 0.35 Mix F-4 600 0.35 Mix F-5 657 0.33 Mix F-6 800 0.28 Mix F-7 978 0.25
72

Mix F-8 978 0.25 Mix F-9 978 0.25
As can be seen from the table, Mixes F-1 through F-5 were focused on
narrowing down the 6000 psi mix. The weights of cement in the mix designs
were similar to the amount seen in the mixes in the first and second iterations
shown in Tables 3.1 and 3.4. Mix F-1 was concerned with seeing if less cement
could be used, thereby making the concrete more economical. Mixes F-2 through
F-4 were refinements of earlier mixes. Mix F-5 was done in response to
underyielding problems.
Mixes F-6 through F-9 were done in response to the 8000 psi strength
problems. Mixes F-7 through F-9 were based upon a mix done for an earlier high
strength normal weight concrete project for TxDOT done by John Myers [11].
The volume of normal weight aggregate was replaced by an equal volume of
lightweight aggregate.
3.3.1.2 Chemical Admixtures
For this sequence of the project, the same chemical admixtures were used.
Again, Daratard-17 and ADVA Superflow were the two chemical admixtures of
choice. However, it was expected that larger amounts of superplasticizer and
retardant would reflect the large amount of cement being used in Mixes F-7
through F-9.
The same goal of 7-9 inches of slump was still the guide for the amount of
superplasticizer.
73
3.3.2 Procedures
The same procedures as those used in the second iteration were followed
for these nine mixes. Again, a rodded unit weight of the aggregate was taken to
ensure that the aggregates were in a consistent moisture state when poured. There
was a little more consistency for this portion of the project since Clodine was used
as the aggregate for all of the mixes. Because of these reasons, the variability
inherent to the aggregate was reduced to a manageable level.
Also, the aggregate was dried the same way, by placing it on a screen and
allowing it to dry with the aid of gravity. The other materials were all batched in
the same way.
The big difference came in the type of cylinders used. Previously, 4 inch
X 8 inch cylinders had been used for all of the tests using cylinders throughout the
project. They minimized the concrete usage as well as made the placement easier.
However, along with the 4 inch X 8 inch cylinders, 6 inch X 12 inch cylinders
were also cast. They would provide an important check for the tests since the
larger cylinders generally produce more conservative results.
3.3.3 Properties
3.3.3.1 Workability
The mixes designed for 6000 psi did not pose any problems for
workability. They performed similarly to the mixes made with Clodine from the
second iteration, requiring approximately the same amount of chemical admixture
74
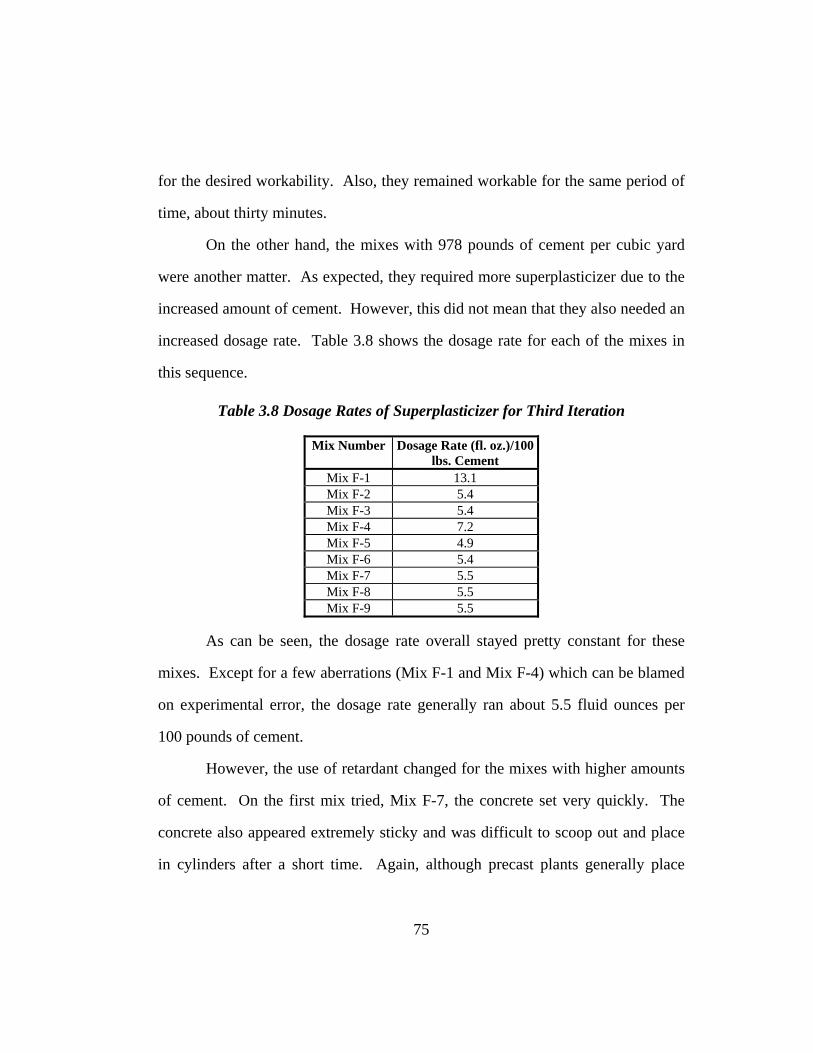
for the desired workability. Also, they remained workable for the same period of
time, about thirty minutes.
On the other hand, the mixes with 978 pounds of cement per cubic yard
were another matter. As expected, they required more superplasticizer due to the
increased amount of cement. However, this did not mean that they also needed an
increased dosage rate. Table 3.8 shows the dosage rate for each of the mixes in
this sequence.
Table 3.8 Dosage Rates of Superplasticizer for Third Iteration
Mix Number Dosage Rate (fl. oz.)/100 lbs. Cement
Mix F-1 13.1 Mix F-2 5.4 Mix F-3 5.4 Mix F-4 7.2 Mix F-5 4.9 Mix F-6 5.4 Mix F-7 5.5 Mix F-8 5.5 Mix F-9 5.5
As can be seen, the dosage rate overall stayed pretty constant for these
mixes. Except for a few aberrations (Mix F-1 and Mix F-4) which can be blamed
on experimental error, the dosage rate generally ran about 5.5 fluid ounces per
100 pounds of cement.
However, the use of retardant changed for the mixes with higher amounts
of cement. On the first mix tried, Mix F-7, the concrete set very quickly. The
concrete also appeared extremely sticky and was difficult to scoop out and place
in cylinders after a short time. Again, although precast plants generally place
75

their concrete very quickly, this could pose a problem since more than 15 minutes
of dependable workable time is needed.
To combat this problem, retardant dosage was increased. Beforehand, a
negligible amount of retardant was added to the mix. However, after
encountering this problem in Mix F-7, the retarder dosage was increased for Mix
F-8 from 1.1 fluid ounces per 100 pounds cement to 2.75 fluid ounces per 100
pounds cement. In Mix F-8, this seemed to adequately restrain the reaction of the
cement with the water enough to place all the concrete. Retardant would then
become an integral part of the chemical admixture mix.
3.3.3.2 Mechanical Properties
3.3.3.2.1 Compressive Strength
For these results, the data from the 6 inch X 12 inch cylinders will be
presented as these data are more reliable and accepted.
Figure 3.26 presents the compressive strengths from the mixes designed
for 6000 psi.
76
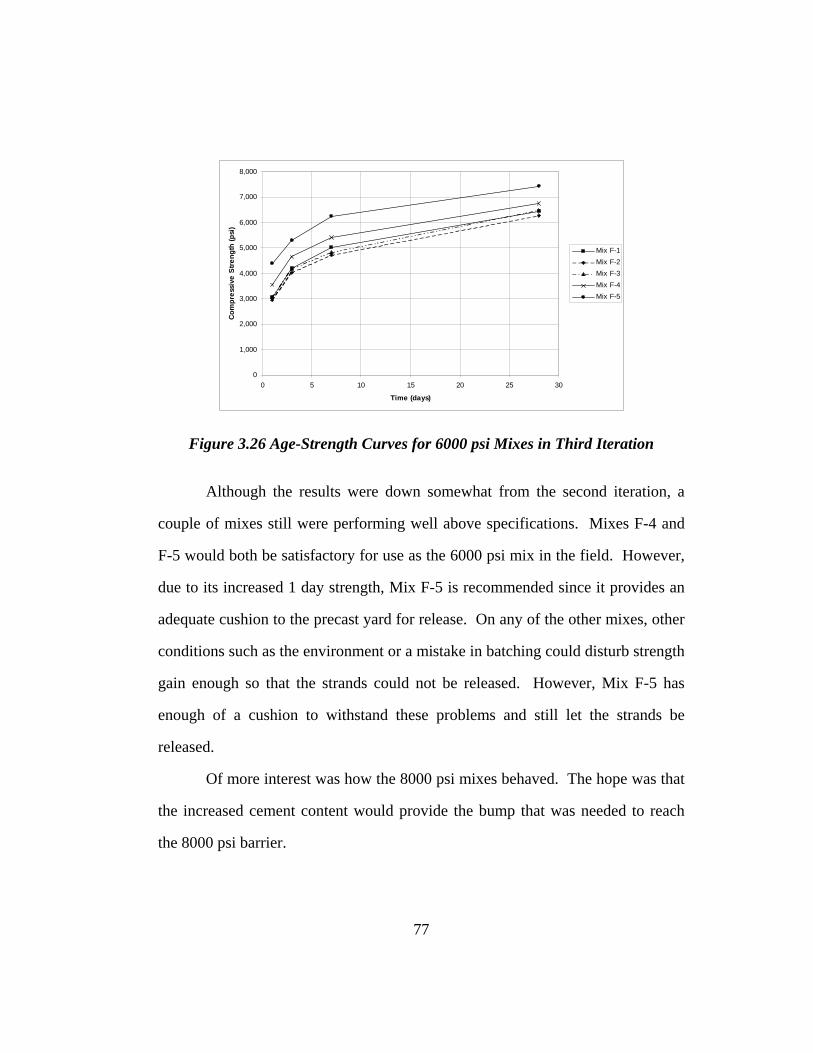
0
1,000
2,000
3,000
4,000
5,000
6,000
7,000
8,000
0 5 10 15 20 25 30
Time (days)
Com
pres
sive
Stre
ngth
(psi
)
Mix F-1Mix F-2Mix F-3Mix F-4Mix F-5
Figure 3.26 Age-Strength Curves for 6000 psi Mixes in Third Iteration
Although the results were down somewhat from the second iteration, a
couple of mixes still were performing well above specifications. Mixes F-4 and
F-5 would both be satisfactory for use as the 6000 psi mix in the field. However,
due to its increased 1 day strength, Mix F-5 is recommended since it provides an
adequate cushion to the precast yard for release. On any of the other mixes, other
conditions such as the environment or a mistake in batching could disturb strength
gain enough so that the strands could not be released. However, Mix F-5 has
enough of a cushion to withstand these problems and still let the strands be
released.
Of more interest was how the 8000 psi mixes behaved. The hope was that
the increased cement content would provide the bump that was needed to reach
the 8000 psi barrier.
77

0
1,000
2,000
3,000
4,000
5,000
6,000
7,000
8,000
9,000
0 5 10 15 20 25 30
Time (days)
Com
pres
sive
Stre
ngth
(psi
)
Mix F-6Mix F-7Mix F-8Mix F-9
Figure 3.27 Age-Strength Curves for 8000 psi Mixes for Third Iteration
From Figure 3.27, it is seen that three concrete mixes finally reached the
strengths needed for 8000 psi. Mix F-6, a repeat of a mix in the second iteration,
almost reached 8000 psi just like the mixes that had 800 pounds of cemetitious
materials. Mixes F-7 and F-8, which were exactly the same, except that different
amounts of retardant were used to control the workability, performed nearly the
same. Mix F-8 lagged a bit due to the extra retardant but eventually caught up at
28 days. Both mixes were well above the 8000 psi level. Mix F-9 had an
increased amount of coarse aggregate but proved to be a little too low in strength.
Therefore, Mix F-8 was chosen as the 8000 psi mix for use in the precast
yard for the production of the beams.
78
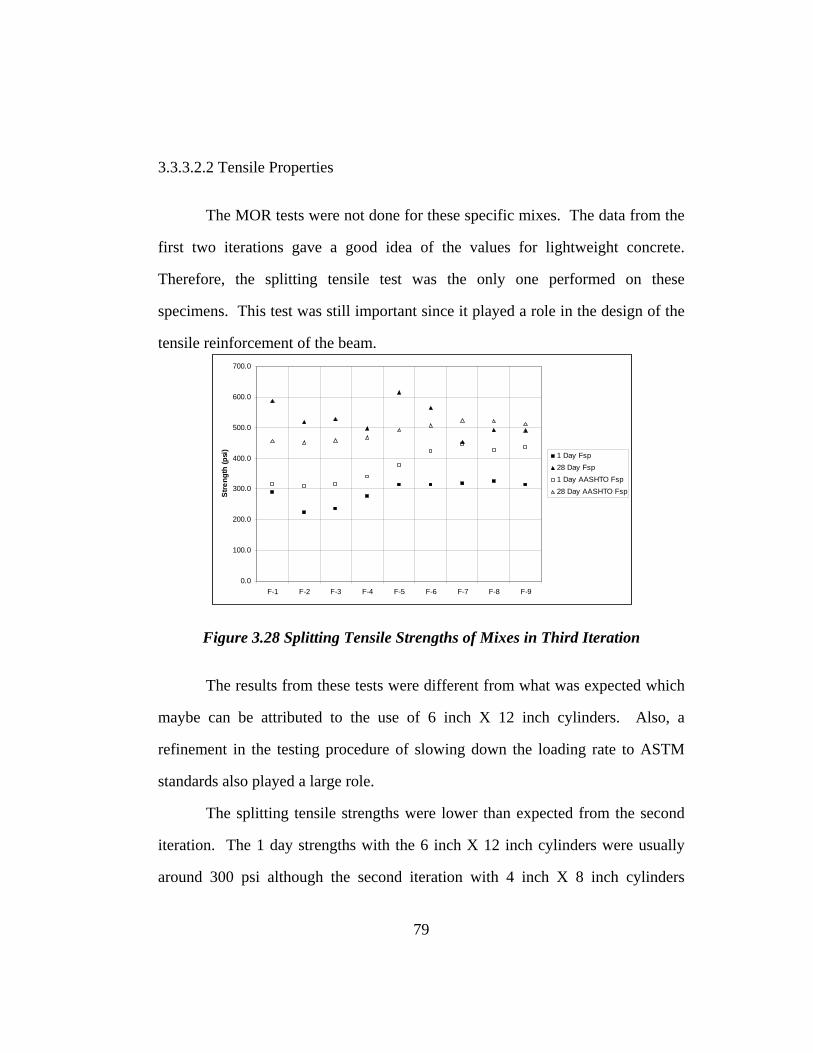
3.3.3.2.2 Tensile Properties
The MOR tests were not done for these specific mixes. The data from the
first two iterations gave a good idea of the values for lightweight concrete.
Therefore, the splitting tensile test was the only one performed on these
specimens. This test was still important since it played a role in the design of the
tensile reinforcement of the beam.
0.0
100.0
200.0
300.0
400.0
500.0
600.0
700.0
F-1 F-2 F-3 F-4 F-5 F-6 F-7 F-8 F-9
Stre
ngth
(psi
)
1 Day Fsp28 Day Fsp1 Day AASHTO Fsp28 Day AASHTO Fsp
Figure 3.28 Splitting Tensile Strengths of Mixes in Third Iteration
The results from these tests were different from what was expected which
maybe can be attributed to the use of 6 inch X 12 inch cylinders. Also, a
refinement in the testing procedure of slowing down the loading rate to ASTM
standards also played a large role.
The splitting tensile strengths were lower than expected from the second
iteration. The 1 day strengths with the 6 inch X 12 inch cylinders were usually
around 300 psi although the second iteration with 4 inch X 8 inch cylinders
79
generally produced strengths around 400 psi. Also, the 28 day strengths came out
to be around 500 psi which was a little lower than the usual 550-600 psi of the
second iteration.
These results can be attributed to the change in cylinders size and to the
slowing of the loading rate used in this round of tests. The concrete felt the full
effect of the load this time and was properly allowed to react, producing the lower
results.
Also, the concrete was allowed to dry too much before the test. Martinez
[2] showed that splitting tensile strengths of dry cylinders are only 50-60% those
of wet cylinders. These cylinders had dried for 45 minutes prior to testing,
affecting the strength.
3.3.3.2.3 Unit Weight Results
Again, the unit weights of the concrete mixes were taken at various times
to make sure they followed specifications of being not more than 122 pounds per
cubic foot (pcf) at equilibrium weight. Figure 3.29 presents these results.
80

110.0
112.0
114.0
116.0
118.0
120.0
122.0
124.0
126.0
128.0
F-1 F-2 F-3 F-4 F-5 F-6 F-7 F-8 F-9
Mix
Uni
t Wei
ght (
poun
ds p
er c
ubic
foot
)
Fresh7 Day28 Day
Figure 3.29 Unit Weights of Mixes from Third Iteration
Although equilibrium weight was not measured, the unit weights shown in
Figure 3.15 prove that the concrete satisfies the requirement since all the 28 day
weights meet the 122 pcf requirement. From prior experience in the first two
iterations, it is known that the concrete loses weight from 28 day weight to
equilibrium. Therefore, these mixes performed well.
From Figure 3.29, it is shown that all the unit weights meet the 122 pcf
barrier except F-7 which falls closely enough since it will still lose weight until
equilibrium. The mixes using more cement such as F-7 through F-9 had larger
unit weights due to the reduction of lightweight aggregate volume. However,
they still met the specification, making them available for use.
81
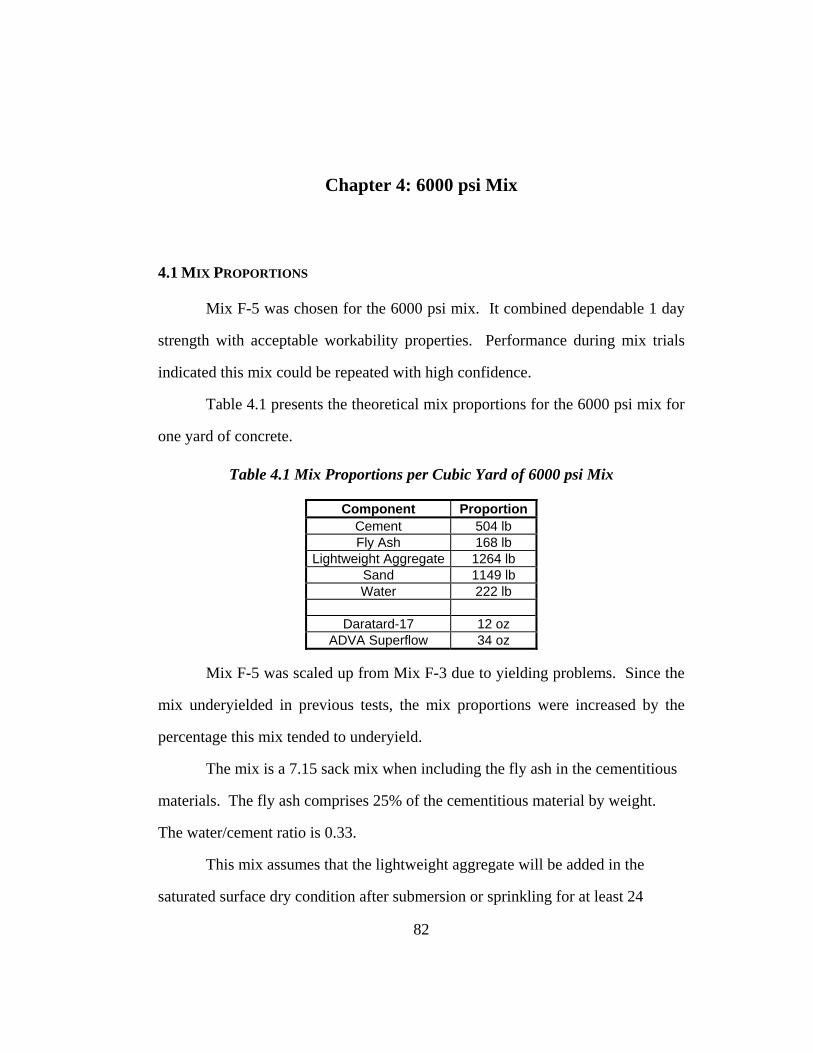
Chapter 4: 6000 psi Mix
4.1 MIX PROPORTIONS
Mix F-5 was chosen for the 6000 psi mix. It combined dependable 1 day
strength with acceptable workability properties. Performance during mix trials
indicated this mix could be repeated with high confidence.
Table 4.1 presents the theoretical mix proportions for the 6000 psi mix for
one yard of concrete.
Table 4.1 Mix Proportions per Cubic Yard of 6000 psi Mix
Component Proportion Cement 504 lb Fly Ash 168 lb
Lightweight Aggregate 1264 lb Sand 1149 lb Water 222 lb
Daratard-17 12 oz
ADVA Superflow 34 oz
Mix F-5 was scaled up from Mix F-3 due to yielding problems. Since the
mix underyielded in previous tests, the mix proportions were increased by the
percentage this mix tended to underyield.
The mix is a 7.15 sack mix when including the fly ash in the cementitious
materials. The fly ash comprises 25% of the cementitious material by weight.
The water/cement ratio is 0.33.
This mix assumes that the lightweight aggregate will be added in the
saturated surface dry condition after submersion or sprinkling for at least 24
82
hours. The proportions of the chemical admixtures are adjustable to optimize
their use. The amounts reported here provide a guideline for approximate
amounts to be used. However, more superplasticizer could be used depending on
weather conditions.
4.2 PROPERTIES
4.2.1 Workability
Among the biggest concerns at the initiation of this project was achieving
adequate workability. Due to the high cement contents, some difficulty was
expected.
However, in lab mixing, this mix performed admirably in workability
measures. The mix provided enough time for placement in forms at a prestressed
plant as long as mechanical vibration was available, a standard practice at precast
plants.
4.2.1.1 Slump
Due to the demands of placement, this concrete needed to flow. Since
prestressed plants use mechanized carts with hoppers and chutes (sidewinders) for
placement, high slump concrete was needed to aid in removal from the sidewinder
into the forms. A sidewinder is shown in Figure 4.1.
83

Hopper
Chute
Figure 4.1 Sidewinder at Heldenfels Precast Plant
The sidewinders do not have any way to mix the concrete or vibrate it.
This caused the need for concrete that could easily slide out of the sidewinder into
the forms.
Slump for this concrete was specified between 7 and 9 inches. A concrete
with this amount of slump is extremely thick. This slump was achieved through
the addition of the appropriate amount of superplasticizer. Before the
superplasticizer is added to the mixer, this concrete mix has approximately 1/2 to
1 inch of slump.
In the trial mixing period, the 6000 psi mix had 6 fluid ounces of ADVA
Superflow added to achieve 6.5 inches of slump. This amount was appropriate
for five cubic feet of concrete. Factored for a cubic yard of concrete would give
34 fluid ounces of superplasticizer. This is the amount used in the final mix.
84
However, this amount is not definitive. Due to the inherent variability of
concrete, some change in amount of superplasticizer should be expected
4.2.1.2 Finishability
The other aspect of workability lies in the finishability of the concrete.
This is a measure of how well the concrete responds to placement into edges and
corners and how well the concrete takes a smooth surface.
For the application in pretensioned girders, the concrete did not need to
finish smoothly. Actually, a rough surface is preferable since that surface
promotes good bond between the deck and girder, allowing good transfer of the
horizontal shear between the deck and girder.
No good, objective measure exists for finishability. Relying on first-hand
observation is the only way to have any idea as to how well the concrete finishes.
During the trial mixes in the laboratory, finishing the concrete to a smooth
surface was difficult. Even with extreme caution and care, some aggregate was
still visible in the top portion of concrete surfaces after finishing of the concrete.
The aggregate was completely covered by paste and only protruded above the
surface by approximately 1/16 inch, a minor amount. This finish was acceptable
due to the rough surface desired for good bond.
The concrete could be pushed and shaped into position by a trowel. Also,
fine troweling of the surface did finish the surface to the rough surface described
above.
85

4.2.1.3 Consistency
Another important characteristic of the concrete was its consistency. This
property is closely related to slump and finishability, yet encompasses some
different aspects.
After completion of rotation in the laboratory mixer, the concrete
remained with a slump of 7 to 9 inches for fifteen minutes. There was no
segregation of the paste from the aggregate and the aggregate remained properly
coated for the whole time.
After thirty minutes minutes, the concrete started to bind. The concrete
was cohesive and difficult to scoop from the wheelbarrow. The concrete could
still be vibrated into place. However, the difficulty in handling had increased.
Mixing with a shovel after this time alleviated the problem somewhat.
The concrete remained in this state for a substantial period of time, approximately
thirty minutes. Since prestressed plants place their concrete extremely fast, this
provided an acceptable window of time for the concrete.
4.2.2 Mechanical Properties
Along with the workability properties, the mechanical properties of the
concrete played a large role in its acceptance for usage. Mix F-5 satisfied the
specifications placed upon it at the beginning of the project.
86
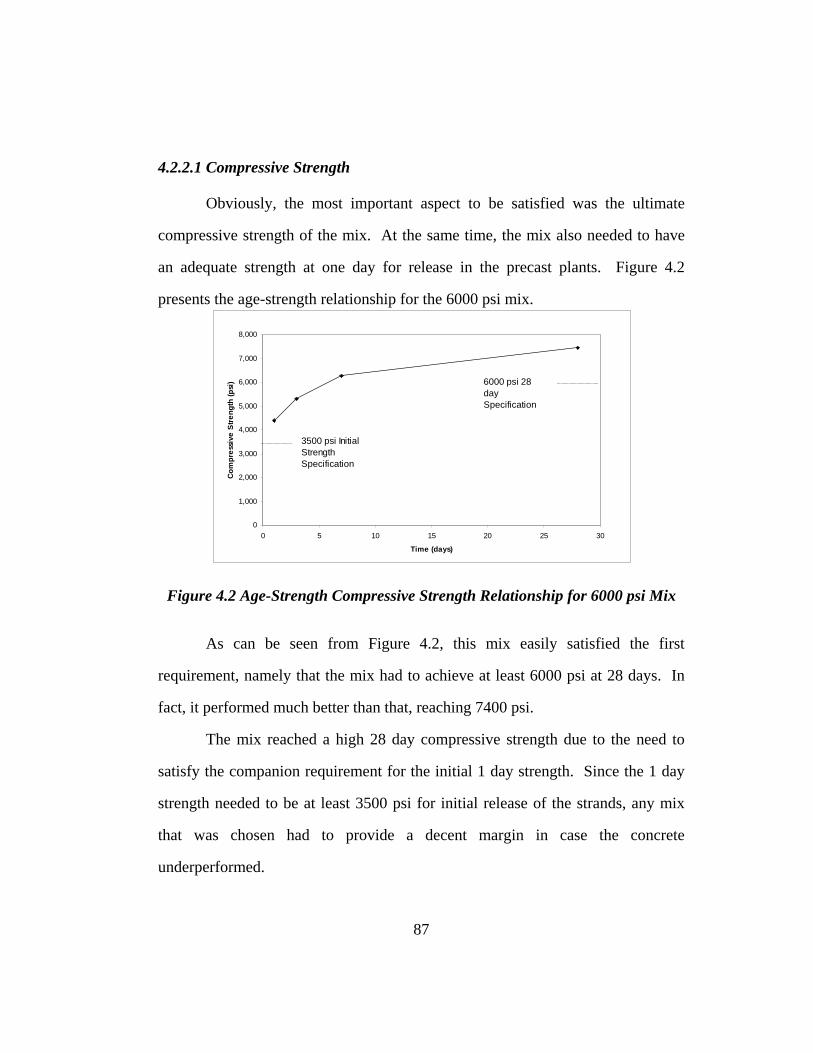
4.2.2.1 Compressive Strength
Obviously, the most important aspect to be satisfied was the ultimate
compressive strength of the mix. At the same time, the mix also needed to have
an adequate strength at one day for release in the precast plants. Figure 4.2
presents the age-strength relationship for the 6000 psi mix.
0
1,000
2,000
3,000
4,000
5,000
6,000
7,000
8,000
0 5 10 15 20 25 30
Time (days)
Com
pres
sive
Stre
ngth
(psi
)
3500 psi Initial Strength Specification
6000 psi 28 day Specification
Figure 4.2 Age-Strength Compressive Strength Relationship for 6000 psi Mix
As can be seen from Figure 4.2, this mix easily satisfied the first
requirement, namely that the mix had to achieve at least 6000 psi at 28 days. In
fact, it performed much better than that, reaching 7400 psi.
The mix reached a high 28 day compressive strength due to the need to
satisfy the companion requirement for the initial 1 day strength. Since the 1 day
strength needed to be at least 3500 psi for initial release of the strands, any mix
that was chosen had to provide a decent margin in case the concrete
underperformed.
87

There were other interesting aspects to the performance of this mix. The
concrete continued to gain substantially in strength after seven days, a somewhat
surprising result considering the use of Type III cement. In fact, the strength gain
is quite gradual and consistent, indicating that this concrete probably gained more
strength past 28 days.
This gain in strength can be attributed to the use of fly ash. The use of fly
ash contributes to the long term strength gain of the concrete since it is similar to
cement in its chemistry but reacts at a much slower rate. The fly ash also helps
increase the ultimate strength of the concrete at later ages. This is invaluable due
to the use of the Type III cement. The fly ash helps counteract the tendency of
Type III cement to stop gaining strength after seven days.
4.2.2.2 Modulus of Elasticity
Modulus of elasticity plays a large role in determining the deflections of
the member. Overall, lightweight concrete has values of modulus of elasticity
less than those of normal weight concrete. However, of more interest is
comparing the values to other tests done on lightweight concrete. In Figure 4.3,
the data from the 6000 psi mix is compared to data from four other papers. All
involved lightweight concrete and focused mainly on high strength concrete.
88

0
1
2
3
4
5
6
7
40 50 60 70 80 90 100 110 120
fc'^0.5 (psi)
E*(1
45/w
c)^1
.5*1
E-06
(psi
)
MartinezZhang and GjorvNilsen and AitcenShideler6000 psi Mix
AASHTO Equation
Martinez Equation
Figure 4.3 Comparison of Moduli of Elasticity days for 6000 psi Mix
Figure 4.3 shows how well the concrete designed for this project
compared to other concrete in other projects. Before discussion of the 6000 psi
concrete, one item must be noted. This graph substantiates the assertion of
Martinez [2] that the AASHTO equation does not predict the modulus of elasticity
well for high strength lightweight concrete. It also shows that the equation
developed by Martinez for lightweight concrete does a better job of predicting
modulus of elasticity.
For the 6000 psi concrete, it performed well within the scatter band of the
Martinez [2], Shideler [5], and Zhang and Gjørv [16] data which were similar in
strength and composition to the concrete developed in this project. Of the two
data points for the 6000 psi concrete, the more important data point, that for the
concrete at 28 days, lay close to Equation 2.1.
89
From this data, it can be seen that the 6000 psi concrete performed well in
the modulus of elasticity test and was similar to other concrete produced in other
tests.
4.2.2.3 Tensile Strength
Since this mix was F-5, the tensile strength was determined with the use of
6 X 12 inch splitting tensile cylinders. In Figure 4.4, the splitting tensile strength
of the 6000 psi mix is compared to data from Martinez [2] and Zhang [16]. Both
Martinez and Zhang used all-lightweight concrete which have lower values of
splitting tensile strength. Therefore, both AASHTO equations for all-lightweight
and sand-lightweight concrete are included in the graph to give a full
understanding of the behavior.
90
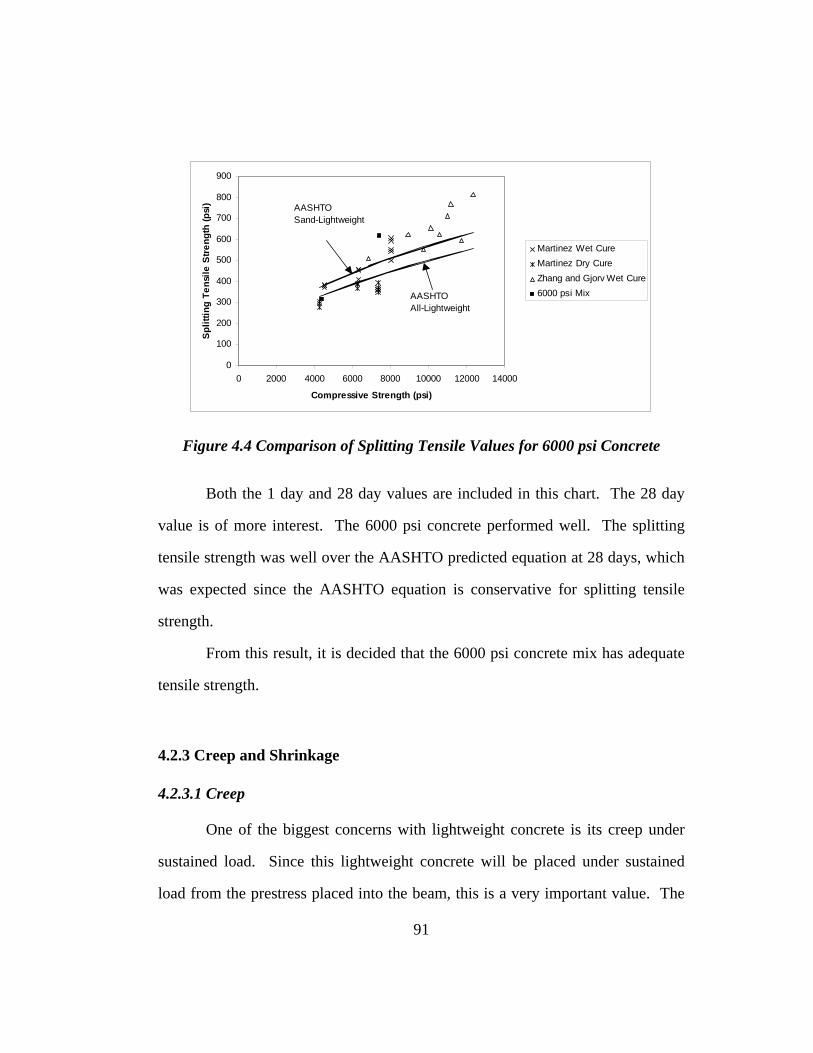
0
100
200
300
400
500
600
700
800
900
0 2000 4000 6000 8000 10000 12000 14000
Compressive Strength (psi)
Split
ting
Tens
ile S
tren
gth
(psi
)
Martinez Wet CureMartinez Dry CureZhang and Gjorv Wet Cure6000 psi MixAASHTO
All-Lightweight
AASHTOSand-Lightweight
Figure 4.4 Comparison of Splitting Tensile Values for 6000 psi Concrete
Both the 1 day and 28 day values are included in this chart. The 28 day
value is of more interest. The 6000 psi concrete performed well. The splitting
tensile strength was well over the AASHTO predicted equation at 28 days, which
was expected since the AASHTO equation is conservative for splitting tensile
strength.
From this result, it is decided that the 6000 psi concrete mix has adequate
tensile strength.
4.2.3 Creep and Shrinkage
4.2.3.1 Creep
One of the biggest concerns with lightweight concrete is its creep under
sustained load. Since this lightweight concrete will be placed under sustained
load from the prestress placed into the beam, this is a very important value. The
91
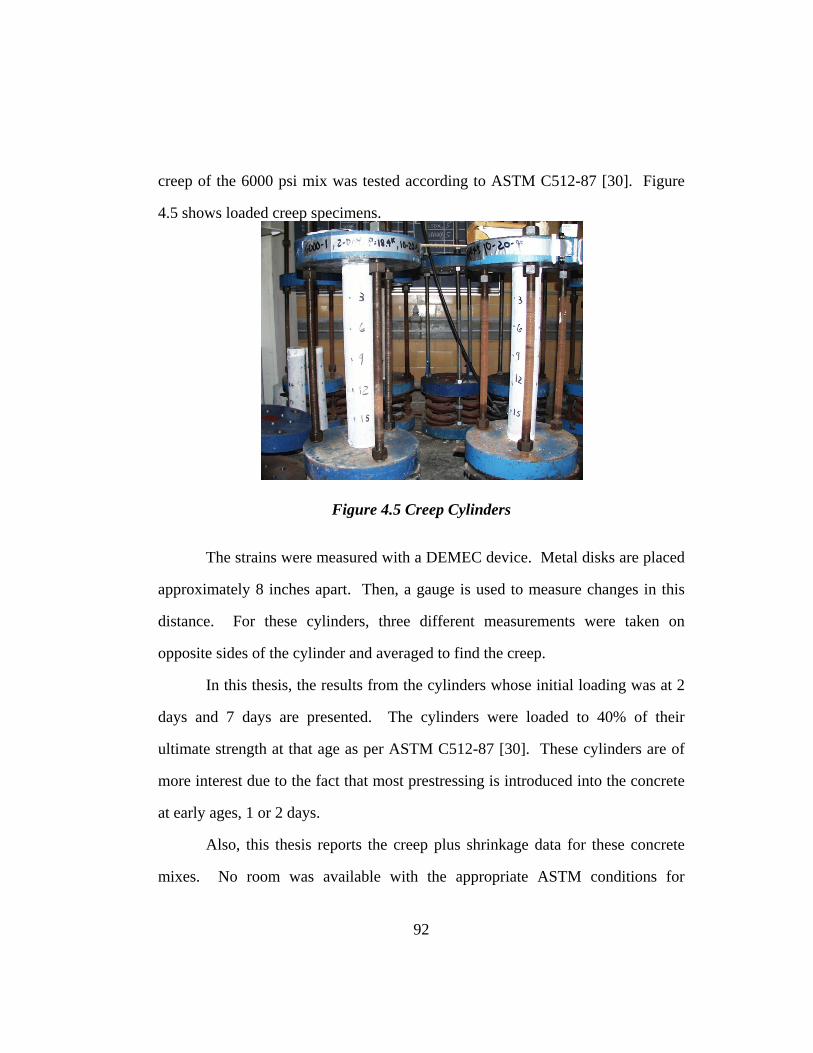
creep of the 6000 psi mix was tested according to ASTM C512-87 [30]. Figure
4.5 shows loaded creep specimens.
Figure 4.5 Creep Cylinders
The strains were measured with a DEMEC device. Metal disks are placed
approximately 8 inches apart. Then, a gauge is used to measure changes in this
distance. For these cylinders, three different measurements were taken on
opposite sides of the cylinder and averaged to find the creep.
In this thesis, the results from the cylinders whose initial loading was at 2
days and 7 days are presented. The cylinders were loaded to 40% of their
ultimate strength at that age as per ASTM C512-87 [30]. These cylinders are of
more interest due to the fact that most prestressing is introduced into the concrete
at early ages, 1 or 2 days.
Also, this thesis reports the creep plus shrinkage data for these concrete
mixes. No room was available with the appropriate ASTM conditions for
92
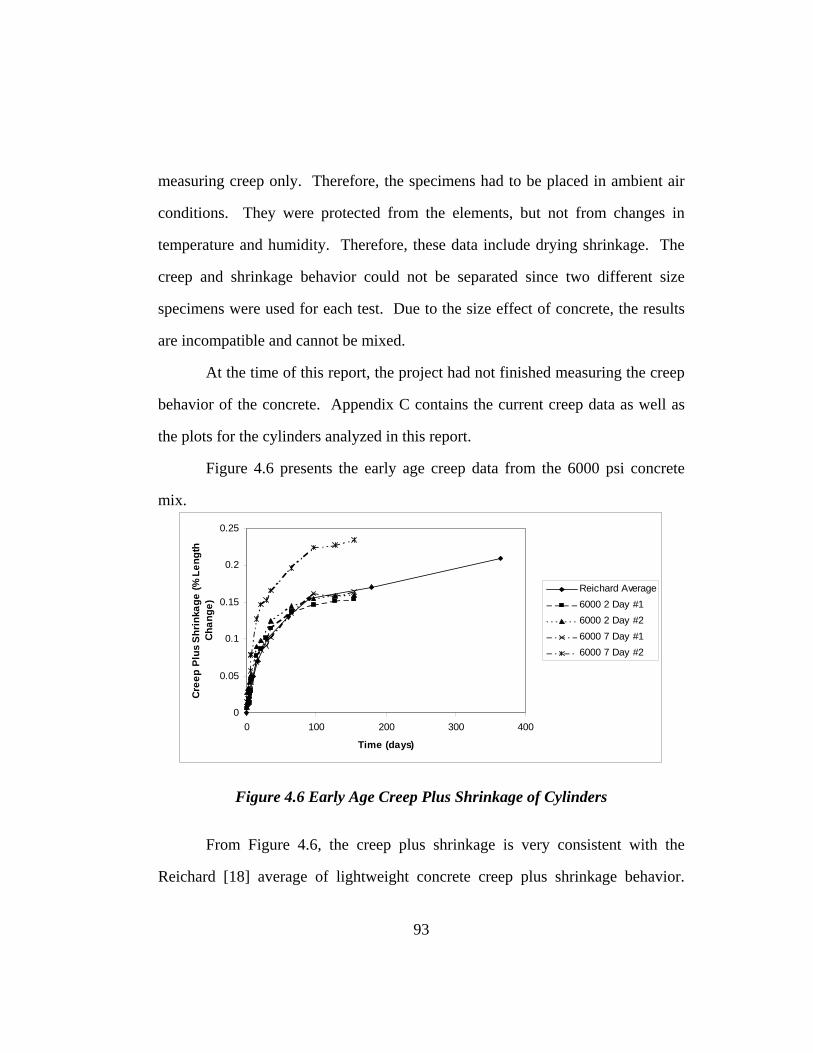
measuring creep only. Therefore, the specimens had to be placed in ambient air
conditions. They were protected from the elements, but not from changes in
temperature and humidity. Therefore, these data include drying shrinkage. The
creep and shrinkage behavior could not be separated since two different size
specimens were used for each test. Due to the size effect of concrete, the results
are incompatible and cannot be mixed.
At the time of this report, the project had not finished measuring the creep
behavior of the concrete. Appendix C contains the current creep data as well as
the plots for the cylinders analyzed in this report.
Figure 4.6 presents the early age creep data from the 6000 psi concrete
mix.
0
0.05
0.1
0.15
0.2
0.25
0 100 200 300 400
Time (days)
Cree
p P
lus
Shr
inka
ge (%
Len
gth
Chan
ge)
Reichard Average6000 2 Day #16000 2 Day #26000 7 Day #16000 7 Day #2
Figure 4.6 Early Age Creep Plus Shrinkage of Cylinders
From Figure 4.6, the creep plus shrinkage is very consistent with the
Reichard [18] average of lightweight concrete creep plus shrinkage behavior.
93
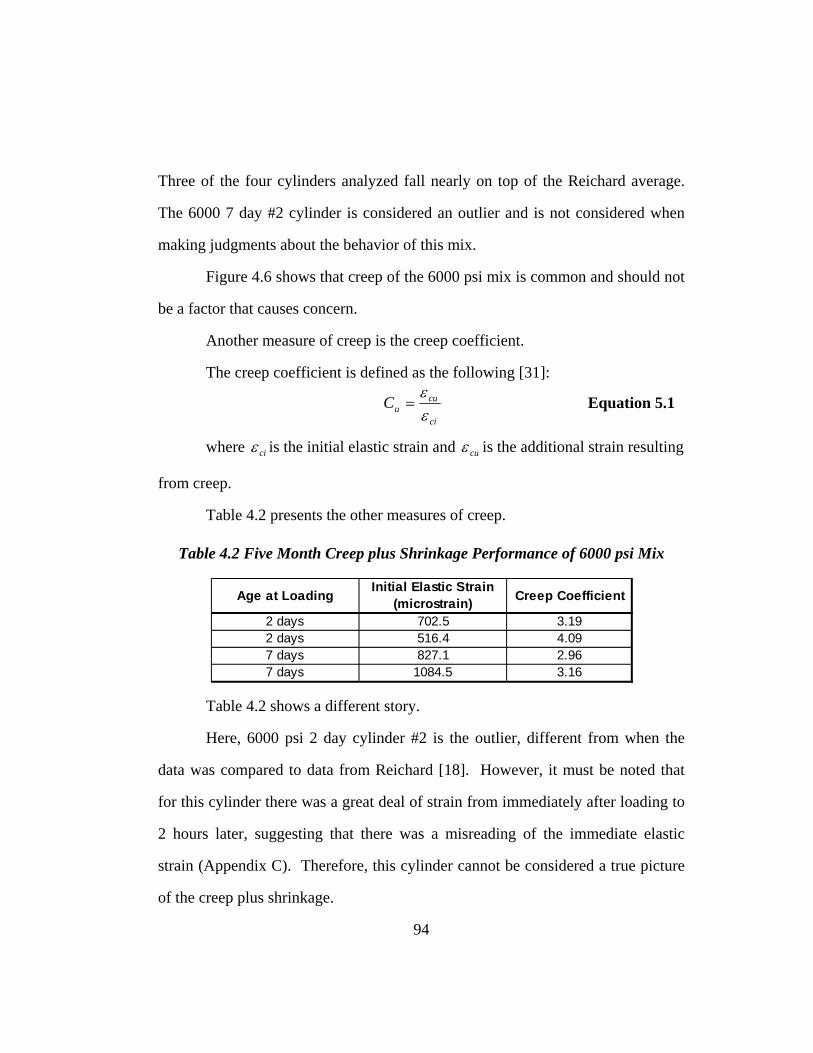
Three of the four cylinders analyzed fall nearly on top of the Reichard average.
The 6000 7 day #2 cylinder is considered an outlier and is not considered when
making judgments about the behavior of this mix.
Figure 4.6 shows that creep of the 6000 psi mix is common and should not
be a factor that causes concern.
Another measure of creep is the creep coefficient.
The creep coefficient is defined as the following [31]:
ci
cuuC
εε
= Equation 5.1
where ciε is the initial elastic strain and cuε is the additional strain resulting
from creep.
Table 4.2 presents the other measures of creep.
Table 4.2 Five Month Creep plus Shrinkage Performance of 6000 psi Mix
Age at Loading Initial Elastic Strain (microstrain) Creep Coefficient
2 days 702.5 3.192 days 516.4 4.097 days 827.1 2.967 days 1084.5 3.16
Table 4.2 shows a different story.
Here, 6000 psi 2 day cylinder #2 is the outlier, different from when the
data was compared to data from Reichard [18]. However, it must be noted that
for this cylinder there was a great deal of strain from immediately after loading to
2 hours later, suggesting that there was a misreading of the immediate elastic
strain (Appendix C). Therefore, this cylinder cannot be considered a true picture
of the creep plus shrinkage.
94
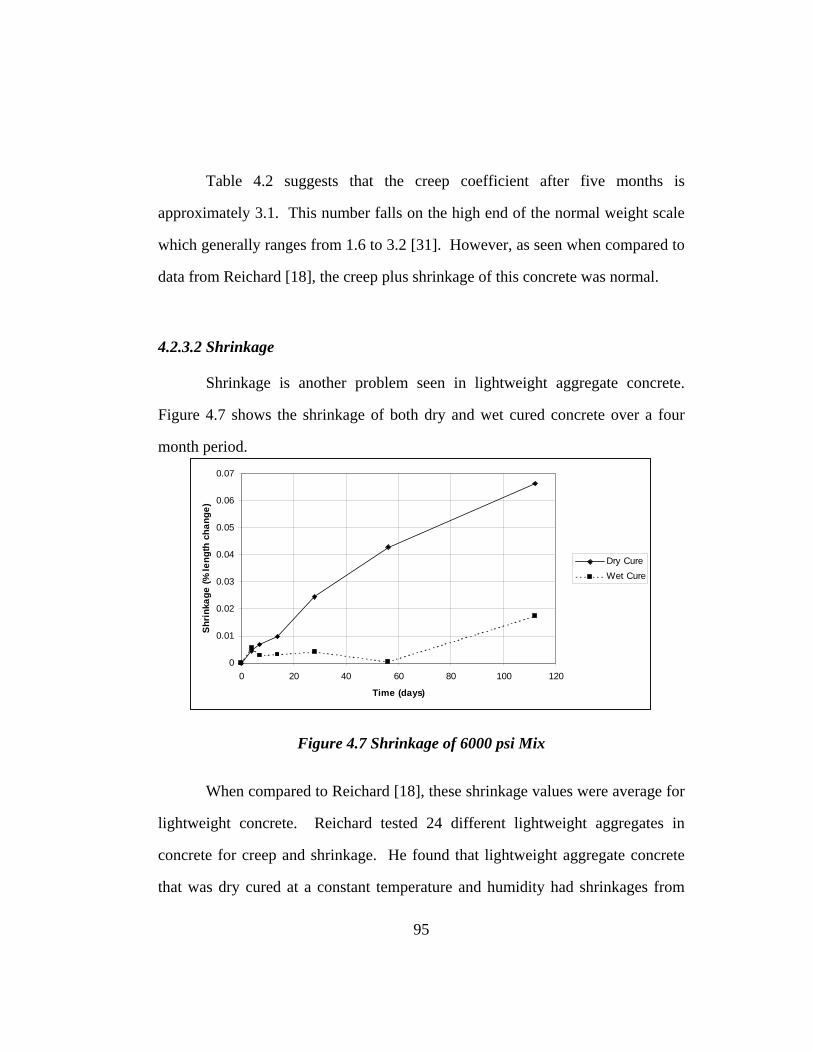
Table 4.2 suggests that the creep coefficient after five months is
approximately 3.1. This number falls on the high end of the normal weight scale
which generally ranges from 1.6 to 3.2 [31]. However, as seen when compared to
data from Reichard [18], the creep plus shrinkage of this concrete was normal.
4.2.3.2 Shrinkage
Shrinkage is another problem seen in lightweight aggregate concrete.
Figure 4.7 shows the shrinkage of both dry and wet cured concrete over a four
month period.
0
0.01
0.02
0.03
0.04
0.05
0.06
0.07
0 20 40 60 80 100 120
Time (days)
Shri
nkag
e (%
leng
th c
hang
e)
Dry CureWet Cure
Figure 4.7 Shrinkage of 6000 psi Mix
When compared to Reichard [18], these shrinkage values were average for
lightweight concrete. Reichard tested 24 different lightweight aggregates in
concrete for creep and shrinkage. He found that lightweight aggregate concrete
that was dry cured at a constant temperature and humidity had shrinkages from
95
0.02% to 0.08% at 90 days. From the 6000 psi data, the shrinkage at 90 days in
constant temperature and humidity was approximately 0.055%. Also, Reichard
showed that lightweight concrete shrinkage generally plateaued at approximately
150 days, a data point that has not been reached yet.
Therefore, the shrinkage of the 6000 psi mix was average. The results
agreed with data from Reichard [18], the data upon which ACI Committee 213
[33] bases its creep and shrinkage recommendations.
4.3 JOBSITE PERFORMANCE
One of the most important aspects of this project was to determine how
well the concrete performed when mixed and placed at the precast plant. The
actual use of the concrete would gauge the performance of the concrete and help
determine the ability of precast plants to handle the use of lightweight concrete
for prestressing.
At the jobsite, the aggregate was sprinkled for 48 hours prior to initial use.
For the 6000 psi mix, two different trials were run. On the first day, two different
20 foot beams designed to represent the highest level of reinforcement congestion
likely to be encountered in beams in practice were produced. One used this 6000
psi concrete mix. The other used a companion 8000 psi mix. This allowed
determination of the approximate behavior of the concrete before placement in
full length specimens.
After that, two 40 foot beams were produced using the 6000 psi mix. On
the same day, a normalweight 40 foot beam was also cast.
96

4.3.1 Workability
At the plant, the slump of the concrete was again controlled through the
use of superplasticizer to achieve the desired slump. For the 20 foot beam, one
three cubic yard batch of concrete was used to produce the concrete. For this
batch, a dosage rate of 5.96 oz./100 pounds of cementitious material (cement plus
fly ash) was used. This dosage rate was a little larger than predicted from
laboratory calculations, but this was expected. The concrete produced a slump of
6.5 inches, a little lower than desired. However, the concrete performed
extremely well during placement in the highly congested beams as it required
little vibration to be placed. Overall, the concrete for this beam performed well
and verified the concrete mix design process of the first part of this project.
After observing the initial trial 20 foot beam, it was felt that the mix was
ready for placement into the two 40-ft beams that would actually be load tested
later in the project. To produce these beams, two three-yard batches of concrete
would be mixed. The proportions were expected to be the same as for the 20 foot
beam.
The first batch again used 150 ounces of superplasticizer, a dosage rate of
5.96 oz./100 pounds of cement. The slump for this batch when it left the batch
plant was 9 inches. However, after transport, this concrete had lost 1 inch of
slump and was down to 8 inches.
The slump of the first batch is shown in Figure 4.8.
97

Figure 4.8 Slump of First Batch of 6000 psi Concrete
This concrete proved to be slightly thin (not cohesive). To correct this
problem, the next batch of concrete was given 120 ounces of superplasticizer.
This dosage solved the problem as the concrete retained its slump of 7 inches on
the way to the prestressed bed. Figure 4.9 shows the slump of the second batch.
98
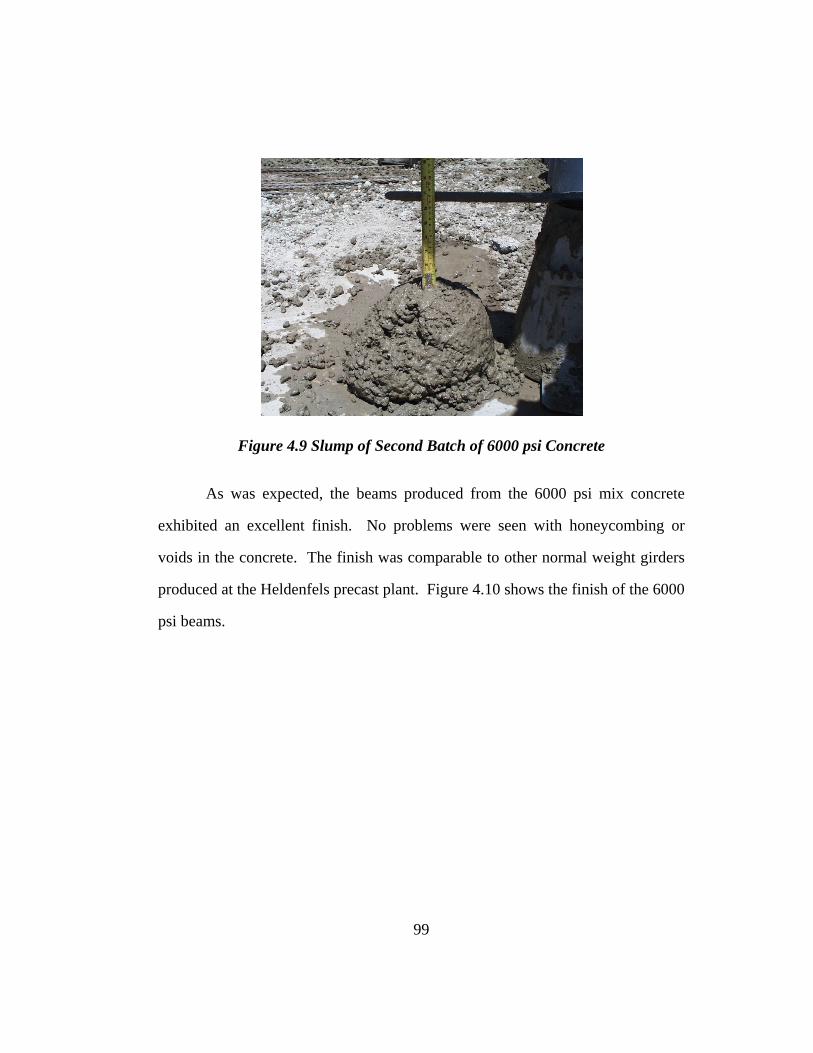
Figure 4.9 Slump of Second Batch of 6000 psi Concrete
As was expected, the beams produced from the 6000 psi mix concrete
exhibited an excellent finish. No problems were seen with honeycombing or
voids in the concrete. The finish was comparable to other normal weight girders
produced at the Heldenfels precast plant. Figure 4.10 shows the finish of the 6000
psi beams.
99
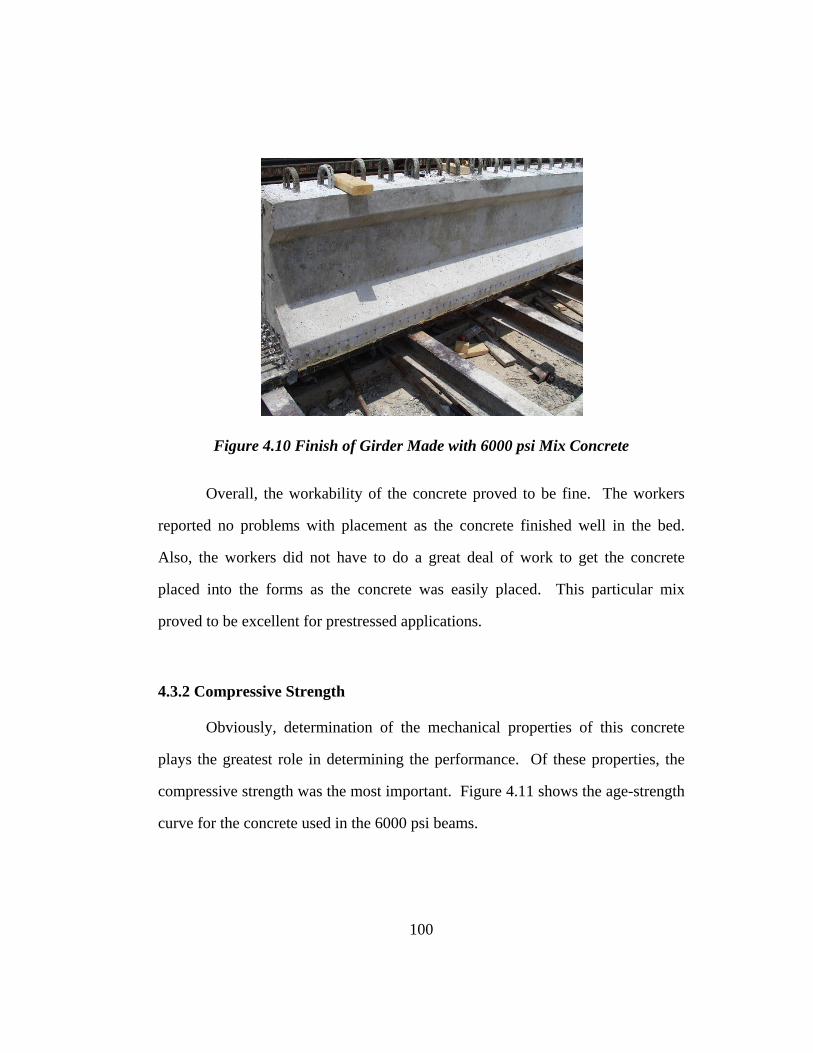
Figure 4.10 Finish of Girder Made with 6000 psi Mix Concrete
Overall, the workability of the concrete proved to be fine. The workers
reported no problems with placement as the concrete finished well in the bed.
Also, the workers did not have to do a great deal of work to get the concrete
placed into the forms as the concrete was easily placed. This particular mix
proved to be excellent for prestressed applications.
4.3.2 Compressive Strength
Obviously, determination of the mechanical properties of this concrete
plays the greatest role in determining the performance. Of these properties, the
compressive strength was the most important. Figure 4.11 shows the age-strength
curve for the concrete used in the 6000 psi beams.
100
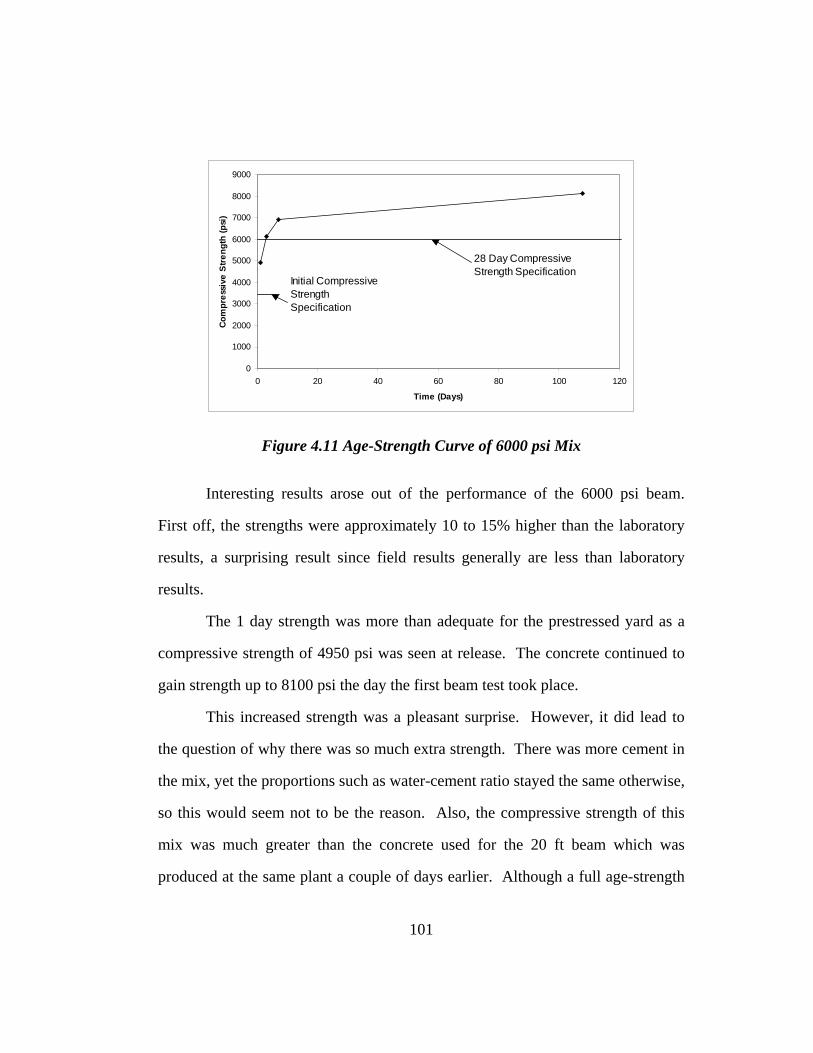
0
1000
2000
3000
4000
5000
6000
7000
8000
9000
0 20 40 60 80 100 1
Time (Days)
Com
pres
sive
Str
engt
h (p
si)
20
Initial Compressive Strength Specification
28 Day Compressive Strength Specification
Figure 4.11 Age-Strength Curve of 6000 psi Mix
Interesting results arose out of the performance of the 6000 psi beam.
First off, the strengths were approximately 10 to 15% higher than the laboratory
results, a surprising result since field results generally are less than laboratory
results.
The 1 day strength was more than adequate for the prestressed yard as a
compressive strength of 4950 psi was seen at release. The concrete continued to
gain strength up to 8100 psi the day the first beam test took place.
This increased strength was a pleasant surprise. However, it did lead to
the question of why there was so much extra strength. There was more cement in
the mix, yet the proportions such as water-cement ratio stayed the same otherwise,
so this would seem not to be the reason. Also, the compressive strength of this
mix was much greater than the concrete used for the 20 ft beam which was
produced at the same plant a couple of days earlier. Although a full age-strength
101
curve was not obtained, the 1 day and 3 day strengths of that beam were measured
as 3520 psi and 4629 psi, respectively. Since this mix was just used as a check,
this data were used to proceed with the fabrication of the 40 foot beams.
As for reasons for the high strength, none can be proven or even
hypothesized. A staff member watched the batching of the concrete and saw that
the proportions added were identical to the proportions ordered. Therefore, no
additional cement was placed in the mix. The aggregate was in a moisture state
between SSD and saturated, which was typical for mixing of the project.
The data presented at the beginning of this chapter should be taken as the
mechanical properties of this mix. The compressive strength of the concrete at
the precast plant was an aberration, one that was positive.
4.3.3 Tensile Strength
Due to the time constraints of the project, a 1 day splitting tensile and
modulus of rupture tests were all that were taken. Figures 4.12 and 4.13 show
their comparison to data already produced.
102

0
200
400
600
800
1000
1200
0 2000 4000 6000 8000 10000 12000 14000
Compressive Strength (psi)
Mod
ulus
of R
uptu
re (p
si)
Martinez Wet CureMartinez Dry CureZhang and Gjorv6000 psi Mix
AASHTOAll-Lightweight
MartinezSand-Lightweight
AASHTO Sand-Lightweight
Figure 4.12 Comparison of MOR Data for 6000 psi Mix
From Figure 4.12, the 1 day 6000 psi MOR point exceeded both the
AASHTO [12] and Martinez [2] recommendations. Although a 28 day data point
was not taken, previous experience in the project assured the staff that the MOR
at 28 days would be adequate since the concrete would still grow in strength.
103

0
100
200
300
400
500
600
700
800
900
0 2000 4000 6000 8000 10000 12000 14000
Compressive Strength (psi)
Split
ting
Tens
ile S
tren
gth
(psi
)
Martinez Wet CureMartinez Dry CureZhang and Gjorv Wet Cure6000 psi MixAASHTO
All-Lightweight
AASHTOSand-Lightweight
Figure 4.13 Comparison of Splitting Tensile Data for 6000 psi Mix
Just as in the last iteration, the splitting tensile data at 1 day did not meet
the code equation. Although this occurred, the staff did not decide to do a 28 day
test since the last iteration showed that the strength gain would be enough that the
splitting tensile strength would exceed the AASHTO [16] equation at 28 days.
104

Chapter 5: 8000 psi Mix
5.1 MIX PROPORTIONS
As a companion to the 6000 psi mix, another high strength concrete mix
was developed. A higher strength was desired to provide more options for
applications for long span girders.
The 8000 psi mix was developed using a previously designed normal
weight mix from Myers [11] as a starting point. A high strength normal weight
concrete mix was designed by him for a Houston bridge overpass. To change this
mix to a lightweight concrete mix, the coarse aggregate was replaced by an equal
volume of lightweight aggregate.
Table 5.1 shows the mix proportions.
Table 5.1 Mix Proportions per Cubic Yard for 8000 psi Mix
Component Proportion Cement 671 lb Fly Ash 316 lb
Lightweight Aggregate 1123 lb Sand 1029 lb Water 247 lb
Daratard-17 12 oz
ADVA Superflow 54 oz
Discussion in the previous chapter focused on the 6000 psi mix. Many of
the things discussed there are the same for this mix of concrete. However, there
are a couple of differences that should be noted.
105

First, this mix is a 10.5 sack (987 pounds) cement mix of concrete. This is
an extremely large amount of cementitious material. The amount of cement in
this mix of concrete is not easily controlled. Some problems associated with high
cement contents are shrinkage cracks and high curing temperatures which can
cause the concrete not to reach the target strength.
Also, the larger amount of cement meant that the aggregate amounts had
to be reduced. Therefore, this mix was richer and less rocky than the 6000 psi
mix. This also caused an increased amount of superplasticizer to be used in this
mix.
5.2 PROPERTIES
5.2.1 Workability
Due to the large amount of cementitious material in this mix, workability
was the major concern in the prestressing yard. The high cement content dictated
the use of a large amount of superplasticizer to produce the requisite flowing
concrete that was needed for placement. Also, the elevated temperature of the
concrete might reduce a great deal of the slump in the concrete.
Because of these problems, the dosage of superplasticizer was an
important aspect of this mix. The correct balance had to be obtained between an
amount that provided for enough flowability and yet did not cause segregation of
the concrete.
106
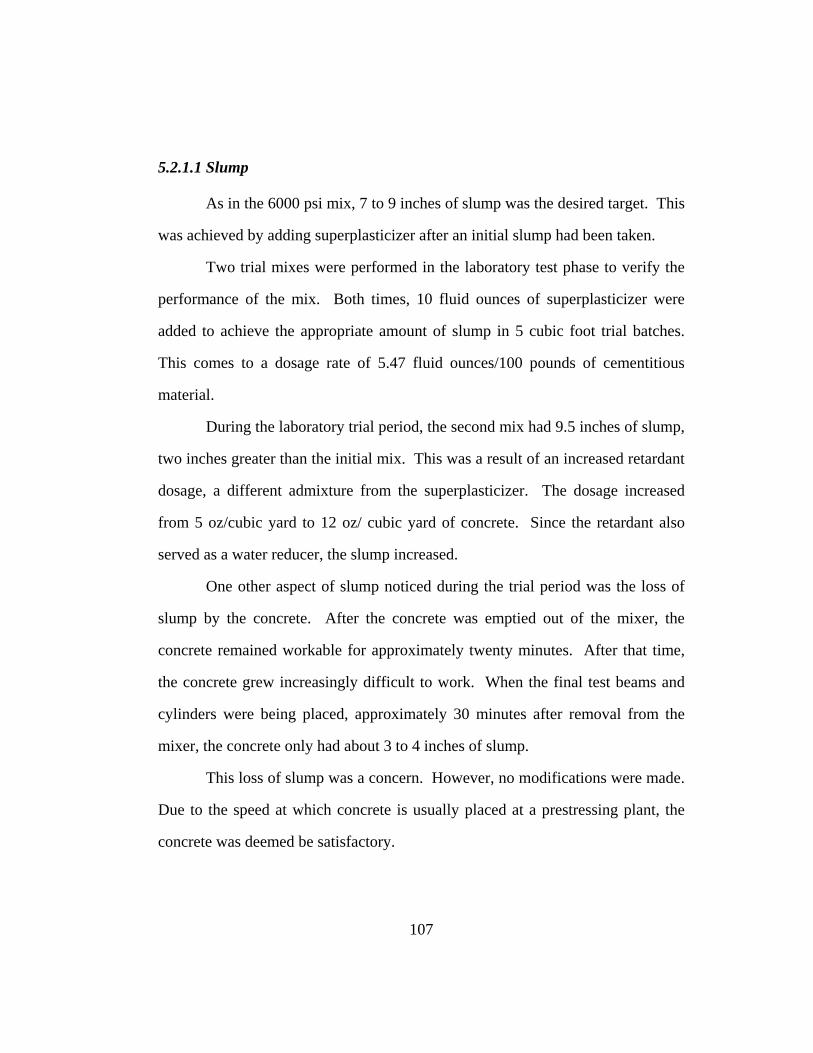
5.2.1.1 Slump
As in the 6000 psi mix, 7 to 9 inches of slump was the desired target. This
was achieved by adding superplasticizer after an initial slump had been taken.
Two trial mixes were performed in the laboratory test phase to verify the
performance of the mix. Both times, 10 fluid ounces of superplasticizer were
added to achieve the appropriate amount of slump in 5 cubic foot trial batches.
This comes to a dosage rate of 5.47 fluid ounces/100 pounds of cementitious
material.
During the laboratory trial period, the second mix had 9.5 inches of slump,
two inches greater than the initial mix. This was a result of an increased retardant
dosage, a different admixture from the superplasticizer. The dosage increased
from 5 oz/cubic yard to 12 oz/ cubic yard of concrete. Since the retardant also
served as a water reducer, the slump increased.
One other aspect of slump noticed during the trial period was the loss of
slump by the concrete. After the concrete was emptied out of the mixer, the
concrete remained workable for approximately twenty minutes. After that time,
the concrete grew increasingly difficult to work. When the final test beams and
cylinders were being placed, approximately 30 minutes after removal from the
mixer, the concrete only had about 3 to 4 inches of slump.
This loss of slump was a concern. However, no modifications were made.
Due to the speed at which concrete is usually placed at a prestressing plant, the
concrete was deemed be satisfactory.
107
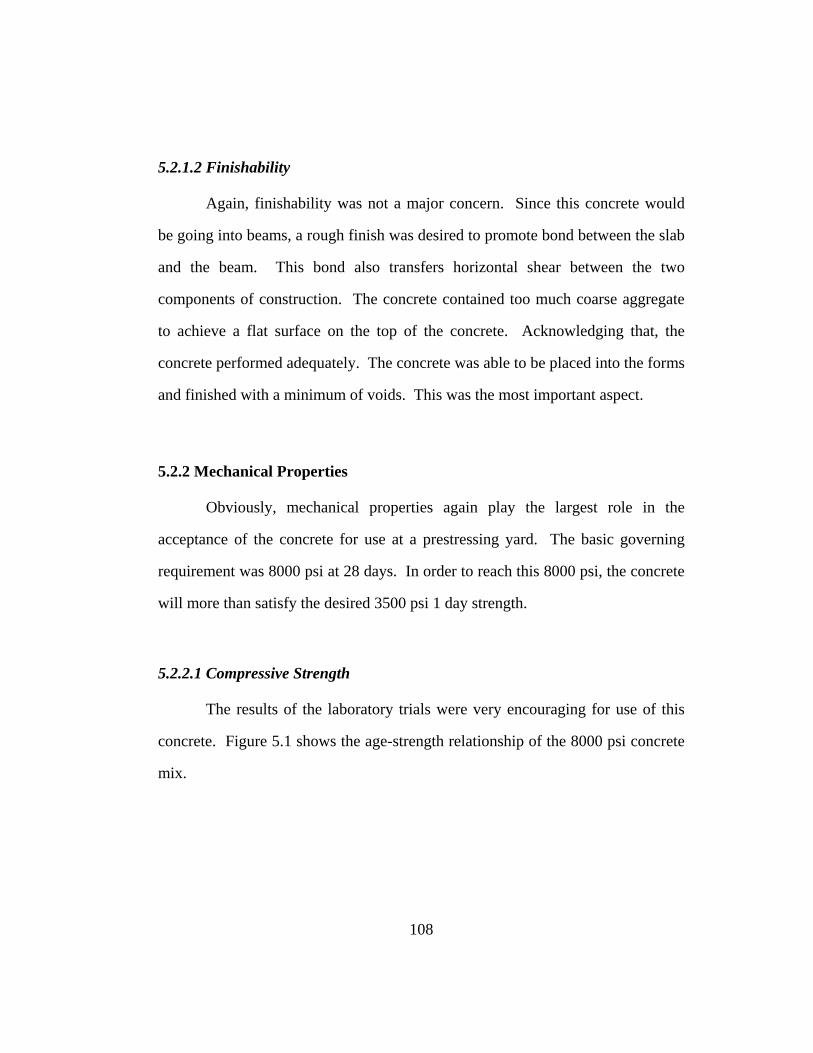
5.2.1.2 Finishability
Again, finishability was not a major concern. Since this concrete would
be going into beams, a rough finish was desired to promote bond between the slab
and the beam. This bond also transfers horizontal shear between the two
components of construction. The concrete contained too much coarse aggregate
to achieve a flat surface on the top of the concrete. Acknowledging that, the
concrete performed adequately. The concrete was able to be placed into the forms
and finished with a minimum of voids. This was the most important aspect.
5.2.2 Mechanical Properties
Obviously, mechanical properties again play the largest role in the
acceptance of the concrete for use at a prestressing yard. The basic governing
requirement was 8000 psi at 28 days. In order to reach this 8000 psi, the concrete
will more than satisfy the desired 3500 psi 1 day strength.
5.2.2.1 Compressive Strength
The results of the laboratory trials were very encouraging for use of this
concrete. Figure 5.1 shows the age-strength relationship of the 8000 psi concrete
mix.
108
0
1,000
2,000
3,000
4,000
5,000
6,000
7,000
8,000
9,000
0 5 10 15 20 25 30
Time (days)
Com
pres
sive
Stre
ngth
(psi
)
Batch 1Batch 2
3500 psi 1 Day Strength Specification
8000 psi 28 Day Strength Specification
Figure 5.1 Age-Strength Relationship of 8000 psi Mix
As can be seen, the 8000 psi mix performed satisfactorily. Both batches
achieved strengths in the mid 8000 psi range at 28 days. Also, the initial strength
was far more than adequate with a strength of at least 5500 psi at one day.
The strength curves are typical of concrete and show that the concrete was
continuing to gain strength at later ages. Also, there was some significant early
age difference between the first batch of concrete and the second batch. This
caused some concern. However, when the concrete reached later ages, the
strengths were remarkably similar. This alleviated any fears that this particular
mix of concrete performed differently during two separate tests.
5.2.2.3 Modulus of Elasticity
As discussed in Chapter 4, modulus of elasticity is an important property
for this lightweight concrete. The 8000 psi concrete was expected to have
109
somewhat larger values of modulus of elasticity than the 6000 psi concrete.
However, Figure 5.2 shows the 6000 and 8000 psi mixes normalized on the same
graph.
0
1
2
3
4
5
6
60 65 70 75 80 85 90 95
fc' ^ 0.5 (psi)
E*(1
45/w
c)^1
.5*1
E-06
(psi
)
6000 psi Mix8000 psi Mix
Martinez Equation
AASHTOEquation
Figure 5.2 Relation of Moduli of Elasticity Values to Code Values
Figure 5.2 shows that the two mixes produced in this project varied
similarly to the predictive equations for modulus of elasticity. Except for the 1
day 8000 psi value, which was low, all the concrete values were very similar.
This figure also shows how the Martinez and AASHTO equations
overestimated the modulus of elasticity values for both mixes. However, there is
always a great deal of scatter in these values. Figure 5.3 shows the 8000 psi data
among other data.
110
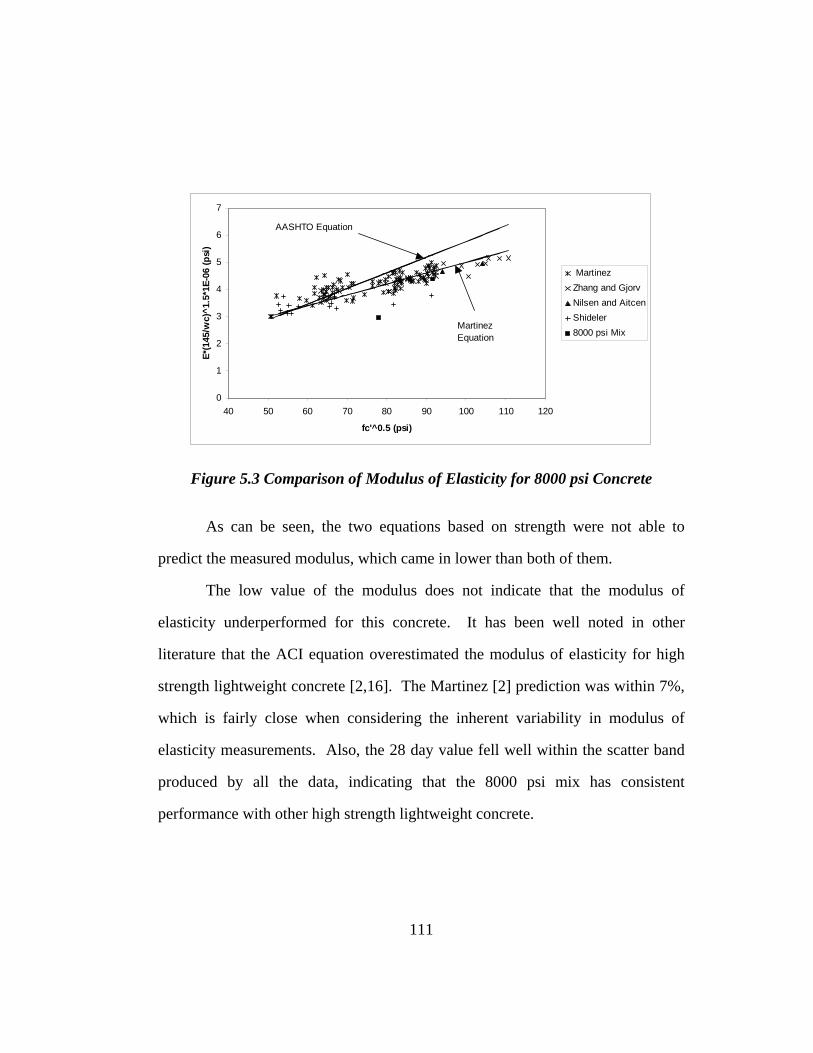
0
1
2
3
4
5
6
7
40 50 60 70 80 90 100 110 120
fc'^0.5 (psi)
E*(1
45/w
c)^1
.5*1
E-06
(psi
)
MartinezZhang and GjorvNilsen and AitcenShideler8000 psi Mix
AASHTO Equation
Martinez Equation
Figure 5.3 Comparison of Modulus of Elasticity for 8000 psi Concrete
As can be seen, the two equations based on strength were not able to
predict the measured modulus, which came in lower than both of them.
The low value of the modulus does not indicate that the modulus of
elasticity underperformed for this concrete. It has been well noted in other
literature that the ACI equation overestimated the modulus of elasticity for high
strength lightweight concrete [2,16]. The Martinez [2] prediction was within 7%,
which is fairly close when considering the inherent variability in modulus of
elasticity measurements. Also, the 28 day value fell well within the scatter band
produced by all the data, indicating that the 8000 psi mix has consistent
performance with other high strength lightweight concrete.
111
Overall, the performance of the 8000 psi concrete in the laboratory Ec test
is fine. Kolozs [34] goes into greater detail into the losses and deflections of the
beams, which are the areas that are affected the most by the modulus of elasticity.
5.2.2.3 Split Cylinder Tensile Strength
The split cylinder tensile strengths of the concrete again did not play a
major role in the selection of the appropriate concrete mix. However, due to the
use of tensile properties in prestressed design, the properties were measured to
verify that the 8000 psi mix had adequate performance in this aspect.
In terms of tensile strength, the 8000 psi mix actually performed relatively
poorly. When compared to the 6000 psi mix, the values for the 8000 psi mix were
much less. Splitting tensile strength of 6 X 12 inch cylinders was 318 psi at one
day and 452 psi at 28 days. This was about 50 psi below those of the 6000 psi
mix. This reflected earlier split tensile results.
Figure 5.4 gives a comparison of split tensile values to values from other
studies.
112

0
100
200
300
400
500
600
700
800
900
0 2000 4000 6000 8000 10000 12000 14000
Compressive Strength (psi)
Split
ting
Tens
ile S
treng
th (p
si)
Martinez Wet CureMartinez Dry CureZhang and Gjorv Wet Cure8000 psi MixAASHTO
All-Lightweight
AASHTOSand-Lightweight
Figure 5.4 Comparison of 8000 psi Mix Split Tensile Values to Other Studies
Figure 5.4 shows that the values for the 8000 psi concrete were very low
when compared to values from other studies. All four values fell beneath the
equation given by AASHTO [12] for sand-lightweight concrete. The 28 day
strengths, of more interest since these are the strengths usually given as the split
tensile strengths of the concrete mix, are closer to the equation but still do not
reach it.
A possible reason to explain this discrepancy is the moisture state of the
specimens when tested. The split cylinder test is very dependent on the moisture
state of the specimen. Martinez [2] tested both wet and dry cured cylinders and
found that the dry-cured cylinders had values 23% lower than those of
corresponding moist-cured concretes.
These concrete specimens tested had been allowed to dry for
approximately an hour before testing. The outer surfaces where cracks would
113
initiate dry before testing. Although the specimens had been kept in the moist
room prior to testing, they were dry when testing began. This could have caused
the low values for the split cylinder test.
Considering that the 28 day values were 13% and 6% lower than the
AASHTO [12] sand-lightweight concrete values, keeping the cylinders wet until
testing might have caused the tested values to exceed the equation.
5.2.2 Creep and Shrinkage
5.2.3.1 Creep
The creep of the 8000 psi concrete mix was tested the same way as for the
6000 psi concrete mix. Details of the tests are given in Chapter 4.
Also, creep plus shrinkage again was factored into these tests since there
was no control of humidity and temperature in the room where the creep tests
were occurring. Therefore, the data are compared to data from Reichard [18],
who compiled data on lightweight concrete behavior in creep and shrinkage.
114
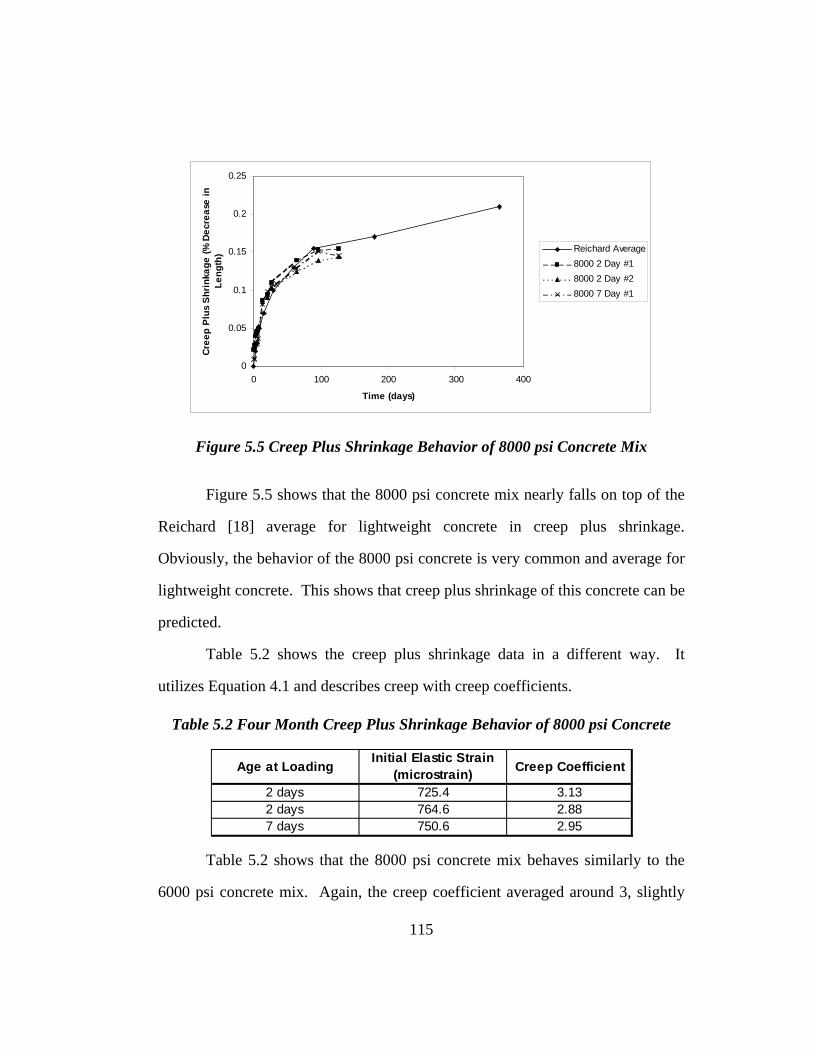
0
0.05
0.1
0.15
0.2
0.25
0 100 200 300 400
Time (days)
Cree
p Pl
us S
hrin
kage
(% D
ecre
ase
in
Leng
th) Reichard Average
8000 2 Day #18000 2 Day #28000 7 Day #1
Figure 5.5 Creep Plus Shrinkage Behavior of 8000 psi Concrete Mix
Figure 5.5 shows that the 8000 psi concrete mix nearly falls on top of the
Reichard [18] average for lightweight concrete in creep plus shrinkage.
Obviously, the behavior of the 8000 psi concrete is very common and average for
lightweight concrete. This shows that creep plus shrinkage of this concrete can be
predicted.
Table 5.2 shows the creep plus shrinkage data in a different way. It
utilizes Equation 4.1 and describes creep with creep coefficients.
Table 5.2 Four Month Creep Plus Shrinkage Behavior of 8000 psi Concrete
Age at Loading Initial Elastic Strain (microstrain) Creep Coefficient
2 days 725.4 3.132 days 764.6 2.887 days 750.6 2.95
Table 5.2 shows that the 8000 psi concrete mix behaves similarly to the
6000 psi concrete mix. Again, the creep coefficient averaged around 3, slightly
115

less than the 6000 psi concrete mix. This can be attributed to the fact that this
data were the four month data, not the five month data like the 6000 psi mix.
Once the five month data are added, the creep coefficient likely will be the same
for both mixes.
Overall, the creep plus shrinkage behavior can be predicted using data
from Reichard [18], which are the data in ACI Committee 213 [33] report. This
result is good since it shows that the behavior of the 8000 psi mix is ordinary and
not difficult to understand.
5.2.3.2 Shrinkage
Shrinkage also can affect long-term deformations of lightweight aggregate
concrete. Figure 5.6 gives the shrinkage results for the 8000 psi concrete.
0
0.01
0.02
0.03
0.04
0.05
0.06
0.07
0 20 40 60 80 100 120
Time (days)
% S
hrin
kage
Dry CureWet Cure
Figure 5.6 Shrinkage Results for 8000 psi Mix
116

Again, when compared to data from Reichard [18], the 8000 psi concrete
proved to be average in its amount of shrinkage. Reichard showed that
lightweight concrete decreased from 0.02% to 0.08% at 90 days due to drying
shrinkage for dry cured specimens. From Figure 5.6, the 8000 psi concrete has
decreased approximately 0.05% at 90 days, placing it firmly in the middle of data
from Reichard.
Also, Reichard [18] showed that lightweight concrete plateaus at
approximately 150 days of age for drying shrinkage. Although this data point has
not been reached yet, it is expected to occur in this concrete.
5.3 JOBSITE PERFORMANCE
The performance of the 8000 psi mix did not measure up to the
performance of the 6000 psi mix. Jobsite performance results were mixed.
5.3.1 Workability
More concern was always present when dealing with the 8000 psi mix.
due to the high cement content and increased amount of superplasticizer used.
To produce the three 40 foot concrete beams to be made of 8000 psi
concrete, three batches of concrete were mixed. Each batch of concrete was three
cubic yards in size. Again, 7-9 inches of slump was the target for this concrete.
Each of the three batches of concrete had a different amount of
superplasticizer. The results of workability tests are summarized in Table 5.3.
117
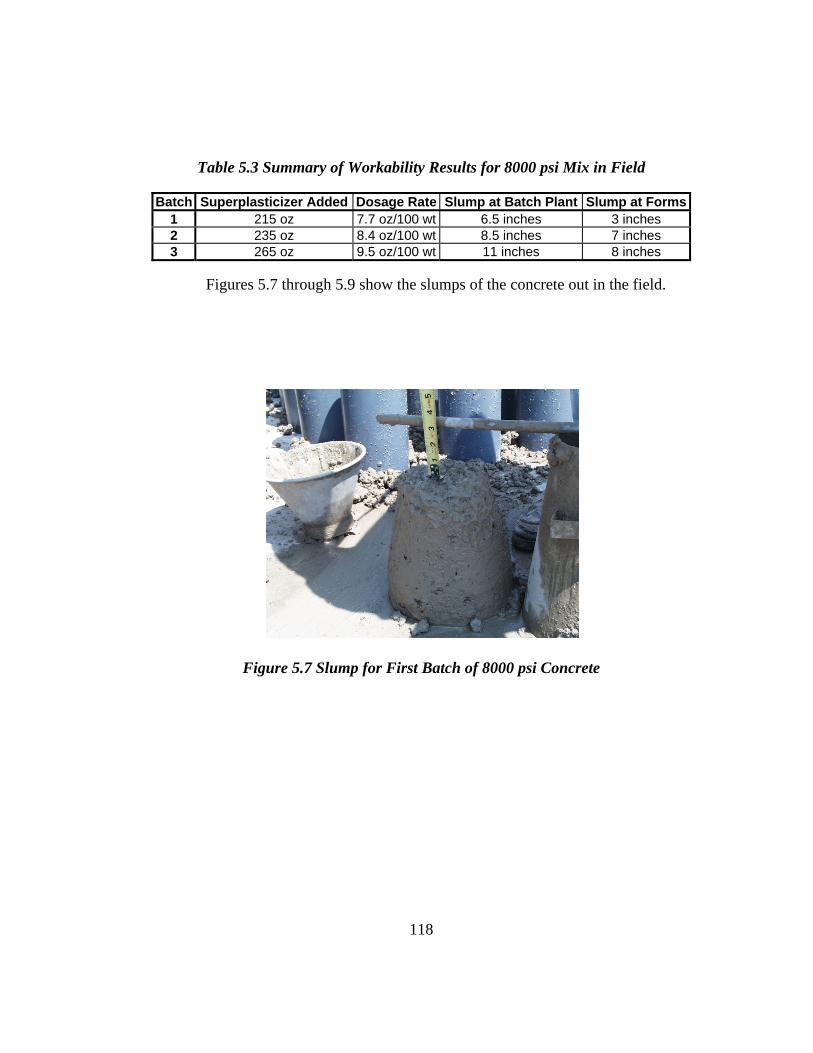
Table 5.3 Summary of Workability Results for 8000 psi Mix in Field
Batch Superplasticizer Added Dosage Rate Slump at Batch Plant Slump at Forms1 215 oz 7.7 oz/100 wt 6.5 inches 3 inches 2 235 oz 8.4 oz/100 wt 8.5 inches 7 inches 3 265 oz 9.5 oz/100 wt 11 inches 8 inches
Figures 5.7 through 5.9 show the slumps of the concrete out in the field.
Figure 5.7 Slump for First Batch of 8000 psi Concrete
118

Figure 5.8 Slump for Second Batch of 8000 psi Concrete
Figure 5.9 Slump for Third Batch of 8000 psi Concrete
As can be seen, there was more need for adjusting superplasticizer for the
8000 psi mix. For each batch of concrete, the amount of superplasticizer was
increased. The concrete was being sent out of the batch plant at adequate slumps.
However, the concrete was losing slump during the short trip in the sidewinder.
119
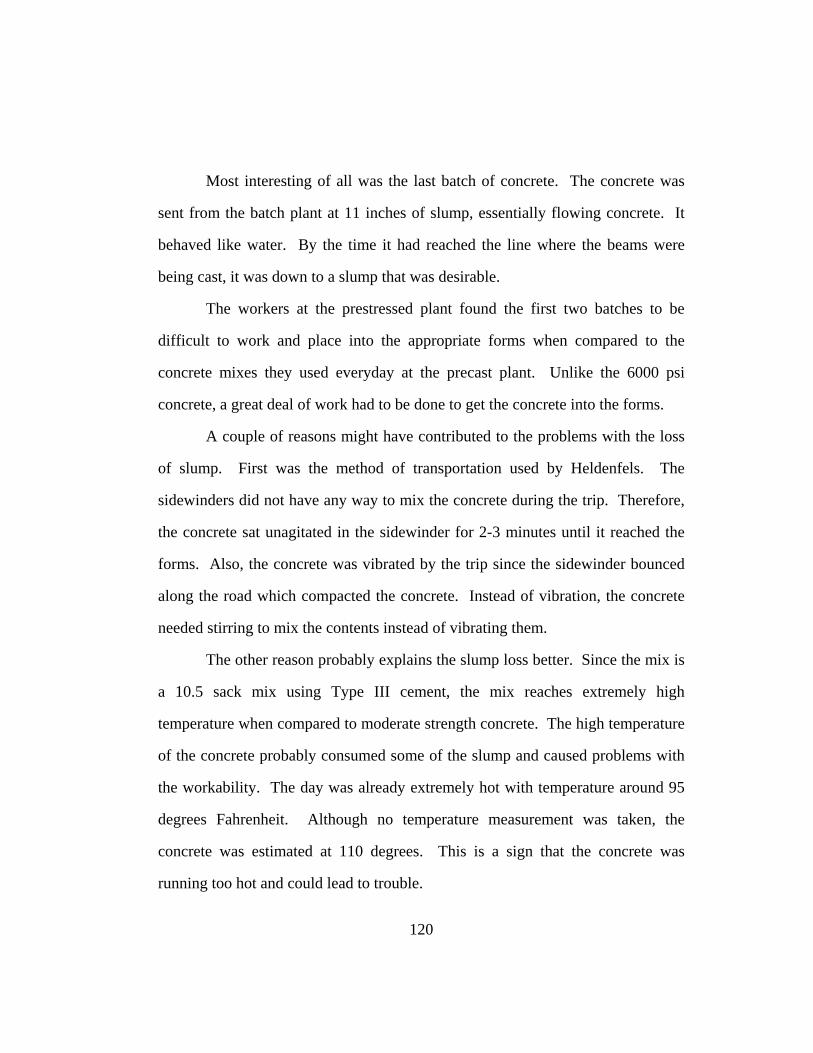
Most interesting of all was the last batch of concrete. The concrete was
sent from the batch plant at 11 inches of slump, essentially flowing concrete. It
behaved like water. By the time it had reached the line where the beams were
being cast, it was down to a slump that was desirable.
The workers at the prestressed plant found the first two batches to be
difficult to work and place into the appropriate forms when compared to the
concrete mixes they used everyday at the precast plant. Unlike the 6000 psi
concrete, a great deal of work had to be done to get the concrete into the forms.
A couple of reasons might have contributed to the problems with the loss
of slump. First was the method of transportation used by Heldenfels. The
sidewinders did not have any way to mix the concrete during the trip. Therefore,
the concrete sat unagitated in the sidewinder for 2-3 minutes until it reached the
forms. Also, the concrete was vibrated by the trip since the sidewinder bounced
along the road which compacted the concrete. Instead of vibration, the concrete
needed stirring to mix the contents instead of vibrating them.
The other reason probably explains the slump loss better. Since the mix is
a 10.5 sack mix using Type III cement, the mix reaches extremely high
temperature when compared to moderate strength concrete. The high temperature
of the concrete probably consumed some of the slump and caused problems with
the workability. The day was already extremely hot with temperature around 95
degrees Fahrenheit. Although no temperature measurement was taken, the
concrete was estimated at 110 degrees. This is a sign that the concrete was
running too hot and could lead to trouble.
120

Soroka and Ravina [35] documented this phenomenon. They showed that
slump loss in concrete is accelerated by temperatures over 86°F. Although no
temperature was taken of the concrete, the ambient air temperature that day was
approximately 95°F, hot enough to aid this process.
Also, Punkki, et al. [36] showed that high strength concrete utilizing a
large amount of superplasticizer had problems with loss of workability. They
showed that besides slump, which decreased, high strength concrete showed a
loss in plastic viscosity greater than the loss in normal strength concrete. This
very likely is the explanation for the cohesiveness shown by the concrete.
However, these problems with workability did not cause any problems
with the finish of the concrete. The prestressed bridge girders compared
adequately to girders made with normal weight concrete. There were no voids or
honeycombing which might be expected with a cohesive mix such as the 8000 psi
concrete mix.
Figure 5.10 Finish of Girder with 8000 psi Concrete Mix
121
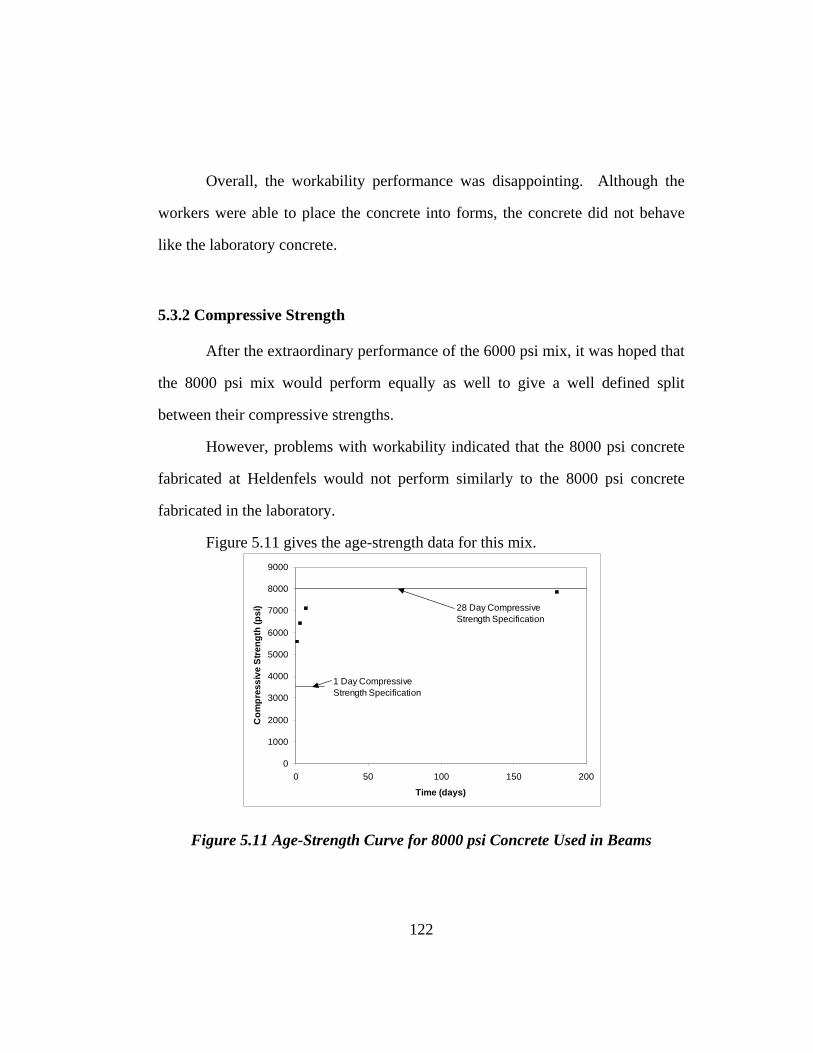
Overall, the workability performance was disappointing. Although the
workers were able to place the concrete into forms, the concrete did not behave
like the laboratory concrete.
5.3.2 Compressive Strength
After the extraordinary performance of the 6000 psi mix, it was hoped that
the 8000 psi mix would perform equally as well to give a well defined split
between their compressive strengths.
However, problems with workability indicated that the 8000 psi concrete
fabricated at Heldenfels would not perform similarly to the 8000 psi concrete
fabricated in the laboratory.
Figure 5.11 gives the age-strength data for this mix.
0
1000
2000
3000
4000
5000
6000
7000
8000
9000
0 50 100 150 200
Time (days)
Com
pres
sive
Stre
ngth
(psi
)
1 Day Compressive Strength Specification
28 Day Compressive Strength Specification
Figure 5.11 Age-Strength Curve for 8000 psi Concrete Used in Beams
122
In Figure 5.11, a line is not drawn between the points since that would not
approximate the strength gain. A 28 day compressive strength was not taken due
to a lack of cylinders. After the 7 day tests had been completed, the staff realized
that enough cylinders did not exist to allow 28 day compressive tests and also
compressive and modulus of elasticity tests for the beam development length tests
that would come later in the project. Therefore, a 180 day compressive strength
test was done since a beam test took place at this date.
As can be seen from Figure 5.11, the 28 day strength was not adequate.
Therefore, this mix did not meet that specifications. It is believed that this
occurred for the same reasons that workability was not adequate. With the slump
loss often occurs loss in strength.
5.3.3 Flexural and Split Cylinder Tensile Strength
The 8000 psi concrete field mix also was tested at 1 day for flexural and
split cylinder tensile strength. Figure 5.12 and 5.13 present this data and compare
it to values from other studies.
123
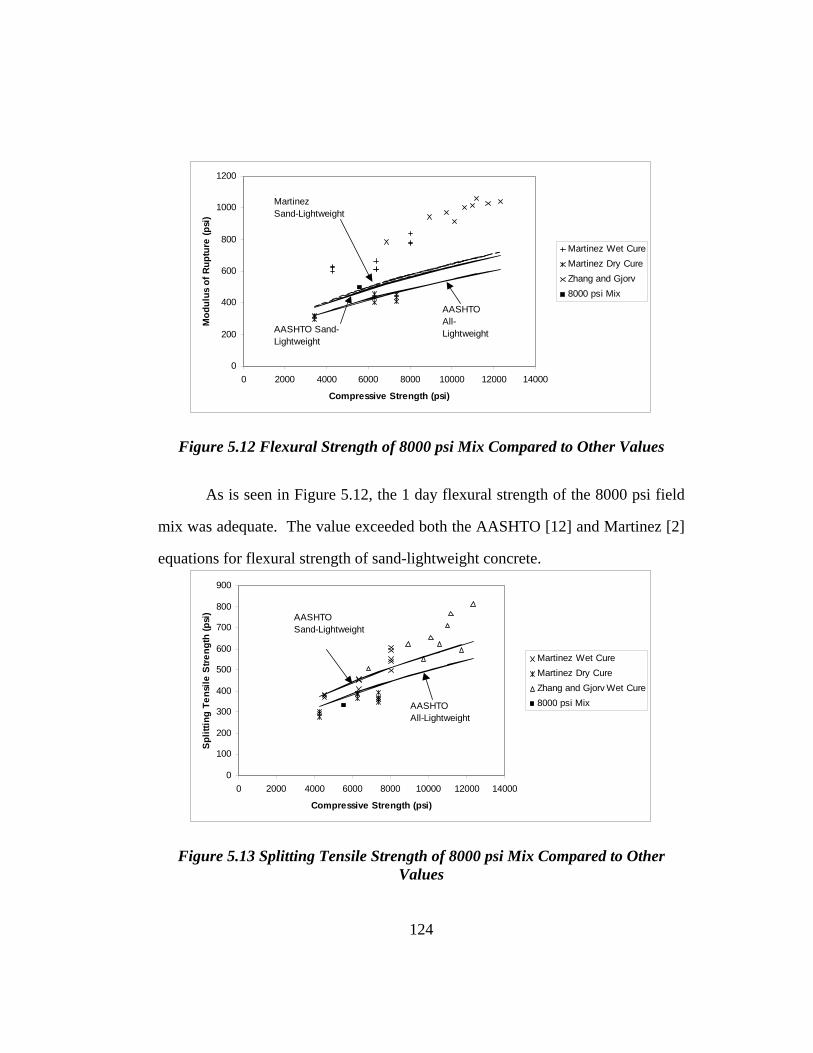
0
200
400
600
800
1000
1200
0 2000 4000 6000 8000 10000 12000 14000
Compressive Strength (psi)
Mod
ulus
of R
uptu
re (p
si)
Martinez Wet CureMartinez Dry CureZhang and Gjorv8000 psi Mix
AASHTOAll-Lightweight
MartinezSand-Lightweight
AASHTO Sand-Lightweight
Figure 5.12 Flexural Strength of 8000 psi Mix Compared to Other Values
As is seen in Figure 5.12, the 1 day flexural strength of the 8000 psi field
mix was adequate. The value exceeded both the AASHTO [12] and Martinez [2]
equations for flexural strength of sand-lightweight concrete.
0
100
200
300
400
500
600
700
800
900
0 2000 4000 6000 8000 10000 12000 14000
Compressive Strength (psi)
Split
ting
Tens
ile S
treng
th (p
si)
Martinez Wet CureMartinez Dry CureZhang and Gjorv Wet Cure8000 psi MixAASHTO
All-Lightweight
AASHTOSand-Lightweight
Figure 5.13 Splitting Tensile Strength of 8000 psi Mix Compared to Other Values
124
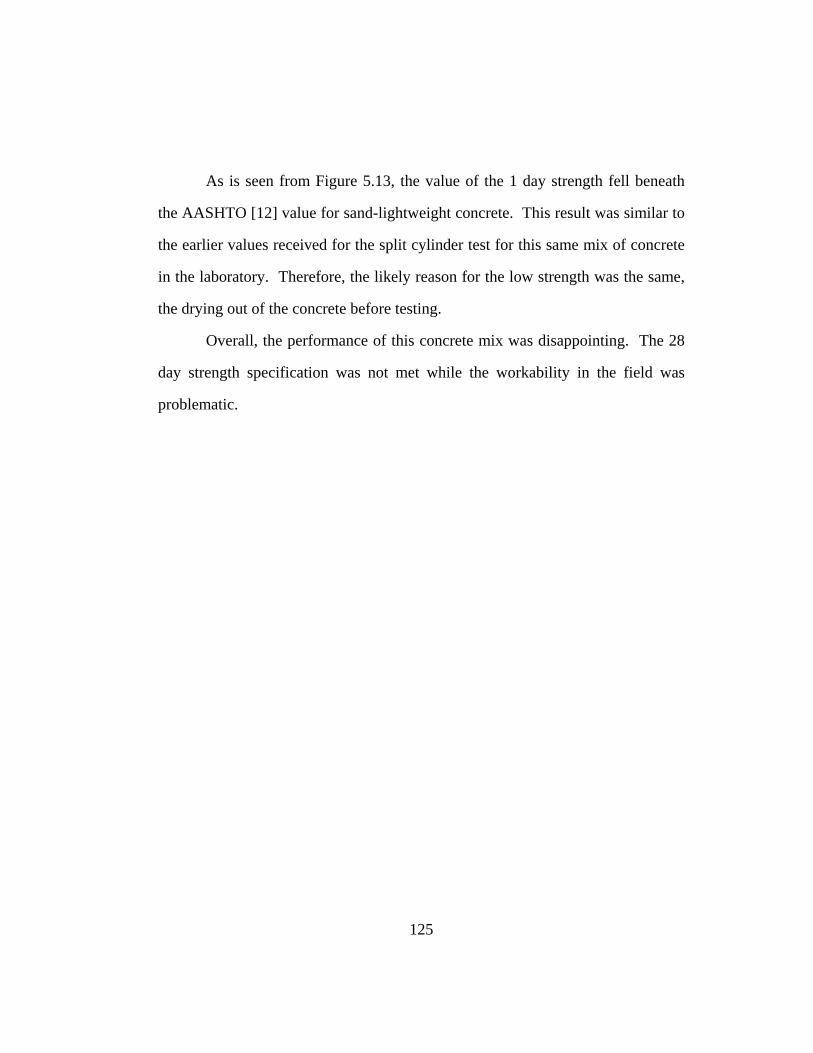
As is seen from Figure 5.13, the value of the 1 day strength fell beneath
the AASHTO [12] value for sand-lightweight concrete. This result was similar to
the earlier values received for the split cylinder test for this same mix of concrete
in the laboratory. Therefore, the likely reason for the low strength was the same,
the drying out of the concrete before testing.
Overall, the performance of this concrete mix was disappointing. The 28
day strength specification was not met while the workability in the field was
problematic.
125

Chapter 6: Conclusions
6.1 SUMMARY
This portion of the project was carried out to determine the feasibility of
utilization of high strength lightweight concrete in pretensioned bridge girders.
For these bridge girders, two distinct concrete mixes were developed. One was
intended to have a 28 day strength of 6000 psi while the other was intended to
have a 28 day strength of 8000 psi. Both also were intended to have a strength of
at least 3500 psi at one day of age for release of prestress in precast plants.
To obtain these two mixes, an ambitious laboratory mixing and testing
program was implemented. Thirty-five mixes were designed and fabricated. For
each of the mixes, mechanical behavior was determined to adequately describe
the concrete mix. Tests were performed to give compressive strength, modulus of
elasticity, modulus of rupture, and splitting tensile strength. These four tests
provide the moist important data for utilization in girder design.
Furthermore, the slump of the concrete and finishability was noted for
help in choosing the appropriate concrete. From these mixes, two laboratory
concrete mixes were chosen that combined the best mechanical performance with
adequate workability performance.
Using the 6000 psi mix, one 20 foot long and two 40 foot long beams were
cast. Using the 8000 psi mix, one 20 foot long beam and three 40 foot long
beams were fabricated. The beams were then brought to Ferguson Structural
Engineering Laboratory for performance testing.
126

6.2 CONCLUSIONS
6.2.1 6000 psi Mix
The 6000 psi mix was controlled by the 1 day strength requirement for the
concrete. In order to achieve 3500 psi at 1 day with Type III cement and 25%
replacement of fly ash, a certain minimum amount of cement was needed.
1. The 1 day strength of the concrete was approximately 4000 psi.
2. The 28 day strength of the concrete averaged 7200 psi in the laboratory.
3. The 28 day strength of the concrete in the field was 7800 psi.
4. Approximately 5.5 fluid ounces of superplasticizer were required for every
100 pounds of cementitious material to produce the needed 7-9 inches of
slump.
5. The fresh unit weight of the concrete was 127 pounds per cubic foot (pcf)
which later decreased to 118 pcf at equilibrium conditions.
6. The concrete continued to gain some strength after 28 days.
7. The concrete finished adequately in the precast plant.
8. This concrete mix provides about 30 minutes of working time under room
temperature and average humidity conditions.
9. The concrete placed well at the precast plant. The workers could tell no
difference between this mix and normal weight prestressed concrete girder
mixes used at Heldenfels.
10. Creep and shrinkage of the 6000 psi was high when compared to normal
weight concrete. However, the results were reasonable when compared to
other lightweight concrete.
127

The 6000 psi concrete produced excellent results. The concrete met all the
mechanical strength requirements while also providing the needed workability.
6.2.2 8000 psi Mix
The 8000 psi mix was controlled by the 28 day strength of the concrete.
To reach this goal, a large amount of cement was required. The following are
conclusions about the development of the 8000 psi mix.
1. The 1 day strength was 5500 psi, easily surpassing the 1 day strength
requirement.
2. The 28 day strength of this mix of concrete was 8600 psi.
3. The 28 day estimate of strength of this mix in the field was 7900 psi.
4. Further laboratory mixing should have done to understand fully the
compressive strength.
5. This concrete required a superplasticizer dosage of 7 fluid ounces per 100
pounds of cement.
6. The fresh unit weight of the concrete was 129 pcf, dropping to 122 pcf at
equilibrium conditions.
7. The concrete was somewhat difficult to work in the laboratory; however, it
was not unmanageable.
8. At room temperature and humidity conditions, this concrete only gives
about 20 minutes of time where the concrete is workable.
9. At Heldenfels precast plant, the concrete required more work to place than
the comparable concrete of the 6000 psi concrete. The workers said that
128
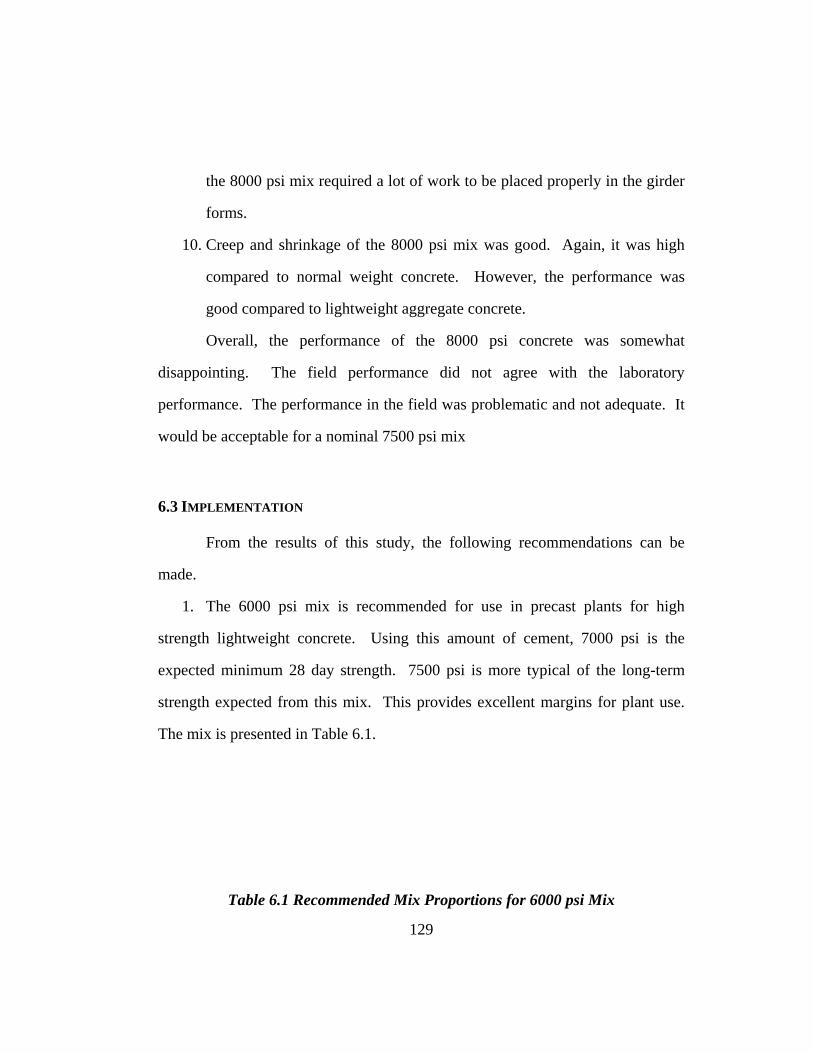
the 8000 psi mix required a lot of work to be placed properly in the girder
forms.
10. Creep and shrinkage of the 8000 psi mix was good. Again, it was high
compared to normal weight concrete. However, the performance was
good compared to lightweight aggregate concrete.
Overall, the performance of the 8000 psi concrete was somewhat
disappointing. The field performance did not agree with the laboratory
performance. The performance in the field was problematic and not adequate. It
would be acceptable for a nominal 7500 psi mix
6.3 IMPLEMENTATION
From the results of this study, the following recommendations can be
made.
1. The 6000 psi mix is recommended for use in precast plants for high
strength lightweight concrete. Using this amount of cement, 7000 psi is the
expected minimum 28 day strength. 7500 psi is more typical of the long-term
strength expected from this mix. This provides excellent margins for plant use.
The mix is presented in Table 6.1.
Table 6.1 Recommended Mix Proportions for 6000 psi Mix
129
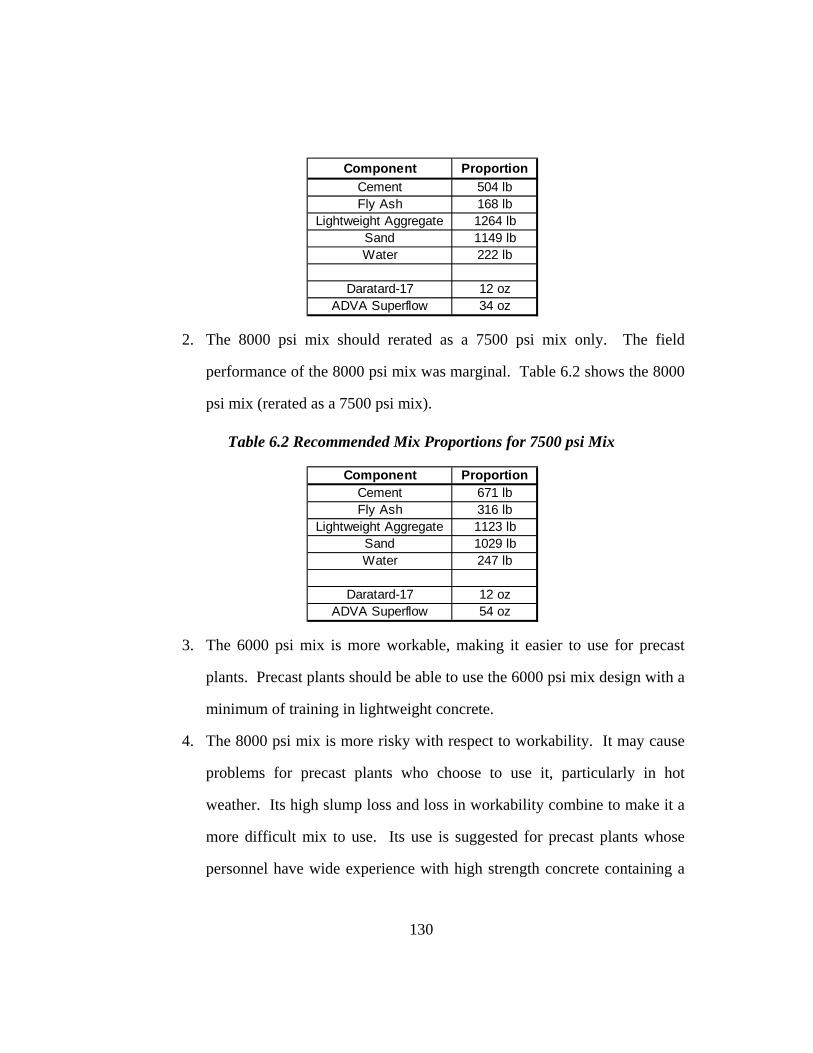
Component ProportionCement 504 lbFly Ash 168 lb
Lightweight Aggregate 1264 lbSand 1149 lbWater 222 lb
Daratard-17 12 ozADVA Superflow 34 oz
2. The 8000 psi mix should rerated as a 7500 psi mix only. The field
performance of the 8000 psi mix was marginal. Table 6.2 shows the 8000
psi mix (rerated as a 7500 psi mix).
Table 6.2 Recommended Mix Proportions for 7500 psi Mix
Component ProportionCement 671 lbFly Ash 316 lb
Lightweight Aggregate 1123 lbSand 1029 lbWater 247 lb
Daratard-17 12 ozADVA Superflow 54 oz
3. The 6000 psi mix is more workable, making it easier to use for precast
plants. Precast plants should be able to use the 6000 psi mix design with a
minimum of training in lightweight concrete.
4. The 8000 psi mix is more risky with respect to workability. It may cause
problems for precast plants who choose to use it, particularly in hot
weather. Its high slump loss and loss in workability combine to make it a
more difficult mix to use. Its use is suggested for precast plants whose
personnel have wide experience with high strength concrete containing a
130

large amount of cement per cubic yard. This mix can be used with
minimal problems. It just requires workers with experience to control it.
6.4 RECOMMENDATIONS FOR FUTURE STUDY
The following are recommended for future study.
1. Further lab mixing of the recommended 6000 psi and 8000 psi mixes to
gain an average age-strength curve with standard deviations.
2. Exploration of the use of silica fume in lightweight concrete. Silica fume
has been proven to produce lightweight concrete with strengths in excess
of 10,000 psi [16].
3. Testing of different types of sand with different gradations to understand
the interaction of sand with this lightweight aggregate.
4. Further laboratory testing of lightweight aggregate concrete to understand
overyielding and underyielding.
131

Appendix A: Mix Designs
132

Cement Fly Ash Lightweight Aggregate Sand WaterMix #1 600 0 1155 1387 210Mix #2 450 150 1155 1371 210Mix #3 600 0 1260 1207 210Mix #4 450 150 1260 1181 210Mix #5 600 0 1155 1122 210Mix #6 600 0 1271 1013 210Mix #7 600 0 1328 1090 210Mix #8 600 0 1155 1122 210
Mix #H-1 800 0 1155 1100 256Mix #H-2 600 200 1155 1065 256Mix #H-3 800 0 1260 920 256Mix #H-4 600 200 1260 885 256
Daratard ADVA Superflow DaravairMix #1 6 oz. 30 oz. 0 oz.Mix #2 6 oz. 30 oz. 0 oz.Mix #3 6 oz. 30 oz. 0 oz.Mix #4 6 oz. 30 oz. 0 oz.Mix #5 6 oz. 30 oz. 1 oz.Mix #6 6 oz. 30 oz. 0.5 oz.Mix #7 6 oz. 30 oz. 0 oz.Mix #8 6 oz. 30 oz. 0.5 oz.
Mix #H-1 8 oz. 40 oz. 0 oz.Mix #H-2 8 oz. 40 oz. 0 oz.Mix #H-3 8 oz. 40 oz. 0 oz.Mix #H-4 8 oz. 40 oz. 0 oz.
Table A.1 Mix Designs in First Iteration
(All quantities are pounds per cubic yard unless otherwise noted)
133

Cement Fly Ash Lightweight Aggregate Sand WaterMix #1-C 600 200 1161 1098 224Mix #1-S 600 200 1173 1067 200Mix #1-W 600 200 1161 1055 224Mix #2-C 637.5 212.5 1205 983 221Mix #2-S 637.5 212.5 1205 964 221Mix #2-W 637.5 212.5 1205 964 221Mix #3-C 675 225 1103 1003 234Mix #3-S 675 225 1103 1003 234Mix #3-W 675 225 1103 1003 234Mix #4-C 600 200 1231 985 224Mix #4-S 600 200 1231 985 224Mix #4-W 600 200 1231 985 224Mix #5-C 600 200 1184 1031 224Mix #5-S 600 200 1184 1031 224
Daratard ADVA Superflow DaravairMix #1-C 4 oz. 27 oz. 0 oz.Mix #1-S 4 oz. 39 oz. 0 oz.Mix #1-W 4 oz. 31 oz. 0 oz.Mix #2-C 4 oz. 31 oz. 0 oz.Mix #2-S 4 oz. 39 oz. 0 oz.Mix #2-W 4 oz. 31 oz. 0 oz.Mix #3-C 4 oz. 42 oz. 0 oz.Mix #3-S 4 oz. 39 oz. 0 oz.Mix #3-W 4 oz. 42 oz. 0 oz.Mix #4-C 4 oz. 54 oz. 0 oz.Mix #4-S 4 oz. 46 oz. 0 oz.Mix #4-W 4 oz. 46 oz. 0 oz.Mix #5-C 4 oz. 31 oz. 0 oz.Mix #5-S 4 oz. 39 oz. 0 oz.
Table A.2 Mix Designs for Second Iteration
(All quantities are in pounds per cubic yard unless otherwise noted)
134
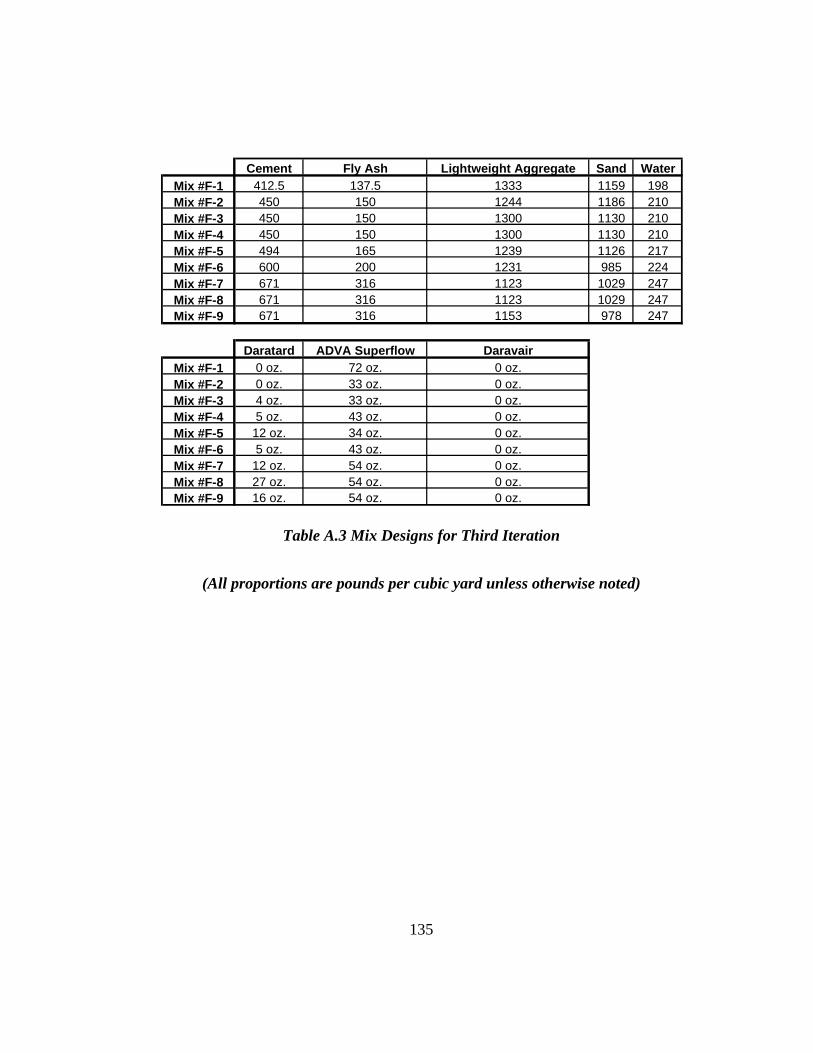
Cement Fly Ash Lightweight Aggregate Sand WaterMix #F-1 412.5 137.5 1333 1159 198Mix #F-2 450 150 1244 1186 210Mix #F-3 450 150 1300 1130 210Mix #F-4 450 150 1300 1130 210Mix #F-5 494 165 1239 1126 217Mix #F-6 600 200 1231 985 224Mix #F-7 671 316 1123 1029 247Mix #F-8 671 316 1123 1029 247Mix #F-9 671 316 1153 978 247
Daratard ADVA Superflow DaravairMix #F-1 0 oz. 72 oz. 0 oz.Mix #F-2 0 oz. 33 oz. 0 oz.Mix #F-3 4 oz. 33 oz. 0 oz.Mix #F-4 5 oz. 43 oz. 0 oz.Mix #F-5 12 oz. 34 oz. 0 oz.Mix #F-6 5 oz. 43 oz. 0 oz.Mix #F-7 12 oz. 54 oz. 0 oz.Mix #F-8 27 oz. 54 oz. 0 oz.Mix #F-9 16 oz. 54 oz. 0 oz.
Table A.3 Mix Designs for Third Iteration
(All proportions are pounds per cubic yard unless otherwise noted)
135

Appendix B: Test Results for Mixes
136
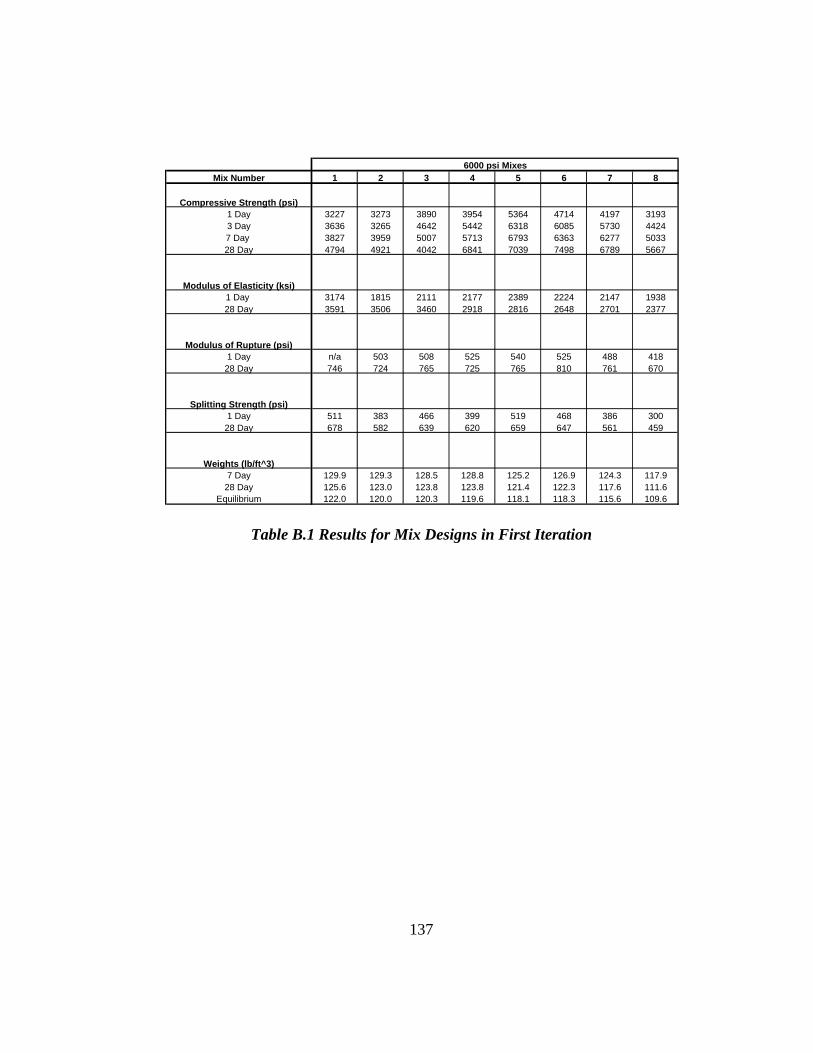
Mix Number 1 2 3 4 5 6 7 8
Compressive Strength (psi)1 Day 3227 3273 3890 3954 5364 4714 4197 31933 Day 3636 3265 4642 5442 6318 6085 5730 44247 Day 3827 3959 5007 5713 6793 6363 6277 503328 Day 4794 4921 4042 6841 7039 7498 6789 5667
Modulus of Elasticity (ksi)1 Day 3174 1815 2111 2177 2389 2224 2147 193828 Day 3591 3506 3460 2918 2816 2648 2701 2377
Modulus of Rupture (psi)1 Day n/a 503 508 525 540 525 488 418
28 Day 746 724 765 725 765 810 761 670
Splitting Strength (psi)1 Day 511 383 466 399 519 468 386 300
28 Day 678 582 639 620 659 647 561 459
Weights (lb/ft^3)7 Day 129.9 129.3 128.5 128.8 125.2 126.9 124.3 117.9
28 Day 125.6 123.0 123.8 123.8 121.4 122.3 117.6 111.6Equilibrium 122.0 120.0 120.3 119.6 118.1 118.3 115.6 109.6
6000 psi Mixes
Table B.1 Results for Mix Designs in First Iteration
137
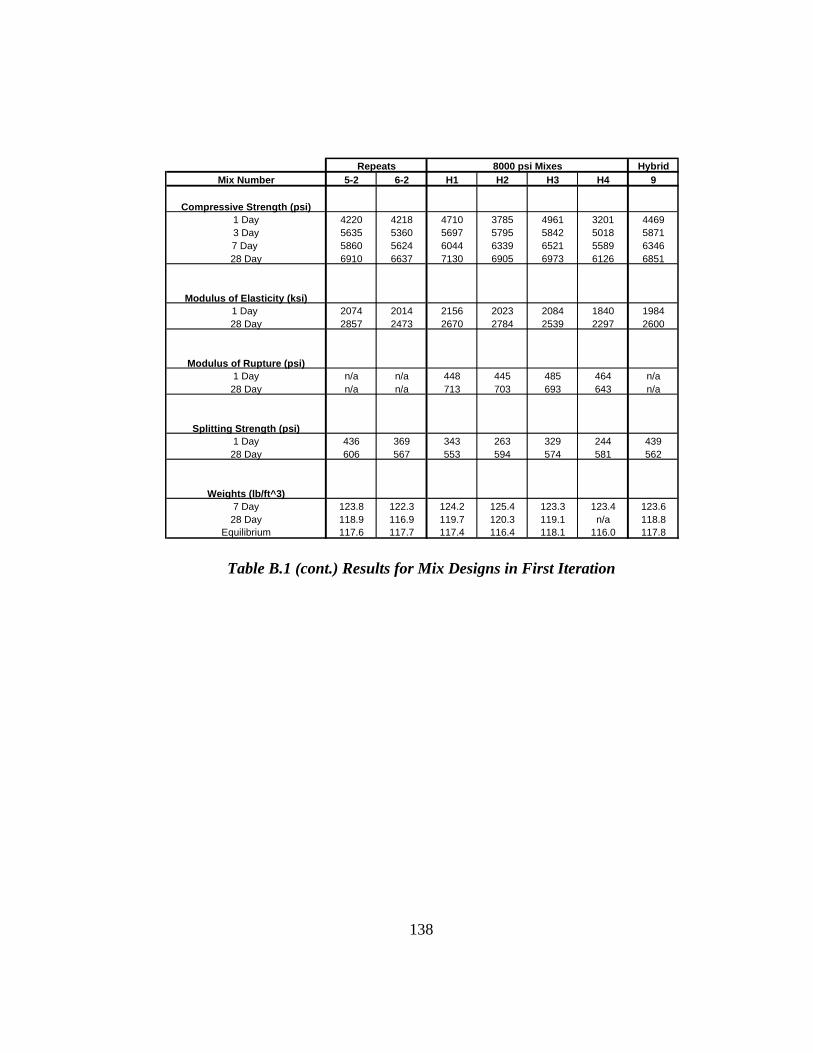
HybridMix Number 5-2 6-2 H1 H2 H3 H4 9
Compressive Strength (psi)1 Day 4220 4218 4710 3785 4961 3201 44693 Day 5635 5360 5697 5795 5842 5018 58717 Day 5860 5624 6044 6339 6521 5589 634628 Day 6910 6637 7130 6905 6973 6126 6851
Modulus of Elasticity (ksi)1 Day 2074 2014 2156 2023 2084 1840 198428 Day 2857 2473 2670 2784 2539 2297 2600
Modulus of Rupture (psi)1 Day n/a n/a 448 445 485 464 n/a28 Day n/a n/a 713 703 693 643 n/a
Splitting Strength (psi)1 Day 436 369 343 263 329 244 43928 Day 606 567 553 594 574 581 562
Weights (lb/ft^3)7 Day 123.8 122.3 124.2 125.4 123.3 123.4 123.628 Day 118.9 116.9 119.7 120.3 119.1 n/a 118.8
Equilibrium 117.6 117.7 117.4 116.4 118.1 116.0 117.8
Repeats 8000 psi Mixes
Table B.1 (cont.) Results for Mix Designs in First Iteration
138

Mix Number 1-C 1-W 1-S 2-C 2-W 2-S
Compressive Strength (psi)1 Day 4395 4549 4643 4985 4463 45273 Day 5532 5574 5845 6133 5420 61827 Day 6008 5730 6432 6579 5609 N/A28 Day 7125 6441 7812 7685 6185 8023
Modulus of Elasticity (ksi)1 Day 2217 1980 2297 2253 2068 274228 Day 2755 2828 2297 2845 2757 2742
Modulus of Rupture (psi)1 Day 475 490 523 483 460 50828 Day 658 668 735 625 655 650
Splitting Strength (psi)1 Day 437 394 397 440 382 39828 Day 606 507 531 595 482 520
Weights (lb/ft^3)Fresh 126.5 127.9 121.4 126.1 126.8 119.57 Day 126.5 127.3 121.4 127.0 126.628 Day 121.7 122.0 117.4 127.2 126.5
Equilbrium 119.3 119.1 115.1 121.1 119.8 114.2
Table B.2 Results for Mix Designs in Second Iteration
139

Mix Number 3-C 3-W 3-S 4-C 4-W 4-S 5-C 5-S
Compressive Strength (psi)1 Day 5164 5141 4599 5448 5054 4980 4544 36003 Day 6234 6015 5908 6479 5633 6119 6217 51517 Day 6874 6312 7305 6799 5857 6681 6001 605128 Day 7839 6677 8103 8037 6660 7935 7441 7216
Modulus of Elasticity (ksi)1 Day 2212 2383 2273 2250 2354 2242 2075 112528 Day 2791 3186 2814 2797 2989 2773 2637 2199
Modulus of Rupture (psi)1 Day 430 465 475 525 484 448 420 42028 Day 658 675 673 753 599 665 655 653
Splitting Strength (psi)1 Day 392 461 431 491 429 392 380 32828 Day 689 544 587 590 483 499 555 472
Weights (lb/ft^3)Fresh 126.4 125.6 122.3 127.8 117.9 123.1 117.67 Day 126.1 124.8 122.8 126.9 120.8 117.1 123.5 117.828 Day 122.2 121.4 118.7 122.7 117.5 112.9
Equilbrium 119.7 118.9 117.2 120.6 115.8 111.3 116.1 111.7
Table B.2 (cont.) Results for Mix Designs in Second Iteration
140

Mix Number F-1 F1 4x8 F-2 F2 4x8 F-3 F3 4x8 F-4 F4 4x8
Compressive Strength (psi)1 Day 3060 2952 2946 2717 3061 2733 3554 32653 Day 4202 4503 4031 3974 4188 4252 4647 44017 Day 5029 N/A 4728 4706 4827 4947 5423 513028 Day 6443 6571 6272 6156 6492 6177 6760 6629
Modulus of Elasticity (ksi)1 Day 1980 N/A 1996 N/A 2140 1903 2099 189128 Day 3017 2853 3095 3109 2907 2840 2904 3029
Splitting Strength (psi)1 Day 290 259 222 272 236 253 277 29128 Day 587 N/A 518 561 527 548 498 518
Weights (lb/ft^3)Fresh 122.4 122.7 122.4 121.67 Day 123.3 123.8 123.7 122.428 Day 117.7 116.6 116.3 116.4
Table B.3 Results for Mix Designs in Third Iteration
141
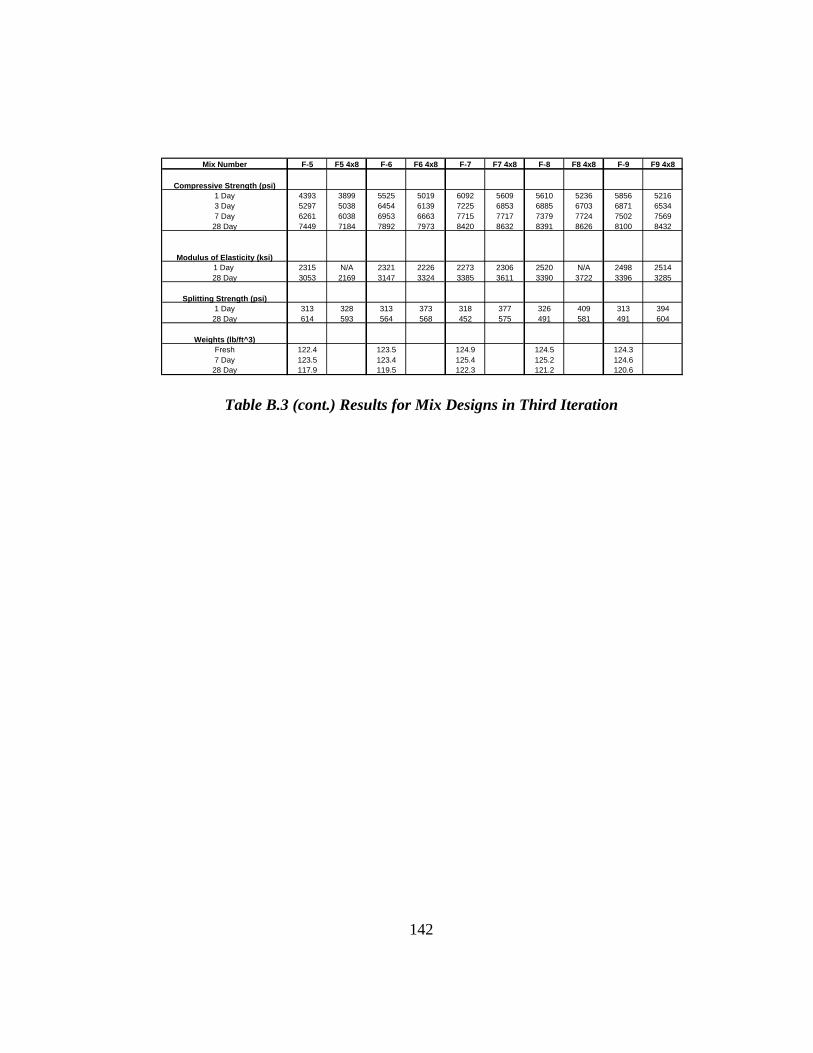
Mix Number F-5 F5 4x8 F-6 F6 4x8 F-7 F7 4x8 F-8 F8 4x8 F-9 F9 4x8
Compressive Strength (psi)1 Day 4393 3899 5525 5019 6092 5609 5610 5236 5856 52163 Day 5297 5038 6454 6139 7225 6853 6885 6703 6871 65347 Day 6261 6038 6953 6663 7715 7717 7379 7724 7502 756928 Day 7449 7184 7892 7973 8420 8632 8391 8626 8100 8432
Modulus of Elasticity (ksi)1 Day 2315 N/A 2321 2226 2273 2306 2520 N/A 2498 251428 Day 3053 2169 3147 3324 3385 3611 3390 3722 3396 3285
Splitting Strength (psi)1 Day 313 328 313 373 318 377 326 409 313 39428 Day 614 593 564 568 452 575 491 581 491 604
Weights (lb/ft^3)Fresh 122.4 123.5 124.9 124.5 124.37 Day 123.5 123.4 125.4 125.2 124.628 Day 117.9 119.5 122.3 121.2 120.6
Table B.3 (cont.) Results for Mix Designs in Third Iteration
142
Appendix C: Creep Data Sheets
143
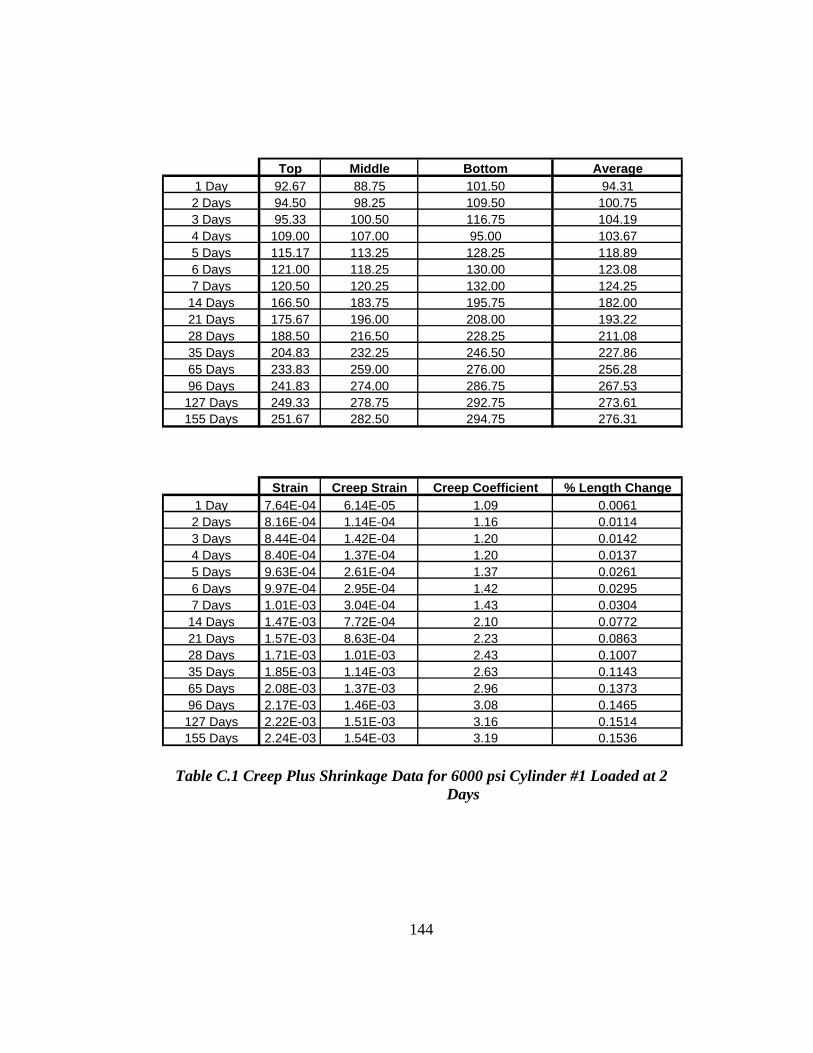
Top Middle Bottom Average1 Day 92.67 88.75 101.50 94.312 Days 94.50 98.25 109.50 100.753 Days 95.33 100.50 116.75 104.194 Days 109.00 107.00 95.00 103.675 Days 115.17 113.25 128.25 118.896 Days 121.00 118.25 130.00 123.087 Days 120.50 120.25 132.00 124.2514 Days 166.50 183.75 195.75 182.0021 Days 175.67 196.00 208.00 193.2228 Days 188.50 216.50 228.25 211.0835 Days 204.83 232.25 246.50 227.8665 Days 233.83 259.00 276.00 256.2896 Days 241.83 274.00 286.75 267.53127 Days 249.33 278.75 292.75 273.61155 Days 251.67 282.50 294.75 276.31
Strain Creep Strain Creep Coefficient % Length Change1 Day 7.64E-04 6.14E-05 1.09 0.00612 Days 8.16E-04 1.14E-04 1.16 0.01143 Days 8.44E-04 1.42E-04 1.20 0.01424 Days 8.40E-04 1.37E-04 1.20 0.01375 Days 9.63E-04 2.61E-04 1.37 0.02616 Days 9.97E-04 2.95E-04 1.42 0.02957 Days 1.01E-03 3.04E-04 1.43 0.030414 Days 1.47E-03 7.72E-04 2.10 0.077221 Days 1.57E-03 8.63E-04 2.23 0.086328 Days 1.71E-03 1.01E-03 2.43 0.100735 Days 1.85E-03 1.14E-03 2.63 0.114365 Days 2.08E-03 1.37E-03 2.96 0.137396 Days 2.17E-03 1.46E-03 3.08 0.1465127 Days 2.22E-03 1.51E-03 3.16 0.1514155 Days 2.24E-03 1.54E-03 3.19 0.1536
Table C.1 Creep Plus Shrinkage Data for 6000 psi Cylinder #1 Loaded at 2 Days
144
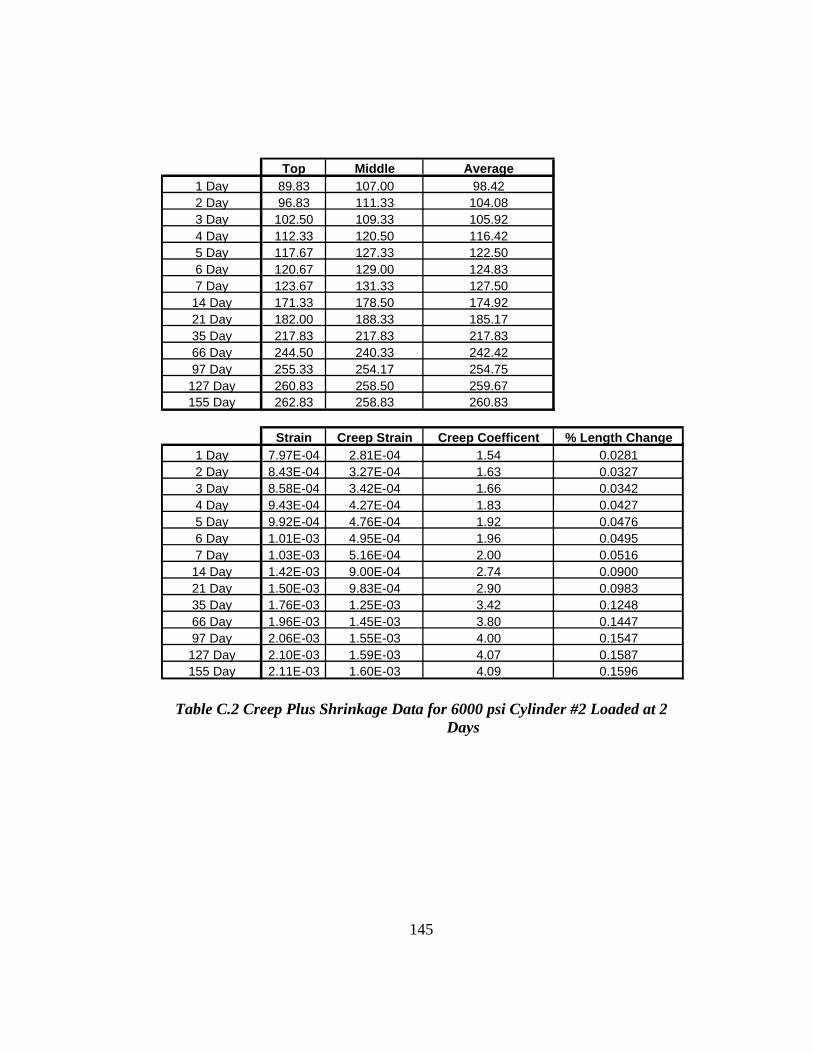
Top Middle Average1 Day 89.83 107.00 98.422 Day 96.83 111.33 104.083 Day 102.50 109.33 105.924 Day 112.33 120.50 116.425 Day 117.67 127.33 122.506 Day 120.67 129.00 124.837 Day 123.67 131.33 127.5014 Day 171.33 178.50 174.9221 Day 182.00 188.33 185.1735 Day 217.83 217.83 217.8366 Day 244.50 240.33 242.4297 Day 255.33 254.17 254.75127 Day 260.83 258.50 259.67155 Day 262.83 258.83 260.83
Strain Creep Strain Creep Coefficent % Length Change1 Day 7.97E-04 2.81E-04 1.54 0.02812 Day 8.43E-04 3.27E-04 1.63 0.03273 Day 8.58E-04 3.42E-04 1.66 0.03424 Day 9.43E-04 4.27E-04 1.83 0.04275 Day 9.92E-04 4.76E-04 1.92 0.04766 Day 1.01E-03 4.95E-04 1.96 0.04957 Day 1.03E-03 5.16E-04 2.00 0.051614 Day 1.42E-03 9.00E-04 2.74 0.090021 Day 1.50E-03 9.83E-04 2.90 0.098335 Day 1.76E-03 1.25E-03 3.42 0.124866 Day 1.96E-03 1.45E-03 3.80 0.144797 Day 2.06E-03 1.55E-03 4.00 0.1547127 Day 2.10E-03 1.59E-03 4.07 0.1587155 Day 2.11E-03 1.60E-03 4.09 0.1596
Table C.2 Creep Plus Shrinkage Data for 6000 psi Cylinder #2 Loaded at 2 Days
145

Top Middle Bottom Average1 Day 102.83 126.67 129.83 119.782 Day 110.83 135.33 132.33 126.173 Day 118.50 141.17 134.50 131.394 Day 127.50 149.67 139.50 138.895 Day 129.00 157.00 134.33 140.116 Day 141.00 166.00 154.67 153.897 Day 141.50 168.83 152.67 154.33
14 Day 171.33 199.67 190.83 187.2821 Day 191.83 220.33 211.33 207.8328 Day 197.83 228.83 214.50 213.7235 Day 209.83 244.33 230.33 228.1765 Day 249.83 282.83 276.33 269.6796 Day 281.50 313.17 311.33 302.00127 Day 285.33 310.83 296.67 297.61155 Day 293.17 320.67 301.50 305.11
Strain Creep Strain Creep Coefficient % Length Change1 Day 9.70E-04 1.43E-04 1.17 0.01432 Day 1.02E-03 1.95E-04 1.24 0.01953 Day 1.06E-03 2.37E-04 1.29 0.02374 Day 1.13E-03 2.98E-04 1.36 0.02985 Day 1.13E-03 3.08E-04 1.37 0.03086 Day 1.25E-03 4.19E-04 1.51 0.04197 Day 1.25E-03 4.23E-04 1.51 0.0423
14 Day 1.52E-03 6.90E-04 1.83 0.069021 Day 1.68E-03 8.56E-04 2.04 0.085628 Day 1.73E-03 9.04E-04 2.09 0.090435 Day 1.85E-03 1.02E-03 2.23 0.102165 Day 2.18E-03 1.36E-03 2.64 0.135796 Day 2.45E-03 1.62E-03 2.96 0.1619127 Day 2.41E-03 1.58E-03 2.91 0.1584155 Day 2.47E-03 1.64E-03 2.99 0.1644
Table C.3 Creep Plus Shrinkage Data for 6000 psi Cylinder #1 Loaded at 7 Days
146
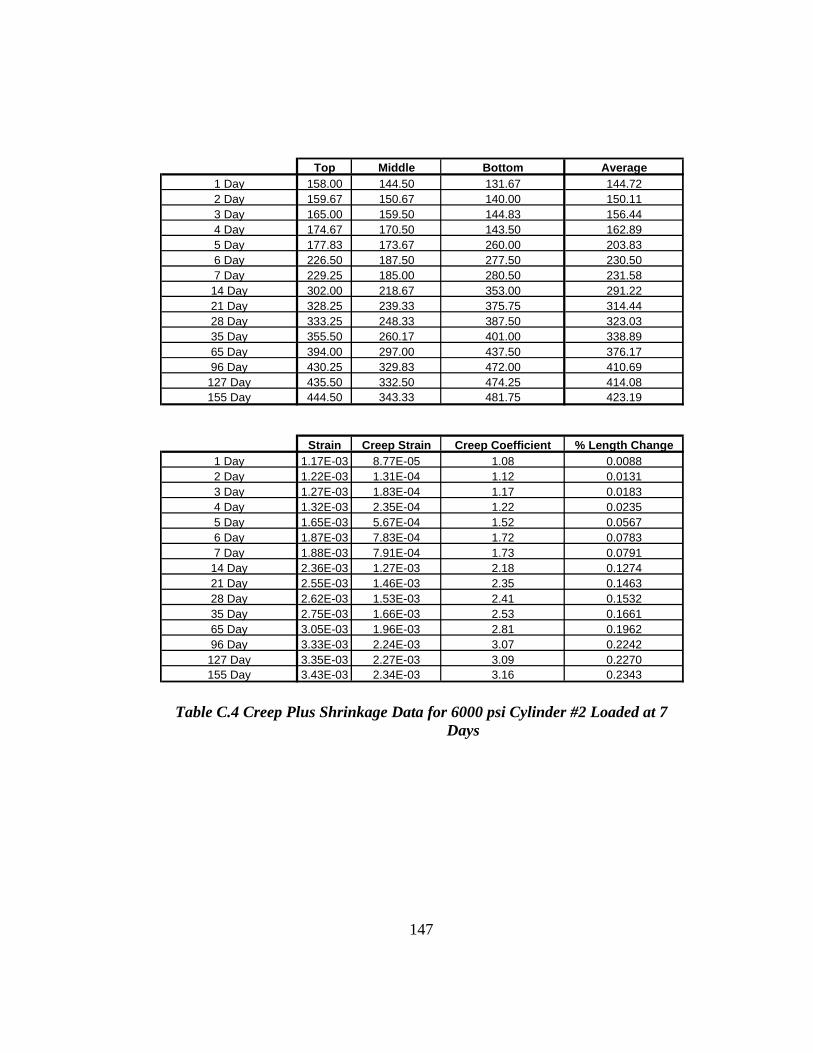
Top Middle Bottom Average1 Day 158.00 144.50 131.67 144.722 Day 159.67 150.67 140.00 150.113 Day 165.00 159.50 144.83 156.444 Day 174.67 170.50 143.50 162.895 Day 177.83 173.67 260.00 203.836 Day 226.50 187.50 277.50 230.507 Day 229.25 185.00 280.50 231.5814 Day 302.00 218.67 353.00 291.2221 Day 328.25 239.33 375.75 314.4428 Day 333.25 248.33 387.50 323.0335 Day 355.50 260.17 401.00 338.8965 Day 394.00 297.00 437.50 376.1796 Day 430.25 329.83 472.00 410.69
127 Day 435.50 332.50 474.25 414.08155 Day 444.50 343.33 481.75 423.19
Strain Creep Strain Creep Coefficient % Length Change1 Day 1.17E-03 8.77E-05 1.08 0.00882 Day 1.22E-03 1.31E-04 1.12 0.01313 Day 1.27E-03 1.83E-04 1.17 0.01834 Day 1.32E-03 2.35E-04 1.22 0.02355 Day 1.65E-03 5.67E-04 1.52 0.05676 Day 1.87E-03 7.83E-04 1.72 0.07837 Day 1.88E-03 7.91E-04 1.73 0.079114 Day 2.36E-03 1.27E-03 2.18 0.127421 Day 2.55E-03 1.46E-03 2.35 0.146328 Day 2.62E-03 1.53E-03 2.41 0.153235 Day 2.75E-03 1.66E-03 2.53 0.166165 Day 3.05E-03 1.96E-03 2.81 0.196296 Day 3.33E-03 2.24E-03 3.07 0.2242
127 Day 3.35E-03 2.27E-03 3.09 0.2270155 Day 3.43E-03 2.34E-03 3.16 0.2343
Table C.4 Creep Plus Shrinkage Data for 6000 psi Cylinder #2 Loaded at 7 Days
147

Top Middle Bottom Average1 Day 123.00 120.17 105.50 116.222 Day 129.50 129.83 110.50 123.283 Day 144.17 147.33 124.33 138.614 Day 146.83 148.83 127.00 140.895 Day 151.00 154.00 132.00 145.676 Day 154.33 151.67 133.33 146.447 Day 158.67 154.17 138.17 150.33
14 Day 207.33 204.17 179.00 196.8321 Day 215.00 211.50 189.33 205.2828 Day 234.33 232.33 208.00 224.8965 Day 268.83 271.17 242.50 260.8396 Day 286.83 289.17 259.33 278.44127 Day 287.00 290.17 263.00 280.06
Strain Creep Strain Creep Coefficient % Length Change1 Day 9.41E-04 2.16E-04 1.30 0.02162 Day 9.99E-04 2.73E-04 1.38 0.02733 Day 1.12E-03 3.97E-04 1.55 0.03974 Day 1.14E-03 4.16E-04 1.57 0.04165 Day 1.18E-03 4.55E-04 1.63 0.04556 Day 1.19E-03 4.61E-04 1.64 0.04617 Day 1.22E-03 4.92E-04 1.68 0.0492
14 Day 1.59E-03 8.69E-04 2.20 0.086921 Day 1.66E-03 9.37E-04 2.29 0.093728 Day 1.82E-03 1.10E-03 2.51 0.109665 Day 2.11E-03 1.39E-03 2.91 0.138796 Day 2.26E-03 1.53E-03 3.11 0.1530
127 Day 2.27E-03 1.54E-03 3.13 0.1543
Table C.5 Creep Plus Shrinkage Data for 8000 psi Cylinder #1 Loaded at 2 Days
148
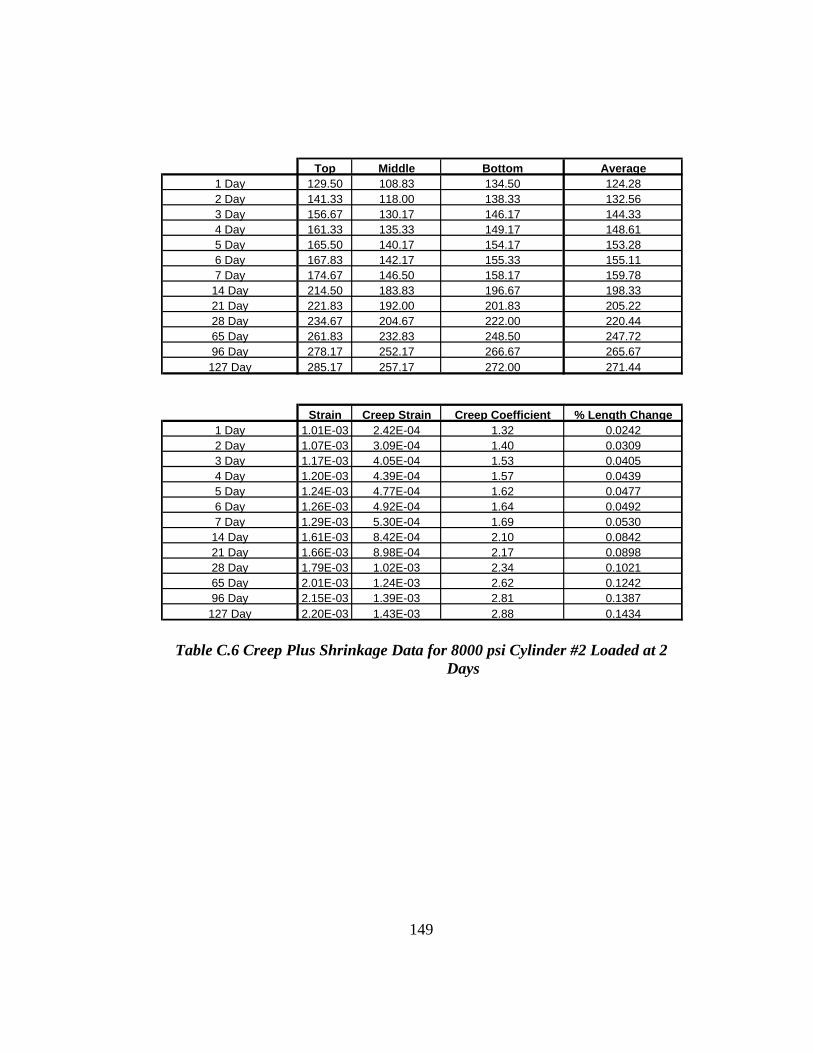
Top Middle Bottom Average1 Day 129.50 108.83 134.50 124.282 Day 141.33 118.00 138.33 132.563 Day 156.67 130.17 146.17 144.334 Day 161.33 135.33 149.17 148.615 Day 165.50 140.17 154.17 153.286 Day 167.83 142.17 155.33 155.117 Day 174.67 146.50 158.17 159.78
14 Day 214.50 183.83 196.67 198.3321 Day 221.83 192.00 201.83 205.2228 Day 234.67 204.67 222.00 220.4465 Day 261.83 232.83 248.50 247.7296 Day 278.17 252.17 266.67 265.67127 Day 285.17 257.17 272.00 271.44
Strain Creep Strain Creep Coefficient % Length Change1 Day 1.01E-03 2.42E-04 1.32 0.02422 Day 1.07E-03 3.09E-04 1.40 0.03093 Day 1.17E-03 4.05E-04 1.53 0.04054 Day 1.20E-03 4.39E-04 1.57 0.04395 Day 1.24E-03 4.77E-04 1.62 0.04776 Day 1.26E-03 4.92E-04 1.64 0.04927 Day 1.29E-03 5.30E-04 1.69 0.0530
14 Day 1.61E-03 8.42E-04 2.10 0.084221 Day 1.66E-03 8.98E-04 2.17 0.089828 Day 1.79E-03 1.02E-03 2.34 0.102165 Day 2.01E-03 1.24E-03 2.62 0.124296 Day 2.15E-03 1.39E-03 2.81 0.1387127 Day 2.20E-03 1.43E-03 2.88 0.1434
Table C.6 Creep Plus Shrinkage Data for 8000 psi Cylinder #2 Loaded at 2 Days
149
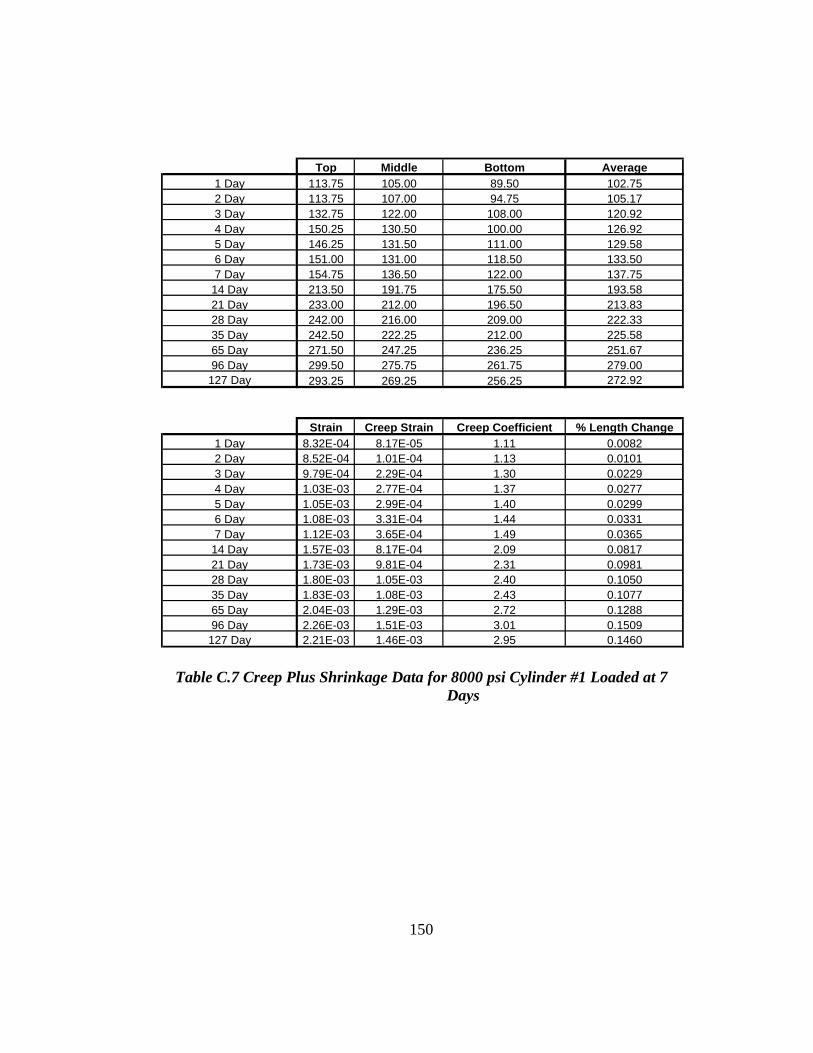
Top Middle Bottom Average1 Day 113.75 105.00 89.50 102.752 Day 113.75 107.00 94.75 105.173 Day 132.75 122.00 108.00 120.924 Day 150.25 130.50 100.00 126.925 Day 146.25 131.50 111.00 129.586 Day 151.00 131.00 118.50 133.507 Day 154.75 136.50 122.00 137.7514 Day 213.50 191.75 175.50 193.5821 Day 233.00 212.00 196.50 213.8328 Day 242.00 216.00 209.00 222.3335 Day 242.50 222.25 212.00 225.5865 Day 271.50 247.25 236.25 251.6796 Day 299.50 275.75 261.75 279.00127 Day 293.25 269.25 256.25 272.92
Strain Creep Strain Creep Coefficient % Length Change1 Day 8.32E-04 8.17E-05 1.11 0.00822 Day 8.52E-04 1.01E-04 1.13 0.01013 Day 9.79E-04 2.29E-04 1.30 0.02294 Day 1.03E-03 2.77E-04 1.37 0.02775 Day 1.05E-03 2.99E-04 1.40 0.02996 Day 1.08E-03 3.31E-04 1.44 0.03317 Day 1.12E-03 3.65E-04 1.49 0.036514 Day 1.57E-03 8.17E-04 2.09 0.081721 Day 1.73E-03 9.81E-04 2.31 0.098128 Day 1.80E-03 1.05E-03 2.40 0.105035 Day 1.83E-03 1.08E-03 2.43 0.107765 Day 2.04E-03 1.29E-03 2.72 0.128896 Day 2.26E-03 1.51E-03 3.01 0.1509127 Day 2.21E-03 1.46E-03 2.95 0.1460
Table C.7 Creep Plus Shrinkage Data for 8000 psi Cylinder #1 Loaded at 7 Days
150

References
1. Short, Andrew, and Kinniburgh, William. Lightweight Concrete. Third Edition, Applied Science Publishers, Ltd., London, 1978.
2. Martinez Morales, Salvador. “Short-Term Mechanical Properties of High strength Lightweight Concrete,” Report Number 82-9. Department of Structural Engineering, School of Civil and Environmental Engineering, Cornell University, August 1982.
3. Holm, T.A., and Bremner, T.W., “High Strength Lightweight Aggregate Concrete,” High Performance Concrete: Properties and Applications, McGraw-Hill, Inc., New York, 1994.
4. Vaysburd, Alexander M., “Durability of Lightweight Concrete Bridges in Severe Environments,” Concrete International, July 1996, pp.33-38.
5. Shideler, J.J., “Lightweight Aggregate Concrete for Structural Use,” Journal of the American Concrete Institute, October 1957, pp. 299-328.
6. Jennings, T.W., and Brewer, J.A., “Lightweight, Prestressed Concrete,” 1964, Lightweight Concrete Research Studies, Texas Industries, Inc., 1998.
7. Interview with Coreslab Structures, October 1998.
8. Shah, S.P., and Ahmad, S.H., “Preface,” High Performance Concrete: Properties and Applications, McGraw-Hill, Inc., 1994.
9. Barnes, Robert W., “Development Length of 0.6-Inch Prestressing Strand in Standard I-Shaped Pretensioned Concrete Beams,” Doctoral Dissertation, The University of Texas at Austin, May 2000.
10. Gross, Shawn P., “Field Performance of Prestressed High Performance Concrete Highway Bridges in Texas,” Doctoral Dissertation, The University of Texas at Austin, 1998.
11. Myers, John Joseph, “Production and Quality Control of High Performance Concrete in Texas Bridge Structures,” Doctoral Dissertation, The University of Texas at Austin, 1998.
12. American Association of State Highway and Transportation Officials (AASHTO), Standard Specifications for Highway Bridges, Sixteenth Edition, American Association of State Highway and Transportation Officials, Washington, D.C., 1996.
151
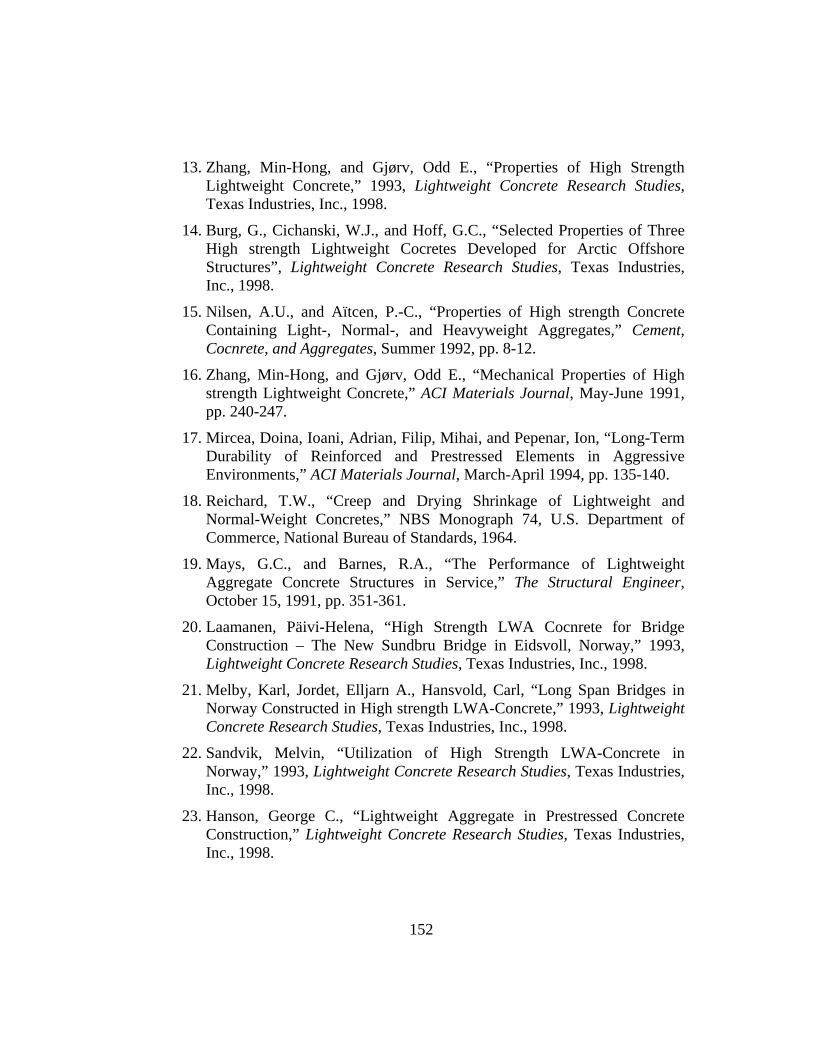
13. Zhang, Min-Hong, and Gjørv, Odd E., “Properties of High Strength Lightweight Concrete,” 1993, Lightweight Concrete Research Studies, Texas Industries, Inc., 1998.
14. Burg, G., Cichanski, W.J., and Hoff, G.C., “Selected Properties of Three High strength Lightweight Cocretes Developed for Arctic Offshore Structures”, Lightweight Concrete Research Studies, Texas Industries, Inc., 1998.
15. Nilsen, A.U., and Aïtcen, P.-C., “Properties of High strength Concrete Containing Light-, Normal-, and Heavyweight Aggregates,” Cement, Cocnrete, and Aggregates, Summer 1992, pp. 8-12.
16. Zhang, Min-Hong, and Gjørv, Odd E., “Mechanical Properties of High strength Lightweight Concrete,” ACI Materials Journal, May-June 1991, pp. 240-247.
17. Mircea, Doina, Ioani, Adrian, Filip, Mihai, and Pepenar, Ion, “Long-Term Durability of Reinforced and Prestressed Elements in Aggressive Environments,” ACI Materials Journal, March-April 1994, pp. 135-140.
18. Reichard, T.W., “Creep and Drying Shrinkage of Lightweight and Normal-Weight Concretes,” NBS Monograph 74, U.S. Department of Commerce, National Bureau of Standards, 1964.
19. Mays, G.C., and Barnes, R.A., “The Performance of Lightweight Aggregate Concrete Structures in Service,” The Structural Engineer, October 15, 1991, pp. 351-361.
20. Laamanen, Päivi-Helena, “High Strength LWA Cocnrete for Bridge Construction – The New Sundbru Bridge in Eidsvoll, Norway,” 1993, Lightweight Concrete Research Studies, Texas Industries, Inc., 1998.
21. Melby, Karl, Jordet, Elljarn A., Hansvold, Carl, “Long Span Bridges in Norway Constructed in High strength LWA-Concrete,” 1993, Lightweight Concrete Research Studies, Texas Industries, Inc., 1998.
22. Sandvik, Melvin, “Utilization of High Strength LWA-Concrete in Norway,” 1993, Lightweight Concrete Research Studies, Texas Industries, Inc., 1998.
23. Hanson, George C., “Lightweight Aggregate in Prestressed Concrete Construction,” Lightweight Concrete Research Studies, Texas Industries, Inc., 1998.
152

24. Murillo, Juan A., Thoman, Steve, and Smith, Dennis, “Lightweight Concrete for a Segmental Bridge,” Civil Engineering, May 1994, pp. 68-70.
25. American Society for Testing and Materials (ASTM), Standard Specification for Concrete Made by Volumetric Batching and Continuous Mixing (C685), ASTM, Philadelphia, Pennsylvania, 1998.
26. American Society for Testing and Materials (ASTM), Standard Test Method for Compressive Strength of Cylindrical Concrete Specimens (C39), ASTM, Philadelphia, Pennsylvania, 1998.
27. American Society for Testing and Materials (ASTM), Standard Test Method for Static Modulus of Elasticity and Poisson’s Ratio of Concrete in Compression (C469), ASTM, Philadelphia, Pennsylvania, July 1998.
28. American Society for Testing and Materials (ASTM), Standard Test Method for Modulus of Rupture of Concrete (C78), ASTM, Philadelphia, Pennsylvania, 1998.
29. American Society for Testing and Materials (ASTM), Standard Test Method for Splitting Tensile Strength of Concrete (C496), ASTM, Philadelphia, Pennsylvania, 1998.
30. American Society for Testing and Materials (ASTM), Standard Test Method for Creep of Concrete in Compression (C512-87), ASTM, Philadelphia, Pennsylvania, 1998.
31. Nilson, Arthur, H., Design of Prestressed Concrete, Second Edition, John Wiley & Sons, New York, 1987.
32. American Society for Testing and Materials (ASTM), Standard Test Method for Length Change of Hardened Hydraulic-Cement Mortar and Concrete (C157-93), ASTM, Philadelphia, Pennsylvania, 1998.
33. ACI Committee 213, “Guide for Structural Lightweight Aggregate Concrete,” ACI Manual of Concrete Practice, Part I, 1998.
34. Kolozs, Robert T., “Transfer and Development Lengths of 1/2 Inch Prestressing Strand in Standard AASHTO Type I Pretensioned High Performance Lightweight Concrete (HPLC) Beams,” Master’s Thesis, The University of Texas at Austin, May 2000.
35. Soroka, I, and Ravina, D., “Hot Weather Concreting with Admixtures,” Cement and Concrete Composites, April-June 1998, pp. 129-136.
153

154
36. Punkki, Jouni, Golaszewski, Jacek, and Gjørv, Odd E., “Workability Loss of High strength Concrete,” ACI Materials Journal, September-October 1996, pp. 427-431.
37. Mindess, Sidney, and Young, J. Francis, Concrete, Prentice-Hall, Englewood Cliffs, N.J., 1981.
Vita
John Andrew Heffington was born March 17, 1976 in San Diego,
California. His family moved to College Station when John was two. In College
Station, John graduated with his high school degree from A&M Consolidated
High School in 1994. John entered Texas A&M University in the fall of 1994 on
a President’s Endowed Scholarship. He studied civil engineering with a specialty
in structures. During the summer of 1995, he worked as a undergraduate research
assistant in the Texas A&M Wisenbaker High Bay laboratory. John graduated
summa cum laude from Texas A&M University in May 1998 with a B.S. in civil
engineering. In the fall of 1998, he entered the University of Texas at Austin as a
research assistant. After two years, he graduated with a M.S.E. in civil
engineering (structural engineering specialty) and accepted a job in Phoenix,
Arizona with Paragon Structural Design. He will work as structural engineer in
doing large commercial design.
Permanent address: John A. Heffington 1304 Augustine College Station, TX 77840
This thesis was typed by the author.
Top Related