


Languages
Pages
Legal


Dr.-Ing. Sae Hoon Kim
Hyundai Kia Motor Company
November 8, 2010
Development of Fuel Cell Electric
Vehicle in Hyundai · Kia Motors

Energy Consumption
Coal: 84 MT
Oil: 761 M bbl
LNG: 23 MT
Nuclear: 147 TWhPrimary Energy Import
Oil, Natural Gas, Coal
$66.7 Billion
97% of Energy Consumed
10th Energy Consumption in the world(229.3 MTOE)
5th Crude Oil Importer in the world
2nd LNG Importer in the world
Energy Situation of Korea
Data of 2005
Electricity Production
Hydro: 1.7 %
Nuclear: 39 %
Coal: 38 %
Oil: 8 %
LNG: 13 %
In 2008, 35.3 MTOE of energy is used by transportation sector
which is 15% of total energy consumption in Korea
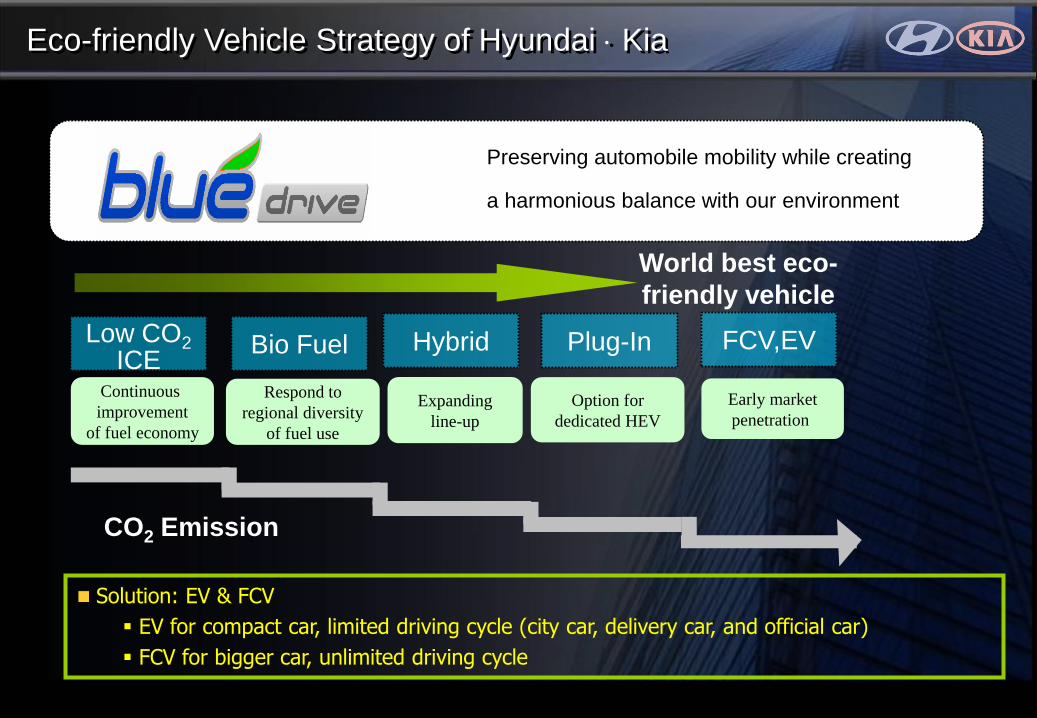
Eco-friendly Vehicle Strategy of Hyundai Kia
Preserving automobile mobility while creating
a harmonious balance with our environment
Low CO2ICE
Hybrid Plug-In FCV,EVBio Fuel
Continuous
improvement
of fuel economy
Early market
penetration
Respond to
regional diversity
of fuel use
Option for
dedicated HEV
Expanding
line-up
World best eco-
friendly vehicle
CO2 Emission
Solution: EV & FCV
EV for compact car, limited driving cycle (city car, delivery car, and official car)
FCV for bigger car, unlimited driving cycle

Fuel Cell Vehicle Development
• 2007
- Tucson, Sportage FCV-II (100 kW)
- FC-BUS II (200 kW)
• 2006
- Tucson, Sportage FCV (80 kW In House Stack)
- FC-BUS (160 kW In House Stack)
Domestic Monitoring Program
(2006.08 ~ 2010.07)
• 2004 ~ 2005
- Tucson FCV (80 kW)
- Sportage FCV (80 kW)
US DOE Fleet Program
(2004.09 ~ 2009.12)
- Santa Fe FCV (75 kW)
- Sportage (10kW)
• 2000 ~ 2002
Member of CaFCP
(2000.11 ~ Present)
• 2008 ~ 2009
- Borrego FCV (115 kW)
- FC-BUS Gen II (200kW)
Validation Program(2009.12 ~ 2011.11) - Tucson iX FCV (100kW)
• 2012 ~
Small Scale Production
i-Blue Concept car

Vehicle design considering small scale production
Dramatic cost reduction through production technology
Compact design of fuel cell system by modularization
Extension of driving range by 70% compared to its
previous version
Hydrogen Tank
Fuel Cell Stack
Motor
Fuel Cell Power 100 kW
Battery 34 kW
Motor System 100 kW
H2 Tank 700 bar
Fuel Economy 31 km/l
Driving Range 650 km
Acceleration (0 → 100kph) 12.9 sec
Max. Speed 160 KPH
Fuel Cell Vehicle Development
Tucson iX Fuel Cell Vehicle (2012)

RIGHT FRONT LEFT
Fuel Cell Vehicle Development
Tucson iX Fuel Cell System (2012)
Compact component design and system modularization
System Power Density: over 620W/L (DOE Target: 650W/L)
Gas/Gas Humidifier
Cold Start Ability: -25oC
System max. Pressure: 1.45baraAir Filter
FC Stack
G/G Humidifier Air BlowerCoolant Pump
Deionizer
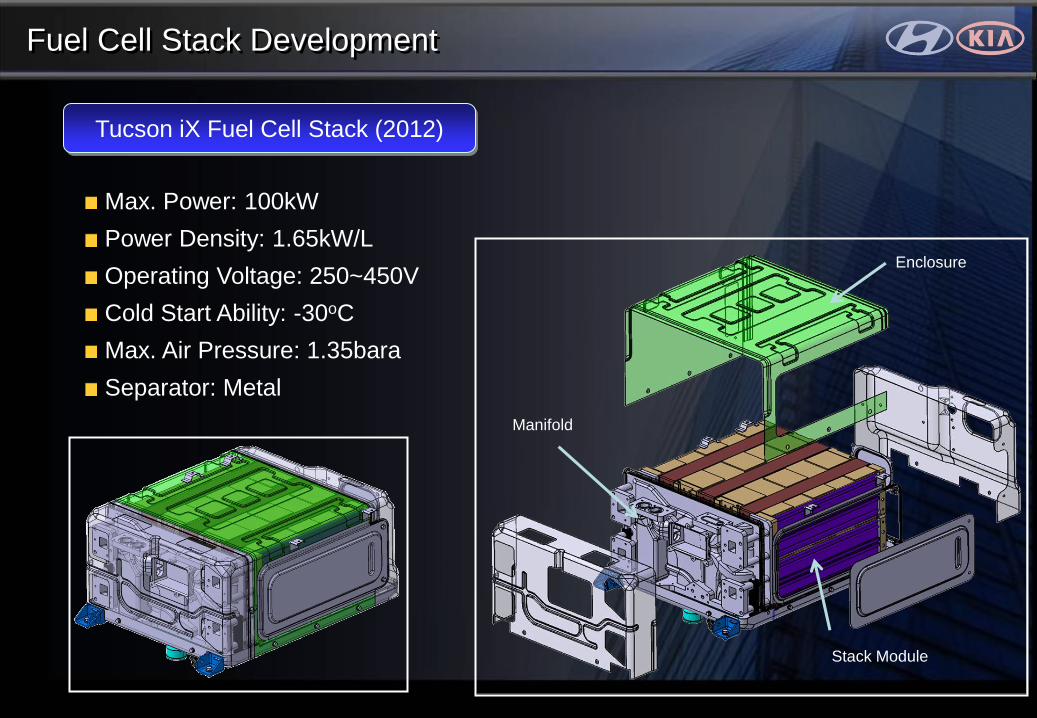
Fuel Cell Stack Development
Max. Power: 100kW
Power Density: 1.65kW/L
Operating Voltage: 250~450V
Cold Start Ability: -30oC
Max. Air Pressure: 1.35bara
Separator: Metal
Tucson iX Fuel Cell Stack (2012)
Enclosure
Manifold
Stack Module

Test Item Simulation Vehicle Test
Sled Impact
Test
Side Impact
Test
(FMVSS 305)
Rear Crash
Test
(FMVSS 301)No Leak in the H2
storage and delivery
system
Before: He gas, 30bar
After: He gas, 350bar
54kph
48kph
54kph(40 G)
No Leak
Check the deformation of
H2 storage and delivery
system
Before: He gas, 30bar
No Leak
Check the deformation
of H2 storage and
delivery system.
Check the H2 tank
burst pressure.
Before: He gas, 10bar
33.5 MPH
30 MPH
Crashworthiness Evaluation
Fuel Cell Vehicle Tests
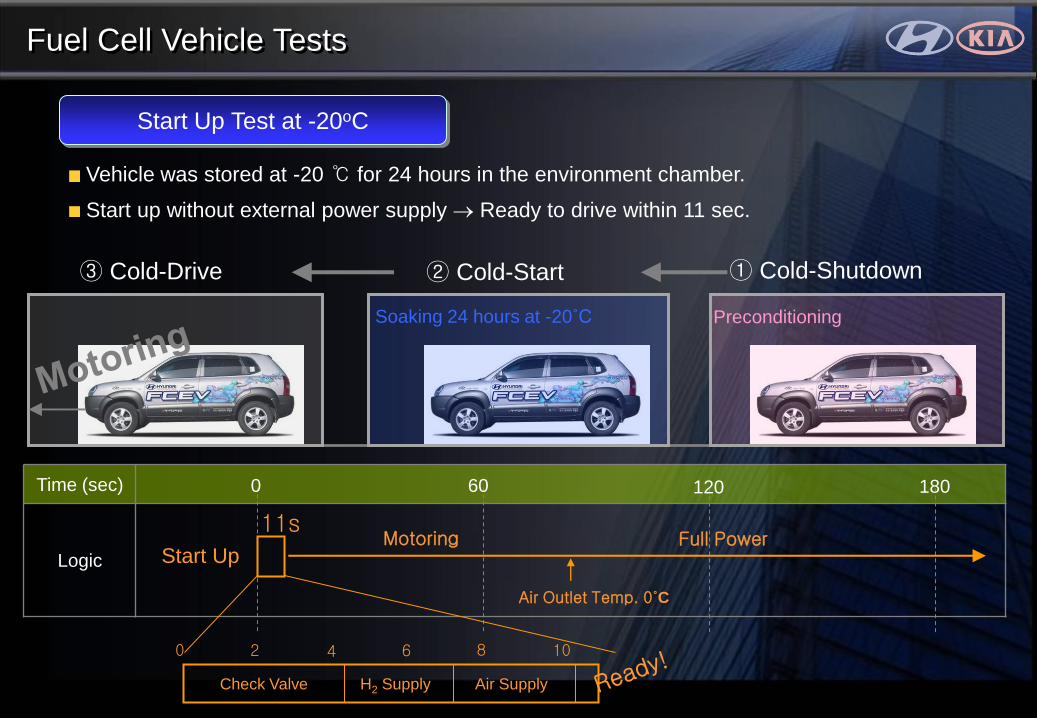
Vehicle was stored at -20 ℃ for 24 hours in the environment chamber.
Start up without external power supply Ready to drive within 11 sec.
Start Up Test at -20oC
Fuel Cell Vehicle Tests
Time (sec)
Logic
0 60 120 180
11s
0 2 4 6 8 10
Check Valve H2 Supply Air Supply
Motoring
Air Outlet Temp. 0˚C
Start Up
① Cold-Shutdown② Cold-Start③ Cold-Drive
Soaking 24 hours at -20˚C Preconditioning
Full Power

Fire Test
Fuel Cell Vehicle Tests
Gasoline Vehicle FCV with Type 3 Tank
Test
Condition• Fire initiated from the ashtray
Result • Fuel tank exploded after 40 minute. • PRD activated after 22 minutes.
Vehicle
CNG Tank (150bar) Hydrogen Tank (350bar)
Test
Condition• Fire Source: LPG gas
Result• PRD activated : CNG vent
• max. flame height 11m
• PRD activated : H2 vent
• max. flame height 8m
Vehicle
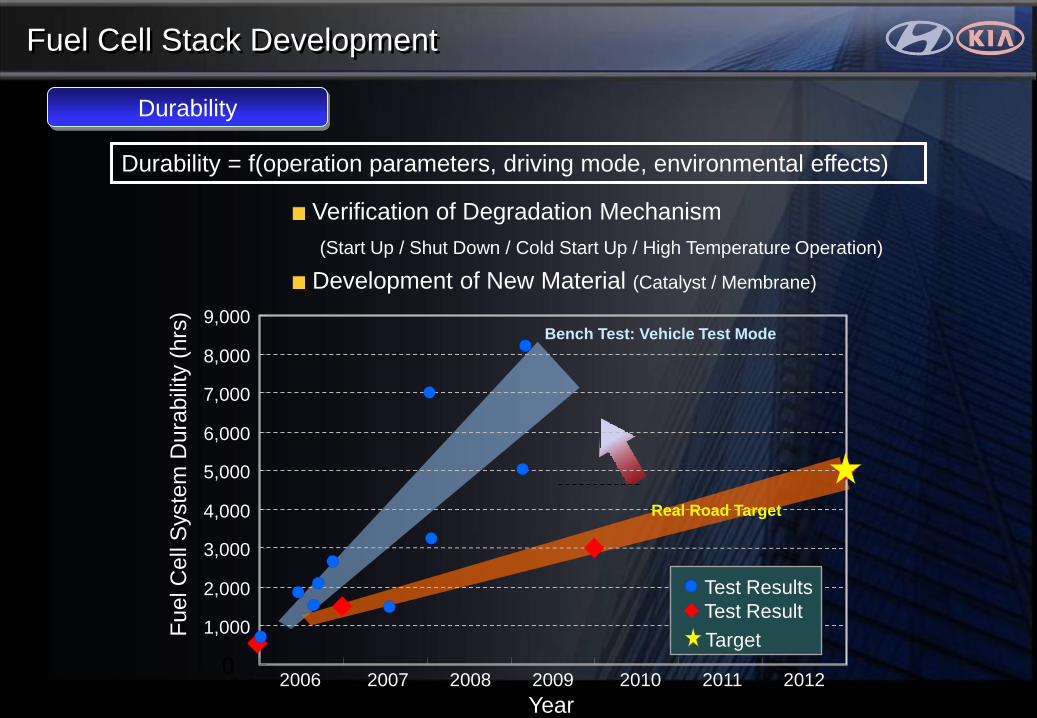
Bench Test: Vehicle Test Mode
Real Road Target
0
1,000
2,000
3,000
4,000
5,000
6,000
7,000
8,000
9,000
Year
Fu
el C
ell
Syste
m D
ura
bili
ty (
hrs
)
Test Results
Test Result
2006 2007 2008 2009 2010 2011 2012
Durability = f(operation parameters, driving mode, environmental effects)
Verification of Degradation Mechanism
(Start Up / Shut Down / Cold Start Up / High Temperature Operation)
Development of New Material (Catalyst / Membrane)
Durability
Fuel Cell Stack Development
Target
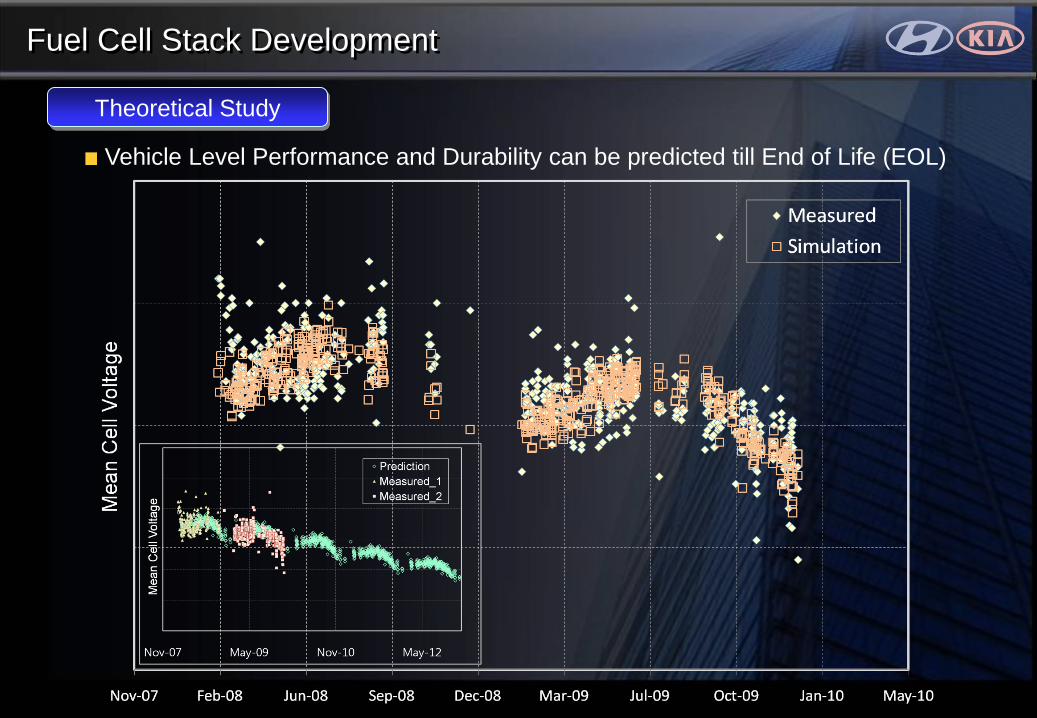
Fuel Cell Stack Development
Theoretical Study
Vehicle Level Performance and Durability can be predicted till End of Life (EOL)

1st Vehicle for Demo Fleet Program
(2005. 12.16)
Fleet Program
1
2
3
4
5
6
11
7
8
9
10
12
( ): 1,000 persons
*Ref.: National Geographic Information System (2005)
1. US DOE
- Period : 2004. 12 ~ 2009. 12 (5years)
- Budget : $105 million
- Vehicles : Tucsan/Sportage FCEV Total 32 vehicles
- 721,654 km / 21,284hr / 71,839 Start up
- Average Fuel Economy: 16.3km/l (gasoline eq.)
2. 1st Stage Domestic
- Period : 2006. 8 ~ 2010. 7 (4 years)
- Budget : $46.6 million
- Vehicles : 30 Passenger cars, 4 Buses
- 743,500km (including Bus)
- Average Fuel Economy: 19.2km/l (gasoline eq.)
3. 2nd Stage Domestic
- Period : 2009. 12 ~ 2011. 11 (2 years)
- Budget : $17.6 million
- Vehicles : 80 Passenger cars
700bar Station: #1, #6, #12

1st Stage
(~’03)
• Member of CaFCP (’00)
• Santa Fe FCEV (’00)
- Award in Michelin Challenge Bibendum
• Tucson, Sportage FCEV (’04)
• DOE Project, US (‘04~ ’09)
• Fleet Demonstration (’06~)
2nd Stage
(’04~’11)
3rd Stage
(’12~)
• The 3rd Generation FCEV
• Establish Core Technology for
Mass Production
CaFCP : California Fuel Cell PartnershipDOE : Department of Energy
Preliminary
Research
Small Scale
Production
Prototype
Development
FCEV Roadmap of Hyundai · Kia

2003 ~ 2012
R&D and Demonstration
2013 ~ 2020 2021 ~ 2030 2031 ~ 2040
Market
Formation
Market
Expansion
Initial Phase of
Hydrogen
Economy
. Demonstration and Supply under
government Support
. Hydrogen Energy Market Share
▶ 0.03%
R&D Demo Market Intrusion
’03-’05 ’06-’08 ’09-’12
▶ ▶
. Accomplishment
Of Technical Development
. Expansion of
Hydrogen Infra
. Self-Growing
Market
Fuel Cell Generation Market Share
Decentralized
1,000 MW
Industrial
2,000 units
Residential
100,000 units
10% 15%
Fuel Cell Vehicle Market Share
Hydrogen Station
500 units
Fuel Cell Vehicle
50,000 units
15% 50%
Decentralized (250-1000kW) 400 MW
Industrial (10-50kW) 80 units
Residential (under 3kW ) 10,000 units
Hydrogen Station 10 units
Fuel Cell Vehicle 500 units
Fuel Cell Bus 20 units
Korean Vision of Hydrogen Economy (2008, MKE)
MKE: Ministry of Knowledge Economy

Cost Estimation
MEA
GDL
Bipolar Plate
Gasket
Balance of Stack
Cost
Annual Production
100 (’10) 1,000 (’12) 10,000 (’15) 100,000 (’20)
Mass Production Effect
MEA/GDL Cost Reduction
Design & Production
Technology Improvement
Low Cost Bipolar Plate
& Gasket Material
Achieved:
1/3 of ’08 Cost
Target: Promising
1/6 of ’08 Cost
Target:
1/20 of ’08 Cost
Target:
1/40 of ’08 Cost
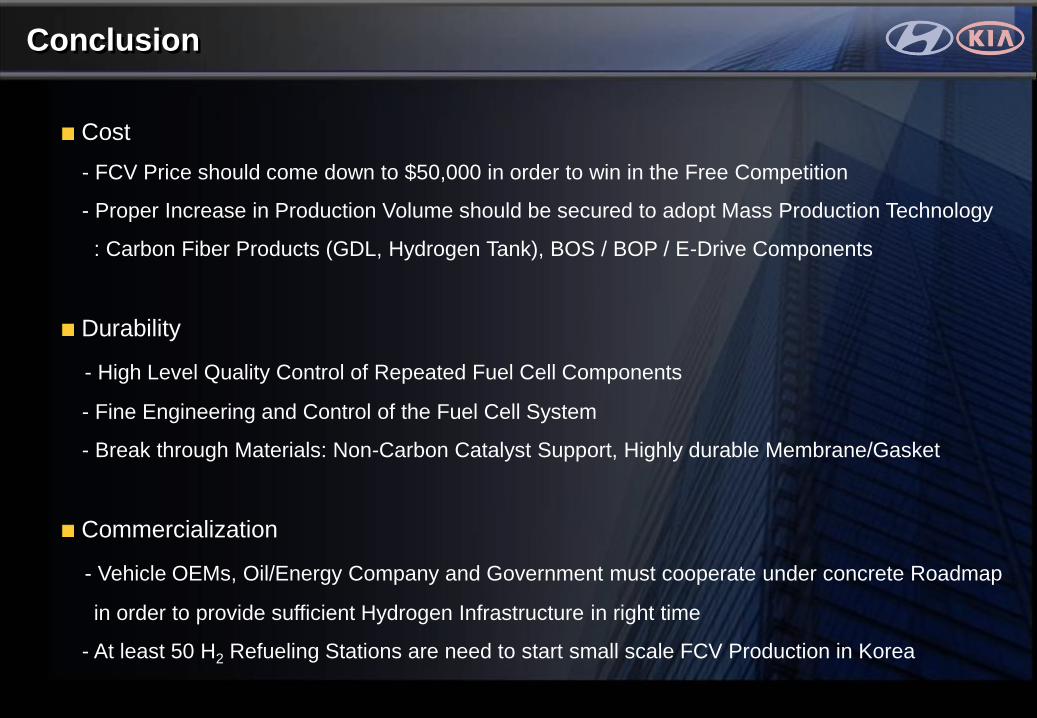
Conclusion
Cost
- FCV Price should come down to $50,000 in order to win in the Free Competition
- Proper Increase in Production Volume should be secured to adopt Mass Production Technology
: Carbon Fiber Products (GDL, Hydrogen Tank), BOS / BOP / E-Drive Components
Durability
- High Level Quality Control of Repeated Fuel Cell Components
- Fine Engineering and Control of the Fuel Cell System
- Break through Materials: Non-Carbon Catalyst Support, Highly durable Membrane/Gasket
Commercialization
- Vehicle OEMs, Oil/Energy Company and Government must cooperate under concrete Roadmap
in order to provide sufficient Hydrogen Infrastructure in right time
- At least 50 H2 Refueling Stations are need to start small scale FCV Production in Korea

Thank You
Top Related