


Languages
Pages
Legal


1
Development and Internal Validation of a Chelex® DNA Extraction Protocol for Reference Oral Swabs
Choon Sung Kambara, BS1, Rebecca Boissaye, MSFS2, Joshua Stewart, MSFS1, Pamela Staton, PhD1
1Marshall University, 1401 Forensics Science Drive, Huntington, WV 25701
2Boston Police Department Crime Laboratory, One Schroeder Plaza, Boston, MA 02120

2
Abstract
Oral swabs are frequently used as reference samples in forensic casework due to their
ease of collection and abundance of DNA for analysis. While several DNA extraction methods
are capable of obtaining a clean DNA extract for analysis, many of these contain factors which
decrease their feasibility in a forensic laboratory. A forensic laboratory must consider several
factors when selecting a DNA extraction method including the quality of the extract as shown in
its ability to produce a DNA profile, the time it takes to perform, any safety risks the method
poses, and cost to the lab. A method is selected based upon a balance of these factors. For
example, the PCI method, while known to provide a very clean DNA extract, involves several
harmful chemicals and is relatively labor intensive. Safer and more facile methods are
commonly used in forensic laboratories. The DNA section of the Boston Police Department
Crime Laboratory currently uses one of these methods for DNA extraction from oral swabs –
the EZ1® DNA Investigator Kit with the EZ1® Advanced (Qiagen). This validated procedure in
place at BPD, while very straightforward, requires a minimum one hour incubation, multiple
tube changes and purchase of the EZ1® DNA Investigator Kit and EZ1® Advanced. The cost per
sample with this procedure is approximately $8.64. An alternative extraction method was
sought to improve efficiency and decrease cost. One such method is a Chelex® 100 resin based
extraction. This method is relatively fast, poses minimal risk to the analyst and costs
approximately $0.03 per sample. The BPD DNA laboratory currently has Chelex® 100 resin DNA
extractions online for bloodstained fabrics, whole blood, saliva, hair, teeth, bone and tissue.

3
The primary goal of this project is to develop a Chelex® 100 resin extraction protocol for
reference swabs for the DNA section of the BPD Crime Laboratory. Such a method will decrease
extraction time and cost while maintaining quality of the ultimate product, the DNA profile. The
secondary goal is to perform an internal validation based on studies recommended by
SWGDAM Validation Guidelines for DNA Analysis Methods to demonstrate that this protocol is
a reliable method for DNA extraction from oral swabs and identify any limitations.
The developed Chelex® 100 resin DNA Extraction from Oral Swabs protocol is a single-
tube extraction that consumes a tip of swab cutting and includes 15 minute incubations at
room temperature and 56°C and an 8 minute incubation in a 100°C dry bath. All samples were
quantified with the Quantifiler® Duo DNA Quantification kit, amplified with the AmpFLSTR®
Identifiler® Plus Amplification kit, typed on an Applied Biosystems® 3130xl Genetic Analyzer and
analyzed using GeneMapper ID v3.2.1. This protocol is capable of extracting DNA from oral
swabs and the resulting extract can be used to produce concordant and reproducible full,
single-source profiles. Future work should be performed to further refine the analysis by
determining the optimal amplification target and evaluating the performance of the method
with oral swabs with trace amounts of DNA.
Introduction
The purpose of Forensic DNA laboratories is to obtain as much factual information
about the DNA contained in a biological sample as possible. In an ideal world, this could be
done without time or financial constraints. However, in reality, many Forensic DNA laboratories
have limited budgets, analysts and time with an abundance of samples to be examined.

4
Therefore, it is necessary to implement procedures in a lab that maximize efficiency while
minimizing cost. The purpose of this research is to devise and validate such a procedure for the
Boston Police Department Crime Laboratory DNA Section. Specifically, a BioRad Chelex® resin
(Bio-Rad, Hercules, CA, US) based extraction procedure for oral swabs to be used as reference
samples.
Extraction of DNA from biological samples is the first part of the DNA workflow and is
the step ultimately responsible for obtaining the DNA for analysis. Additional goals of DNA
extraction include protecting the DNA from materials that can degrade it such as biological
nucleases and removing any other biological materials that could potentially complicate the
analysis process such as lipids, carbohydrates and other proteins. It is also desirable to remove
any potential PCR inhibitors that could prevent the necessary DNA amplification.1
The DNA Section of the Boston Police Department Crime (BPD) Laboratory currently
uses three DNA extraction methods: the QIAGEN EZ1® Advanced (QIAGEN, Venlo, The
Netherlands) with the EZ1® DNA Investigator Kit (QIAGEN) extraction using the trace or large
volume protocols, a BioRad Chelex® resin based extraction and an organic extraction for bones
and teeth. In the remainder of this paper, the QIAGEN EZ1® Advanced with the EZ1® DNA
Investigator Kit extraction and the BioRad Chelex® resin based extractions will be referred to as
the EZ1® and Chelex® extractions, respectively.
The EZ1® extraction method is often used in forensic DNA laboratories because it is a
facile, automated extraction that produces a clean extract with relatively little analyst manual
labor. However, the procedure can be relatively lengthy and the accumulated cost can become
a burden. The BPD DNA lab currently uses the Trace and Large Volume protocols which require

5
removal of the swab substrate with multiple tube changes. Any step that involves movement
of biological materials introduces the potential risk of contamination. Additionally, BPD’s SOP
includes a minimum one hour incubation. The potential contamination risk and extraction
length of greater than one hour are downfalls of the extraction method.
The EZ1® extraction requires the use of proprietary reagents which must be obtained
from QIAGEN. This extraction requires the purchase of the QIAGEN EZ1® Advanced , the EZ1®
DNA Investigator Kit which contains reagent cartridges, proprietary buffer G2, tip holders, filter-
tips, sample tubes, elution tube, proteinase K, carrier RNA, a Q-card and the handbook.2
Depending on the type of extraction, additional buffers are required that are not included in
EZ1 kit. Each kit contains 48 reagent cartridges, each of which can be used for the extraction of
a single sample. Additionally, labs are encouraged to purchase service contracts for the EZ1®
Advanced and will inevitably incur preventative maintenance costs. The BPD DNA section has
also occasionally experienced issues with their EZ1® extractions producing poor quality or
partial profiles with control samples.
The Chelex® extraction is slightly more labor intensive compared to the EZ1® Advanced
extraction and in the BPD lab it has been seen that Chelex® extracts have more issues with
inhibitors that are not seen with EZ1® extracts. However, it is much more cost effective and has
a consistently shorter procedure compared to the EZ1® extraction used by BPD. While the EZ1®
extraction tends to produce cleaner extracts compared to many other extractions, the extracts
obtained with the Chelex® procedure have proven to produce good quality interpretable
profiles that can be used for DNA analysis.

6
Chelex® DNA extractions basically consist of incubating cells with a 5% solution of
Chelex® at water boiling temperature. The high temperature serves to lyse the cells, thereby
releasing the DNA. However, this also releases DNA nucleases which can destroy the DNA. The
purpose of the Chelex® is to chelate divalent and trivalent cations that are needed for the
function of the DNA nucleases, specifically Mg2+ ions. The Chelex® protects the DNA by
preventing the action of the DNA nucleases. This extraction only requires the additional
purchase of the BioRad BT Chelex® 100 resin. All other components of the extraction are
already present in the laboratory.
A cost analysis comparison was performed comparing the costs incurred per sample for
the EZ1® and Chelex® extractions and is shown in Table 1. This analysis only took into account
the costs of the DNA Investigator Kit and the Chelex® resin. It did not include the additional
costs incurred by the EZ1® extraction for the instrument purchase, maintenance and service
contracts. The Chelex® cost was determined using the assumption that the resin will be used to
make 5% Chelex® solutions which are currently used in the Chelex® extraction procedures at
BPD. This comparison showed the cost incurred by the Chelex® extraction is significantly lower
than the cost incurred by the EZ1® extraction. The cost of the EZ1 extraction is about 300 times
more expensive per sample compared to the Chelex® extraction.
Table 1: Cost analysis comparison of the EZ1® and Chelex® ® extractions.
Qiagen DNA Investigator Kit
Chelex® 100 Resin (100 g Bottle)
Cost of Kit/Bottle $414.72 $397.10 Number of Samples
per Kit/Bottle 48 11765
Cost per Sample $8.64 $0.03

7
Currently, the BPD DNA section lab manual has procedures for Chelex® resin extractions
of whole blood, bloodstains, saliva and hair. The only extraction method online for oral swabs is
the EZ1® extraction method. Oral swabs are often collected in the course of an investigation to
act as reference samples and there are several expectations associated with these types of
samples. On average, oral swabs are expected to produce a relatively large quantity of DNA,
approximately 10 - 1,500 ng of DNA per oral swab1. Additionally, oral swabs should produce
single source profiles. When collected properly, the overwhelming majority of biological
material on the swab should be the individual of interest’s buccal cells.
Oral swabs are also easy to collect, primarily consisting of rubbing a cotton swab against
the inside of the cheek to gather cells. They are also relatively inexpensive, only requiring the
purchase of the swabs, and do not require much specialized training to collect as opposed to
blood reference samples which must be collected by a medically trained individual.
BPD previously did work to develop a Chelex® based extraction protocol for oral swabs.
However, the final procedure was somewhat labor intensive and time consuming. It involved
using a half swab cutting, removing the swab substrate with a spin-x basket, 30 minute room
temperature incubation, 30 minute 56° incubation and purification using a Centricon-100
(Millipore, Billerica, MA, US). The protocol efficiently and reproducibly extracted DNA, but was
not ideal for several reasons. Removing the swab substrate involves movement of DNA
containing material and introduces a potential risk of contamination. Additional purchase of the
spin-x basket is also undesirable as it increases cost of the extraction. The accumulated
incubation length is already as long as the EZ1 extraction. The purification step requires
additional work from the analyst and the use of additional materials which ultimately results in

8
increased cost of the extraction. Furthermore, the Centricon-100 is no longer manufactured so
another purification method would need to be evaluated. The ideal extraction method is a
short, one-tube extraction that involves minimal manipulation of the substrate or extract with
few additional materials needed.
The purpose of this project is to develop and validate a facile, quick, and cost effective
procedure for Chelex® extraction of DNA from oral swabs. This project has three components:
procedure development, validation, and additional studies. In the development of the
procedure, the following factors were taken into consideration: the swab cutting size, length of
room temperature incubation, length of 56° incubation and method of boiling. The Chelex®
extraction validation included contamination and stability studies. The stability studies explored
the stability of the extracts produced by the Chelex® extraction procedure as well as the ability
of the procedure to extract DNA from aged samples. Concordance was evaluated in all studies
that involved extraction of samples from individuals of known profile. Additional studies were
devised to address questions that were encountered during the course of this project and
included a 5% Chelex® solution stability study, amplification target study and post-extraction
interference studies.
Materials and Methods
General DNA workflow
All DNA samples in this research project were carried through extraction, quantitation,
amplification, and typing. Boston Police Department standard operating procedures were used
for all steps unless otherwise specified. The extraction procedures used are study specific and
will be described in each individual study but reagent blanks were included in all extractions.

9
Post-extraction DNA workflow processes were performed using BPD’s SOP unless otherwise
indicated in the materials and methods. Quantitation was performed using the Applied
Biosystems® (Carlsbad, CA, US) Quantifiler® Duo DNA Quantification Kit and 7500 Real-Time
PCR System. Amplification was performed using the AmpFlSTR® Identifiler® Plus Amplification
kit (Applied Biosystems®) and the 9700 thermal cycler (Applied Biosystems®). Typing was
performed using Applied Biosystems® 3130xL Genetic Analyzer. Profile analysis was performed
using Genemapper ID v.3.2.1 (Applied Biosystems®) with BPD validated marker-specific stutter
filters (we use the AB stutter filters). Statistical analysis and figure generation was performed in
Microsoft® Excel 2010 (Microsoft Corporation, Redmond, WA, US).
Analysis
Quantitation data was analyzed for ability to meet the following:
• Slope: -3.3 ± 0.3 • R2 values >0.98 • IPC Ct values of samples within a run were approximately ±0.5 of each other (if not in
range, possible indication of inhibition) • Correct sex assignment (if known)
Profiles were evaluated for the following:
• Only one or two true peaks reported per locus (expectation of single source) • Stochastic threshold: 155 RFU • Analytical threshold: 50 RFU • Heterozygote peak height ratio: 60% • Presence of artifacts – pull up, minus A, stutter, etc. • General peak height trends were also noted to give indication of relative quantity of
DNA amplified and indications of degradation or inhibition
Throughout the course of this paper, the studies performed are labeled according the portion of the project with which they correspond and their individual study number.
1. Project Development

10
2. Validation 3. Additional Questions
Procedure Development
The BPD Chelex® DNA Extraction from Whole Blood/Bloodstains/Saliva protocol, shown below,
was used as the basis for development of a Chelex® extraction protocol for oral swabs. The 5%
Chelex® solution was prepared per BPD SOP by dissolving 5 grams of BioRad BT Chelex® 100
Resin in 100 mL of DI H2O and storing sealed at room temperature.
Additional equipment used included an Eppendorf® Centrifuge 5424 (Haupparuge, NY,
US), MaxiMixTM II Vortex (Thermo Fisher Scientific, Waltham, MA, US), OHaus® Adventurer Pro
Balance (Parsippany, NJ, US), and Corning® pH Meter 430 (Corning, NY, US). A Boekel Model
111004 was used for the 56°C dry bath and a Fisher Scientific Isotemp® was used for the 100°C
dry bath. Swabs used to collect biological samples during the course of this project were
Puritan® Pur-Wraps REF 25-806 2WC (Puritan Medical, Guilford, ME, US).
BPD Chelex® DNA Extraction from Whole Blood/Bloodstains/Saliva Controls: • Reagent Blank (Required) • Reagent Blank – future testing (Required) • Control bloodstain (Required if testing known, alternate, or investigative
references) • Unstained material if evidence is a stain (subject to analyst discretion)
1. Pipette 1 ml sterile distilled water into a sterile, uniquely labeled 1.5 ml microcentrifuge tube. Add one of the following and mix gently: A. 3 μl whole blood B. ~ 3 mm x 3 mm portion of stain 2. Incubate at room temperature for 15 to 30 minutes. Mix occasionally by inversion or gentle vortexing. 3. Spin in a microcentrifuge for 2 to 3 minutes at 10,000 to 15,000 x g.

11
4. Carefully remove all but 20 to 30 μl supernatant and discard. If the sample is a stain, leave the fabric substrate in the tube with the pellet. 5. Using a stir plate, ensure the 5% Chelex® solution is being aggressively mixed to get the beads mixed evenly into the liquid. 6. Using a P1000 pipet, add 5% Chelex® to bring the final volume in the tube to 200 μl.
a. Note: A P200 pipet tip is not large enough to effectively pipet the Chelex® resin, causing it to clog the pipet tip and not pipet the correct amount.
7. Incubate at 56°C for 15 to 30 minutes. While the samples are incubating, fill the beaker with ~400ml of water, and place on hotplate to allow time to get to boiling for the next step. 8. Vortex at high speed for 5 to 10 seconds. 9. Secure the tops of the tubes with tube locks. Incubate in a boiling water bath for 8 minutes. 10. Vortex at high speed for 5 to 10 seconds. 11. Spin in a microcentrifuge for 2 to 3 minutes at 10,000 to 15,000 x g. The sample is now ready for DNA quantitation. Store the extract at 2 to 8°C or frozen for a period of 3 years. To re-use, repeat steps 9 through 10.
Unless otherwise indicated, whenever given a range in the protocol, the maximum of
the limit was used. For example, for step 2, extracts were allowed to incubate for 30 minutes
with vortexing every five minutes. Additionally, it must be noted that a few amendments were
made to the protocol in the DNA Lab Manual v2013.0 which was released during the course of
this internship. Specifically, in the first step, the sample is placed in the 1.5 mL microcentrifuge
tube followed by the addition of 1 mL of sterile distilled water. A wash procedure for the tube
locks was also included (shown below).

12
Clean the tube locks by filling a tray with a soapy solution made with warm water and 10%
detergent. Let the tube locks soak for 15-60 minutes. Rinse well with warm water, followed
by a distilled water rinse.
Both of these amendments were implemented in the revision of the protocol from the
beginning of the project.
1.1 - Concordance of Chelex® Extracted Known Bloods and Oral Swabs; Tip of Swab Cutting
Evaluation Study
This study was performed to determine whether a Chelex® extraction was capable of
extracting good, quality DNA from oral swabs to produce full, single source profiles that were
concordant with Chelex® extracted bloodstains from the same donors. This study was also used
as a preliminary sampling size study. Previous Chelex® extractions of oral swab studies
performed by BPD indicated that half of a swab produced issues with downstream processes in
the DNA analysis workflow resulting in profiles that seemed inhibited. Due to the high quantity
of DNA expected with oral swabs, a tip of swab cutting was chosen for the sampling size for this
preliminary study. Smaller sampling size is also desirable to preserve as much of the original
sample as possible. Additionally, the cotton swab was not removed during the extraction.
BPD currently uses an amplification target of 0.75 ng with the Identifiler® Plus
Amplification kit. An amplification target of 0.5 ng was used rather than the 0.75 ng target due
to presence of artifacts such as excessive pull up, stutter and some overblown samples seen
with 0.75 ng targeted Chelex® extracts using Identifiler® Plus and BPD’s 3130xL genetic analyzer
to evaluate whether a smaller amplification target is needed with Chelex® extracts.

13
This study was conducted by extracting oral swabs from three donors using the BPD
Chelex® DNA Extraction from Whole Blood/Bloodstains/Saliva Protocol with the previously
mentioned modifications. Bloodstained fabrics from the same donors were extracted using the
Chelex® DNA Extraction from Whole Blood/Bloodstains/Saliva protocol.
All profiles were analyzed, evaluated for fullness and quality of profile and compared for
each donor. Comparisons were made between the blood and oral swab extract profiles and to
BPD’s internal DNA database.
1.2 - Sample Cutting Type Study
The purpose of this study was to determine the effect of sampling size of oral swabs on
the quality of the DNA profile after extraction with the Chelex® extraction procedure. This study
had the dual goals of determining the most effective sampling method and evaluating the
sensitivity of the Chelex® extraction procedure in terms of what types of sample cuttings the
procedure can extract DNA from and produce a full good quality profile.
This study was performed by comparing profiles of extracts obtained from 3 samples
cutting types: tip of swab, ¼ of swab (cut lengthwise), and ½ of swab (cut lengthwise). This
comparison will indicate which sampling method is capable of producing a good quality full
profile. Another consideration for cutting type is that minimal consumption of the sample is
preferable to allow for re-examination of the original sample, if needed. Additionally, the study
acted as a stress test to determine what sampling sizes the extraction method can handle and
expose issues that may be encountered with different sample sizes.

14
The three cutting types were obtained and extracted for 4 individual donors, including
two donors of known profile. The oral swabs were a combination of freshly collected and
previously collected and refrigerated oral swabs covering a range of 0-5 years old.
All profiles were analyzed, evaluated for fullness and quality of profile and compared for
each donor. The smallest sampling size that consistently produces a full good quality profile is
the best candidate for sampling size.
1.3 - Room Temperature Incubation Length Study
The purpose of this study was to determine whether a 15 minute or 30 minute room
temperature incubation is sufficient for an efficient extraction with the Chelex® extraction
method for oral swabs. Currently, the BPD Chelex® extraction protocol allows for a 15-30
minute room temperature incubation. However, if a 15 minute incubation is capable of
producing a good quality, full profile; it would be desirable to use the 15 minute incubation as
this would decrease total extraction time.
The samples were also used in an evaluation of whether an 0.25 ng or 0.5 ng DNA target
for amplification performs better with Chelex® extracted oral swabs. In previous studies, the
0.5 ng DNA amplified profiles have shown evidence of pull up, minus A and in one occurrence
an over blown profile. Using a smaller target may improve the quality of the profile.
Two swabs from three donors were extracted using the Chelex® extraction procedure.
One swab from each donor was extracted using a 15 minute room temperature incubation and
the other swab was extracted with a 30 minute room temperature incubation. The remainder
of the extraction protocol remained constant. All samples were amplified using 0.25 ng and 0.5
ng targets.

15
For each individual donor, the quantitation results and qualities of the profiles obtained
from using the different room temperature incubation lengths were compared. If the 15 minute
incubation length consistently produces a full good-quality profile, this will indicate that it is the
best candidate for room temperature incubation. However, if issues are seen within the 15
minute incubation profiles (ex. inhibition, poor peak height ratios, degradation, etc.) longer
room temperature incubation lengths will be tested.
The quality of the profiles were also used to evaluate whether a 0.25 ng or 0.5 ng DNA
target should be used for amplification of Chelex® extracted oral swabs. The target amount that
produces a larger percentage of full, good quality profiles will be considered for the
amplification target amount.
1.4 - 56°C Incubation Length Study
The purpose of this study was to determine whether a 15 minute or 30 minute 56°C
temperature incubation is sufficient for an efficient extraction with the Chelex® extraction
method. Currently, the BPD Chelex® extraction protocol allows for a 15-30 minute 56°C
temperature incubation. However, if a 15 minute incubation is capable of producing a good
quality, full profile; it would be desirable to use the 15 minute incubation as this would cut
down on extraction time.
The quantitation results from the Room Temperature Incubation Length Study indicated
that the 15 minute room temperature incubation produces comparable results to the 30
minute room temperature incubation. Therefore, the 15 minute room temperature incubation
was used for this study. The remainder of the extraction protocol was unchanged.
16
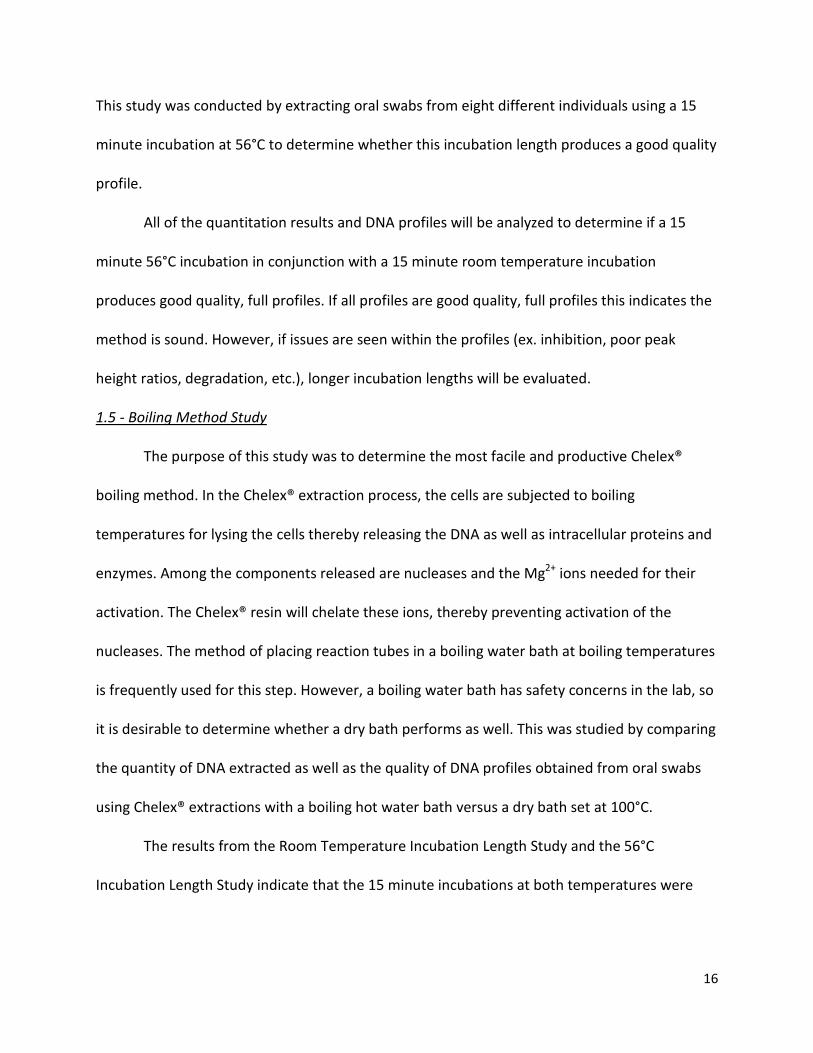
This study was conducted by extracting oral swabs from eight different individuals using a 15
minute incubation at 56°C to determine whether this incubation length produces a good quality
profile.
All of the quantitation results and DNA profiles will be analyzed to determine if a 15
minute 56°C incubation in conjunction with a 15 minute room temperature incubation
produces good quality, full profiles. If all profiles are good quality, full profiles this indicates the
method is sound. However, if issues are seen within the profiles (ex. inhibition, poor peak
height ratios, degradation, etc.), longer incubation lengths will be evaluated.
1.5 - Boiling Method Study
The purpose of this study was to determine the most facile and productive Chelex®
boiling method. In the Chelex® extraction process, the cells are subjected to boiling
temperatures for lysing the cells thereby releasing the DNA as well as intracellular proteins and
enzymes. Among the components released are nucleases and the Mg2+ ions needed for their
activation. The Chelex® resin will chelate these ions, thereby preventing activation of the
nucleases. The method of placing reaction tubes in a boiling water bath at boiling temperatures
is frequently used for this step. However, a boiling water bath has safety concerns in the lab, so
it is desirable to determine whether a dry bath performs as well. This was studied by comparing
the quantity of DNA extracted as well as the quality of DNA profiles obtained from oral swabs
using Chelex® extractions with a boiling hot water bath versus a dry bath set at 100°C.
The results from the Room Temperature Incubation Length Study and the 56°C
Incubation Length Study indicate that the 15 minute incubations at both temperatures were
17
acceptable. Therefore, the 15 minute room temperature and 56°C incubations were used for
this study.
The sample group consisted of five individuals, including one individual of known profile.
Tip of oral swab cuttings were divided in half. One of the halves underwent extraction with the
boiling water bath. The other half underwent extraction with the dry bath set at 100°C.
For each individual donor, the extracted DNA quantities and qualities of the profiles obtained
by using the different boiling methods were compared. The method that consistently produces
a full good-quality profile is the best candidate for Chelex® extraction. Quality of the profile was
evaluated based on RFU values, peak morphology and presence of artifacts.
Validation Studies
Validation studies are performed to meet the standards set by the FBI Director’s Quality
Assurance Standards (QAS).3 The studies performed in this validation were designed using the
SWGDAM Validation Guidelines for DNA Analysis Methods and the specific needs of the BPD
DNA section for an extraction method to be used for reference samples. The studies performed
as part of this validation were contamination and various stability studies. The stability studies
included evaluations of the stability of the extract and of the ability of the extraction procedure
to extract DNA from aged swabs. Both of these stability studies were performed using the
original unmodified extraction procedure and the revised extraction procedure after changes
were made following the procedure development studies. Additionally, throughout the course
of this project, all samples from donors with known profiles were compared with their
respective previously obtained profiles and evaluated for concordance.

18
2.1 - Concordance Study
Samples of known profile were compared to their profiles in the BPD internal database and
evaluated for concordance.
2.2 - Contamination Study
The purpose of this study was to determine whether the Chelex® extraction procedure
poses a risk for introducing contamination. This study was performed by analyzing the reagent
blanks collected throughout the course of this internship.
All reagent blanks were analyzed for signs of contamination in the quantification results
and the run electropherograms. If reagent blanks are free of DNA, the Chelex® extraction
procedure is not likely to cause contamination.
2.3 - Stability Study – Original Procedure – Substrate Variability
The purpose of this study was to determine whether the Chelex® extraction method can
extract good quality DNA from oral swabs that have been subjected to a stressful environment
that simulated accelerated aging. The environment chosen was an incubation oven set at 37°C.
Oral swabs were incubated and then removed and extracted at different times to determine if
the quality of the DNA is affected by the incubation. Quantification and amplification were
performed following extraction. Oral swabs that were incubated for 0, 15, 34 and 50 days were
evaluated.
This portion of the study was conducted on freshly collected swabs and artificially aged
swabs. Four donors each provided four swabs. The freshly collected swabs that did not undergo
artificial aging were designated as Day 0 swabs. The artificially aged swabs were designated by

19
the day when they were removed from the oven: Day 15, Day 34 and Day 50. A single swab
from each donor was used for each Day 0, Day 15, Day 34 and Day 50.
The profiles of the extracts obtained at Day 0, 15, 34 and 50 were compared. The quality
of the profiles and whether they correspond with their respective Day 0 profiles will indicate
whether this Chelex® extraction protocol can be used for extractions of aged swabs.
2.4 - Stability Study – Extract Variability
Additionally, it is necessary to determine whether storing an extract obtained from an
oral swab with the Chelex® extraction procedure with the cotton swab material and Chelex®
resin left in the extract over a long period will affect the quality of the DNA profile obtained
from the extract.
Minimizing the number of manipulations to a sample, such as removing the substrate
from the extract, reduces the risk of contamination which is always a priority in any forensic
science discipline. If storing the extract, refrigerated at 4-8°C with the substrate left in the
extract has no effect on the DNA analysis of the sample, this indicates that the storage
procedure does not have any deleterious effect on the DNA.
This part of the study was performed by quantifying and amplifying the extracts from
the Day 0 swabs on multiple days over the course of approximately 50 days. This was
performed at approximately 15, 34 and 50 days after extraction. The profiles of each
amplification of the Day 0 extracts were compared to the profiles obtained from their
respective original amplification and runs. The quality of the profiles and whether they
correspond with the previously obtained profiles will indicate whether the extract storage
procedure has any deleterious effect on the DNA.

20
2.5 - Stability Study – Revised Procedure – Substrate Variability
This study is a follow up to Stability Study – Original Procedure – Substrate Variability
and was included to ensure that the changes to the original protocol have not negatively
impacted the protocol’s ability to extract good quality DNA from oral swabs that have been
subjected to a stressful environment. The modifications made to the protocol are shown in
Table 2.
Table 2: Summary of modifications to Chelex® Extraction Protocol
Parameters Original Protocol
Revised Protocol
Room Temperature Incubation Length 30 min 15 min
56°C Incubation Length 30 min 15 min
100°C Incubation Method Boiling Water Bath (8 min)
Dry Bath (8 min)
As in Stability Study – Original Procedure – Substrate Variability, the stressful environment was
an incubation oven set at 37°C. Oral swabs were incubated and then removed and extracted
after different lengths of 37°C incubation to determine if the quality of the DNA is affected by
the incubation. Oral swabs that have been incubated for 0, 15, 34 and 50 days were evaluated
with quantification and amplification performed soon after extraction.
The profiles of the extracts obtained at Day 0, 15, 34 and 50 were compared. The quality
of the profiles and whether they correspond with their respective Day 0 profiles will indicate
whether this Chelex® extraction protocol can be used for extractions of aged swabs.
Additional Studies

21
These studies were performed to address questions that arose during the course of this
internship project.
3.1 - Amplification Target Study
The purpose of this study was to determine the amplification target amount that most
consistently produces full good-quality DNA profiles. BPD currently has an amplification target
of 0.75 ng in their DNA Lab manual. However, this target amount has been seen to produce
profiles with characteristics of excessive DNA for single source reference samples. Additionally,
during the course of previous studies for this project, targets of 0.5 ng have produced profiles
with very high RFU values (>6,000 RFU) and various artifacts including n+4 stutter, n-8 stutter, -
A and shoulders. There are a few possible explanations for the results that have been observed.
Chelex® extraction for oral swabs is a protocol that has not previously been used in the
BPD DNA lab. Therefore it is unknown whether the nature of the sample could potentially
introduce materials that would affect either the quantification or the amplification of the
extract. The swab material itself or the buccal cells and saliva in conjunction with Chelex® resin
could be possible sources of the observed results. This will be further evaluated in additional
studies.
Additionally, the BPD DNA Laboratory recently transitioned from the ABI Identifiler®
Amplification kit to the ABI Identifiler® Plus Amplification kit. Identifiler® Plus is a more sensitive
amplification system that causes increased amplification resulting in greater peak heights
compared to Identifiler®4. This could contribute to the results that have been seen.
Over the course of this internship, samples within multiple studies were amplified using 0.25 ng
DNA and 0.5 ng DNA amplification targets.

22
All profiles were evaluated for fullness of profile and the profiles obtained at different
amplification targets for each individual were compared for quality of profile. Quality of profile
was defined by peak height ratios of heterozygotes (BPD standard of 60%), overall peak height
distribution across loci and presence of artifacts.
The amplification target that most consistently produces full good quality profiles will be
defined as the target amount for Chelex® extracted oral swabs.
3.2 - Stability of 5% Chelex® Solution Study
The purpose of this study was to approximate the length of the stability of a 5% Chelex®
Solution. Various sources give different time periods for the shelf-life of a 5% Chelex® solution.
Per a phone conversation with a BioRad representative, BioRad’s recommended stability period
for the solutions is a few days and the solution is still considered viable when the pH is at least
9. Willard, Lee and Holland consider the life-time of the solution to be a few hours and
recommend only using the solution if the pH is between 10.0 and 11.0.5 The Maine State Police
Crime Laboratory Manual version 5.1 also recommends preparing the 5% Chelex® solution for
each extraction but states the pH must be between 9.0 and 10.0.6
However, other agencies state the shelf-life of 5% Chelex® solution is potentially longer.
The National Forensic Science Technology Center DNA Analyst Laboratory Training Manual
Protocol 3.05 Chelex® 100 Non-Differential Extraction defines the shelf-life to be 1 year from
date of preparation 7.The BPD DNA Lab Manual, designates the shelf life of a 5% Chelex®
solution as 1 year from time of preparation or the expiration date of the soonest expired
component, whichever is closest to date of preparation.

23
The shelf-life of a 5% Chelex® solution was evaluated by measuring the pH of a
previously prepared and freshly prepared 5% Chelex® solution over various lengths of time. The
pH of the freshly prepared 5% Chelex® solution was measured hourly during the day of its
preparation. The pH of both the freshly and previously prepared solutions were also measured
daily over a period of approximately 30 days.
The trends in changes in pH over the time periods that were evaluated to determine the
shelf-life of a 5% Chelex® solution. The 5% Chelex® solution was considered expired if it reaches
pH 9.0.
The findings of this study were used to determine how frequently the 5% Chelex®
solution should be prepared. Additionally, a schedule for regularly monitoring the pH of 5%
Chelex® solutions will be put in place.
3.3 - Post-Extraction Interference Study – Blood
During the course of this project, the profiles obtained from Chelex® extracted oral
swabs with targets of 0.5 ng have shown quality issues (BPD’s current standard operating
procedure for Identifiler® Plus has amplification target of 0.75 ng). These issues consist of
obtaining profiles with characteristic features of excessive DNA (higher than expected RFU
levels, excessive pull up, stutter and minus A) which is not the expected result for the targets
used. Additionally, these issues have been seen with Chelex® extracted control bloods (rbs
fabrics) with amplification targets of 0.75 ng with Identifiler® Plus.
The purpose of this study was to evaluate whether extracting stains on cotton swabs
with the Chelex® DNA extraction affects the downstream steps of the DNA analysis workflow.

24
Specifically, it was studied whether the effect is manifested in quantification with the
Quantifiler® Duo Quantification Kit or amplification with the Identifiler® Plus Amplification Kit.
Possible sources of the previously mentioned issues were evaluated by comparing
quantification results and profiles for blood on cotton swabs vs. liquid blood when extracted
with Chelex® vs. EZ1 methods.
Four samples of whole blood were obtained from the serology section of the BPD Crime
Lab. The whole blood was previously collected by certified individuals in vacutainers with
purple caps and had been designated as ready for discarding by the serology section.
Swab samples were prepared by pipetting 10 μL of blood onto a clean tip of swab
cutting and allowed to dry. For each individual donor, six swab samples of this type were
prepared. The swab samples were extracted with Chelex® and EZ1 methods. Both types of
extractions were performed in triplicate.
Chelex® Extraction – Revised Procedure
Two types of samples per donor:
1. Blood swab sample (see above for sample preparation) 2. 10 μL of liquid blood
EZ1 Extraction
BPD DNA Manual - DNA Extraction from Whole Blood/Bloodstains/Saliva/Epithelial Cells Protocol
Two types of samples per donor:
1. Blood swab sample (see above for sample preparation) • 1 hour incubation at 56°C • Trace protocol • 50 μL elution volume • TE for elution buffer

25
2. 10 μL of liquid blood • Liquid blood procedure • Trace protocol • 50 μL elution volume • TE for elution buffer
For each individual donor, the quantification results for the blood swabs extracted with
the two different methods were compared with one another. The liquid blood extracts from the
two different methods were also compared with one another. Additionally, for each extraction
method, the quantification results from the whole blood and bloodstained swabs were
compared.
Each sample was evaluated for fullness of profile, peak heights, artifacts (including
stutter, minus A, and pull up, etc.) and ability to meet BPD’s heterozygote peak height ratio of
60%.The profiles obtained from the different amplification targets will be compared as a
function of the sample type and extraction method. These comparisons were used to
determine whether the amplification issues that had been observed were a result of swab
material, the Chelex® resin, Quantifiler® Duo DNA Quantification Kit or Identifiler® Plus
Amplification Kit or some combination of these factors.
3.4 - Post-Extraction Interference Study – Saliva and Buccal Cells
The purpose of this study was to evaluate whether extracting DNA from saliva and
buccal cells on cotton swabs in with the Chelex® DNA extraction method affects the
downstream steps of the DNA analysis workflow. Specifically, whether the effect is manifested
in quantification with the Quantifiler® Duo Quantification Kit or amplification with the
Identifiler® Plus Amplification Kit.

26
Possible sources of the previously mentioned issues were evaluated by comparing
quantification results and profiles for saliva and buccal cells on cotton swabs vs. saliva and
buccal cells when extracted with Chelex® vs. EZ1 methods.
Saliva and Buccal Sample Collection
Four donors were each asked for approximately 1 mL saliva samples in 1.5 mL
microcentrifuge tubes. Samples were stored in a refrigerator at 2-8°C. Prior to
use, samples were permitted to warm to room temperature and vortexed to
ensure homogeneity.
Saliva Swab Sample Preparation
Swab samples were prepared by pipetting 50 μL of saliva onto a clean tip of swab
cutting in a 1.5 mL microcentrifuge tube and allowed to dry. For each individual
donor, six swab samples of this type were prepared. The swab samples were
extracted with Chelex® and EZ1 methods. Both types of extractions were
performed in triplicate.
Chelex® Extraction – Revised Procedure
For each donor had two types of samples:
1. Saliva swab sample (see above for sample preparation) 2. 50 μL of saliva
EZ1 Extraction
BPD DNA Manual - DNA Extraction from Whole Blood/Bloodstains/Saliva/Epithelial Cells Protocol
For each donor, had two types of samples:
1. Saliva swab sample (see above for sample preparation)

27
• Use 1 hour incubation at 56°C (BPD normal protocol for oral swabs is 1 hour incubation)
• Trace protocol • 50 μL elution volume • TE for elution buffer •
2. 50 μL of saliva • Use liquid blood procedure • Trace protocol • 50 μL elution volume • TE for elution buffer
For each individual donor, the quantification results for the saliva swabs extracted with
the two different methods were compared with one another. The swab free saliva extracts
from the two different methods were also compared with one another. Additionally, for each
extraction method, the results from the liquid saliva and saliva stained swabs were compared.
Each sample was evaluated for fullness of profile, peak heights and artifacts (including stutter,
minus A, and pull up, etc.) and ability to meet BPD’s heterozygote peak height ratio of 60%. The
profiles obtained from the different amplification targets were compared as a function of the
sample type and extraction method. These comparisons were used to determine whether the
amplification issues that have been observed are a result of swab material, the Chelex® resin,
Quantifiler® Duo DNA Quantification Kit or Identifiler® Plus Amplification Kit or some
combination of these factors.
3.5 - Post-Extraction Interference Study – Saliva and Blood
The data found in the saliva and blood post-extraction interference studies were used for an
additional comparison of saliva versus blood for each sample types. A total of four comparisons

28
were made to determine if the interference issue of possible underestimation of quantification
values could be attributed to the samples being saliva based.
These comparisons were saliva vs. blood for:
• EZ1 extracted liquid samples • Chelex® extracted liquid samples • EZ1 extracted stained swab samples • Chelex® extracted stained swab samples
Comparisons were based solely on profile evaluation comparisons and peak height
comparisons. Quantification data was not compared as similar DNA containing quantities of
blood and saliva based samples were not used.
Results and Discussion
Procedure Development
1.1 - Concordance of Chelex® Extracted Known Bloods and Oral Swabs; Tip of Swab Cutting
Evaluation Study

29
As expected, quantification results (shown in figure 1 ) were obtained for all bloodstain samples
and all males and female assignments were made correctly. The reagent blanks also performed
as expected with no DNA detected in either one. Quantification results were also obtained for
all of the oral swabs with males and females correctly assigned. The IPC CT values indicated a
lack of inhibition.
All extracts were amplified with DNA targets of 0.5 ng and produced full, single-source profiles.
All controls performed as expected.
Pull up was observed in the KRK and JKL oral swabs extract profiles but the sources of all
pull up peaks were located. No pull up was observed in the DH sample.
The KRK oral swab extract was overblown and also had minus A artifacts and an artifact
of unknown origin. This sample was re-amplified and ran with DNA targets of 0.125 ng, 0.25 ng
and 0.5 ng. The profiles from the 0.125 ng and 0.25 ng amplification targets contained no
artifacts. The 0.5 ng target profile contained a shoulder peak.
Each profile was evaluated to determine whether each locus meets BPD’s inter-locus
peak height ratio standard of 60%. Imbalance was seen in one sample. All others met the 60%
heterozygote peak height ratio. No evidence of degradation or inhibition was seen in any of the
profiles.
For each donor, the profiles from the blood and oral swabs were compared and found
to be concordant. All profiles were also concordant with the BPD DNA lab’s database of
genotypes.
The quantification results indicate that the Chelex® extraction method will extract DNA from
oral swabs without any indication of inhibition. The amount of DNA extracted from all oral

30
swabs was sufficient for continuing DNA analysis, indicating that the tip of the swab may be an
adequate cutting size.
The quality of the profiles and the concordance of individual donor profiles indicate that
the Chelex® extraction protocol is capable of extracting DNA from oral swabs. Furthermore, this
study indicates that using tip of the swab cuttings and leaving the swab material in the extract
can be considered for the protocol.
However, the profiles produced by the 0.5 ng amplification exhibited very high peaks
heights and artifacts characteristic of larger DNA amplification targets. While these factors did
not prevent the profile from being typed, they did indicate that targets less than 0.5 ng of DNA
should be studied.
1.2 - Sample Cutting Type Study
31
The male quantification results showed the swabs performed as expected with respect
to male and female assignments. The reagents blanks also performed as expected, detecting no
DNA.
The human quantification results (figure 2) showed DNA was extracted from all swabs
cutting types. A sufficient quantity of DNA for later analysis was obtained from all samples.
There was no consistent trend with respect to how the different types of swab cuttings
performed in terms of which cutting produced the greatest amount of DNA. However, the tip
of swab cutting did not give the lowest quantification value for any of the individuals.
All samples were amplified with DNA targets of 0.5 ng and produced full, single-source
profiles. All controls performed as expected.
Pull up was observed in several profiles. The AEL tip of swab and ¼ swab cuttings and
the RA ½ swab cutting contained pull up artifacts that could be attributed to other peaks. The
remainder of the profiles contained no artifacts.
The AEL ¼ swab cutting also contained a minus A artifact and elevated peaks (>6,500
rfu). This sample was re-amplified targeting lower amounts: 0.125 ng, 0.25 ng and 0.5 ng. The
re-amplified and typed samples contained no artifacts. All of these profiles were full and
concordant with the previously obtained profile.
Each profile was evaluated for heterozygote peak height balance. BPD’s standard for
peak height balance is 60%. Peak height imbalance was seen in the D2S1338 locus in the JKL ¼
swab cutting profile and the RA tip of swab cutting profile. The remainder of the loci met BPD
PHR of 60%. No evidence of degradation or inhibition was seen in any of the profiles.

32
For each donor, the profiles obtained from the different swab cutting types were concordant.
For donors of previously known profile (JKL and CEK), the profiles were concordant with known
profiles.
The quantification values indicated that any of the evaluated cutting sizes will
adequately provide enough DNA for analysis.
The qualities of the profiles indicate that all of cutting types can be used for oral swab
extraction. However, due to the large sample size of the ¼ and ½ swab cuttings, the extraction
process is more difficult for these sample cuttings. Consistently cutting a ¼ swab is difficult due
to the tendency of the swabs to become loose with multiple cuts and variability of swabs.
Volume adjustments and pipetting with the larger amounts of swab material are also more
cumbersome.
Additionally, using a smaller cutting conserves more of the sample for any potential
later testing. The results of this study indicate that the tip of swab cutting size should be used in
the Chelex® extraction protocol for oral swabs due to their ability to produce a full, good quality
profiles and relative ease of use in the extraction process.
This study also indicates that Chelex® extraction protocol may be used for oral swabs
that have been in storage for a period of 0-5 years.
1.3 - Room Temperature Incubation Length Study

33
The human quantification results (figure 3) showed the swabs performed as expected
with respect to male and female assignments. The reagents blanks also performed as expected,
detecting no DNA.
The IPC CT values indicated that inhibition did not occur.
All samples were amplified with DNA targets of 0.25 ng and 0.50 ng. All controls
performed as expected.
Full, single-source profiles were obtained for all samples at both target amounts. Table 3
compares and summarizes the difference seen between the DNA profiles produced by the 15
and 30 minute incubations at 0.25 ng and 0.5 ng targets. The profiles were evaluated for ability
to meet BPD’s 60% heterozygote peak height ratio, presence of pull up, stutter and any other
artifacts.

34
Table 3: Comparison of DNA profiles for 15 and 30 minute room temperature incubation at 0.25 ng and 0.5 ng amplification targets.
Incubation Length
Amplification Target
Percent with Full Profile
Percent of Profiles with
Pull Up
Percent of Profiles with Heterozygote
PHR Imbalance
Percent of Profiles with
Stutter
Percent of Profiles with Additional
Artifacts
15 Minutes 0.5 ng 100 33 33 33 0
0.25 ng 100 0 33 0 0
30 Minutes 0.5 ng 100 33 0 33 33
0.25 ng 100 0 33 33 0
No evidence of degradation or inhibition was seen in any of the profiles. All occurrences
of pull up could be attributed to other peaks. The additional artifact seen in the 0.25 ng target
for the 30 minute incubation was a shoulder on X at Amelogenin.
These profiles were compared to previously obtained profiles for the individual donors
and all were found to be concordant at all loci.
The quantification results showed DNA was extracted with 15 and 30 minute room
temperature incubations. Based on the ranges of DNA extracted with the two incubation times,
the 15 minute extraction performed better having a higher minimum and maximum amount of
DNA. However, this needs to be confirmed by additional samples. The results indicated that
both the 15 and 30 minute room temperature incubations extract a sufficient amount of DNA
to continue with DNA analysis.
The profiles obtained from both incubation lengths were all full, single-source profiles.
Both incubation lengths at both target amounts produced profiles with artifacts however the 15
minute incubation with 0.25 ng target had the fewest. The results of this study indicate that a
15 minute incubation should be used over a 30 minute incubation because it produces good
quality profiles and decreases extraction time.

35
This study also indicates that a 0.25 ng amplification target may produce profiles with
fewer artifacts compared to 0.5 ng. This will be further evaluated in future studies by
continuing amplification at 0.25 and 0.5 ng targets.
1.4 - 56°C Incubation Length Study
The quantification results, shown in table 4, showed the swabs performed as expected
with respect to male and female assignments. The reagents blanks also performed as expected,
detecting no DNA.
Table 4: Human Quantification Results for 15 Minute Incubation at 56°C
Human Quantification Results (ng/µL)
JKL 0.460 CEK 0.903 EAZ 0.162 KS 1.72 LM 3.25 RA 0.259 LP 0.91
EWP 2.26 Reagent Blank None Detected
Reagent Blank 2 None Detected
The IPC CT values indicated that inhibition did not occur.
All samples were amplified with DNA targets of 0.25 ng and 0.50 ng. All controls performed as
expected.
Full, single-source profiles were obtained for all samples at both target amounts. Table 5
summarizes the evaluation of the DNA profiles. The profiles were evaluated for ability to meet
BPD’s 60% heterozygote peak height ratio, presence of pull up, stutter and any other artifacts.

36
Table 5: Comparison of DNA profiles for 15 minute incubation at 56°C with 0.25 ng and 0.5 ng amplification targets.
Amplification Target
Percent with Full Profile
Percent of Profiles
with Pull Up
Percent of Profiles with Heterozygote
PHR Imbalance
Percent of Profiles with
Stutter
Percent of Profiles with Additional
Artifacts
0.5 ng 100 50 0 0 0 0.25 ng 100 0 50 0 0
No evidence of degradation or inhibition was seen in any of the profiles. All occurrences
of pull up could be attributed to known sources.
For the individuals in the BPD laboratory DNA database, all profiles were found to be
concordant.
The quantification results indicated that the 15 minute incubation at 56°C was sufficient
to extract enough DNA for further analysis.
The DNA profiles were all full, single-source profiles indicating that the 15 minute incubation
produces satisfactory results and may be considered for the Chelex® extraction protocol.
1.5 - Boiling Method Study
The human quantification results showed the swabs performed as expected with
respect to male and female assignments. The reagents blanks also performed as expected,
detecting no DNA.
The IPC CT values indicated that inhibition did not occur.
The human quantification results (shown in figure 4) indicate that both the boiling water bath
and dry bath set at 100°C will extract DNA from oral swabs.

37
All samples were amplified with DNA targets of 0.25 ng and 0.50 ng. One sample had a partial
LIZ failure and the typing results were not used in this study. The sample should have been re-
injected but the two week time limit had already been exceeded. Controls performed as
expected.
With the exception of the sample with the partial LIZ failure, full, single-source profiles were
obtained for all samples. Table 6 summarizes the evaluation of the DNA profiles. The profiles
were evaluated for ability to meet BPD’s 60% heterozygote peak height ratio, presence of pull
up, stutter and any other artifacts.
Table 6: Comparison of DNA profiles for boiling method at 0.25 ng and 0.5 ng amplification targets. (Note: Could not amplify one sample at 0.5 ng due to limited sample and had a failed typing with one 0.25 ng sample)
Boiling Method
Amplification Target
Percent with Full Profile
Percent of Profiles with
Pull Up
Percent of Profiles with Heterozygote
PHR Imbalance
Percent of Profiles with
Stutter
Percent of Profiles with Additional
Artifacts
Water Bath 0.5 ng 100 50 25 0 0
0.25 ng 100 75 25 50 0
Dry Bath 0.5 ng 100 100 0 0 0
0.25 ng 100 20 0 0 0
No evidence of degradation or inhibition was seen in any of the profiles. All occurrences of pull
up could be attributed to known sources.

38
The control profile was found to be concordant with the profile in the BPD laboratory DNA
profile database.
Comparison of the quantification values from the boiling methods, shown in Figure 4, did not
indicate that one boiling method outperformed the other. Profiles obtained from the dry bath
method contained fewer heterozygote PHR imbalances in both targets than the boiling water
bath. The dry bath produced relatively more pull up than the water bath at 0.5 ng but fewer at
the 0.25 ng target. These results indicate that the dry bath boiling method produces
satisfactory results and may be considered for the Chelex® extraction protocol over the boiling
water bath.
Validation Studies
2.1 - Concordance Study
During the course of this project, all samples with known profiles were compared to
their known profiles. All profiles were found to be concordant.
2.2 - Contamination Study
The quantification results showed that all reagent blanks performed as expected with human
and male quantification amounts reported as “none detected”.
One reagent blank in each extraction was carried through amplification with the samples in the
extraction set. Each electropherogram was analyzed to determine whether there were any
peaks observed above or below analytical threshold.
In the BPD DNA Lab Manual v.2013.0, evaluation of a reagent blank is specified as follows:
Reagent Blanks must give expected results to call case results valid. Reagent Blanks
should not contain reproducible peaks consistent with a DNA profile. If there are peaks

39
present in the Reagent Blank that are consistent with a DNA profile (multiple peaks in a
color, peaks detected in multiple colors), regardless if the peaks cross the threshold of
detection or not, the issue will be addressed by the analyst. Peaks consistent with
amplified DNA that are greater than 30RFU should not be present in the analytical size
range. If more than one peak greater than 30RFU is detected in a color, and/or one peak
greater than 30 RFU is detected in three or more colors, the sample set should be re-
extracted. If the possible source of the DNA profile can be determined, appropriate
steps to address the manner in which the DNA was most likely deposited into the
Reagent Blank will be corrected. The sample set will be re-extracted.
To meet BPD’s requirements for evaluating reagent blanks, it was noted if there were any peaks
greater than or equal to 30 RFU. Additionally, all peaks (including those less than 30 RFU) with
their location and approximate peak height were noted. Table 7 summarizes the
electropherogram results seen with the amplified reagent blanks.
Table 7: Summary of examination of reagent blanks from Chelex® extraction sets for contamination
Study Description Extraction Set
ID Sample
ID Peaks at or above 30
RFU (Y/N) Peaks
Observed 7 Concordance of oral swab and blood 061113CEK RB1 N N/A 7 Concordance of oral swab and blood 061313CEK2 G N N/A 8 Day 0 - Amp 1 061313CEK RB1 N N/A 8 Day 0 - Amp 2 061313CEK RB1 N N/A 8 Day 0 - Amp 3 061313CEK RB1 N N/A 8 Day 0 - Amp 4 061313CEK RB1 N N/A 8 Day 15 062713CEK E N N/A 8 Day 34 071613CEK E Y D5 (~40 RFU) 8 Day 50 080113CEK1 E N N/A
8A Day 0 and Day 15 071213CEK I N N/A 8A Day 34 071613CEK1 E N N/A 8A Day 50 080113CEK1 E N N/A 9A Sample Size - Group 1 061313CEK1 G N N/A 9A Sample Size - Group 2 061313CEK2 G N N/A

40
9B Room Temp Incubation 062013CEK G N N/A 9B Room Temp Incubation 062013CEK I N N/A 9C 56 Incubation 062413CEK I N D13 (~25 RFU) 9D Boiling Water Bath 070313CEK F N N/A 9D Dry Bath 070313CEK1 F N N/A 13 Blood Swab - Chelex® 071813CEK M N D2 (~15 RFU) 13 Whole Blood - Chelex® 072313CEK M N N/A
13A Saliva Swab - Chelex® 071113CEK M N D7(~20 RFU) 13A Liquid Saliva - Chelex® 071713CEK M N N/A
All reagent blanks met BPD’s requirements for uncontaminated reagent blanks. The
quantification and typing results indicate that all reagent blanks used in Chelex® resin
extractions performed as expected and indicate that the Chelex® extraction protocol does not
pose a risk of causing contamination.
2.3 - Stability Study – Original Procedure – Substrate Variability
The male quantification results showed the swabs performed as expected with respect
to male and female assignments. The reagents blanks also performed as expected, detecting no
DNA.
The IPC CT values indicated that inhibition did not occur.
The human quantification results (shown in Figure 5) indicate that this protocol can
extract DNA from oral swabs that have been incubated for 0 – 50 days.

41
All samples except for the Day 0 swabs were amplified with DNA targets of 0.25 ng and 0.50 ng.
The Day 0 swab was only amplified with a 0.50 target because at time of amplification,
Amplification Target Study had not been initiated. All controls performed as expected.
Full, single-source profiles were obtained for all samples at both target amounts. Figures 6 and
7 summarize the evaluations of the DNA profiles for the 0.5 ng and 0.25 ng targets,
respectively. The profiles were evaluated for ability to meet BPD’s 60% heterozygote peak
height ratio, presence of pull up, stutter and any other artifacts.

42
No evidence of degradation or inhibition was seen in any of the profiles. All occurrences
of pull up could be attributed to other peaks.
For each individual, the profiles from the multiple amplifications were compared and found to be concordant.

43
To compare the quality of the DNA obtained from the artificially aged swabs, the peak
heights at each locus were averaged for the four donors. The average peak heights were
plotted as a function of their loci with error bars of standard deviation. The plots for each of the
swabs for 0.25 and 0.5 ng targets are included in Figures 8 and 9.
The general trend in relative peak heights of all loci remains fairly consistent in the
profiles obtained from the swabs that were incubated for different lengths of times. If DNA was
becoming degraded or inhibited as a result of the stress applied to the swabs one would expect

44
to see drastic changes in the shape of the plot for swabs that were incubated for longer periods
of time. The error bars account variation in peak heights at each locus due to biological
variation in the DNA of different individuals as well as experimental variation due to factors
such as instrument performance. Better overlap of the trendlines within the range of the error
bars indicate comparable peak heights, which is consistent with the expected behavior of DNA
that is not inhibited nor degraded.
Comparison of the quantification values from the swabs that were incubated for
different lengths of times indicate that a longer incubation time does not affect the quantity of
DNA obtained from the swab material.
The DNA profiles were all full, single-source profiles. Comparison of the DNA profiles
indicated that subjecting the swab material to a stressing environment of 37°C did not
significantly affect the quality of the DNA obtained from swab.
These results indicate that the Chelex® extraction protocol can extract good quality DNA from
aged swabs.
2.4 - Stability Study – Extract Variability
The male quantification results showed the swab extracts performed as expected with
respect to male and female assignments. The reagents blanks also performed as expected,
detecting no DNA.
The IPC CT values indicated that inhibition did not occur.
The human quantification results (depicted in Figure 10) indicate that DNA was detected
in the extract each time it was amplified over the time period it was examined.

45
With the exception of the first amplification, which refers to the original quantification
and amplification, each amplification was performed with DNA targets of 0.25 ng and 0.50 ng.
The initial amplification was only performed with a 0.50 ng target because at the time, the
Amplification Target Study had not been initiated. All controls performed as expected.
Full, single-source profiles were obtained for all samples at both target amounts (Note:
The first amplification for the RU extract had to be redone two days after the initial
amplification due to a failed amplification). Figures 11 and 12 summarize the evaluation of the
DNA profiles at 0.5 ng and 0.25 ng targets. The profiles were evaluated for ability to meet BPD’s
60% heterozygote peak height ratio, presence of pull up, stutter and any other artifacts.

46
No evidence of degradation or inhibition was seen in any of the profiles. All occurrences of pull up could be attributed to other peaks. The additional artifact observed in the 0.5 ng target sample set of the second amplification was an overblown profile.
To compare the quality of the DNA in the extracts over time, the peak heights at each
locus were averaged for the four donors’ extracts for each amplification. The average peak
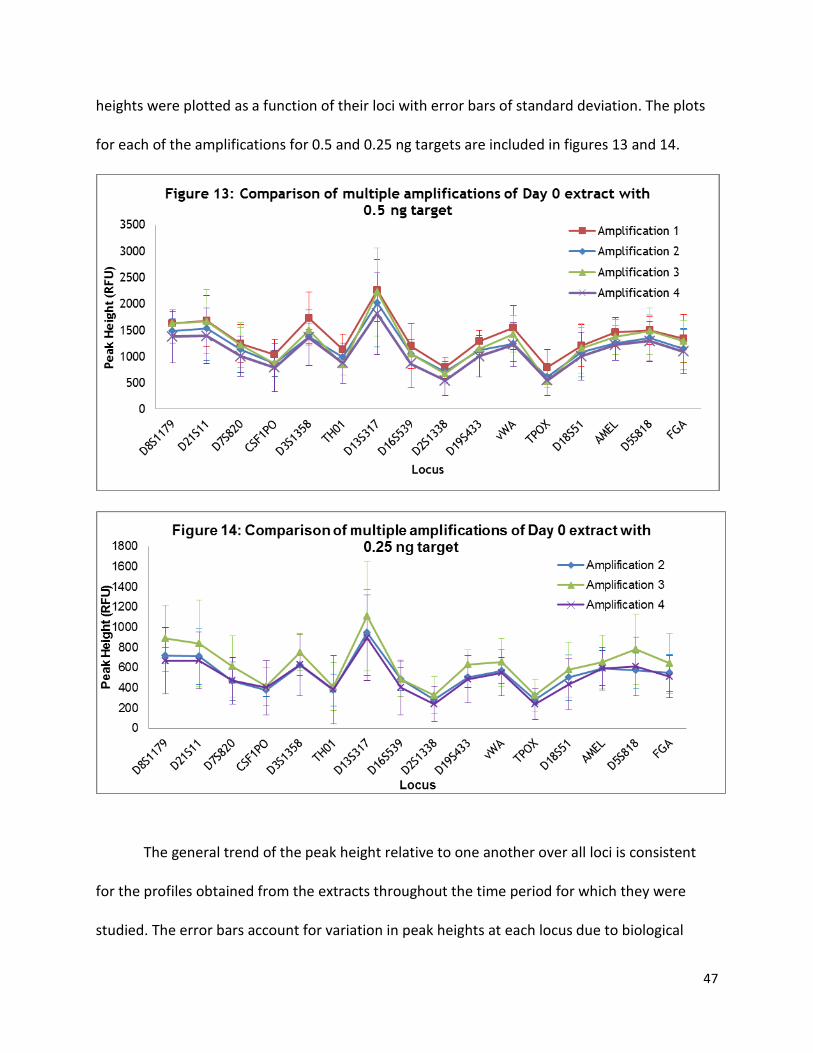
47
heights were plotted as a function of their loci with error bars of standard deviation. The plots
for each of the amplifications for 0.5 and 0.25 ng targets are included in figures 13 and 14.
The general trend of the peak height relative to one another over all loci is consistent
for the profiles obtained from the extracts throughout the time period for which they were
studied. The error bars account for variation in peak heights at each locus due to biological
48
variation in the DNA of different individuals as well as experimental variation due to factors
such as instrument performance. Better overlap of the trendlines within the range of the error
bars indicate comparable peak heights, which is consistent with the expected behavior of DNA
that is not inhibited nor degraded.
Comparison of the quantification values from the extracts stored measured multiple
times over the length of approximately 50 days indicates that DNA can be consistently detected
up to and including 50 days after the extract is obtained.
The DNA profiles were all full, single-source profiles. Comparison of the DNA profiles
indicated that storing the extracts in a refrigerator set at 2 - 8°C does not affect the quality of
the DNA.
These results indicate that the quantity and quality of DNA in an extract obtained from
an oral swab by the Chelex® extraction protocol is not affected by storage with the swab
substrate and Chelex® resin in a refrigerator at 2-8°C over a period of approximately 50 days.
Comparison of the DNA profiles produced by the 0.5 ng vs. 0.25 ng targets will be performed in
the Amplification Target Study.
Per a conversation with a BioRad representative, the pH of a Chelex® solution decreases
over time and the ability of the Chelex® solution to chelate ions decreases as a function of it pH.
It is BioRad’s recommendation that a Chelex® solution not be used if the pH drops to 9.0. At
the time of the initial extraction, the pH of the Chelex® solution used to extract the DNA from
the oral swab was approximately 9.43 or greater (5% Chelex® Solution Stability Study). Further
studies could be performed to determine whether the quantity and quality of the DNA in the
extract is maintained after the pH drops below 9.0. Additional factors which could affect the

49
stability of the extract are the effect of refrigeration or freezing the Chelex® containing DNA
extract.
2.5 - Stability Study – Revised Procedure – Substrate Variability
The male quantification results showed the swabs performed as expected with respect
to male and female assignments. The reagents blanks also performed as expected, detecting no
DNA.
The IPC CT values indicated that inhibition did not occur.
The human quantification results (shown in Figure 15) indicate that this protocol can
extract DNA from oral swabs that have been incubated for 0 – 50 days.
All samples were amplified with DNA targets of 0.25 ng and 0.50 ng. All controls
performed as expected.
Full, single-source profiles were obtained for all samples at both target amounts. Figures
16 and 17 summarize the evaluation of the DNA profiles for the 0.5 ng and 0.25 ng

50
amplification targets, respectively. The profiles were evaluated for ability to meet BPD’s 60%
heterozygote peak height ratio, presence of pull up, stutter and any other artifacts.

51
No evidence of degradation or inhibition was seen in any of the profiles. All occurrences
of pull up could be attributed to other peaks.
For each individual, the profiles from the multiple amplifications were compared and
found to be concordant.
To compare the quality of the DNA obtained from the artificially aged swabs, the peak
heights at each locus were averaged for the four donors. The average peak heights were
plotted as a function of their loci with error bars of standard deviation. The plots for each of the
swabs for 0.25 and 0.5 ng targets are included in Figures 18 and 19.

52
The peak height trend lines across the loci indicate that the swabs that spent more time
in the incubator (i.e. Day 34 and Day 50 swabs) showed an increased downward slope trend per
dye channel, which may be an indicator of degradation. The error bars account variation in
peak heights at each locus due to biological variation in the DNA of different individuals as well
as experimental variation due to factors such as instrument performance. Better overlap of the
trend lines within the range of the error bars indicate comparable peak heights, which is
consistent with the expected behavior of DNA that is not inhibited nor degraded.
Comparison of the quantification values from the swabs that were incubated for
different lengths of times indicate that a longer incubation time does not affect the quantity of
DNA obtained from the swab material.
The DNA profiles were all full, single-source profiles. Comparison of the DNA profiles
indicated that subjecting the swab material to a stressing environment of 37°C may cause slight
degradation of the DNA. However, this protocol is devised for reference oral swabs rather than
53
casework samples and given that the samples still give full, single-source profiles this may be
considered acceptable.
These results indicate that the revised Chelex® extraction protocol can extract good
quality DNA from aged swabs for use as reference samples.
Additional Studies
3.1 - Amplification Target Study
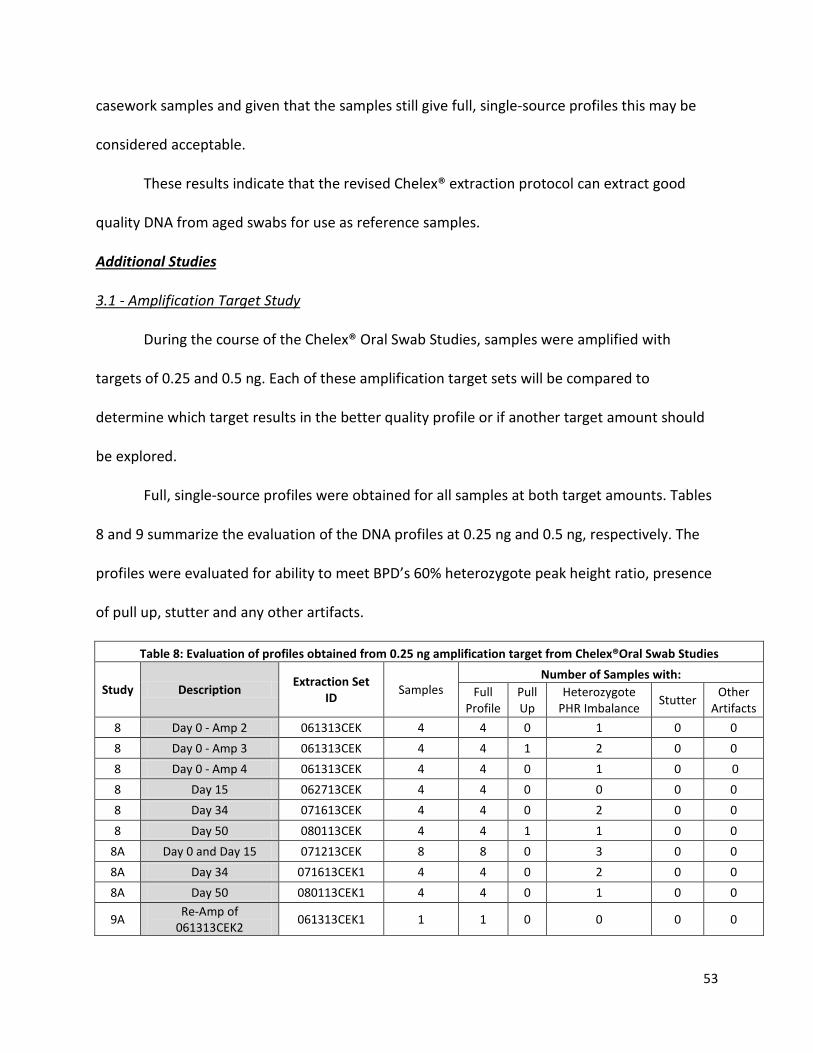
During the course of the Chelex® Oral Swab Studies, samples were amplified with
targets of 0.25 and 0.5 ng. Each of these amplification target sets will be compared to
determine which target results in the better quality profile or if another target amount should
be explored.
Full, single-source profiles were obtained for all samples at both target amounts. Tables
8 and 9 summarize the evaluation of the DNA profiles at 0.25 ng and 0.5 ng, respectively. The
profiles were evaluated for ability to meet BPD’s 60% heterozygote peak height ratio, presence
of pull up, stutter and any other artifacts.
Table 8: Evaluation of profiles obtained from 0.25 ng amplification target from Chelex®Oral Swab Studies
Study Description Extraction Set ID Samples
Number of Samples with: Full
Profile Pull Up
Heterozygote PHR Imbalance Stutter Other
Artifacts 8 Day 0 - Amp 2 061313CEK 4 4 0 1 0 0 8 Day 0 - Amp 3 061313CEK 4 4 1 2 0 0 8 Day 0 - Amp 4 061313CEK 4 4 0 1 0 0 8 Day 15 062713CEK 4 4 0 0 0 0 8 Day 34 071613CEK 4 4 0 2 0 0 8 Day 50 080113CEK 4 4 1 1 0 0
8A Day 0 and Day 15 071213CEK 8 8 0 3 0 0 8A Day 34 071613CEK1 4 4 0 2 0 0 8A Day 50 080113CEK1 4 4 0 1 0 0
9A Re-Amp of 061313CEK2 061313CEK1 1 1 0 0 0 0

54
9B Room Temp Incubation - 15 min 062013CEK 3 3 0 1 0 0
9B Room Temp Incubation - 30 min 062013CEK 3 3 0 1 1 0
9C 56 Incubation 062413CEK 8 8 0 4 0 0 9D Boiling Water Bath 070313CEK 4 4 2 2 1 0 9D Dry Bath 070313CEK1 4 4 0 0 0 0
Table 9: Evaluation of profiles obtained from 0.5 ng amplification target from Chelex®Oral Swab Studies
Study Description Extraction Set ID Samples
Number of Samples with: Full
Profile Pull Up
Heterozygote PHR Imbalance Stutter Other
Artifacts 8 Day 0 - Amp 2 061313CEK 4 4 2 0 0 0 8 Day 0 - Amp 3 061313CEK 4 4 2 0 0 1 8 Day 0 - Amp 4 061313CEK 4 4 0 0 0 0 8 Day 15 062713CEK 4 4 1 0 2 0 8 Day 34 071613CEK 4 4 1 0 0 0 8 Day 50 080113CEK 4 4 1 0 0 0
8A Day 0 and Day 15 071213CEK 8 8 0 0 0 0 8A Day 34 071613CEK1 4 4 0 0 0 0 8A Day 50 080113CEK1 4 4 0 0 0 0
9A Re-Amp of 061313CEK2 061313CEK1 1 1 0 0 0 0
9B Room Temp Incubation - 15 min 062013CEK 3 3 1 1 1 0
9B Room Temp Incubation - 30 min 062013CEK 3 3 1 0 1 1
9C 56 Incubation 062413CEK 8 8 4 0 0 0 9D Boiling Water Bath 070313CEK 4 4 2 1 0 0 9D Dry Bath 070313CEK1 4 4 4 0 0 0
The other artifacts seen in the 0.5 ng target samples were an overblown profile and minus A,
respectively.
Comparison of the profile evaluations is shown in Figure 20 including the variables
shown in tables 8 and 9 as well as the percentage of profiles with alleles that fell below
stochastic threshold.

55
This figure indicates that the 0.5 ng and 0.25 ng target are similarly matched expect for
with respect to pull up and heterozygote PHR imbalance. 0.5 ng targets have significantly more
pull up while 0.25 ng targets have significantly more heterozygote PHR imbalance and increased
percentage of alleles that fall below stochastic threshold.
Figure 21 is a comparison of the averaged peak heights of all of the samples that were
amplified at both target amounts with error bars of standard deviation. Table 10 summarizes
the average and ranges of the peak heights at both target amounts.

56
Table 10:Statistic summary Target Minimum Maximum Mean 0.25 ng 313.8 827.8 562.8 0.5 ng 679.0 1659.6 1164.0
This plot indicates that the 0.25 ng peak heights are more balanced than those for the
0.5 ng targets. Additionally, this data indicates that both target amounts should on average
produce profiles above stochastic threshold.
While both the 0.25 ng and 0.5 ng targets will produce full-single source profiles, there
is a tradeoff between increased number of pull up artifacts or increased heterozygote peak
height ratio balance.
In terms of amplification across the loci, the 0.25 ng target seems to produce more
equally balanced peak heights.

57
Given these results and experience with the profiles seen in these studies, it is the
recommendation of this study to use a 0.25 ng target or consider a target amount between
0.25 ng and 0.5 ng.
3.2 - Stability of 5% Chelex® Solution Study
The purpose of this study is to evaluate the manner in which the pH of a 5% Chelex®
solution changes over time. This study has three subsets.
1 - Hourly Evaluation of a Freshly Prepared 5% Chelex® Solution
Some agencies recommend that a 5% Chelex® solution should be used within hours of
preparation. A 5% Chelex® solution was prepared and the pH monitored hourly through the
course of the day.
The results of the monitoring the pH of a solution in the hours following preparation are
depicted in Figure 22.
2 - Daily Evaluation of a Freshly Prepared 5% Chelex® Solution
The behavior of a freshly prepared 5% Chelex® solution was evaluated by measuring the pH
daily.

58
The results of monitoring the pH of a solution in the days following preparation are depicted in
Figure 23.
3 - Daily Evaluation of a Previously Prepared 5% Chelex® Solution
The behavior of a previously prepared 5% Chelex® solution was evaluated by measuring
the pH daily. This solution was prepared on 11/05/12. Measurements of the pH were
conducted between the dates of 07/08/13 through 08/09/13. The results of monitoring the pH
of a previously prepared solution are depicted in Figure 24.

59
The linear function for each data set is included in each figure. Comparison of the slopes
of the plots indicates that the rate of decline in pH is not constant over the lifetime of the 5%
Chelex® Solution rather the rate of decline decreases as the time since preparation increases.
The results of monitoring the behavior of 5% Chelex® solutions indicate that the decline in pH
of the solution is not a linear function over the entire lifetime of the solution. Therefore, no
conclusions will be made as to the definite length of time needed for a 5% Chelex® solution to
reach a pH of 9.0 when it would be considered no longer viable.
However, the results of this study do indicate that a 5% Chelex® solution will remain
viable for a period of time of at least 272 days.
To ensure that there is no risk of using a 5% Chelex® solution after it is no longer
effective as defined by the pH 9.0 threshold defined by BioRad, it is the recommendation of this
study to prepare the solution more frequently than once a year and implement a protocol for

60
regularly monitoring the pH of the solution. For example, preparing the solution every 6
months and monitoring the pH weekly.
3.3 - Post-Extraction Interference Study – Blood
The sex assignments of the blood donors were unknown prior to this study because the
blood was obtained from sexual assault kits after they were used and ready for discard by
serology. However, the quantification results, with one exception, indicated that all of the
donors were female with no male DNA detected. The exception was a male quantification value
of 0.0045 ng/µL in one of the set of triplicate bloodstained swabs extracted with EZ1 and the
profile obtained for that sample has a genotype of X,X at Amelogenin with no indication that Y
was present. The reagent blanks performed as expected, detecting no DNA.
The IPC CT values indicated that inhibition did not occur.
The quantification results (displayed in figure 25) indicate that both extraction methods,
Chelex® and EZ1 Advanced, can extract DNA from bloodstained swabs and whole blood. Note:
in the figures for this study, blood kit numbers 39635, 41850, 44242 and 44689 will be
designated as blood kits 1, 2, 3 and 4, respectively.

61
All samples were amplified with DNA targets of 0.25 ng and 0.50 ng. All controls
performed as expected.
Single-source profiles were obtained for all samples at both target amounts. The profiles
were evaluated for fullness of profile (alleles reported) ability to meet BPD’s 60% heterozygote
peak height ratio, presence of pull up, stutter and any other artifacts.
Four sets of comparisons using the quantification and typing results will be performed in
an attempt to pinpoint the source of disconnect between these two steps in the DNA workflow
seen in previous studies with DNA extracted from oral swabs with Chelex®. These comparisons
will consist of: bloodstained swabs extracted with Chelex® vs. EZ1 Advanced, whole blood
extracted with Chelex® vs. EZ1 Advanced, both sample types extracted with Chelex®, and both
sample types extracted with EZ1 Advanced
3.3a - Bloodstained Swabs – Chelex® vs. EZ1 Advanced Comparison
The quantification results for the bloodstained swabs extracted with Chelex® vs EZ1
Advanced are shown in Figure 26. The quantification system reports relatively higher
quantification values for the EZ1 extracts compared to the Chelex® extracts from bloodstained
swabs. For this set of data, on average, the ratio of the EZ1 Advanced:Chelex® quantification
results were approximately 3:1 ng/µL with a relative standard deviation (RSD) of 17%. Increased
relative standard deviation indicates decreased consistency between kit average quantification
values.

62
Figures 27 and 28 show the profile evaluation comparison of these factors for
bloodstained swabs extracted with Chelex® vs. EZ1 Advanced with 0.5 ng and 0.25 ng,
respectively. Bloodstained swabs, with decrease in target amount, see expected decrease in
pull up and stutter with both extractions. Both extractions behave as expected and there does
not appear to be an indication of a relative underestimation of quantification values.

63
To compare the DNA profiles, the peak heights at each locus were averaged for the four
donors. The average peak heights were plotted as a function of their loci with error bars of
standard deviation. The plots for each of the swabs for 0.25 and 0.5 ng targets are included in
Figures 29 and 30.
Comparison of the peak height trends from the bloodstained swab swabs extracted with
EZ1 Advanced vs. Chelex®, indicates that there is fairly equal amplification across the loci. There
are consistently higher peak heights from the Chelex® extraction than from the EZ1 Advanced
extraction indicating a possible relative underestimation of the Chelex® bloodstain swab

64
quantification values. Decreasing the target amount, doesn't seem to change the trends seen at
the larger target amount.
In summary, there does appear to be indication of relative underestimation of
quantification values obtained from bloodstained swabs extracted with Chelex® as compared to
EZ1. The higher quantification value of the EZ1 Advanced extracts compared to the Chelex®
extracts may be due to more DNA extracted by the system rather than an issue with the
quantification system.
3.3b - Whole Blood – Chelex® vs. EZ1 Advanced Comparison
The quantification results for the whole blood samples extracted with Chelex® vs EZ1
Advanced are shown in figure 31. The quantification system reports relatively higher
quantification values for the EZ1 extracts compared to the Chelex® extracts from liquid blood.
For this set of data, on average, the ratio of the EZ1 Advanced:Chelex® quantification results
were approximately 5:1 ng/µL with an RSD of 21%.

65
Comparison of the profile evaluations at 0.5 ng and 0.25 ng targets, shown in Figures 32
and 33, do not give indication of underestimation of one extraction system compared to the
other. Decreasing from 0.5 ng to 0.25 ng target, changes in artifact formation are observed with
both extraction systems, which does not strongly support the underestimation of one
extraction system over the other.
Comparison of the peak height evaluations at 0.5 ng and 0.25 ng targets are shown in
Figures 34 and 35. There is very good agreement in peak height trends and peak heights for
both targets and there does not seem to be any favor in peak height for one extraction system
over another. This indicates similar amplifications of the extracts.

66
In summary, there does not appear to be an indication of relative underestimation of
quantification values obtained from whole blood extracted with either method. The higher
quantification value of the EZ1 Advanced extracts compared to the Chelex® extracts may be
due to more DNA extracted by the system rather than an issue with the quantification system.
3.3c - Chelex® Extraction – Bloodstained swabs vs. Whole Blood
The quantification values for the bloodstained swabs and whole blood samples
extracted with Chelex® are shown in figure 36. The quantification system reports similar

67
quantification values from the bloodstained swabs and liquid whole blood extracts obtained
using the Chelex® method. For this set of data, on average, the ratio of the bloodstained
swabs:whole blood quantification results were approximately 1:1 ng/µL with a RSD of 20%.
Comparison of the profile evaluations at 0.5 ng and 0.25ng targets, shown in figures 37
and 38, gives some indication of possible underestimation of the bloodstained swabs compared
to the whole blood for the Chelex® extracts. The bloodstained swab profiles have a greater
degree of artifacts associated with excessive DNA including pull up and stutter and do not see
as marked a decrease in these artifacts as decrease from 0.5 to 0.25 ng target. Additionally, do
not see as marked an increase in amount of heterozygote PHR imbalances as go to lower target
value.

68
Comparison of the peak height evaluations at 0.5 ng and 0.25 ng targets are shown in
Figures 39 and 40. The peak heights of the bloodstained swabs extracts do appear to be
consistently higher than those of the whole blood extracts. Indicating a possible relative
underestimation of the Chelex® extracted bloodstained swabs.

69
In summary, there does appear to be indication of relative underestimation of Chelex®
extracted bloodstained swabs compared to the liquid whole blood samples.
3.3d - EZ1 Advanced Extraction – Bloodstained swabs vs. Whole Blood
The quantification values for the bloodstained swabs and whole blood samples
extracted with EZ1 Advanced are shown in figure 41. The quantification system reports similar
to slightly higher quantification values for the whole blood compared to the bloodstained
swabs EZ1 extracts. For this set of data, on average, the ratio of the bloodstained swabs:whole
blood quantification results were approximately 0.5:1 ng/µL with a RSD of 19%.

70
Comparison of the profile evaluations at 0.5 ng and 0.25 ng targets, shown in Figures 42
and 43, is inconclusive. The whole blood samples produced more pull up which suggest
underestimation of whole blood samples compared to bloodstained swabs. However, a higher
percentage of full profiles was obtained from bloodstained swabs, which suggests
underestimation of bloodstained swabs.

71
Comparison of the peak height evaluations at 0.5 ng and 0.25 ng targets are shown in
figures 44 and 45. There does not appear to be a significant or consistent difference in peak
heights between the two sample types.

72
In summary, comparison of bloodstained swabs compared to whole blood EZ1 extracts
is inconclusive.
The quantification values indicate that generally for both bloodstained swabs and liquid
whole blood samples, Quantifiler® Duo reports larger amounts of DNA is extracted with EZ1
Advanced compared to Chelex®. The results also indicate that for both types of extractions,
Quantifiler® Duo reports similar to slightly higher amounts of DNA extracted from liquid whole
blood and bloodstained swabs.
Comparisons of the evaluations of the DNA profiles does not indicate underestimation
of the quantification values of Chelex® extracts compared to EZ1 Advanced extracts. There may
be underestimation of bloodstained swabs compared to liquid whole for Chelex® extractions.
Given that the same amplification targets were used for all samples, DNA profiles of the same
amplification target should, in theory, give similar peak height distribution across the loci
examined. Comparison of the peak height evaluations of the electropherograms indicated that
there may be some underestimation of Chelex® extracted bloodstained swabs.
3.4 - Post-Extraction Interference Studies – Saliva

73
The male quantification results showed the swabs performed as expected with respect
to male and female assignments. The reagents blanks also performed as expected, detecting no
DNA.
The IPC CT values indicated that inhibition did not occur.
The human quantification results (shown in Figure 46) indicate that both extraction
methods, Chelex® and EZ1 Advanced, can extract DNA from saliva stained swabs and liquid
saliva. Note: in figures, donors AIL, EF, EN and JDR will be designated as donors 1, 2, 3 and 4,
respectively.
All samples were amplified with DNA targets of 0.25 ng and 0.50 ng. All controls
associated with the samples used for comparisons performed as expected.
Four sets of comparisons using the quantification and typing results will be performed in
an attempt to pinpoint the source of disconnect between these two steps in the DNA workflow
as indicated in previous studies with DNA extracted from oral swabs with Chelex®. These

74
comparisons will consist of: saliva stained swabs extracted with Chelex® vs. EZ1 Advanced;
liquid saliva extracted with Chelex® vs. EZ1 Advanced; both sample types extracted with
Chelex®; and both sample types extracted with EZ1 Advanced.
3.4a - Saliva stained Swabs – Chelex® vs. EZ1 Advanced Comparison
The quantification results for the saliva stained swabs extracted with Chelex® vs. EZ1
Advanced are shown in Figure 47. For this set of data, on average, the ratio of the EZ1
Advanced: Chelex® quantification results were approximately 2:1 ng/µL with a relative standard
deviation (RSD) of 29%. Increased RSD indicates decreased consistency in quantification values
between different individuals’ samples.
All profiles were evaluated for fullness of profile and ability to meet BPD’s 60%
heterozygote peak height ratio, presence of pull up, stutter and any other artifacts. Fullness of
profile is based upon alleles reported by GeneMapper (peaks that meet the analytical
threshold) and not ability of peaks to meet stochastic threshold (155 RFU). Figures 48 and 49

75
show the comparison of these factors for saliva stained swabs extracted with Chelex® vs. EZ1
Advanced with 0.5 ng and 0.25 ng amplification targets, respectively.
As shown in above figures with saliva stained swabs, as the amplification target amount
is decreased for both extraction methods, an expected decrease in fullness of profile, pull up
and stutter and expected increase in PHR imbalance is seen. Chelex® extracts produced a higher
percentage of samples with pull up, stutter and additional artifacts, indicating a possible
relative underestimation of quantification values from the Chelex® extracts.
To compare the DNA profiles, the peak heights at each locus were averaged for the four
donors. The average peak heights were plotted as a function of their loci with error bars of
standard deviation. The plots for each of the swabs for 0.25 and 0.5 ng targets are included in
Figures 50 and 51.

76
There does not appear to be a significant or consistent difference in overall peak heights
between the two extraction methods. There is overlap within the error bars at a majority of the
loci, however the Chelex® profiles tend to have a consistently higher RFU than the EZ1
Advanced extracts in the red channel. The figures also indicate that decreasing the target
amount to 0.25 ng may cause notably more drop out with EZ1 Advanced extracts.

77
For the Chelex-extracted swabs, there is some evidence of a downward slope pattern
within the loci of the individual color channels. Relatively, the EZ1 Advanced extracted samples
have more equal peak height distribution especially at the lower target amount.
In summary, for saliva stained swabs, may have a slight relative underestimation of
Chelex® extracts compared to EZ1 Advanced extracts – indicated by evaluation but not by peak
heights.
3.4b - Liquid saliva – Chelex® vs. EZ1 Advanced Comparison
The quantification results for the liquid saliva samples extracted with Chelex® vs. EZ1
Advanced are shown in figure 52. The quantification system reports relatively higher
quantification values for the EZ1 extracts compared to the Chelex® extracts from liquid saliva.
For this set of data, on average, the ratio of the EZ1 Advanced: Chelex® quantification results
were approximately 3:1 ng/µL with a RSD of 60%.

78
All profiles were evaluated for fullness of profile and ability to meet BPD’s 60%
heterozygote peak height ratio, presence of pull up, stutter and any other artifacts. Fullness of
profile is based upon alleles reported by GeneMapper (peak that meet the analytical threshold)
and not ability of peaks to meet stochastic threshold (155 RFU). Figures 53 and 54 show the
comparison of these factors for liquid saliva samples extracted with Chelex® vs. EZ1 Advanced
with 0.5 ng and 0.25 ng, respectively.
Comparison of the profile evaluations for the liquid saliva samples at 0.5 ng and 0.25ng
targets, gives some indication of possible relative underestimation of the Chelex® extracts
compared to the EZ1 extracts. Decreasing the target amount, causes expected decrease in pull
up and increase in heterozygote PHR imbalance in both extraction types. However, only the EZ1
Advanced samples show indication of drop out.

79
Peak height comparisons for each of the extraction methods for the liquid saliva at 0.25
and 0.5 ng targets are included in figures 55 and 56.
Comparison of liquid saliva extracted with EZ1 Advanced vs. Chelex, shows the average
peak height at the majority of the loci to be similar, especially within overlap of the error bars.
In summary, liquid saliva may have a slight underestimation of Chelex® extraction
compared to EZ1 extraction as indicated by the profile evaluation for artifacts and dropout but
not by the peak height comparison.
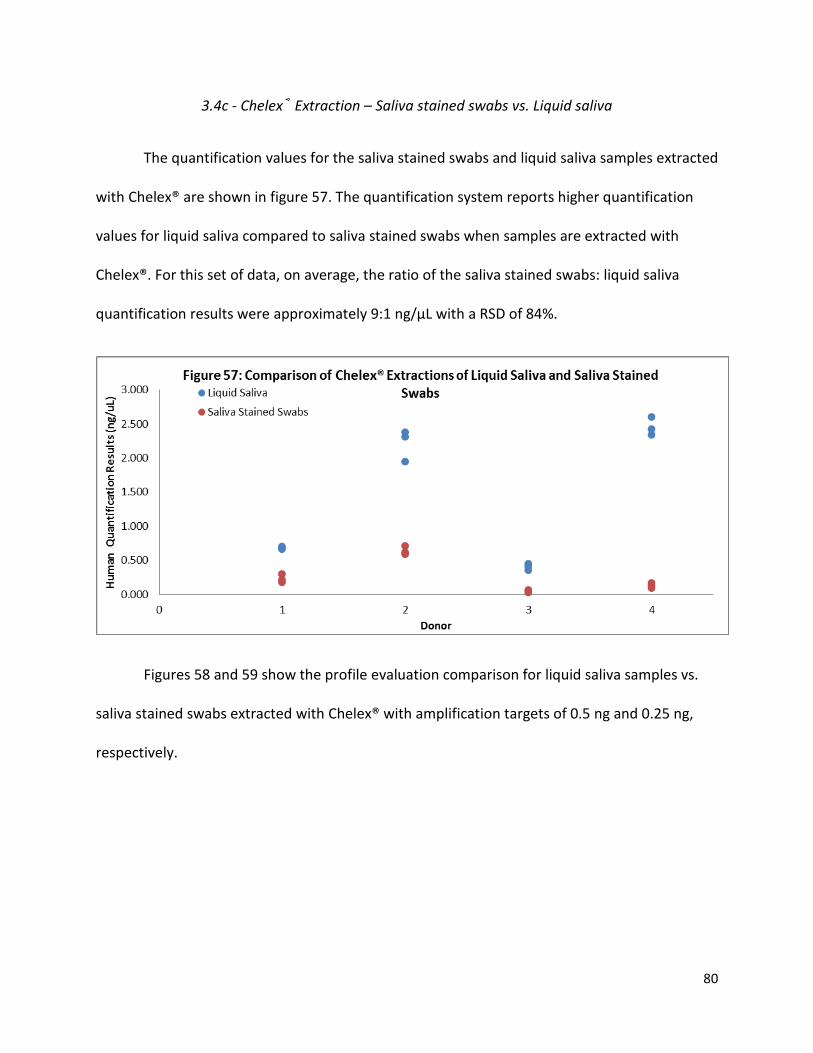
80
3.4c - Chelex® Extraction – Saliva stained swabs vs. Liquid saliva
The quantification values for the saliva stained swabs and liquid saliva samples extracted
with Chelex® are shown in figure 57. The quantification system reports higher quantification
values for liquid saliva compared to saliva stained swabs when samples are extracted with
Chelex®. For this set of data, on average, the ratio of the saliva stained swabs: liquid saliva
quantification results were approximately 9:1 ng/µL with a RSD of 84%.
Figures 58 and 59 show the profile evaluation comparison for liquid saliva samples vs.
saliva stained swabs extracted with Chelex® with amplification targets of 0.5 ng and 0.25 ng,
respectively.

81
The comparison of sample types extracted with Chelex® is inconclusive due to
conflicting trends. As decrease target amount with Chelex® extractions for the two sample
types, see expected decrease in fullness of profile with saliva swab but not liquid saliva which is
indicative of a possible underestimation of liquid saliva. See expected decrease in pull up and
increase in heterozygote PHR imbalance in both. Expected decrease in amount of samples with
stutter is seen for swabs but an unexpected increase in seen in the liquid samples which is
indicative of an underestimation of saliva stained swabs.
The additional artifact seen in profiles was a third allele of 15 at the D13 locus in some
of the EN samples. This artifact may be a product of amplification and the samples that
contained this artifact were re-amplified and re-ran. The 15 allele at D13 was not called in any
of the samples but it was visible below analytical threshold.
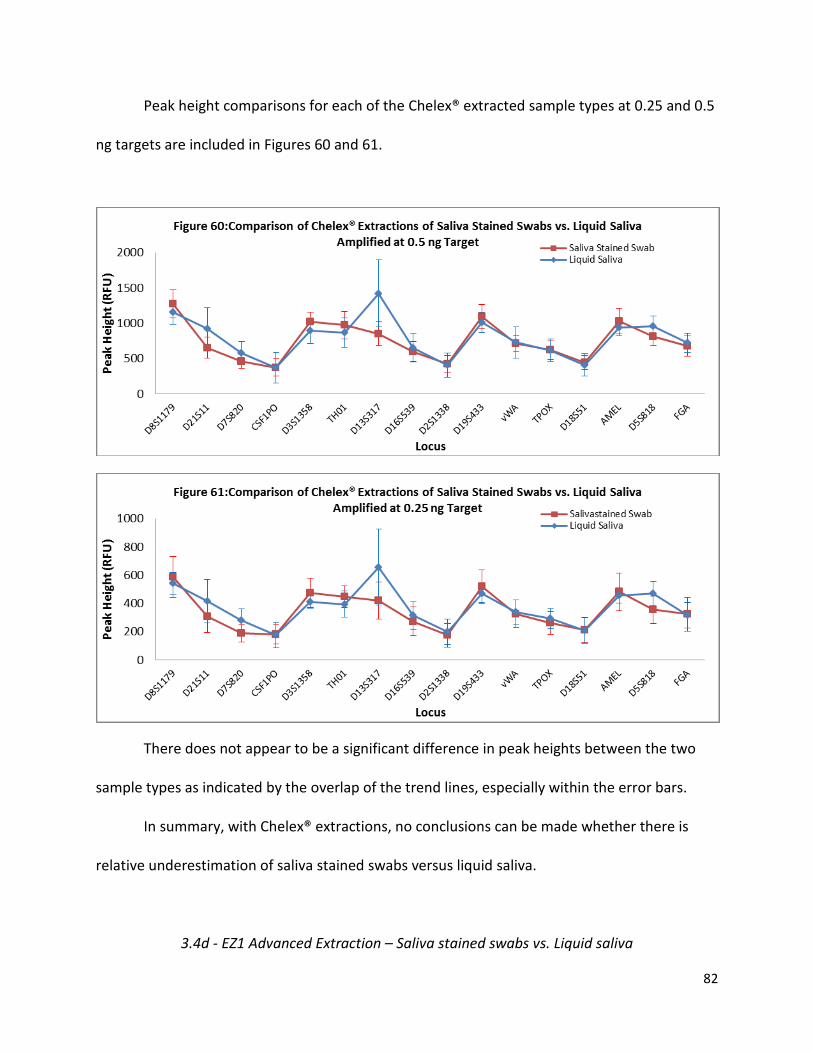
82
Peak height comparisons for each of the Chelex® extracted sample types at 0.25 and 0.5
ng targets are included in Figures 60 and 61.
There does not appear to be a significant difference in peak heights between the two
sample types as indicated by the overlap of the trend lines, especially within the error bars.
In summary, with Chelex® extractions, no conclusions can be made whether there is
relative underestimation of saliva stained swabs versus liquid saliva.
3.4d - EZ1 Advanced Extraction – Saliva stained swabs vs. Liquid saliva

83
The quantification values for the saliva stained swabs and liquid saliva samples extracted
with EZ1 Advanced are shown in figure 62. There is indication that the quantification system
reports greater quantities of DNA obtained from the liquid saliva samples compared to the
saliva stained swabs when extracted with EZ1 Advanced. For this set of data, on average, the
ratio of the liquid saliva:saliva stained swabs quantification results were approximately 14:1
ng/µL with a RSD of 83%.
Figures 63 and 64 show the profile evaluation comparison for liquid saliva samples vs.
saliva stained swabs extracted with EZ1 Advanced with amplification targets of 0.5 ng and 0.25
ng, respectively.

84
No indication of underestimation was seen in the profile evaluation comparison. The
decrease in target amount caused expected behavior of decreased target in all areas: decrease
in profile, pull up and stutter and increase in heterozygote PHR imbalance.
Peak height comparison for the two sample types when extracted with EZ1 Advanced at
0.25 and 0.5 ng targets are included in figures 65 and 66.

85
Comparison of the EZ1 Advanced extractions of the saliva stained swabs and liquid
saliva, indicate fairly equal amplification across the loci and similar peak heights across the loci.
In summary, for EZ1 Advanced extractions, no indication of relative underestimation of
quantification values obtained from saliva stains compared to liquid saliva samples is observed.
The full profiles were found to be concordant with their respective profiles in the BPD
laboratory DNA profile database.
The quantification values indicate that generally for both saliva stained swabs and liquid
saliva samples, Quantifiler® Duo reports larger amounts of DNA is extracted with EZ1 Advanced
compared to Chelex®. The results also indicate that for both types of extractions, Quantifiler®
Duo reports more DNA extracted from liquid saliva compared to saliva stained swabs.
Comparisons of the evaluations of the DNA profiles indicate that there may be some
underestimation of the quantification values of Chelex® extracts compared to EZ1 Advanced
extracts. Given that the same amplification targets were used for all samples, DNA profiles of
the same amplification target should, in theory, give similar peak height distribution across the

86
loci examined. Comparison of the peak height evaluations of the electropherograms does not
indicate that there is a significant difference between Chelex® vs. EZ1 Advanced extractions of
saliva stained swabs vs. liquid saliva.
3.5 - Post-Extraction Interference Study – Saliva vs. Blood
The variables used to evaluate whether there was a significant difference between the
saliva vs. blood based samples were:
• EZ1 extracted liquid samples • Chelex® extracted liquid samples • EZ1 extracted stained swab samples • Chelex® extracted stained swab samples
Comparisons were based solely on profile evaluation comparisons and peak height
comparisons. Quantification data was not compared as there similar DNA containing quantities
of blood and saliva based samples were not used.
3.5a - EZ1 Extracted Liquid Samples
Figures 67 and 68 show the profiles evaluation comparison of the liquid saliva vs. liquid
whole blood EZ1 extractions at 0.5 and 0.25 ng targets, respectively.

87
Profile evaluation comparison indicates possible underestimation of the whole blood
samples as demonstrated by the artifact changes from the 0.5 to 0.25 ng targets.
Peak height comparisons of the liquid saliva vs. liquid whole blood EZ1 extractions are
shown in figures 69 and 70 at 0.5 and 0.25 ng targets, respectively.

88
Comparison of the peak height trends demonstrates slightly greater peak heights from
whole blood compared to liquid saliva when extracted with EZ1.
In summary, there is indication of relative underestimation of quantification values of
whole blood samples compared to liquid saliva samples when extracted with EZ1.
3.5b - Chelex® Extracted Liquid Samples
Figures 71 and 72 show the profiles evaluation comparison of the liquid saliva vs. liquid
whole blood Chelex® extractions at 0.5 and 0.25 ng targets, respectively.

89
Profile evaluation comparison does not indicate any relative underestimation in
quantification values between liquid saliva and whole blood when extracted with Chelex®.
Peak height comparisons of the liquid saliva vs. liquid whole blood Chelex® extractions
are shown in figures 73 and 74 at 0.5 and 0.25 ng targets, respectively.

90
Comparison of the peak height trends demonstrates slightly greater peak heights from whole
blood compared to liquid saliva when extracted with Chelex®.
In summary, there is indication of relative underestimation in quantification values of whole
blood samples compared to liquid saliva samples when extracted with Chelex®.
3.5c - EZ1 Extracted Swab Samples
Figures 75 and 76 show the profiles evaluation comparison of the saliva stained swabs
vs. bloodstained swabs EZ1 extractions at 0.5 and 0.25 ng targets, respectively.
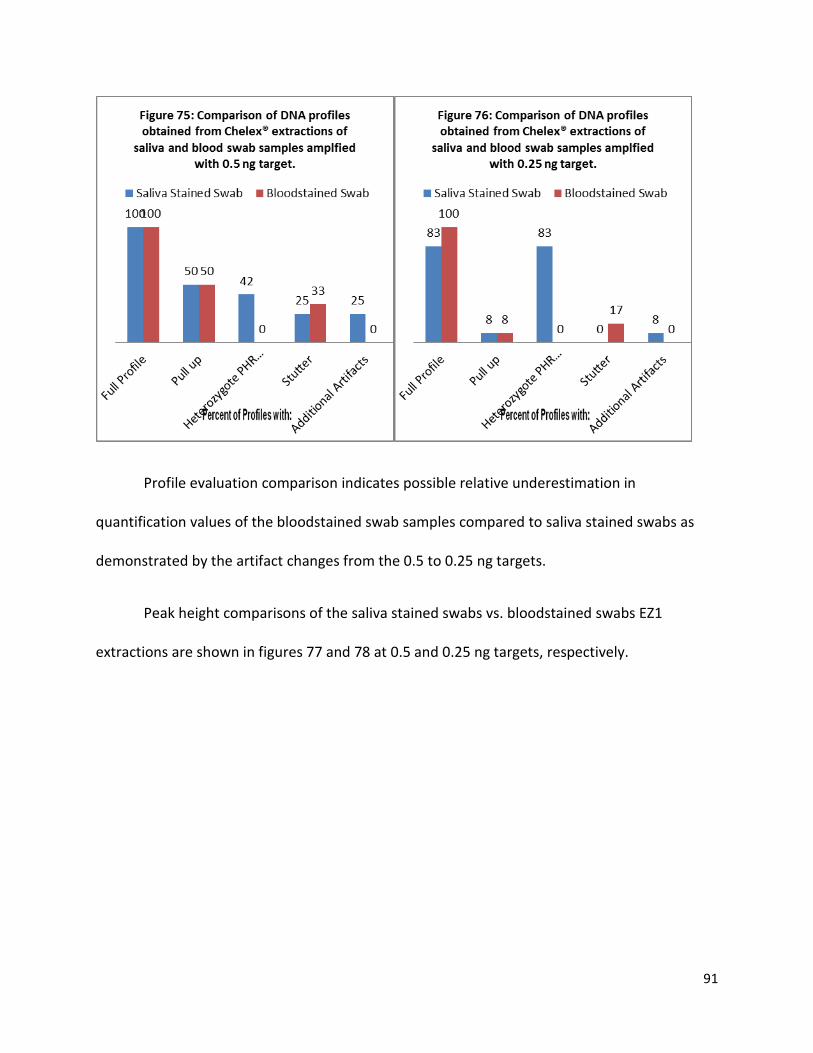
91
Profile evaluation comparison indicates possible relative underestimation in
quantification values of the bloodstained swab samples compared to saliva stained swabs as
demonstrated by the artifact changes from the 0.5 to 0.25 ng targets.
Peak height comparisons of the saliva stained swabs vs. bloodstained swabs EZ1
extractions are shown in figures 77 and 78 at 0.5 and 0.25 ng targets, respectively.

92
Comparison of the peak height trends demonstrates slightly greater peak heights from
the bloodstained swabs compared to the saliva stained swabs when extracted with EZ1.
In summary, there is indication of relative underestimation in quantification values of
bloodstained swab samples compared to saliva stained swab samples when extracted with EZ1.
3.5d - Chelex® Extracted Swab Samples
Figures 79 and 80 show the profiles evaluation comparison of the saliva stained swabs
vs. bloodstained swabs Chelex® extractions at 0.5 and 0.25 ng targets, respectively.

93
Profile evaluation comparison indicates possible relative underestimation in
quantification values of the bloodstained swab samples compared to saliva stained swabs as
demonstrated by the artifact changes from the 0.5 to 0.25 ng targets.
Peak height comparisons of the saliva stained swabs vs. bloodstained swabs Chelex®
extractions are shown in figures 81 and 82 at 0.5 and 0.25 ng targets, respectively.

94
Comparison of the peak height trends demonstrates slightly greater peak heights from
the bloodstained swabs compared to the saliva stained swabs when extracted with Chelex®. An
additional observation to note is the noticable downward slope in the saliva stained swabs
compared to the bloodstained swabs which is not as prevalent with the other comparisons.
In summary, there is indication of relative underestimation in quantification values of
bloodstained swab samples compared to saliva stained swab samples when extracted with
Chelex®.

95
Conclusions
Protocol Development
The purpose of this internship project was to develop a Chelex® resin based DNA
extraction protocol for extraction from oral reference swabs. Such a protocol was developed
based on BPD’s Chelex® DNA Extraction from Whole Blood/Bloodstains/Saliva Protocol and
previous studies performed by the BPD crime lab DNA section. The changes made in the
development of the extraction protocol included use of a tip of swab cutting, a 15 minute room
temperature incubation, a 15 minute 56°C incubation and use of a dry bath set at 100°C. The
complete Chelex® DNA Extraction from Oral Swabs Protocol is included in Appendix 1.
Validation
This protocol was evaluated to determine whether it was a reliable method and to
determine its limitations. It was found that the sensitivity of this protocol is sufficient to extract
amplifiable quantities of DNA from oral swabs in sufficient quality to be used for DNA analysis
and provide interpretable, concordant DNA profiles. Additionally, it was demonstrated that this
protocol is associated with a low risk of contamination and is capable of extracting DNA from
artificially-aged swabs. The extract itself was also seen to be stable when stored at 2-8°C, as
amplifications were reproducible across a span of 50 days.
Additional Studies
Amplification targets of 0.25 ng and 0.5 ng are both associated with artifacts that add
additional work to the interpretation of the DNA profiles. These targets are associated with too

96
little DNA at the 0.25 ng end and an excess at the 0.5 ng end. Therefore, an intermediate target
amount, perhaps 0.35 ng, should be evaluated.
Evaluations of the 5% Chelex® solution used in the extraction protocol demonstrated
that the solution should be made more than once a year with a pH monitoring system set in
place. For example, the 5% Chelex® solution should be made twice per year with the pH
measured monthly.
The post-extraction interference studies were an attempt to attribute the source of the
disconnect between quantification values and amplification results to a specific factor. The
factors evaluated included biological sample type (blood vs. saliva), substrate type (liquid
sample vs. stained swab), and extraction type (Chelex® vs. EZ1). The hypothesis with which the
results of this study were evaluated assumed an underestimation by the quantification system
was the reason for the disconnect. Using this assumption, the results of the study indicate a
possible relative underestimation of quantification values is associated with stained swabs
(compared to liquid samples) and blood based samples (over saliva samples). There is also a
slight indication that Chelex® extracted samples have underestimation in quantification values
compared to EZ1 extracted samples.
Future Studies
There are some additional studies that may be performed to further evaluate the
Chelex® extraction protocol from oral swabs. A study using oral swabs that are simply touched
to the cheek may be useful to evaluate the ability of the protocol to work with low DNA
samples. As a follow up to the Chelex® stability studies, it may be useful to do a comparison of

97
extractions performed with 5% Chelex® solutions over a range of pH to demonstrate exactly
how the extraction results are impacted by the pH. A follow up to the extract stability study
would include determining the effect of freezing the extract on the quality of the DNA because
the BPD DNA lab manual allows for extracts to be stored frozen for a period of three years.
Additionally, a post-extraction interference study comparing the original and modified Chelex®
protocols using blood and saliva samples could be useful for further exploring the source of
disconnect.
References
1 Butler, John M. Forensic DNA Typing: Biology, Technology, and Genetics of STR Markers. Burlington, MA: Elsevier Academic, 2005.
2 Qiagen EZ1 DNA Investigator Handbook. 4th Edition. April 2009 3 Scientific Working Group on DNA Analysis Methods. Validation Guidelines for DNA Analysis
Methods. Approved December 2012 4 Wang DY, Chang C, Lagace RE, Calandro LM, Hennesy LK. Developmental Validation of the
AmpFlSTR Identifiler® Plus PCR Amplification Kit: An Established Multiplex Assay with Improved Performance. J Forensic Sci. March 2012. Vol 57. No 2.
5 J.M. Willard, D.A. Lee, M.M Holland. Recovery of DNA for PCR Amplification from Blood and Forensic Samples Using a Chelating Resin. Methods in Molecular Biology. Vol 98 Forensic DNA Profiling Protocols.
6 Maine State Police Crime Laboratory: Forensic Biology Section Chelex® 100 Extraction of DNA. Version 5.1. 01/28/03.
7 National Forensic Science Technology Center President’s DNA Initiative DNA Analyst Training Laboratory Training Manual. Protocol 3.05 Chelex®100 Non-Differential Extraction.
Acknowledgements
I thank the Boston Police Department Crime Laboratory for having me as an intern and
assisting me throughout the course of this project. I also thank Rebecca Boissaye for acting as
my supervisor, Joshua Stewart and Dr. Pamela Staton for acting as my advisors and reviewers
through the course of this project.

98
Disclaimer
This project was supported by Award No. 2009-IJ-CX-K11 awarded by the National Institute of
Justice, Office of Justice Programs, U.S. Department of Justice. The opinions, findings, and
conclusions or recommendations expressed in this publication/program/exhibition are those of
the author(s) and do not necessarily reflect the views of the Department of Justice.

99
Appendix I

100
Chelex® DNA Extraction from Oral Swabs Controls:
• Reagent Blank (Required) • Reagent Blank – future testing (Required) • Control bloodstain (Required if testing known, alternate, or investigative references) • Unstained material if evidence is a stain (subject to analyst discretion)
3. Add ½ of tip of oral swab cutting to 1.5 mL microcentrifuge tube.
4. Pipette 1 mL sterile distilled water to tube and mix gently.
5. Incubate at room temperature for 15 minutes. Mix every 5 minutes by inversion or gentle
vortexing.
6. Spin in a microcentrifuge for 2 to 3 minutes at 10,000 to 15,000 rcf.
7. Carefully remove all but 20 to 30 μL supernatant and discard. Leave the substrate in the tube with
the pellet.
8. Using a stir plate, ensure the 5% Chelex® solution is being aggressively mixed to get the beads mixed
evenly into the liquid.
9. Using a P1000 pipet, add 5% Chelex® to bring final volume in the tube to 200 μL.
• Note: A P200 pipet tip is not large enough to effectively pipet the Chelex® resin, possibly
clogging the pipet tip and pipetting the incorrect volume.
10. Incubate at 56°C for 15 minutes.
11. Vortex at high speed for 5 to 10 seconds.
12. Incubate in dry bath set at 100°C for 8 minutes.
13. Vortex at high speed for 5 to 10 seconds.
14. Spin in a microcentrifuge for 2 to 3 minutes at 10,000 to 15,000 rcf.
Store the extract at 2 - 8°C or frozen for a period of 3 years. To use or aliquot from the extract, repeat steps 11 and 12.
Top Related