


Languages
Pages
Legal

DOE/CE/23810-109
Development and Consolidation of Gas Chromatography Methodsfor Appendix C to ARI 700
Final ReportSupersedes All Previous Additions
May 12, 2000
John J. ByrneAndrew M. Gbur
Douglas G. Gehring
Integral Sciences Incorporated1717 Arlingate Lane
Columbus, OH 43228
National Refrigerants, Inc.661 Kenyon AvenueBridgeton, NJ 08302
Prepared forThe Air-Conditioning and Refrigeration Technology Institute
UnderARTI MCLR Project Number 670-55000
This project is supported, in part, by US Department of Energy (Office of Building Technology) grant number DE-FG02-91CE23810: MaterialCompatibility and Lubricants Research (MCLR) on CFC-Refrigerant Substitutes. Federal funding supporting this project constitutes 93.57% ofallowable costs. Funding from non-government sources supporting this project consists of direct cost sharing of 6.43% of allowable costs, and in-kindcontributions from the air-conditioning and refrigeration industry.

1
Abstract
New Gas Chromatography methods for determining the composition of zeotropic andazeotropic refrigerant blends are reported. The new procedures provide a single columnto determine the blend composition of R-401, R-402, R-403B, R-404A, R-406A, R-407,R-408A, R-409, R-410, R-411, R-412A, R-500, R-502, R-503, R-507, R-509.This project also revised and generalized the format of each previously developed GCpurity method. These methods originally appeared in Appendix C to ARI 700-95 as wellas those set forth in a previous MCLR-funded project; namely, Methods Development forOrganic Contaminant Determination in Fluorocarbon Refrigerant Azeotropes andBlends.
Background
It has been almost 12 years since the inception of ARI Standard 700, Specifications forFluorocarbon and Other Refrigerants. This standard, in conjunction with its Appendix,Analytical Procedures for ARI Standard 700, is widely recognized as the technicalspecification which must be met by new and reclaimed refrigerants throughout therefrigeration and air-conditioning industry.
The current Gas Chromatographic (GC) procedures for organic purity and blendcompositions given in Appendix C to ARI Standard 700-95 are summarized in Tables 1and 2. As evidenced, these GC methods contain significant procedural differences fromone refrigerant to the next. In 1988, these procedural differences were largely overcomebecause there were only nine refrigerants in the initial version of ARI Standard 700. Bycustomizing each chromatographic method to a specific refrigerant, near-ideal separationand quantitation of the broadest possible range of manufacturing impurities was achieved.At that time a laboratory could analyze all nine refrigerants with only three different GCcolumns, and no sub-ambient temperature instrumentation was required.
Justification
What served well in 1988 has become complicated in the year 2000. In the 1995Standard 700 revision, the number of refrigerants requiring analysis quadrupled and nowstands at 36. Eleven different GC columns are now required (See Table 2). Manycolumns have no technical specificity in laboratories that analyze more than onerefrigerant. For example, the 105 meter DB1301 column required in the analysis of R-113 is unnecessary as the 120 meter DB1301 column required in the analysis of R-22,R32, and R134a can also be adapted to the R-113 analysis. Similarly, the 8 and 16 footCarbopack B columns used in the analysis of R-32, R-408A, and R-409A may bereplaced by one 24 foot Carbopack column. As Table 1 shows, ARI Standard 700presently mandates 13 separate GC methods for the determination of organic purity.Table 1 also shows 11 separate GC methods for determining the major componentcompositions of zeotropic and azeotropic blends with six blend composition methods stillto be added.

2
Because of these complications, the industry has requested simplified, technicallyappropriate GC test methods and/or method revisions for determining the organic purityand blend compositions of these refrigerants. The demand is especially great in theinternational standards community, as many parties have been reluctant to supportrefrigerant testing standards that are perceived as unnecessarily complex. Also, theinvestigators of this project have been in direct contact with several members of the ARIStandard 700 Engineering Subcommittee and with ISO TC 86/SC 8/WG 3 for aconsensus as to what work is required. Therefore, in order to safeguard domesticacceptance of ARI 700 and to facilitate international trade, it was most important torevise, simplify, and to consolidate all of the current methods.
Table 1. Refrigerant Type-Dependent GC Test Methods for ARI Standard 700
RefrigerantPurityMethod (1)
CompositionMethod(blends only)(1)
Detector Column(s) (2)TemperatureProgram(s) (3)
11 Part 6 FID K W12 Part 7 FID K N13 Part 8 TCD K N22 Part 9 FID E & K K & N23 Part 10 TCD H Q32 Part 11 FID E & J A & S113 Part 12 FID D I114 Part 13 FID K R123 Part 14 FID F & K C & V124 Part 15 FID K O125 Part 16 FID K L134a Part 17 FID A & E B & P143a Part 18 FID A & K H & P401 ∅ Part 19 TCD G M402 ∅ Part 20 TCD G M404A ∅ Part 21 TCD G G405 ∅ ∅406 ∅ ∅407 ∅ Part 24 TCD K T408A ∅ Part 25 FID I E409A ∅ Part 26 TCD I D410 ∅ Part 27 TCD B J411 ∅ ∅412 ∅ ∅500 ∅ Part 30 TCD C T502 ∅ Part 31 TCD C F503 ∅ Part 32 FID K U507 ∅ Part 33 TCD B J508 ∅ ∅509 ∅ ∅1. ∅ = Appendix does not contain any test method.2. A through K = See Table 2 for column information.3. A through W = See Table 3 for temperature program.
As a result, this project introduces a general test method using just one GC column thatdetermines the blend compositions of refrigerants 401 through 412, and for refrigerants500, 502, 503, 507, 508, and 509. This project also revised and generalized the format of

3
each previously developed GC purity method. These methods originally appeared inAppendix C to ARI 700-95 as well as those set forth in a previous MCLR-funded project;namely, Methods Development for Organic Contaminant Determination in FluorocarbonRefrigerant Azeotropes and Blends.
The completion of this work has produced new and revised test methods in a formatsimilar to Appendix C to ARI Standard 700. These methods can be advanced forconsideration in the next edition of ARI 700, ISO 12810, and other refrigerant standardsafter the appropriate review and revision processes of the respective committees havetaken place.
Table 2. Columns for Organic Purity and Blend Composition Testing for ARI 700-95Column Description (details in ARI 700 Appendix)A Bentone / Krytox / SP1000 / Porapak-T, connected in seriesB Carbowax / Dibutyl Maleate / SP1000, connected in seriesC DC200D DB1301 (105 meter)E DB1301 (120 meter)F DB1701 / SPB5, connected in seriesG KrytoxH Porapak-TI SP1000 (8 foot) on Carbopack-BJ SP1000 (16 foot) on Carbopack-BK SP1000 (24 foot) on Carbopack-B
Table 3. Temperature Programs for Organic Purity and Blend Composition Testing for ARI 700-95Program Initial Temp., º C Initial Time, min. Ramp, º C / min. Final Temp., º CA –28* 10 5 40B –20* 10 8 150C 15* 10 7 60D 30 3.75 15 100E 30 3.75 70 110F 35 isothermalG 35 7 20 75H 35 7 10 150I 35 10 8 160J 40 isothermalK 40 10 8 50L 40 6 5 130M 40 6 30 150N 40 6 10 160O 40 10 10 160P 40 6 10 165Q 40 3 18 175R 40 6 10 175S 45 8 8 150T 50 isothermalU 60 isothermalV 125 isothermalW 125 4 10 180
*Subambient capability is necessary for temperature programs A–C.

4
Objective
This work has been sponsored to develop gas chromatographic methods for determiningthe composition of refrigerants 401 through 412, 500, 502, 503, 507, 508, and 509 usinga single column. A second task, involving the same refrigerants, entailed rewriting eachpreviously developed method in simplified form. This second task was expanded toinclude refrigerants 11, 12, 13, 22, 23, 32, 113, 114, 123, 124, 125, 134a, and 143a thatwere not part of the original proposal.
The following goals were sought during the development and consolidation of the GasChromatography methods included herein:
• The new gas chromatographic procedures for determining the composition ofrefrigerant blends and azeotropes should all employ the same column.
• The new methods should allow any laboratory skilled in the art to readily use themethods to determine the composition of refrigerant azeotropes and blends.
• The gas chromatographic methods currently appearing in Appendix C to ARI700-95 and in the previously funded MCLR project: Methods Development forOrganic Contaminant Determination in Fluorocarbon Refrigerant Azeotropesand Blends, should be replaced with generalized procedures and GC Method DataSheets to allow for a reduction of redundancy currently existing in the standard.
• The simplified methods should provide all of the detail included in the previousmethods for which they are intended to replace. To the greatest extent possible,all of the generalized methods should employ calibration standard preparation,sample analysis, calculations (statistical and otherwise) and techniques consistentwith those already appearing in Appendix C to ARI 700-95.
Principle Features of the Resulting Methods
The new methods appear at the end of this report. Each of the 50 resulting procedureshas no more than 5 pages of text and in many cases 2 pages. The following new featuresare added over those previously published in ARI 700-95:
1. The new gas chromatographic procedures for the analysis of the composition ofblends do in fact employ a single column (See Table 4). The column utilized foreach composition analysis is a Supelco 1% SP-1000 on Carbopack B. Themethod describing the new generalized procedure for blend compositiondetermination appears in Part 15 of this report with the gas chromatographicmethods appearing in Parts 16-32.

5
Table 4. Summary of Refrigerant Testing Procedures
Refrigerant Testing ProcedurePages inCurrentARI 700
Pages inConsolidatedProcedure
Comment on NewMethods
General procedure for organic purity ∅ 10 Universal methodGeneral procedure for blend composition ∅ 5 Universal methodGeneral procedure for blend purity ∅ 5 Universal methodR-11 7 3 ConsolidatedR-12 9 4 ConsolidatedR-13 8 3 ConsolidatedR-22 10 5 ConsolidatedR-23 8 3 ConsolidatedR-32 10 4 ConsolidatedR-113 7 3 ConsolidatedR-114 9 3 ConsolidatedR-123 10 5 ConsolidatedR-124 9 4 ConsolidatedR-125 8 4 ConsolidatedR-134a 11 4 ConsolidatedR-143a 10 5 ConsolidatedR-401 (Composition) 5 2 New Single ColumnR-402 (Composition) 5 2 New Single ColumnR-403 (Composition) ∅ 2 New Single ColumnR-404 (Composition) 6 2 New Single ColumnR-406 (Composition) ∅ 2 New Single ColumnR-407 (Composition) 7 2 New Single ColumnR-408 (Composition) 6 2 New Single ColumnR-409 (Composition) 6 2 New Single ColumnR-410 (Composition) 5 2 New Single ColumnR-411 (Composition) 5 2 New Single ColumnR-412 (Composition) 5 2 New Single ColumnR-500 (Composition) 5 2 New Single ColumnR-502 (Composition) 5 2 New Single ColumnR-503 (Composition) 5 2 New Single ColumnR-507 (Composition) 5 2 New Single ColumnR-508 (Composition) 5 2 New Single ColumnR-509 (Composition) 5 2 New Single ColumnR-401 (Purity) ∅ 3 Single ColumnR-402 (Purity) ∅ 3 Single ColumnR-404 (Purity) ∅ 3 Single ColumnR-405 (Purity) ∅ 3 Single ColumnR-406 (Purity) ∅ 3 Single ColumnR-407 (Purity) ∅ 3 Single ColumnR-408 (Purity) ∅ 3 Single ColumnR-409 (Purity) ∅ 3 Single ColumnR-410 (Purity) ∅ 3 Single ColumnR-412 (Purity) ∅ 3 Single ColumnR-500 (Purity) ∅ 3 Single ColumnR-502 (Purity) ∅ 3 Single ColumnR-503 (Purity) ∅ 3 Single ColumnR-507 (Purity) ∅ 3 Single ColumnR-508 (Purity) ∅ 3 Single ColumnR-509 (Purity) ∅ 3 Single Column

6
2. The composition methods presently appearing in Appendix C to ARI 700 weredeveloped at different laboratories and employ some variety in both materials andlaboratory practice. This has imposed a considerable financial, procedural andtraining burden on laboratories that must employ the procedures of the standard orestablish procedures of their own and demonstrate equivalence (as currentlyrequired by law).
The new methods developed in the course of this study standardize, to the greatestextent possible, analytical procedures, equipment, calibration standard preparationand sampling methods. The methods reported herein are considered readilyusable by any refrigerant-testing laboratory skilled in the art.
3. The GC Method Data Sheet, found in Parts 2-14, 16-32, and 34-50, can standalone if used in conjunction with its respective Generalized Procedure found inPart 1, Part 15 or in Part 33. This simplification has allowed for a neededreduction in verbiage in the current edition of ARI 700-95 while maintaining itstechnical integrity.
4. All of the generalized methods employ similar calibration standard preparationtechniques, sample analysis, gas chromatographic equations, refrigerant transferprocedures and sampling techniques that are consistent with those alreadyappearing in ARI 700. Statistical parameters, definitions and calculations arethose used in ARI 700 and while not detailed in this report, are readily known andavailable to all personnel who would employ the procedures.
5. All of the methods appearing in this report are ready for review from allappropriate domestic and international committees for which they were originallywritten.
References
1. Air-Conditioning and Refrigeration Institute, Appendix C to ARI Standard700-95: Analytical Procedures for ARI Standard 700-95, 4301 North FairfaxDrive, Arlington, Virginia 22203.
2. BIPM, IEC, IFCC, ISO, IUPAP, and OIML, Guide to the Expression ofUncertainty in Measurement, ISO/TAG/WG3 Technical Advisory Group onMetrology, 1993.
3. NAMAS NIS 3003, Edition 8, The Expression of Uncertainty and Confidence inMeasurement for Calibrations, May 1995, NAMAS Executive, National PhysicalLaboratory, Teddington, Middlesex, TW11 0LW, England.
4. International Organization for Standardization, ISO 10012-1:1992(E), Qualityassurance requirements for measuring equipment—Part 1: Metrologicalconfirmation system for measuring equipment, ISO, Case Postale 56, CH-1211Genève 20, Switzerland.
5. Integral Sciences Incorporated, Standard Analytical Procedures, Document Q101Revision 1.2, January 5, 1997.

7
6. Byrne, J., Abel, M., Gbur, A. (Integral Sciences Incorporated), ARTI MCLRProject Number 665-54600, Methods Development for Organic ContaminantDetermination in Fluorocarbon Refrigerant Azeotropes and Blends, March 3,1998.
7. Huber, M., Gallagher, J., McLinden, M., and Morrison, G. (National Institute ofStandards and Technology Chemical Science and Technology Laboratory), NISTStandard Reference Database 23: NIST Thermodynamic Properties ofRefrigerants and Refrigerant Mixtures (REFPROP), Version 5.10, 1996.
8. BIPM, IEC, ISO, and OIML, International vocabulary of basic and general termsin metrology (VIM), 1994.
9. Bruno, T. J., Handbook for the Analysis and Identification of AlternativeRefrigerants, CRC Press, Boca Raton, Florida, 1995.
10. Bruno, T. J., Wertz, K. H., and Caciari, M., Kovats Retention Indices ofHalocarbons on a Hexafluoropropylene Epoxide-Modified Graphitized CarbonBlack, Analytical Chemistry, Vol. 68, No. 8, April 15, 1996, p. 1347 ff.
11. Gehring, D. G., Barsotti, D. J., and Gibbon, H. E., ChlorofluorocarbonsAlternatives Analysis, Part I: The determination of HFC-134a Purity by GasChromatography, Journal of Chromatographic Science, Vol. 30, pp. 280-284,July 1992.
12. Gehring, D. G., Barsotti, D. J., and Gibbon, H. E., ChlorofluorocarbonsAlternatives Analysis, Part I: The determination of HFC-143a Purity by GasChromatography, Journal of Chromatographic Science, Vol. 30, pp. 301-305,August 1992.
13. National Refrigerants Inc. Methods: NR200.0, NR202.1, NR204.0, NR212.0,NR214.0, NR216.1, NR226.1, NR228.1, NR236.0, NR254.0, and NR265.0.
14. DuPont Chemicals Dept. Methods F0050.165.01.CW, F0055.165.01.CW,F0080.165.01.LV, F0090.165.01CW, F0095.165.01, F0100.160.01.CW,F0100.165.01.CW, F3275.165.01CC (P), F3295.165.01.CW, F3297.165.01CC,F3327.165.01.CW, F3333.165.01.CW, F3337.165.01.CW (P), andRC110.000.03.CW.
15. AlliedSignal Inc. Methods: 538T, 539T, R-410-A-7, and R-507-7.
16. ICI Analytical Method: Determination of Composition of Refrigerant MixturesContaining KLEA 32, KLEA 125, and KLEA 134a, M. A. Cleaver, February1993.
17. Elf Atochem North America Methods: WK408A-1 and WK409A-1.

8
18. Cotton, J., Duncan, C., Spence, J., and Underwood, B., Elementary Statistics,Prentice Hall, 3rd Edition, 1976.

METHODS
DEVELOPMENT AND CONSOLIDATION
OF GAS CHROMATOGRAPHY METHODS
FOR APPENDIX C TO ARI 700
i
TABLE OF CONTENTS
PAGE
Part 1. General Procedure for the Determination of Purity ofNew and Reclaimed Refrigerants by Gas Chromatography........................1
Part 2. R-11 GC Method Data Sheet .....................................................................11
Part 3. R-12 GC Method Data Sheet .....................................................................14
Part 4. R-13 GC Method Data Sheet .....................................................................18
Part 5. R-22 GC Method Data Sheet .....................................................................21
Part 6. R-23 GC Method Data Sheet .....................................................................26
Part 7. R-32 GC Method Data Sheet .....................................................................29
Part 8. R-113 GC Method Data Sheet ...................................................................33
Part 9. R-114 GC Method Data Sheet ...................................................................36
Part 10. R-123 GC Method Data Sheet ...................................................................39
Part 11. R-124 GC Method Data Sheet ...................................................................44
Part 12. R-125 GC Method Data Sheet ...................................................................48
Part 13. R-134a GC Method Data Sheet .................................................................52
Part 14. R-143a GC Method Data Sheet .................................................................57
Part 15. Determination of Component Concentrations ofRefrigerant 400 and 500 Series Blends and AzeotropesBy Gas Chromatography............................................................................61
Part 16. R-401 Composition GC Method Data Sheet .............................................66
Part 17. R-402 Composition GC Method Data Sheet .............................................68
Part 18. R-403B Composition GC Method Data Sheet...........................................70
Part 19. R-404A Composition GC Method Data Sheet...........................................72
Part 20. R-406A Composition GC Method Data Sheet...........................................74

ii
TABLE OF CONTENTS (CONTINUED)
PAGE
Part 21. R-407 Composition GC Method Data Sheet .............................................76
Part 22. R-408A Composition GC Method Data Sheet...........................................78
Part 23. R-409 Composition GC Method Data Sheet .............................................80
Part 24. R-410 Composition GC Method Data Sheet .............................................82
Part 25. R-411 Composition GC Method Data Sheet .............................................84
Part 26. R-412A Composition GC Method Data Sheet...........................................86
Part 27. R-500 Composition GC Method Data Sheet .............................................88
Part 28. R-502 Composition GC Method Data Sheet .............................................90
Part 29. R-503 Composition GC Method Data Sheet .............................................92
Part 30. R-507 Composition GC Method Data Sheet .............................................94
Part 31. R-508 Composition GC Method Data Sheet .............................................96
Part 32. R-509 Composition GC Method Data Sheet .............................................98
Part 33. General Procedure for the Determination of Purity ofNew and Reclaimed Refrigerant Blends and AzeotropesBy Gas Chromatography..........................................................................100
Part 34. R-401 Purity GC Method Data Sheet ......................................................105
Part 35. R-402 Purity GC Method Data Sheet ......................................................108
Part 36. R-404 Purity GC Method Data Sheet ......................................................111
Part 37. R-405 Purity GC Method Data Sheet ......................................................114
Part 38. R-406 Purity GC Method Data Sheet ......................................................117
Part 39. R-407 Purity GC Method Data Sheet ......................................................120
Part 40. R-408 Purity GC Method Data Sheet ......................................................123

iii
TABLE OF CONTENTS (CONTINUED)
PAGE
Part 41. R-409 Purity GC Method Data Sheet ......................................................126
Part 42. R-410 Purity GC Method Data Sheet ......................................................129
Part 43. R-411 Purity GC Method Data Sheet ......................................................132
Part 44. R-412 Purity GC Method Data Sheet ......................................................135
Part 45. R-500 Purity GC Method Data Sheet ......................................................138
Part 46. R-502 Purity GC Method Data Sheet ......................................................141
Part 47. R-503 Purity GC Method Data Sheet ......................................................144
Part 48. R-507 Purity GC Method Data Sheet ......................................................147
Part 49. R-508 Purity GC Method Data Sheet ......................................................150
Part 50. R-509 Purity GC Method Data Sheet ......................................................153

iv
LIST OF FIGURES
PAGE
Part 1. Figure 1. Apparatus Used for Sampling CalibrationStandards and Samples ......................................................10
Part 2. Figure 1. Gas Chromatogram of R-11...............................................12
Part 3 Figure 1. Gas Chromatogram of R-12...............................................15
Part 4 Figure 1. Gas Chromatogram of R-13...............................................19
Part 5. Figure 1. Packed Column Gas Chromatogram of R-22 ....................22Figure 2. Capillary Column Gas Chromatogram of R-22
For Determination of R-31 Impurity..................................23
Part 6. Figure 1. Gas Chromatogram of R-23...............................................27
Part 7. Figure 1. Packed Column Gas Chromatogram of R-32 ....................30Figure 2. Capillary Column Gas Chromatogram of R-32 .................31
Part 8. Figure 1. Gas Chromatogram of R-113.............................................34
Part 9. Figure 1. Gas Chromatogram of R-114.............................................37
Part 10. Figure 1. Packed Column Gas Chromatogram of R-123 ..................40Figure 2. Capillary Column Gas Chromatogram of R-123 ...............41
Part 11. Figure 1. Gas Chromatogram of R-124.............................................45
Part 12. Figure 1. Gas Chromatogram of R-125.............................................49
Part 13. Figure 1. Packed Column Gas Chromatogram of R-134a.................53Figure 2. Capillary Column Gas Chromatogram of R-134a .............54
Part 14. Figure 1. Combination Packed Column Gas Chromatogram of R-143a ..........................................................................58
Figure 2. 1% SP-1000 Packed Column Gas Chromatogram of R-143a ..........................................................................59
Part 15. Figure 1. Apparatus Used for Sampling CalibrationStandards and Samples ......................................................65
Part 16. Figure 1. Gas Chromatogram of R-401.............................................67
Part 17. Figure 1. Gas Chromatogram of R-402.............................................69
v
LIST OF FIGURES (CONTINUED)
PAGE
Part 18. Figure 1. Gas Chromatogram of R-403B ..........................................71
Part 19. Figure 1. Gas Chromatogram of R-404A..........................................73
Part 20. Figure 1. Gas Chromatogram of R-406A..........................................75
Part 21. Figure 1. Gas Chromatogram of R-407.............................................77
Part 22. Figure 1. Gas Chromatogram of R-408A..........................................79
Part 23. Figure 1. Gas Chromatogram of R-409.............................................81
Part 24. Figure 1. Gas Chromatogram of R-410.............................................83
Part 25. Figure 1. Gas Chromatogram of R-411.............................................85
Part 26. Figure 1. Gas Chromatogram of R-412A..........................................87
Part 27. Figure 1. Gas Chromatogram of R-500.............................................89
Part 28. Figure 1. Gas Chromatogram of R-502.............................................91
Part 29. Figure 1. Gas Chromatogram of R-503.............................................93
Part 30. Figure 1. Gas Chromatogram of R-507.............................................95
Part 31. Figure 1. Gas Chromatogram of R-508.............................................97
Part 32. Figure 1. Gas Chromatogram of R-509.............................................99
Part 33. Figure 1. Apparatus Used for Sampling CalibrationStandards and Samples ....................................................104
Part 34. Figure 1. Gas Chromatogram of R-401...........................................105
Part 35. Figure 1. Gas Chromatogram of R-402...........................................108
Part 36. Figure 1. Gas Chromatogram of R-404...........................................111
Part 37. Figure 1. Gas Chromatogram of R-405...........................................114
Part 38. Figure 1. Gas Chromatogram of R-406...........................................117
vi
LIST OF FIGURES (CONTINUED)
PAGE
Part 39. Figure 1. Gas Chromatogram of R-407...........................................120
Part 40. Figure 1. Gas Chromatogram of R-408...........................................123
Part 41. Figure 1. Gas Chromatogram of R-409...........................................126
Part 42. Figure 1. Gas Chromatogram of R-410...........................................129
Part 43. Figure 1. Gas Chromatogram of R-411...........................................132
Part 45. Figure 1. Gas Chromatogram of R-500...........................................138
Part 46. Figure 1. Gas Chromatogram of R-502...........................................141
Part 47. Figure 1. Gas Chromatogram of R-503...........................................144
Part 48. Figure 1. Gas Chromatogram of R-507...........................................147
Part 49. Figure 1. Gas Chromatogram of R-508...........................................150
Part 50. Figure 1. Gas Chromatogram of R-509...........................................153
vii
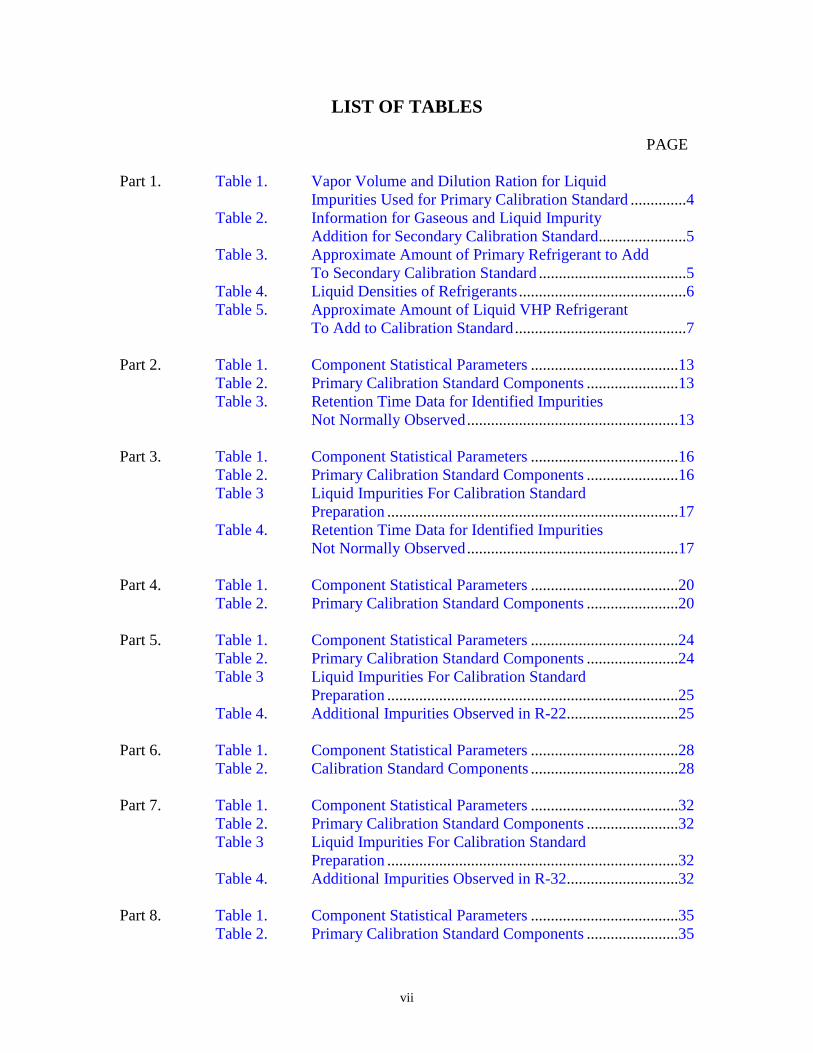
LIST OF TABLES
PAGE
Part 1. Table 1. Vapor Volume and Dilution Ration for LiquidImpurities Used for Primary Calibration Standard ..............4
Table 2. Information for Gaseous and Liquid ImpurityAddition for Secondary Calibration Standard......................5
Table 3. Approximate Amount of Primary Refrigerant to AddTo Secondary Calibration Standard .....................................5
Table 4. Liquid Densities of Refrigerants..........................................6Table 5. Approximate Amount of Liquid VHP Refrigerant
To Add to Calibration Standard...........................................7
Part 2. Table 1. Component Statistical Parameters .....................................13Table 2. Primary Calibration Standard Components .......................13Table 3. Retention Time Data for Identified Impurities
Not Normally Observed.....................................................13
Part 3. Table 1. Component Statistical Parameters .....................................16Table 2. Primary Calibration Standard Components .......................16Table 3 Liquid Impurities For Calibration Standard
Preparation .........................................................................17Table 4. Retention Time Data for Identified Impurities
Not Normally Observed.....................................................17
Part 4. Table 1. Component Statistical Parameters .....................................20Table 2. Primary Calibration Standard Components .......................20
Part 5. Table 1. Component Statistical Parameters .....................................24Table 2. Primary Calibration Standard Components .......................24Table 3 Liquid Impurities For Calibration Standard
Preparation .........................................................................25Table 4. Additional Impurities Observed in R-22............................25
Part 6. Table 1. Component Statistical Parameters .....................................28Table 2. Calibration Standard Components .....................................28
Part 7. Table 1. Component Statistical Parameters .....................................32Table 2. Primary Calibration Standard Components .......................32Table 3 Liquid Impurities For Calibration Standard
Preparation .........................................................................32Table 4. Additional Impurities Observed in R-32............................32
Part 8. Table 1. Component Statistical Parameters .....................................35Table 2. Primary Calibration Standard Components .......................35

viii
LIST OF TABLES (CONTINUED)PAGE
Part 9. Table 1. Component Statistical Parameters .....................................38Table 2. Primary Calibration Standard Components .......................38Table 3 Liquid Impurities For Calibration Standard
Preparation .........................................................................38
Part 10. Table 1. Component Statistical Parameters .....................................42Table 2. Primary Calibration Standard Components .......................42Table 3. Additional Impurities Observed in R-123,
Quantitation by Effective Carbon NumberMethod ...............................................................................43
Part 11. Table 1. Component Statistical Parameters .....................................46Table 2. Primary Calibration Standard Components .......................46Table 3 Primary Calibration Standard Liquid
Impurities ...........................................................................47Table 4. Retention Time Data for Identified Impurities
Not Normally Observed.....................................................47
Part 12. Table 1. Component Statistical Parameters .....................................50Table 2. Primary Calibration Standard Components .......................50Table 3 Primary Calibration Standard Liquid
Impurities ...........................................................................50Table 4. Retention Time Data for Identified Impurities
Not Normally Observed.....................................................51
Part 13. Table 1. Component Statistical Parameters .....................................55Table 2. Primary Calibration Standard Components .......................55Table 3. Primary Calibration Standard Liquid Impurities ...............56Table 4. Additional Impurities Observed in R-134a,
Quantitation by Effective Carbon NumberMethod ...............................................................................56
Part 14 Table 1. Component Statistical Parameters .....................................60Table 2. Primary Calibration Standard Components .......................60
Part 15. Table 1. GC Method Data Sheets.....................................................64
Part 16. Table 1. Blend Component Wt.% ...................................................66Table 2. Component Statistical Parameters .....................................66Table 3. Blend Calibration Standard Preparation ............................66

ix
LIST OF TABLES (CONTINUED)PAGE
Part 17. Table 1. Blend Component Wt.% ...................................................68Table 2. Component Statistical Parameters .....................................68Table 3. Blend Calibration Standard Preparation ............................68
Part 18. Table 1. Blend Component Wt.% ...................................................70Table 2. Component Statistical Parameters .....................................70Table 3. Blend Calibration Standard Preparation ............................70
Part 19. Table 1. Blend Component Wt.% ...................................................72Table 2. Component Statistical Parameters .....................................72Table 3. Blend Calibration Standard Preparation ............................72
Part 20. Table 1. Blend Component Wt.% ...................................................74Table 2. Component Statistical Parameters .....................................74Table 3. Blend Calibration Standard Preparation ............................74
Part 21. Table 1A. Blend Component Wt.% 407A ..........................................76Table 1B. Blend Component Wt.% 407B ..........................................76Table 1C. Blend Component Wt.% 407C ..........................................76Table 2. Component Statistical Parameters .....................................76Table 3. Blend Calibration Standard Preparation ............................76
Part 22. Table 1. Blend Component Wt.% ...................................................78Table 2. Component Statistical Parameters .....................................78Table 3. Blend Calibration Standard Preparation ............................78
Part 23. Table 1. Blend Component Wt.% ...................................................80Table 2. Component Statistical Parameters .....................................80Table 3. Blend Calibration Standard Preparation ............................80
Part 24. Table 1. Blend Component Wt.% ...................................................82Table 2. Component Statistical Parameters .....................................82Table 3. Blend Calibration Standard Preparation ............................82
Part 25. Table 1. Blend Component Wt.% ...................................................84Table 2. Component Statistical Parameters .....................................84Table 3. Blend Calibration Standard Preparation ............................84
Part 26. Table 1. Blend Component Wt.% ...................................................86Table 2. Component Statistical Parameters .....................................86Table 3. Blend Calibration Standard Preparation ............................86

x
LIST OF TABLES (CONTINUED)
PAGE
Part 27. Table 1. Blend Component Wt.% ...................................................88Table 2. Component Statistical Parameters .....................................88Table 3. Blend Calibration Standard Preparation ............................88
Part 28. Table 1. Blend Component Wt.% ...................................................90Table 2. Component Statistical Parameters .....................................90Table 3. Blend Calibration Standard Preparation ............................90
Part 29. Table 1. Blend Component Wt.% ...................................................92Table 2. Component Statistical Parameters .....................................92Table 3. Blend Calibration Standard Preparation ............................92
Part 30. Table 1. Blend Component Wt.% ...................................................94Table 2. Component Statistical Parameters .....................................94Table 3. Blend Calibration Standard Preparation ............................94
Part 31. Table 1A. Blend Component Wt.% R-508A ......................................96Table 1B. Blend Component Wt.% R-508B ......................................96Table 2. Component Statistical Parameters .....................................96Table 3. Blend Calibration Standard Preparation ............................96
Part 32. Table 1. Blend Component Wt.% ...................................................98Table 2. Component Statistical Parameters .....................................98Table 3. Blend Calibration Standard Preparation ............................98
Part 33. Table 1. GC Method Data Sheet ....................................................103
Part 34. Table 1A. Contaminant Statistical Parameters .................................106Table 1B. Component Statistical Parameters ...................................106Table 1C. Blend Component Balance Preparation ...........................106Table 2. Primary Calibration Standard Impurities .........................107
Part 35. Table 1A. Contaminant Statistical Parameters .................................109Table 1B. Component Statistical Parameters ...................................109Table 1C. Blend Component Balance Preparation ...........................109Table 2. Primary Calibration Standard Impurities .........................110
Part 36. Table 1A. Contaminant Statistical Parameters .................................112Table 1B. Component Statistical Parameters ...................................112Table 1C. Blend Component Balance Preparation ...........................112Table 2. Primary Calibration Standard Impurities .........................113

xi
LIST OF TABLES (CONTINUED)PAGE
Part 37. Table 1A. Contaminant Statistical Parameters .................................115Table 1B. Component Statistical Parameters ...................................115Table 1C. Blend Component Balance Preparation ...........................115Table 2. Primary Calibration Standard Impurities .........................116
Part 38. Table 1A. Contaminant Statistical Parameters .................................118Table 1B. Component Statistical Parameters ...................................118Table 1C. Blend Component Balance Preparation ...........................118Table 2. Primary Calibration Standard Impurities .........................119
Part 39. Table 1A. Contaminant Statistical Parameters .................................121Table 1B. Component Statistical Parameters ...................................121Table 1C. Blend Component Balance Preparation ...........................121Table 2. Primary Calibration Standard Impurities .........................122
Part 40. Table 1A. Contaminant Statistical Parameters .................................124Table 1B. Component Statistical Parameters ...................................124Table 1C. Blend Component Balance Preparation ...........................124Table 2. Primary Calibration Standard Impurities .........................125
Part 41. Table 1A. Contaminant Statistical Parameters .................................127Table 1B. Component Statistical Parameters ...................................127Table 1C. Blend Component Balance Preparation ...........................127Table 2. Primary Calibration Standard Impurities .........................128
Part 42. Table 1A. Contaminant Statistical Parameters .................................130Table 1B. Component Statistical Parameters ...................................130Table 1C. Blend Component Balance Preparation ...........................130Table 2. Primary Calibration Standard Impurities .........................131
Part 43. Table 1A. Contaminant Statistical Parameters .................................133Table 1B. Component Statistical Parameters ...................................133Table 1C. Blend Component Balance Preparation ...........................133Table 2. Primary Calibration Standard Impurities .........................134
Part 44. Table 1A. Contaminant Statistical Parameters .................................136Table 1B. Component Statistical Parameters ...................................136Table 1C. Blend Component Balance Preparation ...........................136Table 2. Primary Calibration Standard Impurities .........................137
Part 45. Table 1A. Contaminant Statistical Parameters .................................139

xii
LIST OF TABLES (CONTINUED)
PAGE
Table 1B. Component Statistical Parameters ...................................139Table 1C. Blend Component Balance Preparation ...........................139Table 2. Primary Calibration Standard Impurities .........................140
Part 46. Table 1A. Contaminant Statistical Parameters .................................142Table 1B. Component Statistical Parameters ...................................142Table 1C. Blend Component Balance Preparation ...........................142Table 2. Primary Calibration Standard Impurities .........................143
Part 47. Table 1A. Contaminant Statistical Parameters .................................145Table 1B. Component Statistical Parameters ...................................145Table 1C. Blend Component Balance Preparation ...........................145Table 2. Primary Calibration Standard Impurities .........................146
Part 48. Table 1A. Contaminant Statistical Parameters .................................148Table 1B. Component Statistical Parameters ...................................148Table 1C. Blend Component Balance Preparation ...........................148Table 2. Primary Calibration Standard Impurities .........................149
Part 49. Table 1A. Contaminant Statistical Parameters .................................151Table 1B. Component Statistical Parameters ...................................151Table 1C. Blend Component Balance Preparation ...........................151Table 2. Primary Calibration Standard Impurities .........................152
Part 50. Table 1A. Contaminant Statistical Parameters .................................154Table 1B. Component Statistical Parameters ...................................154Table 1C. Blend Component Balance Preparation ...........................154Table 2. Primary Calibration Standard Impurities .........................155

1
PART 1
GENERAL PROCEDURE FOR THE DETERMINATIONOF PURITY OF NEW AND RECLAIMED
REFRIGERANTS BY GAS CHROMATOGRAPHY
Section 1. Purpose
The purpose of this test method is to determine the purity ofnew and reclaimed refrigerants by gas chromatography (GC).
Section 2. Scope
This test method is for use in conjunction with the GC MethodData Sheets for all refrigerants as listed in section 12 of thismethod.
Section 3. Definitions
Definitions for this part are identical to those of ARI Standard700 and ARI Standard 740.
Section 4. Principle
The organic purity of new and reclaimed refrigerants isdetermined by programmed temperature gas chromatographyusing either a packed or capillary GC column and either a flameionization detector (FID) or thermal conductivity detector(TCD). Component peak areas are integrated electronically andquantified by the area normalization-response factor method byreference to a suitable calibration standard.
Section 5. Applicability
This method is applicable for the determination of the organicimpurities typically present in new and reclaimed refrigerant.These impurities are listed in the GC Method Data Sheet foreach respective refrigerant.
Section 6. Limitations and Interferences
This method will not detect impurities that coelute within thelarge peak matrix of the refrigerant being analyzed. Additionallimitations and interferences (if any) appear in the GC MethodData Sheet for each refrigerant.
Section 7. Sensitivity, Precision, and Accuracy
Values for these statistical parameters are given in Table 1 ofthe respective GC Method Data Sheet for each refrigerant.
Section 8. Special Apparatus and Reagents
NOTE: Equivalents may be substituted.
1. Gas chromatograph: Model 5890, equipped with FID,TCD and with capillary column split injection,subambient temperature valve and packed columncapability as specified in each refrigerant’s GC MethodData Sheet, Hewlett Packard, Wilmington, DE.
2. Electronic integrator: Model# 3396, Hewlett Packard,Wilmington, DE.
3. Gas chromatography columns specific to eachrefrigerant are given in Section 3 of the appropriate GCMethod Data Sheet.
4. Glass collecting tubes: 500 mL, 250 mL and 125 mL,LG-8601, Lab Glass Inc., Vineland, NJ. (Enlarge sideoutlet opening to accommodate a crimp-on 2-cm septum.Apply fiberglass tape outside for protection frombreakage)
5. Steel cylinder: 1L, with a single #9 valve (#1014-C,Superior Valve), 3/8" pipe neck, E. F. Britten Co.,Cranford, NJ.
6. Deflected point needles: Cat# 7174, #22, Popper andSons, Inc., New Hyde Park, NY.
7. Swivel union: US44, United Refrig. Inc., Philadelphia,PA.
8. Serum bottle: 125 mL, (Note: Bottle holds 160 mL whenliquid full.) Cat# 223748, Wheaton Glass, Vineland, NJ.
9. Impurities for calibration standard preparation: Thefluorochemicals may be purchased from Lancaster,Windham, NH and Synquest, Inc., Alachua, FL. Thehydrocarbons may be purchased from Scott SpecialtyGases, Inc., Plumbsteadville, PA. All other impuritiesmay be purchased from Aldrich, Milwaukee, WI. SeeTable 2 of the GC Method Data sheet for the specificimpurities required for each refrigerant. The purity ofeach calibration component must be predetermined bygas chromatography and, if necessary, by GC/MassSpectroscopy (GC-MS).
10. Stainless steel cylinder: 1L, 304L-WDF4-1000, 1/4"pipe, Whitey Co., Highland Heights, OH.
2
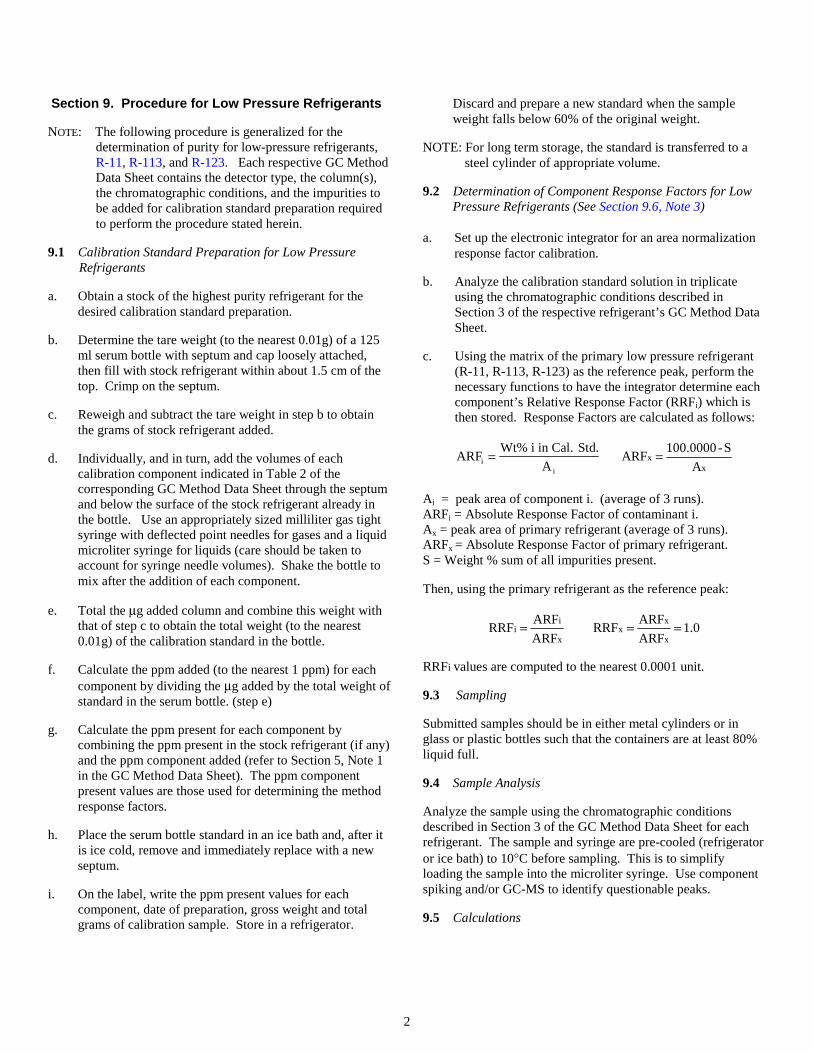
Section 9. Procedure for Low Pressure Refrigerants
NOTE: The following procedure is generalized for thedetermination of purity for low-pressure refrigerants,R-11, R-113, and R-123. Each respective GC MethodData Sheet contains the detector type, the column(s),the chromatographic conditions, and the impurities tobe added for calibration standard preparation requiredto perform the procedure stated herein.
9.1 Calibration Standard Preparation for Low PressureRefrigerants
a. Obtain a stock of the highest purity refrigerant for thedesired calibration standard preparation.
b. Determine the tare weight (to the nearest 0.01g) of a 125ml serum bottle with septum and cap loosely attached,then fill with stock refrigerant within about 1.5 cm of thetop. Crimp on the septum.
c. Reweigh and subtract the tare weight in step b to obtainthe grams of stock refrigerant added.
d. Individually, and in turn, add the volumes of eachcalibration component indicated in Table 2 of thecorresponding GC Method Data Sheet through the septumand below the surface of the stock refrigerant already inthe bottle. Use an appropriately sized milliliter gas tightsyringe with deflected point needles for gases and a liquidmicroliter syringe for liquids (care should be taken toaccount for syringe needle volumes). Shake the bottle tomix after the addition of each component.
e. Total the µg added column and combine this weight withthat of step c to obtain the total weight (to the nearest0.01g) of the calibration standard in the bottle.
f. Calculate the ppm added (to the nearest 1 ppm) for eachcomponent by dividing the µg added by the total weight ofstandard in the serum bottle. (step e)
g. Calculate the ppm present for each component bycombining the ppm present in the stock refrigerant (if any)and the ppm component added (refer to Section 5, Note 1in the GC Method Data Sheet). The ppm componentpresent values are those used for determining the methodresponse factors.
h. Place the serum bottle standard in an ice bath and, after itis ice cold, remove and immediately replace with a newseptum.
i. On the label, write the ppm present values for eachcomponent, date of preparation, gross weight and totalgrams of calibration sample. Store in a refrigerator.
Discard and prepare a new standard when the sampleweight falls below 60% of the original weight.
NOTE: For long term storage, the standard is transferred to asteel cylinder of appropriate volume.
9.2 Determination of Component Response Factors for LowPressure Refrigerants (See Section 9.6, Note 3)
a. Set up the electronic integrator for an area normalizationresponse factor calibration.
b. Analyze the calibration standard solution in triplicateusing the chromatographic conditions described inSection 3 of the respective refrigerant’s GC Method DataSheet.
c. Using the matrix of the primary low pressure refrigerant(R-11, R-113, R-123) as the reference peak, perform thenecessary functions to have the integrator determine eachcomponent’s Relative Response Factor (RRFi) which isthen stored. Response Factors are calculated as follows:
ARFWt% i in Cal. Std.
Aii
= x
xA
S-100.0000ARF =
Ai = peak area of component i. (average of 3 runs).ARFi = Absolute Response Factor of contaminant i.Ax = peak area of primary refrigerant (average of 3 runs).ARFx = Absolute Response Factor of primary refrigerant.S = Weight % sum of all impurities present.
Then, using the primary refrigerant as the reference peak:
x
ii
ARF
ARFRRF = 0.1
ARF
ARFRRF
x
xx ==
RRFi values are computed to the nearest 0.0001 unit.
9.3 Sampling
Submitted samples should be in either metal cylinders or inglass or plastic bottles such that the containers are at least 80%liquid full.
9.4 Sample Analysis
Analyze the sample using the chromatographic conditionsdescribed in Section 3 of the GC Method Data Sheet for eachrefrigerant. The sample and syringe are pre-cooled (refrigeratoror ice bath) to 10°C before sampling. This is to simplifyloading the sample into the microliter syringe. Use componentspiking and/or GC-MS to identify questionable peaks.
9.5 Calculations

3
a. The weight percentage of each component is calculated asfollows:
W100 x RRF x A
(A x RRFii i
i i
=∑ )
Where:
Wi = weight percentage of component i.RRFi = relative response factor for component i.Ai = peak area of component i.Σ…= sum of all component peak areas times their
respective relative response factors.
9.6 Notes for Low Pressure Refrigerants
1. The purest refrigerant will contain some of the impurities listedin Table 1 of the GC Method Data Sheet. The ppmamounts of impurities already in the primary refrigerant aredetermined via the method of Standards Addition.Individual impurity peak areas in the stock are increased inthe calibration standard by the ppm amount of thecorresponding impurity added. The ppm already present iscombined with the ppm added to give the total ppmcomponent present in the calibration standard.
2. To preserve the stock of calibration component, it issuggested to load a small evacuated 125 mL gas collectingtube to 101.325 kPa from the liquid phase as illustrated inFigure 1. The appropriate volume is then withdrawn andinjected into the serum bottle containing the primaryrefrigerant. For impurities that are liquid at roomtemperature, inject the indicated µl volumes of eachrespective component into the serum bottle.
3. Depending upon the electronic integrator used, it isoften more desirable to convert the ppm values to wt % forresponse factor calculations and for reporting purposes.
4. Typically, commercially available R-123 contains from 1to 7% R-123a isomer and 300 to 600 ppm R-123b isomer.The concentration of R-123a in the stock is determinedseparately by the method of Standards Addition (addingpercent amounts of R-123a to the stock R-123 andchromatographing as in Section 9.1). The calculatedRRF123a value is also assigned to the R-123b isomer, as R-123b is not commercially available for separate calibration.The amounts present are added to Table 2 in the GCMethod Data Sheet; the R-123a isomer shown as percentpresent.
Section 10. Procedure for High Pressure Refrigerants
NOTE: The following procedure is generalized for thedetermination of purity for high-pressure refrigerants,R-12, R-22, R-32, R-114, R-124, R-125, R-134a, and
R-143a. Each respective GC Method Data Sheetcontains the detector type, the column, thechromatographic conditions, and the impuritiesnecessary for the following calibration standardpreparation.
10.1 Primary Calibration Standard Preparation and Analysisfor High Pressure Refrigerants
a. Crimp-on the septum, then determine the internal volumeof the 500 ml gas bulb by weighing the bulb empty, thenfilled to maximum capacity with water. Record thegrams of water as ml volume capacity on the outside ofthe bulb (to the nearest 0.1ml).
b. Thoroughly dry the gas bulb, then assemble the apparatusas illustrated in Figure 1.
c. Attach a cylinder of the refrigerant for which acalibration standard is desired (hereafter referred to as theprimary refrigerant). Make sure that the refrigerant usedis of high purity. (Refer to Note 1 in Section 10.7)
d. With valve “A” closed, open all other valves andevacuate to 0.133 kPa.
e. Close valve “D” and monitor the gauge for severalminutes to ensure that the system is not leaking.
f. Close metering valve “E”. Open valve “A”, then slowlyopen valve “E” and flash liquid phase refrigerant to bringthe system to 101.325 kPa. Close Valve “A”.
g. Repeat steps d through f.
h. Close valves “B” and “C” and remove the bulb from thevacuum/sampling apparatus.
i. Calculate the grams of primary refrigerant added to thebulb as follows:
grams added = MW Ref. x Internal Volume of Bulb (mL) 24,450
Where:
MW Ref. = Molecular weight of the primary refrigerant24,450 = Volume occupied by 1 mole of the primary refrigerant
at 25°C and 101.325 kPa.
NOTE: Alternatively, the grams added may be determined byweighing (0.0001g) the dried, evacuated bulb (step dabove) and then reweighing at step h.
j. Individually, and in turn, add the volumes of eachgaseous calibration component indicated in Table 2 ofthe corresponding GC Method Data Sheet to the

4
calibration bulb. Use an appropriately sized microliter ormilliliter gas tight syringe with deflected point needles.(See Note 2 in Section 10.7 of this method)
k. Into a 30 ml serum bottle that has been capped andcrimped with a septum, add the exact volumes of theliquid impurities in the order given in Table 3 (if any) ofeach GC Method Data Sheet. Add each impurity bysyringe injection through the septum using a #22 needle(or smaller) as a vent. After addition, shake vigorouslyto mix. Label, date and store in a refrigerator.
NOTE: For refrigerants which have no liquid impurities listed in Table 4 of the GC Method Data Sheet skip steps k-n and proceed to step o.
l. Evacuate a 125 ml gas sampling bulb (refer to Figure 1)with its internal volume pre-measured, and fill to 101.325kPa with the primary refrigerant for which a calibrationstandard is desired.
NOTE: For R-114, a 250-mL gas sampling bulb is used.
m. Accurately withdraw and inject exactly 10 microliters ofsolution from the 30-mL serum bottle into the 125-mLbulb. Allow to equilibrate for 30 minutes.
NOTE: For R-114, 20 µL is added instead of 10 µL and for R-134a, 5 µL is added instead of 10 µL.
n. Using a gas tight syringe, withdraw vapor from the 125-mL bulb and inject the exact volume as listed in Table 1below into the 500-mL calibration bulb. The µg of eachcomponent thus added is calculated as follows and isadded to the fourth column of Table 2 of the appropriateGC Method Data Sheet as follows:
µµµµg of component i added = gi x D 32 x A
Where:
gi = g from step k and found in Table 4 of the GC Method DataSheet.
A = internal mL of the gas sampling bulb.32 = total (approximate) mL of solution in step k/Table 3.D = dilution ratio as listed in Table 1 below.
o. Total the µg added column in Table 2 (refer to the GCMethod Data Sheet) and combine this weight with that ofstep i to obtain the total weight of the sample (to thenearest 0.0001 g) in the bulb.
p. Calculate the ppm added (to the nearest 1 ppm) for eachcomponent by dividing the µg added by the total weightof sample in the gas bulb (step o).
Table 1. Vapor Volume and Dilution Ratio (D) for LiquidImpurities Used for Primary Calibration Standard
Refrigerant Vapor Volume(used in step n)
Dilution Ratio (D)
R-12 5.0 mL 50,000R-22 5.0 mL 50,000R-32 None added None
R-114 10.0 mL 200,000R-124 5.0 mL 50,000R-125 2.0 mL 20,000R-134a 5.0 mL 25,000R-143a None added None
q. Calculate the ppm present for each component bycombining the ppm present in the primary refrigerant (ifany) and the ppm component added (See Note 1 inSection 10.7 of this method). The ppm componentpresent values are those used for determining the methodresponse factors.
r. Allow the gas calibration bulb to stand for 20-30 minutesto equilibrate. The standard will be stable for 3 days.
10.2 Determination of Component Response Factors (Refer toSection 10.7, Note 3)
a. Set up the electronic integrator for an area normalization-response factor calibration.
b. Analyze the calibration standard bulb in triplicate usingthe chromatographic conditions described in Section 3 ofthe GC Method Data Sheet.
c. Using the primary refrigerant as the reference peak,perform the necessary functions to have the integratordetermine each component’s Relative Response Factor(RRFi) which is then stored. Response factors arecalculated as follows:
ARFWt% i in Cal. Std.
Aii
= x
xA
S-100.0000ARF =
Where:
ARFi = Absolute Response Factor of component i.Ai = peak area of component i (average of 3 runs)Ax = peak area of primary refrigerant (average of 3 runs).ARFx = Absolute Response Factor of Primary Refrigerant.S = Weight % sum of all impurities present.

5
Then, using the primary refrigerant as the reference peak:
x
ii
ARF
ARFRRF = 0.1
ARF
ARFRRF
x
xx ==
RRFi values are computed to the nearest 0.0001 unit.
Refer to Note 5 in Section 10.7 for R-32 and refer to Note 6 inSection 10.7 for R-134a.
10.3 Secondary Calibration Standard Preparation
NOTE: A secondary calibration standard is prepared in muchlarger quantity due to the comparatively short lifetimeof the primary bulb standard. The primary bulbstandard is necessary initially because of inherentphase distribution of added components if simplypreparing and calibrating a standard such as describedhere. The secondary standard is analyzed as a sampleagainst the primary standard and then usedsubsequently as the daily calibration standard.
a. Evacuate a 1L steel cylinder and determine the tareweight to the 0.1g.
b. Attach a Swagelok nut and septum to the valve and thenexternally cool the cylinder in ice water. Open thecylinder valve.
c. While keeping the cylinder in ice water, individually andin turn add the volume of each gaseous component givenin Table 2 of the GC Method Data Sheet multiplied bythe factor given in Table 2 below for each refrigerant tothe cylinder by syringe injection through the septum.Similarly, add the volume of liquid refrigerant impuritiesfrom Section 10.1 k (if any) in the quantity specified inTable 2 below. Close the cylinder valve and remove theSwagelok nut and septum.
Table 2. Secondary Calibration Standard Gaseous andLiquid Impurity Addition Information
RefrigerantGaseous Impurities
Factor1Liquid Refrigerant
Impurities (mL)R-12 400 0.15R-22 500 0.20R-32 700 None
R-114 400 0.30R-124 400 0.15R-125 400 0.15R-134a 500 0.10R-143a 350 None
1 Multiply each gaseous impurity in Table 2 of the GC Method Data Sheet by the factor given above to give the total volume of impurity to be added for the secondary calibration standard.
d. Evacuate a second clean, dry 1L steel cylinder anddetermine the tare weight to the nearest 0.1g.
e. Cool the cylinder in ice water and attach a short (up to 61cm) section of flex line from the primary refrigerant’ssupply cylinder. Purge a small amount of the primaryrefrigerant through the flex line before immediatelyattaching to the 1L cylinder.
f. Open the 1L cylinder valve, then open the refrigerantcylinder of the primary refrigerant for which it is desiredto constitute a secondary calibration standard. Whilekeeping the 1L cylinder in ice water, fill the 1L cylinderwith the amount of liquid phase of the primaryrefrigerant listed in Table 3 below. If significantly morethan the prescribed weight of the primary refrigerant isadded, vent the cylinder to give approximately the weightdesired in Table 3 (See Note 4 in Section 10.7 of thismethod). Remove the 1L cylinder from the ice bath andallow it to warm to ambient temperature.
g. Place the 1L secondary calibration standard cylinder (thecylinder mentioned in steps a, b, and c) in the ice bathand cool for 30 minutes.
h. Using a short double female swivel coupler, invert the 1Lcylinder containing the primary refrigerant in step f, andconnect to the secondary calibration standard cylinder.Open the valve slightly and purge some of the primaryrefrigerant vapor to sweep the coupler before connectingto the secondary calibration standard cylinder. Warm,but do not overheat, the cylinder containing the primaryrefrigerant with a heat gun.
Table 3. Approximate Amount of PrimaryRefrigerant to Add to Secondary Calibration
Standard
Refrigerant Weight of Primary Refrigerant (g)
R-12
R-22
R-32
R-114
R-124
R-125
R-134a
R-143a
1200
1100
900
1300
1200
1100
1100
820
i. Open the valves on both cylinders and allow all of theprimary refrigerant to transfer into the calibrationstandard cylinder. Close the cylinder valves.
j. Remove the calibration cylinder from the ice bath andallow the cylinder to reach ambient laboratory

6
temperature before the final weighing. Dry off thecylinder then reweigh it to the nearest 0.1g.
k. Subtract the tare weight (from step a) from the totalweight (step j) to obtain the total grams of standard in thecylinder. Record this weight together with the cylindertare weight and the date of preparation on the cylinderlabel.
l. Roll the cylinder for at least 4 hours to thoroughly mix.
m. Analyze the cylinder contents in triplicate as described inSection 3 of the GC Method Data Sheet, loading first intoan evacuated gas bulb as shown in Figure 1.
n. Average the results calculated electronically (see Section10.6, Calculations) and tabulate to the nearest 1ppm. Listeach component on the cylinder label with the ppmamount for each. This cylinder is used henceforth as thecalibration standard until the loss of standard weightindicates that the internal volume of liquid phase is lessthan 60% of the total internal volume of the cylinder.Liquid densities of the primary refrigerants are listed inTable 4 below.
Table 4. Liquid Densities of Refrigerants
Refrigerant Density at 25°C (g/mL)
R-12
R-13
R-22
R-23
R-32
R-114
R-124
R-125
R-134a
R-143a
1.311
0.907
1.194
0.670
1.100
1.456
1.364
1.250
1.202
0.946
10.4 Sampling
Submitted sample cylinders must contain sufficient liquid phase(80% liquid full is recommended) for analysis.
10.5 Sample Analysis
Analyze the sample using the chromatographic conditionsspecified in Section 3 of the respective GC Method Data Sheet.Load the sample as illustrated in Figure 1 by flashing the liquidphase into an evacuated gas bulb and bringing to 101.325 kPapressure.
NOTE: Alternatively, the sample liquid phase may be flashedinto a Tedlar bag (1L recommended) and the sample
for GC analysis is withdrawn from the bag.
10.6 Calculations
a. The weight percentage of each component is calculated asfollows:
W100 x RRF x A
(A x RRFii i
i i
=∑ )
Where:
Wi = weight percentage of component i.RRFi = relative response factor for component i.Ai = peak area of component i.Σ…= sum of all component peak areas times their
respective relative response factors.
b. Report sample component concentrations to the nearest0.0001% (or to the nearest 1 ppm). If the results are lessthan the individual detection limits (see Table 1), thenreport < the detection limit (DL) value given.
10.7 Notes for High Pressure Refrigerants
1. The purest refrigerant will contain some of the impurities listedin Table 1 of the GC Method Data Sheet. The ppmamounts of impurities already in the primary refrigerant aredetermined via the method of Standards Addition.Individual impurity peak areas in the stock are increased inthe calibration standard by the ppm amount of thecorresponding impurity added. The ppm already present iscombined with the ppm added to give the total ppmcomponent present in the calibration standard.
2. To preserve the stock of calibration component, it issuggested to load a small evacuated 125 mL gas collectingtube to 101.325 kPa from the liquid phase as illustrated inFigure 1. The appropriate volume is then withdrawn andinjected into the 500-mL calibration bulb.
3. Depending upon the electronic integrator used, it isoften more desirable to convert the ppm values to wt % forresponse factor calculations and for reporting purposes.
4. During the primary refrigerant’s addition to the 1L cylinder(secondary standard preparation), it is unnecessary to bringthe cylinder to ambient temperature between weighings asonly an approximate weight is required.
5. To determine the R-125 packed column response in thepresence of HCC-40 while analyzing R-32, it is necessaryto first establish an RRF ratio for HCC-40 between the twocolumns. This is done by analyzing the standard on bothcolumns and determining the RRF40 on the packed column
7
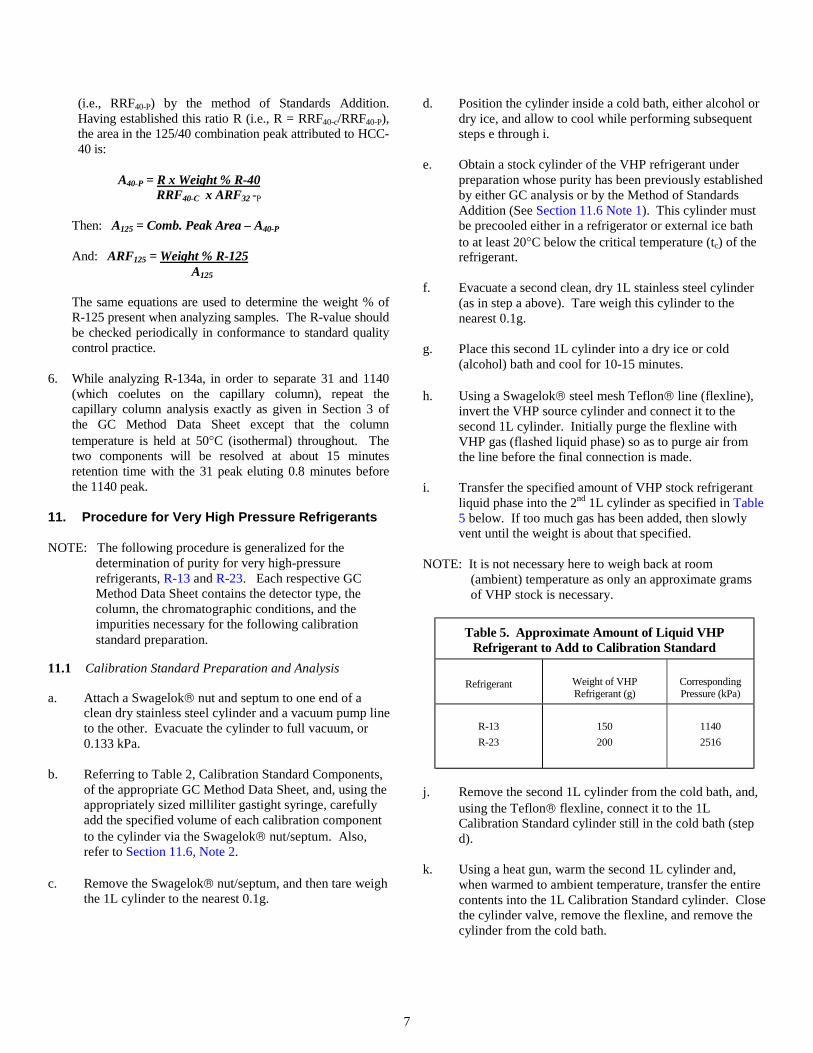
(i.e., RRF40-P) by the method of Standards Addition.Having established this ratio R (i.e., R = RRF40-c/RRF40-P),the area in the 125/40 combination peak attributed to HCC-40 is:
A40-P = R x Weight % R-40 RRF40-C x ARF32 -P
Then: A125 = Comb. Peak Area – A40-P
And: ARF125 = Weight % R-125A125
The same equations are used to determine the weight % ofR-125 present when analyzing samples. The R-value shouldbe checked periodically in conformance to standard qualitycontrol practice.
6. While analyzing R-134a, in order to separate 31 and 1140(which coelutes on the capillary column), repeat thecapillary column analysis exactly as given in Section 3 ofthe GC Method Data Sheet except that the columntemperature is held at 50°C (isothermal) throughout. Thetwo components will be resolved at about 15 minutesretention time with the 31 peak eluting 0.8 minutes beforethe 1140 peak.
11. Procedure for Very High Pressure Refrigerants
NOTE: The following procedure is generalized for thedetermination of purity for very high-pressurerefrigerants, R-13 and R-23. Each respective GCMethod Data Sheet contains the detector type, thecolumn, the chromatographic conditions, and theimpurities necessary for the following calibrationstandard preparation.
11.1 Calibration Standard Preparation and Analysis
a. Attach a Swagelok nut and septum to one end of aclean dry stainless steel cylinder and a vacuum pump lineto the other. Evacuate the cylinder to full vacuum, or0.133 kPa.
b. Referring to Table 2, Calibration Standard Components,of the appropriate GC Method Data Sheet, and, using theappropriately sized milliliter gastight syringe, carefullyadd the specified volume of each calibration componentto the cylinder via the Swagelok nut/septum. Also,refer to Section 11.6, Note 2.
c. Remove the Swagelok nut/septum, and then tare weighthe 1L cylinder to the nearest 0.1g.
d. Position the cylinder inside a cold bath, either alcohol ordry ice, and allow to cool while performing subsequentsteps e through i.
e. Obtain a stock cylinder of the VHP refrigerant underpreparation whose purity has been previously establishedby either GC analysis or by the Method of StandardsAddition (See Section 11.6 Note 1). This cylinder mustbe precooled either in a refrigerator or external ice bathto at least 20°C below the critical temperature (tc) of therefrigerant.
f. Evacuate a second clean, dry 1L stainless steel cylinder(as in step a above). Tare weigh this cylinder to thenearest 0.1g.
g. Place this second 1L cylinder into a dry ice or cold(alcohol) bath and cool for 10-15 minutes.
h. Using a Swagelok steel mesh Teflon line (flexline),invert the VHP source cylinder and connect it to thesecond 1L cylinder. Initially purge the flexline withVHP gas (flashed liquid phase) so as to purge air fromthe line before the final connection is made.
i. Transfer the specified amount of VHP stock refrigerantliquid phase into the 2nd 1L cylinder as specified in Table5 below. If too much gas has been added, then slowlyvent until the weight is about that specified.
NOTE: It is not necessary here to weigh back at room(ambient) temperature as only an approximate gramsof VHP stock is necessary.
Table 5. Approximate Amount of Liquid VHPRefrigerant to Add to Calibration Standard
Refrigerant Weight of VHPRefrigerant (g)
CorrespondingPressure (kPa)
R-13
R-23
150
200
1140
2516
j. Remove the second 1L cylinder from the cold bath, and,using the Teflon flexline, connect it to the 1LCalibration Standard cylinder still in the cold bath (stepd).
k. Using a heat gun, warm the second 1L cylinder and,when warmed to ambient temperature, transfer the entirecontents into the 1L Calibration Standard cylinder. Closethe cylinder valve, remove the flexline, and remove thecylinder from the cold bath.

8
l. Position the cylinder on a roller mill, and roll to mixwhile allowing the cylinder to slowly warm to ambient(room) temperature. Note that the liquid phase willslowly vaporize as the VHP gas warms to roomtemperature.
m. When equilibrated at room temperature, weigh thecylinder (to the nearest 0.1g). Subtract the tare weight(step c) and record the difference as the grams of stockVHP refrigerant added.
n. Total the grams of all added impurities (step b) and addthis sum to the grams of stock from step m above. Thisamount represents the total weight of calibration samplepresent.
o. Divide the grams of each added impurity multiplied by106 by the total weight of calibration sample and recordthese results in Table 2 of the GC Method Data Sheet asppm component added. Correct any amount for thepurity of the added component as previously established(Section 8, 9)
p. Add the ppm amount of any impurity component alreadypresent in the VHP stock refrigerant to the ppm amountof impurity added, and complete Table 2 by recordingeach respective value in the Total ppm Present column(see Section 11.6, Note 1)
q. Record the individual impurities and ppm amountspresent on the Standard Cylinder, the gross weight, andthe date of preparation. Because the standard mixture isall vapor, the mixture is stable indefinitely, or until all isconsumed.
11.2 Determination of Component Response Factors (Refer toSection 11.6, Note 3)
a. Set up the electronic integrator for an area normalization-response factor calibration.
b. Analyze the calibration standard cylinder in triplicateusing the chromatographic conditions described inSection 3 of the GC Method Data Sheet. Refer to Figure1 for loading into the gas sampling bulb.
c. Using the primary refrigerant as the reference peak,perform the necessary functions to have the integratordetermine each component’s Relative Response Factor(RRFi) which is then stored. Response factors arecalculated as follows:
ARFWt% i in Cal. Std.
Aii
= x
xA
S-100.0000ARF =
Where:
ARFi = Absolute Response Factor of component i.Ai = Peak Area of component i (average of 3 runs).Ax = Peak Area of primary refrigerant (average of 3 runs).ARFx = Absolute Response Factor of Primary Refrigerant.S = Wt% sum of all impurities present.
Then, using the primary refrigerant as the reference peak:
x
ii
ARF
ARFRRF = 0.1
ARF
ARFRRF
x
xx ==
RRFi values are computed to the nearest 0.0001 unit.
11.3 Sampling
Submitted sample cylinders must be stainless steel, either 500mL or 1L volume. Source cylinders or containers are sampledabove the critical temperature (Tc) of the VHP refrigerant so asto ensure the refrigerant is all vapor phase (refer to Note 4).
11.4 Sample Analysis
Analyze the sample using the chromatographic conditionsspecified in Section 3 of each GC Method Data Sheet. Load thevapor sample into the gas bulb as illustrated in Figure 1. Becertain that metering valve “E” is rated above the pressure ofthe VHP refrigerant gas in the sample cylinder. Alternatively,the sample may be slowly purged through Tygon tubing and,after purging air from the tubing, the GC sample is withdrawnthrough the tubing in proximity to the cylinder valve.
NOTE: Alternatively, the sample liquid phase may beflashed into a Tedlar bag (1L recommended) and thevapor then sampled for GC analysis.

9
11.5 Calculations
a. The weight percentage of each component is calculated asfollows:
W100 x RRF x A
(A x RRFii i
i i
=∑ )
Where:
Wi = weight percentage of component i.RRFi = relative response factor for component i.Ai = peak area of component i.Σ…= sum of all component peak areas times their
respective relative response factors.
b. Report sample component concentrations to the nearest0.0001% (or to the nearest 1 ppm). If the results are lessthan the individual detection limits (see Table 1), thenreport < the detection limit (DL) value given.
11.6 Notes for Very High Pressure Refrigerants
1. The purest refrigerant will contain some of the impuritieslisted in Table 1 of the GC Method Data Sheet. The ppmamounts of impurities already in the primary refrigerantare determined via the method of Standards Addition.Individual impurity peak areas in the stock are increasedin the calibration standard by the ppm amount of thecorresponding impurity added. The ppm already presentis combined with the ppm added to give the total ppmcomponent present in the calibration standard. The ppmadded amounts for calibration should be greater than theusual amounts present in typical samples. This is becausethe peak response of the TCD becomes increasingly non-linear as impurity concentration levels increase.
2. To preserve the stock of calibration component, it issuggested to load an evacuated 250-mL gas collecting tubeto 110 kPa from the liquid phase as illustrated in Figure 1.The appropriate volume is then withdrawn and injectedinto the 1L stainless steel cylinder.
3. Depending upon the electronic integrator used, it isoften more desirable to convert the ppm values to wt % forresponse factor calculations and for reporting purposes.
4. VHP refrigerants all have Tc values either near or somewhatbelow room temperature. Because ARI Standard 700specifies that the liquid phase of refrigerants is sampled forpurity, et. al., the only way to form sufficient liquid phasefor these analyses is to cool the VHP sample to at least20°C below Tc. In practice, consistent impurity phasedistributions are difficult to control because the relativeamounts of sample liquid and vapor phases are strongly
dependent upon the temperature of the refrigerant at thetime of analytical sampling and analysis. For this reason,the decision was made to ensure sample homogeneity byconverting all source refrigerants to vapor phase beforeanalytical GC sampling. In cold weather, the sampling ofvery large containers (outdoors) is accomplished bysampling the liquid phase and then warming the samplecylinder and contents to above Tc before GC analysis.
5. A 32-fold increase in peak sensitivity is possible byoperating the chromatographic TCD at the high sensitivityposition. However, at higher sensitivity, the usefullifetime of the detector (hot wires) is diminished, thebaseline noise and background is often intolerable andpeak area reproducibility is generally degraded. For thesereasons, the lower sensitivity position was chosen forroutine applications.
Section 12. GC Method Data Sheets
The GC Method Data Sheet for each respective refrigerant canbe found in the following Part:
Table 6. GC Method Data Sheets
RefrigerantProcedure forCalibrationStandardPreparation
GC Method DataSheet PartNumber
R-11 Part 1, Section 9 Part 2R-12 Part 1, Section 10 Part 3R-13 Part 1, Section 11 Part 4R-22 Part 1, Section 10 Part 5R-23 Part 1, Section 11 Part 6R-32 Part 1, Section 10 Part 7
R-113 Part 1, Section 9 Part 8R-114 Part 1, Section 10 Part 9R-123 Part 1, Section 9 Part 10R-124 Part 1, Section 10 Part 11R-125 Part 1, Section 10 Part 12R-134a Part 1, Section 10 Part 13R-143a Part 1, Section 10 Part 14
Section 13. References
1. Air-Conditioning and Refrigeration Institute, Appendix Cto ARI Standard 700-95: Analytical Procedures for ARIStandard 700-95, 4301 North Fairfax Drive, Arlington,Virginia 22203.

10
Figure 1. Apparatus Used for Sampling Calibration Standards and Samples

11
Part 2
R-11 GC Method Data Sheet
Section 1. Scope
This GC Method Data Sheet is for use in conjunction withSection 9 of the General Procedure for the Determination ofPurity of New and Reclaimed Refrigerants by GasChromatography (hereafter referred to as General Procedure).This GC Method Data Sheet is for use with R-11.
Section 2. Limitations and Interferences
This method is applicable and calibrated for only thoseimpurities found in Table 2. Other impurities that have beendetected on occasion are listed (with retention times) in Table 3.This method will not detect any impurities that may elute withinthe comparatively large R-11 peak matrix.
Section 3. Gas Chromatographic AnalysisEquipment and Conditions
Packed column: 7.32 m x 3.17 mm OD stainless steel, 1% SP-1000 on Carbopack B, 60/80 mesh, Supelco, Bellefonte, PA.
Detector FIDCarrier Gas 30 mL He/Min.Initial Column Temp. 125°CInitial Hold 4 Min.Program 10 K/Min.Final Column Temp. 180°CPost Hold 14 Min.Sample 1 µL (liquid syringe)Detector Temp. 250°CInj. Port Temp. 200°CMax Safe Column Temp. 225°C (for conditioning purposes)
Section 4. Sensitivity, Precision, and Accuracy
Statistical parameters for each impurity are listed in Table 1.The data was obtained by analyzing an R-11 calibration mixture7 times during one day by one operator.
Section 5. Tables
The following tables are to be used in conjunction with Section 9of the General Procedure for the Determination of Purity of Newand Reclaimed Refrigerants by Gas Chromatography.

12
Figure 1. Gas Chromatogram of R-11

13
Table 1. Component Statistical Parameters
ComponentDetection
Limit, ppmConcentration
Investigated, ppmPrecision at 95%
Confidence Limit, ppmRelative Mean
Error, %
2313
152a22
11512
133a2130
114123a12320
11310
1120
2312221222322222
15203050306025302540255025602525
0.370.530.470.980.801.100.330.670.331.912.701.330.732.311.701.77
-2.8-3.11.7-0.80.71.1-2.51.2-2.5-2.7-4.83.30.72.2-3.31.8
Table 2. Primary Calibration Standard Components
Component Mol. Wt.Vol.
Added, mLµg
Added (1)ppm
Added (2)Total ppmPresent (3)
23(4)13(4)
152a(4)22(4)115(4)12(4)
133a(4)21(4)
30114(4)123a12320
11310
1120
701056686
13612111810385
170153153120188154132
1.21.02.53.21.22.81.11.6
5.0µL1.3
5.0µL10.0µL5.0µL
10.0µL10.0µL5.0µL
343642746748
113216650
1384553326740668090617490
147507445
15650159507278
15193050296124302940336433687032
(1) If necessary, correct the µg added for the purity of the calibration component previously established.(2) Values shown are for illustration; exact values are determined in Section 9.1 step f of the General Procedure.(3) Column to be filled in (Section 9.1 step g of the General Procedure) after determining ppm present in stock R-11 (see Note 1 in
Section 9.6 of the General Procedure).(4) These impurities are gases at ambient room temperature; the others are liquids with low boiling points.
Table 3. Retention Time Data for Identified ImpuritiesNot Normally Observed
Impurity Retention Time (Min.)
32(1)1114C3H8
2.374.108.00
(1)Coelutes with R-23. To separate, attach 30.5 cm section of Porapak-T column to detector end of columnand chromatograph (R-23 elutes first).
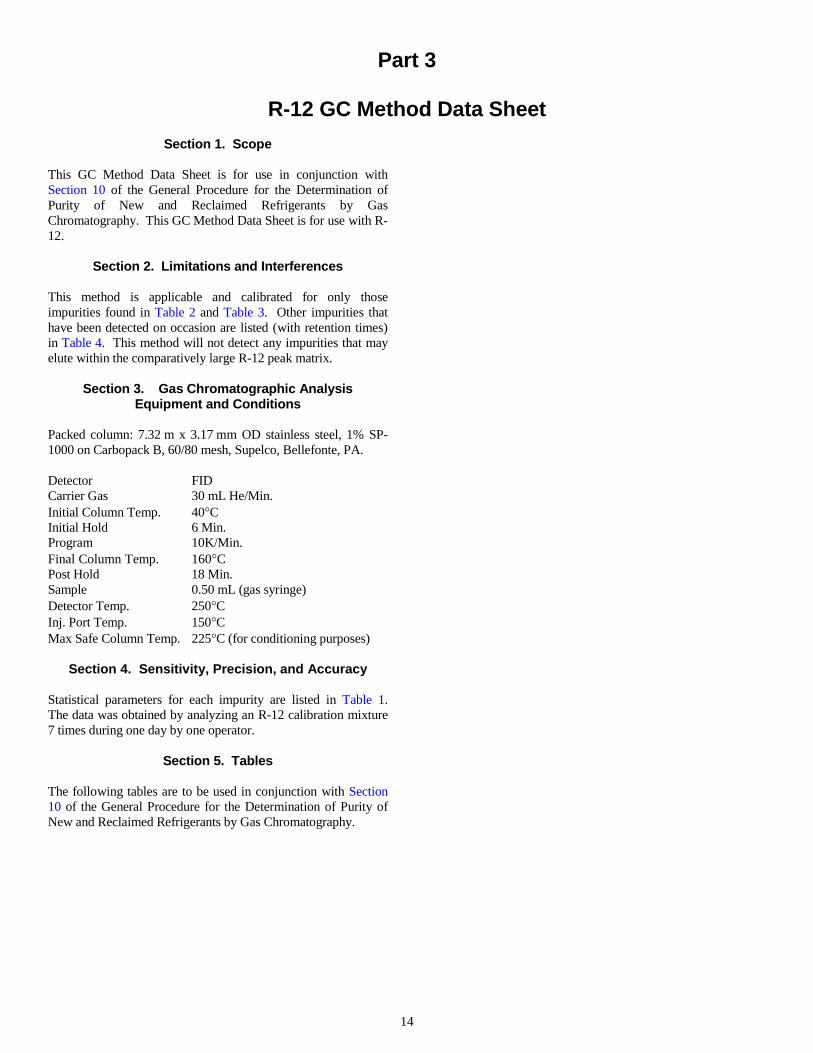
14
Part 3
R-12 GC Method Data Sheet
Section 1. Scope
This GC Method Data Sheet is for use in conjunction withSection 10 of the General Procedure for the Determination ofPurity of New and Reclaimed Refrigerants by GasChromatography. This GC Method Data Sheet is for use with R-12.
Section 2. Limitations and Interferences
This method is applicable and calibrated for only thoseimpurities found in Table 2 and Table 3. Other impurities thathave been detected on occasion are listed (with retention times)in Table 4. This method will not detect any impurities that mayelute within the comparatively large R-12 peak matrix.
Section 3. Gas Chromatographic AnalysisEquipment and Conditions
Packed column: 7.32 m x 3.17 mm OD stainless steel, 1% SP-1000 on Carbopack B, 60/80 mesh, Supelco, Bellefonte, PA.
Detector FIDCarrier Gas 30 mL He/Min.Initial Column Temp. 40°CInitial Hold 6 Min.Program 10K/Min.Final Column Temp. 160°CPost Hold 18 Min.Sample 0.50 mL (gas syringe)Detector Temp. 250°CInj. Port Temp. 150°CMax Safe Column Temp. 225°C (for conditioning purposes)
Section 4. Sensitivity, Precision, and Accuracy
Statistical parameters for each impurity are listed in Table 1.The data was obtained by analyzing an R-12 calibration mixture7 times during one day by one operator.
Section 5. Tables
The following tables are to be used in conjunction with Section10 of the General Procedure for the Determination of Purity ofNew and Reclaimed Refrigerants by Gas Chromatography.

15
Figure 1. Gas Chromatogram of R-12

16
Table 1. Component Statistical Parameters
ComponentDetection
Limit, ppmConcentration
Investigated, ppmPrecision at 95% Confidence
Limit, ppmRelative Mean
Error, %
Methane23
C2H4
C2H6
13143a152a140134a22
C3H6
115142b124133a21
isobutane114
n-butane2-butene-T
11123
2-butanolMEK113
n-pentane
0.52
0.50.5311112
0.521112
0.52
0.50.542222
0.5
52555
3025302045655
115202535502050205
40352025305
0.070.540.130.100.470.300.630.370.271.750.101.670.230.370.230.830.230.830.180.060.871.050.330.470.870.25
4.00-2.30-5.60-4.10-3.803.301.672.30-3.302.733.371.80-1.331.831.831.80-2.772.03-3.33-3.801.05-4.731.60-2.33-4.00-3.73
Table 2. Primary Calibration Standard Components
Component Mol. Wt.Vol.
Added, µLµg
Added (1)ppm
Added (2)Total ppmpresent (3)
Methane23
C2H4
C2H6
13143a152a40
134a22
C3H6
115142b124133a21
isobutane114
n-butane2-butene-T
11(4)123(4)
MEK(4)113(4)
2-butanol(4)n-pentane(4)
16702830
104846650
1028642
15410013611810358
1705856
13715372
1887472
202212112020302830508
50151220322520256
13.163.013.713.585.468.881.057.8125.1176.913.7315.961.767.097.0134.759.3139.859.313.7(5)(5)(5)(5)(5)(5)
523553125302146645
11522243549225122557381727215
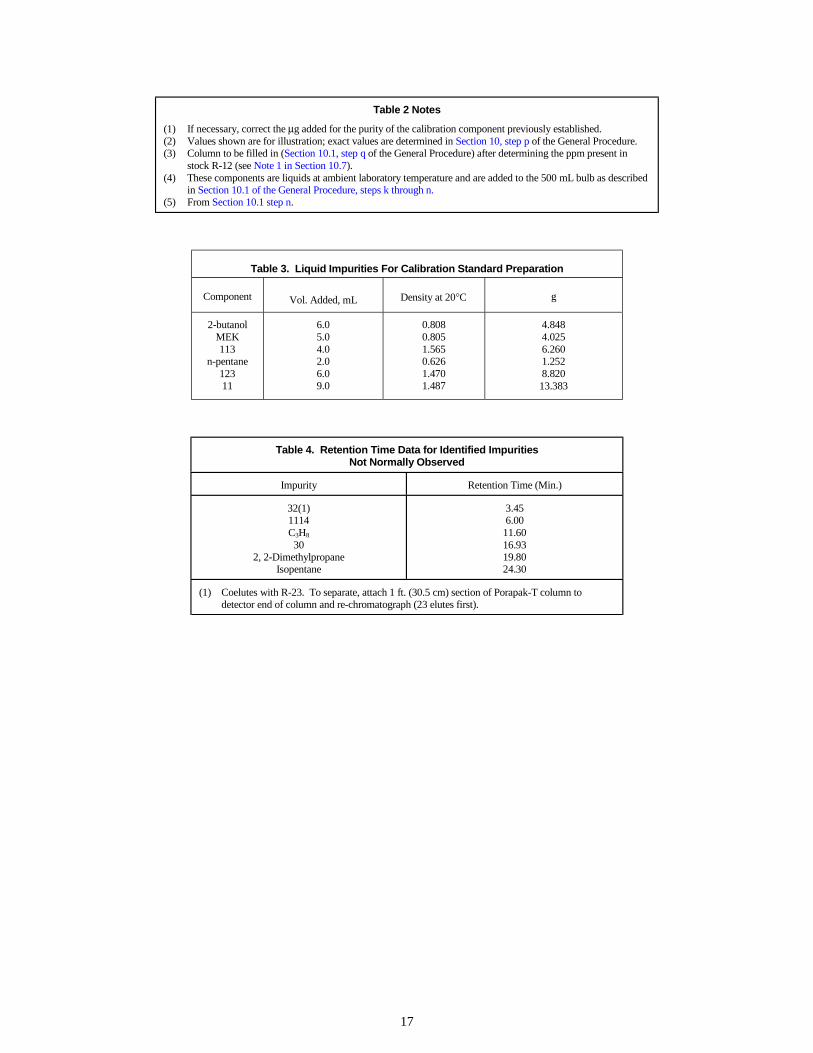
17
Table 2 Notes
(1) If necessary, correct the µg added for the purity of the calibration component previously established.(2) Values shown are for illustration; exact values are determined in Section 10, step p of the General Procedure.(3) Column to be filled in (Section 10.1, step q of the General Procedure) after determining the ppm present in
stock R-12 (see Note 1 in Section 10.7).(4) These components are liquids at ambient laboratory temperature and are added to the 500 mL bulb as described
in Section 10.1 of the General Procedure, steps k through n.(5) From Section 10.1 step n.
Table 3. Liquid Impurities For Calibration Standard Preparation
Component Vol. Added, mL Density at 20°C g
2-butanolMEK113
n-pentane12311
6.05.04.02.06.09.0
0.8080.8051.5650.6261.4701.487
4.8484.0256.2601.2528.82013.383
Table 4. Retention Time Data for Identified ImpuritiesNot Normally Observed
Impurity Retention Time (Min.)
32(1)1114C3H8
302, 2-Dimethylpropane
Isopentane
3.456.00
11.6016.9319.8024.30
(1) Coelutes with R-23. To separate, attach 1 ft. (30.5 cm) section of Porapak-T column todetector end of column and re-chromatograph (23 elutes first).

18
Part 4
R-13 GC Method Data Sheet
Section 1. Scope
This GC Method Data Sheet is for use in conjunction withSection 11 of the General Procedure for the Determination ofPurity of New and Reclaimed Refrigerants by GasChromatography. This GC Method Data Sheet is for use with R-13.
Section 2. Limitations and Interferences
This method is applicable and calibrated for only thoseimpurities found in Table 2. This method will not detect anyimpurities that may elute within the comparatively large R-13peak matrix.
Section 3. Gas Chromatographic AnalysisEquipment and Conditions
Packed column: 7.32 m x 3.17 mm OD stainless steel, 1% SP-1000 on Carbopack B, 60/80 mesh, Supelco, Bellefonte, PA.
Detector TCD, Low Sensitivity*Carrier Gas 30 mL He/Min.Initial Column Temp. 40°CInitial Hold 6 Min.Program 10K/Min.Final Column Temp. 160°CPost Hold 4 Min.Sample 2.0 mL (gas syringe)Detector Temp. 200°CInj. Port Temp. 150°CMax Safe Column Temp. 225°C (for conditioning purposes)
*See Note 5 in Section 11.6.
Section 4. Sensitivity, Precision, and Accuracy
Statistical parameters for each impurity are listed in Table 1.The data was obtained by analyzing an R-13 calibration mixture7 times during one day by one operator.
Section 5. Tables
The following tables are to be used in conjunction with Section11 of the General Procedure for the Determination of Purity ofNew and Reclaimed Refrigerants by Gas Chromatography.

19
Figure 1. Gas Chromatogram of R-13

20
Table 1. Component Statistical Parameters
ComponentDetection
Limit, ppmConcentration
Investigated, ppmPrecision at 95%
Confidence Limit, ppmRelative Mean
Error, %
1423
1161252231
11512
11411
12101412101012101212
300200250150175100200200100100
7.22.73.16.65.32.64.73.66.33.1
1.7-1.01.3-2.02.32.0-2.02.54.0-2.0
Table 2. Primary Calibration Standard Components
Component Mol. Wt.Vol.
Added, mLgrams
Added (1)ppm
Added (2)Total ppmPresent (3)
1423
1161252231
11512
11411 (4)
8870
13812086.568
154.5121171
137.4
10.010.05.05.010.05.05.08.03.04.0
0.03400.02860.02820.02450.03540.01390.03160.03960.02100.0225
22719118816323693211264140150
(1) If necessary, correct the grams added for the purity of the calibration component previously established.(2) Values shown are for illustration; exact values are determined in Section 11.1 step o of the General Procedure.(3) Column to be filled in (Section 11.1, step p of the General Procedure) after determining ppm present in stock R-13 (see Note 1 in Section
11.6).(4) Added by warming an uncapped vial of the liquid component to enrich the headspace vapor, capping, cooling, then removing headspace vapor
via a gas syringe.
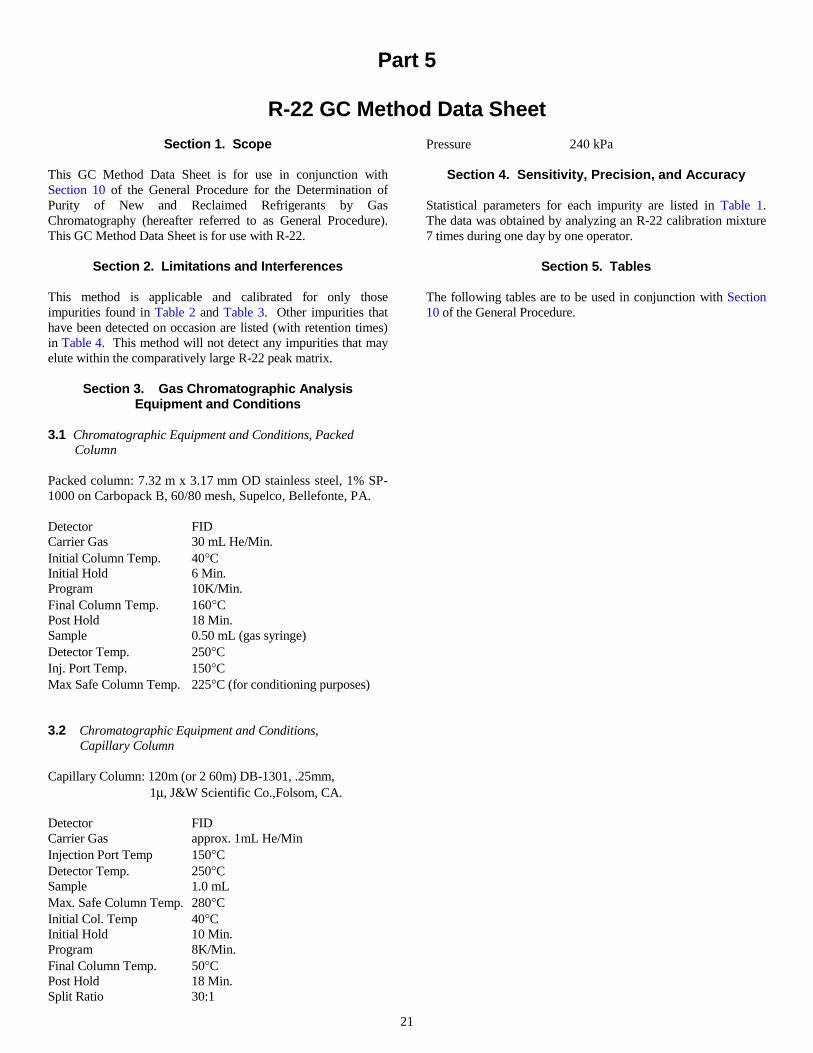
21
Part 5
R-22 GC Method Data Sheet
Section 1. Scope
This GC Method Data Sheet is for use in conjunction withSection 10 of the General Procedure for the Determination ofPurity of New and Reclaimed Refrigerants by GasChromatography (hereafter referred to as General Procedure).This GC Method Data Sheet is for use with R-22.
Section 2. Limitations and Interferences
This method is applicable and calibrated for only thoseimpurities found in Table 2 and Table 3. Other impurities thathave been detected on occasion are listed (with retention times)in Table 4. This method will not detect any impurities that mayelute within the comparatively large R-22 peak matrix.
Section 3. Gas Chromatographic AnalysisEquipment and Conditions
3.1 Chromatographic Equipment and Conditions, Packed Column
Packed column: 7.32 m x 3.17 mm OD stainless steel, 1% SP-1000 on Carbopack B, 60/80 mesh, Supelco, Bellefonte, PA.
Detector FIDCarrier Gas 30 mL He/Min.Initial Column Temp. 40°CInitial Hold 6 Min.Program 10K/Min.Final Column Temp. 160°CPost Hold 18 Min.Sample 0.50 mL (gas syringe)Detector Temp. 250°CInj. Port Temp. 150°CMax Safe Column Temp. 225°C (for conditioning purposes)
3.2 Chromatographic Equipment and Conditions, Capillary Column
Capillary Column: 120m (or 2 60m) DB-1301, .25mm,1µ, J&W Scientific Co.,Folsom, CA.
Detector FIDCarrier Gas approx. 1mL He/MinInjection Port Temp 150°CDetector Temp. 250°CSample 1.0 mLMax. Safe Column Temp. 280°CInitial Col. Temp 40°CInitial Hold 10 Min.Program 8K/Min.Final Column Temp. 50°CPost Hold 18 Min.Split Ratio 30:1
Pressure 240 kPa
Section 4. Sensitivity, Precision, and Accuracy
Statistical parameters for each impurity are listed in Table 1.The data was obtained by analyzing an R-22 calibration mixture7 times during one day by one operator.
Section 5. Tables
The following tables are to be used in conjunction with Section10 of the General Procedure.

22
Figure 1. Gas Chromatogram of R-22

23
Figure 2. Capillary Column Gas Chromatogram of R-22 for Determination of R-31 Impurity

24
Table 1. Component Statistical Parameters
ComponentDetection
Limit, ppmConcentration
Investigated, ppmPrecision at 95%
Confidence Limit, ppmRelative Mean
Error, %
CH4
23C2H4
C2H6
13143a152a40
134a31(1)C3H6
11512
142b124133a21
isobutane114
n-butane2-butene-T
11123a123113
0.52
0.50.5311112
0.5221112
0.52
0.50.54222
52055
3025402550405
80100203035601035105
40153025
0.100.880.080.050.470.670.830.870.503.330.133.052.880.170.450.831.330.131.330.130.051.671.331.671.33
4.71.7-6.2-5.77-3.331.7
-0.67-2.45-1.07-4.675.7-0.82.41.072.071.87-3.8-4.31.8-4.3-5.32.87-3.67-2.331.87
(1) In absence of n-butane.
Table 2. Primary Calibration Standard Components
Component Mol. Wt.Vol.
Added, µLµg
Added (1)ppm
Added (2)Total ppmPresent (3)
Methane23
C2H4
C2H6
13143a152a40
134a31
C3H6
11512
142b124133a21
isobutane114
n-butane2-butene-T
11(4)123a(4)123(4)113(4)
16702830
104846650
1026842
15412110013611810358
1705856
137153153188
151510101515302525285
2540101015301010105
9.843.011.412.364.051.681.051.6
104.378.58.6
158.0197.841.155.872.8
126.323.769.923.711.4(5)(5)(5)(5)
52266332641265340480
100212837641236126
133367047
See Table 2 Notes below.

25
Table 2 Notes
(1) If necessary, correct the µg added for the purity of the calibration component previously established.(2) Values shown are for illustration; exact values are determined in Section 10, step p of the General Procedure.(3) Column to be filled in (Section 10, step q of the General Procedure) after determining the ppm present in stock
R-22 (see Note 1 in Section 10).(4) These components are liquids at ambient laboratory temperature and are added to the 500-mL bulb as described
in Section 10.1 of the General Procedure, steps k through n.(5) From Section 10.1 step n.
Table 3. Liquid Impurities for Calibration Standard Preparation
Component Volume Added, mL Density At 20°C g
113123123a11
58415
1.5651.4701.4921.487
7.82511.765.96822.305
Table 4. Additional Impurities Observed in R-22
ImpurityPacked Column
Retention Time (Min.)
32(1)1114
Propane124a30
CCl4pentane
2.76.011.714.817.026.827.0
(1) Coelutes with R-23 on packed column; to separate, attach 1 foot (30.5 cm)section of Porapak-T column to detector end of column and re-chromatograph (23 elutes first).

26
Part 6
R-23 GC Method Data Sheet
Section 1. Scope
This GC Method Data Sheet is for use in conjunction withSection 11 of the General Procedure for the Determination ofPurity of New and Reclaimed Refrigerants by GasChromatography (hereafter referred to as General Procedure).This GC Method Data Sheet is for use with R-23.
Section 2. Limitations and Interferences
This method is applicable and calibrated for only thoseimpurities found in Table 2. This method will not detect anyimpurities that may elute within the comparatively large R-23peak matrix.
Section 3. Gas Chromatographic AnalysisEquipment and Conditions
Packed column: 6.09 m x 3.17 mm OD stainless steel, Porapak-T, 80/100 mesh, Supelco, Bellefonte, PA.
Detector TCD, Low Sensitivity*Carrier Gas 15 mL He/Min.Initial Column Temp. 40°CInitial Hold 3 Min.Program 18 K/Min.Final Column Temp. 175°CPost Hold 10 Min.Sample 2.0 mL (gas syringe)Detector Temp. 200°CInj. Port Temp. 150°CMax Safe Column Temp. 190°C (for conditioning purposes)
* See Note 5 in Section 11.6 of the General Procedure.
Section 4. Sensitivity, Precision, and Accuracy
Statistical parameters for each impurity are listed in Table 1.The data was obtained by analyzing an R-23 calibration mixture7 times during one day by one operator.
Section 5. Tables
The following tables are to be used in conjunction with Section11 of the General Procedure for the Determination of Purity ofNew and Reclaimed Refrigerants by Gas Chromatography.

27
Figure 1. Gas Chromatogram of R-23

28
Table 1. Component Statistical Parameters
ComponentDetection
Limit, ppmConcentration
Investigated, ppmPrecision at 95%
Confidence Limit, ppmRelative Mean
Error, %
141161332
13B1122231
101510510555
200350400150120160450175
1.775.805.101.935.873.673.901.60
-0.40-0.850.601.40-1.050.880.32-1.37
Table 2. Calibration Standard Components
Component Mol. Wt.Vol.
Added, mLµg
Added (1)ppm
Added (2)Total ppmPresent (3)
141161322323112
13B1
8813810486.55268
121149
10.010.020.020.010.010.06.05.0
0.03600.05640.08510.07090.02130.02780.02970.0305
180282426355107139149153
(1) If necessary, correct the grams added for the purity of the calibration component previously established.(2) Values shown are for illustration; exact values are determined at Section 11.1 step o of the General Procedure.(3) Column to be filled in (Section 11.1, step p of the General Procedure) after determining the ppm present in stock
R-23 (see Note 1 of Section 11.6 of the General Procedure).

29
Part 7
R-32 GC Method Data Sheet
Section 1. Scope
This GC Method Data Sheet is for use in conjunction withSection 10 of the General Procedure for the Determination ofPurity of New and Reclaimed Refrigerants by GasChromatography (hereafter referred to as General Procedure).This GC Method Data Sheet is for use with R-32.
Section 2. Limitations and Interferences
This method is applicable and calibrated for only thoseimpurities found in Table 2. Other impurities that have beendetected on occasion are listed (with retention times) in Table 4.This method will not detect any impurities that may elute withinthe comparatively large R-32 peak matrix.
Section 3. Gas Chromatographic AnalysisEquipment and Conditions
3.1 Chromatographic Equipment and Conditions, Packed Column
Packed column: 4.88 m x 3.17 mm OD stainless steel, 1% SP-1000 on Carbopack B, 60/80 mesh, Supelco, Bellefonte, PA.
Detector FIDCarrier Gas 20 mL He/Min.Initial Column Temp. 45°CInitial Hold 8 Min.Program 8 K/Min.Final Column Temp. 150°CPost Hold 15 Min.Sample 1.0 mL (gas syringe)Detector Temp. 200°CInj. Port Temp. 200°CMax Safe Column Temp. 225°C (for conditioning purposes)
3.2 Chromatographic Equipment and Conditions, Capillary Column
Capillary Column: 120m (or 2-60m) DB-1301, 0.25mm,1µ, J&W Scientific Co.,Folsom, CA.
Detector FIDCarrier Gas approx. 1mL He/MinInjection Port Temp 150°CDetector Temp. 250°CSample 1.5 mLMax. Safe Column Temp. 280°CInitial Col. Temp -28°CInitial Hold 10 Min.Program 5K/Min.Final Column Temp. 40°CPost Hold 5 Min.Split Ratio 30:1
Pressure 200 kPaMakeup Gas 30 mL He/Min.
See Note 5 of Section 10.7 of the General Procedure for theDetermination of Purity of New and Reclaimed Refrigerants byGas Chromatography.
Section 4. Sensitivity, Precision, and Accuracy
Statistical parameters for each impurity are listed in Table 1.The data was obtained by analyzing an R-32 calibration mixture7 times during one day by one operator.
Section 5. Tables
The following tables are to be used in conjunction with Section10 of the General Procedure for the Determination of Purity ofNew and Reclaimed Refrigerants by Gas Chromatography.
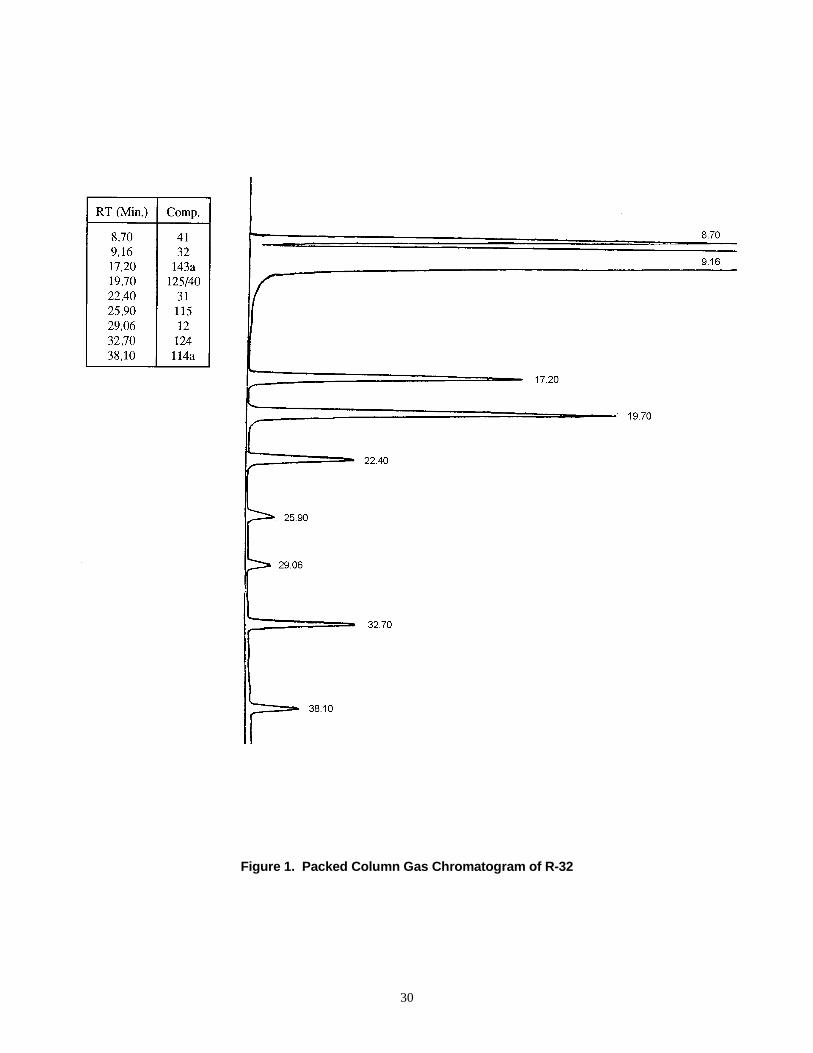
30
Figure 1. Packed Column Gas Chromatogram of R-32

31
Figure 2. Capillary Gas Chromatogram of R-32
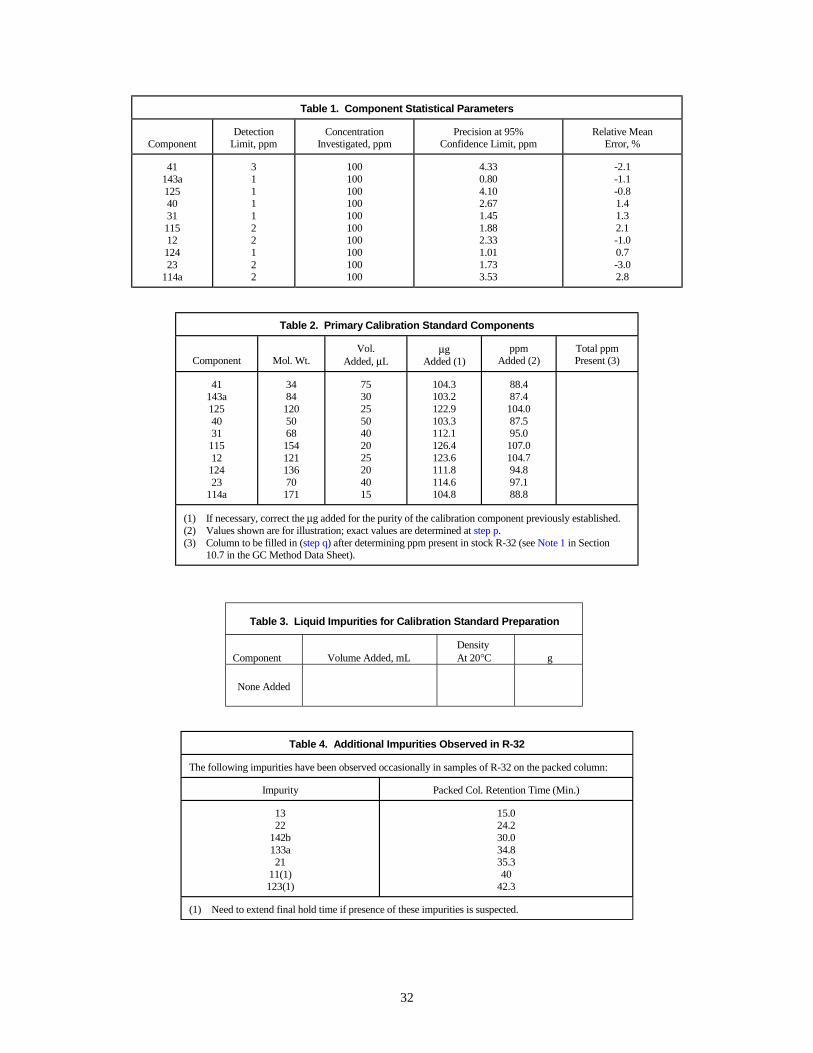
32
Table 1. Component Statistical Parameters
ComponentDetection
Limit, ppmConcentration
Investigated, ppmPrecision at 95%
Confidence Limit, ppmRelative Mean
Error, %
41143a12540311151212423
114a
3111122122
100100100100100100100100100100
4.330.804.102.671.451.882.331.011.733.53
-2.1-1.1-0.81.41.32.1-1.00.7-3.02.8
Table 2. Primary Calibration Standard Components
Component Mol. Wt.Vol.
Added, µLµg
Added (1)ppm
Added (2)Total ppmPresent (3)
41143a1254031
11512
12423
114a
3484120506815412113670171
75302550402025204015
104.3103.2122.9103.3112.1126.4123.6111.8114.6104.8
88.487.4
104.087.595.0
107.0104.794.897.188.8
(1) If necessary, correct the µg added for the purity of the calibration component previously established.(2) Values shown are for illustration; exact values are determined at step p.(3) Column to be filled in (step q) after determining ppm present in stock R-32 (see Note 1 in Section
10.7 in the GC Method Data Sheet).
Table 3. Liquid Impurities for Calibration Standard Preparation
Component Volume Added, mL Density At 20°C g
None Added
Table 4. Additional Impurities Observed in R-32
The following impurities have been observed occasionally in samples of R-32 on the packed column:
Impurity Packed Col. Retention Time (Min.)
1322
142b133a21
11(1)123(1)
15.024.230.034.835.340
42.3
(1) Need to extend final hold time if presence of these impurities is suspected.

33
Part 8
R-113 GC Method Data Sheet
Section 1. Scope
This GC Method Data Sheet is for use in conjunction withSection 9 of the General Procedure for the Determination ofPurity of New and Reclaimed Refrigerants by GasChromatography (hereafter referred to as General Procedure).This GC Method Data Sheet is for use with R-113.
Section 2. Limitations and Interferences
This method is applicable and calibrated for only thoseimpurities found in Table 2. This method will not detect anyimpurities that may elute within the comparatively large R-113peak matrix.
Section 3. Gas Chromatographic AnalysisEquipment and Conditions
Capillary column: 105m x 0.25 mm, 1.0µ, Rtx-1301, Restek Corp., 110 Benner Circle, Bellefonte, PA.
Detector FIDCarrier Gas approx. 1 mL He/Min.Initial Column Temp. 35°CInitial Hold 10 Min.Program 8 K/Min.Final Column Temp. 160°CPost Hold 8 Min.Sample 2 µL (liquid syringe)Detector Temp. 250°CInj. Port Temp. 200°CMax Safe Column Temp. 280°C (for conditioning purposes)Split Ratio 30:1Aux. Flow 30 mL/Min.Pressure 200 kPa
Section 4. Sensitivity, Precision, and Accuracy
Statistical parameters for each impurity are listed in Table 1.The data was obtained by analyzing an R-113 calibration mixture7 times during one day by one operator.
Section 5. Tables
The following tables are to be used in conjunction with Section 9of the General Procedure for the Determination of Purity of Newand Reclaimed Refrigerants by Gas Chromatography.

34
Figure 1. Gas Chromatogram of R-113

35
Table 1. Component Statistical Parameters
ComponentDetection
Limit, ppmConcentration
Investigated, ppmPrecision at 95%
Confidence Limit, ppmRelative Mean
Error, %
11511131222
114216ba133a1112a
11C-316bb
123a123
225da318mbb
12210
11211201110
52
1055212
152221225322
5060707040505020120305050303080100753030
1.22.30.80.80.72.50.70.34.16.81.31.50.90.82.34.72.51.41.7
1.3-0.7-1.21.00.8-1.9-2.3-3.30.8-1.1-2.5-1.1-2.1-0.70.42.6-1.10.30.8
Table 2. Primary Calibration Standard Components
Component Mol. Wt.Vol.
Added, mLµg
Added (1)ppm
Added (2)Total ppmPresent (3)
115(4)1113(4)12(4)22(4)114(4)216ba
133a(4)1112a(4)
11123a123
225da318mbb
122C-316bb
112TCEPCE10
15411612186171221118133137153153203271169233204131166154
2.03.03.55.01.5
8 µL2.50.8
20 µL8 µL8 µL5 µL5 µL5 µL5 µL
--5 µL5 µL
15 µL
1265314294173361769010502127221213743492900011984119847782840077237650200007278815623925
5360727444535018
121505032353232833034
100
(1) If necessary, correct the µg added for the purity of the calibration component previously established.(2) Values shown are for illustration; exact values are determined at Section 9.1 step f of the General
Procedure.(3) Column to be filled in (Section 9.1, step g of the General Procedure) after determining ppm present in
stock R-113 (see Note 1 in Section 9.6 of the General Procedure).(4) These impurities are gases at ambient room temperature, the others are liquids with low boiling points.
For 1112a, warm the vial or cylinder and sample the headspace vapor.

36
Part 9
R-114 GC Method Data Sheet
Section 1. Scope
This GC Method Data Sheet is for use in conjunction withSection 10 of the General Procedure for the Determination ofPurity of New and Reclaimed Refrigerants by GasChromatography (hereafter referred to as General Procedure).This GC Method Data Sheet is for use with R-114.
Section 2. Limitations and Interferences
This method is applicable and calibrated for only thoseimpurities found in Table 2 and Table 3. This method will notdetect any impurities that may elute within the comparativelylarge R-114 peak matrix.
Section 3. Gas Chromatographic AnalysisEquipment and Conditions
Packed column: 7.32 m x 3.17 mm OD stainless steel, 1% SP-1000 on Carbopack B, 60/80 mesh, Supelco, Bellefonte, PA.
Detector FIDCarrier Gas 30 mL He/Min.Initial Column Temp. 40°CInitial Hold 6 Min.Program 10K/Min.Final Column Temp. 175°CPost Hold 18 Min.Sample 0.50 mL (gas syringe)Detector Temp. 250°CInj. Port Temp. 200°CMax Safe Column Temp. 225°C (for conditioning purposes)
Section 4. Sensitivity, Precision, and Accuracy
Statistical parameters for each impurity are listed in Table 1.The data was obtained by analyzing an R-114 calibration mixture7 times during one day by one operator.
Section 5. Tables
The following tables are to be used in conjunction with Section10 of the General Procedure.

37
Figure 1. Gas Chromatogram of R-114
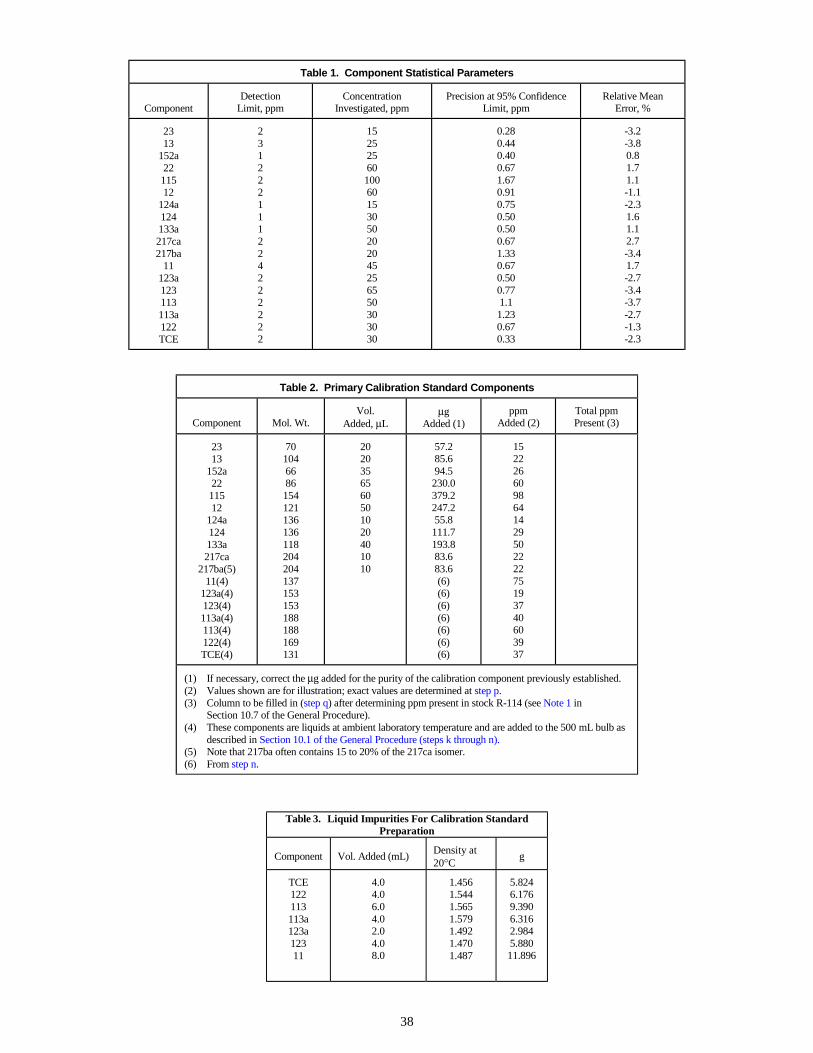
38
Table 1. Component Statistical Parameters
ComponentDetection
Limit, ppmConcentration
Investigated, ppmPrecision at 95% Confidence
Limit, ppmRelative Mean
Error, %
2313
152a2211512
124a124133a217ca217ba
11123a123113113a122TCE
231222111224222222
1525256010060153050202045256550303030
0.280.440.400.671.670.910.750.500.500.671.330.670.500.771.11.230.670.33
-3.2-3.80.81.71.1-1.1-2.31.61.12.7-3.41.7-2.7-3.4-3.7-2.7-1.3-2.3
Table 2. Primary Calibration Standard Components
Component Mol. Wt.Vol.
Added, µLµg
Added (1)ppm
Added (2)Total ppmPresent (3)
2313
152a2211512
124a124133a217ca
217ba(5)11(4)
123a(4)123(4)113a(4)113(4)122(4)TCE(4)
701046686154121136136118204204137153153188188169131
2020356560501020401010
57.285.694.5
230.0379.2247.255.8
111.7193.883.683.6(6)(6)(6)(6)(6)(6)(6)
152226609864142950222275193740603937
(1) If necessary, correct the µg added for the purity of the calibration component previously established.(2) Values shown are for illustration; exact values are determined at step p.(3) Column to be filled in (step q) after determining ppm present in stock R-114 (see Note 1 in
Section 10.7 of the General Procedure).(4) These components are liquids at ambient laboratory temperature and are added to the 500 mL bulb as
described in Section 10.1 of the General Procedure (steps k through n).(5) Note that 217ba often contains 15 to 20% of the 217ca isomer.(6) From step n.
Table 3. Liquid Impurities For Calibration StandardPreparation
Component Vol. Added (mL)Density at20°C
g
TCE122113113a123a12311
4.04.06.04.02.04.08.0
1.4561.5441.5651.5791.4921.4701.487
5.8246.1769.3906.3162.9845.88011.896

39
Part 10
R-123 GC Method Data Sheet
Section 1. Scope
This GC Method Data Sheet is for use in conjunction withSection 9 of the General Procedure for the Determination ofPurity of New and Reclaimed Refrigerants by GasChromatography (hereafter referred to as General Procedure).This GC Method Data Sheet is for use with R-123.
Section 2. Limitations and Interferences
This method is applicable and calibrated for only thoseimpurities found in Table 2. Other impurities that have beendetected on occasion are listed (with retention times) in Table 3.This method will not detect any impurities that may elute withinthe comparatively large R-123 peak matrix. The packed columnis necessary because 123a, 113 and 113a all nearly coelute on thecapillary column. The other impurities do not interfere withthese isomers on the packed column.
Section 3. Gas Chromatographic AnalysisEquipment and Conditions
3.1 Chromatographic Equipment and Conditions, Packed Column
Packed column: 7.32 m x 3.17 mm OD stainless steel, 1% SP-1000 on Carbopack B, 60/80 mesh, Supelco, Bellefonte, PA.
Detector FIDCarrier Gas 40 mL He/Min.Column Temp. 125°C (isothermal)Sample 2.0 µL (liquid syringe)Detector Temp. 250°CInj. Port Temp. 150°CMax Safe Column Temp. 225°C (for conditioning purposes)
Externally cool the syringe to 10°C before sampling.
3.2 Chromatographic Equipment and Conditions, Capillary Column
Capillary Column: 120m (Connect the below two columns together with the DB-1701 column end
attached to the injection port):
1. 60m DB-1701, 0.25mm, 1µ, J&W Scientific Co., FolsomCA.
2. 60m SPB-5, 0.32 mm, 1µ, Supelco, Bellefonte, PA.
Detector FIDCarrier Gas approx. 1mL He/MinInjection Port Temp 150°CDetector Temp. 250°CSample 2µlMax. Safe Column Temp. 280°C
Initial Col. Temp 15°C ???Initial Hold 10 Min.Program 7K/Min.Final Column Temp. 60°CPost Hold 22 Min.Split Ratio 50:1Pressure 200 kPaMakeup Gas 20 mL He/Min.
Section 4. Sensitivity, Precision, and Accuracy
Statistical parameters for each impurity are listed in Table 1.The data was obtained by analyzing an R-123 calibration mixture7 times during one day by one operator.
Section 5. Tables
The following tables are to be used in conjunction with Section 9of the General Procedure.

40
Figure 1. Packed Column Gas Chromatogram of R-123
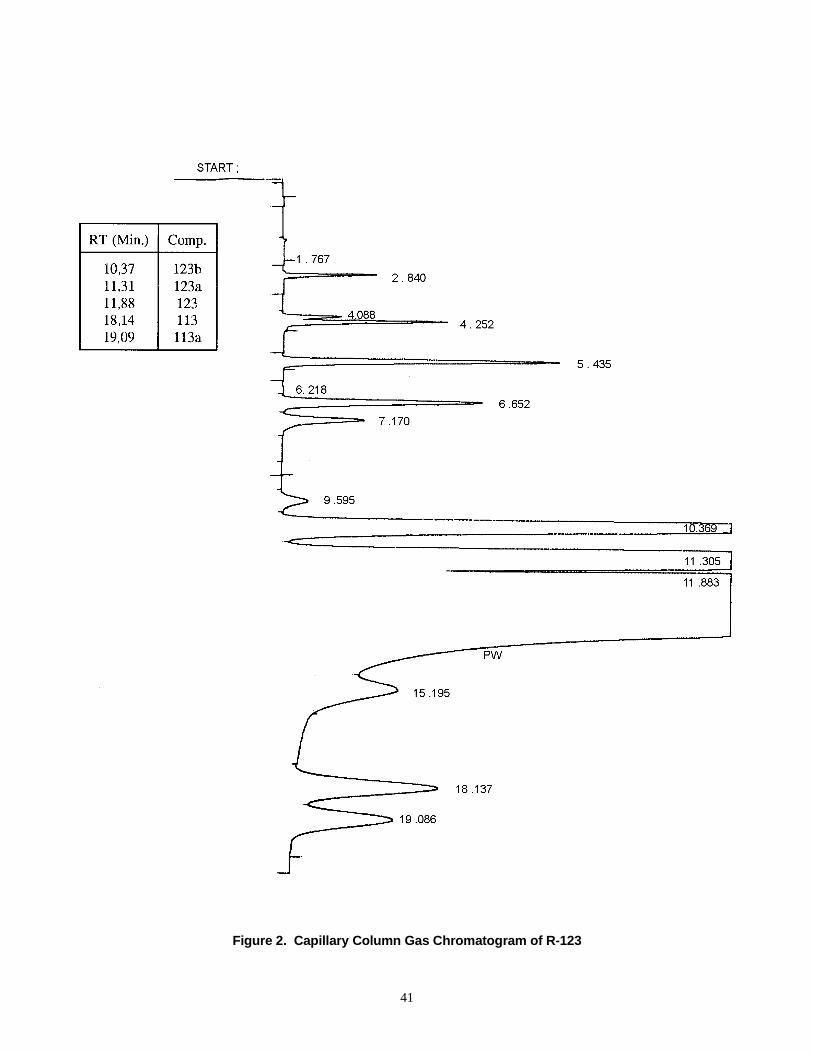
41
Figure 2. Capillary Column Gas Chromatogram of R-123

42
Table 1. Component Statistical Parameters
Component ECN (1)Detection
Limit, ppmConcentration
Investigated, ppmPrecision at 95%
Confidence Limit, ppmRelation Mean
Error, %
11131222
1141317mx
31216ba
1326mxz133a
114B11112a1112123a123b1130
113113a1111
1.690.350.401.043.630.922.163.651.930.951.641.641.841.800.430.631.601.681.90
1322111112112232332
2525255030102015405025155%4006050
30025015
0.370.370.241.200.880.520.670.330.670.800.300.27
0.13%12.72.201.107.307.000.67
0.95-1.11.4-2.1
4.3(2)2.2-1.80.71.92.4-0.7-0.50.30
--1.80.3-0.2
-0.150.8
(1) Effective Carbon Numbers (ECN) determined experimentally or estimated (see J. Chromatog. Sci., 30, 280 and 301 (1992).)(2) Combining both isomers.
Table 2. Primary Calibration Standard Components
Component Mol. Wt.Vol.
Added, mLµg
Added (1)ppm
Added (2)Total ppmPresent (3)
11131222
1141317mx(4)
31216ba(5)1326mxz
133a114B1(4)
1112a1112123a
123b
11(4)30(4)113(4)113a(4)1111(4)
1161218617021668221198118215133133153
153
13785188188149
1.001.001.501.50
6.0 µL0.750.500.401.80
6.0 µL1.000.50
Refer to Note 4in Section 9.6
Refer to Note 4in Section 9.6
10.0 µL10.0 µL50 µL50 µL6.0 µL
476549465307
1045492892101451732708720
1110954502725
Refer to Note 4in Section 9.6
Refer to Note 4in Section 9.6
148691336078795789869279
22232448
41(6)10211540492513
1-7%
200-700
6559
36136241
(1) If necessary, correct the µg added for the purity of the calibration component previously established.(2) Values shown are for illustration; exact values are determined at step f.(3) Column to be completed (Section 9.1, step g of the General Procedure) after determining ppm present in stock R-
123 (see Notes 1 and 4 in Section 9.6 of the General Procedure).(4) Add by syringe injection of the liquid.(5) Although other 216 isomers comprise the usual 216 peak multiplet, the 216ba isomer (available) is used for
calibration purposes.(6) The 1317mx will resolve into the cis and trans isomer peaks with a ratio of one to two, respectively.

43
Table 3. Additional Impurities Observed in R-123,Quantitation by Effective Carbon Number Method
1. Additional impurities observed in samples of R-123 are as follows:
ImpurityCapillary Column
Retention Times (Min.)Effective Carbon
Numbers (1)
1132125134a114a124a1122124
328lcc ether (2)114aB1
141b1121132b
1130-T123B1122b122a122112a
9.189.469.8
11.2211.5611.5711.7714.5915.019.923.025.3525.6428.7236.2837.2438.043.55
2.00.791.671.171.271.761.333.90.82.01.751.92.251.701.751.751.761.48
(1) Refer to References (see J. Chromatog. Sci., 30, 280 and 301 , (1992).)(2) Structure tentatively identified as: CHClF-CF2-O-CF2-CF3.
2. Quantitation by ECN Method
Select a nearby peak in the chromatogram whose identification and response factor (RF) have been established (the Internal Standard).
Then:
RFI = ECNr x MWi
ECNI MWr
Where: RF = either absolute or Relative Response Factor.MWi = molecular weight of the component to be determined.MWr = molecular weight of the Internal Standard Reference.

44
Part 11
R-124 GC Method Data Sheet
Section 1. Scope
This GC Method Data Sheet is for use in conjunction withSection 10 of the General Procedure for the Determination ofPurity of New and Reclaimed Refrigerants by GasChromatography (hereafter referred to as General Procedure).This GC Method Data Sheet is for use with R-124.
Section 2. Limitations and Interferences
This method is applicable and calibrated for only thoseimpurities found in Table 2 and Table 3. Other impurities thathave been detected on occasion are listed (with retention times)in Table 4. This method will not detect any impurities that mayelute within the comparatively large R-124 peak matrix.
Section 3. Gas Chromatographic AnalysisEquipment and Conditions
Packed column: 7.32 m x 3.17 mm OD stainless steel, 1% SP-1000 on Carbopack B, 60/80 mesh, Supelco, Bellefonte, PA.
Detector FIDCarrier Gas 40 mL He/Min.Initial Column Temp. 40°CInitial Hold 10 Min.Program 10K/Min.Final Column Temp. 160°CPost Hold 18 Min.Sample 0.30 mL (gas syringe)Detector Temp. 250°CInj. Port Temp. 150°CMax Safe Column Temp. 225°C (for conditioning purposes)
Section 4. Sensitivity, Precision, and Accuracy
Statistical parameters for each impurity are listed in Table 1.The data was obtained by analyzing an R-124 calibration mixture7 times during one day by one operator.
Section 5. Tables
The following tables are to be used in conjunction with Section10 of the General Procedure.
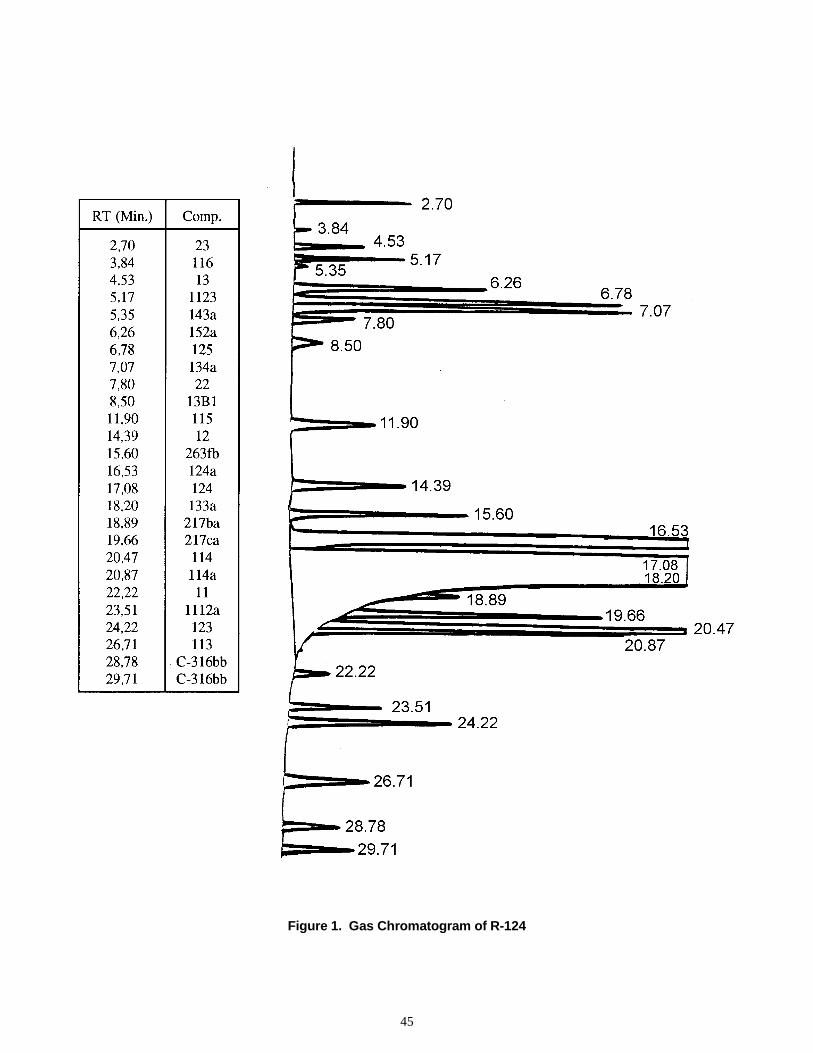
45
Figure 1. Gas Chromatogram of R-124

46
Table 1. Component Statistical Parameters
ComponentDetection
Limit, ppmConcentration
Investigated, ppmPrecision at 95%
Confidence Level, ppmRelative Mean
Error, %
2313
1123143a152a125134a22
13B111512
263fb124a133a217ba217ca114114a11
1112a123113
C-316bb
55211223334225323362233
203015102540502030352525
0.2%50202020504015302530
0.700.330.220.220.330.880.700.730.951.130.700.88
0.009%3.332.661.232.333.660.870.370.830.962.33
6.67-1.33-2.67-4.052.501.332.50-1.70-2.673.74.673.334.67-5.073.331.673.674.33-1.082.33-2.67-3.33-5.33
Table 2. Primary Calibration Standard Components
Component Mol. Wt.Vol.
Added, µLµg
Added(1)ppm
Added(2)Total ppmPresent(3)
2313
1123143a152a125134a22
13B111512
263fb124a(4)
133a217ba217ca114114a11(5)
1112a(5)123(5)113(5)
C-316bb(5)
701048284661201028614915412198136118204204171171137133153187233
222014102825381815171520--25881020
63.085.447.034.475.6
122.7158.563.791.4
107.474.180.2
--121.266.966.969.9
139.8(6)(6)(6)(6)(6)
20.028.015.011.024.039.051.020.029.034.524.026.0
--39.021.521.522.545.056.011.044.647.525.0
(1) If necessary, correct the µg added for the purity of the calibration component previously established.(2) Values shown are for illustration; exact values are determined at Section 10.1, step p of the General
Procedure.(3) Column to be filled in (Section 10.1, step q of the General Procedure) after determining ppm present
in stock R-124 (see Note 1 in Section 10.7 of the General Procedure).(4) Refer to Note 1 in Section 10.7 of the General Procedure.(5) These components are liquids at ambient laboratory temperature and are added to the 500 mL bulb
as described in Section 10.1 of the General Procedure, steps k through n.(6) From Section 10.1 of the General Procedure, step n.

47
Table 3. Primary Calibration StandardLiquid Impurities
Comp. Vol. Added, mL Density at 20°C g
C-316bb11312311
1112a
4.08.08.010.02.0
1.6441.5651.4701.487
1.439(10°C)
6.57612.52011.76014.8702.878
Table 4. Retention Time Data for Identified ImpuritiesNot Normally Observed
Impurity Retention Time (Min.)
32(1)116111413414331
142b365mc1113
1225yeMet. Formate
1331318my-T1318my-C
1327123b
114B1123a216113a
123aB1122a1222341111
2.703.845.008.078.308.53
15.2215.3016.0616.1316.9219.0519.7021.0520.5022.9023.5023.6023.8027.1028.5032.7033.5035.3535.60
(1) 32 and 23 coelute. A one (1) ft. column section of Porapak-T attached to thedetector side of the column will resolve these two components—the 23 peakeluting first.

48
Part 12
R-125 GC Method Data Sheet
Section 1. Scope
This GC Method Data Sheet is for use in conjunction withSection 10 of the General Procedure for the Determination ofPurity of New and Reclaimed Refrigerants by GasChromatography (hereafter referred to as General Procedure).This GC Method Data Sheet is for use with R-125.
Section 2. Limitations and Interferences
This method is applicable and calibrated for only thoseimpurities found in Table 2 and Table 3. Other impurities thathave been detected on occasion are listed (with retention times)in Table 4. This method will not detect any impurities that mayelute within the comparatively large R-125 peak matrix.
Section 3. Gas Chromatographic AnalysisEquipment and Conditions
Packed column: 7.32 m x 3.17 mm OD stainless steel, 1% SP-1000 on Carbopack B, 60/80 mesh, Supelco, Bellefonte, PA.
Detector FIDCarrier Gas 45 mL He/Min.Initial Column Temp. 40°CInitial Hold 6 Min.Program 5 K/Min.Final Column Temp. 130°CPost Hold 11 Min.Sample 0.50 mL (gas syringe)Detector Temp. 250°CInj. Port Temp. 150°CMax Safe Column Temp. 225°C (for conditioning purposes)
Section 4. Sensitivity, Precision, and Accuracy
Statistical parameters for each impurity are listed in Table 1.The data was obtained by analyzing an R-125 calibration mixture7 times during one day by one operator.
Section 5. Tables
The following tables are to be used in conjunction with Section10 of the General Procedure.

49
Figure 1. Gas Chromatogram of R-125

50
Table 1. Component Statistical Parameters
ComponentDetection
Limit, ppmConcentration
Investigated, ppmPrecision at 95%
Confidence Level, ppmRelative Mean
Error, %
Methane2311613
143a13B111512
1113124a
115B1124133a114a123113
0.2547551104211411222
515200301030
0.20%251510152015253030
0.060.705.860.240.151.10
0.006%0.530.200.200.350.300.330.650.701.10
4.006.672.50-3.33-5.002.301.50-2.40-4.004.405.332.55-1.051.33-2.66-3.35
Table 2. Primary Calibration Standard Components
Component Mol. Wt.Vol.
Added, µLµg
Added (1)ppm
Added (2)Total ppmPresent (3)
Methane23
11613
143a13B1115(4)
121113124a
115B1124133a114a
123(5)113(5)
167013810484149154121116136199136118171153187
2115
0.10 mL20814(4)1485510810
14.042.556485.427.585.3
--69.238.127.940.755.838.869.9(6)(6)
515
207311031--251410152114265132
(1) If necessary, correct the µg added for the purity of the calibration component previously established.(2) Values shown are for illustration; exact values are determined at Section 10.1, step p.(3) Column to be filled in Section 10.1 step q of the General Procedure after determining ppm present in
stock R-125 (see Note 1 in Section 10.7).(4) Refer to Note 1 in Section 10.7.(5) These components are liquids at ambient laboratory temperature and are added to the 500 mL bulb as
described in 10.1, steps k through n.(6) From Section 10.1 step n.
Table 3. Primary Calibration StandardLiquid Impurities
Comp. Vol. Added, mL Density at 20°C g
R-113 12.0 1.565 18.78
R-123 20.0 1.470 29.40

51
Table 4. Retention Time Data for IdentifiedImpurities Not Normally Observed
Impurity Retention Time (Min.)
114114
32(1)C2H4
C2H6
111422
134a218
C-318329
31-10114
1318my-T1318my-C
2271327
2.002.352.753.334.084.947.778.3210.614.415.019.121.520.7723.1024.024.85
(1) 32 and 23 coelute. A one (1) ft. column section of Porapak-T attached to the detector side of thecolumn will resolve these two components—the 23 peak eluting first.

52
Part 13
R-134a GC Method Data Sheet
Section 1. Scope
This GC Method Data Sheet is for use in conjunction withSection 10 of the General Procedure for the Determination ofPurity of New and Reclaimed Refrigerants by GasChromatography (hereafter referred to as General Procedure).This GC Method Data Sheet is for use with R-134a.
Section 2. Limitations and Interferences
This method is applicable and calibrated for only thoseimpurities found in Table 2 and Table 3. Other impurities thathave been detected on occasion are listed (with retention times)in Table 4. This method will not detect any impurities that mayelute within the comparatively large R-134a peak matrix.
Section 3. Gas Chromatographic AnalysisEquipment and Conditions
3.1 Chromatographic Equipment and Conditions, Packed Column
Packed column: Formed by joining in series the following 4columns in the following order given:
1. 1.83 m 5% Bentone 34/5%-SP-1200-on Supelcoport,100/200 mesh.
2. 6m 5% Krytox on Carbopack B, 60/80 mesh.
3. 4.88m x 3.17 mm OD stainless steel, 1% SP-1000 onCarbopack B, 60/80 mesh.
4. .35m Porapak T, 60/80 mesh.
NOTE: The Bentone column is attached to the injection port all columns are made from 3.17mm OD stainless steel tubing. The individual columns are conditioned separately before joining together. Columns are available from , Supelco, Bellefonte, PA.
Detector FIDCarrier Gas 20 mL He/Min.Initial Column Temp. 40°CInitial Hold 6 Min.Program 10 K/Min.Final Column Temp. 165°CPost Hold 26 Min.Sample 0.5 mL (gas syringe)Detector Temp. 250°CInj. Port Temp. 150°CMax Safe Column Temp. 175°C (for conditioning purposes)
3.2 Chromatographic Equipment and Conditions, Capillary Column
Capillary Column: 120m (or 2-60m) DB-1301, 0.25mm,1µ, J&W Scientific Co.,Folsom, CA.
Detector FIDCarrier Gas approx. 1mL He/MinInjection Port Temp 150°CDetector Temp. 250°CSample 1.0 mLMax. Safe Column Temp. 280°CInitial Col. Temp -20°CInitial Hold 7 Min.Program 8 K/Min.Final Column Temp. 50°CPost Hold 5 Min.Split Ratio 30:1Pressure 240 kPaMakeup Gas 30 mL He/Min.Sub-ambient Cooling Liquid Nitrogen
See Note 6 of Section 10.7 of the General Procedure for theDetermination of Purity of New and Reclaimed Refrigerants byGas Chromatography.
Section 4. Sensitivity, Precision, and Accuracy
Statistical parameters for each impurity are listed in Table 1.The data was obtained by analyzing an R-134a calibrationmixture 7 times during one day by one operator.
Section 5. Tables
The following tables are to be used in conjunction with Section10 of the General Procedure.
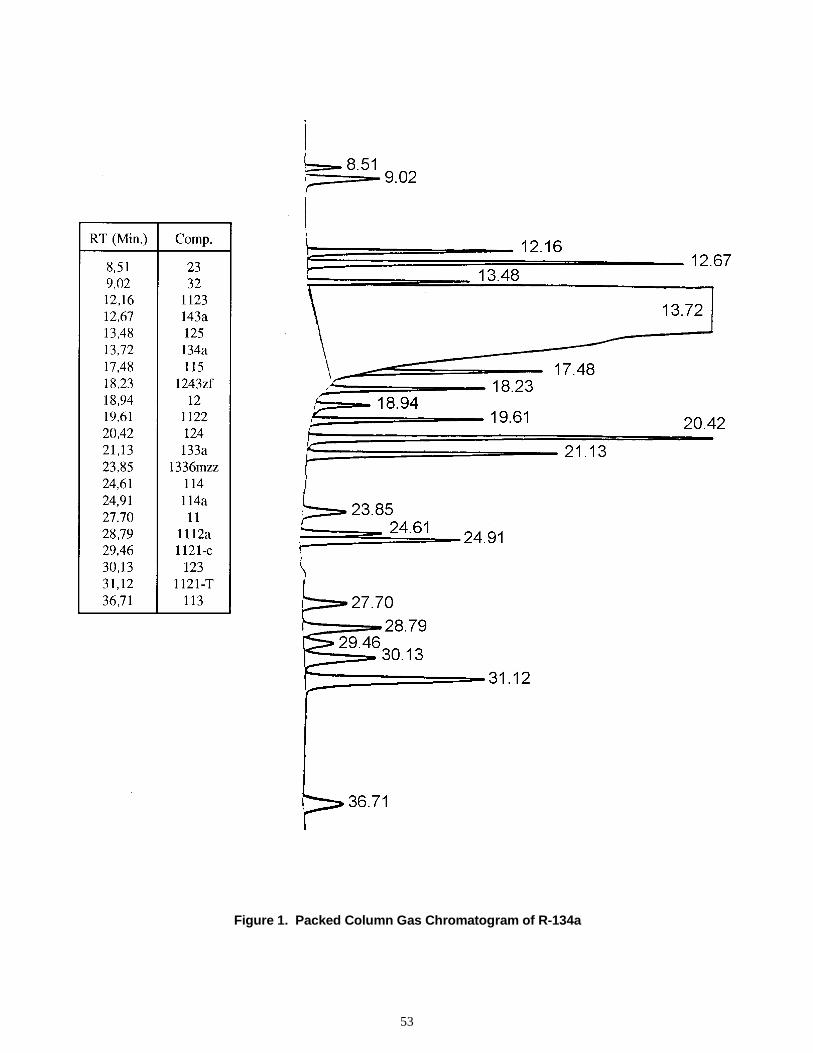
53
Figure 1. Packed Column Gas Chromatogram of R-134a
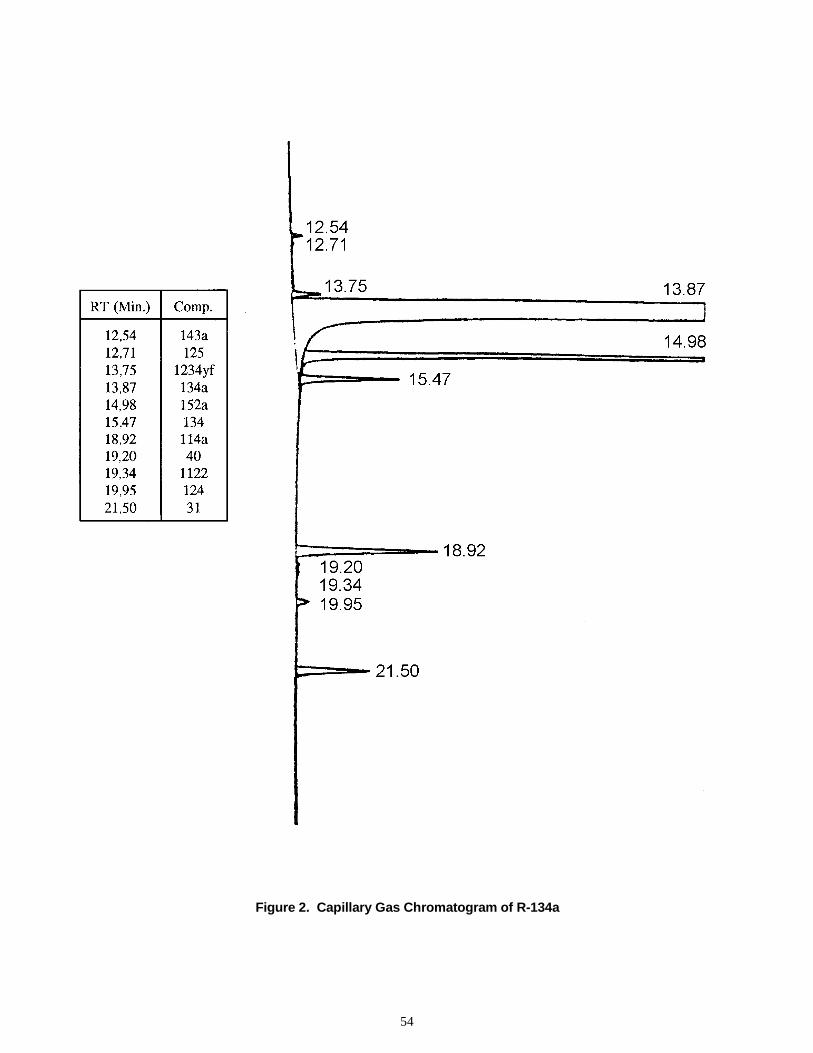
54
Figure 2. Capillary Gas Chromatogram of R-134a

55
Table 1. Component Statistical Parameters
ComponentEffective Carbon
Number (1)Detection
Limit, ppmConcentration
Investigated, ppmPrecision at 95%
Confidence Level, ppmRelative Mean
Error, %
2332
1123143a125115
1243zf12
112212431
133a1336mzz
114114a11
1112a1121-C
1231121-T
113134152a
1234yf
0.160.621.932.120.790.762.840.351.761.330.921.932.901.041.100.431.641.751.761.751.601.611.082.65
421125121111122411212211
151520203060104015401525--30505015102030203030--
0.700.300.200.200.250.650.200.300.200.450.800.50
0.5(2)1.101.202.600.300.300.901.001.30.200.20
0.5(2)
1.81.2-0.81.53.2-1.3-3.61.82.22.01.71.7--
-3.34.32.6-0.2-6.7-3.34.31.71.40.8--
(1) Effective Carbon Numbers (ECN) were determined experimentally (see J. Chromatog. Sci., 30, 280, (1992).)(2) Precision estimated at 10 ppm based upon sample reproducibility.
Table 2. Primary Calibration Standard Components
Component Mol. Wt.Vol.
Added, µLµg
Added (1)ppm
Added (2)Total ppmPresent (3)
2332
1123143a125115134152a12
112212431
133a114114a11(4)
1112a(4)1121-C(4)
123(4)1121-T(4)
113(4)
70528284120154102661219813668118170170137133115153115188
12161414142228252081612121020
34.7334.0346.9848.1068.72139.05116.8167.4998.8932.2389.3233.6158.1769.46138.92
(6)(6)
(5,6)(6)
(5,6)(6)
1515202030605030431539
14.52530603018519
23.524
(1) If necessary, correct the µg added for the purity of the calibration component previously established.(2) Values shown are for illustration; exact values are determined at 10.1, step p of Part 1. Column to be
filled in (Section 10.1, step q) after determining ppm present in stock R-134a.(3) These components are liquids at ambient temperature and are added to the 500 mL bulb as described
in Section 10.1, steps k through n of the General Procedure.(5) 1121 typically contains about 17.5% cis isomer. µg 1121 added x 0.175 is assigned to the cis isomer,
the balance to the trans isomer.(6) From Section 10.1 of the General Procedure, step n.

56
Table 3. Primary Calibration StandardLiquid Impurities
Comp. Vol. Added, mLDensityat 20°C g
1131121C&T
12311
1112a
6.08.05.08.05.0
1.5651.4031.4701.487
1.439(10°C)
9.39011.2247.35011.8967.195
Table 4. Additional Impurities Observed in R-134a,Quantitation by Effective Carbon Number Method
1. Additional impurities occasionally observed in sample of R-134a are tabulated below.
ImpurityColumn Retention
Time (Min.) PackedColumn Retention
Time (Min.) CapillaryEffective CarbonNumber ECN (1)
1243zf1336mzz1234yf
22123a124a245cb1225ye1113263fb1140132b13
1318my-T1318my-C
18.2331.1218.20
29.5019.7518.5019.2119.2019.2118.5031.1212.1623.1824.60
14.98
13.7516.40
21.50
2.842.902.650.401.841.272.602.421.692.952.081.900.232.952.95
(1) Refer to J. Chromatog. Sci., 30, 280, (1992).
2. Quantitation by ECN Method
Select a nearby peak in the chromatogram whose identification and response factor (RF) have been established (theInternal Standard).
Then:
RFI = ECNr x MWi
ECNI MWr
Where: RF = either Absolute or Relative Response Factor.MWi = molecular weight of the component to be determined.MWr = molecular weight of the Internal Standard Reference.

57
Part 14
R-143a GC Method Data Sheet
Section 1. Scope
This GC Method Data Sheet is for use in conjunction withSection 10 of the General Procedure for the Determination ofPurity of New and Reclaimed Refrigerants by GasChromatography (hereafter referred to as General Procedure).This GC Method Data Sheet is for use with R-143a.
Section 2. Limitations and Interferences
This method is applicable and calibrated for only thoseimpurities found in Table 2. This method will not detect anyimpurities that may elute within the comparatively large R-143apeak matrix.
Section 3. Gas Chromatographic AnalysisEquipment and Conditions
3.1 Chromatographic Equipment and Conditions, Combination Packed Column.
Packed column: Formed by joining in series the following 4columns in the following order given:
1. 1.83 m 5% Bentone 34/5%-SP-1200-on Supelcoport,100/200 mesh.
2. 6m 5% Krytox on Carbopack B, 60/80 mesh.
3. 4.88m x 3.17 mm OD stainless steel, 1% SP-1000 onCarbopack B, 60/80 mesh.
4. 0.35m Porapak T, 60/80 mesh.
NOTE: The Bentone column is attached to the injection port all columns are made from 3.17mm OD stainless steel tubing. The individual columns are conditioned separately before joining together. Columns are available from, Supelco, Bellefonte, PA.
Detector FIDCarrier Gas 20 mL He/Min.Initial Column Temp. 40°CInitial Hold 6 Min.Program 10 K/Min.Final Column Temp. 165°CPost Hold 26 Min.Sample 0.5 mL (gas syringe)Detector Temp. 250°CInj. Port Temp. 200°CMax Safe Column Temp. 175°C (for conditioning purposes)
3.2 Chromatographic Equipment and Conditions, 1% SP-1000 Packed Column
Packed Column: 7.32m x 3.17 m OD stainless steel, 1% SP-1000 on Carbopack B, 60/80 mesh,
Supelco, Bellefonte, PA.
Detector FIDInjection Port Temp 200°CDetector Temp. 250°CSample 0.50 mL (gas syringe)Max. Safe Column Temp. 225°C (for conditioning purposes)Initial Col. Temp 35°CInitial Hold 7 Min.Program 10 K/Min.Final Column Temp. 150°C
Section 4. Sensitivity, Precision, and Accuracy
Statistical parameters for each impurity are listed in Table 1.The data was obtained by analyzing an R-143a calibrationmixture 7 times during one day by one operator.
Section 5. Tables
The following tables are to be used in conjunction with Section10 of the General Procedure.

58
Figure 1. 1% SP-1000 Packed Column Gas Chromatogram of R-143a

59
Figure 2. Combination Packed Column Gas Chromatogram of R-143a

60
Table 1. Component Statistical Parameters
ComponentDetection
Limit, ppmConcentration
Investigated, ppmPrecision at 95%
Confidence Limit, ppmRelative Mean
Error, %
412332
C2H4
C2H6
152a40
125134a22
142b1113124
isobutane114a
n-butaneC3H8
115121612
14111238561231511325
30252055
50404025406515255
3555
752540
0.531.190.730.530.371.811.532.131.871.191.430.870.730.330.870.330.472.131.010.88
-1.00.82.1-3.7-4.22.61.32.7-1.21.81.2-0.92.18.2-0.85.1-3.70.9-1.73.1
Table 2. Primary Calibration Standard Components
Component Mol. Wt.Vol.
Added, µLµg
Added (1)ppm
Added (2)Total ppmPresent (3)
412332
C2H4
C2H6
152a40125134a22
142b1113124
isobutane114a
n-butaneC3H8
115121612
34705228306650
12010286
10011613658
1705844
154150121
40161888
353515102030686
1065
228
15
55.745.838.39.99.894.572.373.641.770.8
123.328.644.714.269.714.29.0
139.049.174.2
29242055503838223765152383785732639
(1) If necessary, correct the µg added for the purity of the calibration component previously established.(2) Values shown are for illustration; exact values are determined in Section 10.1, step p of the General
Procedure.(3) Column to be filled in (Section 10.1, step q of the General Procedure) after determining ppm present in
stock R-143a (see Note 1 in Section 10.7 of the General Procedure).

61
PART 15
DETERMINATION OF COMPONENT CONCENTRATIONS OFREFRIGERANT 400 AND 500 SERIES BLENDS AND AZEOTROPES BY
GAS CHROMATOGRAPHY
Section 1. Purpose
The purpose of this test method is to determine the componentcompositions of new and reclaimed Refrigerants 400 (R-400)and 500 (R-500) blends and azeotropes by Gas Chromatography(GC). This method utilizes one (1) GC packed column toseparate and quantify the individual components for all of therefrigerant blends and azeotropes.
Section 2. Scope
This test method is for use with all R-400 and R-500 blends andazeotropes as outlined in Section 11.
Section 3. Definitions
Definitions for this part are identical to those of ARI Standards700-95 and 740-95.
Section 4. Principle
The compositions of new and reclaimed blends and azeotropesare determined by either isothermal or programmed temperaturegas chromatography using a packed column and a thermalconductivity detector (TCD). Component peak areas areintegrated electronically and quantified by the areanormalization-response factor method by reference to a suitablecalibration standard prepared to closely match the expectedcomposition of the particular blend.
Section 5. Applicability
This method is applicable to the determination of thecomposition of new and reclaimed R-400 and R-500 blends andazeotropes.
Section 6. Limitations and Interferences
This method is calibrated for each of the respective R-400 andR-500 blends. If components other than those comprising thegiven mixture are present in significant amounts, results can beerroneous and/or misleading. Any impurity that coelutes withone of the blend components will interfere if present insignificant concentration. This method is limited to thecomposition of the blends and does not address the organicpurity of the blend sample.
Section 7. Sensitivity, Precision, and Accuracy
Values for these statistical parameters are given in theappropriate GC Method Data Sheet.
Section 8. Special Apparatus and Reagents
NOTE: Equivalents may be substituted.
1. Programmable temperature gas chromatograph, singleor dual packed column, TCD detector, low sensitivityposition: Model 6890, Hewlett Packard, Wilmington,DE.
2. Electronic integrator: Model# 3396 or suitable dataacquisition system and GC software, Hewlett Packard,Wilmington, DE.
3. Packed column: 7.32 m x 3.17 mm OD stainless steel,1% SP-1000 on Carbopack B, 60/80 mesh. Thiscolumn may be assembled by attaching two or threeshorter columns together in series. Condition O/N at225°C. Supelco, Bellefonte, PA.
4. Gas collecting tube: 250 mL, LG-8601, Lab Glass Inc.,Vineland, NJ. (Enlarge side outlet opening toaccommodate a crimp-on 2-cm septum. Applyfiberglass tape outside for protection from breakage).
5. Steel cylinder: 1L, with a single #9 valve (#1014-C,Superior Valve), 3/8" pipe neck, E. F. Britten Co.,Cranford, NJ.
6. Syringe, Gastight, 1.0 mL, Hamilton 1001TLL; Supelco,P/N 2-0997M.
7. HP Steel Cylinder, EFB-56, 400 psig, single #9 valve(#1014-C Superior Valve), 3/8” pipe neck,approximately 925 mL internal volume, E.F. Britten Co.,Cranford, NJ.
8. VHP Stainless Steel Cylinder, 1L, 1800 psig, 304L-HDF4-100. Valve SS-IRS4-A, Whitey, WilmingtonValve and Fitting, Co., New Castle, DE.

62
9. The fluorochemicals may be purchased from Lancaster,Windham, NH and Synquest, Inc., Alachua, FL. Thehydrocarbons may be purchased from Scott SpecialtyGases, Inc., Plumbsteadville, PA.
NOTE: The purity of each calibration component must bepredetermined by gas chromatography and, ifnecessary, by GC/Mass Spectroscopy (GC-MS).
Section 9. Procedure
9.1 Calibration Standard Preparation
NOTE: The following procedure is generalized and is followedfor the preparation of each blend calibration standard.The weights of each blend component to be added andthe order of addition are given in the appended GCMethod Data Sheets for each respective refrigerantblend. Normally, the least volatile components areadded first. Refer to Note 1 for additional information.
a. Pressure test the clean, dry calibration standard cylinder toabout 2000 kPa (using N2) to insure there are no leaks.
b. Evacuate the cylinder to below 0-10 kPa (i.e. fullvacuum). Close the valve and record the cylinder weightto the nearest 0.1 g (i.e. tare weight)
c. Using the Teflon transfer line, loosely connect thecylinder containing the first component to be added to thecalibration standard cylinder. Briefly purge the transferline, then connect tightly to the standard cylinder valve.
d. Transfer the calculated weight (approximately) of thecomponent to the standard cylinder.
NOTE: If the amount added is less than desired, the cylinder ispurged until the desired weight is obtained. Purgingthe cylinder is permitted only during addition of thefirst component.
e. Reweigh and record the cylinder weight. This weight lessthe tare weight (step b) gives the weight of the first addedcomponent.
f. Externally cool the calibration cylinder in an ice waterbath for at least 20 minutes (Refer to Note 4).
g. Connect the Teflon transfer line from the secondcomponent cylinder and transfer the desired weight of thesecond component as was done above.
NOTE: Generally, it is simpler to prepare a second cylindercontaining the exact weight of the second componentto be added, then transferring the entire contents (ornearly so) into the calibration standard cylinder.
h. Close the cylinder valves, remove the transfer line,remove the calibration standard cylinder from the icewater bath, and allow the cylinder and contents to warmto ambient laboratory temperature.
i. After drying the cylinder externally, weigh the calibrationstandard cylinder and then subtract the gross weightrecorded in step e. The net difference is the weight of thesecond added component.
j. Repeat above steps f through i for a third and (ifnecessary) for a fourth component.
k. Add the weights of all the added components and thendetermine the weight percentage (to the nearest 0.01%) ofeach component in the calibration mixture. If necessary,correct the individual component percentages for thepurities determined in Section 8.
l. Attach a label to the calibration standard cylindercontaining the name of the refrigerant standard, weightpercentage of each component present, date ofpreparation, total gross weight (i.e. cylinder pluscontents), and gross weight for renewal (See Note 2).Store the standard in a cool, secure location.
9.2 Determination of Component Response Factors
a. Set-up the cylinder sampling apparatus as shown inFigure 1. The plastic line connecting metering valve “E”to the gas bulb valve “B” must be kept as short as possibleas to minimize component fractionation during thetransfer.
b. With valves “E”, “B”, and “C” open, slowly open valve“D” and evacuate the apparatus up to cylinder valve “A”.Close valve “D” and insure the system is holding vacuum.
c. Close valve “E” and then open cylinder valve “A”.
d. Slowly open valve “E” and introduce sample into the gasbulb until the vacuum gauge reads 102 kPa pressure.Close valve “A”.
e. Repeat steps b through d.
f. Set the GC integrator (or work station) for an areanormalization response factor calibration run.
g. Set the GC to the operating conditions given in the GCMethod Data Sheet for the refrigerant blend to becalibrated. The TCD is always set in the least sensitiveposition for all blend component analyses.
h. Using the 1.0 mL syringe, withdraw vapor sample fromthe gas bulb and inject into the GC. Withdraw slowly,

63
allowing sufficient time (5 seconds) for the calibrationstandard to fill the syringe.
i. Repeat the GC analysis twice more.
j. Store the average of the three determined RelativeResponse Factors for each blend component in theMethod Table as follows:
ii
A
Std. Cal.in i Comp. Wt% ARF =
n
ii ARF
ARFRRF =
Where:
ARFi = absolute response factor for component i.ARFn= absolute response factor for the component with the
highest weight percentage in the mixture. RRFi = relative response factor for component i.Ai = peak area of component i.
NOTE: RRFn will always equal 1.0. The largest component(peak area) is normally selected as the reference peak.RRF values are computed to the nearest 0.0001 unit.
9.3 Sampling
High Pressure (HP) sample cylinders should be filled at least80% but no more than 90% liquid full. This will both minimizecomponent fractionation within the sample container and willavoid overfilling for safety considerations. Very high-pressure(VHP) sample cylinders (vapor phase) may be filled to less thansaturation pressure, if desired.
9.4 Sample Analysis
Analyze the sample using the chromatographic conditionsdescribed in the GC Method Data Sheet. Load the sample asillustrated in Figure 1 in the same manner as described for theGC method calibration standard. Questionable sample resultsare most often resolved by re-analysis of the calibrationstandard. The temperature of the sample must equal(essentially) that of the calibration standard at the time of GCcalibration. In the case of VHP refrigerants, the sample must beat or above the critical temperature before analysis.
9.5 Calculations
a. The weight percentage of each component is calculated asfollows:
∑=
)RRF x (A
A x RRF x 100W
ii
iii
Where:
Wi = weight percentage of component i.RRFi = relative response factor for component i.Ai = peak area of component i.Σ…= sum of all component peak areas times their
respective relative response factors.
Report weight percentage results to the nearest 0.01%. (Note 3)
Section 10. Notes
1. The weights of each HP Standard component to be addedhave been calculated such that, after final loading, the HPstandard cylinder will be about 90% filled with liquidphase. This is not the case for the very high-pressure(VHP) standards whose critical temperatures are either ator below ambient laboratory temperatures. For VHPstandards (R-508, for example), the refrigerant vaporphase is used for calibration and sample analysis.Because of pressure considerations, two calibrationstandard cylinders are used, one for HP and the other forVHP refrigerants. In cases where one refrigerant blendhas more than one composition (for example, R-401A andR-401B), where possible, just one calibration standard isprepared with composition approximately the average ofthe A and B compositions.
2. Experimental data has shown that vapor/liquid phaseequilibrium for several R-400 series blends is essentiallyconstant within a container following removal (and afterre-equilibration) of about one third of the original liquidphase from the cylinder (see Reference 1). Hence, afreshly prepared calibration standard with 90% liquidphase will retain its original component ratio until theliquid phase has been depleted to below 60% of thecylinder volume—at which point the standard should berenewed. This renewal point is conveniently determinedby subtracting the cylinder tare weight from the finalcylinder gross weight, taking 66% of this difference, andthen adding the tare weight to this 66% value. This value(recorded on the calibration standard label) is the cylindergross weight at which the HP standard should be renewed.This equilibrium consideration does not apply to the VHPstandards that are all vapor at ambient laboratorytemperature.
3. The sum of the individual component weight percentageswill not necessarily equal 100.00%. This proceduredetermines the blend component amounts present anddoes not address other volatile organic impurities that aremore or less present in the mixture.
4. In preparing the VHP refrigerant calibration standards, itis usually necessary to externally cool the 1L cylinder in
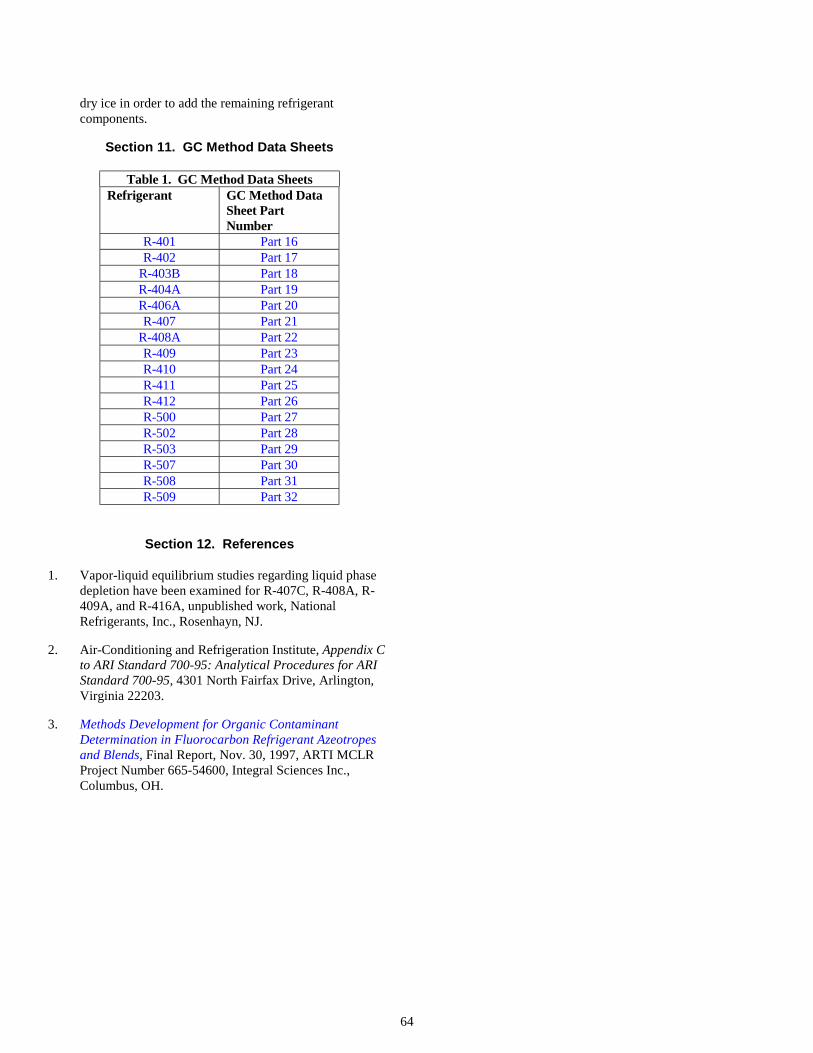
64
dry ice in order to add the remaining refrigerantcomponents.
Section 11. GC Method Data Sheets
Table 1. GC Method Data SheetsRefrigerant GC Method Data
Sheet PartNumber
R-401 Part 16R-402 Part 17
R-403B Part 18R-404A Part 19R-406A Part 20R-407 Part 21
R-408A Part 22R-409 Part 23R-410 Part 24R-411 Part 25R-412 Part 26R-500 Part 27R-502 Part 28R-503 Part 29R-507 Part 30R-508 Part 31R-509 Part 32
Section 12. References
1. Vapor-liquid equilibrium studies regarding liquid phasedepletion have been examined for R-407C, R-408A, R-409A, and R-416A, unpublished work, NationalRefrigerants, Inc., Rosenhayn, NJ.
2. Air-Conditioning and Refrigeration Institute, Appendix Cto ARI Standard 700-95: Analytical Procedures for ARIStandard 700-95, 4301 North Fairfax Drive, Arlington,Virginia 22203.
3. Methods Development for Organic ContaminantDetermination in Fluorocarbon Refrigerant Azeotropesand Blends, Final Report, Nov. 30, 1997, ARTI MCLRProject Number 665-54600, Integral Sciences Inc.,Columbus, OH.

65
Figure 1. Apparatus Used for Sampling Calibration Standards and Samples

66
Part 16
R-401 Composition GC Method Data Sheet
Section 1. Gas Chromatographic Conditions
Detector TCD, Low SensitivityCarrier Gas 30 mL He/Min.Initial Column Temp. 75°CInitial Hold 5 Min.Program 20 K/Min.Final Column Temp. 175°CPost Hold 5 Min.Sample 1.0 mL (gas syringe)Detector Temp. 250°CInj. Port Temp. 200°CMax Safe Column Temp. 225°C (for conditioning purposes)
Table 1. Blend Component Weight %
R-401 Blend Wt%
Component R-401A R-401B Tolerance GCRetention
Time
R-152a
R-22
R-124
13.0
53.0
34.0
11.0
61.0
28.0
+.50,-1.50
±2.0
±1.0
6.20
6.60
10.55
Section 2. Precision, and Accuracy
Statistical parameters for each impurity are listed below. Thedata was obtained by analyzing an R-401 calibration mixture 7times during one day by one operator.
Table 2. Component Statistical Parameters
R-401Component
95% CL
Relative MeanError, wt%
R-22R-152aR-124
±0.03%±0.03%±0.06%
0.060.220.17
Section 3. Calibration Standard Preparation
The following table is to be used in conjunction with Part 15,The Determination of the Component Concentrations ofRefrigerant 400 and 500 Series Blends and Azeotropes by GasChromatography.
Table 3. Blend Calibration Standard Preparation
R-401Component
Amount to Weigh(g)
ApproximateWeight %
R-124
R-152a
R-22
307
119
564
31
12
57

Figure 1. Gas Chromatogram of R-401
67

68
Part 17
R-402 Composition GC Method Data Sheet
Section 1. Gas Chromatographic Conditions
Detector TCD, Low SensitivityCarrier Gas 30 mL He/Min.Initial Column Temp. 75°CInitial Hold 7 Min.Program 25 K/Min.Final Column Temp. 150°CPost Hold 2 Min.Sample 1.0 mL (gas syringe)Detector Temp. 250°CInj. Port Temp. 200°CMax Safe Column Temp. 225°C (for conditioning purposes)
Table 1. Blend Component Wt %
R-402 Blend Wt%
Component R-402A R-402B Tolerance GCRetention
Time(Min)
R-125
R-22
HC-290
60.0
38.0
2.0
38.0
60.0
2.0
±2.0
±2.0
±1.0
6.00
6.95
9.40
Section 2. Precision, and Accuracy
Statistical parameters for each impurity are listed below. Thedata was obtained by analyzing an R-402 calibration mixture 7times during one day by one operator.
Table 2. Component Statistical Parameters
R-402Component
95% CL
Relative MeanError, wt%
R-125R-22
HC-290
±0.010%±0.009%±0.001%
0.080.070.07
Section 3. Calibration Standard Preparation
The following table is to be used in conjunction with Part 15,The Determination of the Component Concentrations ofRefrigerant 400 and 500 Series Blends and Azeotropes by GasChromatography.
Table 3. Blend Calibration Standard Preparation
Amount to Weigh(g) Approximate Weight
% R-402Component
R-402A R-402B R-402A R-402B
HC-290
R-22
R-125
19
364
575
19
578
366
2
38
60
2
60
38

Figure 1. Gas Chromatogram of R-402
69
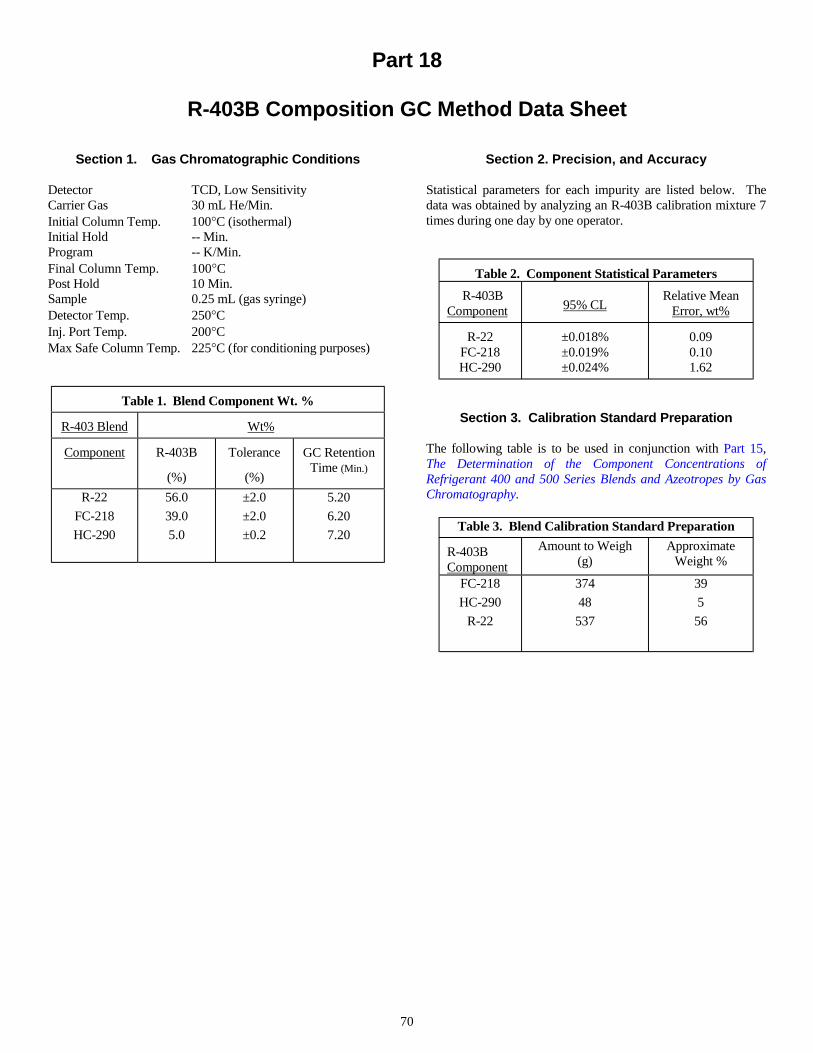
70
Part 18
R-403B Composition GC Method Data Sheet
Section 1. Gas Chromatographic Conditions
Detector TCD, Low SensitivityCarrier Gas 30 mL He/Min.Initial Column Temp. 100°C (isothermal)Initial Hold -- Min.Program -- K/Min.Final Column Temp. 100°CPost Hold 10 Min.Sample 0.25 mL (gas syringe)Detector Temp. 250°CInj. Port Temp. 200°CMax Safe Column Temp. 225°C (for conditioning purposes)
Table 1. Blend Component Wt. %
R-403 Blend Wt%
Component R-403B
(%)
Tolerance
(%)
GC RetentionTime (Min.)
R-22
FC-218
HC-290
56.0
39.0
5.0
±2.0
±2.0
±0.2
5.20
6.20
7.20
Section 2. Precision, and Accuracy
Statistical parameters for each impurity are listed below. Thedata was obtained by analyzing an R-403B calibration mixture 7times during one day by one operator.
Table 2. Component Statistical Parameters
R-403BComponent
95% CL
Relative MeanError, wt%
R-22FC-218HC-290
±0.018%±0.019%±0.024%
0.090.101.62
Section 3. Calibration Standard Preparation
The following table is to be used in conjunction with Part 15,The Determination of the Component Concentrations ofRefrigerant 400 and 500 Series Blends and Azeotropes by GasChromatography.
Table 3. Blend Calibration Standard Preparation
R-403BComponent
Amount to Weigh(g)
ApproximateWeight %
FC-218
HC-290
R-22
374
48
537
39
5
56

Figure 1. Gas Chromatogram of R-403B
71

72
Part 19
R-404A Composition GC Method Data Sheet
Section 1. Gas Chromatographic Conditions
Detector TCD, Low SensitivityCarrier Gas 30 mL He/Min.Initial Column Temp. 35°CInitial Hold 8 Min.Program 15 K/Min.Final Column Temp. 75°CPost Hold 5 Min.Sample 0.5 mL (gas syringe)Detector Temp. 250°CInj. Port Temp. 200°CMax Safe Column Temp. 225°C (for conditioning purposes)
Table 1. Blend Component Wt. %
R-404 Blend Wt%
Component R-404A
(%)
Tolerance
(%)
GC RetentionTime (Min.)
R-125
R-143a
R-134a
44.0
52.0
4.0
±1.0
±1.0
±1.0
10.90
9.55
11.60
Section 2. Precision, and Accuracy
Statistical parameters for each impurity are listed below. Thedata was obtained by analyzing an R-404A calibration mixture 7times during one day by one operator.
Table 2. Component Statistical Parameters
R-404AComponent
95% CL
Relative MeanError, wt%
R-125R-143aR-134a
±0.017%±0.024%±0.038%
0.0230.0970.740
Section 3. Calibration Standard Preparation
The following table is to be used in conjunction with Part 15,The Determination of the Component Concentrations ofRefrigerant 400 and 500 Series Blends and Azeotropes by GasChromatography.
Table 3. Blend Calibration Standard Preparation
R-404AComponent
Amount to Weigh(g)
ApproximateWeight %
R-134a
R-143a
R-125
35
454
384
4
52
44

Figure 1. Gas Chromatogram of R-404A
73

74
Part 20
R-406A Composition GC Method Data Sheet
Section 1. Gas Chromatographic Conditions
Detector TCD, Low SensitivityCarrier Gas 30 mL He/Min.Initial Column Temp. 150°C (Isothermal)Initial Hold -- Min.Program -- K/Min.Final Column Temp. 150°CPost Hold 9 Min.Sample 1.0 mL (gas syringe)Detector Temp. 250°CInj. Port Temp. 200°CMax Safe Column Temp. 225°C (for conditioning purposes)
Table 1. Blend Component Wt. %
R-406 Blend Wt%
Component R-406A
(%)
Tolerance
(%)
GC RetentionTime (Min.)
R-142b
HC-600a
R-22
41.0
4.0
55.0
±1.0
±1.0
±2.0
3.90
5.30
2.85
Section 2. Precision, and Accuracy
Statistical parameters for each impurity are listed below. Thedata was obtained by analyzing an R-406A calibration mixture 7times during one day by one operator.
Table 2. Component Statistical Parameters
R-406AComponent
95% CL
Relative MeanError, wt%
R-142bHC-600a
R-22
±0.060%±0.009%±0.023%
-0.120.250.07
Section 3. Calibration Standard Preparation
The following table is to be used in conjunction with Part 15,The Determination of the Component Concentrations ofRefrigerant 400 and 500 Series Blends and Azeotropes by GasChromatography.
Table 3. Blend Calibration Standard Preparation
R-406AComponent
Amount to Weigh(g)
ApproximateWeight %
HC-600a
R-142b
R-22
37
380
509
4
41
55

Figure 1. Gas Chromatogram of R-406A
75

76
Part 21
R-407 Composition GC Method Data Sheet
Section 1. Gas Chromatographic Conditions
Detector TCD, Low SensitivityCarrier Gas 30 mL He/Min.Initial Column Temp. 50°C (Isothermal)Initial Hold -- Min.Program -- K/Min.Final Column Temp. 50°CPost Hold 15 Min.Sample 0.25 mL (gas syringe)Detector Temp. 250°CInj. Port Temp. 200°CMax Safe Column Temp. 225°C (for conditioning purposes)
Table 1A. Blend Component Wt. % for R-407A
R-407ABlend
Wt%
Component R-407A
(%)
Tolerance
(%)
GC Retention Time(Min.)
R-32
R-125
R-134a
20.0
40.0
40.0
±1.0
±2.0
±2.0
4.05
9.30
9.90
Section 2. Precision, and Accuracy
Statistical parameters for each impurity are listed below. Thedata was obtained by analyzing an R-407C calibration mixture 7times during one day by one operator.
Table 2. Component Statistical Parameters
R-407CComponent
95% CL
Relative MeanError, wt%
R-32R-125
R-134a
±0.020%±0.052%±0.059%
0.130.060.03
Section 3. Calibration Standard Preparation
The following table is to be used in conjunction with Part 15,The Determination of the Component Concentrations ofRefrigerant 400 and 500 Series Blends and Azeotropes by GasChromatography.
Table 3. Blend Calibration Standard Preparation
R-407AComponent
Amount to Weigh(g)
ApproximateWeight %
R-134a
R-32
R-125
380
190
380
40
20
40
Table 1B. Blend Component Wt. % for R-407B
R-407BBlend
Wt%
Component R-407B
(%)
Tolerance
(%)
GC Retention Time(Min.)
R-32
R-125
R-134a
10.0
70.0
20.0
±1.0
±2.0
±2.0
4.05
9.30
9.90
Table 1C. Blend Component Wt. % for R-407C
R-407CBlend
Wt%
Component R-407C
(%)
Tolerance
(%)
GC Retention Time(Min.)
R-32
R-125
R-134a
23.0
25.0
52.0
±1.0
±2.0
±2.0
4.05
9.30
9.90
R-407BComponent
Amount to Weigh(g)
ApproximateWeight %
R-134a
R-32
R-125
194
97
680
20
10
70
R-407CComponent
Amount to Weigh(g)
ApproximateWeight %
R-134a
R-32
R-125
502
222
241
52
23
25
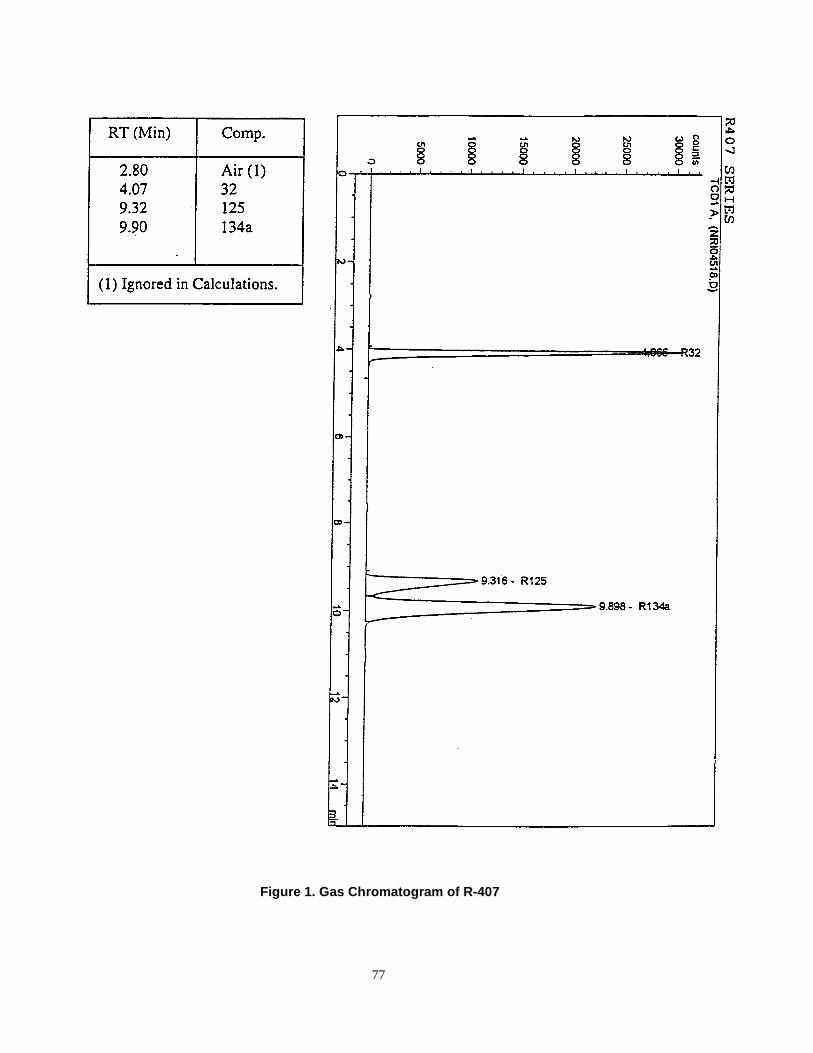
Figure 1. Gas Chromatogram of R-407
77

78
Part 22
R-408A Composition GC Method Data Sheet
Section 1. Gas Chromatographic Conditions
Detector TCD, Low SensitivityCarrier Gas 30 mL He/Min.Initial Column Temp. 40°C (isothermal)Initial Hold 6 Min.Program 10 K/Min.Final Column Temp. 130°CPost Hold 0 Min.Sample 1.0 mL (gas syringe)Detector Temp. 250°CInj. Port Temp. 200°CMax Safe Column Temp. 225°C (for conditioning purposes)
Table 1. Blend Component Wt %
R-408ABlend
Wt%
Component R-408A
(%)
Tolerance
(%)
GC RetentionTime (Min.)
R-143a
R-125
R-22
46.0
7.0
47.0
±1.0
±2.0
±2.0
8.45
9.85
10.55
Section 2. Precision, and Accuracy
Statistical parameters for each impurity are listed below. Thedata was obtained by analyzing an R-408A calibration mixture 7times during one day by one operator.
Table 2. Component Statistical Parameters
R-408AComponent
95% CL
Relative MeanError, wt%
R-125
R-143a
R-22
±0.015%±0.034%±0.023%
0.0010.0440.044
Section 3. Calibration Standard Preparation
The following table is to be used in conjunction with Part 15,The Determination of the Component Concentrations ofRefrigerant 400 and 500 Series Blends and Azeotropes by GasChromatography.
Table 3. Blend Calibration Standard Preparation
R-408AComponent
Amount to Weigh(g)
ApproximateWeight %
R-143a
R-22
R-125
407
416
62
46
47
7

Figure 1. Gas Chromatogram of R-408A
79
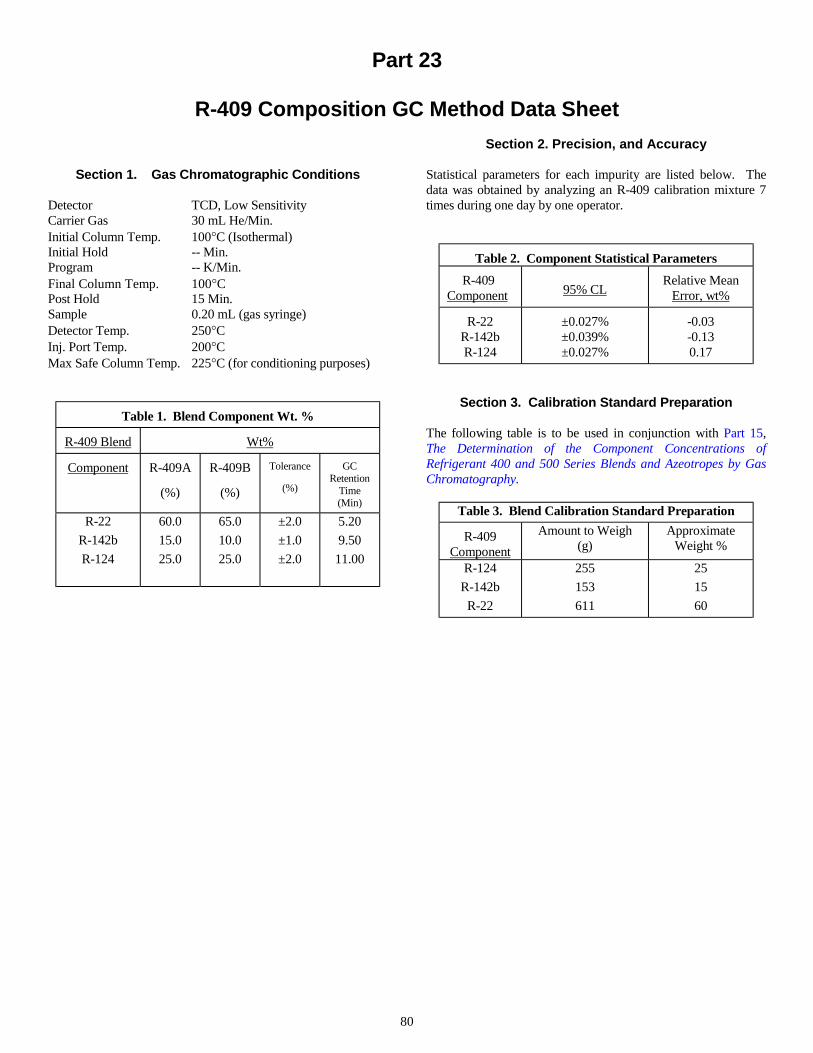
80
Part 23
R-409 Composition GC Method Data Sheet
Section 1. Gas Chromatographic Conditions
Detector TCD, Low SensitivityCarrier Gas 30 mL He/Min.Initial Column Temp. 100°C (Isothermal)Initial Hold -- Min.Program -- K/Min.Final Column Temp. 100°CPost Hold 15 Min.Sample 0.20 mL (gas syringe)Detector Temp. 250°CInj. Port Temp. 200°CMax Safe Column Temp. 225°C (for conditioning purposes)
Table 1. Blend Component Wt. %
R-409 Blend Wt%
Component R-409A
(%)
R-409B
(%)
Tolerance
(%)
GCRetention
Time(Min)
R-22
R-142b
R-124
60.0
15.0
25.0
65.0
10.0
25.0
±2.0
±1.0
±2.0
5.20
9.50
11.00
Section 2. Precision, and Accuracy
Statistical parameters for each impurity are listed below. Thedata was obtained by analyzing an R-409 calibration mixture 7times during one day by one operator.
Table 2. Component Statistical Parameters
R-409Component
95% CL
Relative MeanError, wt%
R-22R-142bR-124
±0.027%±0.039%±0.027%
-0.03-0.130.17
Section 3. Calibration Standard Preparation
The following table is to be used in conjunction with Part 15,The Determination of the Component Concentrations ofRefrigerant 400 and 500 Series Blends and Azeotropes by GasChromatography.
Table 3. Blend Calibration Standard Preparation
R-409Component
Amount to Weigh(g)
ApproximateWeight %
R-124
R-142b
R-22
255
153
611
25
15
60

Figure 1. Gas Chromatogram of R-409
81

82
Part 24
R-410 Composition GC Method Data Sheet
Section 1. Gas Chromatographic Conditions
Detector TCD, Low SensitivityCarrier Gas 30 mL He/Min.Initial Column Temp. 100°C (Isothermal)Initial Hold -- Min.Program -- K/Min.Final Column Temp. 100°CPost Hold 7 Min.Sample 1.0 mL (gas syringe)Detector Temp. 250°CInj. Port Temp. 200°CMax Safe Column Temp. 225°C (for conditioning purposes)
Table 1. Blend Component Wt. %
R-410Blend
Wt%
Component R-410A
(%)
R-410B
(%)
Tolerance
(%)
GCRetention
Time(Min)
R-32
R-125
50.0
50.0
45.0
55.0
-1.50, +.50,±1.0
_________
-.50, +1.50,±1.0
3.00
4.60
Section 2. Precision, and Accuracy
Statistical parameters for each impurity are listed below. Thedata was obtained by analyzing an R-410B calibration mixture 7times during one day by one operator.
Table 2. Component Statistical Parameters
R-410Component
95% CL
Relative MeanError, wt%
R-32
R-125±0.030%±0.025%
0.0470.13
Section 3. Calibration Standard Preparation
The following table is to be used in conjunction with Part 15,The Determination of the Component Concentrations ofRefrigerant 400 and 500 Series Blends and Azeotropes by GasChromatography.
Table 3. Blend Calibration Standard Preparation
R-410Component
Amount to Weigh(g)
ApproximateWeight %
R-32
R-125
430
465
48
52
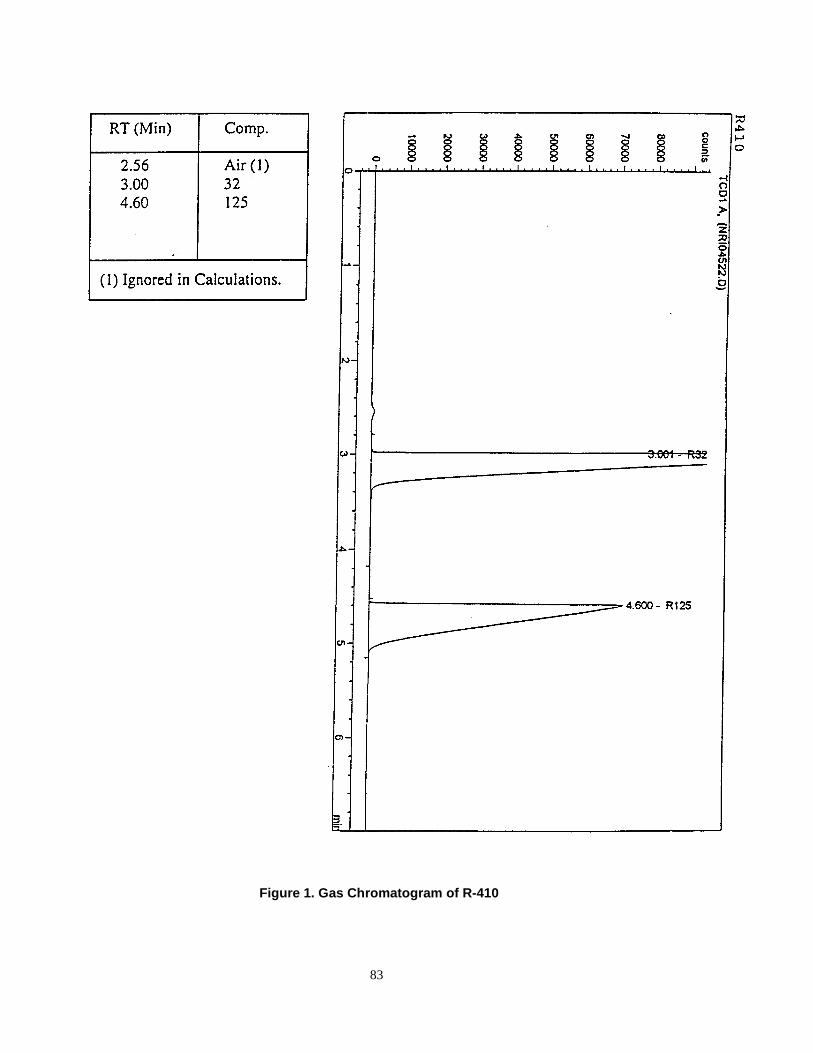
Figure 1. Gas Chromatogram of R-410
83

84
Part 25
R-411 Composition GC Method Data Sheet
Section 1. Gas Chromatographic Conditions
Detector TCD, Low SensitivityCarrier Gas 30 mL He/Min.Initial Column Temp. 75°C (Isothermal)Initial Hold -- Min.Program -- K/Min.Final Column Temp. 75°CPost Hold 12 Min.Sample 1.0 mL (gas syringe)Detector Temp. 250°CInj. Port Temp. 200°CMax Safe Column Temp. 225°C (for conditioning purposes)
Table 1A. Blend Component Wt. % for R-411A
R-411ABlend
Wt%
Component R-411A
(%)
Tolerance
(%)
GCRetention
Time (Min.)
R-152
HC-1270
R-22
11.0
1.5
87.5
+0, -1.0
+0, -1.0
+2.0, -0
6.15
6.60
9.55
Section 2. Precision, and Accuracy
Statistical parameters for each impurity are listed below. Thedata was obtained by analyzing an R-406A calibration mixture7 times during one day by one operator.
Table 2. Component Statistical Parameters
R-411Component
95% CL
Relative MeanError, wt%
R-152aHC-1270
R-22
±0.004%±0.002%±0.002%
00.09
0
Section 3. Calibration Standard Preparation
The following table is to be used in conjunction with Part 15,The Determination of the Component Concentrations ofRefrigerant 400 and 500 Series Blends and Azeotropes by GasChromatography.
Table 3. Blend Calibration Standard Preparation
R-411AComponent
Amount to Weigh(g)
ApproximateWeight %
HC-1270
R-152a
R-22
28
46
855
3.0
5.0
92.0
Table 1B. Blend Component Wt. % for R-411B
R-411BBlend
Wt%
Component R-411A
(%)
Tolerance
(%)
GC Retention Time(Min.)
R-152
HC-1270
R-22
3.0
3.0
94.0
+0, -1.0
+0, -1.0
+2.0, -0
6.15
6.60
9.55
Table 1C. Blend Component Wt. % for R-411C
R-411CBlend
Wt%
Component R-411A
(%)
Tolerance
(%)
GC Retention Time(Min.)
R-152
HC-1270
R-22
1.5
3.0
95.5
+0, -1.0
+0, -1.0
+2.0, -0
6.15
6.60
9.55
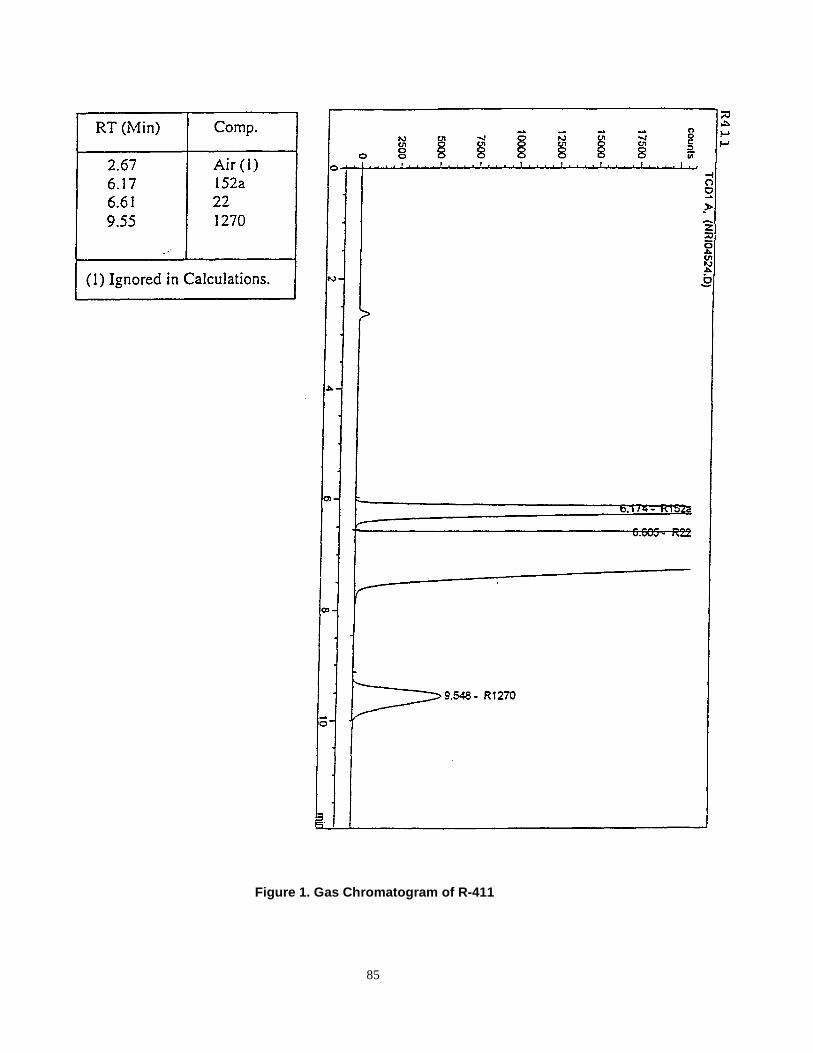
Figure 1. Gas Chromatogram of R-411
85

86
Part 26
R-412A Composition GC Method Data Sheet
Section 1. Gas Chromatographic Conditions
Detector TCD, Low SensitivityCarrier Gas 30 mL He/Min.Initial Column Temp. 100°C (isothermal)Initial Hold -- Min.Program -- K/Min.Final Column Temp. 100°CPost Hold 10 Min.Sample 0.5 mL (gas syringe)Detector Temp. 250°CInj. Port Temp. 200°CMax Safe Column Temp. 225°C (for conditioning purposes)
Table 1. Blend Component Wt. %
R-412ABlend
Wt%
Component R-412A
(%)
Tolerance
(%)
GC RetentionTime (Min.)
R-22
FC-218
R-142b
70.0
5.0
25.0
±2.0
±2.0
±1.0
3.9
4.5
6.9
Section 2. Precision, and Accuracy
Statistical parameters for each impurity are listed below. Thedata was obtained by analyzing an R-412A calibration mixture 7times during one day by one operator.
Table 2. Component Statistical Parameters
R-412AComponent
95% CL
Relative MeanError, wt%
R-22FC-218R-142b
±0.034%±0.014%±0.037%
00.230.4
Section 3. Calibration Standard Preparation
The following table is to be used in conjunction with Part 15,The Determination of the Component Concentrations ofRefrigerant 400 and 500 Series Blends and Azeotropes by GasChromatography.
Table 3. Blend Calibration Standard Preparation
R-412AComponent
Amount to Weigh(g)
ApproximateWeight %
R-142b
FC-218
R-22
244
49
682
25
5
70

Figure 1. Gas Chromatogram of R-412
87

88
Part 27
R-500 Composition GC Method Data Sheet
Section 1. Gas Chromatographic Conditions
Detector TCD, Low SensitivityCarrier Gas 30 mL He/Min.Initial Column Temp. 175°C (isothermal)Initial Hold -- Min.Program -- K/Min.Final Column Temp. 175°CPost Hold 5 Min.Sample 1.0 mL (gas syringe)Detector Temp. 250°CInj. Port Temp. 200°CMax Safe Column Temp. 225°C (for conditioning purposes)
Table 1. Blend Component Wt. %
R-500 Wt%
Component R-500
(%)
Tolerance
(%)
GC RetentionTime (Min.)
R-152a
R-12
26.2
73.8
±1.0
±1.0
2.60
3.15
Section 2. Precision, and Accuracy
Statistical parameters for each impurity are listed below. Thedata was obtained by analyzing an R-500 calibration mixture 7times during one day by one operator.
Table 2. Component Statistical Parameters
R-500Component
95% CL
Relative MeanError, wt%
R-12
R-152a
±0.011%
±0.011%
0.05
0.16
Section 3. Calibration Standard Preparation
The following table is to be used in conjunction with Part 15,The Determination of the Component Concentrations ofRefrigerant 400 and 500 Series Blends and Azeotropes by GasChromatography.
Table 3. Blend Calibration Standard Preparation
R-500Component
Amount to Weigh(g)
ApproximateWeight %
R-12
R-152a
718
255
73.8
26.2
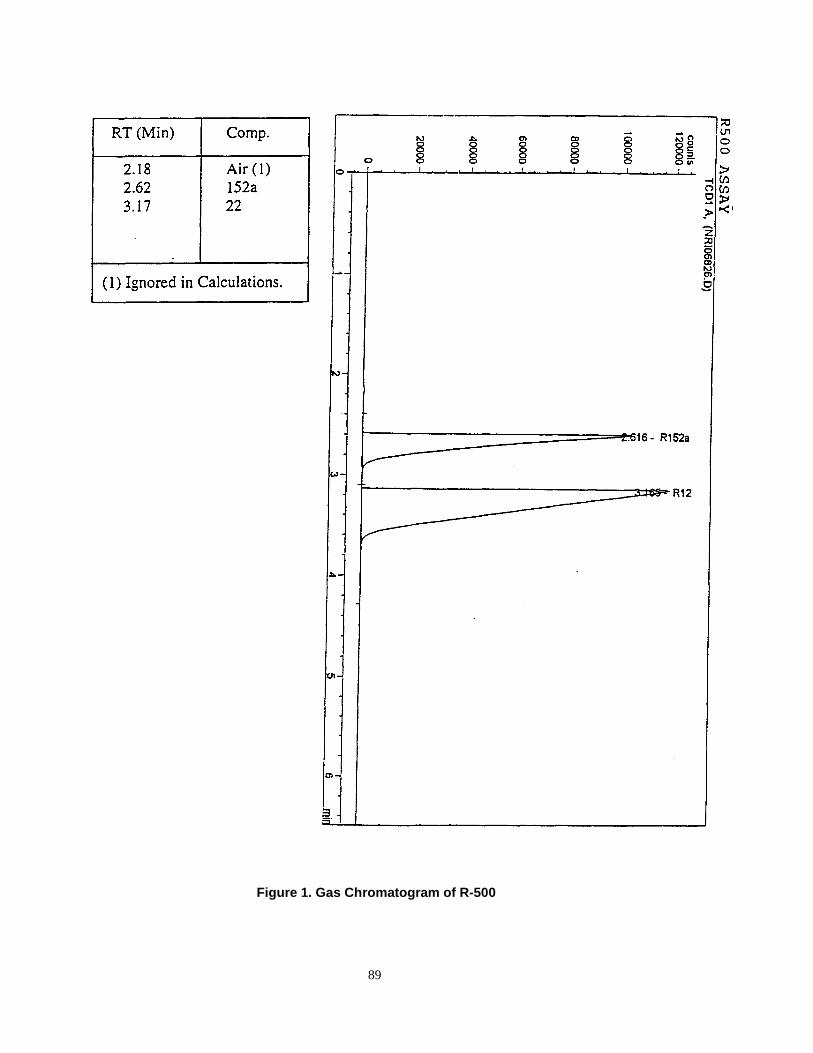
Figure 1. Gas Chromatogram of R-500
89

90
Part 28
R-502 Composition GC Method Data Sheet
Section 1. Gas Chromatographic Conditions
Detector TCD, Low SensitivityCarrier Gas 30 mL He/Min.Initial Column Temp. 150°C (isothermal)Initial Hold -- Min.Program -- K/Min.Final Column Temp. 150°CPost Hold 6 Min.Sample 1.0 mL (gas syringe)Detector Temp. 250°CInj. Port Temp. 200°CMax Safe Column Temp. 225°C (for conditioning purposes)
Table 1. Blend Component Wt. %
R-502 Wt%
Component R-502
(%)
Tolerance
(%)
GC RetentionTime (Min.)
R-22
R-115
48.8
51.2
±4.0
±4.0
2.85
3.30
Section 2. Precision, and Accuracy
Statistical parameters for each impurity are listed below. Thedata was obtained by analyzing an R-502 calibration mixture 7times during one day by one operator.
Table 2. Component Statistical Parameters
R-502Component
95% CL
Relative MeanError, Wt%
R-22
R-115
±0.062%
±0.062%
0.06
0.06
Section 3. Calibration Standard Preparation
The following table is to be used in conjunction with Part 15,The Determination of the Component Concentrations ofRefrigerant 400 and 500 Series Blends and Azeotropes by GasChromatography.
Table 3. Blend Calibration Standard Preparation
R-502Component
Amount to Weigh(g)
ApproximateWeight %
R-22
R-115
495
519
48.8
51.2

Figure 1. Gas Chromatogram of R-502
91

92
Part 29
R-503 Composition GC Method Data Sheet
Section 1. Gas Chromatographic Conditions
Detector TCD, Low SensitivityCarrier Gas 30 mL He/Min.Initial Column Temp. 60°C (isothermal)Initial Hold -- Min.Program -- K/Min.Final Column Temp. 60°CPost Hold 7 Min.Sample 1.0 mL (gas syringe)Detector Temp. 250°CInj. Port Temp. 200°CMax Safe Column Temp. 225°C (for conditioning purposes)
Table 1. Blend Component Wt. %
R-503 Wt%
Component R-503
(%)
Tolerance
(%)
GC RetentionTime (Min.)
R-23
R-13
40.0
60.0
±1.0
±1.0
2.85
3.95
Section 2. Precision, and Accuracy
Statistical parameters for each impurity are listed below. Thedata was obtained by analyzing an R-503 calibration mixture 7times during one day by one operator.
Table 2. Component Statistical Parameters
R-503Component
95% CL
Relative MeanError, Wt%
R-23
R-13
±0.02%
±0.02%
0.03
0.03
Section 3. Calibration Standard Preparation
The following table is to be used in conjunction with Part 15,The Determination of the Component Concentrations ofRefrigerant 400 and 500 Series Blends and Azeotropes by GasChromatography.
Table 3. Blend Calibration Standard Preparation
R-503Component
Amount to Weigh(g)
ApproximateWeight %
R-23
R-13
200
300
40
60

Figure 1. Gas Chromatogram of R-503
93

94
Part 30
R-507 Composition GC Method Data Sheet
Section 1. Gas Chromatographic Conditions
Detector TCD, Low SensitivityCarrier Gas 30 mL He/Min.Initial Column Temp. 40°C (isothermal)Initial Hold -- Min.Program -- K/Min.Final Column Temp. 40°CPost Hold 10 Min.Sample 0.5 mL (gas syringe)Detector Temp. 250°CInj. Port Temp. 200°CMax Safe Column Temp. 225°C (for conditioning purposes)
Table 1. Blend Component Wt. %
R-507 Wt%
Component R-507
(%)
Tolerance
(%)
GC RetentionTime (Min.)
R-143a
R-125
50.0
50.0
±1.0
±1.0
7.00
8.15
Section 2. Precision, and Accuracy
Statistical parameters for each impurity are listed below. Thedata was obtained by analyzing an R-507 calibration mixture 7times during one day by one operator.
Table 2. Component Statistical Parameters
R-507Component
95% CL
Relative MeanError, Wt%
R-143a
R-125
±0.049%
±0.047%
0.11
-0.15
Section 3. Calibration Standard Preparation
The following table is to be used in conjunction with Part 15,The Determination of the Component Concentrations ofRefrigerant 400 and 500 Series Blends and Azeotropes by GasChromatography.
Table 3. Blend Calibration Standard Preparation
R-507Component
Amount to Weigh(g)
ApproximateWeight %
R-143a
R-125
488
488
50
50
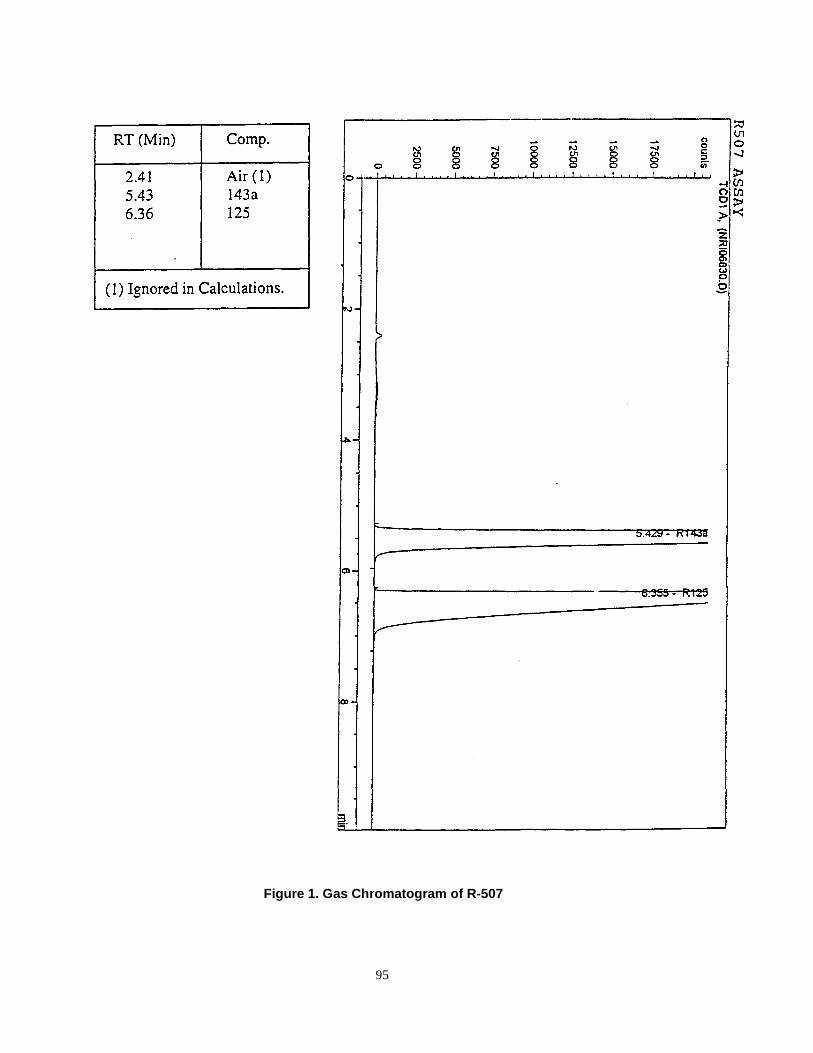
95
Figure 1. Gas Chromatogram of R-507
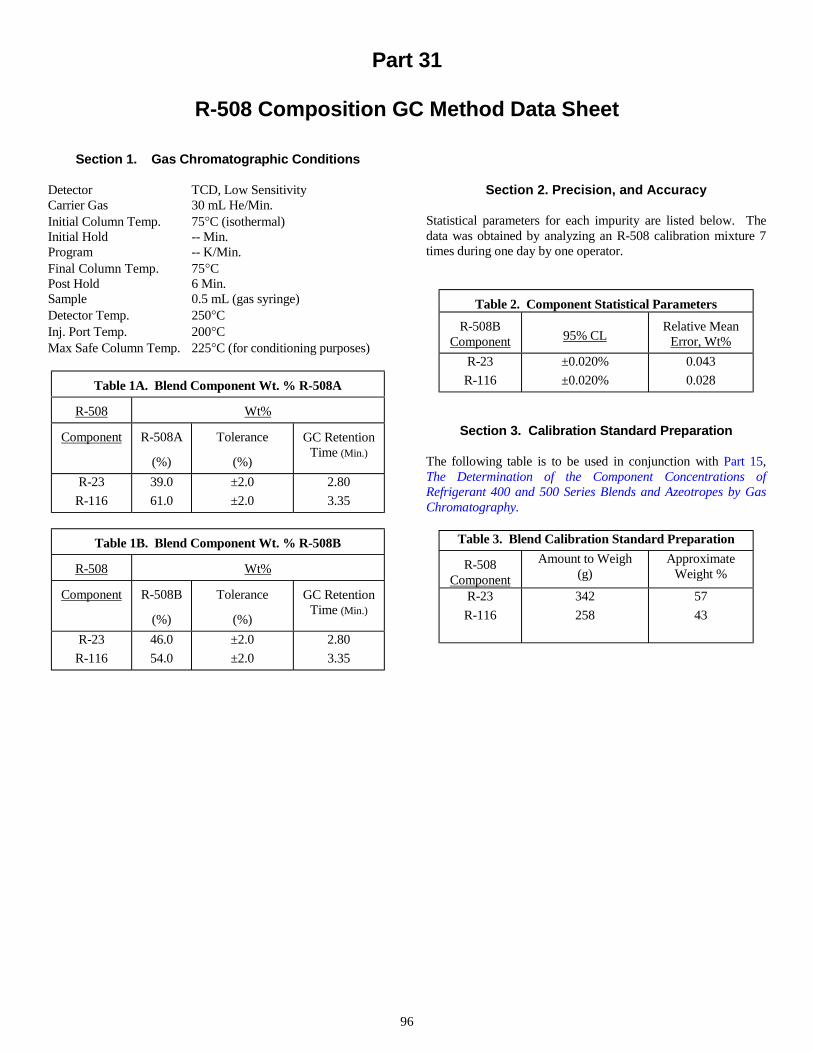
96
Part 31
R-508 Composition GC Method Data Sheet
Section 1. Gas Chromatographic Conditions
Detector TCD, Low SensitivityCarrier Gas 30 mL He/Min.Initial Column Temp. 75°C (isothermal)Initial Hold -- Min.Program -- K/Min.Final Column Temp. 75°CPost Hold 6 Min.Sample 0.5 mL (gas syringe)Detector Temp. 250°CInj. Port Temp. 200°CMax Safe Column Temp. 225°C (for conditioning purposes)
Table 1A. Blend Component Wt. % R-508A
R-508 Wt%
Component R-508A
(%)
Tolerance
(%)
GC RetentionTime (Min.)
R-23
R-116
39.0
61.0
±2.0
±2.0
2.80
3.35
Table 1B. Blend Component Wt. % R-508B
R-508 Wt%
Component R-508B
(%)
Tolerance
(%)
GC RetentionTime (Min.)
R-23
R-116
46.0
54.0
±2.0
±2.0
2.80
3.35
Section 2. Precision, and Accuracy
Statistical parameters for each impurity are listed below. Thedata was obtained by analyzing an R-508 calibration mixture 7times during one day by one operator.
Table 2. Component Statistical Parameters
R-508BComponent
95% CL
Relative MeanError, Wt%
R-23
R-116
±0.020%
±0.020%
0.043
0.028
Section 3. Calibration Standard Preparation
The following table is to be used in conjunction with Part 15,The Determination of the Component Concentrations ofRefrigerant 400 and 500 Series Blends and Azeotropes by GasChromatography.
Table 3. Blend Calibration Standard Preparation
R-508Component
Amount to Weigh(g)
ApproximateWeight %
R-23
R-116
342
258
57
43

Figure 1. Gas Chromatogram of R-508
97
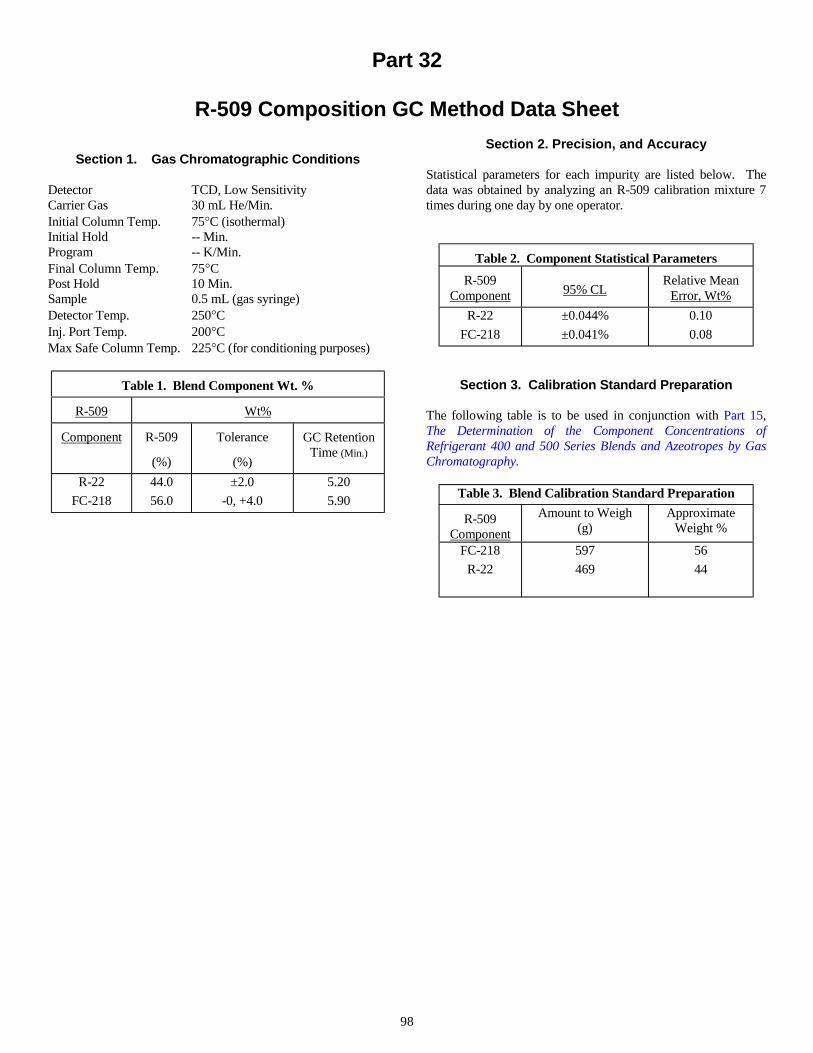
98
Part 32
R-509 Composition GC Method Data Sheet
Section 1. Gas Chromatographic Conditions
Detector TCD, Low SensitivityCarrier Gas 30 mL He/Min.Initial Column Temp. 75°C (isothermal)Initial Hold -- Min.Program -- K/Min.Final Column Temp. 75°CPost Hold 10 Min.Sample 0.5 mL (gas syringe)Detector Temp. 250°CInj. Port Temp. 200°CMax Safe Column Temp. 225°C (for conditioning purposes)
Table 1. Blend Component Wt. %
R-509 Wt%
Component R-509
(%)
Tolerance
(%)
GC RetentionTime (Min.)
R-22
FC-218
44.0
56.0
±2.0
-0, +4.0
5.20
5.90
Section 2. Precision, and Accuracy
Statistical parameters for each impurity are listed below. Thedata was obtained by analyzing an R-509 calibration mixture 7times during one day by one operator.
Table 2. Component Statistical Parameters
R-509Component
95% CL
Relative MeanError, Wt%
R-22
FC-218
±0.044%
±0.041%
0.10
0.08
Section 3. Calibration Standard Preparation
The following table is to be used in conjunction with Part 15,The Determination of the Component Concentrations ofRefrigerant 400 and 500 Series Blends and Azeotropes by GasChromatography.
Table 3. Blend Calibration Standard Preparation
R-509Component
Amount to Weigh(g)
ApproximateWeight %
FC-218
R-22
597
469
56
44

Figure 1. Gas Chromatogram of R-509
99

100
PART 33
GENERAL PROCEDURE FOR THE DETERMINATION OF PURITY OF NEW AND RECLAIMED REFRIGERANT BLENDS AND
AZEOTROPES BY GAS CHROMATOGRAPHY
Section 1. Purpose
The purpose of this test method is to determine the purity ofnew and reclaimed Refrigerants 400 (R-400) and 500 (R-500)series blends and azeotropes by Gas Chromatography (GC).
Section 2. Scope
This test method is for use in conjunction with the GC MethodData Sheets for the refrigerants listed in Section 11 of thismethod.
Section 3. Definitions
Definitions for this part are identical to those of ARI Standards700-95 and 740-95.
Section 4. Principle
The organic purity of new and reclaimed refrigerant blends andazeotropes is determined by programmed temperature gaschromatography using a packed column and a flame ionizationdetector (FID). Component peak areas are integratedelectronically and quantified by the area normalization-responsefactor method.
Section 5. Applicability
This method is applicable to the determination of the impuritiestypically present in new and reclaimed refrigerants.
Section 6. Limitations and Interferences
For new refrigerant blends and azeotropes, it is imperative thatthe constituent components of the blend be separately analyzedprior to blending; this will permit greater scrutiny than analysisafter blending. This method will not detect any impurity thatmay elute with one of the blend components.
If blend composition determination is desired, refer to Part 15,Determination of the Component Concentrations of Refrigerant400 and 500 Series Blends and Azeotropes by GasChromatography.
Section 7. Sensitivity, Precision, and Accuracy
7.1 Sensitivity
Values for these statistical parameters are given in Table 1Aand 1B of each respective refrigerant’s GC Method Data Sheet.
Section 8. Special Apparatus and Reagents
NOTE: Equivalents may be substituted.
1. Gas chromatograph: Model 5890, equipped with FID,Hewlett Packard, Wilmington, DE.
2. Electronic integrator: Model# 3396, Hewlett Packard,Wilmington, DE.
3. Packed column: formed by joining together two 7.32 mx 3.17 mm OD stainless steel, 1% SP-1000 onCarbopack B, 60/80 mesh, Supelco, Bellefonte, PA.
4. Glass collecting tubes: 500 mL, 250 mL and 125 mL,LG-8601, Lab Glass Inc., Vineland, NJ. (Enlarge sideoutlet opening to accommodate a crimp-on 2-cm septum.Apply fiberglass tape outside for protection frombreakage)
5. Steel cylinder: 1L, with a single #9 valve (#1014-C,Superior Valve), 3/8" pipe neck, E. F. Britten Co.,Cranford, NJ.
6. Deflected point needles: Cat# 7174, #22, Popper andSons, Inc., New Hyde Park, NY.
7. Swivel union: US44, United Refrig. Inc., Philadelphia,PA.
8. Serum bottle: 125 mL, (Note: Bottle holds 160 mL whenliquid full.) Cat# 223748, Wheaton Glass, Vineland, NJ.
9. Impurities for calibration standard preparation: Thefluorochemicals may be purchased from Lancaster,Windham, NH and Synquest, Inc., Alachua, FL. Thehydrocarbons may be purchased from Scott SpecialtyGases, Inc., Plumbsteadville, PA. All other impuritiesmay be purchased from Aldrich, Milwaukee, WI. SeeTable 2 of the GC Method Data sheet for the specificimpurities required for each refrigerant.
NOTE: The purity of each calibration component must bepredetermined by gas chromatography and, ifnecessary, by GC/Mass Spectroscopy (GC-MS).
10. Stainless steel cylinder: 1L, 304L-WDF4-1000, and300mL cylinder, 304L-WDF4-300, 1/4" pipe, WhiteyCo., Highland Heights, OH.
Section 9. Procedure
NOTE: The following procedure is generalized for thedetermination of purity for blends and azeotropes.Each respective GC Method Data Sheet contains thechromatogram, statistical parameters and impurities tobe added for calibration standard preparation.

101
9.1 Chromatographic Operating Conditions
Detector FIDCarrier Gas Helium; 28 ml min-1
Initial Column Temp. 35º CInitial Hold 14 minProgram 10 K min-1
Final Column Temp. 160º CPost Hold 34 minSample 500 µl loopDetector Temp. 200º CInjection Port Temp. 150º C
9.2 Calibration Standard Preparation: Major Components
NOTE: The procedure here is generalized and is followed forthe preparation of each blend calibration standard. Theweights of each blend component to be added and theorder of addition are given in the appended GCMethod Data Sheets for each respective refrigerantblend. Normally, the least volatile components areadded first. To determine the composition of theprepared blends and azeotropes, refer to Part 15,Determination of the Component Concentrations ofRefrigerants 400 and 500 Series Blends andAzeotropes by Gas Chromatography.
a. Evacuate a clean, dry 1L stainless steel CalibrationStandard cylinder to 25 Pa. Break the vacuum and allowthe cylinder to fill with air. Re-evacuate the cylinder to25 Pa.
b. Weigh the Calibration Standard cylinder to the nearest0.01 gram.
c. Using a Teflon flex transfer line, attach the CalibrationStandard cylinder to the first component supply cylinder(liquid phase valve) via a vacuum manifold and absolutepressure gauge (refer to Table 1C of the appropriate GCMethod Data Sheet).
d. Gradually open the metering valve and add the firstcomponent as a vapor (vaporized liquid phase) until thegauge reaches the pressure indicated in Table 1C of theGC Method Data Sheet.
NOTE: If too much refrigerant component is added, thecylinder must be vented. Venting is permitted onlyduring addition of the first component and notthereafter.
e. Close the Calibration Standard cylinder valve, remove itfrom the vacuum manifold, and reweigh the cylinder tothe nearest .01g.
f. Subtract the cylinder tare weight (step b) from the weightin step e and record the as the weight of the firstcomponent.
g. Repeat steps c through f for the second component.
NOTE: It is often simpler to prepare a second cylindercontaining the exact weight of the second and also
subsequent components to be added—then transferringthe entire contents (or nearly so) into the CalibrationStandard cylinder using dry ice or liquid nitrogen toexternally cool the Calibration Standard cylinder.Allow the cylinder to warm to ambient temperaturebefore weighing.
h. Repeat steps c through f for a third and (if necessary) afourth component.
i. Add the weights of all the added components and thendetermine the weight percentage (to the nearest 0.01%) ofeach component in the component mixture. If necessary,correct the individual component percentages for thepurities determined in the Note of Section 8.9. (Also, seeNote 1 of Section 10)
9.3 Calibration Standard Preparation: Addition ofContaminants
a. Attach a Swagelok nut and septum to the CalibrationStandard cylinder and then chill the base of the cylinder inliquid nitrogen for 15 minutes. Do not purge the cylinderwhen attaching the septum, as this would alter therelationship between the blend components and thecontaminants. Instead, the small amount of air behind theseptum is permitted to enter the standard when the valveis opened.
b. Verify that the septum is still attached securely, then openthe cylinder valve while keeping the cylinder immersed inthe liquid nitrogen.
c. Using appropriately sized vapor syringes, individually andin turn add the gaseous contaminants listed in Table 2 ofeach respective GC Method Data Sheet in the amountsindicated. This is done by flashing liquid phase into thegas bulb shown in Figure 1 and then withdrawing thespecified amount of vapor into the gas tight syringe andinjecting through the septum attached to the cylinder. Theindicated vapor densities are based on a laboratorytemperature of 20.0º C and a barometric pressure of 100.0kPa. This data must be adjusted to reflect actuallaboratory conditions.
d. Using appropriately sized liquid syringes, individuallyand in turn add the liquid contaminants listed in Table 2 inthe amounts indicated (Special care must be taken toaccount for the syringe needle volume). For bestaccuracy, these contaminants and syringes should bepre-chilled in a freezer (approximately -20º C) andpromptly transferred. The indicated liquid densities arebased on a liquid temperature of 0º C and a barometricpressure of 100.0 kPa. This data must be adjusted toreflect the actual conditions surrounding the transfer.
e. Close the Standard Cylinder valve and allow theCalibration Standard cylinder to return to ambienttemperature. Set the cylinder aside for a minimum of 12hours to allow the cylinder’s contents to equilibrate. Rollthe cylinder while still cold for at least 4 hours to ensurethorough mixing.

102
f. Using a gas tight syringe, withdraw the vapor samplefrom the Calibration Standard cylinder andchromatograph the exact volume listed in Section 9.1. Ifa gas sampling loop is attached to the GC, purge the loopwith the calibration standard, allow the loop to return toatmospheric pressure and then inject the sample into theGC. Chromatograph the standard as indicated in Section9.1, and adjust the standard’s recorded component andcontaminant levels, in milligrams, to account for anysignificant impurities present in the starting materialsusing the method of Standards Addition (see Note 1 inSection 10).
g. Determine the weight percentage of each majorcomponent and each contaminant in the calibrationstandard using the formula:
Std. Cal. of Mass Total
Std.) Cal.in x of Mass)(100( xWt% =
Weight percentages are calculated to the nearest 0.01%for each major component and to the nearest 0.0001% foreach contaminant.
9.4 Determination of Major Component Response Factors
a. Analyze the standard in triplicate using thechromatographic conditions given in Section 9.1.Because the standard is vapor phase, it can be transferreddirectly to the gas chromatograph (via the gas samplingloop or gas sampling bulb/syringe) without furtherpreparation or sampling.
b. Average the peak areas obtained for each majorcomponent of either the blend or azeotrope.
c. Calculate relative response factors (RRF’s) for each majorcomponent as follows:
ii
A
Std. Cal.in i Comp. Wt% ARF =
Where:
RRFi = relative response factor for component i.Ai = peak area of component i.
Then, using the component with the highest area count inthe mixture as the reference peak the RRF Factors aredetermined as follows:
x
ii ARF
ARFRRF = and
1ARF
ARFRRF
x
x ==x
ARFi = absolute response factor for component i.ARFx = absolute response factor for the component withthe highest area count in the mixture.RRFi = relative response factor for component i.
RRFx = relative response factor for the component withthe highest area count in the mixture.
RRF values are computed to the nearest 0.0001 unit.
9.5 Determination of Contaminant Response Factors
Using the highest area count major component as thereference peak, determine and record each contaminant’srelative response factor (RRF) as follows:
ARFWt% i in Cal. Std.
Aii
=
Where:
ARFi = Absolute Response Factor of contaminant i.Ai = peak area of component i (average of 3
determinations).
Then using the highest area count component in theblend as the reference peak:
RRFi =
Again, RRFi values are computed to the nearest 0.0001unit.
9.6 Sampling
High Pressure (HP) sample cylinders should be filled at least80% but no more than 90% liquid full. This will both minimizecomponent fractionation within the sample container and willavoid overfilling for safety considerations. Very high pressure(VHP) sample cylinders (vapor phase) may be filled to less thansaturation pressure, if desired.
9.7 Sample Analysis
Analyze the sample using the chromatographic conditionsdescribed in Section 9.1. Load the sample as illustrated inFigure 1 except that the gas sampling bulb is replaced by a 300mL stainless steel cylinder. Flash the sample liquid phase so asto bring the pressure to just below saturation. Questionablesample results are most often resolved by re-analysis of thecalibration standard. The temperature of the sample must equal(essentially) that of the calibration standard at the time of GCcalibration. In the case of VHP refrigerants, the sample must beat or above the critical temperature before analysis.
9.8 Calculations
a. The weight percentage of each component is calculated asfollows:
W100 x RRF x A
(A x RRFii i
i i
=∑ )
Where:
Wi = weight percentage of component i.RRFi = relative response factor for component i.
ARFi–––––ARFx

103
Ai = peak area of component i.Σ…= sum of all component peak areas times their
respective relative response factors.
Section 10. Notes
1. The purest refrigerant blend will contain some of thecontaminants listed in Table 1 of the GC Method DataSheet in low concentrations. Individual impurity peakareas are increased in the calibration standard by the peakareas that correspond to the mass of the impurity added.The amounts of each contaminant in the stockcomponents are thereby determined by the method ofStandards Addition. The mass of each contaminantpresent is combined with the mass added to give the totalmass of each contaminant in the calibration standard.
Section 11. GC Method Data Sheets
Table 1. GC Method Data Sheets
RefrigerantGC Method Data
Sheet PartNumber
R-401 Part 34R-402 Part 35R-404 Part 36R-405 Part 37R-406 Part 38R-407 Part 39R-408 Part 40R-409 Part 41R-410 Part 42R-411 Part 43R-412 Part 44R-500 Part 45R-502 Part 46R-503 Part 47R-507 Part 48R-508 Part 49R-509 Part 50
Section 12. References
1. Air-Conditioning and Refrigeration Institute, Appendix C toARI Standard 700-95: Analytical Procedures for ARIStandard 700-95, 4301 North Fairfax Drive, Arlington,Virginia 22203.
2. Integral Sciences, Inc., Methods Development for OrganicContaminant Determination in Fluorocarbon RefrigerantAzeotropes and Blends, ARTI MCLR Project Number 665-54600.
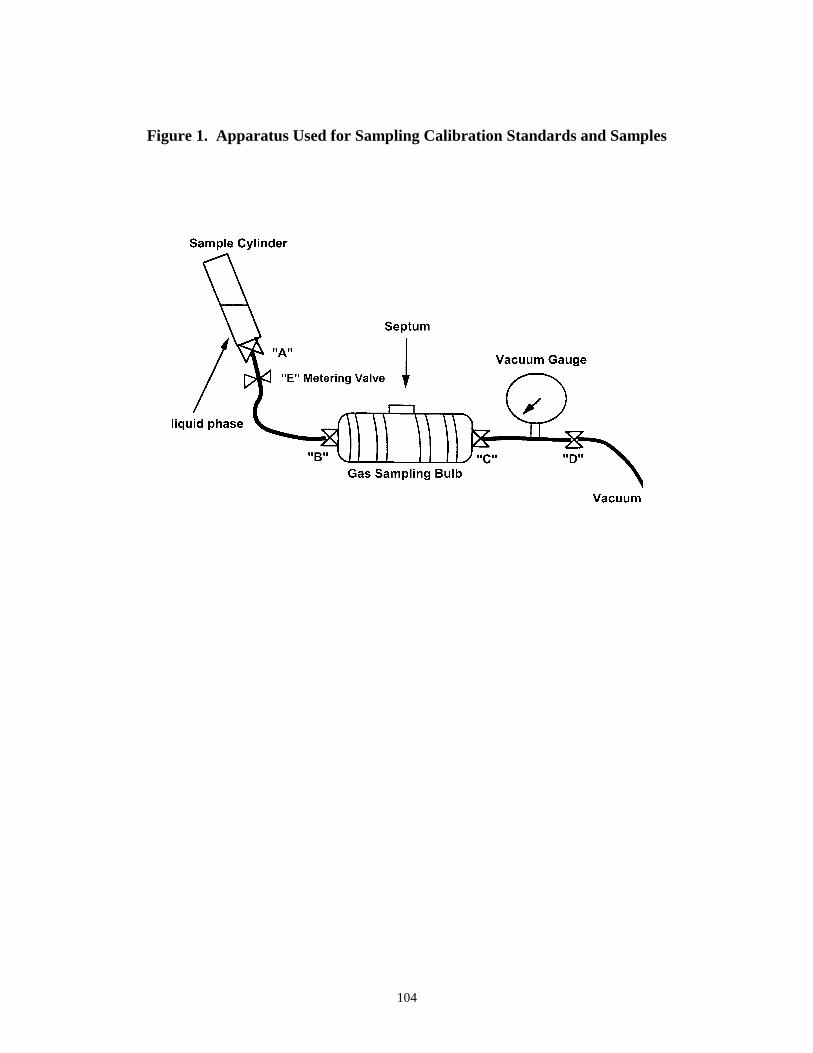
104
Figure 1. Apparatus Used for Sampling Calibration Standards and Samples

105
Part 34
R-401 Purity GC Method Data Sheet
Section 1. Scope
This GC Method Data Sheet is for use in conjunction with Part33, General Procedure for the Determination of Purity of Newand Reclaimed Refrigerant Blends and Azeotropes by GasChromatography (hereafter referred to as General Procedure).This GC Method Data Sheet is for use with R-401 blends.
Section 2. Limitations and Interferences
This method is applicable and calibrated for only thoseimpurities commonly present in R-401 blends (See Table 2).This method will not detect any impurity that may elute withinthe comparatively large HCFC-22, HCFC-124, and HFC-152apeak matrices. For example, HFC-125 elutes on the far shoulderof the large HFC-152a peak and is therefore difficult to detect atlow concentrations. Linearity of the HFC-125 response is
marginal and limits the precision in the determination of thisimpurity. The contaminants HFC-23 and HFC-32 also elutetogether, but these may be separated if needed by adding a0.30 m column section of Porapak-T to the end of the primarycolumn.
Section 3. Sensitivity, Precision, and Accuracy
Statistical parameters for each impurity are listed in Table 1Aand B. The data was obtained by analyzing an R-401 calibrationmixture 7 times during one day by one operator.
Section 4. Tables
The following tables are to be used in conjunction with Section 9of the General Procedure for the Determination of Purity of Newand Reclaimed Refrigerants by Gas Chromatography.
Figure 1. Gas Chromatogram of R-401

106
Table 1A. Contaminant Statistical Parameters
Component DetectionLimit, ppm
RangeInvestigated,
ppm
Precision at 95%Confidence Limit, ppm
methane 1 100 2.823 10 450 10.32 5 450 7.8
ethene 1 450 7.1ethane 1 200 2.6
13 12 450 9.5143a 2 450 12134a 3 450 5.11301 9 450 4.1218 6 450 7.0
propene 1 100 1.4115 7 450 3212 8 450 13
142b 2 450 29133a 2 450 1821 5 450 31
isobutane 1 100 2.3114 5 450 8.011 6 450 41
123 2 450 44113 2 450 60.
Table 1B. Component Statistical Parameters
Component DetectionLimit, ppm
RangeInvestigated,
Wt. %
Precision at 95%Confidence Limit
152a 2 13 % 0.10 %22 5 53 % 0.51 %
124 5 34 % 0.26 %
Table 1C. Blend Component Balance Preparation
ComponentFinal Pressure
AfterComponent
Addition (kPa)
Weight of RefrigerantAdded (g)
HCFC-124 118 6.80
HFC-152a 206 2.60
HCFC-22 466 10.60
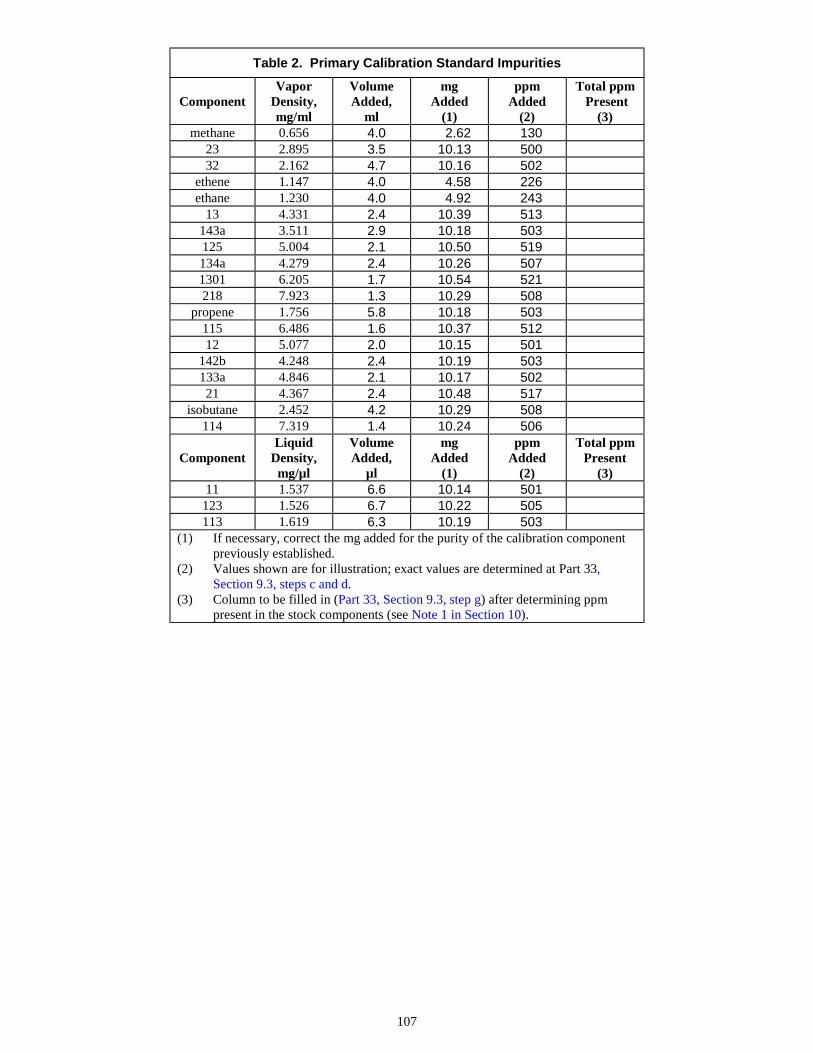
107
Table 2. Primary Calibration Standard Impurities
ComponentVapor
Density,mg/ml
VolumeAdded,
ml
mgAdded
(1)
ppmAdded
(2)
Total ppm Present
(3)methane 0.656 4.0 2.62 130
23 2.895 3.5 10.13 50032 2.162 4.7 10.16 502
ethene 1.147 4.0 4.58 226ethane 1.230 4.0 4.92 243
13 4.331 2.4 10.39 513143a 3.511 2.9 10.18 503125 5.004 2.1 10.50 519134a 4.279 2.4 10.26 5071301 6.205 1.7 10.54 521218 7.923 1.3 10.29 508
propene 1.756 5.8 10.18 503115 6.486 1.6 10.37 51212 5.077 2.0 10.15 501
142b 4.248 2.4 10.19 503133a 4.846 2.1 10.17 50221 4.367 2.4 10.48 517
isobutane 2.452 4.2 10.29 508114 7.319 1.4 10.24 506
ComponentLiquid
Density,mg/µl
VolumeAdded,
µl
mgAdded
(1)
ppmAdded
(2)
Total ppmPresent
(3)11 1.537 6.6 10.14 501
123 1.526 6.7 10.22 505113 1.619 6.3 10.19 503
(1) If necessary, correct the mg added for the purity of the calibration componentpreviously established.
(2) Values shown are for illustration; exact values are determined at Part 33,Section 9.3, steps c and d.
(3) Column to be filled in (Part 33, Section 9.3, step g) after determining ppmpresent in the stock components (see Note 1 in Section 10).

108
Part 35
R-402 Purity GC Method Data Sheet
Section 1. Scope
This GC Method Data Sheet is for use in conjunction with Part33, General Procedure for the Determination of Purity of Newand Reclaimed Refrigerant Blends and Azeotropes by GasChromatography (hereafter referred to as General Procedure).This GC Method Data Sheet is for use with R-402 blends.
Section 2. Limitations and Interferences
This method is calibrated only for those impurities commonlypresent in R-402 blends. This method will not detect anyimpurity that may elute within the comparatively largeHCFC-22, HFC-125, and propane peak matrices. For example,HFC-134a elutes on the far shoulder of the large HFC-125 peakand is therefore difficult to detect at low concentrations.Linearity of the HFC-134a response is marginal and limits theprecision in the determination of this impurity. Detection of
CFC-115 is not resolved as it would coelute with the propane.The contaminants HFC-23 and HFC-32 also elute together, butthese may be separated if needed by adding a 0.30 m columnsection of Porapak-T to the end of the primary column.
Section 3. Sensitivity, Precision, and Accuracy
Statistical parameters for each impurity are listed in Table 1Aand B. The data was obtained by analyzing an R-402 calibrationmixture 7 times during one day by one operator.
Section 4. Tables
The following tables are to be used in conjunction with Part 33of the General Procedure for the Determination of Purity ofReclaimed Refrigerant Blends and Azeotropes by GasChromatography.
Figure 1. Gas Chromatogram of R-402
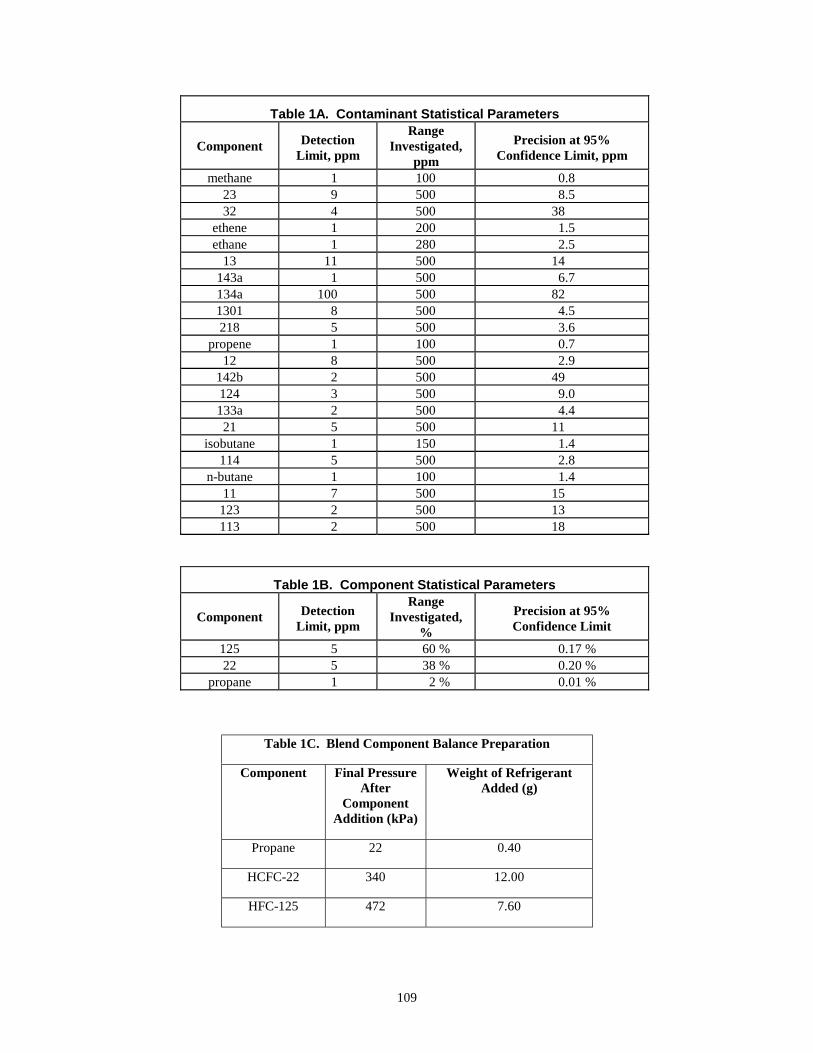
109
Table 1A. Contaminant Statistical Parameters
Component DetectionLimit, ppm
RangeInvestigated,
ppm
Precision at 95%Confidence Limit, ppm
methane 1 100 0.823 9 500 8.532 4 500 38
ethene 1 200 1.5ethane 1 280 2.5
13 11 500 14143a 1 500 6.7134a 100 500 821301 8 500 4.5218 5 500 3.6
propene 1 100 0.712 8 500 2.9
142b 2 500 49124 3 500 9.0133a 2 500 4.421 5 500 11
isobutane 1 150 1.4114 5 500 2.8
n-butane 1 100 1.411 7 500 15
123 2 500 13113 2 500 18
Table 1B. Component Statistical Parameters
Component DetectionLimit, ppm
RangeInvestigated,
%
Precision at 95%Confidence Limit
125 5 60 % 0.17 %22 5 38 % 0.20 %
propane 1 2 % 0.01 %
Table 1C. Blend Component Balance Preparation
Component Final PressureAfter
ComponentAddition (kPa)
Weight of RefrigerantAdded (g)
Propane 22 0.40
HCFC-22 340 12.00
HFC-125 472 7.60

110
Table 2. Primary Calibration Standard Impurities
ComponentVapor
Density,mg/ml
VolumeAdded,
ml
mgAdded
(1)
ppmAdded
(2)
Total ppmPresent
(3)methane 0.656 4.0 2.62 130
23 2.895 3.5 10.13 50032 2.162 4.7 10.16 502
ethene 1.147 4.0 4.58 226ethane 1.230 4.0 4.92 243
13 4.331 2.4 10.39 513143a 3.511 2.9 10.18 503152a 2.772 3.7 10.25 506134a 4.279 2.4 10.26 5071301 6.205 1.7 10.54 521218 7.923 1.3 10.29 508
propene 1.756 5.8 10.18 50312 5.077 2.0 10.15 501
142b 4.248 2.4 10.19 503124 5.758 1.8 10.36 512133a 4.846 2.1 10.17 50221 4.367 2.4 10.48 517
isobutane 2.452 4.2 10.29 508114 7.319 1.4 10.24 506
n-butane 2.463 4.2 10.34 511
ComponentLiquid
Density,mg/µl
VolumeAdded,
µl
mgAdded
(1)
ppmAdded
(2)
Total ppm Present
(3)11 1.537 6.6 10.14 501123 1.526 6.7 10.22 505113 1.619 6.3 10.19 503
(1) If necessary, correct the mg added for the purity of the calibration componentpreviously established.
(2) Values shown are for illustration; exact values are determined in Part 33,Section 9.3, steps c and d.
(3) Column to be filled in (Part 33, Section 9.3 step g) after determining ppmpresent in the stock components (see Note 1 in Section 10).

111
Part 36
R-404 Purity GC Method Data Sheet
Section 1. Scope
This GC Method Data Sheet is for use in conjunction with Part33, General Procedure for the Determination of Purity of Newand Reclaimed Refrigerant Blends and Azeotropes by GasChromatography (hereafter referred to as General Procedure).This GC Method Data Sheet is for use with R-404 blends.
Section 2. Limitations and Interferences
This method is calibrated only for those impurities commonlypresent in R-404A. This method will not detect any impuritythat may elute within the comparatively large HFC-125,HFC-134a, and HFC-143a peak matrices. The contaminantsHFC-23 and HFC-32 also elute together, but these may be
separated if needed by adding a 0.30 m column section ofPorapak-T to the end of the primary column.
Section 3. Sensitivity, Precision, and Accuracy
Statistical parameters for each impurity are listed in Table 1Aand B. The data was obtained by analyzing an R-404 calibrationmixture 7 times during one day by one operator.
Section 4. Tables
The following tables are to be used in conjunction with Part 33of the General Procedure for the Determination of Purity ofReclaimed Refrigerant Blends and Azeotropes by GasChromatography.
Figure 1. Gas Chromatogram of R-404A

112
Table 1A. Contaminant Statistical Parameters
Component DetectionLimit, ppm
RangeInvestigated,
ppm
Precision at 95%Confidence Limit, ppm
methane 1 120 3.123 10 520 6.732 4 520 7.9
ethene 1 520 5.1ethane 1 230 2.5
13 10 520 9.422 7 520 12
1301 7 520 21218 5 520 16
propene 1 130 2.1115 6 4400 9712 7 520 19
142b 2 520 89124 3 520 82133a 2 520 1221 5 520 39
isobutane 1 130 3.0114 4 350 4.6114a 4 170 2.911 7 520 73
123 2 520 50
Table 1B. Component Statistical Parameters
Component DetectionLimit, ppm
RangeInvestigated,
%
Precision at 95%Confidence Limit
143a 4 52 % 0.62 %125 4 44 % 0.61 %134a 3 4 % 0.15 %
Table 1C. Blend Component Balance Preparation
ComponentFinal Pressure
AfterComponent
Addition (kPa)
Weight of RefrigerantAdded (g)
R-134a 19 0.80
R-143a 304 10.4
R-125 458 8.80

113
Table 2. Primary Calibration Standard Impurities
ComponentVapor
Density,mg/ml
VolumeAdded,
ml
mgAdded
(1)
ppmAdded
(2)
Total ppmPresent
(3)methane 0.656 4.0 2.62 130
23 2.895 3.5 10.13 50032 2.162 4.7 10.16 502
ethene 1.147 4.0 4.58 226ethane 1.230 4.0 4.92 243
13 4.331 2.4 10.39 513152a 2.772 3.7 10.25 50622 3.606 2.9 10.45 516
1301 6.205 1.7 10.54 521218 7.923 1.3 10.29 508
propene 1.756 5.8 10.18 503115 6.486 1.6 10.37 51212 5.077 2.0 10.15 501
142b 4.248 2.4 10.19 503124 5.758 1.8 10.36 512133a 4.846 2.1 10.17 50221 4.367 2.4 10.48 517
isobutane 2.452 4.2 10.29 508114 7.319 1.4 10.24 506
ComponentLiquid
Density,mg/µl
VolumeAdded,
µl
mgAdded
(1)
ppmAdded
(2)
Total ppmPresent
(3)11 1.537 6.6 10.14 501123 1.526 6.7 10.22 505113 1.619 6.3 10.19 503
(1) If necessary, correct the mg added for the purity of the calibration componentpreviously established.
(2) Values shown are for illustration; exact values are determined at Part 33,Section 9.3, steps c and d.
(3) Column to be filled in (Part 33, Section 9.3, step g) after determining ppmpresent in the stock components (see Note 1 in Section 10).

114
Part 37
R-405 GC Method Data Sheet
Section 1. Scope
This GC Method Data Sheet is for use in conjunction with Part33, General Procedure for the Determination of Purity of Newand Reclaimed Refrigerant Blends and Azeotropes by GasChromatography (hereafter referred to as General Procedure).This GC Method Data Sheet is for use with R-405 blends.
Section 2. Limitations and Interferences
This method is calibrated only for those impurities commonlypresent in R-405A. This method will not detect any impuritythat may elute within the comparatively large HCFC-22,HCFC-142b, HFC-152a, and FC-C318 peak matrices. Forexample, HFC-125 elutes on the far shoulder of the largeHFC-152a peak and is therefore difficult to detect at lowconcentrations. Linearity of the HFC-125 response is marginal
and limits the precision in the determination of this impurity.The contaminants HFC-23 and HFC-32 also elute together, butthese may be separated if needed by adding a 0.30 m columnsection of Porapak-T to the end of the primary column.
Section 3. Sensitivity, Precision, and Accuracy
Statistical parameters for each impurity are listed in Table 1Aand B. The data was obtained by analyzing an R-405 calibrationmixture 7 times during one day by one operator.
Section 4. Tables
The following tables are to be used in conjunction with Part 33of the General Procedure for the Determination of Purity ofReclaimed Refrigerant Blends and Azeotropes by GasChromatography.
Figure 1. Gas Chromatogram of R-405
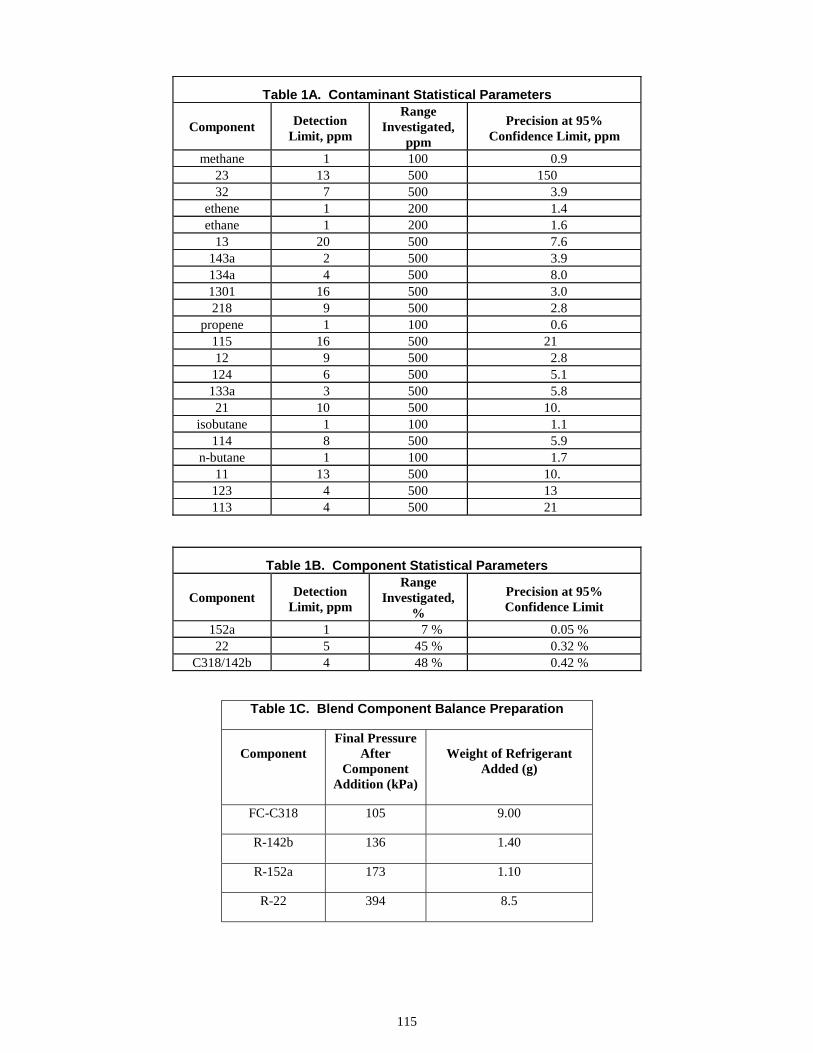
115
Table 1A. Contaminant Statistical Parameters
Component DetectionLimit, ppm
RangeInvestigated,
ppm
Precision at 95%Confidence Limit, ppm
methane 1 100 0.923 13 500 15032 7 500 3.9
ethene 1 200 1.4ethane 1 200 1.6
13 20 500 7.6143a 2 500 3.9134a 4 500 8.01301 16 500 3.0218 9 500 2.8
propene 1 100 0.6115 16 500 2112 9 500 2.8
124 6 500 5.1133a 3 500 5.821 10 500 10.
isobutane 1 100 1.1114 8 500 5.9
n-butane 1 100 1.711 13 500 10.
123 4 500 13113 4 500 21
Table 1B. Component Statistical Parameters
Component DetectionLimit, ppm
RangeInvestigated,
%
Precision at 95%Confidence Limit
152a 1 7 % 0.05 %22 5 45 % 0.32 %
C318/142b 4 48 % 0.42 %
Table 1C. Blend Component Balance Preparation
ComponentFinal Pressure
AfterComponent
Addition (kPa)
Weight of RefrigerantAdded (g)
FC-C318 105 9.00
R-142b 136 1.40
R-152a 173 1.10
R-22 394 8.5

116
Table 2. Primary Calibration Standard Impurities
ComponentVapor
Density,mg/ml
VolumeAdded,
ml
mgAdded
(1)
ppmAdded
(2)
Total ppm Present
(3)methane 0.656 4.0 2.62 130
23 2.895 3.5 10.13 50032 2.162 4.7 10.16 502
ethene 1.147 4.0 4.58 226ethane 1.230 4.0 4.92 243
13 4.331 2.4 10.39 513143a 3.511 2.9 10.18 503125 5.004 2.1 10.50 519134a 4.279 2.4 10.26 5071301 6.205 1.7 10.54 521218 7.923 1.3 10.29 508
propene 1.756 5.8 10.18 503115 6.486 1.6 10.37 51212 5.077 2.0 10.15 501124 5.758 1.8 10.36 512133a 4.846 2.1 10.17 50221 4.367 2.4 10.48 517
isobutane 2.452 4.2 10.29 508114 7.319 1.4 10.24 506
n-butane 2.463 4.2 10.34 511
ComponentLiquid
Density,mg/µl
VolumeAdded,
µl
mgAdded
(1)
ppmAdded
(2)
Total ppmPresent
(3)11 1.537 6.6 10.14 501123 1.526 6.7 10.22 505113 1.619 6.3 10.19 503
(1) If necessary, correct the mg added for the purity of the calibration componentpreviously established.
(2) Values shown are for illustration; exact values are determined at Part 33,Section 9.3, steps c and d.
(3) Column to be filled in (Part 33, Section 9.3, step g) after determining ppmpresent in the stock components (see Note 1 in Section 10).
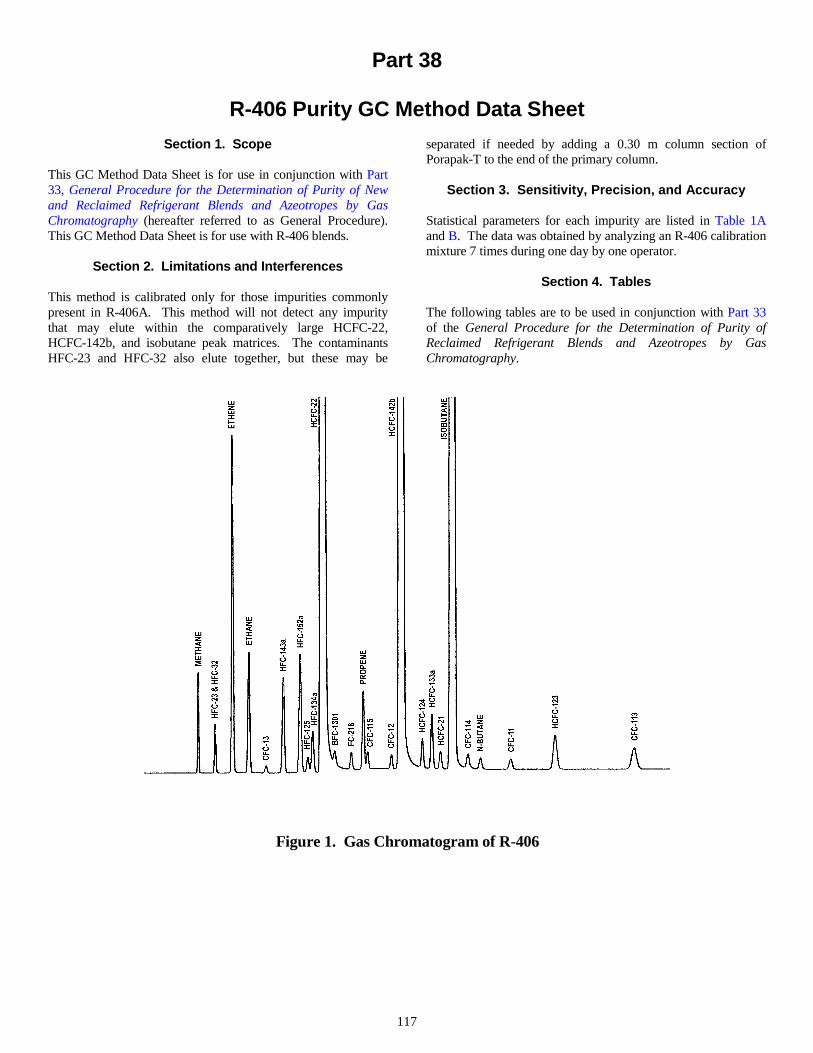
117
Part 38
R-406 Purity GC Method Data Sheet
Section 1. Scope
This GC Method Data Sheet is for use in conjunction with Part33, General Procedure for the Determination of Purity of Newand Reclaimed Refrigerant Blends and Azeotropes by GasChromatography (hereafter referred to as General Procedure).This GC Method Data Sheet is for use with R-406 blends.
Section 2. Limitations and Interferences
This method is calibrated only for those impurities commonlypresent in R-406A. This method will not detect any impuritythat may elute within the comparatively large HCFC-22,HCFC-142b, and isobutane peak matrices. The contaminantsHFC-23 and HFC-32 also elute together, but these may be
separated if needed by adding a 0.30 m column section ofPorapak-T to the end of the primary column.
Section 3. Sensitivity, Precision, and Accuracy
Statistical parameters for each impurity are listed in Table 1Aand B. The data was obtained by analyzing an R-406 calibrationmixture 7 times during one day by one operator.
Section 4. Tables
The following tables are to be used in conjunction with Part 33of the General Procedure for the Determination of Purity ofReclaimed Refrigerant Blends and Azeotropes by GasChromatography.
Figure 1. Gas Chromatogram of R-406

118
Table 1A. Contaminant Statistical Parameters
Component DetectionLimit, ppm
RangeInvestigated,
ppm
Precision at 95%Confidence Limit, ppm
methane 1 100 3.323 11 450 2432 4 450 9.0
ethene 1 450 15ethane 1 200 6.5
13 13 450 18143a 2 650 17152a 1 450 30.125 11 450 15134a 2 450 20.1301 11 450 6.4218 6 450 18
propene 1 100 3.2115 7 450 6.212 8 450 5.3
124 4 450 23133a 2 450 1421 5 450 4
114 6 450 10.n-butane 3 100 2.9
11 7 450 6.2123 2 450 5.0113 2 450 7.1
Table 1B. Component Statistical Parameters
Component DetectionLimit, ppm
RangeInvestigated,
%
Precision at 95%Confidence Limit
22 6 55 % 0.21 %142b 4 41 % 0.35 %
isobutane 1 4 % 0.09 %
Table 1C. Blend Component Balance Preparation
ComponentFinal Pressure
AfterComponent
Addition (kPa)
Weight of RefrigerantAdded (g)
Isobutane 25 0.60
R-142b 166 6.15
R-22 371 8.25

119
Table 2. Primary Calibration Standard Impurities
ComponentVapor
Density,mg/ml
VolumeAdded,
ml
mgAdded
(1)
ppmAdded
(2)
Total ppm Present
(3)methane 0.656 4.0 2.62 130
23 2.895 3.5 10.13 50032 2.162 4.7 10.16 502
ethene 1.147 4.0 4.58 226ethane 1.230 4.0 4.92 243
13 4.331 2.4 10.39 513143a 3.511 2.9 10.18 503152a 2.772 3.7 10.25 506125 5.004 2.1 10.50 519134a 4.279 2.4 10.26 5071301 6.205 1.7 10.54 521218 7.923 1.3 10.29 508
propene 1.756 5.8 10.18 503115 6.486 1.6 10.37 51212 5.077 2.0 10.15 501124 5.758 1.8 10.36 512133a 4.846 2.1 10.17 50221 4.367 2.4 10.48 517114 7.319 1.4 10.24 506
n-butane 2.463 4.2 10.34 511
ComponentLiquid
Density,mg/µl
VolumeAdded,
µl
mgAdded
(1)
ppmAdded
(2)
Total ppm Present
(3)11 1.537 6.6 10.14 501123 1.526 6.7 10.22 505113 1.619 6.3 10.19 503
(1) If necessary, correct the mg added for the purity of the calibration componentpreviously established.
(2) Values shown are for illustration; exact values are determined at Part 33,Section 9.3, steps c and d.
(3) Column to be filled in (Part 33, Section 9.3, step g) after determining ppmpresent in the stock components (see Note 1 in Section 10).

120
Part 39
R-407 Purity GC Method Data Sheet
Section 1. Scope
This GC Method Data Sheet is for use in conjunction with Part33, General Procedure for the Determination of Purity of Newand Reclaimed Refrigerant Blends and Azeotropes by GasChromatography. This GC Method Data Sheet is for use withR-407, blends of R-32, R-125, and R-134a.
Section 2. Limitations and Interferences
This method is calibrated only for those impurities commonlypresent in R-407 blends. This method will not detect anyimpurity that may elute within the comparatively largeHFC-32, HFC-125, and HFC-134a peak matrices. Althoughthis method only partially separates HFC-152a from HFC-125,
the HFC-152a peak can be resolved by reducing the loop sizeto 100 µl.
Section 3. Sensitivity, Precision, and Accuracy
Statistical parameters for each impurity are listed in Table 1Aand B. The data was obtained by analyzing an R-407 calibrationmixture 7 times during one day by one operator.
Section 4. Tables
The following tables are to be used in conjunction with Part 33of the General Procedure for the Determination of Purity ofReclaimed Refrigerant Blends and Azeotropes by GasChromatography.
Figure 1. Gas Chromatogram of R-407
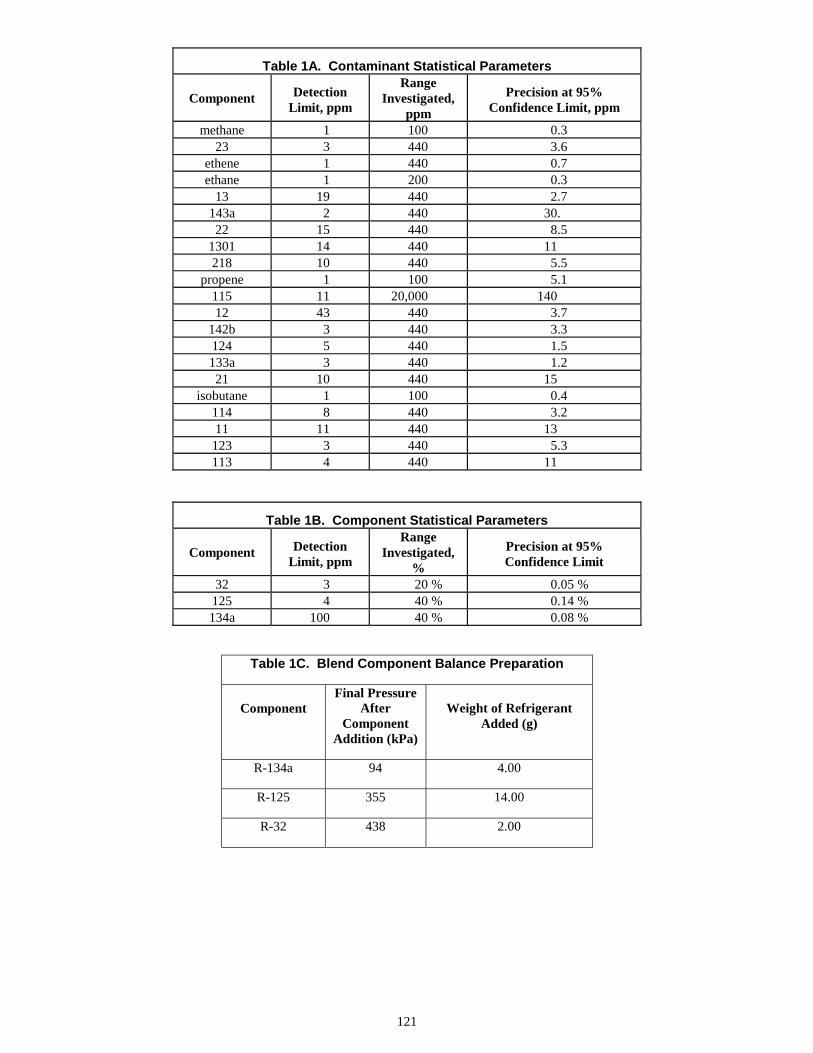
121
Table 1A. Contaminant Statistical Parameters
Component DetectionLimit, ppm
RangeInvestigated,
ppm
Precision at 95%Confidence Limit, ppm
methane 1 100 0.323 3 440 3.6
ethene 1 440 0.7ethane 1 200 0.3
13 19 440 2.7143a 2 440 30.22 15 440 8.5
1301 14 440 11218 10 440 5.5
propene 1 100 5.1115 11 20,000 14012 43 440 3.7
142b 3 440 3.3124 5 440 1.5133a 3 440 1.221 10 440 15
isobutane 1 100 0.4114 8 440 3.211 11 440 13
123 3 440 5.3113 4 440 11
Table 1B. Component Statistical Parameters
Component DetectionLimit, ppm
RangeInvestigated,
%
Precision at 95%Confidence Limit
32 3 20 % 0.05 %125 4 40 % 0.14 %134a 100 40 % 0.08 %
Table 1C. Blend Component Balance Preparation
ComponentFinal Pressure
AfterComponent
Addition (kPa)
Weight of RefrigerantAdded (g)
R-134a 94 4.00
R-125 355 14.00
R-32 438 2.00

122
Table 2. Primary Calibration Standard Impurities
ComponentVapor
Density,mg/ml
VolumeAdded,
ml
mgAdded
(1)
ppmAdded
(2)
Total ppm Present
(3)methane 0.656 4.0 2.62 130
23 2.895 3.5 10.13 500ethene 1.147 4.0 4.58 226ethane 1.230 4.0 4.92 243
13 4.331 2.4 10.39 513143a 3.511 2.9 10.18 503152a 2.772 3.7 10.25 50622 3.606 2.9 10.45 516
1301 6.205 1.7 10.54 521218 7.923 1.3 10.29 508
propene 1.756 5.8 10.18 503115 6.486 1.6 10.37 51212 5.077 2.0 10.15 501
142b 4.248 2.4 10.19 503124 5.758 1.8 10.36 512133a 4.846 2.1 10.17 50221 4.367 2.4 10.48 517
isobutane 2.452 4.2 10.29 508114 7.319 1.4 10.24 506
ComponentLiquid
Density,mg/µl
VolumeAdded,
µl
mgAdded
(1)
ppmAdded
(2)
Total ppm Present
(3)11 1.537 6.6 10.14 501123 1.526 6.7 10.22 505113 1.619 6.3 10.19 503
(1) If necessary, correct the mg added for the purity of the calibration componentpreviously established.
(2) Values shown are for illustration; exact values are determined at Part 33,Section 9.3, steps c and d.
(3) Column to be filled in (Part 33, Section 9.3, step g) after determining ppmpresent in the stock components (see Note 1 in Section 10).
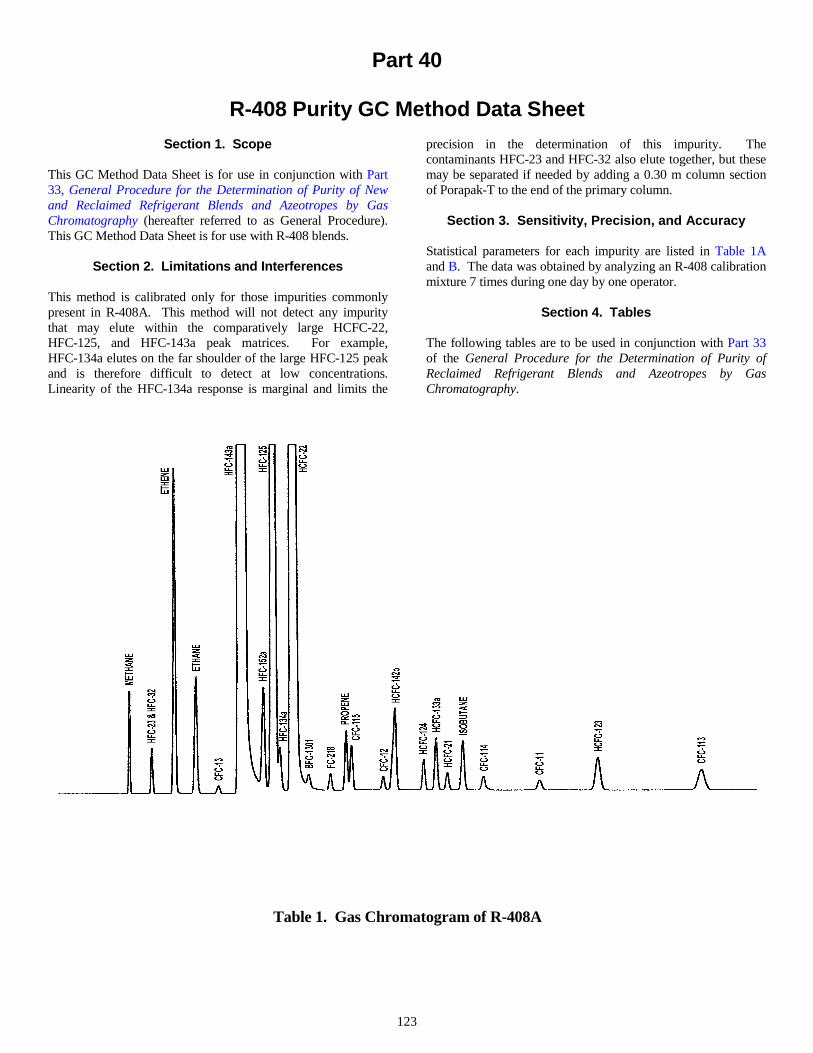
123
Part 40
R-408 Purity GC Method Data Sheet
Section 1. Scope
This GC Method Data Sheet is for use in conjunction with Part33, General Procedure for the Determination of Purity of Newand Reclaimed Refrigerant Blends and Azeotropes by GasChromatography (hereafter referred to as General Procedure).This GC Method Data Sheet is for use with R-408 blends.
Section 2. Limitations and Interferences
This method is calibrated only for those impurities commonlypresent in R-408A. This method will not detect any impuritythat may elute within the comparatively large HCFC-22,HFC-125, and HFC-143a peak matrices. For example,HFC-134a elutes on the far shoulder of the large HFC-125 peakand is therefore difficult to detect at low concentrations.Linearity of the HFC-134a response is marginal and limits the
precision in the determination of this impurity. Thecontaminants HFC-23 and HFC-32 also elute together, but thesemay be separated if needed by adding a 0.30 m column sectionof Porapak-T to the end of the primary column.
Section 3. Sensitivity, Precision, and Accuracy
Statistical parameters for each impurity are listed in Table 1Aand B. The data was obtained by analyzing an R-408 calibrationmixture 7 times during one day by one operator.
Section 4. Tables
The following tables are to be used in conjunction with Part 33of the General Procedure for the Determination of Purity ofReclaimed Refrigerant Blends and Azeotropes by GasChromatography.
Table 1. Gas Chromatogram of R-408A

124
Table 1A. Contaminant Statistical Parameters
Component DetectionLimit, ppm
RangeInvestigated,
ppm
Precision at 95%Confidence Limit, ppm
methane 1 100 0.623 10 430 2.132 4 430 1.8
ethene 1 430 2.6ethane 1 200 1.6
13 11 430 7.5152a 1 430 37134a 100 430 3.41301 9 430 7.5218 6 430 1.5
propene 1 100 6.8115 7 1400 1112 6 430 51
142b 1 430 4.3124 4 430 2.3133a 2 430 0.921 5 430 11
isobutane 1 100 0.9114 5 430 0.811 7 430 12
123 2 430 4.6113 2 430 7.9
Table 1B. Component Statistical Parameters
Component DetectionLimit, ppm
RangeInvestigated,
%
Precision at 95%Confidence Limit
143a 3 46 % 0.06 %125 5 7 % 0.10 %22 6 47 % 0.17 %
Table 1C. Blend Component Balance Preparation
ComponentFinal Pressure
AfterComponent
Addition (kPa)
Weight of RefrigerantAdded (g)
R-22 254 9.40
R-143a 487 9.20
R-125 510 1.40

125
Table 2. Primary Calibration Standard Impurities
ComponentVapor
Density,mg/ml
VolumeAdded,
ml
mgAdded
(1)
ppmAdded
(2)
Total ppm Present
(3)methane 0.656 4.0 2.62 130
23 2.895 3.5 10.13 50032 2.162 4.7 10.16 502
ethene 1.147 4.0 4.58 226ethane 1.230 4.0 4.92 243
13 4.331 2.4 10.39 513152a 2.772 3.7 10.25 506134a 4.279 2.4 10.26 5071301 6.205 1.7 10.54 521218 7.923 1.3 10.29 508
propene 1.756 5.8 10.18 503115 6.486 1.6 10.37 51212 5.077 2.0 10.15 501
142b 4.248 2.4 10.19 503124 5.758 1.8 10.36 512133a 4.846 2.1 10.17 50221 4.367 2.4 10.48 517
isobutane 2.452 4.2 10.29 508114 7.319 1.4 10.24 506
ComponentLiquid
Density,mg/µl
VolumeAdded,
µl
mgAdded
(1)
ppmAdded
(2)
Total ppmPresent (3)
11 1.537 6.6 10.14 501123 1.526 6.7 10.22 505113 1.619 6.3 10.19 503
(1) If necessary, correct the mg added for the purity of the calibration componentpreviously established.
(2) Values shown are for illustration; exact values are determined at Part 33,Section 9.3, steps c and d.
(3) Column to be filled in (Part 33, Section 9.3, step g) after determining ppmpresent in the stock components (see Note 1 in Section 10).
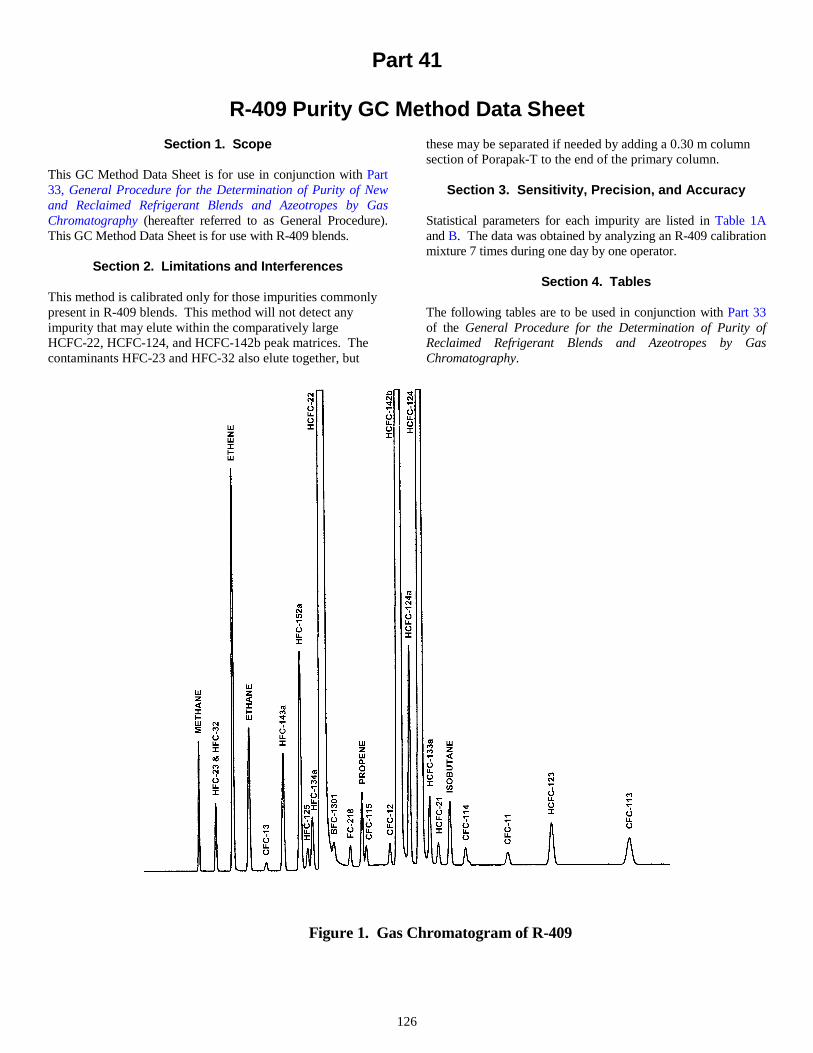
126
Part 41
R-409 Purity GC Method Data Sheet
Section 1. Scope
This GC Method Data Sheet is for use in conjunction with Part33, General Procedure for the Determination of Purity of Newand Reclaimed Refrigerant Blends and Azeotropes by GasChromatography (hereafter referred to as General Procedure).This GC Method Data Sheet is for use with R-409 blends.
Section 2. Limitations and Interferences
This method is calibrated only for those impurities commonlypresent in R-409 blends. This method will not detect anyimpurity that may elute within the comparatively largeHCFC-22, HCFC-124, and HCFC-142b peak matrices. Thecontaminants HFC-23 and HFC-32 also elute together, but
these may be separated if needed by adding a 0.30 m columnsection of Porapak-T to the end of the primary column.
Section 3. Sensitivity, Precision, and Accuracy
Statistical parameters for each impurity are listed in Table 1Aand B. The data was obtained by analyzing an R-409 calibrationmixture 7 times during one day by one operator.
Section 4. Tables
The following tables are to be used in conjunction with Part 33of the General Procedure for the Determination of Purity ofReclaimed Refrigerant Blends and Azeotropes by GasChromatography.
Figure 1. Gas Chromatogram of R-409
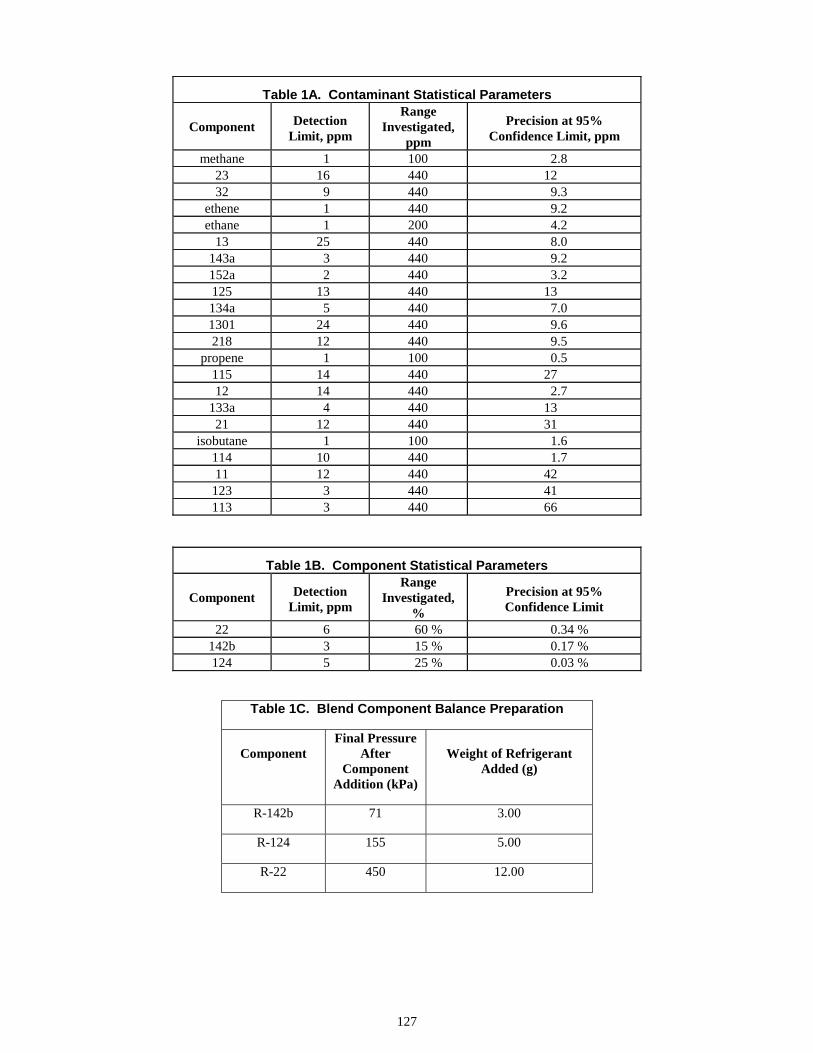
127
Table 1A. Contaminant Statistical Parameters
Component DetectionLimit, ppm
RangeInvestigated,
ppm
Precision at 95%Confidence Limit, ppm
methane 1 100 2.823 16 440 1232 9 440 9.3
ethene 1 440 9.2ethane 1 200 4.2
13 25 440 8.0143a 3 440 9.2152a 2 440 3.2125 13 440 13134a 5 440 7.01301 24 440 9.6218 12 440 9.5
propene 1 100 0.5115 14 440 2712 14 440 2.7
133a 4 440 1321 12 440 31
isobutane 1 100 1.6114 10 440 1.711 12 440 42
123 3 440 41113 3 440 66
Table 1B. Component Statistical Parameters
Component DetectionLimit, ppm
RangeInvestigated,
%
Precision at 95%Confidence Limit
22 6 60 % 0.34 %142b 3 15 % 0.17 %124 5 25 % 0.03 %
Table 1C. Blend Component Balance Preparation
ComponentFinal Pressure
AfterComponent
Addition (kPa)
Weight of RefrigerantAdded (g)
R-142b 71 3.00
R-124 155 5.00
R-22 450 12.00

128
Table 2. Primary Calibration Standard Impurities
ComponentVapor
Density,mg/ml
VolumeAdded,
ml
mgAdded
(1)
ppmAdded
(2)
Total ppmPresent (3)
methane 0.656 4.0 2.62 13023 2.895 3.5 10.13 50032 2.162 4.7 10.16 502
ethene 1.147 4.0 4.58 226ethane 1.230 4.0 4.92 243
13 4.331 2.4 10.39 513143a 3.511 2.9 10.18 503152a 2.772 3.7 10.25 506125 5.004 2.1 10.50 519134a 4.279 2.4 10.26 5071301 6.205 1.7 10.54 521218 7.923 1.3 10.29 508
propene 1.756 5.8 10.18 503115 6.486 1.6 10.37 51212 5.077 2.0 10.15 501
133a 4.846 2.1 10.17 50221 4.367 2.4 10.48 517
isobutane 2.452 4.2 10.29 508114 7.319 1.4 10.24 506
ComponentLiquid
Density,mg/µl
VolumeAdded,
µl
mgAdded
(1)
ppmAdded
(2)
Total ppmPresent
(3)11 1.537 6.6 10.14 501123 1.526 6.7 10.22 505113 1.619 6.3 10.19 503
(1) If necessary, correct the mg added for the purity of the calibration componentpreviously established.
(2) Values shown are for illustration; exact values are determined at Part 33,Section 9.3, steps c and d.
(3) Column to be filled in (Part 33, Section 9.3, step g) after determining ppmpresent in the stock components (see Note 1 in Section 10).

129
Part 42
R-410 Purity GC Method Data Sheet
Section 1. Scope
This GC Method Data Sheet is for use in conjunction with Part33, General Procedure for the Determination of Purity of Newand Reclaimed Refrigerant Blends and Azeotropes by GasChromatography (hereafter referred to as General Procedure).This GC Method Data Sheet is for use with R-410 blends.
Section 2. Limitations and Interferences
This method is calibrated only for those impurities commonlypresent in R-410 blends. This method will not detect anyimpurity that may elute within the comparatively large HFC-32and HFC-125 peak matrices. HFC-134a elutes on the far
shoulder of the large HFC-125 peak, is poorly resolved and isdifficult to detect at low concentrations.
Section 3. Sensitivity, Precision, and Accuracy
Statistical parameters for each impurity are listed in Table 1Aand B. The data was obtained by analyzing an R-410 calibrationmixture 7 times during one day by one operator.
Section 4. Tables
The following tables are to be used in conjunction with Part 33of the General Procedure for the Determination of Purity ofReclaimed Refrigerant Blends and Azeotropes by GasChromatography.
Figure 1. Gas Chromatogram of R-410

130
Table 1A. Contaminant Statistical Parameters
Component DetectionLimit, ppm
RangeInvestigated,
ppm
Precision at 95%Confidence Limit, ppm
methane 1 120 2.123 5 510 5.4
ethene 1 510 8.7ethane 1 230 4.1
13 13 510 11143a 3 550 7.3152a 2 510 11134a 100 510 1722 7 510 14
1301 8 510 17218 6 510 15
propene 1 130 1.6115 6 1900 2312 9 510 12
142b 1 510 5.8124 4 510 6.7133a 2 510 7.021 7 510 10.
isobutane 1 130 2.1114 6 510 10.11 8 510 23
123 2 510 5.2113 3 510 6.4
Table 1B. Component Statistical Parameters
Component DetectionLimit, ppm
RangeInvestigated,
%
Precision at 95%Confidence Limit
32 7 50 % 0.38 %125 5 50 % 0.25 %
Table 1C. Blend Component Balance Preparation
ComponentFinal Pressure
AfterComponent
Addition (kPa)
Weight of RefrigerantAdded (g)
R-125 197 10.00
R-32 616 10.00

131
Table 2. Primary Calibration Standard Impurities
ComponentVapor
Density,mg/ml
VolumeAdded,
ml
mgAdded
(1)
ppmAdded
(2)
Total ppmPresent
(3)methane 0.656 4.0 2.62 130
23 2.895 3.5 10.13 500ethene 1.147 4.0 4.58 226ethane 1.230 4.0 4.92 243
13 4.331 2.4 10.39 513143a 3.511 2.9 10.18 503152a 2.772 3.7 10.25 506134a 4.279 2.4 10.26 50722 3.606 2.9 10.45 516
1301 6.205 1.7 10.54 521218 7.923 1.3 10.29 508
propene 1.756 5.8 10.18 503115 6.486 1.6 10.37 51212 5.077 2.0 10.15 501
142b 4.248 2.4 10.19 503124 5.758 1.8 10.36 512133a 4.846 2.1 10.17 50221 4.367 2.4 10.48 517
isobutane 2.452 4.2 10.29 508114 7.319 1.4 10.24 506
ComponentLiquid
Density,mg/µl
VolumeAdded,
µl
mgAdded
(1)
ppmAdded
(2)
Total ppmPresent
(3)11 1.537 6.6 10.14 501123 1.526 6.7 10.22 505113 1.619 6.3 10.19 503
(1) If necessary, correct the mg added for the purity of the calibration componentpreviously established.
(2) Values shown are for illustration; exact values are determined at Part 33,Section 9.3, steps c and d.
(3) Column to be filled in (Part 33, Section 9.3, step g) after determining ppmpresent in the stock components (see Note 1 in Section 10).
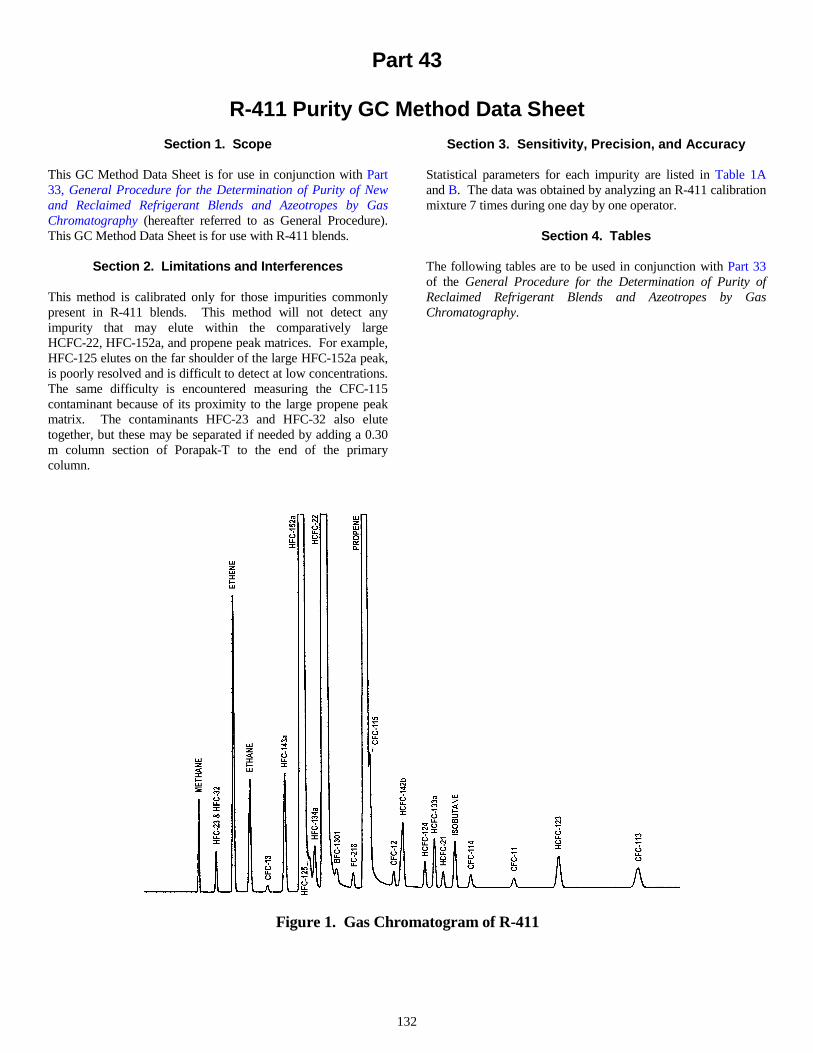
132
Part 43
R-411 Purity GC Method Data Sheet
Section 1. Scope
This GC Method Data Sheet is for use in conjunction with Part33, General Procedure for the Determination of Purity of Newand Reclaimed Refrigerant Blends and Azeotropes by GasChromatography (hereafter referred to as General Procedure).This GC Method Data Sheet is for use with R-411 blends.
Section 2. Limitations and Interferences
This method is calibrated only for those impurities commonlypresent in R-411 blends. This method will not detect anyimpurity that may elute within the comparatively largeHCFC-22, HFC-152a, and propene peak matrices. For example,HFC-125 elutes on the far shoulder of the large HFC-152a peak,is poorly resolved and is difficult to detect at low concentrations.The same difficulty is encountered measuring the CFC-115contaminant because of its proximity to the large propene peakmatrix. The contaminants HFC-23 and HFC-32 also elutetogether, but these may be separated if needed by adding a 0.30m column section of Porapak-T to the end of the primarycolumn.
Section 3. Sensitivity, Precision, and Accuracy
Statistical parameters for each impurity are listed in Table 1Aand B. The data was obtained by analyzing an R-411 calibrationmixture 7 times during one day by one operator.
Section 4. Tables
The following tables are to be used in conjunction with Part 33of the General Procedure for the Determination of Purity ofReclaimed Refrigerant Blends and Azeotropes by GasChromatography.
Figure 1. Gas Chromatogram of R-411

133
Table 1A. Contaminant Statistical Parameters
Component DetectionLimit, ppm
RangeInvestigated,
ppm
Precision at 95%Confidence Limit, ppm
methane 1 100 1223 7 420 3632 5 420 17
ethene 1 420 12ethane 1 200 6.5
13 1 420 30.143a 2 420 19134a 3 420 571301 14 420 14218 6 420 14115 10 420 2512 9 420 5.3
142b 2 420 12124 5 420 22133a 2 420 2521 7 420 22
isobutane 1 100 4.2114 6 420 2211 9 420 12
123 2 420 34113 3 420 36
Table 1B. Component Statistical Parameters
Component DetectionLimit, ppm
RangeInvestigated,
%
Precision at 95%Confidence Limit
152a 1 3 % 0.16 %22 9 94 % 2.6 %
propene 1 3 % 0.06 %
Table 1C. Blend Component Balance Preparation
ComponentFinal Pressure
AfterComponent
Addition (kPa)
Weight of RefrigerantAdded (g)
Propene 35 0.60
R-152a 56 0.60
R-22 533 18.80

134
Table 2. Primary Calibration Standard Impurities
ComponentVapor
Density,mg/ml
VolumeAdded,
ml
mgAdded
(1)
ppmAdded
(2)
Total ppmPresent (3)
methane 0.656 4.0 2.62 13023 2.895 3.5 10.13 50032 2.162 4.7 10.16 502
ethene 1.147 4.0 4.58 226ethane 1.230 4.0 4.92 243
13 4.331 2.4 10.39 513143a 3.511 2.9 10.18 503125 5.004 2.1 10.50 519134a 4.279 2.4 10.26 5071301 6.205 1.7 10.54 521218 7.923 1.3 10.29 508115 6.486 1.6 10.37 51212 5.077 2.0 10.15 501
142b 4.248 2.4 10.19 503124 5.758 1.8 10.36 512133a 4.846 2.1 10.17 50221 4.367 2.4 10.48 517
isobutane 2.452 4.2 10.29 508114 7.319 1.4 10.24 506
ComponentLiquid
Density,mg/µl
VolumeAdded,
µl
mgAdded
(1)
ppmAdded
(2)
Total ppmPresent
(3)11 1.537 6.6 10.14 501123 1.526 6.7 10.22 505113 1.619 6.3 10.19 503
(1) If necessary, correct the mg added for the purity of the calibration componentpreviously established.
(2) Values shown are for illustration; exact values are determined in Part 33,Section 9.3, steps c and d.
(3) Column to be filled in (Part 33, Section 9.3, step g) after determining ppmpresent in the stock components (see Note 1 in Section 10).

135
Part 44
R-412 Purity GC Method Data Sheet
Section 1. Scope
This GC Method Data Sheet is for use in conjunction with Part33, General Procedure for the Determination of Purity of Newand Reclaimed Refrigerant Blends and Azeotropes by GasChromatography (hereafter referred to as General Procedure).This GC Method Data Sheet is for use with R-412 blends.
Section 2. Limitations and Interferences
This method is calibrated only for those impurities commonlypresent in R-412A. This method will not detect any impuritythat may elute within the comparatively large HCFC-22,HCFC-142b, and FC-218 peak matrices. The contaminantsHFC-23 and HFC-32 also elute together, but these may be
separated if needed by adding a 0.30 m column section ofPorapak-T to the end of the primary column.
Section 3. Sensitivity, Precision, and Accuracy
Statistical parameters for each impurity are listed in Table 1Aand B. The data was obtained by analyzing an R-412 calibrationmixture 7 times during one day by one operator.
Section 4. Tables
The following tables are to be used in conjunction with Part 33of the General Procedure for the Determination of Purity ofReclaimed Refrigerant Blends and Azeotropes by GasChromatography.
Figure 1. Gas Chromatogram of R-412
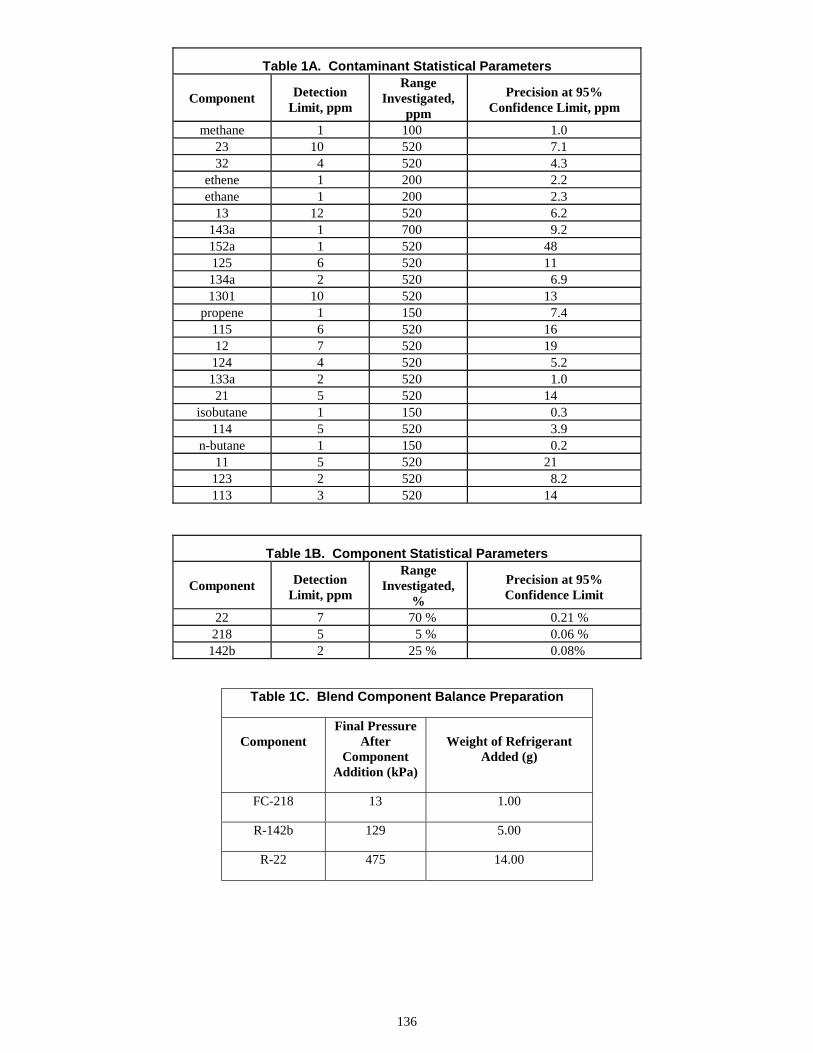
136
Table 1A. Contaminant Statistical Parameters
Component DetectionLimit, ppm
RangeInvestigated,
ppm
Precision at 95%Confidence Limit, ppm
methane 1 100 1.023 10 520 7.132 4 520 4.3
ethene 1 200 2.2ethane 1 200 2.3
13 12 520 6.2143a 1 700 9.2152a 1 520 48125 6 520 11134a 2 520 6.91301 10 520 13
propene 1 150 7.4115 6 520 1612 7 520 19
124 4 520 5.2133a 2 520 1.021 5 520 14
isobutane 1 150 0.3114 5 520 3.9
n-butane 1 150 0.211 5 520 21
123 2 520 8.2113 3 520 14
Table 1B. Component Statistical Parameters
Component DetectionLimit, ppm
RangeInvestigated,
%
Precision at 95%Confidence Limit
22 7 70 % 0.21 %218 5 5 % 0.06 %
142b 2 25 % 0.08%
Table 1C. Blend Component Balance Preparation
ComponentFinal Pressure
AfterComponent
Addition (kPa)
Weight of RefrigerantAdded (g)
FC-218 13 1.00
R-142b 129 5.00
R-22 475 14.00

137
Table 2. Primary Calibration Standard Impurities
ComponentVapor
Density,mg/ml
VolumeAdded,
ml
mgAdded
(1)
ppmAdded
(2)
Total ppmPresent (3)
methane 0.656 4.0 2.62 13023 2.895 3.5 10.13 50032 2.162 4.7 10.16 502
ethene 1.147 4.0 4.58 226ethane 1.230 4.0 4.92 243
13 4.331 2.4 10.39 513143a 3.511 2.9 10.18 503152a 2.772 3.7 10.25 506125 5.004 2.1 10.50 519134a 4.279 2.4 10.26 5071301 6.205 1.7 10.54 521
propene 1.756 5.8 10.18 503115 6.486 1.6 10.37 51212 5.077 2.0 10.15 501124 5.758 1.8 10.36 512133a 4.846 2.1 10.17 50221 4.367 2.4 10.48 517
isobutane 2.452 4.2 10.29 508114 7.319 1.4 10.24 506
n-butane 2.463 4.2 10.34 511
ComponentLiquid
Density,mg/µl
VolumeAdded,
µl
mgAdded
(1)
ppmAdded
(2)
Total ppmPresent (3)
11 1.537 6.6 10.14 501123 1.526 6.7 10.22 505113 1.619 6.3 10.19 503
(1) If necessary, correct the mg added for the purity of the calibration componentpreviously established.
(2) Values shown are for illustration; exact values are determined at Part 33,Section 9.3, steps c and d.
(3) Column to be filled in (Part 33, Section 9.3, step g) after determining ppmpresent in the stock components (see Note 1 in Section 10).

138
Part 45
R-500 Purity GC Method Data Sheet
Section 1. Scope
This GC Method Data Sheet is for use in conjunction with Part33, General Procedure for the Determination of Purity of Newand Reclaimed Refrigerant Blends and Azeotropes by GasChromatography (hereafter referred to as General Procedure).This GC Method Data Sheet is for use with R-500.
Section 2. Limitations and Interferences
This method is calibrated only for those impurities commonlypresent in R-500. This method will not detect any impurity thatmay elute within the comparatively large CFC-12 andHFC-152a peak matrices. For example, HFC-134a elutes onthe far shoulder of the large HFC-152a peak and is thereforedifficult to detect at low concentrations. Linearity of theHFC-134a response is marginal and limits the precision in the
determination of this impurity. The contaminants HFC-23 andHFC-32 also elute together, but these may be separated ifneeded by adding a 0.30 m column section of Porapak-T to theend of the primary column.
Section 3. Sensitivity, Precision, and Accuracy
Statistical parameters for each impurity are listed in Table 1Aand B. The data was obtained by analyzing an R-500 calibrationmixture 7 times during one day by one operator.
Section 4. Tables
The following tables are to be used in conjunction with Part 33of the General Procedure for the Determination of Purity ofReclaimed Refrigerant Blends and Azeotropes by GasChromatography.
Figure 1. Gas Chromatogram of R-500

139
Table 1A. Contaminant Statistical Parameters
Component DetectionLimit, ppm
RangeInvestigated,
ppm
Precision at 95%Confidence Limit, ppm
methane 2 100 1.123 7 440 8.532 4 440 3.3
ethene 1 440 2.3ethane 1 200 0.9
13 9 440 5.0143a 1 440 1.7134a 3 440 1.722 5 440 3.1
1301 7 440 3.7218 5 440 1.4
propene 1 100 4.5115 6 440 8.5
142b 2 440 4.6124 3 440 4.2133a 2 440 5.421 5 440 12
isobutane 1 100 6.6114 4 440 4.211 6 440 14
123 2 440 16113 2 440 23
Table 1B. Component Statistical Parameters
Component DetectionLimit, ppm
RangeInvestigated,
%
Precision at 95%Confidence Limit
152a 2 26.2 % 0.02 %12 7 73.8 % 0.07 %
Table 1C. Blend Component Balance Preparation
ComponentFinal Pressure
AfterComponent
Addition (kPa)
Weight of RefrigerantAdded (g)
R-152a 185 5.24
R-12 441 14.76

140
Table 2. Primary Calibration Standard Impurities
ComponentVapor
Density,mg/ml
VolumeAdded,
ml
mgAdded
(1)
ppmAdded
(2)
Total ppmPresent
(3)methane 0.656 4.0 2.62 130
23 2.895 3.5 10.13 50032 2.162 4.7 10.16 502
ethene 1.147 4.0 4.58 226ethane 1.230 4.0 4.92 243
13 4.331 2.4 10.39 513143a 3.511 2.9 10.18 503134a 4.279 2.4 10.26 50722 3.606 2.9 10.45 516
1301 6.205 1.7 10.54 521218 7.923 1.3 10.29 508
propene 1.756 5.8 10.18 503115 6.486 1.6 10.37 512142b 4.248 2.4 10.19 503124 5.758 1.8 10.36 512133a 4.846 2.1 10.17 50221 4.367 2.4 10.48 517
isobutane 2.452 4.2 10.29 508114 7.319 1.4 10.24 506
ComponentLiquid
Density,mg/µl
VolumeAdded,
µl
mgAdded
(1)
ppmAdded
(2)
Total ppmPresent
(3)11 1.537 6.6 10.14 501123 1.526 6.7 10.22 505113 1.619 6.3 10.19 503
(1) If necessary, correct the mg added for the purity of the calibration componentpreviously established.
(2) Values shown are for illustration; exact values are determined at Part 33,Section 9.3, steps c and d.
(3) Column to be filled in (Part 33, Section 9.3, step g) after determining ppmpresent in the stock components (see Note 1 in Section 10).

141
Part 46
R-502 Purity GC Method Data Sheet
Section 1. Scope
This GC Method Data Sheet is for use in conjunction with Part33, General Procedure for the Determination of Purity of Newand Reclaimed Refrigerant Blends and Azeotropes by GasChromatography (hereafter referred to as General Procedure).This GC Method Data Sheet is for use with R-502.
Section 2. Limitations and Interferences
This method is calibrated only for those impurities commonlypresent in R-502. This method will not detect any impurity thatmay elute within the comparatively large HCFC-22 andCFC-115 peak matrices. Propene and CFC-115 are poorlyresolved which complicates the quantification of the propene.The contaminants HFC-23 and HFC-32 elute together, but
these may be separated if needed by adding a 0.30 m columnsection of Porapak-T to the end of the primary column.
Section 3. Sensitivity, Precision, and Accuracy
Statistical parameters for each impurity are listed in Table 1Aand B. The data was obtained by analyzing an R-502 calibrationmixture 7 times during one day by one operator.
Section 4. Tables
The following tables are to be used in conjunction with Part 33of the General Procedure for the Determination of Purity ofReclaimed Refrigerant Blends and Azeotropes by GasChromatography.
Figure 1. Gas Chromatogram of R-502

142
Table 1A. Contaminant Statistical Parameters
Component DetectionLimit, ppm
RangeInvestigated,
ppm
Precision at 95%Confidence Limit, ppm
methane 1 100 8.423 5 440 1332 3 440 15
ethene 1 440 8.7ethane 1 200 3.5
13 8 440 11143a 1 440 11152a 1 440 11125 5 440 14134a 2 440 161301 21 440 31218 5 440 14
propene 1 100 8.712 5 440 16
142b 1 440 11124 2 440 11133a 2 440 9.321 4 440 32
isobutane 1 100 0.9114 4 440 9.511 9 440 74
123 2 440 11113 3 440 21
Table 1B. Component Statistical Parameters
Component DetectionLimit, ppm
RangeInvestigated,
%
Precision at 95%Confidence Limit
22 5 48.8 % 0.11 %115 5 51.2 % 0.10 %
Table 1C. Blend Component Balance Preparation
ComponentFinal Pressure
AfterComponent
Addition (kPa)
Weight of RefrigerantAdded (g)
R-115 156 10.24
R-22 405 9.76

143
Table 2. Primary Calibration Standard Impurities
ComponentVapor
Density,mg/ml
VolumeAdded,
ml
mgAdded
(1)
ppmAdded
(2)
Total ppmPresent
(3)methane 0.656 4.0 2.62 130
23 2.895 3.5 10.13 50032 2.162 4.7 10.16 502
ethene 1.147 4.0 4.58 226ethane 1.230 4.0 4.92 243
13 4.331 2.4 10.39 513143a 3.511 2.9 10.18 503152a 2.772 3.7 10.25 506125 5.004 2.1 10.50 519134a 4.279 2.4 10.26 5071301 6.205 1.7 10.54 521218 7.923 1.3 10.29 508
propene 1.756 5.8 10.18 50312 5.077 2.0 10.15 501
142b 4.248 2.4 10.19 503124 5.758 1.8 10.36 512133a 4.846 2.1 10.17 50221 4.367 2.4 10.48 517
isobutane 2.452 4.2 10.29 508114 7.319 1.4 10.24 506
ComponentLiquid
Density,mg/µl
VolumeAdded,
µl
mgAdded
(1)
ppmAdded
(2)
Total ppmPresent
(3)11 1.537 6.6 10.14 501123 1.526 6.7 10.22 505113 1.619 6.3 10.19 503
(1) If necessary, correct the mg added for the purity of the calibration componentpreviously established.
(2) Values shown are for illustration; exact values are determined at Part 33,Section 9.3, steps c and d.
(3) Column to be filled in (Part 33, Section 9.3, step g) after determining ppmpresent in the stock components (see Note 1 in Section 10).

144
Part 47
R-503 Purity GC Method Data Sheet
Section 1. Scope
This GC Method Data Sheet is for use in conjunction with Part33, General Procedure for the Determination of Purity of Newand Reclaimed Refrigerant Blends and Azeotropes by GasChromatography (hereafter referred to as General Procedure).This GC Method Data Sheet is for use with R-503.
Section 2. Limitations and Interferences
This method is calibrated only for those impurities commonlypresent in R-503. This method will not detect any impurity thatmay elute within the comparatively large CFC-13 and HFC-23peak matrices. For example, HFC-32 cannot be detected using
this method as it elutes within the large HFC-23 componentpeak matrix.
Section 3. Sensitivity, Precision, and Accuracy
Statistical parameters for each impurity are listed in Table 1Aand B. The data was obtained by analyzing an R-503 calibrationmixture 7 times during one day by one operator.
Section 4. Tables
The following tables are to be used in conjunction with Part 33of the General Procedure for the Determination of Purity ofReclaimed Refrigerant Blends and Azeotropes by GasChromatography.
Figure 1. Gas Chromatogram of R-503

145
Table 1A. Contaminant Statistical Parameters
Component DetectionLimit, ppm
RangeInvestigated,
ppm
Precision at 95%Confidence Limit, ppm
methane 1 100 0.9ethene 1 440 3.9ethane 1 200 1.6143a 2 440 15152a 1 440 4.2125 7 440 14134a 2 440 5.622 5 440 20.
1301 7 440 2.5218 5 440 3.9
propene 1 100 3.1115 7 440 20.12 8 440 1.0
142b 2 440 10.124 3 440 19133a 2 440 1621 5 440 7.9
isobutane 1 100 1.7114 5 440 9.111 7 440 20
123 2 440 14113 3 440 15
Table 1B. Component Statistical Parameters
Component DetectionLimit, ppm
RangeInvestigated,
%
Precision at 95%Confidence Limit
23 11 40.1 % 0.07 %13 10 59.9 % 0.09 %
Table 1C. Blend Component Balance Preparation
ComponentFinal Pressure
AfterComponent
Addition (kPa)
Weight of RefrigerantAdded (g)
R-13 272 11.98
R-23 533 8.02

146
Table 2. Primary Calibration Standard Impurities
ComponentVapor
Density,mg/ml
VolumeAdded,
ml
mgAdded
(1)
ppmAdded
(2)
Total ppmPresent
(3)methane 0.656 4.0 2.62 130ethene 1.147 4.0 4.58 226ethane 1.230 4.0 4.92 243143a 3.511 2.9 10.18 503152a 2.772 3.7 10.25 506125 5.004 2.1 10.50 519134a 4.279 2.4 10.26 50722 3.606 2.9 10.45 516
1301 6.205 1.7 10.54 521218 7.923 1.3 10.29 508
propene 1.756 5.8 10.18 503115 6.486 1.6 10.37 51212 5.077 2.0 10.15 501
142b 4.248 2.4 10.19 503124 5.758 1.8 10.36 512133a 4.846 2.1 10.17 50221 4.367 2.4 10.48 517
isobutane 2.452 4.2 10.29 508114 7.319 1.4 10.24 506
ComponentLiquid
Density,mg/µl
VolumeAdded,
µl
mgAdded
(1)
ppmAdded
(2)
Total ppmPresent
(3)11 1.537 6.6 10.14 501123 1.526 6.7 10.22 505113 1.619 6.3 10.19 503
(1) If necessary, correct the mg added for the purity of the calibration componentpreviously established.
(2) Values shown are for illustration; exact values are determined at Part 33,Section 9.3, steps c and d.
(3) Column to be filled in (Part 33, Section 9.3, step g) after determining ppmpresent in the stock components (see Note 1 in Section 10).

147
Part 48
R-507 Purity GC Method Data Sheet
Section 1. Scope
This GC Method Data Sheet is for use in conjunction with Part33, General Procedure for the Determination of Purity of Newand Reclaimed Refrigerant Blends and Azeotropes by GasChromatography (hereafter referred to as General Procedure).This GC Method Data Sheet is for use with R-507.
Section 2. Limitations and Interferences
This method is calibrated only for those impurities commonlypresent in R-507A. This method will not detect any impuritythat may elute within the comparatively large HFC-125 andHFC-143a peak matrices. For example, HFC-134a elutes onthe far shoulder of the large HFC-125 peak and is thereforedifficult to detect at low concentrations. Because of this poorresolution, the precision of the HFC-134a impurity is
comparitively large. The contaminants HFC-23 and HFC-32also elute together, but these may be separated if needed byadding a 0.30 m column section of Porapak-T to the end of theprimary column.
Section 3. Sensitivity, Precision, and Accuracy
Statistical parameters for each impurity are listed in Table 1Aand B. The data was obtained by analyzing an R-507 calibrationmixture 7 times during one day by one operator.
Section 4. Tables
The following tables are to be used in conjunction with Part 33of the General Procedure for the Determination of Purity ofReclaimed Refrigerant Blends and Azeotropes by GasChromatography.
Figure 1. Gas Chromatogram of R-507

148
Table 1A. Contaminant Statistical Parameters
Component DetectionLimit, ppm
RangeInvestigated,
ppm
Precision at 95%Confidence Limit, ppm
methane 1 100 0.523 17 450 1232 8 450 3.3
ethene 1 450 1.8ethane 1 200 0.8
13 23 450 5.4134a 100 450 5.322 15 450 29
1301 16 450 4.3218 11 450 0.9
propene 1 100 0.5115 17 3400 11012 17 450 4.3
142b 3 450 6.6124 7 450 1.9133a 4 450 3.321 11 450 13
isobutane 1 100 1.1114 10 450 3.911 12 450 9.6
123 4 450 11113 5 450 14
Table 1B. Component Statistical Parameters
Component DetectionLimit, ppm
RangeInvestigated,
%
Precision at 95%Confidence Limit
143a 4 50 % 0.05 %125 5 50 % 0.07 %
Table 1C. Blend Component Balance Preparation
ComponentFinal Pressure
AfterComponent
Addition (kPa)
Weight of RefrigerantAdded (g)
R-143a 276 10.00
R-125 453 10.00
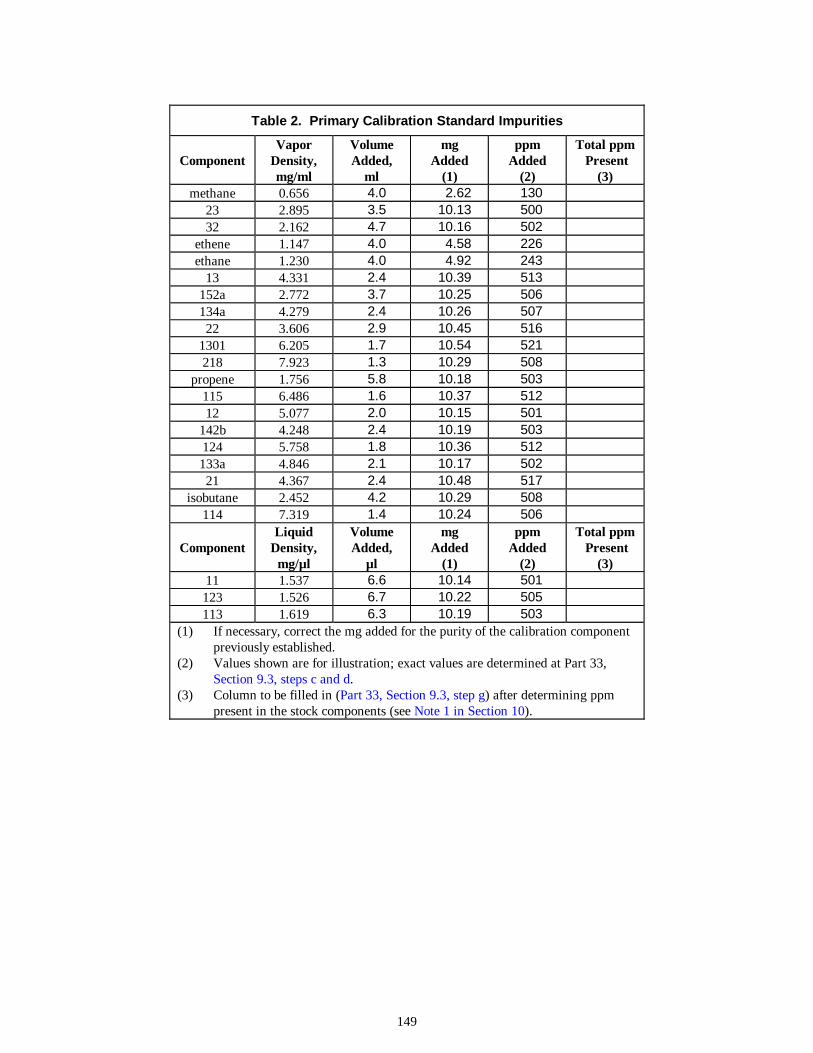
149
Table 2. Primary Calibration Standard Impurities
ComponentVapor
Density,mg/ml
VolumeAdded,
ml
mgAdded
(1)
ppmAdded
(2)
Total ppm Present
(3)methane 0.656 4.0 2.62 130
23 2.895 3.5 10.13 50032 2.162 4.7 10.16 502
ethene 1.147 4.0 4.58 226ethane 1.230 4.0 4.92 243
13 4.331 2.4 10.39 513152a 2.772 3.7 10.25 506134a 4.279 2.4 10.26 50722 3.606 2.9 10.45 516
1301 6.205 1.7 10.54 521218 7.923 1.3 10.29 508
propene 1.756 5.8 10.18 503115 6.486 1.6 10.37 51212 5.077 2.0 10.15 501
142b 4.248 2.4 10.19 503124 5.758 1.8 10.36 512133a 4.846 2.1 10.17 50221 4.367 2.4 10.48 517
isobutane 2.452 4.2 10.29 508114 7.319 1.4 10.24 506
ComponentLiquid
Density,mg/µl
VolumeAdded,
µl
mgAdded
(1)
ppmAdded
(2)
Total ppm Present
(3)11 1.537 6.6 10.14 501123 1.526 6.7 10.22 505113 1.619 6.3 10.19 503
(1) If necessary, correct the mg added for the purity of the calibration componentpreviously established.
(2) Values shown are for illustration; exact values are determined at Part 33,Section 9.3, steps c and d.
(3) Column to be filled in (Part 33, Section 9.3, step g) after determining ppmpresent in the stock components (see Note 1 in Section 10).

150
Part 49
R-508 Purity GC Method Data Sheet
Section 1. Scope
This GC Method Data Sheet is for use in conjunction with Part33, General Procedure for the Determination of Purity of Newand Reclaimed Refrigerant Blends and Azeotropes by GasChromatography (hereafter referred to as General Procedure).This GC Method Data Sheet is for use with R-508.
Section 2. Limitations and Interferences
This method is calibrated only for those impurities commonlypresent in R-508 blends. This method will not detect anyimpurity that may elute within the comparatively large HFC-23and FC-116 peak matrices. For example, HFC-32 cannot bedetected using this method as it elutes within the large HFC-23
component peak matrix. In addition, ethane cannot be detectedas it elutes within the FC-116 component peak.
Section 3. Sensitivity, Precision, and Accuracy
Statistical parameters for each impurity are listed in Table 1Aand B. The data was obtained by analyzing an R-508 calibrationmixture 7 times during one day by one operator.
Section 4. Tables
The following tables are to be used in conjunction with Part 33of the General Procedure for the Determination of Purity ofReclaimed Refrigerant Blends and Azeotropes by GasChromatography.
Figure 1. Gas Chromatogram of R-508

151
Table 1A. Contaminant Statistical Parameters
Component DetectionLimit, ppm
RangeInvestigated,
ppm
Precision at 95%Confidence Limit, ppm
methane 1 100 0.4ethene 1 200 1.0
13 14 450 2.0143a 2 450 3.0152a 2 450 5.3125 8 450 41134a 4 450 2.022 12 450 31
1301 14 450 3.6218 11 450 1.5
propene 1 100 6.0115 13 450 2112 16 450 2.4
142b 3 450 4.9124 7 450 3.9133a 3 450 5.221 8 450 5.4
isobutane 1 100 2.6114 9 450 4.8
n-butane 1 100 2.411 15 450 12
123 4 450 11113 5 450 7.8
Table 1B. Component Statistical Parameters
Component DetectionLimit, ppm
RangeInvestigated,
%
Precision at 95%Confidence Limit
23 8 39 % 0.12 %116 98 61 % 1.7 %
Table 1C. Blend Component Balance Preparation
ComponentFinal Pressure
AfterComponent
Addition (kPa)
Weight of RefrigerantAdded (g)
R-23 266 7.80
R-116 465 12.20

152
Table 2. Primary Calibration Standard Impurities
ComponentVapor
Density,mg/ml
VolumeAdded,
ml
mgAdded
(1)
ppmAdded
(2)
Total ppmPresent (3)
methane 0.656 4.0 2.62 130ethene 1.147 4.0 4.58 226
13 4.331 2.4 10.39 513143a 3.511 2.9 10.18 503152a 2.772 3.7 10.25 506125 5.004 2.1 10.50 519134a 4.279 2.4 10.26 50722 3.606 2.9 10.45 516
1301 6.205 1.7 10.54 521218 7.923 1.3 10.29 508
propene 1.756 5.8 10.18 503115 6.486 1.6 10.37 51212 5.077 2.0 10.15 501
142b 4.248 2.4 10.19 503124 5.758 1.8 10.36 512133a 4.846 2.1 10.17 50221 4.367 2.4 10.48 517
isobutane 2.452 4.2 10.29 508114 7.319 1.4 10.24 506
n-butane 2.463 4.2 10.34 511
ComponentLiquid
Density,mg/µl
VolumeAdded,
µl
mgAdded
(1)
ppmAdded
(2)
Total ppmPresent
(3)11 1.537 6.6 10.14 501123 1.526 6.7 10.22 505113 1.619 6.3 10.19 503
(1) If necessary, correct the mg added for the purity of the calibration componentpreviously established.
(2) Values shown are for illustration; exact values are determined at Part 33,Section 9.3, steps c and d.
(3) Column to be filled in (Part 33, Section 9.3, step g) after determining ppmpresent in the stock components (see Note 1 in Section 10).
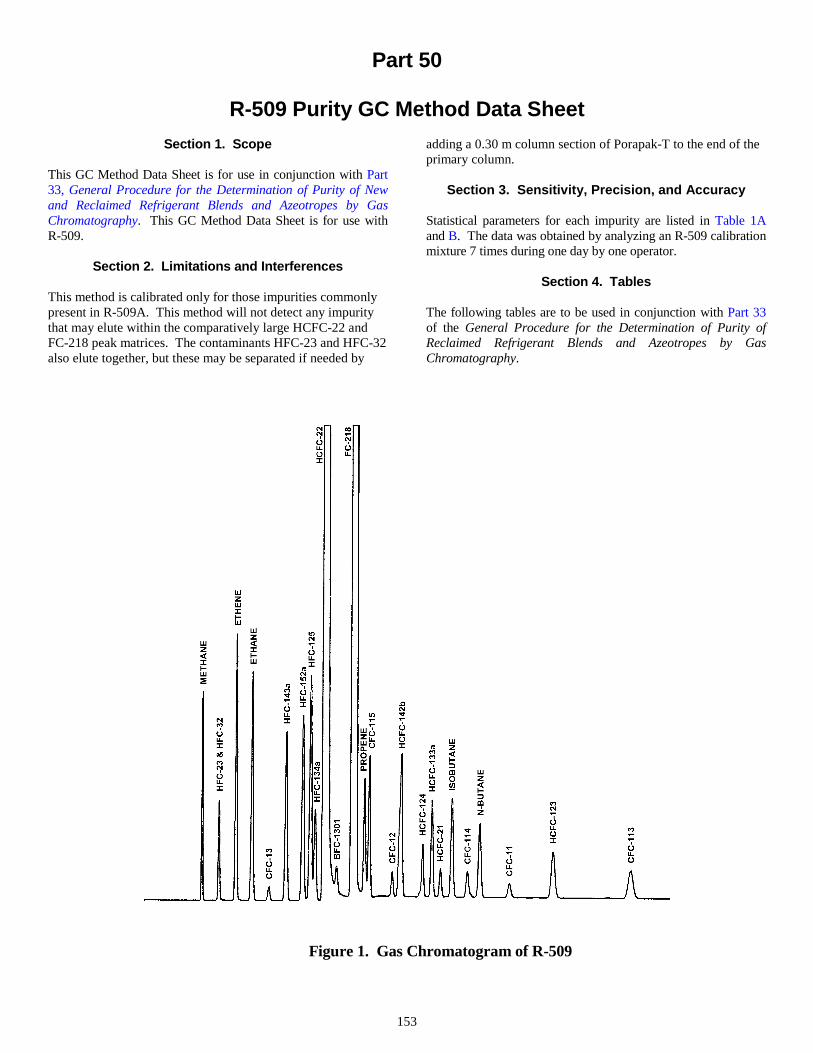
153
Part 50
R-509 Purity GC Method Data Sheet
Section 1. Scope
This GC Method Data Sheet is for use in conjunction with Part33, General Procedure for the Determination of Purity of Newand Reclaimed Refrigerant Blends and Azeotropes by GasChromatography. This GC Method Data Sheet is for use withR-509.
Section 2. Limitations and Interferences
This method is calibrated only for those impurities commonlypresent in R-509A. This method will not detect any impuritythat may elute within the comparatively large HCFC-22 andFC-218 peak matrices. The contaminants HFC-23 and HFC-32also elute together, but these may be separated if needed by
adding a 0.30 m column section of Porapak-T to the end of theprimary column.
Section 3. Sensitivity, Precision, and Accuracy
Statistical parameters for each impurity are listed in Table 1Aand B. The data was obtained by analyzing an R-509 calibrationmixture 7 times during one day by one operator.
Section 4. Tables
The following tables are to be used in conjunction with Part 33of the General Procedure for the Determination of Purity ofReclaimed Refrigerant Blends and Azeotropes by GasChromatography.
Figure 1. Gas Chromatogram of R-509

154
Table 1A. Contaminant Statistical Parameters
Component DetectionLimit, ppm
RangeInvestigated,
ppm
Precision at 95%Confidence Limit, ppm
methane 1 100 0.923 8 450 8.332 3 450 4.8
ethene 1 200 1.4ethane 1 200 1.9
13 9 450 2.7143a 1 450 4.8152a 1 450 5.4125 4 450 5.2134a 2 450 3.61301 7 450 4.5
propene 1 100 0.5115 6 450 1212 8 450 1.3
142b 1 450 83124 3 450 7.3133a 2 450 7.621 4 450 6.0
isobutane 1 100 1.2114 4 450 4.9
n-butane 1 100 1.211 6 450 17
123 2 450 5.2113 2 450 13
Table 1B. Component Statistical Parameters
Component DetectionLimit, ppm
RangeInvestigated,
%
Precision at 95%Confidence Limit
22 5 44 % 0.01 %218 5 56 % 0.12 %
Table 1C. Blend Component Balance Preparation
ComponentFinal Pressure
AfterComponent
Addition (kPa)
Weight of RefrigerantAdded (g)
FC-218 140 11.20
R-22 363 8.80
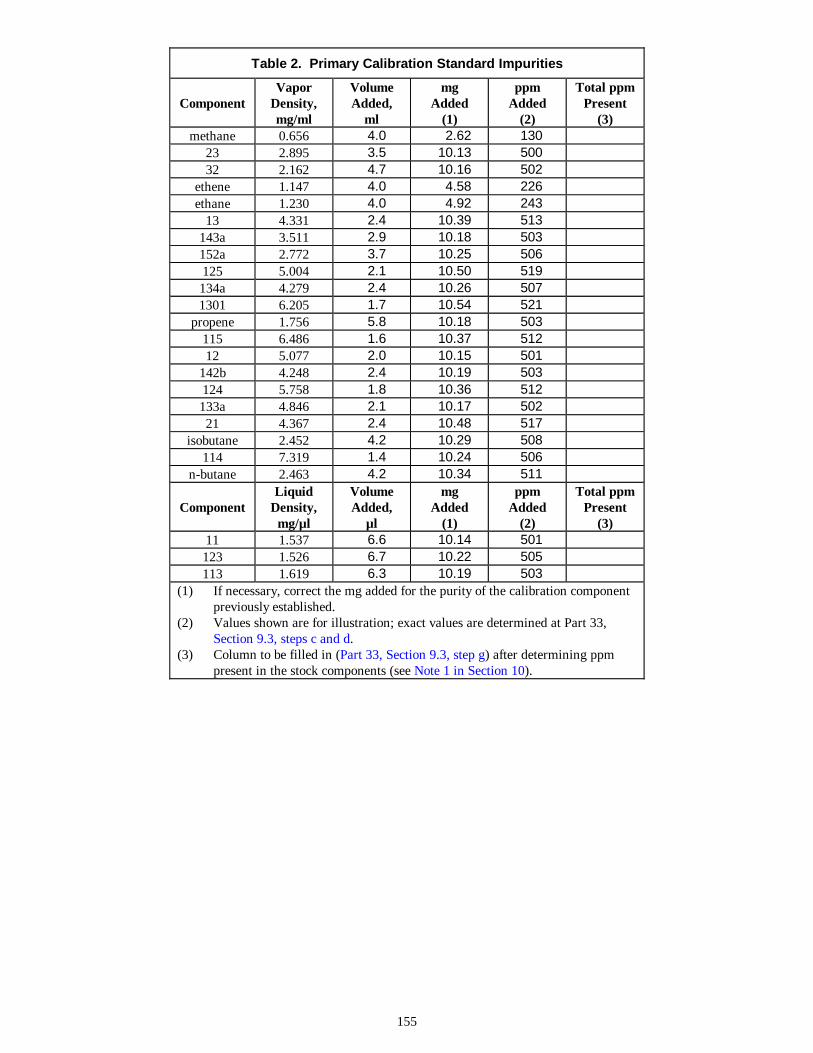
155
Table 2. Primary Calibration Standard Impurities
ComponentVapor
Density,mg/ml
VolumeAdded,
ml
mgAdded
(1)
ppmAdded
(2)
Total ppmPresent
(3)methane 0.656 4.0 2.62 130
23 2.895 3.5 10.13 50032 2.162 4.7 10.16 502
ethene 1.147 4.0 4.58 226ethane 1.230 4.0 4.92 243
13 4.331 2.4 10.39 513143a 3.511 2.9 10.18 503152a 2.772 3.7 10.25 506125 5.004 2.1 10.50 519134a 4.279 2.4 10.26 5071301 6.205 1.7 10.54 521
propene 1.756 5.8 10.18 503115 6.486 1.6 10.37 51212 5.077 2.0 10.15 501
142b 4.248 2.4 10.19 503124 5.758 1.8 10.36 512133a 4.846 2.1 10.17 50221 4.367 2.4 10.48 517
isobutane 2.452 4.2 10.29 508114 7.319 1.4 10.24 506
n-butane 2.463 4.2 10.34 511
ComponentLiquid
Density,mg/µl
VolumeAdded,
µl
mgAdded
(1)
ppmAdded
(2)
Total ppmPresent
(3)11 1.537 6.6 10.14 501123 1.526 6.7 10.22 505113 1.619 6.3 10.19 503
(1) If necessary, correct the mg added for the purity of the calibration componentpreviously established.
(2) Values shown are for illustration; exact values are determined at Part 33,Section 9.3, steps c and d.
(3) Column to be filled in (Part 33, Section 9.3, step g) after determining ppmpresent in the stock components (see Note 1 in Section 10).
Top Related