


Languages
Pages
Legal

Aim:
To study the different types of signal sampling and its reconstruction.
Apparatus Required:
1. Sampling and its reconstruction Kit - DCL 01
2. Digital Storage Oscilloscope (DSO)
3. Power supply
4. Patch cords
Procedure:
1. The connections are given as per the block diagram for natural sampling
2. Connect the power supply in proper polarity to the kit and & switch it on.
3. Using the clock selector switch select 8 KHz sampling frequency and using switch SW2 select 50% duty cycle.
4. The input and output waveforms are measured using DSO.
5. The procedure above is repeated for sample & hold and flat top sampling.
Tabular Column:
SIGNAL AMPLITUDE (V) TIME FREQ(HZ) PERIOD (S)
I/P Signal
Clock Signal
O/P a) Natural
Sampling
b) Sample hold
c) Flat top sampling
Dev Bhoomi Institute Of Technology
Department of Electronics and Communication
Engineering
LABORATORY
MANUAL
PRACTICAL INSTRUCTION SHEET
EXPERIMENT NO. 1 ISSUE NO. : ISSUE DATE: JULY 2011
REV. NO. : REV. DATE :
PAGE: 3
LABORATORY Name & Code: DIGITAL COMMUNICATION PEC-651 SEMESTER: VI

Fig. 1.1 Block Diagram for Natural Sampling
Fig. 1.2 Block Diagram for Sample and Hold
Fig. 1.3 Block Diagram for Flat Top Sampling

MODEL GRAPH
Fig 1.4 Model Graph for Signal is sampling and reconstruction using sample & hold.
Result:
Comparing the reconstructed output of 2nd
order Low Pass Butterworth filter for all three types of sampling , it is observed that the output of the sample and hold is the better when compared to the outputs of natural sampling and the flat top sampling.

Aim:
To study an amplitude modulation & demodulation circuit and to calculate modulation index of AM.
Apparatus Required:
1. AM transmitter and receiver kit
2. Digital Storage Oscilloscope (DSO)
3. Power supply
4. Patch cords
Procedure:
1. The connections are given as per the block diagram.
2. Set the modulating signal frequency at 1KHz and carrier signal frequency at 500Khz
3. Vary the amplitude of the modulating signal and check for the three following conditions
a. Modulation index (m) lesser than 1
b. Modulation index (m) equal to 1
c. Modulation index (m) greater than 1
Dev Bhoomi Institute Of Technology
Department of Electronics and Communication
Engineering
LABORATORY
MANUAL
PRACTICAL INSTRUCTION SHEET
EXPERIMENT NO. 2 ISSUE NO. : ISSUE DATE: JULY 2011
REV. NO. : REV. DATE :
PAGE: 3
LABORATORY Name & Code: DIGITAL COMMUNICATION PEC-651 SEMESTER: VI

Block Diagram
Fig. 2.1 Block Diagram for AM Modulation and Demodulation
MODEL GRAPH
Fig 2.1 Model Graph for AM Modulation and demodulation.

Tabular Column:
Result:
Message Frequency = Carrier Frequency =
S.NO Am Ac Emax Emin %M
Amplitude Modulation and Demodulation are verified in the hardware kit and its waveforms are analyzed for different modulation index.
Aim:
To study frequency modulation & demodulation and to calculate modulation index of FM.
Apparatus Required:
1. FM transmitter and receiver kit
2. Digital Storage Oscilloscope (DSO)
3. Power supply
4. Patch cords
Procedure:
1. The connections are given as per the block diagram.
2. Set the modulating signal frequency at 1KHz and carrier signal frequency at 500Khz
3. Vary the frequency of the modulating signal and check for the three following conditions
a. Modulation index (m) lesser than 1
b. Modulation index (m) equal to 1 c. Modulation index (m) greater than 1
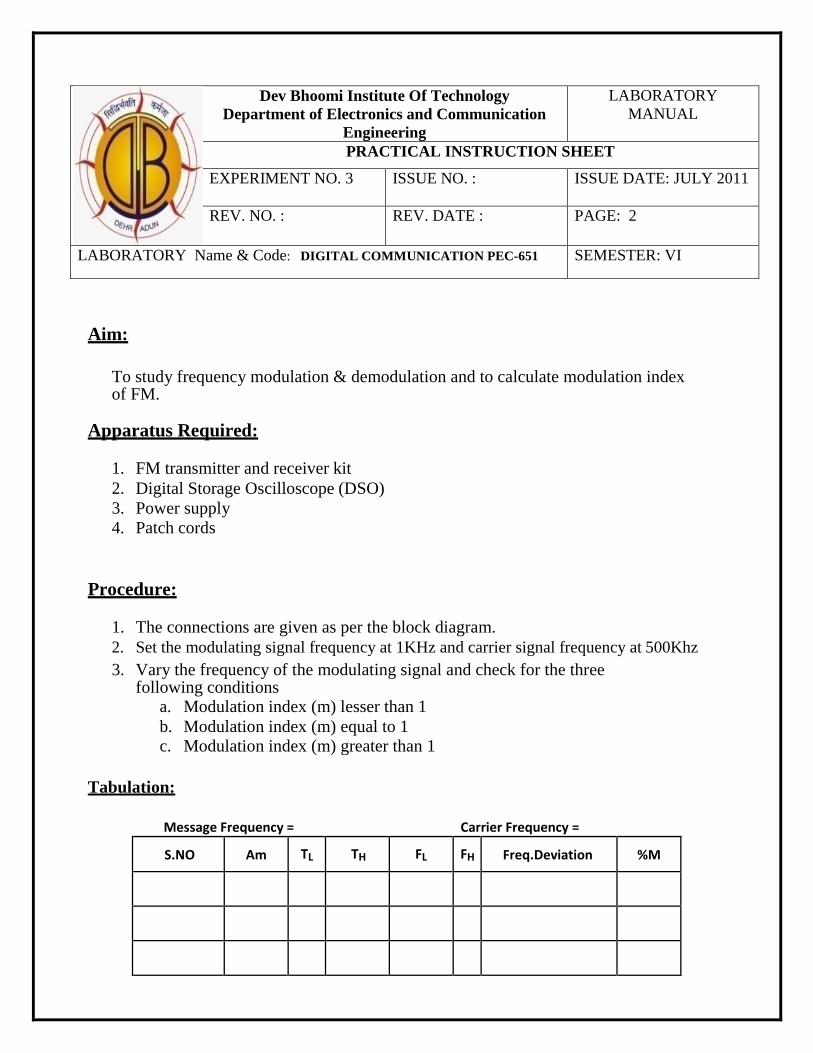
Tabulation:
Message Frequency = Carrier Frequency =
S.NO Am TL TH FL FH Freq.Deviation %M
Dev Bhoomi Institute Of Technology
Department of Electronics and Communication
Engineering
LABORATORY
MANUAL
PRACTICAL INSTRUCTION SHEET
EXPERIMENT NO. 3 ISSUE NO. : ISSUE DATE: JULY 2011
REV. NO. : REV. DATE :
PAGE: 2
LABORATORY Name & Code: DIGITAL COMMUNICATION PEC-651 SEMESTER: VI

Block Diagram
Model Graph
Fig 3.1 Block diagram for FM modulation and demodulation
Fig 3.2 Model Graph for FM modulation and demodulation
Result:
Frequency Modulation and Demodulation are verified in the hardware kit and its waveforms are analyzed for different modulation index.

Aim: To construct and study a PCM transmitter and receiver kit
Apparatus Required:
1. PCM Transmitter and Receiver Kit
2. Digital Storage Oscilloscope (DSO)
3. Power supply
4. Patch cords
Procedure:
1. The connections are given as per the block diagram.
2. Connect power supply in proper polarity to kits DCL-03 and DCL-04 and switch it on.
3. Set the function generator , clock generator and speed selection switch SW1 to fast mode.
4. Observe the modulated output and demodulated output. 5. Measure the observed output and with the values plot the graph.
Tabular Column:
SIGNAL AMPLITUDE (V) TIME PERIOD (s)FRE QUENCY(Hz)
Message Signal_1
Message Signal_2
Clock Signal _1
Clock Signal _2
PCM (Modulated Output)
Demodulated Signal_1
Demodulated Signal_2
Dev Bhoomi Institute Of Technology
Department of Electronics and Communication
Engineering
LABORATORY
MANUAL
PRACTICAL INSTRUCTION SHEET
EXPERIMENT NO. 4 ISSUE NO. : ISSUE DATE: JULY 2011
REV. NO. : REV. DATE :
PAGE: 2
LABORATORY Name & Code: DIGITAL COMMUNICATION PEC-651 SEMESTER: VI

Block Diagram
Fig. 4.1 Block Diagram for PCM Modulation and Demodulation
Model Graph
Result:
Pulse Code Modulation and Demodulation are verified in the hardware kit and its waveforms are studied.

Aim: To study the characteristics of delta modulation and demodulation kit.
Apparatus Required:
1. Delta modulation and demodulation Kit
2. Digital Storage Oscilloscope (DSO)
3. Power supply
4. Patch cords
Procedure:
1. The connections are given as per the block diagram.
2. Connect power supply in proper polarity to kits DCL-07 and switch it on. 3. Keep the Switch S2 in Delta position.
4. Keep the Switch S4 High.
5. Observe the various tests points in delta demodulator section and observe the
reconstructed signal through 2nd
order and 4th
order filter .
TABULATION
AMPLITUDE TIME PERIODFR EQUENCY
Message Signal
Digital Sampler
O/P
Integrator -3 O/P
Filter O/P
Dev Bhoomi Institute Of Technology
Department of Electronics and Communication
Engineering
LABORATORY
MANUAL
PRACTICAL INSTRUCTION SHEET
EXPERIMENT NO. 5 ISSUE NO. : ISSUE DATE: JULY 2011
REV. NO. : REV. DATE :
PAGE: 2
LABORATORY Name & Code: DIGITAL COMMUNICATION PEC-651 SEMESTER: VI

Block Diagram
Fig 5.1a Block diagram for delta modulation and demodulation
MODELGRAPH
RESULT
Delta Modulation and Demodulation are verified in the hardware kit and its waveforms are studied.

Aim: To study the characteristics of adaptive delta modulation and demodulation kit.
Apparatus Required:
1. Delta modulation and demodulation Kit
2. Digital Storage Oscilloscope (DSO)
3. Power supply
4. Patch cords
Procedure:
1. The connections are given as per the block diagram.
2. Connect power supply in proper polarity to kits DCL-07 and switch it on.
3. Keep the Switch S2 in sigma delta position.
4. Keep the Switch S3 High.
5. Observe the various tests points in demodulator section and observe the
reconstructed signal through 2nd
order and 4th
order filter .
Tabulation
AMPLITUDE TIME PERIODFR EQUENCY
Message Signal
Digital Sampler O/P
Integrator -3 O/P
Filter O/P
Dev Bhoomi Institute Of Technology
Department of Electronics and Communication
Engineering
LABORATORY
MANUAL
PRACTICAL INSTRUCTION SHEET
EXPERIMENT NO. 6 ISSUE NO. : ISSUE DATE: JULY 2011
REV. NO. : REV. DATE :
PAGE: 2
LABORATORY Name & Code: DIGITAL COMMUNICATION PEC-651 SEMESTER: VI

BLOCK DIAGRAM
Fig 5.1b Block diagram for Adaptive delta modulation and demodulation
MODELGRAPH
RESULT
Adaptive Delta Modulation and Demodulation are verified in the hardware kit and its waveforms are studied.

Aim:
To study the characteristics of Binary Frequency Shift keying (BFSK) modulation and demodulation.
Apparatus Required:
1. BFSK Modulation (DCL-05) and demodulation kit (DCL-06)
2. Digital Storage Oscilloscope (DSO)
3. Power supply
4. Patch cords
Procedure:
1. The connections are given as per the block diagram.
2. Connect the power supply in proper polarity to the kit and & switch it on.
3. Set the amplitude of the sine wave as desired.
4. Observe the waveforms at the a. Clock
b. SIN 1 & SIN 2
c. MODULATOR OUTPUT
d. FSK OUT
and plot it on graph paper
Tabulation:
SIGNAL AMPLITUDE (V) TIME PERIOD (s) Frequency(Hz)
Clock Signal
Input 1
Input2
Modulator Output
Demodulated Output
Dev Bhoomi Institute Of Technology
Department of Electronics and Communication
Engineering
LABORATORY
MANUAL
PRACTICAL INSTRUCTION SHEET
EXPERIMENT NO. 7 ISSUE NO. : ISSUE DATE: JULY 2011
REV. NO. : REV. DATE :
PAGE: 2
LABORATORY Name & Code: DIGITAL COMMUNICATION PEC-651 SEMESTER: VI

Block Diagram:
Fig 6.1 Block diagram for Frequency Shift Keying
Model Graph:
RESULT
BFSK Modulation and Demodulation are verified in the hardware kit and its waveforms are studied.

Aim: To construct and study the characteristics of BPSK modulation and demodulation.
Apparatus Required:
1. BPSK Modulation and demodulation kit
2. Digital Storage Oscilloscope (DSO)
3. Power supply
4. Patch cords
Procedure:
5. The connections are given as per the block diagram.
6. Connect the power supply in proper polarity to the kit and & switch it on.
7. Set the amplitude of the sine wave as desired.
8. Observe the waveforms at the
a. Clock
b. SIN 1 & SIN 2 c. MODULATOR OUTPUT
d. PSK OUT
and plot it on graph paper
Tabulation:
SIGNAL AMPLITUDE (V) TIME PERIOD (s) Frequency(Hz)
Clock Signal
Input 1
Input2
Modulator Output
Demodulated Output
Dev Bhoomi Institute Of Technology
Department of Electronics and Communication
Engineering
LABORATORY
MANUAL
PRACTICAL INSTRUCTION SHEET
EXPERIMENT NO. 8 ISSUE NO. : ISSUE DATE: JULY 2011
REV. NO. : REV. DATE :
PAGE: 2
LABORATORY Name & Code: DIGITAL COMMUNICATION PEC-651 SEMESTER: VI

Block Diagram:
Fig 7.1 Block diagram for Binary Phase Shift Keying
Model Graph:
RESULT
BPSK Modulation and Demodulation are verified in the hardware kit and its waveforms are studied.

Aim: To study the Time Division Multiplexing (TDM) and draw its waveforms.
Apparatus Required:
1. DCL 02 TDM kit
2. Digital Storage Oscilloscope (DSO)
3. Power supply
4. Patch cords
Procedure:
1. The connections are given as per the block diagram.
2. Connect the power supply in proper polarity to the kit and & switch it on.
3. Set the amplitude of the sine wave as desired.
4. Observe the following waveforms at the
a. Input Channel
b. Multiplexer Output (TXD)
c. Reconstructed Signal (OUT0, OUT1,OUT2,OUT3) and
plot it on graph paper
Tabulation: SIGNAL AMPLITUDE (V) TIME PERIOD (s) Frequency(Hz)
CARRIER (CLK) TON=
TOFF=
MODULATING1
MODULATING2
MODULATING3
MODULATING4
MODULATED V1= T1=
V2= T2=
V3= T3=
V4= T4=
DEMODULATED V1= T1=
V2= T2=
V3= T3=
V4= T4=
Dev Bhoomi Institute Of Technology
Department of Electronics and Communication
Engineering
LABORATORY
MANUAL
PRACTICAL INSTRUCTION SHEET
EXPERIMENT NO. 9 ISSUE NO. : ISSUE DATE: JULY 2011
REV. NO. : REV. DATE :
PAGE: 2
LABORATORY Name & Code: DIGITAL COMMUNICATION PEC-651 SEMESTER: VI

Block Diagram:
Fig 8.1a Block diagram for Time Division Multiplexing
Model graph
RESULT
TDM Modulation and Demodulation are verified in the hardware kit and its waveforms are studied.

Aim: To study the Frequency Division Multiplexing (FDM) and draw its waveforms.
Apparatus Required:
1. ACL 06 FDM kit
2. Digital Storage Oscilloscope (DSO)
3. Power supply
4. Patch cords
Procedure:
1. The connections are given as per the block diagram.
2. Connect the power supply in proper polarity to the kit and & switch it on.
3. Observe the following waveforms at the
a. Input Channel
b. Multiplexer Output (TXD) c. Reconstructed Signal (OUT0, OUT1,OUT2,OUT3)
and plot it on graph paper
Block Diagram:
Fig 8.1b Block diagram for Frequency Division Multiplexing
Dev Bhoomi Institute Of Technology
Department of Electronics and Communication
Engineering
LABORATORY
MANUAL
PRACTICAL INSTRUCTION SHEET
EXPERIMENT NO. 10 ISSUE NO. : ISSUE DATE: JULY 2011
REV. NO. : REV. DATE :
PAGE: 2
LABORATORY Name & Code: DIGITAL COMMUNICATION PEC-651 SEMESTER: VI
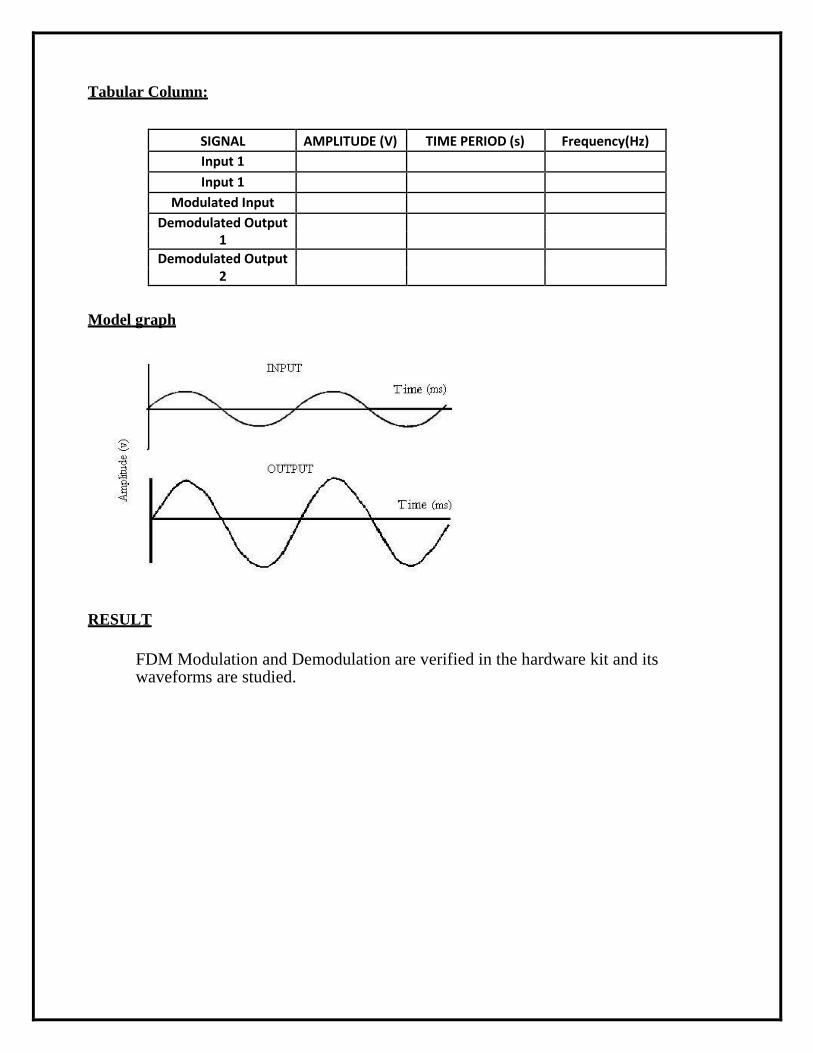
Tabular Column:
SIGNAL AMPLITUDE (V) TIME PERIOD (s) Frequency(Hz)
Input 1
Input 1
Modulated Input
Demodulated Output
1
Demodulated Output
2
Model graph
RESULT
FDM Modulation and Demodulation are verified in the hardware kit and its waveforms are studied.

AIM:
To perform data coding and decoding techniques for phase encoded format.
APPARATUS REQUIRED
1. Experiment kits DCL-05 & DCL-06
2. Patch cords
3. Power supply
DIAGRAM:
Dev Bhoomi Institute Of Technology
Department of Electronics and Communication
Engineering
LABORATORY
MANUAL
PRACTICAL INSTRUCTION SHEET
EXPERIMENT NO. 10 ISSUE NO. : ISSUE DATE: JULY 2011
REV. NO. : REV. DATE :
PAGE: 2
LABORATORY Name & Code: DIGITAL COMMUNICATION PEC-651 SEMESTER: VI

THEORY
This phase – encoded – group consists of
a) Biphase – level
b) Biphase – mark
c) Biphase – Space
With the Biphase – L ‘ one’ is represented by a half bit wide pulse partitioned during the
first half the bit interval and a ‘zero’ is represent by a half bit white pulse partitioned during the
second half of the bit interval.
PROCEDURE
1. Connections are given as per the circuit diagram
2. Connect CLOCK and data generated on DCL-05 to coding CLOCK IN and data input
respectively by means of patch cords.
3. Connect the coded data NRZ – L on DCL-05 to corresponding DATA INPUT NRZ–L
of the decoding logic on DCL-06
4. Keep the switches SW2 for NRZ-L to ON position
5. Observe the coded and decoded signal on the oscilloscope ,Observe the waveform
TABULATION:
SIGNALS AMPLITUDE (V) TIME (ms)
Input
Output
MODEL GRAPH:
RESULT:The data coding and decoding techniques for phase encoded format are studied.
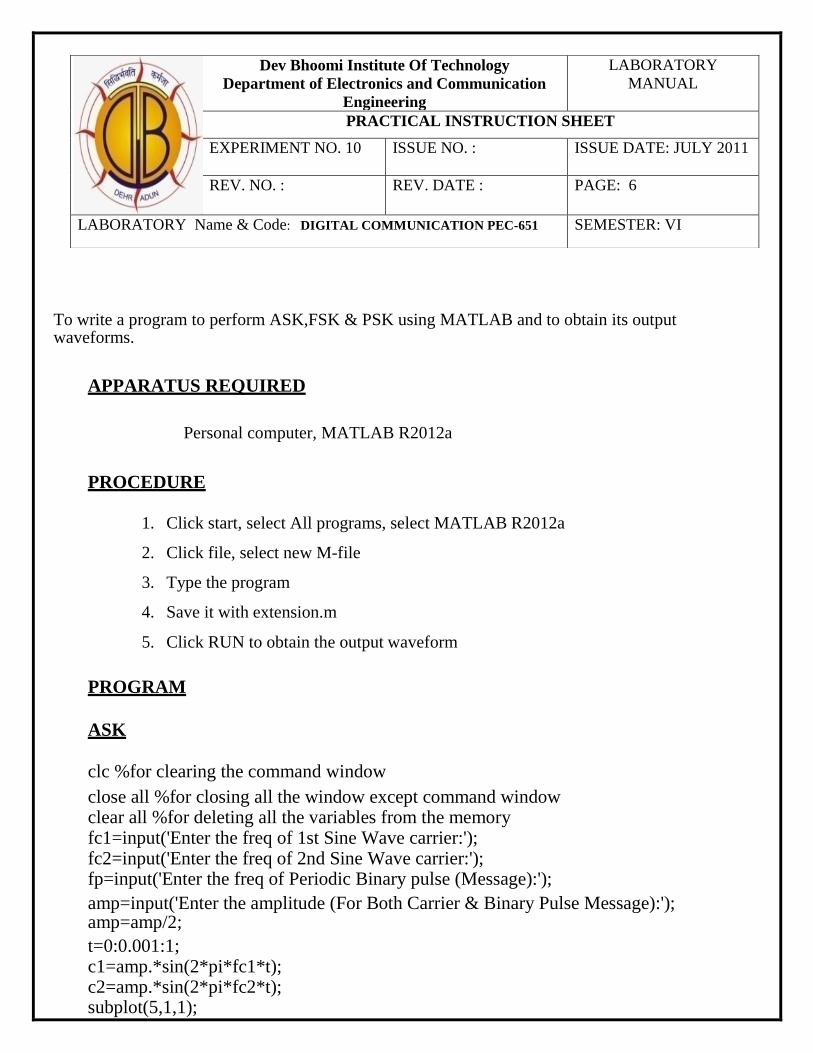
To write a program to perform ASK,FSK & PSK using MATLAB and to obtain its output waveforms.
APPARATUS REQUIRED
Personal computer, MATLAB R2012a
PROCEDURE
1. Click start, select All programs, select MATLAB R2012a
2. Click file, select new M-file
3. Type the program
4. Save it with extension.m
5. Click RUN to obtain the output waveform
PROGRAM
ASK
clc %for clearing the command window
close all %for closing all the window except command window clear all %for deleting all the variables from the memory fc1=input('Enter the freq of 1st Sine Wave carrier:'); fc2=input('Enter the freq of 2nd Sine Wave carrier:'); fp=input('Enter the freq of Periodic Binary pulse (Message):');
amp=input('Enter the amplitude (For Both Carrier & Binary Pulse Message):'); amp=amp/2;
t=0:0.001:1; c1=amp.*sin(2*pi*fc1*t); c2=amp.*sin(2*pi*fc2*t); subplot(5,1,1);
Dev Bhoomi Institute Of Technology
Department of Electronics and Communication
Engineering
LABORATORY
MANUAL
PRACTICAL INSTRUCTION SHEET
EXPERIMENT NO. 10 ISSUE NO. : ISSUE DATE: JULY 2011
REV. NO. : REV. DATE :
PAGE: 6
LABORATORY Name & Code: DIGITAL COMMUNICATION PEC-651 SEMESTER: VI

plot(t,c1)
xlabel('Time')
ylabel('Amplitude') title('Carrier 1 Wave') subplot(5,1,2)
plot(t,c2) xlabel('Time')
ylabel('Amplitude') title('Carrier 2 Wave')
m=amp.*square(2*pi*fp*t)+amp; subplot(5,1,3) plot(t,m) xlabel('Time')
ylabel('Amplitude') title('Binary Message Pulses') for i=0:1000
if m(i+1)==0 mm(i+1)=c2(i+1); else mm(i+1)=c1(i+1);
end end
subplot(5,1,4)
plot(t,mm)
xlabel('Time')
ylabel('Amplitude') title('Modulated Wave') for i=0:1000
if mm(i+1)==c2(i+1) dm(i+1)=m(i+1);
else dm(i+1)=m(i+1);
end end
subplot(5,1,5)
plot(t,dm)
xlabel('Time')
ylabel('Amplitude') title('Demodulated signal')

Fig 10.1 Matlab Simulation of ASK
FSK
clc %for clearing the command window
close all %for closing all the window except command window clear all %for deleting all the variables from the memory fc1=input('Enter the freq of 1st Sine Wave carrier:'); fc2=input('Enter the freq of 2nd Sine Wave carrier:'); fp=input('Enter the freq of Periodic Binary pulse (Message):');
amp=input('Enter the amplitude (For Both Carrier & Binary Pulse Message):'); amp=amp/2;
t=0:0.001:1; c1=amp.*sin(2*pi*fc1*t);
c2=amp.*sin(2*pi*fc2*t); subplot(5,1,1);
plot(t,c1)
xlabel('Time')
ylabel('Amplitude') title('Carrier 1 Wave') subplot(5,1,2) plot(t,c2) xlabel('Time') ylabel('Amplitude') title('Carrier 2 Wave')
m=amp.*square(2*pi*fp*t)+amp; subplot(5,1,3)

plot(t,m)
xlabel('Time')
ylabel('Amplitude') title('Binary Message Pulses') for i=0:1000
if m(i+1)==0 mm(i+1)=c2(i+1); else mm(i+1)=c1(i+1);
end end subplot(5,1,4)
plot(t,mm)
xlabel('Time')
ylabel('Amplitude') title('Modulated Wave') for i=0:1000
if mm(i+1)==c2(i+1) dm(i+1)=m(i+1);
else dm(i+1)=m(i+1);
end end subplot(5,1,5)
plot(t,dm)
xlabel('Time')
ylabel('Amplitude') title('Demodulated signal')
Fig 10.2 Matlab Simulation of FSK PSK

clear all; clc; close all;
set(0,'defaultlinelinewidth',2);
A=5;
t=0:.001:1;
f1=input('Carrier Sine wave frequency ='); f2=input('Message frequency ='); x=A.*sin(2*pi*f1*t);%Carrier Sine subplot(4,1,1);
plot(t,x); xlabel('time');
ylabel('Amplitude');
title('Carrier'); grid on;
u=square(2*pi*f2*t);%Message signal subplot(4,1,2); plot(t,u);
xlabel('time');
ylabel('Amplitude'); title('Message Signal'); grid on;
v=x.*u;%Sine wave multiplied with square wave subplot(4,1,3); plot(t,v);
xlabel('t');
ylabel('y');
title('PSK'); grid on;
d=v./x;%Sine wave multiplied with square wave subplot(4,1,4); plot(t,d);
xlabel('t');
ylabel('y'); title('Demodulated PSK'); grid on;

Fig 10.2 Matlab Simulation of PSK
RESULT
Thus the program for performing frequency shift keying using MATLAB was
performed.
Top Related