


Languages
Pages
Legal

Pollution, 3(1): 55-67, Winter 2017
DOI: 10.7508/pj.2017.01.007
Print ISSN 2383-451X Online ISSN: 2383-4501
Web Page: https://jpoll.ut.ac.ir, Email: [email protected]
55
Determination of nitrate utilization efficiency of selective strain of
Bacillus sp. isolated from Eutrophic Lake, Theerthamkara,
Kasaragod, Kerala
Usharani, K.1,2*
, Sruthilaya, K.1 and Divya, K.
1
1. Department of Environmental Science, School of Energy, Environment and
Earth Sciences, Central University of Kerala, India
2. Division of Environmental Microbiology, Department of Environmental
Sciences, Bharathiar University, TN, India
Received: Accepted:
ABSTRACT: Nitrate pollutants increase the growth of algal bloom, resulting in fresh water eutrophication. The high nitrogen level in wastewater has become a growing concern, which has risen the necessity to develop efficient nitrogen removal techniques. Biological denitrification, which is the reduction of oxidized nitrogen compounds like nitrate or nitrite to gaseous nitrogen compounds, is the most important and widely used method to treat nitrate wastes as it enables the transformation of nitrogen compounds into harmless nitrogen gas. As such, this study collected samples from Eutrophic Lake, picking isolates of bacterial strain with good growth rates in the nitrate medium. The selected bacterial strains were cultured on media 1and 2 and by means of UV-visible spectrophotometer, the nitrate removal efficiency and growth were detected at 410 nm and 600 nm OD respectively. After comparing three bacterial strains, it was found that RN1 had a higher efficiency in nitrate removal at 1000ppm nitrate concentration. At an optimum temperature of 37
°C, pH of 7, and agitation of 121 rpm, after 432 hrs of the
treatment, RN1 showed an optimum growth, equal to 0.1859 OD in 1000ppm nitrate solution with dextrose. Also the spectral analysis of RN1 strain showed 85% removal efficiency, thus making this strain the best one. Confirmed and identified as Bacillus species, it can be recommended for the bioremoval process of nitrate from wastewater.
Keywords: Bacillus sp., bioremoval process, eutrophic water, nitrate.
INTRODUCTION
Pollution of water resources by excessive
presence of nitrogen compounds such as
nitrate, nitrite, and ammonium, is a real
health-related and environmental threat.
Unrestrained utilization of artificial
fertilizers as well as uncontrolled discharge
Corresponding author E-mail: [email protected]; [email protected]
of raw have been known to cause large
amounts of nitrate and phosphate permeate
ground and surface waters (Peavy et al.,
1985; Lin and Wu, 1996; Shrimali and
Singh, 2001; Bogardi and Kuzelka, 1991).
The discharge of nitrogen components into
the environment is hazardous for not only
human but animal health also, and nitrate
pollution and remediation is at the same
time a global issue and challenge.
11 Jun. 2016 9 Aug. 2016

Usharani, K. et al.
56
Nitrate excess in the drinking water may
cause blue disease in babies, called
methemoglobinemia in new-born infants
along with other illnesses (Ozturk and
Bektas, 2004). The most important
environmental problems, caused by
nitrogen and phosphorus compounds, are
eutrophication of water supplies and
infectious disease (Barber and Stuckey,
2000). Nitrate pollutants increase the
growth of algal bloom, leading to fresh
water eutrophication. These components
are involved in the eutrophication of
surface waters as well as high levels of
nitrate and nitrite ions in drinking water,
entails a substantial risk for human health
(Jorgensen, 2001; Viessman and Hammer,
2005; Chiban et al., 2012; WHO, 1984).
In addition, excessive levels of nitrate
ions in drinking water may cause health
problems, especially for infants under six
months of age and pregnant women (Seidel
et al., 2008). The Maximum Acceptable
Concentration (MAC) for nitrate-nitrogen
in Canadian drinking water has been
established as 10 mg N-NO3-/L (Health
Canada, 2003; WHO, 2007). Moreover, in
1990 Environmental Protection Agency
(EPA) indicated that 250,000 water supply
sources had Maximum Contaminant Levels
(MCL) for nitrate. In 2004, the World
Health Organization (WHO) found that
30% of the 2,000 sources, surveyed in the
world, had more than 24 mg N-NO3-/L
(Archna et al., 2012). Inside body, once
nitrate is converted to nitrite, the oxygen-
carrying capacity in blood is reduced,
resulting in a condition called
"methaemoglobinaemia", also known as
"blue baby syndrome" (WHO, 1984).
Moreover, the reaction between nitrite and
secondary or tertiary amine in acidic
organs such as in the human stomach could
lead to the formation of Nitroso
compounds (NOC), which are known to be
carcinogenic, teratogenic, and mutagenic
(Pontius, 1993; Mikuska and Vecera,
2003;). After a while, NOC might cause
stomach and bladder cancer.
Microorganism-based bioremediation is
one of the biological wastewater-treatment
methods or processes to eliminate nitrate
contaminants from aquatic system; therefore,
removal of nitrate and nitrite from water is of
high account for environment and health.
Nowadays, many traditional methods have
been applied to remove nitrate from
wastewater. They include biological de-
nitrification processes (Abe et al., 2002;
Schipper et al., 2005; Bougard et al., 2006),
chemical processes (Hu et al., 2001; Bae et
al., 2002; Cengeloglu et al., 2006), and
physical operation (Elmidaoui et al., 2001).
However, they are expensive, produce
increased volumes of sludge, and require
complex and strict control of the operating
conditions (Chatterjee and Woo, 2009;
Chatterjee et al., 2009). Recently, nitrate
removal via adsorption methods has attracted
much attention; however, these adsorbents
exhibit low adsorption capacity, due to
limited surface area. Furthermore, bacteria
with a marked resistance to high salinity are
generally employed when treating polluted
seawater; and strains, isolated from critically
polluted environments, are used for the
treatment of special industrial wastewater.
Nitrate pollution results in eutrophication
of fresh waters, becoming the most serious
environmental problem in our area as it
causes algae blooms. Growth of algae
decreases the concentration of dissolved
oxygen in water, ultimately resulting in the
death of fish and other aquatic organisms.
Hence, in order to avoid the eutrophic
formation of fresh water and determine the
efficiency of nitrate utilization, the present
study has been conducted on selective
bacterial strains, isolated from eutrophic
wastewater. This study has aimed to both
examine the removal potential of nitrate by
selective bacterial strains, isolated from
water samples of Eutrophic Lake and
determine its efficiency for denitrifying high
nitrate waste.
Pollution, 3(1): 55-67, Winter 2017
57
MATERIALS AND METHODS
Sample collection The study included three sample types,
collected from different places in and
around Central University of Kerala (the
riverside transit campus) in order to isolate
the nitrate-utilizing bacteria. Water
samples such as Eutrophic pond water
from the Theerthamkara pond were taken
to laboratory under sterile conditions.
Serial dilution of water sample The sample, collected from the Eutrophic
Lake, was serially diluted by adding 9 to
10 ml distilled water to 1ml of the sample,
which was also added to the petriplates
from each dilution, being incubated at 37c
for 24 hrs. The number of cells was
counted and in order to isolate the pure
single colony, streak plate method was
utilized.
Isolation and Identification of nitrate removing bacteria The bacteria were isolated from collected
samples on Nutrient Agar Media (NAM)
from the numerous colonies, obtained from
the NAM plates. The colony with special
characteristics was picked out and streaked
on media 1 and 2. Afterwards pure isolated
colony was taken from the plates in order
to be cultured. (Media1: MgCl 2-1.4 g/l;
Potassium sulphate-10g/l; Agar-15g/l; pH-
7 and Media 2: Peptone casein -10g/l;
Protease peptone -10 g/l; Dipotassium
phosphate-1.5g/l; MgSo4 -1.5g/l; Agar -
15g/l; pH -7).
Bacterial degradation of nitrate
Determination of bacterial growth in nitrate solution using UV-vis spectrophotometer One ml of the sample was inoculated into
different concentrations of nitrate solution
with 0.5% dextrose (pH=6.7) as well as the
control, without any culture, which was
taken in a 250 ml conical flask, containing
200 ml of the solution, placed in the
shaking incubator. Bacterium growth was
measured by taking the optical density
(O.D) reading at 600 nm from 0 hrs to 432
hrs at regular intervals against deionised
water as blank, using UV-visible
spectrophotometer. The experiments were
repeated three times and their mean values
were used for the result analysis.
Bacterial culture inoculation and nitrate treatment
Preparation of stock solution Stock solution was prepared using
potassium nitrate: 1g potassium nitrate was
weighed and poured into a standard flask,
making an amount of 1000ml in a standard
flask using deionised water. From that
stock solution of nitrate solutions, the
desired ones were prepared with different
concentrations (500 ppm and 1000 ppm).
Culture inoculation in nitrate solution One ml of the sample was inoculated in
different concentrations of nitrate solution
with 0.5% dextrose (pH=6.7) as well as the
control, without any culture, taken in a 250-
ml conical flask, containing 200ml solution,
placed in the shaking incubator. The nitrate
level in the synthetic solution was estimated
every 24 hrs by centrifuging the sample. The
nitrate level in the synthetic solution was
estimated at different time intervals by
Salicylic acid method (i.e. Chromotropic
acid method-ammoniacal nitrogen in water;
APHA, 1998) at 410 nm via a
spectrophotometer. Control experiments
were also repeated with the same nitrate
solution concentrations, yet without any
inoculum. They were repeated three times
and their mean values were taken into
consideration during the result analysis.
Spectrophotometric analysis The nitrate level in the synthetic solution was
estimated at different time intervals by
Salicylic acid method (i.e. Chromotropic
acid method- ammoniacal nitrogen in water),
using spectrophotometer UV-2600 (series
SHIMADZU). For analysing nitrate solution,
about 0.25 ml of the sample solution, was
Usharani, K. et al.
58
measured via a pipette with a 50-ml beaker.
Added to that, was 0.8 ml of 5% (w/v)
salicylic acid in conc. H2SO4. After 20
minutes 19 ml NaOH was added, to increase
the pH above 12. Then the sample was
allowed to cool down, its absorbance
measured in terms of optical density (OD) at
410 nm, via a UV-visible spectrophotometer.
The relevant calibration graph consists of an
absorbance plot against the concentration for
a series of standard solutions, the
concentrations of which are accurately
known. The experiments were repeated three
times; their mean values, used for the result
analysis.
pH change The change in the pH of the bacterial
strain, inoculating samples with varying
concentrations at different time intervals,
was estimated using digital pH meter
(Scientific Tech Advanced pH meter, mode
ST-200).
Morphological and biochemical characterization Gram staining revealed the morphological
characteristics of the isolated bacterial
strains, whereas spore staining showed
whether the organism produced any spore
or not. Motility test was able to determine
the organism which is motile or non-
motile. Catalase test was performed to
check the ability of the isolated strains to
degrade Hydrogen Peroxide and Oxidase
test to detect the existence of cytochrome
oxidase enzyme. IMViC test, however, was
performed to identify the organisms and
carbohydrate utilization tests revealed the
ability of isolated strains in fermentation of
sugars like glucose, lactose, sucrose, and
mannitol. The identification occurred on
the basis of morphological and biochemical
characteristics as per Bergeys Manual of
Systemic Bacteriology (Holt et al., 1994).
RESULTS AND DISCUSSION Nitrate is a common pollutant to be found
in water. Its removal is an important
process to reduce environmental problems
and social impact. Thus, this study used
different bacterial strains to remove the
nitrates with the effective one being
selected. The high nitrogen level in
wastewater has become a growing concern,
which has increased the necessity to
develop efficient N-removal techniques.
High nitrate wastes (>1000 ppm NO3-N)
are usually generated by fertilizer, metal
finishing, and nuclear industry (Glass and
Silverstein, 1998 and 1999). Dealing with
such wastes has posed a challenge for these
industries. When such wastewaters are
released into water streams, they cause
various negative effects, like
methehemoglobinemia, on infants, also
being suspected to cause cancer (Forman et
al., 1991). In USA the permissible level for
nitrate in drinking water is 10 ppm NO3-N
(USEPA, 1987).
Biological denitrification, i.e. the
reduction of oxidized nitrogen compounds
like nitrate or nitrite to gaseous nitrogen
compounds, is the most important and
widely used method to treat nitrate wastes
as it enables the transformation of nitrogen
compounds into harmless nitrogen gas. It
happens by various chemorganotrophic,
lithoautotrophic, and phototrophic bacteria
as well as some fungi (Shoun and
Tanimoto, 1991; Zumft, 1997), especially
under oxygen-reduced or anoxic conditions
(Focht and Chang, 1975). Denitrifiers can
be naturally found in sediments, surface
waters, and soils, not to mention municipal
and industrial wastes. The universality and
common distribution of denitrifies is
related to the complexity of their species
and differing physiological requirements.
Isolation and selection of nitrate utilizing bacteria from the sample In the current study, collected samples
were isolated through pour plating, out of
which the colony with special
characteristics was selected and used for
further study. Serial dilution was done so
as to count bacterial colonies in each

Pollution, 3(1): 55-67, Winter 2017
59
dilution, itself carried out by pour plate
technique that used nutrient agar medium.
Table 1 and Table 2 represent the serial
dilution of two samples (soil and water).
Results showed that the number of
colonies, forming a unit, dropped when
dilution ascended.
A sum of three bacterial isolates was
screened for their growth on nitrate-
containing media. Three of them showed
the best growth on nutrient agar plates. The
selected bacterial strains showed rich
growth in nitrate-containing selective
media, thus they were chosen for further
study (Figs. 1 and 2). Here the study
started with three strains (EW1, EW2, and
RN1). Thanks to spectral analysis, the
efficiency of different bacterial strains was
observed, among which RN1 showed the
highest efficiency in nitrate removal.
Further identification processes, including
biochemical tests and grams staining
procedure, were performed on that strain.
Table 1. Average Colony Forming Unit (CFU/µl) from Eutrophic Lake
Sample Dilution Dilution factor Number of
colonies
Average colony forming unit
(CFU/µl)
1 10¯¹ 10¹ 40x4 160x10 CFU/µl
2 10¯² 10² 23x4 92x10² CFU/µl
3 10¯³ 10³ 17x4 68x10³ CFU/µl
4 10¯⁴ 10⁴ 15x4 60x10⁴ CFU/µl
5 10¯⁵ 10⁵ 12x4 48x10⁵ CFU/µl
Table 2. Average Colony Forming Unit (CFU/µl) from soil sludge
Sample Dilution Dilution factor Number of
colonies
Average colony forming unit
(CFU/µl)
1 10¯¹ 10¹ 100x4 400x10 CFU/µl
2 10¯² 10² 80x4 320x10² CFU/µl
3 10¯³ 10³ 67x4 260x10³ CFU/µl
4 10¯⁴ 10⁴ 45x4 180x10⁴ CFU/µl
5 10¯⁵ 10⁵ 32x4 128x10⁵ CFU/µl
Fig. 1. Experimental study of nitrate bioremoval by selective bacterial strains from Eutrophic Lake after
24 hrs (EW1, EW2, RN1 and Control)
EW1 Control
1
EW2 RN1

Usharani, K. et al.
60
Fig. 2. (a) Growth of selective bacterial strain (Bacillus sp) on Nutrient agar with nitrate and (b) gram
staining microscopic observation at 40X
Detection of nitrate removal
Bacterial growth using UV-visible spectrophotometr Figure 3 demonstrates the growth of three
strains in 500 ppm. Compared to the
control solution, the samples showed a
large increase in their growth. The figure
also includes the growth curve of three
different bacterial strains in 500ppm nitrate
concentration, showing the different phases
(Log phase, Stationary phase) to be seen in
the bacterial growth curve. The growth was
studied by monitoring the optical density
for a period of 432 hrs, during which time
an increase was observed in the growth rate
for EW1, EW2, and RN1 (accounting to
0.072-0.1074, 0.1245-0.1132, and 0.1811-
0.1011 respectively). During 192 hours of
incubation, the maximum rates proved to
be 0.1671 OD for EW1, 0.1843 OD for
EW2, and 0.1985 OD for RN1. The culture
reached stationary phase during 192 hrs of
incubation and began its decline phase
during 432 hrs of incubation.
Fig. 3. Time course of growth for bacterial strains cultured in nitrate solution at 500 ppm
Pollution, 3(1): 55-67, Winter 2017
61
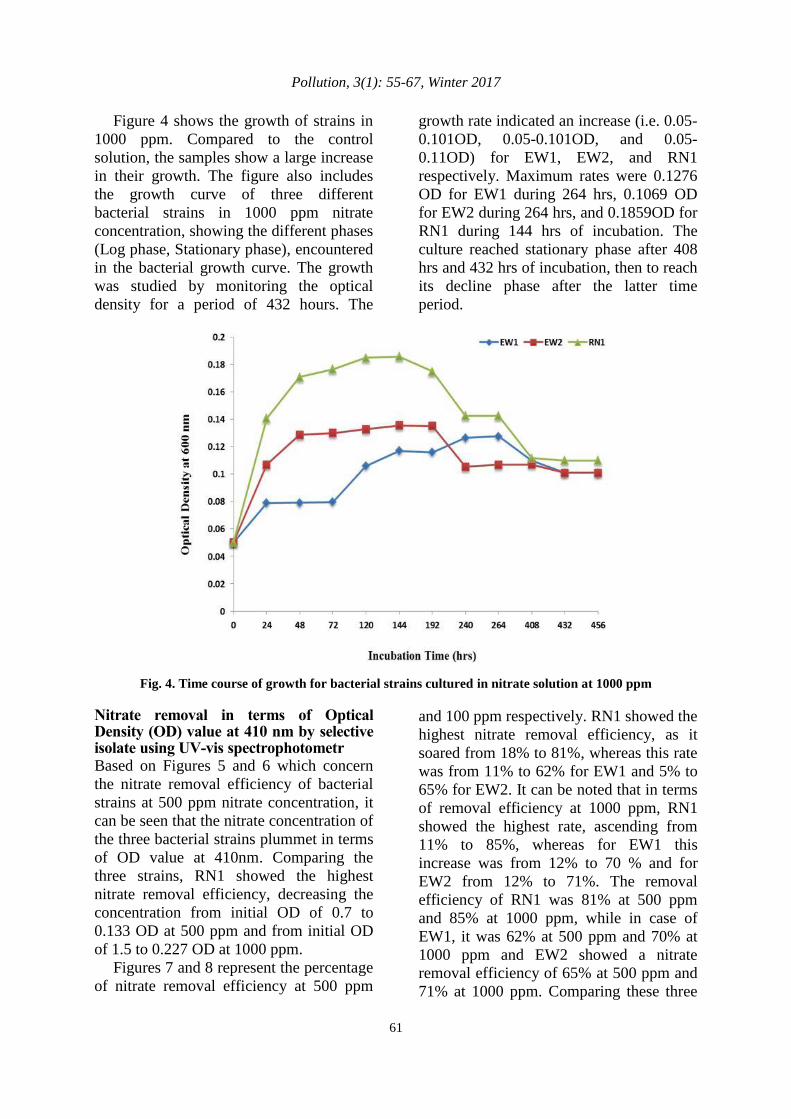
Figure 4 shows the growth of strains in
1000 ppm. Compared to the control
solution, the samples show a large increase
in their growth. The figure also includes
the growth curve of three different
bacterial strains in 1000 ppm nitrate
concentration, showing the different phases
(Log phase, Stationary phase), encountered
in the bacterial growth curve. The growth
was studied by monitoring the optical
density for a period of 432 hours. The
growth rate indicated an increase (i.e. 0.05-
0.101OD, 0.05-0.101OD, and 0.05-
0.11OD) for EW1, EW2, and RN1
respectively. Maximum rates were 0.1276
OD for EW1 during 264 hrs, 0.1069 OD
for EW2 during 264 hrs, and 0.1859OD for
RN1 during 144 hrs of incubation. The
culture reached stationary phase after 408
hrs and 432 hrs of incubation, then to reach
its decline phase after the latter time
period.
Fig. 4. Time course of growth for bacterial strains cultured in nitrate solution at 1000 ppm
Nitrate removal in terms of Optical Density (OD) value at 410 nm by selective isolate using UV-vis spectrophotometr Based on Figures 5 and 6 which concern
the nitrate removal efficiency of bacterial
strains at 500 ppm nitrate concentration, it
can be seen that the nitrate concentration of
the three bacterial strains plummet in terms
of OD value at 410nm. Comparing the
three strains, RN1 showed the highest
nitrate removal efficiency, decreasing the
concentration from initial OD of 0.7 to
0.133 OD at 500 ppm and from initial OD
of 1.5 to 0.227 OD at 1000 ppm.
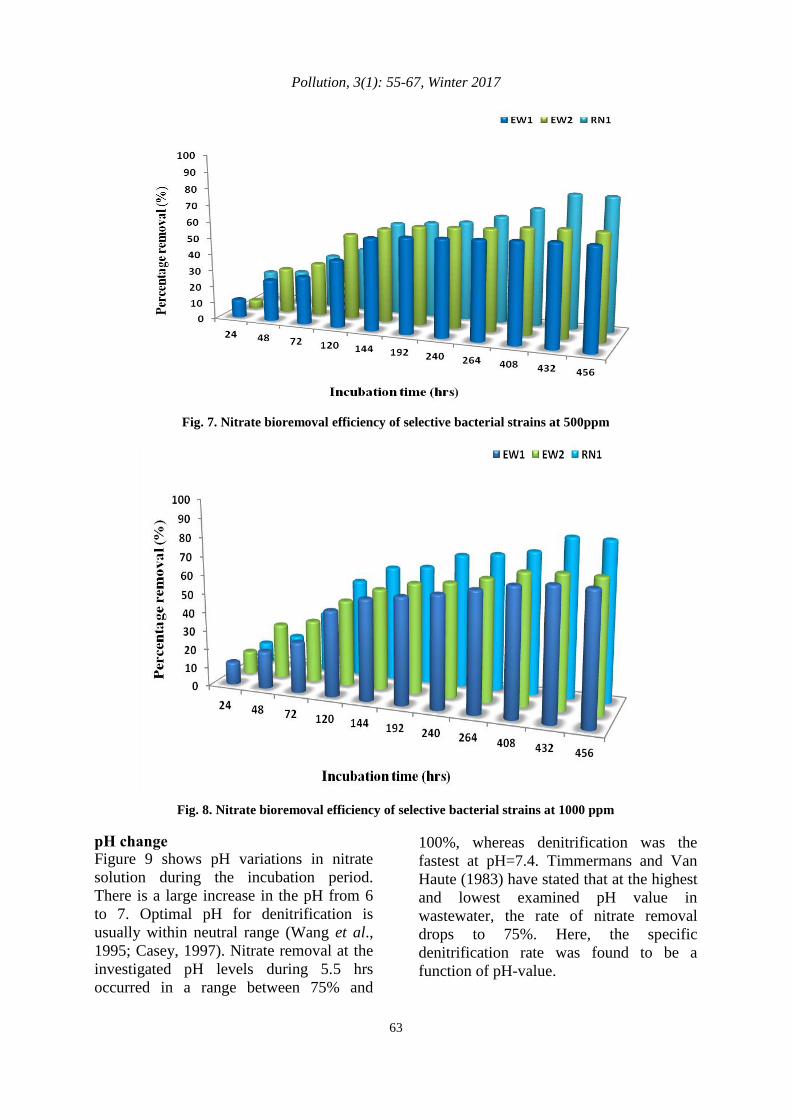
Figures 7 and 8 represent the percentage
of nitrate removal efficiency at 500 ppm
and 100 ppm respectively. RN1 showed the
highest nitrate removal efficiency, as it
soared from 18% to 81%, whereas this rate
was from 11% to 62% for EW1 and 5% to
65% for EW2. It can be noted that in terms
of removal efficiency at 1000 ppm, RN1
showed the highest rate, ascending from
11% to 85%, whereas for EW1 this
increase was from 12% to 70 % and for
EW2 from 12% to 71%. The removal
efficiency of RN1 was 81% at 500 ppm
and 85% at 1000 ppm, while in case of
EW1, it was 62% at 500 ppm and 70% at
1000 ppm and EW2 showed a nitrate
removal efficiency of 65% at 500 ppm and
71% at 1000 ppm. Comparing these three

Usharani, K. et al.
62
bacterial strains, RN1 showed the highest
nitrate removal efficiency in both 500 and
1000 ppm. These strains showed optimal
growth at 37°C, pH=7, agitation of 121
rpm, and time period of 432 hrs. Nair et al.
(2007) reported that the rate of nitrate
removal was due to the two enzymes of
nitrate reductase (NaR) and nitrite
reductase (NiR). This, as a result, gives an
insight to understanding the metabolic
activity during the whole process of
denitrification by the isolate, which was
not complete with the nitrate and nitrite
degradation profiles.
Fig. 5. Nitrate bioremoval of bacterial strains at 500ppm nitrate
Fig. 6. Nitrate bioremoval of bacterial strains at 1000ppm nitrate
Pollution, 3(1): 55-67, Winter 2017
63
Fig. 7. Nitrate bioremoval efficiency of selective bacterial strains at 500ppm
Fig. 8. Nitrate bioremoval efficiency of selective bacterial strains at 1000 ppm
pH change Figure 9 shows pH variations in nitrate
solution during the incubation period.
There is a large increase in the pH from 6
to 7. Optimal pH for denitrification is
usually within neutral range (Wang et al.,
1995; Casey, 1997). Nitrate removal at the
investigated pH levels during 5.5 hrs
occurred in a range between 75% and
100%, whereas denitrification was the
fastest at pH=7.4. Timmermans and Van
Haute (1983) have stated that at the highest
and lowest examined pH value in
wastewater, the rate of nitrate removal
drops to 75%. Here, the specific
denitrification rate was found to be a
function of pH-value.
Usharani, K. et al.
64
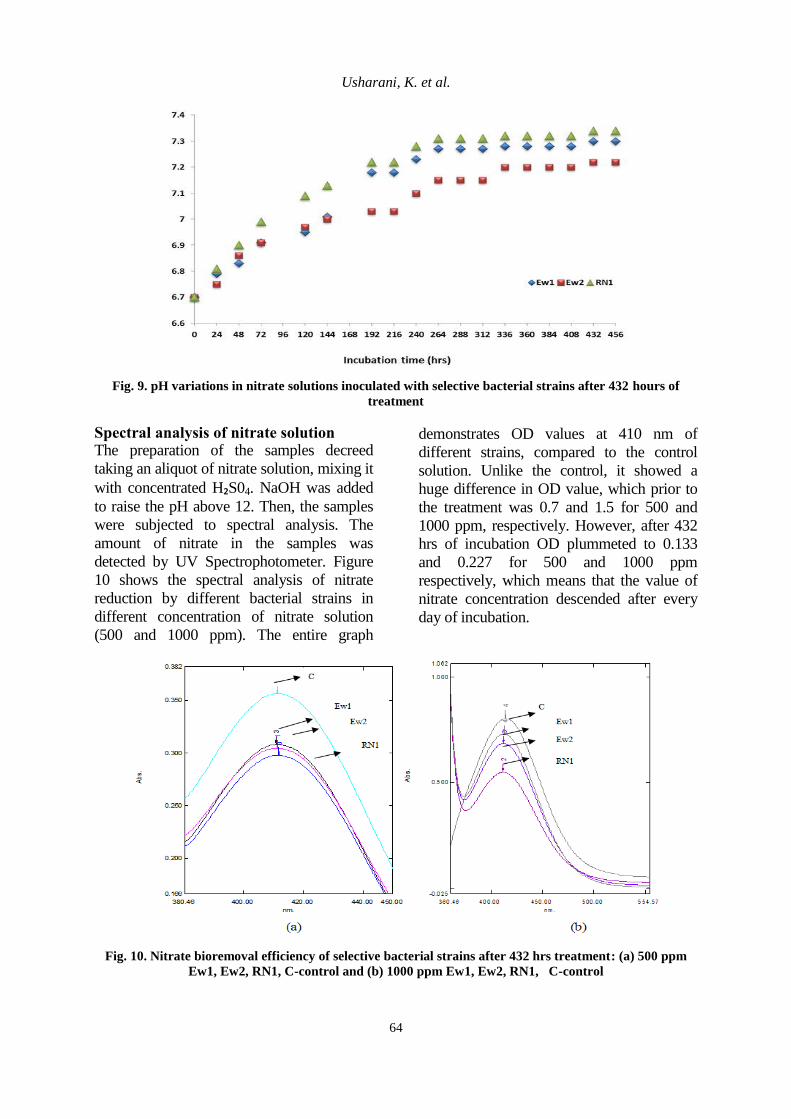
Fig. 9. pH variations in nitrate solutions inoculated with selective bacterial strains after 432 hours of
treatment
Spectral analysis of nitrate solution The preparation of the samples decreed
taking an aliquot of nitrate solution, mixing it
with concentrated H₂S04. NaOH was added
to raise the pH above 12. Then, the samples
were subjected to spectral analysis. The
amount of nitrate in the samples was
detected by UV Spectrophotometer. Figure
10 shows the spectral analysis of nitrate
reduction by different bacterial strains in
different concentration of nitrate solution
(500 and 1000 ppm). The entire graph
demonstrates OD values at 410 nm of
different strains, compared to the control
solution. Unlike the control, it showed a
huge difference in OD value, which prior to
the treatment was 0.7 and 1.5 for 500 and
1000 ppm, respectively. However, after 432
hrs of incubation OD plummeted to 0.133
and 0.227 for 500 and 1000 ppm
respectively, which means that the value of
nitrate concentration descended after every
day of incubation.
Fig. 10. Nitrate bioremoval efficiency of selective bacterial strains after 432 hrs treatment: (a) 500 ppm
Ew1, Ew2, RN1, C-control and (b) 1000 ppm Ew1, Ew2, RN1, C-control
Pollution, 3(1): 55-67, Winter 2017
65
Morphology and biochemical characterization In this study, samples were collected from
Eutrophic Lake. From the collected
samples, the isolates of the bacterial strain,
showing good growth in nitrate medium,
were then selected. They got cultured in
media 1 and 2. Morphology and
biochemical studies proved to be positive.
The nitrate removal study from the three
selective bacterial strains showed that the
bacterial strain, RN1, was a potential one.
It was identified taxonomically, using
morphological and biochemical tests
(Table 3). The colony morphology of the
selected potential bacterial strain, namely
RN1, was white in colour and irregular in
shape. It was found to be gram positive
with rod shaped bacterium (Fig. 2).
The optimum growth of RN1 and RN10
took place in 0.1985OD in 500 ppm
and.1859 OD in 1000 ppm at an optimum
temperature (37°C), pH (7), and agitation
(121 rpm) after 432 hrs of the treatment
period. Both the nitrate removal efficiency
and the OD value were decreased during
the first hour (the 0th
one) to 432 hrs. The
spectrophotometric analysis for nitrate
removal showed that RN1 enjoyed an 81%
removal efficiency at 500 ppm and an 85%
one at 1000 ppm.
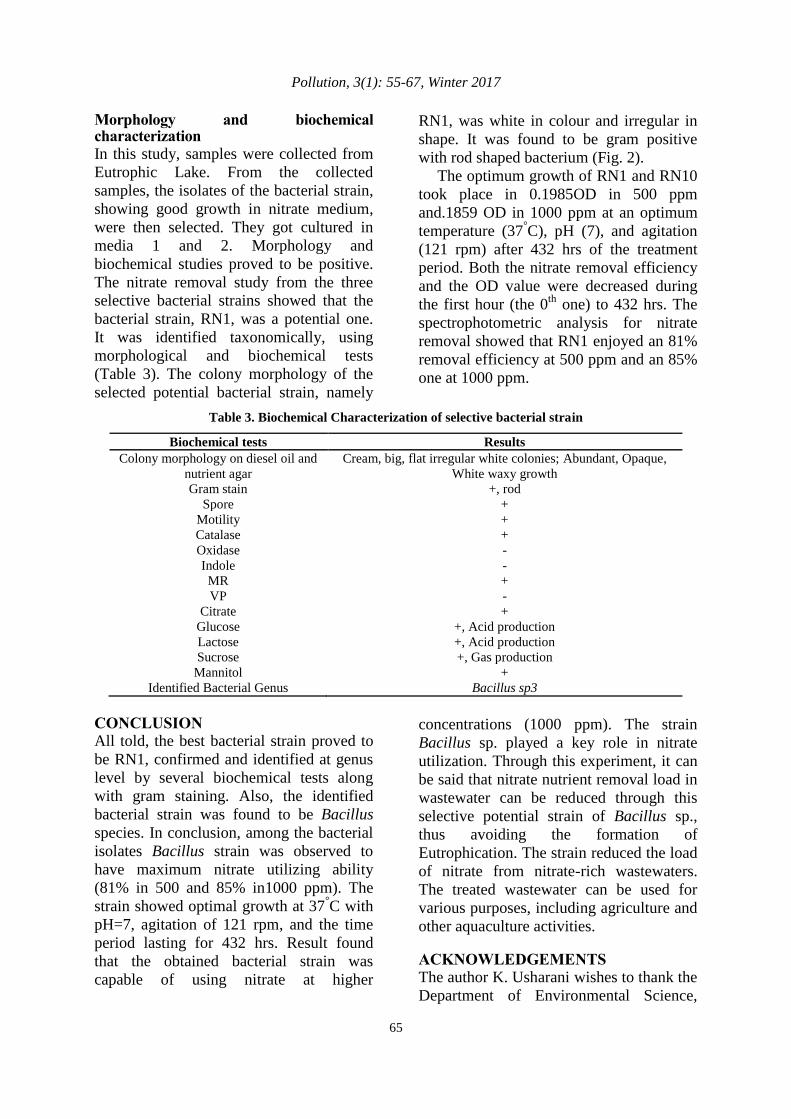
Table 3. Biochemical Characterization of selective bacterial strain
Biochemical tests Results
Colony morphology on diesel oil and
nutrient agar
Cream, big, flat irregular white colonies; Abundant, Opaque,
White waxy growth
Gram stain +, rod
Spore +
Motility +
Catalase +
Oxidase -
Indole -
MR +
VP -
Citrate +
Glucose +, Acid production
Lactose +, Acid production
Sucrose +, Gas production
Mannitol +
Identified Bacterial Genus Bacillus sp3
CONCLUSION All told, the best bacterial strain proved to
be RN1, confirmed and identified at genus
level by several biochemical tests along
with gram staining. Also, the identified
bacterial strain was found to be Bacillus
species. In conclusion, among the bacterial
isolates Bacillus strain was observed to
have maximum nitrate utilizing ability
(81% in 500 and 85% in1000 ppm). The
strain showed optimal growth at 37°C with
pH=7, agitation of 121 rpm, and the time
period lasting for 432 hrs. Result found
that the obtained bacterial strain was
capable of using nitrate at higher
concentrations (1000 ppm). The strain
Bacillus sp. played a key role in nitrate
utilization. Through this experiment, it can
be said that nitrate nutrient removal load in
wastewater can be reduced through this
selective potential strain of Bacillus sp.,
thus avoiding the formation of
Eutrophication. The strain reduced the load
of nitrate from nitrate-rich wastewaters.
The treated wastewater can be used for
various purposes, including agriculture and
other aquaculture activities.
ACKNOWLEDGEMENTS The author K. Usharani wishes to thank the
Department of Environmental Science,

Usharani, K. et al.
66
Central University of Kerala and
Bharathiar University, South India. He also
wishes to extend her sincere gratitude to
editor and reviewers.
Conflict of interest The authors declare that there are no
conflicts of interests regarding the
publication of this manuscript.
REFERENCE Abe, K., Imamaki, A. and Hirano, M. (2002).
Removal of nitrate, nitrite, ammonium and
phosphate ions from water by the aerial microalga
Trentepohlia aurea. J. Appl. Phycol., 14, 129–134.
APHA (1998). American Public Health
Association, American Water Works Association,
Water Environment Federation. Standard
Methods for the Examination of Water and
Wastewater.
Archna, Sharma, S. K. and Sobti, R.C. (2012).
Nitrate Removal from Ground Water: A Review. E-
J. Chem., 9, 1667–1675.
Bae, B.U., Jung, Y.H., Han, W.W. and Shin, H.S.
(2002). Improved brine recycling during nitrate
removal using ion exchange. Water Res., 36, 3330-
3340.
Barber, W.P. and Stuckey, D.C. (2000). Nitrogen
removal in a modified anaerobic baffled reactor
(ABR): 1, Denitrification. Water Res., 34, 2413–
2422.
Bogardi, I. and Kuzelka, R.D. (1991). Nitrate
Contamination: Exposure consequence and control.
Springer, Berlin.
Bougard, D., Bernet, N., Chèneby, D. and
Delgenès, J.P. (2006). Nitrification of a High-
Strength Wastewater in an Inverse Turbulent Bed
Reactor: Effect of temperature on nitrite
accumulation. Process Biochem., 41(1), 106-113.
Cengeloglu, Y., Tor, A., Ersoz, M. and Arslan, G.
(2006). Removal of nitrate from aqueous solution by
using red mud. Sep. Purif. Technol., 51, 374– 378.
Chatterjee, S. and Woo, S.H. (2009). The removal
of nitrate from aqueous solutions by chitosan
hydrogel beads. J. Hazard. Mater., 164, 1012-1018.
Chatterjee S., Lee, D.S., Lee, M.W. and Woo, S.H.
(2009). Nitrate removal from aqueous solutions by
cross-linked chitosan beads conditioned with sodium
bisulfate. J. Hazard. Mater. 166(1), 508-513.
Chiban, M., Soudani, A. and Sinan F. (2012).
Removal of nitrate ions by using low-cost adsorbents:
Equilibrium isotherm, kinetics and thermodynamic
study. Nova Science Publishers. 31-48.
Elmidaoui, A., Elhannouni, F., Sahli, M.A.M.,
Chay, L., Elabbassi, H., Hafsi, M. and Largeteau,
D. (2001). Desalination 136, 325.
Focht, D.D and Chang, A.C. (1975). Nitrification
and denitrification process related to waste water
treatment. Adv. Appl. Microbiol., 19, 153-186.
Forman, D. (1991). Nitrate exposure and human
cancer. In: Bogardi, I., Kuzelka, R. (Eds.), Nitrate
Contamination, RD NATO ASI Series,vol. G 30.
Springer-Verlag.
Glass, C. and Silverstein, J. (1999). Denitrification
of high nitrate, high salinity wastewater. Water
Resour., 33, 223-229.
Glass, C. and Silverstein, J. (1998). Denitrification
kinetics of high nitrate concentration water: pH
effect on inhibition and nitrite accumulation. Water
Resour., 32, 831-839.
Health Canada. Canadian Perinatal Health Report
(2003). Ottawa: Minister of Public Works and
Government Services Canada.
Holt, J.G., Krieg, N.R., Sneath, P.H.A., Staley, J.T.
and Williams, S.T. (1994). Bergey’s Manual of
Determinative Systematic Bacteriology. Lippincott
Williams and Wilkins, A Wolters Kluwer
Company, Philadelphia.
Hu, H.Y., Goto, N.H. and Fujie, K. (2001). Effect
of pH on the reduction of nitrite by metallic iron.
Water Res., 35, 2789–2793.
Jorgensen, S.E. (2001). Water quality: The impact
of eutrophication. UN Environment Programme.
Lin, S.H. and Wu, C.L. (1996). Removal of
nitrogenous compounds from aqueous solution by
ozonation and ion exchange. Water Res., 30, 1851-
1857.
Mikuska, P., and Vecera, Z. (2003). Simultaneous
Determination of Nitrite and Nitrate in Water by
Chemiluminescent Flow-injection Analysis.
Analytica Chimica Acta., 495(1-2), 225-232.
Nair, R.R., Dhamole, P.B., Lele, S.S. and D’Souza,
S.F. (2007). Biological denitrification of high
strength nitrate waste using pre adapted denitrifying
sludge. Chemosphere. 67, 1612-1617.
Ozturk, N. and Bektas, T.E. (2004). Nitrate removal
from aqueous solution by adsorption onto various
materials. J. Hazard. Mater, 112, 155-162.
Peavy, H.S., Rowe, D.R. and Tchobanoglous, G.
(1985). Environmental Engineering, McGraw-Hill
Book Company, New York, 696.
Pollution, 3(1): 55-67, Winter 2017
Pollution is licensed under a "Creative Commons Attribution 4.0 International (CC-BY 4.0)"
67
Pontius, F.W. (1993). Nitrate and Cancer: Is there A
Link?. Journal AWWA., 85(4), 12-14.
Schipper, L.A., Barkle, G.F. and Vojvodic-
Vukovic, M. (2005). Maximum rates of nitrate
removal in a denitrification wall. J. Environ. Qual.,
34, 1270–1276.
Seidel, C., Gorman, C. and Werner, K. (2008). Nitrate
reduction by sulphur modified iron: pilot study results.
Presentation at the American Water Works
Association Inorganic Contaminants Workshop.
American Water Works Association, Denver,
Colorado.
Shoun, H. and Tanimoto, T. (1991). Denitrification
by the fungus Fusarium oxysporum and
involvement of cytochrome P-450 in the respiratory
nitrite reduction. J. Biol.Chem., 25, 1527-1536.
Shrimali, M. and Singh, K.P. (2001). New methods
of nitrate removal from water. Environ. Pollut., 112,
351-359.
Timmermans, P. and Van Haute, A. (1983).
Denitrification with methanol. Water Resour., 17,
1249-1255.
U.S. EPA (U.S. Environmental Protection Agency)
(1987). Nitrate/Nitrite: Health Advisory.
Washington, DC: Office of Drinking Water.
Viessman, Jr W. and Hammer, M.J. (2005). Water
supply and pollution control, seventh ed., Pearson
Prentice Hall, Upper Saddle River, NJ.
Wang, J.H., Baltzis, B.C. and Lewandowski, G.A.
(1995). Fundamental denitrification kinetic studies
with Pseudomonas denitrificans. Biotechnol.
Bioengg., 47, 26-41.
WHO (2007). Nitrate and nitrite in drinking-water.
Background document for development of WHO
Guidelines for Drinking-water Quality. World
Health Organization, Geneva
(WHO/SDE/WSH/07.01/16).
WHO, (1984). Drinking Water Quality Control in
Small Community Supplies. In : Guidelines for
Drinking Water Quality (vol 3), WHO, Geneva,
Switzerland.
Zumft, W.G. (1997). Cell biology and molecular
basis of denitrification. Microbiol. Mol. Biol. Rev.,
61, 533-616.
Top Related