


Languages
Pages
Legal


DETERMINANTS OF NUTRITIONAL STATUS IN CHILDREN UNDER 5 YEARS
IN INDIA: A MULTILEVEL APPROACH
by
PRIYANKA CHAKRABORTY
(Under the Direction of Alex K. Anderson)
ABSTRACT
Children aged below 5 years in India are amongst the most affected with
poor nutritional status in the developing world. This dissertation examines different
nutritional outcomes of children in India and their associated risk factors. This is a
secondary data analysis using data from the National Health and Family Survey (NFHS)
collected during 1992-2006. The three areas examined are 1) pregnancy outcome (birth
weight and birth size of children) and related determinants, 2) determinants of
undernutrition (stunting, underweight, wasting and anemia), and 3) determinants of
childhood overweight. Significant regional, urban/rural and socio-economic disparity
existed with respect to the outcomes studied. Maternal education and employment were
important predictors of the overall nutritional status of children in the study. Other
predictors were maternal autonomy, presence of grandparents in the household and
dietary practices that significantly increased or decreased the risks of poor birth outcome
and undernutrition in the children. For instance, low maternal autonomy increased the
risks of poor pregnancy outcome with respect to birth weight and birth size of the child.
Presence of grandparents in the household and intake of diet of good quality were

important factors that decreased the risks of undernutrition in children. On the other hand,
urban children and those from affluent households had the maximum risk of being
overweight. Overall we observed higher prevalence of low birth weight and
undernutrition in children from rural areas and a higher prevalence of overweight among
urban children. This dissertation work identified both individual and household level risk
factors of under 5 nutritional outcomes, suggesting the need for intervention programs
targeting individuals and household as a means of overcoming these important public
health problems.
INDEX WORDS: Undernutrition, birth weight, maternal autonomy, overweight,
dietary intake, National Health and Family Survey

DETERMINANTS OF NUTRITIONAL STATUS IN CHILDREN UNDER 5 YEARS
IN INDIA: A MULTILEVEL APPROACH
by
PRIYANKA CHAKRABORTY
FORB University of Calcutta, India, 2001
MS, University of Calcutta, India, 2002
A Dissertation Submitted to the Graduate Faculty of The University of Georgia in Partial
Fulfillment of the Requirements for the Degree
DOCTOR OF PHILOSOPHY
ATHENS, GEORGIA
2011

© 2011
Priyanka Chakraborty
All Rights Reserved

DETERMINANTS OF NUTRITIONAL STATUS IN CHILDREN UNDER 5 YEARS
IN INDIA: A MULTILEVEL APPROACH
by
PRIYANKA CHAKRABORTY
Major Professor: Alex K Anderson Committee: Gail Hanula Woncheol Jang Mary Ann Johnson Richard Lewis Electronic Version Approved: Maureen Grasso Dean of the Graduate School The University of Georgia December 2011

DEDICATION
I would like to dedicate this work to my parents, Partha Sarathi and Kamal
Ghosh Roy and my brother Prithwiraj Ghosh Roy for their unconditional love, support
and trust in my decision to pursue a higher degree. This journey would have been
impossible without your love and faith in my potentials. I have been blessed to have you
as my family. Thank you so much for believing in me and standing by me. I would also
like to dedicate this achievement to my sister Koyeli Khan (Papan) and sister-in-law
Andrea Pinto Ghosh Roy (Andy) who have always been pillars of strength during the last
four years. Papan and Andy, words cannot express how thankful I am to both of you. You
have always succeeded to bring a smile to my face and keep me going during the
toughest of times. I love you all very much and thank you for everything!
iv

ACKNOWLEDGEMENTS
I would like to express my gratitude to Dr. Alex Anderson for his constant
guidance and support throughout the course of my dissertation. You have been an
excellent mentor and words cannot express how much I have learnt from you. A special
thanks to Dr. Mary Ann Johnson for her words of encouragement and support. Thank you
to my other committee members Drs. Gail Hanula, Richard Lewis and Woncheol Jang for
your assistance in helping me with my dissertation.
Thank you to all my friends and fellow lab mates, especially Chandana Mitra,
Ujwal Bagal, Arpan Sharma, Biswajit Bandyopadhyay, Sanjeev Kumar and Johane
Filemon for your love, support and constant encouragement. I could not have completed
this dissertation without you.
I am extremely grateful to the families of Ruth Rowan Morrison and Glenn and
Helen Burton, and the Department of Foods and Nutrition, The University of Georgia for
financially supporting me for the past three years and making it possible for me to
continue with this degree. Thank you all.
v
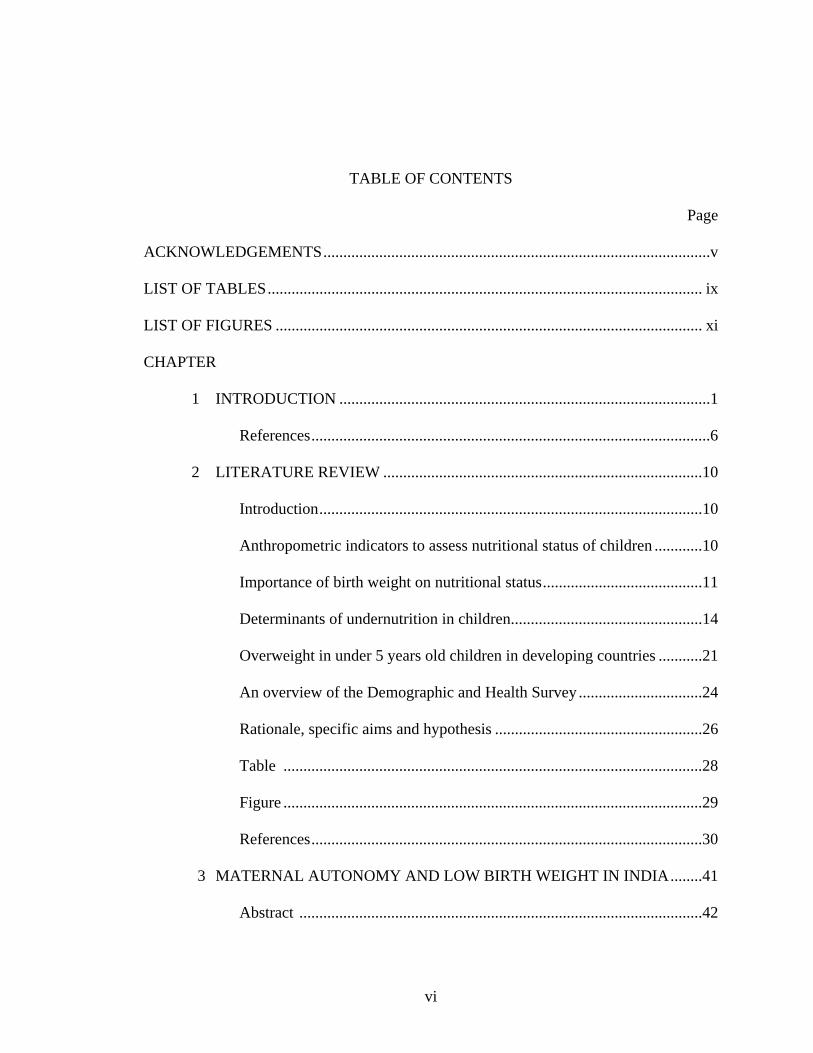
TABLE OF CONTENTS
Page
ACKNOWLEDGEMENTS.................................................................................................v
LIST OF TABLES............................................................................................................. ix
LIST OF FIGURES ........................................................................................................... xi
CHAPTER
1 INTRODUCTION .............................................................................................1
References....................................................................................................6
2 LITERATURE REVIEW ................................................................................10
Introduction................................................................................................10
Anthropometric indicators to assess nutritional status of children ............10
Importance of birth weight on nutritional status........................................11
Determinants of undernutrition in children................................................14
Overweight in under 5 years old children in developing countries ...........21
An overview of the Demographic and Health Survey ...............................24
Rationale, specific aims and hypothesis ....................................................26
Table .........................................................................................................28
Figure .........................................................................................................29
References..................................................................................................30
3 MATERNAL AUTONOMY AND LOW BIRTH WEIGHT IN INDIA........41
Abstract .....................................................................................................42
vi

Introduction ...............................................................................................43
Methods .....................................................................................................45
Results........................................................................................................49
Discussion..................................................................................................53
References .................................................................................................59
Tables.........................................................................................................64
Figures........................................................................................................74
4 HOUSEHOLD AND INDIVIDUAL FACTORS ASSOCIATED WITH
UNDERNUTRITION OF CHILDREN < 3 YEARS FROM INDIA..............78
Abstract ......................................................................................................79
Introduction................................................................................................81
Methods .....................................................................................................84
Results........................................................................................................88
Discussion..................................................................................................98
References ...............................................................................................109
Tables.......................................................................................................117
Figures......................................................................................................138
5 PREDICTORS OF OVERWEIGHT IN CHILDREN UNDER 5 YEARS IN
INDIA .....................................................................................................145
Abstract ....................................................................................................146
Introduction..............................................................................................147
Methods ...................................................................................................148
Results......................................................................................................151
vii
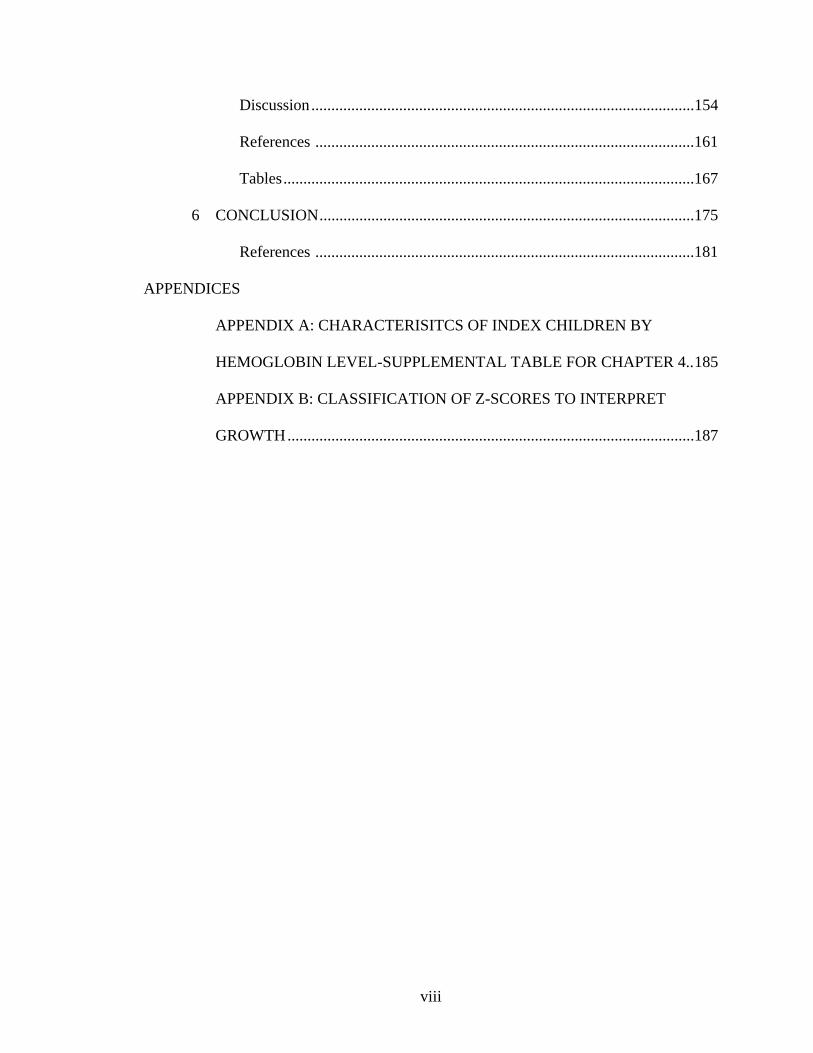
Discussion................................................................................................154
References ...............................................................................................161
Tables.......................................................................................................167
6 CONCLUSION..............................................................................................175
References ...............................................................................................181
APPENDICES
APPENDIX A: CHARACTERISITCS OF INDEX CHILDREN BY
HEMOGLOBIN LEVEL-SUPPLEMENTAL TABLE FOR CHAPTER 4..185
APPENDIX B: CLASSIFICATION OF Z-SCORES TO INTERPRET
GROWTH......................................................................................................187
viii
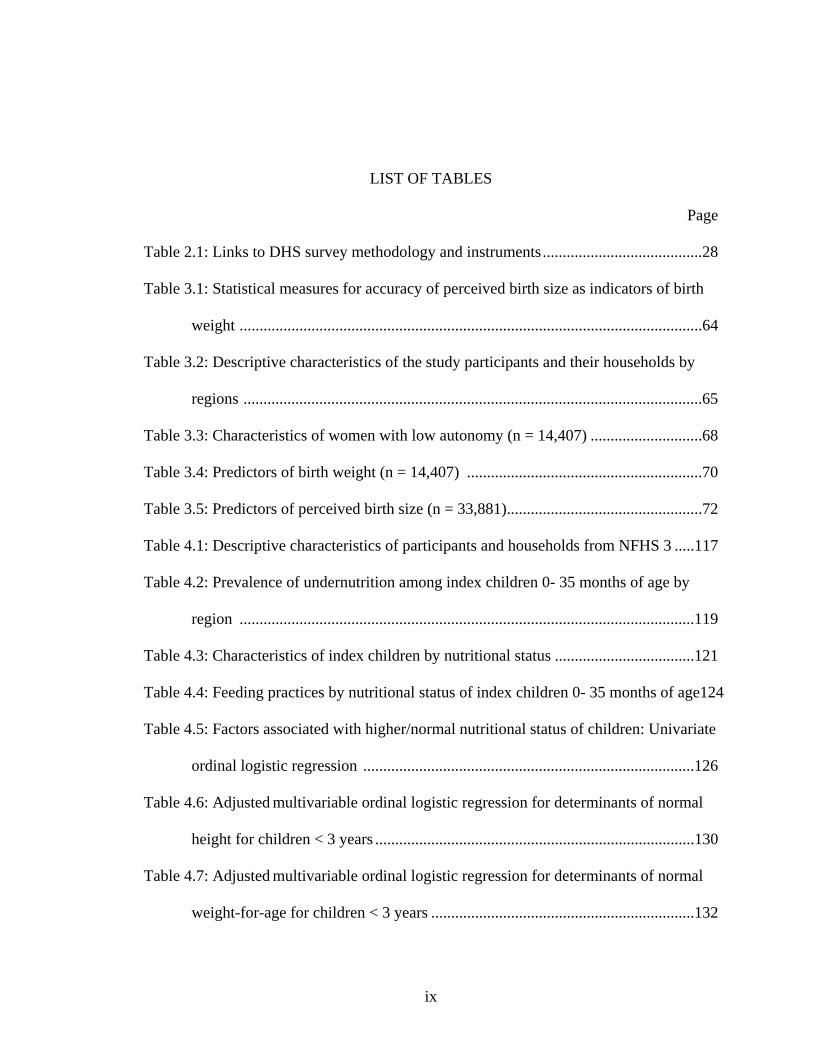
LIST OF TABLES
Page
Table 2.1: Links to DHS survey methodology and instruments........................................28
Table 3.1: Statistical measures for accuracy of perceived birth size as indicators of birth
weight ....................................................................................................................64
Table 3.2: Descriptive characteristics of the study participants and their households by
regions ...................................................................................................................65
Table 3.3: Characteristics of women with low autonomy (n = 14,407) ............................68
Table 3.4: Predictors of birth weight (n = 14,407) ...........................................................70
Table 3.5: Predictors of perceived birth size (n = 33,881).................................................72
Table 4.1: Descriptive characteristics of participants and households from NFHS 3 .....117
Table 4.2: Prevalence of undernutrition among index children 0- 35 months of age by
region ..................................................................................................................119
Table 4.3: Characteristics of index children by nutritional status ...................................121
Table 4.4: Feeding practices by nutritional status of index children 0- 35 months of age124
Table 4.5: Factors associated with higher/normal nutritional status of children: Univariate
ordinal logistic regression ...................................................................................126
Table 4.6: Adjusted multivariable ordinal logistic regression for determinants of normal
height for children < 3 years ................................................................................130
Table 4.7: Adjusted multivariable ordinal logistic regression for determinants of normal
weight-for-age for children < 3 years ..................................................................132
ix

Table 4.8: Adjusted multivariable ordinal logistic regression for determinants of normal
weight-for-height for children < 3 years..............................................................134
Table 4.9: Adjusted multivariable ordinal logistic regression for determinants of normal
hemoglobin level for children < 3 years ..............................................................136
Table 5.1: Socio-demographic characteristics of women in NFHS 3 (2005-2006) by
region of residence...............................................................................................167
Table 5.2: Characteristics of normal weight vs. overweight children in NFHS 3 (2005-
2006); (N = 23,814). ............................................................................................169
Table 5.3: Predictors of childhood overweight: Univariate logistic regression...............171
Table 5.4: Logistic regression models of independent predictors of childhood overweight
..................................................................................................................173
x

xi
LIST OF FIGURES
Page
Figure 2.1: Conceptual framework for examining the factors influencing nutritional status
of children < 5 years in India .................................................................................29
Figure 3.1 a: Maternal autonomy by socio-demographic characteristics ..........................74
Figure 3.1 b: Maternal autonomy by household characteristics ........................................75
Figure 3.2 a: Prevalence of pregnancy outcome by region................................................76
Figure 3.2 b: Prevalence of pregnancy outcome by urban and rural areas ........................77
Figure 4.1: Trend of child undernutrition prevalence over the years 1992- 2006 ...........138
Figure 4.2 a: Mean HAZ score by place of residence......................................................139
Figure 4.2 b: Mean WAZ score by place of residence ....................................................140
Figure 4.2 c: Mean WHZ score by place of residence.....................................................141
Figure 4.2 d: Mean hemoglobin level by place of residence ...........................................142
Figure 4.3: Hemoglobin status of children < 3 years by dietary practices .....................143
Figure 4.4: Nutritional status of children < 3 by immunization status ............................144

1
CHAPTER 1
INTRODUCTION
Nutritional status of a population is a prominent reflection of a nation’s
economic development and public welfare policies. Adequate growth and nutritional
status of children are monitored by the use of anthropometric measurements, specifically
height and weight, which in combination with the age of the child forms the
anthropometric indices (1). These are further classified as weight-for-age, length/height-
for-age, weight-for-length/height and BMI-for-age and can be interpreted using the z-
score classification system (1, 2). Thus a child with weight-for-age (WAZ) or weight-for-
height (WHZ) less than -2.0 standard deviation (SD) is classified as being underweight or
wasted respectively. Similarly a height-for-age (HAZ) < -2.0 SD indicates stunting or
chronic under nutrition. On the other hand, a BMI-for-age (BAZ) less than -2.0 SD and
greater than 2.0 SD indicates underweight and overweight respectively. Apart from the
use of anthropometric measurements, the nutritional status of a child is also reflected by
the hemoglobin level, which indicates the presence or absence of iron-deficiency anemia
(3).
Malnutrition in its several forms of under nutrition, namely wasting, stunting and
underweight has been coined as the “silent emergency” by the United Nations Children's
Fund (UNICEF). It has been associated with endangering women and children across the
world (4). To address the issue of child hunger and under nutrition, one of the primary
objectives of the Millennium Development Goals (MDG) has been to improve the

2
nutritional status of children worldwide (5). Almost 23.0% of children < 5 years from
developing countries were identified to be moderately or severely underweight, while
28.0% were stunted, during 2000-2007 (6). The worst afflicted areas of under nutrition
are South Asian countries where the prevalence of underweight (15.0%) and stunting
(46.0%) exceeds those observed in other developing countries (6), with the highest
prevalence observed in India (16.0% and 48.0% respectively) (5). At the same time it has
been estimated that nearly 47% of preschool children worldwide are afflicted with
anemia, with the highest prevalence in Africa (67%) and South Asia (65.5%) (3). In
India, while the prevalence of stunted children < 3 years have notably declined from
45.5% in 1998-99 to 38.4% in 2005-06, the prevalence of LBW, underweight and
anemia remains astonishingly high at 30.0%, 43.0% and 79.0% respectively (6,7).
One of the main causes of child mortality worldwide is attributed to under
nutrition (6), and is estimated to cause at least 55.0% of all child deaths (8). A study of 10
cohorts from developing countries reported a significant increased risk (RR: 4.24; 95%
CI: 3.13- 5.53) of overall child mortality associated with underweight (weight-for-age: -
2.0 to -3.0 SDs) (9). Moreover, the same study reported a significant association of
disease prevalence in children with weight-for-age < -1.0 SD, which followed a linear
trend with increasing degrees of underweight. For instance, the relative risk of suffering
from diarrhea increased from 5.39 (95% CI: 3.73 to 7.79) to 12.50 (95% CI: 7.19 to
21.73) for moderately underweight and severely underweight children respectively. The
study also reported similar observations for other common childhood illnesses, namely
pneumonia, malaria and measles (9). Deshmukh et al. (2009) detected iron-deficiency
anemia in nearly 80.0% of children < 3 years living in the Wardha district of Central

3
India. While the overall prevalence of acute morbidity, i.e. fever, acute respiratory
infections and diarrhea was almost 60.0%, children suffering from severe anemia were 9
times at risk of being morbid, compared to non-anemic children (10). These findings
therefore indicate the significant association of poor nutritional status with childhood
morbidity and mortality.
Adding to the crisis of undernutrition in children from the developing world is the
high prevalence of low birth weight (<2.5 kg), that increases the infant mortality and
morbidity rates (11). Low birth weight (LBW) is not only associated with neonatal and
infant mortality and morbidity, but is an important determinant of growth retardation in
children and development of chronic diseases such as diabetes mellitus, cardiovascular
diseases and hypertension (11) in adults. Studies examining the determinants of LBW
have identified maternal demography and nutritional status to be important predictors
(12). Few studies have also considered the impact of prenatal care use on the incidence of
LBW (12-14). Since maternal characteristics are linked to household and community
factors which are further associated with the incidence of LBW, further examination of
these factors are needed to understand their influence on pregnancy outcome in the Indian
context. Additionally, status of women in the household have been closely related to the
use of prenatal care (15) and nutritional status of the child (16), but studies documenting
the impact of this factor on birth outcome are lacking.
Although the performance of developing countries with respect to child health
and nutrition has been slow, there have been rapid economic growth and industrialization.
Several economic reforms in the past decade have contributed to the remarkable
economic growth in South Asia (17). Similarly, India too witnessed an overall economic
4
expansion and a rise in annual Gross Domestic Product (GDP) from 4.0% in 2000 to
9.0% in 2007 (18). Along with economic accretion was the increased consumption of
high saturated fat, refined carbohydrate and animal products, coupled with decreased
consumption of fiber and physical activity patterns, culminating in increased risks of
overweight/obesity (19). Several studies have reflected the growing incidence of
overweight/obesity and related chronic diseases in adults and children from the
developing world (20-21). It is thus paradoxical that developing countries are plagued by
the double burden of under and over nutrition related health problems. While a major
portion of the population (children and women) is still afflicted with the different
manifestations of under nutrition, a large section of the population living in urban areas
suffers from overweight and obesity (22, 23). Thus, in the light of the current scenario of
health and nutrition in developing countries the gravity of the issue has been well
established and thus needs to be studied further.
Several studies indicate that India is experiencing a paradigm shift in nutrition,
specifically in urban areas (21, 24, 25). Griffith and Bentley (2005) evaluated the
prevalence of overweight among urban women from the state of Karnataka, South India,
showing the growing burden of the problem (26). While recent studies documented the
prevalence of overweight and obesity among children < 5 years in India (27, 28), regional
comparative studies on overweight prevalence and its determinants are lacking.
This dissertation project therefore examines the different factors influencing the
nutritional status of children < 5 years in the context of birth outcome, undernutrition and
overweight status. Chapter 2 provides detailed review of the literature outlining the
different factors associated with pregnancy outcome and undernutrition status of children.
5
The nutrition transition in developing countries and prevalence of overweight in children
from these countries are also reviewed. Chapter 3 discusses the factors associated with
pregnancy outcome in Indian women. Chapter 4 describes the prevalence and
determinants of undernutrition in children aged 0-35 months in India, while chapter 5
discusses the determinants of overweight in Indian children aged < 5 years. The summary
of the major findings of this dissertation and future recommendations are discussed in
chapter 6.

6
References
1. Cogill B. Anthropometric indicators measurement guide. Food and Nutrition
Technical Assistance Project, Academy for Educational Development:
Washington, D.C. 2003.
2. de Onis M, Blössner M. WHO global database on child growth and
malnutrition.World Health Organization: Geneva. 1997.
3. Benoist B, McLean E, Egli I, Cogswell M. Worldwide prevalence of anemia
1993-2005: WHO global database on anemia. World Health Organization:
Geneva. 2008 [Available from:
http://whqlibdoc.who.int/publications/2008/9789241596657_eng.pdf]
4. United Nations Children’s Fund. State of the world’s children. Focus on nutrition
UNICEF: New York. 1998. [Available from: http://www.unicef.org/sowc98/]
5. United Nations Children's Fund. The State of the World's Children- Maternal and
new born health. UNICEF: New York. 2009. [Available from:
http://www.unicef.org/sowc09/docs/SOWC09-FullReport-EN.pdf]
6. United Nations Children’s Fund. The state of the world's children- Child survival.
UNICEF: New York. 2008. [Available from:
http://www.unicef.org/sowc08/docs/sowc08.pdf]
7. International Institute for Population Sciences (IIPS), 2005-2006 National Family
Health Survey (NFHS-3): National Fact Sheet India: Mumbai. 2007.
8. Pelletier DL, Frongillo Jr EA, Schroeder DG, Habicht JP. The effects of
malnutrition on child mortality in developing countries. Bull WHO. 1995;73:443-
8.

7
9. Caulfield LE, de Onis M, Blössner M, Black RE. Undernutrition as an underlying
cause of child deaths associated with diarrhea, pneumonia, malaria, and measles.
Am J Clin Nutr. 2004;80(1):193-198.
10. Deshmukh P, Dongre AR, Sinha N, Garg BS. Acute childhood morbidities in
rural Wardha : Some epidemiological correlates and health care seeking. Indian J
Med Sci 2009;63:345-54.
11. United Nations Children’s Fund and World Health Organization. Low
birthweight: Country, regional and global estimates. New York: 2004.
12. Kramer MS. Determinants of low birth weight: methodological assessment and
meta-analysis. Bulletin of the World Health Organization. 1987;65(5):663-737.
13. Alexander GR, Korenbrot CC. The role of prenatal care in preventing low birth
weight. The Future of Children. 1995;5(1):103-120.
15. Dhall K, Bagga R, Maternal determinants of birth weight of North Indian babies.
Indian J Pediatr. 1995;62(3):333-344.
16. Mistry R, Galal O, Lu M. Women's autonomy and pregnancy care in rural India:
A contextual analysis. Soc Sci Med. 2009;69(6):926-933.
17. Shroff M, Griffiths P, Adair L, Suchindran C, Bentley M. Maternal autonomy is
inversely related to child stunting in Andhra Pradesh, India. Matern Child Nutr.
2009;5(1):64-74.
18. Devarajan S, Nabi I. Economic growth in South Asia: Promising, un-equilizing,
sustainable? World Bank: Washington DC. 2006
19. World Bank. World Development Indicators database. 2008. [Available from:
http://data.worldbank.org/products/data-books/WDI-2008]

8
20. Popkin BM. The nutrition transition and obesity in the developing world. J Nutr.
2001; 131(3):871S-873.
21. Martorell R, Kettel Khan L, Hughes ML, Grummer-Strawn LM. Overweight and
obesity in preschool children from developing countries. Int J Obes Relat Metab
Disord. 2000;24(8): 959-967.
22. Martorell R, Kettel Khan L, Hughes ML, Grummer-Strawn LM. Obesity in
women from developing countries. Eur J Clin Nutr. 2000;54(3):247-252.
23. Armstrong J, Dorosty A, Reilly J, Emmett P. Coexistence of social inequalities in
undernutrition and obesity in preschool children: population based cross sectional
study. Arch Dis Child. 2003;88(8):671-675.
24. Eckhardt CL. Micronutrient malnutrition, obesity, and chronic disease in
countries undergoing the nutrition transition. International Food Policy Research
Institute. 2006.
25. Griffiths P, Bentley M. Women of higher socio-economic status are more likely
to be overweight in Karnataka, India. Eur J Clin Nutr. 2005;59(10):1217-1220.
26. Popkin BM. The Nutrition Transition in Low-Income Countries: An Emerging
Crisis. Nutr Rev. 1994; 52(9): 285-298.
27. Griffiths PL, Bentley M. The nutrition transition is underway in India.J Nutr.
2001;131(10).
28. Kaur S, Sachdev HP, Dwivedi SN, Lakshmy R, Kapil U. Prevalence of
overweight and obesity amongst school children in Delhi, India. Asia Pac J Clin
Nutr. 2008;17(4):592-6.

9
29. Wang Y, Chen HJ, Shaikh S, Mathur P. Is obesity becoming a public health
problem in India? Examine the shift from under- to overnutrition problems over
time. Obes Rev. 2009;10(4):456-74.
10
CHAPTER 2
LITERATURE REVIEW
Introduction
This section reviews previous research addressing the nutritional status of
children aged below 5 years and the various factors associated with it. The different areas
covered include the association between pregnancy outcome and nutritional status of
children, factors contributing to pregnancy outcome and the determinants of under and
over nutrition status of children from developing countries. In the context of India, there
is lack of information at the national and regional levels examining the factors associated
with the above mentioned areas (to the best of our knowledge). This information is
required to identify and address these issues for improving the health and overall
nutritional status of these children.
Anthropometric indicators to assess nutritional status of children
The following section reviews the indicators used to assess the nutritional status
of children less than 5 years. Anthropometric measurements are the most common tool
used to assess the nutritional status of a population and to monitor growth in children (1).
The anthropometric indices commonly used are weight-for-height, height-for-age and
weight-for-age expressed as percentiles or z-scores representing the overall nutritional
status of a child (1, 2). Wasting, stunting and underweight is identified by the weight-for-
height, height-for-age and weight-for-age < - 2.0 standard deviation (SD) respectively,
while weight-for-height and weight-for-age > 2.0 SD are also used to assess overweight
11
in children (2). For the purpose of this dissertation project, we used the z-scores for each
of these indicators.
The use of body mass index (BMI; weight/height2) has also been used to assess
overweight status in children 2 years and older with a cutoff > 95th percentile or 2.0 SD
(2). Longitudinal studies have indicated a significant correlation between childhood BMI
and adult adiposity (3). Moreover, comparison between BMI of Pima Indian children
with their adiposity (measured by the dual energy x-ray absorptiometry) revealed a strong
correlation with fat mass (r = 0.96–0.98; p < 0.0001) (4), thereby confirming the
appropriateness of using BMI as an anthropometric indicator in children.
Importance of birth weight on nutritional status
The nutritional status of children is known to be influenced by several factors, of
them birth weight is an important component. As defined by the World Health
Organization, birth weight is the first weight of the newborn obtained within the first
hour of life (5). A birth weight less than 2500 grams, is defined as low birth weight and is
an universally accepted classification (5).
The relationship between birth weight and nutritional status of children at the end
of their first year of life was investigated by Motta et al. (2005), who reported the
significant influence of low birth weight on the incidence of underweight among
children, compared to those who had birth weight above 2500 grams (6). More recent
studies confirmed the importance of birth weight as a determinant of a child’s nutritional
status (7, 8). A study conducted in Vietnam, to assess the nutritional status and factors
contributing to malnutrition in children less than five years of age also reported similar
findings (7). Of the 650 children included in the study, 31.8% were underweight, 44.3%

12
were stunted and 11.9% were wasted. Interestingly, children born low birth weight had
higher risks of being malnourished compared to their normal birth weight counterparts.
The odds ratio for underweight, stunting and wasting were as high as 7.7, 5.6 and 5.2
respectively in low birth weight children thereby indicating the negative impact of low
birth weight on future weight gain and linear growth pattern of a child. An increased risk
of malnutrition, specifically low stature and underweight were also observed to be
associated with low birth weight (RR = 1.6; 95%CI = 1.2-2.3) among children under 5
years in a longitudinal hospital based study in Brazil (8).
In addition to the influence of low birth weight on children’s nutritional status, a
growing body of evidence suggests its impact on health conditions and incidence of
chronic diseases such as cardiovascular disease, hypertension and diabetes mellitus in
adults (9- 11). Studies from the United Kingdom confirmed the association between low
birth weight and cardiovascular disease (12). Similar findings were reported in studies
conducted with the Asian-Indian population of South India. Among the 517 adult men
and women born in Mysore, India, low birth weight, short birth length and small head
circumference had significantly increased the risks of coronary heart disease (13).
Additionally, prevalence of heart disease decreased with increasing birth weight in this
study population thereby confirming the association between birth weight and incidence
of coronary heart disease. Increased prevalence of hypertension was also observed among
participants in the Nurses’ Health Study- I, where the age-adjusted odds ratio for
hypertension was 1.4 (95% CI = 1.3 - 1.5) in participants born low birth weight compared
to those of birth weight > 2.5 kg (5 lb) (10). These evidences therefore strengthen the
need to investigate the factors contributing to low birth weight and small birth size in

13
order to prevent its incidence and reduce the prevalence of both under nutrition and
chronic diseases.
Factors affecting pregnancy outcome: low- birth weight
Several studies have revealed that characteristics of women of child-bearing age
influence outcomes of pregnancy, that is it affects the weight and length of the infant at
birth. Maternal age less than 20 years and above 35 years has been associated with low
birth weight, premature delivery, and clinical complications during pregnancy and labor
leading to cesarean delivery (14). In addition to this, stressful working conditions during
pregnancy have been found to result in small for gestational age babies and preterm
delivery (15).
Literature suggests that mother’s health and nutritional status play an important
role on pregnancy outcome. Although maternal nutrition in developed population was
found to have little effect on birth weight (16), other studies have shown that maternal
nutrition depletion and inadequate nutrient reserve at the time of conception leads to
preterm birth and fetal growth retardation (17). A study conducted by Rao et al. in 2001
found a strong association between maternal nutrition and mean birth weight and length
of term infants in rural Indian women (18). Further evidence is provided through the
cross-sectional study by Carvalho Padilha et al that included 433 pregnant women in Rio
de Janeiro. Total gestational weight gain (β = 25.29; p = 0.000) and maternal nutritional
status assessed through pre-gestational BMI (β =13.02; p = 0.037) were significant
predictors of birth weight of the newborn (19).
Pregnancy outcome is also known to depend on the utilization of prenatal care.
Socio-economic difference is known to influence the utilization of health care services
14
and prenatal care by mothers (18). Roos and Mustard (1997) studied this factor in a
Canadian population having complete health care insurance. Their study revealed that
there was inadequate or poor utilization of prenatal care services by women with low
socio-economic status (SES), although the difference in birth weight was small when
analyzed against service utilization (20). Impact of SES on birth weight and pre-term
delivery was also seen in an urban city in Thailand (21).
Significant predictors of birth weight and birth size with respect to utilization of
prenatal care services are influenced by the woman’s status in the household and the
society (22- 24). Studies on the influence of women’s autonomy on utilization of prenatal
care services have demonstrated that women with greater autonomy had greater
utilization of prenatal care and safe delivery practices (22). Additionally, education and
employment status of the mother which have been previously identified as important
predictors of birth weight (25) have been shown to be significant determinants of
women’s autonomy (26). Currently it is not known if there is an association between
women’s autonomy and pregnancy outcome, specifically in India. This association is of
concern as the prevalence of low birth weight in India is rather high (30.0%) (27).
Determinants of undernutrition in children
Epidemiological studies conducted in developing countries have identified several
causes of undernutrition in children. The most prominent cause is poverty, followed by
low levels of parental education, poor dietary intake by children and rural residence (28-
30). For example, children < 5 years from low socio-economic households were found to
have twice the risk of being stunted than children from rich households in Ghana (28).
The association between poverty and undernutrition is mainly due to lack of adequate and
15
nutritionally balanced diet, health care and poor living conditions. As reported by Jalan
and Ravallion (2003), children living in households without piped water system were
more susceptible to diarrhea that influenced their overall health status compared to those
with access to piped water (31). Underweight among these children were also strongly
associated with maternal education, as children of mothers with no formal education were
more likely to be underweight than children of mothers with at least secondary school
education (OR = 1.64; 95% CI = 1.04–2.59) (28). An examination of the Bangladesh
Demographic Health Survey reported children from households with low socio-economic
status and illiterate mothers were at a greater risk of being undernourished (29). Other
studies have shown the influence of place of residence on the nutritional status of
children. A study by Shen et al. (1996) revealed that despite economic reforms in both
rural and urban China, higher percentage of rural children aged 2 to 5 years (38.0%) were
stunted as compared to urban children (10.0%) (32). These evidence clearly indicate the
increased risk of poor nutritional status for rural children compared to their urban
counterparts.
In addition to the anthropometric indices that reflect optimal growth or growth
faltering, iron nutriture is also indicative of overall nutritional status. Iron deficiency
adversely affects the immune system and increases the onset of diseases in children (33).
Children from both developing (Kenya and Bangladesh) and industrialized countries
(United Kingdom and United States) were found to benefit from iron supplementation
with respect to growth and reduced incidence of diarrhea and other infections (33).
Among the various socio-demographic causes, maternal illiteracy and poverty remained
primary causes (34, 35). Increased risk of anemia was observed among children of

16
mothers with no education compared to children of mothers with secondary education in
Indonesia (35). Moreover, in Brazil, pre-school children living in households with
inadequate physical and sanitary conditions were found to be significantly at increased
risk of anemia (34). A more recent study by Pasricha et al. (2010) also reported low
ferritin and hemoglobin levels in children from households with low socio-economic
status (36).
Maternal and household characteristics are directly associated with feeding and
health care practices received by the child. Poor dietary intakes, lack of health care and
incomplete immunization are immediate causes of undernutrition and have been
identified as potential modifiable risk factors. Several epidemiological studies have
confirmed the importance of dietary pattern and immunization coverage for optimum
growth and nutritional status in children. The following section reviews the studies
examining the association between these factors and undernutrition in children.
Dietary practices and nutritional status of children
The World Health Organization (WHO) has issued guidelines regarding infant
and child feeding practices. These guidelines encourage the promotion of exclusive
breastfeeding for the first six months and initiation of complementary feeding
(introduction of solid foods) thereafter (37). The guidelines also promote continued
breastfeeding till the child’s second birthday. Notzon (1984) studied the changing pattern
of breastfeeding in 7 developing countries using data from cross-sectional surveys. His
study revealed a notable decline in average duration of breastfeeding in these countries,
by ethnicity and modernization (38). More recently, the changing pattern of infant
feeding practices in developing countries was reviewed by King and Ashworth (2002).

17
While extended breastfeeding and early introduction of complementary feeding were
traditional norms among low-income mothers in Malaysia and the Caribbean, a notable
decrease in the duration of breastfeeding was observed in these countries (39).
Additionally, there has been an increased use of processed milk as a supplement for the
infant, as a result of industrialization and promotion of infant formulas (39).
Early introduction of complementary feeding, that is before the age of 6 months is
significantly associated with poorer growth patterns among infants. A longitudinal study
of 4 cohorts of infants in Vietnam examined this association and reported growth
faltering in infants receiving premature complementary feeding compared to exclusive
breastfeeding at 3 months (40). Not only were weight and length gain delayed among
infants who were partially breast-fed or weaned compared to exclusive breastfed infants
at 1 to 3 months of age, a similar trend was also observed among infants aged 3 to 6
months, thereby confirming the negative consequences of early weaning. Additionally,
morbidity from diarrhea and acute respiratory infections was significantly lower in infants
who were exclusively breastfed compared to their weaned counterparts (40). In spite of
the global guidelines on infant feeding practices, adherence to these recommendations is
limited in developing countries. A longitudinal study of newborns in Malawi, Africa,
highlighted this notion (41). Although universal breastfeeding was practiced for 18
months, rates of exclusive breastfeeding were only 19.0%, 8.0%, 2.0% and 0.0% at ages
1, 2, 3 and 4 mo, respectively. Moreover, the average age range of introduction of
complementary foods varied from 2.5 to 6.3 months, indicating premature initiation of
weaning (41).

18
Evidence suggests that maternal characteristics such as age, education,
employment and marital status impact infant feeding practices (42). Adherence to the
feeding recommendations varied with respect to the mother’s education level and SES
(41). Previous studies have established the impact of household and community
characteristics on infant feeding practices and overall nutritional status (43). A cross-
cultural study by Abel et al (2001) in New-Zealand showed the existence of inter-ethnic
similarities and differences in infant care and feeding practices (44). Kannan and group
(1999) compared American mothers and Asian-Indian-American mothers residing in the
United States for a median duration of 6 years with respect to infant feeding practices
(45). Their study revealed that beliefs about prelacteals, introduction of solid foods and
feeding carbonated beverages differed significantly between American and immigrant
Asian-Indian-American mothers. This study thus accentuates the influence of culture on
infant feeding practices. The influence of cultural beliefs and traditions on infant feeding
practices and its effect on child’s nutritional status in Puerto Rico was studied by Higgins
in 2000. This again revealed that culture was an important predictor of infant feeding
practice (46). Infant feeding practice is also influenced by other household factors such as
presence of a grandparent and place of residence. Feeding practices in households with a
grandmother present were significantly influenced with respect to the time of
introduction and type of solid foods received by the infant (47). On the other hand,
longitudinal and cross-sectional studies of rural and urban children in Bangladesh
observed a 100.0% practice of breast-feeding at birth among rural mothers compared to
78.0% among urban elite mothers (48). On the other hand, urban and rural differences
19
were observed for the decline in breast feeding rates and weaning of infants at 10 months
of age (48), confirming the influence of residence on feeding practices.
In a low socio-economic rural African community, although breastfeeding was
initiated in 99.0% of the study sample, more than 60.0% of the infants included in the
study had been introduced to water during their first month of life (49). Moreover, nearly
95.0% of the infants were introduced to solid foods at 2-4 months of age (49). This study
therefore highlights that although the rate of breast feeding initiation is relatively high in
developing countries, exclusive breastfeeding is rarely practiced. Similarly, while
breastfeeding was initiated by 97.0% mothers in a cross-sectional study in Brazil, early
introduction of complementary feeding was the usual norm (50). Moreover, the dietary
pattern of the infants/children aged 0 – 24 months mainly comprised of a higher intake of
carbohydrate rich foods, cow’s milk and lower intake of animal protein (50). Failing to
initiate breastfeeding 6 hours after birth, lack of colostrum and improper complementary
foods were all significant predictors of poor nutritional status of Indian children under 5
years of age (51).
Indicators of infant/child feeding practices
This section reviews the indicators in use for assessing infant and child feeding
practices. For the purpose of this dissertation feeding practices include breastfeeding for
infants < 6 months and dietary diversity for older children (> 6 months). Feeding
practices are based on a 24 hour dietary recall by the mother/caretaker.
Researchers have identified differences in the assessment of exclusive
breastfeeding with variability in the methods and breastfeeding definitions (52, 53). Aarts
et al., (2000) examined the underlying differences between data pertaining to the ‘current
20
status of breastfeeding’ (based on 24 hour recall) and ‘exclusive breastfeeding since
birth’ (based on daily recording) and reported a discrepancy between the results (52).
However, epidemiological studies have employed food records and dietary recall by the
infants/children’s caretakers to assess exclusive breastfeeding and dietary practices (54,
55). Information obtained retrospectively by Launer and group (2002) examined the
accuracy of maternal recall regarding infant feeding practices and reported positive
results (54). Although levels of accuracy were lower for formula feeding compared to
other feeding practices, accuracy rates were significantly higher for breastfeeding and
complementary feeding (54). The review by Li et al., (2005) also documents evidence of
validity and reliability of maternal recall for infant feeding practices (55). Additionally,
WHO has developed indicators for assessing breastfeeding practices for household
surveys using the 24 hour dietary recall (56). Other studies have successfully utilized this
approach to estimate the duration of exclusive breastfeeding (57). The national level
Demographic and Health Surveys (DHS) have therefore incorporated the 24-hour feeding
recall method to obtain information on infant and child feeding practices (58). Using data
from the DHS for 5 Latin American countries, age specific composite feeding index was
created to examine the association between feeding practices and nutritional status
(stunting) of children (59). Similar national level household surveys such as the National
Health and Nutrition Examination Survey have also successfully used household
interview generated information to assess the prevalence of exclusive breastfeeding
among US infants (60).

21
Childhood immunization and nutritional status
Immunization against the six vaccine preventable diseases namely poliomyelitis,
diphtheria, pertusis (whooping cough), tetanus, tuberculosis and measles has been
recognized as one of the most cost effective intervention strategies to reduce childhood
morbidity and mortality (61). Previous studies have confirmed the importance of
childhood immunization for optimal nutritional status (62, 63). In the Bangladesh based
study of children aged 12-23 months, nearly 51.0% of children without measles
immunization, i.e. incomplete immunization were stunted, while underweight and
wasting were prevalent among 76.0% and 48.0% children respectively (62). Non-
immunized children also reported higher frequencies of morbidity and hospitalization in
this study (62). Another study in Indonesia reported higher prevalence of severe
underweight, stunting and anemia in non-immunized children compared to completely
immunized children (63). Non-immunized children were 9 times more likely to suffer
from frequent diarrheal episodes compared to their immunized counterparts (63). These
studies imply that children who miss being completely immunized are at a higher risk of
poor nutritional status from repeated morbidities due to lack of immunity against the
vaccine preventable diseases.
Overweight in under 5 years old children in developing countries
With changing life-style and growing urbanization, there has been a rapid increase
in health problems related to over nutrition such as overweight and obesity in developing
countries worldwide (64- 66). As reported by a number of researchers, an increase in
Gross Domestic Product (GNP) is associated with higher energy intake from sugars,
animal and vegetable fats and decrease in the consumption of complex carbohydrates (64,
22
67, 68). Urbanization in developing countries is accompanied with an increased
consumption of processed foods, shorter duration of breast feeding and early weaning
(64, 66). These changes termed as ‘nutrition transition’ (64) has been one of the key
factors leading to increased rates of obesity and overweight in both adults and children.
Analysis of national representative data from Brazil revealed the simultaneous
decline of the prevalence of under nutrition in children and increase in adult obesity (69)
indicating the changing trend from under nutrition to over nutrition in this population.
Similar observations were made in Chile, where obesity prevalence increased among all
age groups (70). Even in Asian countries such as China and India, though malnutrition is
still widely prevalent, a noticeable decline of under nutrition in children clubbed with
increasing obesity among adults was observed (56). In China, while increasing rates of
obesity has been observed among adults irrespective of socioeconomic status and place of
residence, this trend was observed among the urban adult and high-income rural
population in India (66). A cross-sectional study in India, of children aged 9-15 years also
reported an overall prevalence of obesity and overweight at 11.1% and 14.2%
respectively (71). SES of the children’s households was a significant predictor of obesity
and overweight.
While the consequences of nutrition transition have been clearly manifested
among adults (66) and adolescents (71), several studies now document this observation
among pre-school children as well (72, 73). de Onis and Blössner (2000) examined data
from national nutrition surveys of 94 developing countries and reported the prevalence,
changing trend, and geographic distribution of overweight in children aged below 5 years
(73). Although the prevalence of overweight in the studied children was fairly low
23
(3.3%), 16 countries showed an increasing trend. Another study by Savva et al (2005)
performed on pre-school children from Cyprus showed that while there was a decrease in
the rate of under-nutrition, obesity was on the rise (74), indicating the urgency of this
health issue.
Lower maternal educational level, increased intake of total daily energy and
inadequate physical activity were identified as determinants of childhood overweight in
Latin America (75). A cross-sectional study carried out in the schools of India’s capital
city Delhi, found SES to be positively correlated with BMI as nearly 12.0% of children
from high-income group schools were consuming energy dense foods as compared with
7.2% of children from low-income group schools (76). Similarly, an examination of
stunting, underweight, overweight and obesity in Guatemala reported a higher prevalence
of stunting in children from low socio-economic status, while overweight and obesity
prevalence was significantly higher among children from affluent households (77). At the
same time, a study in Cameroon showed that low SES and low maternal education were
predisposing factors for preschool children to be stunted and overweight (78).
Although several national nutrition surveys have been conducted in developing countries,
including India, health policies and programs have overlooked the creeping problem of
overweight in children. There is a dearth of literature on the prevalence and determinants
of overweight in children under 5 years in developing countries. There is limited
information on the prevalence of overweight among Indian children, although several
studies indicate that India is experiencing a paradigm shift in nutrition, specifically in
urban areas (64, 79, 80). Griffith and Bentley (2005) evaluated the prevalence of
overweight among urban women from the state of Karnataka, South India, indicating the

24
growing burden of the problem (81). Country wide comparative studies focusing on
overweight in children under 5 years are lacking, thus strengthening the need to delve
into this area.
An overview of the Demographic and Health Survey
The Demographic and Health Surveys (DHS) are nationally-representative
household surveys conducted by MEASURE DHS and funded by the U.S. Agency for
International Development (USAID). These surveys collect information for indicators in
the areas of population health and nutrition, usually every 5 years to understand the
trends in these indicators. These surveys conducted in more than 85 developing countries
provide information to policy makers for planning, monitoring and evaluating programs
in these areas (58). The samples covered through DHS are representative at the national,
residence (urban-rural) and the regional levels. A two-stage stratification method is used
as the sampling frame. In the first stage, Enumeration Areas (EA) are drawn from Census
files, from which households are randomly selected from an updated list (second stage)
(58). For this dissertation work, DHS conducted in India (National Health and Family
Survey) was used.
National Health and Family Survey: sample design and data collection
The National Health and Family Survey (NFHS), conducted in India was initiated
by the Ministry of Health and Family Welfare (MOHFW), Government of India (GOI) in
1992-93 (82-84). The International Institute for Population Science, Mumbai has been the
sole agency responsible for the implementation of these surveys. Information from the
three available surveys (1992-93; 1998-99; 2005-06) has been used in this dissertation

25
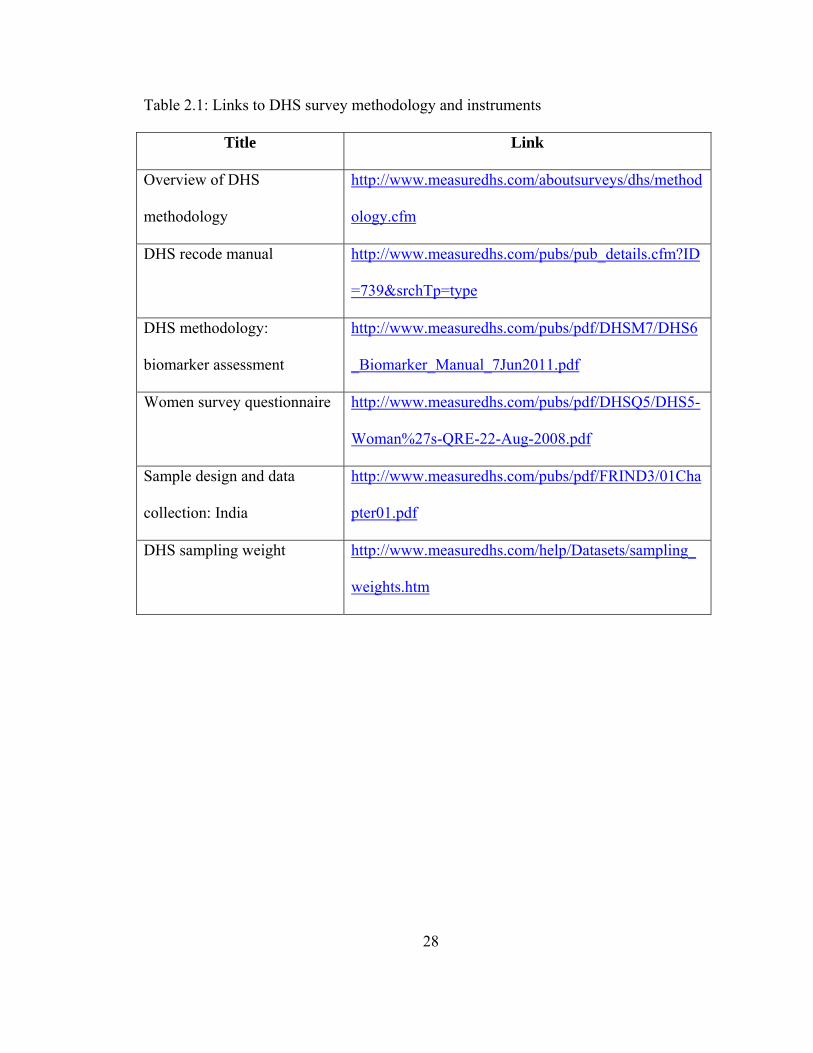
research. Details of the survey have been discussed below and important links provided
in Table 2.1.
Survey design and data collection
The surveys obtained information from married women in the age-group 13-49
years from all 29 states (82- 84). Similar to the methods employed by DHS, samples for
NFHS were collected through stratified cluster sampling process. Samples for each state
were drawn separately from urban and rural areas that were proportionate to the state’s
urban and rural population (84). The rural sample was first selected from villages that
comprised the Primary Sampling Units (PSUs), from which households were randomly
selected (second stage). In contrast, a three-stage stratification sampling was followed in
the urban areas. Urban wards were first selected from the Census file based on PPS,
followed by a census enumeration block (CEB). In the final stage, households were
randomly selected within each selected CEB (84). In order to adjust for differences in the
probability of oversampling of cases, sampling weight (national women’s weight)
provided by NFHS (84) was incorporated during data analysis (Table 2.1).
Survey instruments
Questionnaire: Information on household characteristics, participant’s
demography and anthropometric indicators were collected through questionnaires
(household, women and men). The household questionnaire collected demographic
information of usual residents and any visitor present from the night before the survey
and household infrastructure. In addition to these information women’s questionnaires
covered areas of reproductive and general health, nutrition, child immunization and
utilization of government services (Table 2.1). The content of the men’s questionnaire
26
included similar questions on the women’s questionnaire and additional questions
administered to men only (Table 2.1).
Biomarker and anthropometric measurement: The NFHS III survey collected
anthropometric measurements of women and children younger than 5 years, while only
children under 4 years were measured in NFHS I and II. During the second and third
phase of the survey (NFHS 2 and 3), trained health investigators collected blood samples
from women age 15-49, and children age 6-59 months. Hemoglobin levels were further
assessed using HemoCue on the fields. For this dissertation project we used information
pertaining to mothers having an index child less than 5 years from all the 3 surveys (82-
84).
Rationale, specific aims and hypothesis
This dissertation examines the different factors influencing the nutritional status
of children less than 5 years of age in India at individual and household levels. While the
prevalence of under nutrition and low birth weight remains high in the country (83), a
noticeable increase in overweight has been observed among children (71, 85, 86).
However, national and regional studies looking into the factors are lacking in the
literature. The purpose of this dissertation is to identify the key factors contributing to
both under nutrition and over nutrition among children aged below 5 years and poor
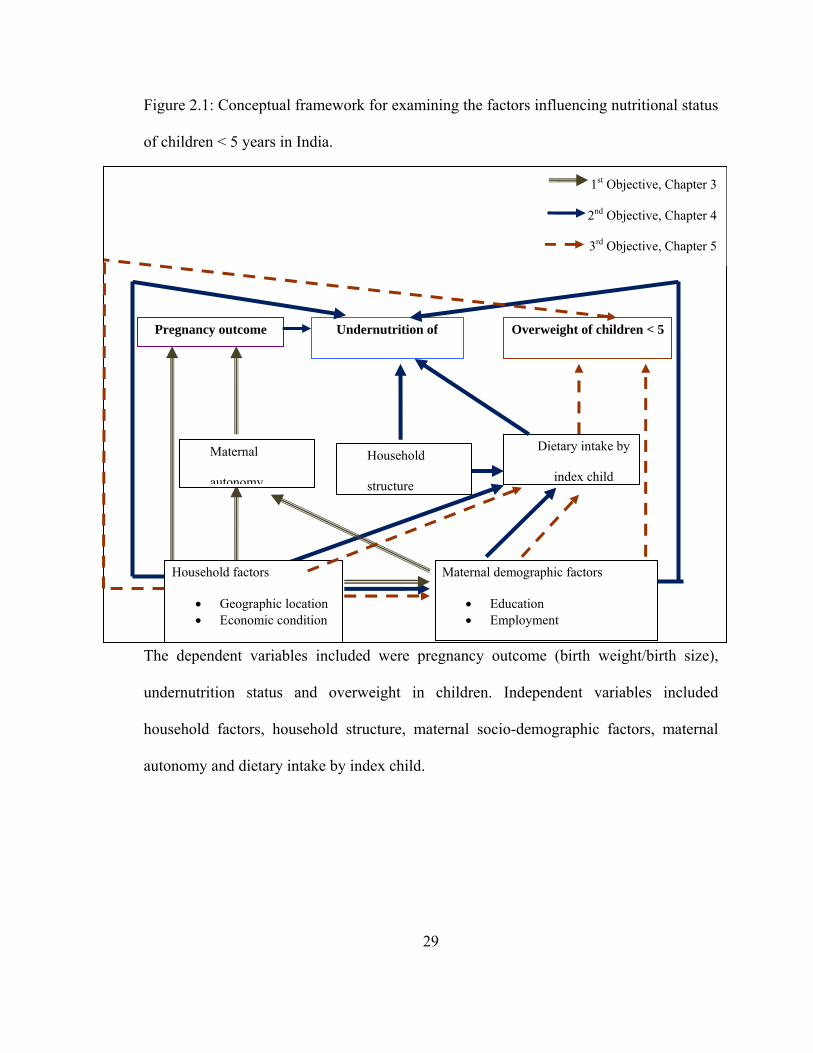
pregnancy outcome. The conceptual framework of the different independent and
dependent variables used in this dissertation research is presented in Figure 2.1.
The first specific aim is to examine the influence of maternal and household
characteristics on pregnancy outcome and identify existing regional differences. Our
hypothesis was that maternal socio-demographic characteristics and household conditions
27
would vary within regions with a significant impact on pregnancy outcome. The results
of this study have been reported in chapter 3.
The second specific aim is to examine regional variation and individual
(maternal) and household characteristics influencing undernutrition in children. It was
hypothesized that regional cultural variation along with maternal, household and
environmental characteristics would significantly influence nutritional status of children
< 5 years. Results of this study have been reported in chapter 4.
The third study aimed to examine the prevalence of overweight among children
aged below 5 years, existing trend between the 3 survey waves and the respective
predictors. The hypothesis was that a noticeable increase in overweight prevalence would
be observed across the survey waves. It was also hypothesized that maternal, child and
household characteristics would influence the risk for childhood overweight. Chapter 5
documents the findings of the study addressing this specific aim.
28
Table 2.1: Links to DHS survey methodology and instruments
Title Link
Overview of DHS
methodology
http://www.measuredhs.com/aboutsurveys/dhs/method
ology.cfm
DHS recode manual http://www.measuredhs.com/pubs/pub_details.cfm?ID
=739&srchTp=type
DHS methodology:
biomarker assessment
http://www.measuredhs.com/pubs/pdf/DHSM7/DHS6
_Biomarker_Manual_7Jun2011.pdf
Women survey questionnaire http://www.measuredhs.com/pubs/pdf/DHSQ5/DHS5-
Woman%27s-QRE-22-Aug-2008.pdf
Sample design and data
collection: India
http://www.measuredhs.com/pubs/pdf/FRIND3/01Cha
pter01.pdf
DHS sampling weight http://www.measuredhs.com/help/Datasets/sampling_
weights.htm
29
Dietary intake by
index child
Maternal
autonomy
Household
structure
Household factors
• Geographic location • Economic condition
Maternal demographic factors
• Education • Employment
Undernutrition of Pregnancy outcome Overweight of children < 5
1st Objective, Chapter 3
2nd Objective, Chapter 4
3rd Objective, Chapter 5
Figure 2.1: Conceptual framework for examining the factors influencing nutritional status
of children < 5 years in India.
The dependent variables included were pregnancy outcome (birth weight/birth size),
undernutrition status and overweight in children. Independent variables included
household factors, household structure, maternal socio-demographic factors, maternal
autonomy and dietary intake by index child.

30
References
1. Gorstein J, Sullivan K, Yip R, de Onís M, Trowbridge F, Fajans P, Clugston G.,
et al., Issues in the assessment of nutritional status using anthropometry. Bull
World Health Organ. 1994;72(2):273-283.
2. WHO Multicentre Growth Reference Study Group. WHO Child Growth
Standards: Length/height-for-age, weight-for-age, weight-for-length, weight-for-
height and body mass index-for-age: Methods and development. Geneva: World
Health Organization.2006.
3. Freedman DS, Khan LK, Serdula MK, Dietz WH, Srinivasan SR, Berenson GS.
The relation of childhood BMI to adult adiposity: The Bogalusa Heart Study.
Pediatrics. 2005;115(1): 22-27.
4. Lindsay RS, Hanson RL, Roumain J, Ravussin E, Knowler WC, Tataranni PA.
Body Mass Index as a measure of adiposity in children and adolescents:
relationship to adiposity by dual energy x-ray absorptiometry and to
cardiovascular risk factors. J Clin Endocrinol Metab. 2001;86(9):4061-4067.
5. World Health Organization. Indicator definitions and metadata. 2008. [Available
from: http://www.who.int/whosis/indicators/compendium/2008/en/]
6. Motta ME, Silva GA, Araújo OC, Lira PI, Lima MC. Does birth weight affect
nutritional status at the end of first year of life? J Pediatr (Rio J). 2005;81:377-82.
7. Hien NN, Kam S. Nutritional status and the characteristics related to malnutrition
in children under five years of age in Nghean, Vietnam. J Prev Med Public
Health. 2008; 41(4):232-240.
31
8. Sarni RO, Carvalho Mde F, Monte CM, Albuquerque ZP, Souza FI.
Anthropometric evaluation, risk factors for malnutrition, and nutritional therapy
for children in teaching hospitals in Brazil. J Pediatr (Rio J). 2009. 85:223-8.
9. Barker DJP. Fetal and infant origins of adult disease. Monatsschrift
Kinderheilkunde. 2001;149:S2-S6.
10. Curhan GC, Chertow GM, Willett WC, Spiegelman D, Colditz GA, Manson JE,
Speizer FE, Stampfer MJ. Birth weight and adult hypertension and obesity in
women. Circulation. 1996;94(6):1310-1315.
11. Valdez R, Athens MA, Thompson GH, Bradshaw BS, Stern MP. Birthweight and
adult health outcomes in a biethnic population in the USA. Diabetologia.
1994;37(6):624-631.
12. Frankel S, Elwood P, Sweetnam P, Yarnell J, Smith GD. Birthweight, body-mass
index in middle age, and incident coronary heart disease. Lancet.
1996;348(9040):1478-1480.
13. Stein CE, Fall CH, Kumaran K, Osmond C, Cox V, Barker DJ. Fetal growth and
coronary heart disease in South India. Lancet. 1996;348(9037):1269-1273.
14. Dulitzki M, Soriano D, Schiff E, Chetrit A, Mashiach S, Seidman DS. Effect of
very advanced maternal age on pregnancy outcome and rate of cesarean delivery.
Obstet Gynecol. 1998;92(6):935-939.
15. Mozurkewich EL, Luke B, Avni M, Wolf FM. Working conditions and adverse
pregnancy outcome: a meta-analysis. Obstetrics & Gynecology. 2000;95(4): 623-
635.
32
16. Mathews F, Yudkin P, Neil A. Influence of maternal nutrition on outcome of
pregnancy: prospective cohort study. BMJ. 1999;319:339-343.
17. King JC. The risk of maternal nutritional depletion and poor outcomes increases
in early or closely spaced pregnancies. J Nutr. 2003;133:1732S-1736S.
18. Rao S, Yajnik CS, Kanade A, Fall CH, Margetts BM, Jackson AA, Shier R, Joshi
S, Rege S, et al. Intake of micronutrient-rich foods in rural Indian mothers is
associated with the size of their babies at birth: Pune maternal nutrition study. J
Nutr. 2001;131:1217-24.
19. Carvalho Padilha PD, Accioly E, Chagas C, Portela E, Da Silva CL, Saunders C.
Birth weight variation according to maternal characteristics and gestational
weight gain in Brazilian women. Nutr Hosp. 2009;24(2):207-212.
20. Roos NP, Mustard CA. Variation in health and health care use by socioeconomic
status in winnipeg, Canada: Does the system work well? Yes and No. Milbank Q.
1997;75:89-111.
21. Tuntiseranee P, Olsen J, Chongsuvivatwong V, Limbutara S. Socioeconomic and
work related determinants of pregnancy outcome in southern Thailand. J
Epidemiol Community Health. 1999;53(10):624-9.
22. Bloom SS, Wypij D, Gupta MD. Dimensions of women's autonomy and the
influence on maternal health care utilization in a North Indian city. Demography.
2001;38(1).
23. Mistry R, Galal O, Lu M. Women's autonomy and pregnancy care in rural India:
A contextual analysis. Soc Sci Med. 2009;69(6):926-33.

33
24. Simkhada B, Teijlingen ER, Porter M, Simkhada P. Factors affecting the
utilization of antenatal care in developing countries: systematic review of the
literature. J Adv Nurs. 2008 61(3):244-60.
25. Kramer M. Determinants of low birth weight: methodological assessment and
meta-analysis. Bull World Health Organ. 1987;65(5):663-737.
26. Al Riyami A, Afifi M, Mabry RM. Women's autonomy, education and
employment in Oman and their influence on contraceptive use. Reprod Health
Matters. 2004;12(23):144-54.
27. United Nations Children's Fund. The State of the World's Children- Maternal and
new born health. UNICEF: New York. 2009. [Available from:
http://www.unicef.org/sowc09/docs/SOWC09-FullReport-EN.pdf]
28. Bloss E, Wainaina F, Bailey RC. Prevalence and predictors of underweight,
stunting, and wasting among children aged 5 and under in western Kenya. J Trop
Pediatr. 2004;50(5):260-70.
29. Das S, Hossain MZ. Levels and determinants of child undernutrition in
Bangladesh. Pak. J. Statist. 2008;24(4):301-323.
30. Dutta A, Pant K, Puthia R, Sah A. Prevalence of undernutrition among children in
the Garhwal Himalayas. Food Nutr Bull. 2009;30(1):77-81.
31. Jalan J, Ravallion M. Does piped water reduce diarrhea for children in rural
India? J Econom. 2003;112(1): 153-173.
32. Shen T, Habicht JP, Chang Y. Effect of economic reforms on child growth in
urban and rural areas of China. N Engl J Med. 1996;335(6):400-406.
34
33. World Health Organization. Iron Deficiency Anaemia: Assessment, Prevention
and Control. A guide for programme managers. WHO: Geneva. 2001.
34. Assis AM, Barreto ML, Gomes GS, Prado Mda S, Santos NS, Santos LM,
Sampaio LR, Ribeiro Rde C, Oliveira LP, et al. Childhood anemia prevalence and
associated factors in Salvador, Bahia, Brazil. Cadernos de Saúde Pública.
2004;20:1633-1641.
35. De Pee S, Bloem MW, Sari M, Kiess L, Yip R, Kosen S. The high prevalence of
low hemoglobin concentration among indonesian infants aged 3-5 months is
related to maternal anemia. J Nutr. 2002;132(8):2215-2221.
36. Pasricha SR, Black J, Muthayya S, Shet A, Bhat V, Nagaraj S, Prashanth NS,
Sudarshan H, Biggs BA et al. Determinants of anemia among young children in
rural India. Pediatrics. 2010;126(1): e140-149.
37. World Health Organization, United Nations Childrens Fund. Global strategy for
infant and young child feeding. WHO: Geneva. 2003.
38. Notzon F. Trends in infant feeding in developing countries. Pediatrics.
1984;74(4):648-666.
39. King J, Ashworth A. Historical review of the changing pattern of infant feeding in
developing countries: The case of Malaysia, the Caribbean, Nigeria and Zaire.
Soc Sci Med. 1987;25(12):1307-20.
40. Hop LT, Gross R, Giay T, Sastroamidjojo S, Schultink W, Lang NT. Premature
complementary feeding is associated with poorer growth of Vietnamese children.
J. Nutr. 2000;130(11): 2683-2690.
35
41. Vaahtera M, Kulmala T, Hietanen A, Ndekha M, Cullinan T, Salin ML, Ashorn P.
Breastfeeding and complementary feeding practices in rural Malawi. Acta
Paediatrica, 2001;90(3):328-332.
42. Hendricks K, Briefel R, Novak T, Ziegler P. Maternal and child characteristics
associated with infant and toddler feeding practices. J Am Diet Assoc. 2006;106(1
Suppl 1):S135-48.
43. Griffiths P, Madise N, Whitworth A, Matthews Z. A tale of two continents: a
multilevel comparison of the determinants of child nutritional status from selected
African and Indian regions. Health Place;2004;10:183-199.
44. Abel S, Park J, Tipene-Leach D, Finau S, Lennan M. Infant care practices in New
Zealand: a cross-cultural qualitative study. Soc Sci Med. 2001;53(9):1135-48.
45. Kannan S, Carruth BR, Skinner J. Cultural influences on infant feeding beliefs of
mothers. J Am Diet Assoc. 1999;99(1):88-90.
46. Higgins B. Puerto Rican cultural beliefs: Influence on infant feeding practices in
western New York. J Transcult Nurs. 2000;11(1):19-30.
47. Bentley M, Gavin L, Black MM, Teti L. Infant feeding practices of low-income,
African-American, adolescent mothers: an ecological, multigenerational
perspective. Soc Sci Med. 1999;49(8):1085-100.
48. Khan M. Infant feeding practices in rural Meheran, Comilla, Bangladesh. Am J
Clin Nutr. 1980;33(11):2356-2364.
49. Faber M, Benadé A. Nutritional status and dietary practices of 4-24-month-old
children from a rural South African community. Public Health Nutr.
1999;2(2):179-85.
36
50. Castro TG, Baraldi LG, Muniz PT, Cardoso MA. Dietary practices and nutritional
status of 0?24-month-old children from Brazilian Amazonia. Public Health Nutr.
2009;12(12):2335-2342.
51. Kumar D, Goel NK, Mittal PC, Misra P. Influence of infant-feeding practices on
nutritional status of under-five children. Indian J Pediatr. 2006;73(5):417-21.
52. Aarts C, Kylberg E, Hörnell A, Hofvander Y, Gebre-Medhin M, Greiner T. How
exclusive is exclusive breastfeeding? A comparison of data since birth with
current status data. Int. J. Epidemiol. 2000;29(6):1041-1046.
53. Auerbach KG, Renfrew MJ, Minchin M. Infant Feeding Comparisons: A Hazard
to Infant Health? J Hum Lact. 1991;7(2):63-8.
54. Launer LJ, Forman MR, Hundt GL, Sarov B, Chang D, Berendes HW, Naggan L.
Maternal recall of infant feeding events is accurate. J Epidemiol Community
Health. 1992;46(3):203-6.
55. Li R, Scanlon KS, Serdula MK. The Validity and Reliability of Maternal Recall
of Breastfeeding Practice. Nutr Rev. 2005;63(4):103-10.
56. World Health Organization. Indicators for assessing breast-feeding practices.
WHO: Geneva. 1991.
57. Thorsdottir I, Gunnarsdottir I, Kvaran MA, Gretarsson SJ. Maternal body mass
index, duration of exclusive breastfeeding and children's developmental status at
the age of 6 years. Eur J Clin Nutr. 2005;59(3):426-431.
58. Demographic and Health Surveys. [Available from: www.measuredhs.com/]

37
59. Ruel MT, Menon P. Child feeding practices are associated with child nutritional
status in Latin America: Innovative uses of the Demographic and Health Surveys.
J Nutr. 2002;132(6):1180-1187.
60. Li R, Ogden C, Ballew C, Gillespie C, Grummer-Strawn L. Prevalence of
Exclusive breastfeeding among US infants: The third National Health and
Nutrition Examination Survey (Phase II, 1991-1994). Am J Public Health.
2002;92(7):1107-1110.
61. United Nations Childrens Fund. The State of the World's Children- Child
survival. UNICEF: New York. 2008. [Available from:
http://www.unicef.org/sowc08/docs/sowc08.pdf]
62. Chowdhury F, Khan AI, Hossain MI, Malek MA, Faruque AS, Ahmed T, Salam
MA. Young children non-immunized against measles: characteristics and
programmatic implications. Acta Paediatr. 2006;95(1):44-49.
63. Semba RD, de Pee S, Berger SG, Martini E, Ricks MO, Bloem MW. Malnutrition
and infectious disease morbidity among children missed by the childhood
immunization program in Indonesia. Southeast Asian J Trop Med Public Health.
2007;38(1):120-9.
64. Popkin BM. The nutrition transition in low-income countries: An emerging crisis.
Nutr Rev. 1994;52(9):285-98.
65. Popkin BM. The nutrition transition and obesity in the developing world. J Nutr.
2001;131(3):871S-873.

38
66. Popkin BM, Horton S, Kim S, Mahal A, Shuigao J. Trends in diet, nutritional
status, and diet-related noncommunicable diseases in China and India: The
economic costs of the nutrition transition. Nutr Rev. 2001;59(12):379-390.
67. Drewnowski A, Popkin BM. The nutrition transition: new trends in the global
diet. Nutr Rev. 1997; 55(2):31-43.
68. Popkin BM, Horton SH, KimS. The nutrition transition and prevention of diet-
related diseases in Asia and the Pacific. Food Nutr Bull. 2001;22(4).
69. Monteiro CA, Mondini L, de Souza AL, Popkin BM. The nutrition transition in
Brazil. Eur J Clin Nutr. 1995;49(2):105-13.
70. Albala C, Vio F, Kain J, Uauy R. Nutrition transition in Chile: determinants and
consequences. Public Health Nutr. 2002;5(1a):123-128.
71. Chhatwal J, Verma M, Riar SK. Obesity among preadolescents of a developing
country (India). Asia Pac J Clin Nutr. 2004;12:231- 235.
72. Martorell R, Kettel Khan L, Hughes ML, Grummer-Strawn LM. Overweight and
obesity in preschool children from developing countries. Int J Obes Relat Metab
Disord. 2000;24(8):959-67.
73. de Onis M, Blössner M. Prevalence and trends of overweight among preschool
children in developing countries. Am J Clin Nutr. 2000;72(4):1032-1039.
74. Savva SC, Tornaritis M, Chadjigeorgiou C, Kourides YA, Savva ME, Panagi A,
Chrictodoulou E, Kafatos A. Prevalence and socio-demographic associations of
undernutrition and obesity among preschool children in Cyprus. Eur J Clin Nutr.
2005;59(11):1259-65.

39
75. Kain J, Vio F, Albala C. Obesity trends and determinant factors in Latin America.
Cad Saude Publica. 2003;19:S77-86.
76. Kaur S, Sachdev HP, Dwivedi SN, Lakshmy R, Kapil U. Prevalence of
overweight and obesity amongst school children in Delhi, India. Asia Pac J Clin
Nutr. 2008;17(4):592-6.
77. Groeneveld IF, Solomons NW, Doak CM. Nutritional status of urban
schoolchildren of high and low socioeconomic status in Quetzaltenango,
Guatemala. Rev Panam Salud Publica. 2007;22(3):169-77.
78. Said-Mohamed R, Allirot X, Sobgui M, Pasquet P. Determinants of overweight
associated with stunting in preschool children of Yaounde, Cameroon. Ann Hum
Biol. 2009;36(2):146-61.
79. Griffiths P, Bentley M. Women of higher socio-economic status are more likely to
be overweight in Karnataka, India. Eur J Clin Nutr. 2005;59(10):1217-20.
80. Martorell R, Khan LK, Hughes ML, Grummer-Strawn LM. Obesity in women
from developing countries. Eur J Clin Nutr. 2000;54(3):247-52.
81. Griffiths PL, Bentley M. The nutrition transition is underway in India. J Nutr.
2001;131(10):2692-700.
82. International Institute for Population Sciences (IIPS), National Family Health
Survey (MCH and Family Planning)- India 1992-93. 1995: Bombay:IIPS.
83. International Institute for Population Sciences (IIPS) and Macro International,
National Family Health Survey (NFHS-3), 2005-06: India: Volume I. 2007, IIPS:
Mumbai.

40
84. International Institute for Population Sciences (IIPS) and ORC Macro, National
Family Health Survey (NFHS-3), 2005-2006, India: Key Findings. 2007:
Mumbai.
85. Bhandari N, Mazumder S, Bahl R, Martines J, Black RE, Bhan MK; Infant
Feeding Study Group. An educational intervention to promote appropriate
complementary feeding practices and physical growth in infants and young
children in rural Haryana, India. J Nutr. 2004;134(9):2342-8.
86. Chatterjee P. India sees parallel rise in malnutrition and obesity. Lancet.
2002;360(9349):1948.

41
CHAPTER 3
MATERNAL AUTONOMY AND LOW BIRTH WEIGHT IN INDIA1
1 Chakraborty, P. and A.K. Anderson. 2011. Journal of Women’s Health. 20:1373-82. Reprinted here with permission of publisher.
42
Abstract
Background: The prevalence of low birth weight (LBW) is a major public health
issue in India (30.0%), and is the highest among South-Asian countries. Maternal
autonomy or the mother’s status in the household indicates her decision making power
with respect to movement, finance, health care use and other household decisions.
Autonomy of the mother is significantly associated with the child’s nutritional status.
Although previous studies in India reported the determinants of LBW, literature on the
association between mother’s autonomy and birth weight are lacking. This study
therefore aims to examine the influence of maternal autonomy on birth weight of the
newborn. Methods: The study, a secondary data analysis, examined data from the 2005-
2006 National Health and Family Survey (NFHS-III) of India. A maternal autonomy
score was created through proximal component factor analysis and categorized as high,
medium and low autonomy levels. The main outcome variable included birth weight of
the index child obtained from health cards and mother’s recall. Descriptive and logistic
regression analyses were performed. Results: Results from the study indicate that 20.0%
of the index children included in the analysis was born LBW. Low maternal autonomy
was one of the most important predictor of LBW (OR = 1.3, 95% CI = 1.1 – 1.5, p =
0.007), irrespective of socio-demographic and household characteristics, while medium
autonomy level was not significant. Conclusion: These findings clearly indicate the
importance of empowering women in India to combat the high incidence of LBW.
43
Introduction
The high prevalence of low birth weight (LBW) remains to be one of the most
critical public health issues in developing countries, specifically South Asia. Of the total
at term deliveries, 15.5% infants are born LBW worldwide (1). While the incidence of
LBW in developing countries is 16.5%, nearly 27.0% of the newborns are LBW in South
Asia, as compared to 15.0% in Africa and 6.0% in East Asia. Among the countries in
South Asia, India along with Bangladesh has the highest reported cases of LBW (30.0%)
(1).
Consequences of LBW are not limited to the individual child alone, but have
detrimental effects on the society as a whole. It is one of the major determinants of
neonatal mortality and morbidity and childhood growth retardation (2). Children born
LBW may experience physical growth faltering, manifested as decreased body weight,
height and head circumference when compared to normal weight infants (3).
Additionally, studies show that LBW infants have poor academic performance during
school age, and are at an increased risk of developing chronic diseases later in adult life
(2,4). A strong association between fetal undernutrition, LBW and the development of
insulin resistance and type 2 diabetes in later life has been observed among adult
populations from Europe and USA (5,6). LBW is reported to be one of the potential risk
factors for high systolic blood pressure and development of insulin resistance among
Indian children (7). Examination of the relationship between birth weight and nutritional
status of Vietnamese children aged below 5 years, found an increased risk of
underweight, stunting and wasting among children born LBW compared to their
counterparts born normal birth weight (> 2500.0 gram) (8).
44
Maternal characteristics such as nutritional status, age, education and socio-
economic status have been associated with intrauterine growth and subsequent birth
weight of an infant. Another important predictor of birth weight is utilization of prenatal
care, which is influenced by women’s autonomy and other cultural practices ( 2, 9, 10).
Other studies have observed that a woman’s autonomy influences her health behaviors,
thus contributing to their overall health status (11). A study by Shroff and colleagues
also observed an association between mother’s autonomy and the nutritional status of her
child (12).
The concept of women’s autonomy has been defined in different ways by several
authors. For example, Begin et al., captured the caregiver’s autonomy through their
decision-making authority, which they found to be negatively associated with stunting
among their children (13). In the study by Smith et al., women’s autonomy was defined
by equality between men and women (14). The authors observed a positive influence of
maternal autonomy on the overall nutrition of children from developing countries (14).
Other key dimensions of women’s autonomy reported in the scientific literature include
decision-making authority in the household, freedom of movement, financial
independence and attitude towards domestic violence (15-17). Using these individual
domains of autonomy, Shroff et al., reported a significant increased risk of stunting
among children of mothers with low autonomy in India (12). These studies mentioned
above document the significant role women’s autonomy play in the nutritional status of
their children. However, to the best of our knowledge, studies examining the influence of
autonomy as defined by a composite score on birth weight and birth size are limited.
45
Considering the magnitude of LBW prevalence, poor nutritional status of children
as well as the regional distribution of these problems in India, there is a need to
investigate the impact of women’s autonomy on LBW deliveries in this population. In
addition, Jejeebhoy and Sathar, have also reported disparity in autonomy of women from
North and South India (16). Even though previous studies from India have explored the
determinants of LBW (3,18,19) the literature is limited on the role of maternal
autonomy and its subsequent influence on birth weight and birth size in this population.
Also, we did not find any study that used a composite score with the different domains of
autonomy as mentioned above to examine this association. The current study therefore
aims to examine the association of maternal autonomy with birth outcome (i.e. birth
weight and maternal perception of the infant’s birth size) in India.
Methods
Study design and data
This study is a secondary data analysis of the recent wave of India’s National
Family Health Survey (NFHS 3) conducted in 2005-2006 (20). This nationally
representative multi-stage household survey interviewed women in the reproductive age
group (15-49 years) from the states of India, covering 124,285 women. Details about the
data collection and sample stratification are reported elsewhere (20). To compare the
regional prevalence of LBW deliveries, we divided the country into 5 regions- namely:
North, East, North-East, South and Central-West regions (20). Prevalence of poor
pregnancy outcome was also examined by place of residence (urban and rural) of the
index children. For the purpose of this study, information pertaining to non-pregnant
women with index child < 5 years (n = 34,300) from singleton births, with complete
46
information on birth weight/birth size was extracted. The final analytical sample-sizes
used in the present study were therefore 14,407 (40.8%) for measured birth weight and
33,881 (98.8%) for maternal perception of birth size.
Outcome measure
Pregnancy outcome of the respondents included in our analysis were
determined with respect to the birth weight (grams) of the index child obtained from
health cards (n = 2201; 15.3%) and mother’s recall (n = 12206; 84.6%). We used the
World Health Organization’s (WHO) classification of LBW, i.e. birth weight less than
2500.0 grams, (1) to categorize it as either LBW or normal birth weight.
More than 50.0% of deliveries in India are non-institutional and infants are not
weighed at birth (NFHS 3), leading to missing information on birth weight. To address
the issue of missing information on birth weight, the use of ‘mother’s subjective
assessment’ of infant’s birth size has been reported to be a reliable indicator (1).
Reliability of using maternal perception of infant’s birth size was examined using data
from the Demographic and Health Surveys (DHS) of 15 countries (9). The study reported
a strong association between mother’s perception of birth size and birth weight (9).
Similar studies from Pakistan also reported a consistent relationship between infant’s
birth weight and mother’s assessment of birth size (11).
In the current study we observed a moderate association between infant’s birth
weight and mother’s perception of birth size (κ = 0.50). The sensitivity and specificity
values comparing mother’s estimate of birth size as a measure of birth weight (N =
14,407) were 0.59 and 0.89 respectively, with a positive predictive value (PPV) of 0.54

47
(Table 3.1). We therefore used the mother’s perception of the birth size of the infant in
addition to birth weight to assess whether both measures have similar predictors.
Independent variables
The primary independent variable used in our analysis was maternal autonomy.
Previous studies that have reported on women’s autonomy used individual measures such
as decision-making power of women in household activities, health seeking behavior,
freedom of movement, financial independence and attitude towards wife beating or
domestic violence to measure autonomy (16, 17, 23). Our autonomy score was created
by use of individual autonomy measures selected through the principal component factor
analysis (PCA) . The final variables used to define women’s autonomy were participants’
responses (1= respondent alone; 2= respondent and husband; 3= respondent and other; 4=
husband or partner alone; 5= someone else; 6= other) to the following: “final say on own
health care,” “final say on making large household purchases,” “final say on making
purchases for daily needs” and “final say on visits to family or relatives.” The reliability
of using the above mentioned variables to compute maternal autonomy score was
assessed by Cronbach's alpha (α = 0.80). The autonomy score (range: 4.0-24.0) was
categorized as high (score: 4.0- 7.0), medium (score: 8.0- 15.0) and low (score: 16.0-
24.0) maternal autonomy. A similar autonomy score, based on these 4 dimensions was
recently used by Acharya et al., to examine the influence of socio-demographic factors
influencing autonomy of Nepali women (24).
Other covariates included in our analysis were socio-demographic and biomedical
characteristics of the mothers along with their nutritional status and household
characteristics. Maternal age, education, religion, caste/tribe and employment status were
48
used to describe maternal socio-demographic characteristics. Utilization of prenatal care
and parity captured the biomedical information pertaining to the participants included in
our analysis. Maternal nutritional status was based on their Body Mass Index (BMI)
obtained from the survey data sets. These were further used to categorize the mothers as
underweight (BMI < 18.5 kg/m2) and normal/overweight (BMI > 18.5 kg/m2) according
to the WHO classification.
Information on household characteristics obtained included place of residence
(regions and rural/urban), sex of the household head and SES of the households. SES of
the households was assessed based on the wealth index classifications used in NFHS III,
as discussed elsewhere (20). The five categories of the given wealth index, ranging from
‘poorest’ to ‘richest’ were further categorized as ‘poor,’ ‘middle’ and ‘rich’ in the present
study.
Statistical Analysis
The NFHS data sets were downloaded from Measure DHS,26 and analyzed using
SPSS for windows version 16.0 (SPSS Inc, Chicago, IL). A sample weight (national
women’s weight) was used to adjust for oversampling and non-response from various
places within the country. We used the measured birth weight data (N = 14,407) as the
sample for descriptive and bivariate analysis. Prevalence of poor pregnancy outcome is
reported as weighted percentages. Chi-square analyses were used to compare maternal
and household characteristics by region of residence. Predictors of birth weight (LBW vs.
normal) and birth size (small vs. average/large) were identified through weighted
univariate and multivariate logistic regression. Factors associated with maternal

49
autonomy were also examined using multivariate logistic regression. All results were
considered significant if p < 0.05.
Results
Characteristics of study participants and households
The socio-demographic, biomedical and household characteristics of the
participants from the five regions are presented in Table 3.2. Majority (> 60.0%) of the
participants were aged between 20- 29 years, with a mean age of 25.9 ± 4.9 years. More
than 70.0% of the participants were Hindu, while the remaining followed Islam,
Christianity, Sikhism, Buddhism, Jainism and other minor religions (Zoroastrian and
Doni-polo) or no religion. A significant regional difference was observed with respect to
education levels and employment status of the participants (Table 3.2). The percentage of
mothers with no formal education was highest in the East (23.7%) region compared to
other regions. Participants not employed outside the homes also followed a similar trend
(East: 83.0%). Biomedical characteristics of the participants were similar in the five
regions (Table 3.2). Medical advice obtained for prenatal care was fairly similar in the
five regions (data not shown). In terms of parity, nearly 60.0% of the participants were
multiparous. Out of the 14407 households included in our analysis, nearly 90.0% were
headed by male members. Majority of the households (80.0%) from the North region
belonged to the highest socioeconomic category, while only 45.4% households in the
East were in this category (Table 3.2).
Characteristics of mothers with low autonomy
Participants with low autonomy were younger in age (15- 19 years; 43.0%),
followed Islam (28.8%) religion, have had no formal education (29.0%) and were not

50
engaged in any form of employment outside the home (27.0%), as compared to
participants with higher autonomy (Figure 3.1a). Furthermore, a significant association
was observed between the nutritional status, i.e. underweight (BMI < 18.0 kg/m2) of
participants and low autonomy (p < 0.05). A higher proportion of participants with low
autonomy were from the North (28.6%) and East (32.7%) regions as compared to North-
East (9.7%), South (22.5%) and Central-West (25.0%) regions. Nearly 30.0% of
participants with low autonomy were of low SES (Figure 3.1b). There was also
significant difference between the degrees of autonomy of participants with respect to the
sex of the household head (p < 0.05). Among the female headed households, 26.3% of
the mothers had a high autonomy in contrast to 19.1% from male headed households
(Figure 3.1b). Interestingly, relationship of participants with the household head was
significantly associated with their level of autonomy. Low autonomy was observed
among participants who were either daughter-in-law (42.0%) or other relative (34.0%) of
the household head, compared to wives (15.0%) or daughters (27.0%) of the household
head.
Multiple logistic regressions examining factors associated with participant’s
autonomy are presented in Table 3.3. Socio-demographic and household characteristics
of participants were significantly associated with their autonomy status (Table 3.3). For
example, higher maternal age, education level, being employed and belonging to nuclear
households improved their degree of autonomy. On the other hand, mothers who
followed the Islam religion were more likely to be of low autonomy (OR = 1.21, 95% CI
= 1.05- 1.40, p = 0.008) compared to their Hindu counterparts. In addition, mothers from
the East region were more likely to have low autonomy, while those from the North east
51
had higher autonomy compared to their counterparts from the North (Table 3.3).
Nutritional status and utilization of prenatal care were other factors strongly associated
with the level of autonomy of the mothers. Mothers with higher BMI normal/overweight)
were almost 10.0% less likely to have low autonomy (Table 3.3).
Prevalence of poor pregnancy outcome
Although, the mean birth weight of index children included in our analysis was
2835.0 ± 666.4 g, nearly 20.0% of them were born LBW and were widely prevalent in
the North region as compared to the other four regions (p < 0.001; Figure 3.2a). Nearly
27.0% of all pregnancies in the North resulted in LBW newborns, followed by Central-
West (21.2%), East (20.04%), North- East (16.8%) and South (16.2%) regions. A similar
trend was observed for the mother’s perception of her newborn’s birth size. There was
also a significant (p < 0.001) difference in LBW prevalence among urban and rural areas
(Figure 3.2b). In terms of the mother’s perception of the newborn’s birth size nearly
equal proportions of the mothers perceived them as larger than average, average or small,
irrespective of the place of residence (urban/rural; Figure 3.2b).
Predictors of low birth weight/size
Univariate logistic regression analysis was used to explore other covariates
besides maternal autonomy that are associated with our outcomes of interest. Variables
that came out significant were subsequently used in the multivariate analysis. Tables 3.4
and 3.5 present results from multivariate logistic regression analyses that examined the
independent association of maternal autonomy on birth weight (Table 3.4) and birth size
(Table 3.5). Our final multivariate models therefore contained all significant covariates in
addition to maternal autonomy adjusting for important confounders.
52
In terms of infant’s birth weight, low maternal autonomy significantly increased
the risk of delivering a LBW infant (OR = 1.28; 95% CI: 1.07 to 1.53, p = 0.007; Table
3.4), compared to mothers with high autonomy, and was one of the most important
predictors. However, there was no significant influence of mothers with medium
autonomy on birth weight. Formal education in the secondary and higher (college) levels,
belonging to higher SES household and good nutritional status of the mother remained to
be protective against LBW (Table 3.4). Residing in any of the four regions, i.e. East,
North-East, South and Central-West also reduced the odds of LBW by nearly 50.0% -
60.0% as compared to residing in the North. Among other risk factors, rural residence
increased the odds of LBW delivery by 14.0%, in the presence of important covariates.
Unlike the results from the univariate logistic regression analysis, religion of the mother
had no independent association with the infant’s birth weight (Table 3.4).
Similar to the observations for birth weight, low maternal autonomy remained a
significant independent predictor for small birth size, as perceived by the mother, when
controlled for maternal and household characteristics (OR = 1.28, 95% CI: 1.07 to 1.53,
p = 0.007; Table 3.5). Here again we observed that mothers with formal education at the
higher/college level had 30.0% reduced risks of delivering small infants. While religions
such as Islam and Christianity had no significant association with the infant’s birth size,
those following other minor religions were more likely to report smaller birth size of the
infant (OR = 1.40, 95% CI = 1.15- 1.70, p = 0.001; Table 3.5) compared to Hindu
mothers. Other independent factors such as good nutritional status of the mothers, higher
SES and regions of residence other than the North significantly reduced the risks of

53
reporting small birth size of the infants. However, place of residence (urban/rural) was no
longer significant in the multivariate model.
Discussion
The findings from this study confirm our hypothesis that low maternal autonomy
is an important predictor of unfavorable birth outcome in terms of birth weight and
mother’s perception of the birth size, in India. The composite score used to measure
women’s autonomy in the present study unlike previous studies captured the different
domains of autonomy in a single autonomy variable that influenced birth weight and birth
size.
As observed in our study, mothers with low autonomy were more viable to risk
factors for unfavorable birth outcome. In our study population, poor nutritional status or
underweight, a critical factor for intra-uterine growth retardation and LBW, was most
prevalent among women with low autonomy. Similar to this observation, other studies
suggest that women who have low autonomy are more likely to be undernourished or
suffer from chronic energy deficiency (27, 28). Dharmalingam et al., examined the data
from NFHS 2 (1998-1999) and identified maternal nutritional status as one of the most
important determinants influencing intra-uterine growth and therefore the infant’s birth
weight (29). The recent review by Muthayya, also reports the influence of micronutrient
and fatty acid deficiencies on inadequate weight gain during pregnancy and the incidence
of LBW (30). It is therefore plausible women with low autonomy and poor nutritional
status was at a higher risk of delivering LBW or small infants.
Utilization of prenatal care influences pregnancy outcome in terms of
complications faced by the mother and the newborn’s birth weight (31). In the hospital
54
based case-control study conducted in Ahmedabad, India, lack of prenatal care was a
significant independent predictor of term LBW delivery (31). These results further
confirm our findings, as use of prenatal care, an independent predictor of LBW was also
strongly associated with maternal autonomy. Mistry, Galal and Lu, (32) reported that
women with low autonomy were less likely to obtain prenatal care, that probably
increased their risks of delivering LBW infants. Women with high autonomy or decision
making power in the household were more likely to utilize prenatal care irrespective of
the women’s age, educational level and relationship to household head, (32) thereby
confirming our study results.
Our findings about the socio-demographic and household characteristics of
women with low autonomy are consistent with previous studies (16, 33, 34). In our study
population, women with low autonomy had significantly less years of formal education,
were unemployed and were from households with low SES, compared to women with
medium or high autonomy. Similar observations were made in Sri Lanka, where
education and employment in a paid work were significant contributors for achieving
financial autonomy (33). Interestingly, education and employment were not significant
contributors of social autonomy in Sri Lanka, which is in contrast to our finding. The
study examined the predictors of financial and social autonomy independently (33) while
we used a cumulative autonomy score (as previously discussed), which possibly
contributed to the contrasting findings. Education and employment in paid work outside
the home remained important predictors of women’s autonomy and reproductive rights,
specifically with contraceptive use in Oman indicating the importance of these
demographic factors on women’s status (34). Our findings also follow a similar trend as
55
evident from the significant association of maternal socio-demographic characteristics
and levels of autonomy.
Consistent with our results, previous studies have identified maternal education to
be an important predictor of poor pregnancy outcome (2, 35). In the population based
study in Quebec, lower levels of maternal education increased the risks of LBW and
smaller birth size (small-for-gestation age) It is likely that women with lower levels of
education practice unsuitable health habits and have poor economic conditions, during
pregnancy that may influence fetal growth. In India, women with no formal education or
those with lower levels of education are usually from lower SES households and rural
areas (20) factors that limit their access to proper health care resources, thereby
increasing their risk of having adverse birth outcomes. In addition, lower SES and rural
residence were significant risk factors for LBW in this study population. These results are
confirmed by meta-analysis results reported by Kramer (2) that documents the increased
risk of delivering LBW infants in women from low SES households and/or those
belonging to rural areas.
While religion of the mothers had no independent association with birth weight,
those following minor religions (Sikh, Jain, Buddhist, Zoroastrian, Doni-polo and no
religion) were 40.0% more likely to perceive their infant’s birth size as small. However,
due to the small sample size of this group (n = 954), it is difficult to draw any
conclusions. In contrast to our observations, Sikh infants were reported to have a
significantly larger birth size compared to Hindu infants born in Britain (36). In addition,
an examination of birth weight of infants in North India reported that Sikh infants were
36.0 grams heavier than Hindu, Muslim or Christian (37). The differences in

56
observations made in the current study could be attributed to the different religious
groups (Hindu, Islam, Christian and others) included in our analysis.
Another important contribution of this study is the confirmation of mother’s
perception of infant’s birth size is a reasonable proxy measure for birth weight in India.
Similar to the observations made by Boerma et al., (21) in 15 developing countries,
proportion of infants weighed at birth was only 40.3%, whereas 98.0% of mothers
recalled their infant’s birth size. The sensitivity or “the proportion of low-birth-weight
children identified by the relative size-at-birth indicator”, (21) between the two measures
was 59.10%. In addition the PPV i.e. “the proportion of LBW children among those
identified by the perceived birth size indicator,” (21) was also nearly 54.0%. These values
indicate that in the absence of measured birth weight, mother’s perception of the infant’s
birth size is a reliable proxy measure for the birth weight. Moreover, maternal autonomy
remained an important independent predictor of both birth weight and the relative birth
size of the infant as reported by the mother, irrespective of maternal and household
characteristics. These findings further suggest that in the absence of measured birth
weight, maternal perception of birth size can be substituted in surveys and other health
and nutrition need determinations. However, as majority of the birth weight were by
mother’s recall, there exist the potential for random misclassification, thereby limiting the
reliability of this data. Moreover, facility based deliveries where the infant was measured
at birth, could have influenced the mother’s perception of the birth size. Thus these
findings need to be interpreted with caution. As mentioned in the previous sections, a
large proportion of subjects (48.8%) with missing information on birth weight were
excluded from the analysis. Characteristics of subjects included and excluded from the
57
analysis varied significantly for education level, SES, place of residence and autonomy
level. It is also possible that the exclusion of those with missing data may have
contributed to the observed prevalence of low birth weight (20.0%) in this sample that is
lower than that previously reported for India (30.0%) (1).
Conclusion
Due to the cross-sectional nature of the data the results of this study need to be
interpreted with caution. However, due to the large analytical sample size, results can be
generalized to the Indian population. Moreover, the measure of maternal autonomy was
derived from a composite score that included several domains of autonomy as previously
discussed and adds to the study’s strengths. There could be recall bias on participants
reporting on decision making authority of mothers within the household because of the
cross-sectional nature of the data collection if used individually limiting the reliability of
this indicator.
Several national level programs in India, such as the Integrated Child
Development Services (ICDS) scheme, focus on elevating the nutrition and health status
of women through supplementary nutrition and prenatal council.20 While this forms an
essential component of maternal health care programs, results from our study suggests
the need to include strategies to improve women’s status in the society. Promotion of
gender equality and women’s empowerment through financial independence as contained
in the Millennium Development Goals (MDG),38 are means of improving women’s
autonomy. Empowerment programs in Andhra Pradesh, India supported by the World
Bank and others such as the Bangladesh Rural Advancement Committee (BRAC) have
considerably increased women’s autonomy in domains such as mobility, economic
58
security, involvement in household purchases and political and legal awareness.39, 40 Our
study results suggest that effective implementation of similar programs in India and other
developing countries will not only impact women’s own well-being but reduce the
burden of LBW.
Acknowledgements
The authors wish to thank the families of Ruth Rowan Morrison and Glenn and
Helen Burton, and the Department of Foods and Nutrition, The University of Georgia for
providing funds to support the study. The authors also thank the members of Measure
DHS for making the data available and providing technical guidance.
59
References
1. United Nations Children’s Fund & World Health Organization. Low Birthweight:
Country, regional and global estimates. UNICEF, New York:2004.
2. Kramer M. Determinants of low birth weight: methodological assessment and
meta-analysis. Bulletin of the World Health Organization, 1987;65(5):663-737.
3. Sachdev H. Low Birth Weight in South Asia. Int J Diabetes Dev Ctries. 2001;
21(1): 13-33.
4. Barker DJP. The developmental origins of adult disease. J Am Coll Nutr.
2004;23:588S-595.
5. Frankel S, Elwood P, Sweetnam P, Yarnell J, Smith GD. Birthweight, body-mass
index in middle age, and incident coronary heart disease. Lancet. 1996;
348(9040):1478.
6. Li CY, Johnson MS, Goran MI. Effects of low birth weight on insulin resistance
syndrome in Caucasian and African-American children. Diabetes Care.
2001;24(12):2035-2042.
7. Bavdekar A, Yajnik CS, Fall CH et al. Insulin resistance syndrome in 8-year-old
Indian children: small at birth, big at 8 years, or both? Diabetes.
1999;48(12):2422-2429.
8. Hien NN, Kam S. Nutritional status and the characteristics related to malnutrition
in children under five years of age in Nghean, Vietnam. J Prev Med Public
Health. 2008;41(4):232-240.
9. Mavalankar DV, Gray RH, Trivedi CR. Risk factors for preterm and term low
birthweight in Ahmedabad, India. Int J Epidemiol. 1992;21(2):263-272.

60
10. Mistry R, Galal O, Lu M. Women's autonomy and pregnancy care in rural India:
A contextual analysis. Soc Sci Med. 2009;69(6):926-933.
11. Woldemicael G, Tenkorang E. Women’s autonomy and maternal health-seeking
behavior in Ethiopia. Matern Child Health J. 2010; 14(6):988-998.
12. Shroff M, Griffiths P, Adair L, Suchindran C, Bentley M. Maternal autonomy is
inversely related to child stunting in Andhra Pradesh, India. Matern Child Nutr.
2009;5(1):64-74.
13. Bégin F, Frongillo EA, Delisle H. Caregiver behaviors and resources influence
child height-for-age in rural Chad. J Nutr. 1999;129(3):680-686.
14. Smith LC, Ramakrishnan U, Ndiaye A, Haddad LJ, Martorell R. The importance
of women’s status for child nutrition in developing countries. Research Reports
131. International Food Policy Research Institute (IFPRI): Washington, D.C.
2003
15. Vlassoff C: Progress and Stagnation: Changes in fertility and women's position in
an Indian village. Population Studies 1992, 46(2):195-212.
16. Jejeebhoy SJ, Sathar ZA: Women's autonomy in India and Pakistan: The
influence of religion and region. Popul Dev Rev. 2001;27(4):687-712.
17. Jejeebhoy SJ: Convergence and divergence in spouses' perspectives on women's
autonomy in rural India. Stud Fam Plann. 2002;33(4):299-308.
18. Rao S, Yajnik CS, Kanade A, et al. Intake of micronutrient-rich foods in rural
Indian mothers is associated with the size of their babies at birth: Pune maternal
nutrition study. J Nutr. 2001;131(4):1217-1224.

61
19. Nair N, Rao R, Chandrashekar S, Acharya D, Bhat H. Socio-demographic and
maternal determinants of low birth weight : A multivariate approach. Indian J
Pediatr. 2000; 67(1):9-14.
20. International Institute for Population Sciences (IIPS), ORC Macro International.
National Family Health Survey (NFHS-3), 2005-06: India: Volume I. IIPS.
Mumbai:2007.
21. Boerma JT, Weinstein KI, Rutstein SO, Sommerfelt AE. Data on birth weight in
developing countries: Can surveys help? Bull World Health Organ.
1996;74(2):209-216.
22. Qazi S, Khan M, Rizvi T, Khatoon Z, Peterson K. Longitudinal growth patterns of
Pakistani infants in a clinic based growth promotion program. Indian Pediatr.
2003;40(11):1043-1053.
23. Bloom SS, Wypij D, Gupta MD. Dimensions of women's autonomy and the
influence on maternal health care utilization in a north Indian city. Demography.
2001;38(1):67-78.
24. Acharya D, Bell J, Simkhada P, van Teijlingen E, Regmi P. Women's autonomy
in household decision-making: a demographic study in Nepal. Reproductive
Health. 2010;7(1):15.
25. World Health Organization. Physical status: The use and interpretation of
anthropometry. WHO. Geneva, Switzerland:1995.
26. Demographic and Health Surveys. Web site. http://www.measuredhs.com
Accessed August, 2008.

62
27. Hindin MJ. Women’s power and anthropometric status in Zimbabwe. Social Sci
Med. 2000;51:1517-1518.
28. Bindon JR, Vitzthum VJ. Household economic strategies and nutritonal
anthropometry of women in American Samoa and highland Bolivia. Soc Sci Med.
2002;54:1299-1308
29. Dharmalingam A, Navaneetham K, Krishnakumar C. Nutritional status of
mothers and low birth weight in India. Matern Child Health J. 2010;14(2):290-
298.
30. Muthayya S. Maternal nutrition & low birth weight - what is really important?
Indian J Med Res. 2009;130(5):600-608.
31. Mavalankar DV, Gray RH, Trivedi CR. Risk factors for preterm and term low
birthweight in Ahmedabad, India. Int J Epidemiol. 1992;21(2):263-272.
32. Mistry R, Galal O, Lu M. Women's autonomy and pregnancy care in rural India:
A contextual analysis. Soc Sci Med. 2009;69(6):926-933.
33. Malhotra A, Mather M. Do schooling and work empower women in developing
countries? Gender and domestic decisions in Sri Lanka. Sociological Forum.
1997;12(4):599-630.
34. Al Riyami A, Afifi M, Mabry RM. Women's autonomy, education and
employment in Oman and their Influence on contraceptive use. Reprod Health
Matters. 2004;12(23):144-154.
35. Luo Z-C, Wilkins R, Kramer MS: Effect of neighbourhood income and maternal
education on birth outcomes: a population-based study. CMAJ.
2006 ;174(10):1415-1420.
63
36. Margetts BM, Mohd Yusof S, Al Dallal Z, Jackson AA. (2002). Persistence of
lower birth weight in second generation South Asian babies born in the United
Kingdom. J Epidemiol Community Health. 2002;56(9):684-687.
37. Dhall K, bagga R. Maternal determinants of birth weight of North Indian babies.
Inian J Pediatr. 1995;62(3):333-344.
38. United Nations. Millenium Development Goals. 2010. [Available from:
http://www.un.org/millenniumgoals/reports.shtml]
39. The World Bank. Women’s empowerment in Andhra Pradesh. 2010. [Available
from: http://www.worldbank.org.in]
40. Hashemi SM, Schuler SR, Riley AP: Rural credit programs and women's
empowerment in Bangladesh. World Development. 1996;24(4):635-653.

64
Table 3.1: Statistical measures for accuracy of perceived birth size as indicators of birth
weight
Birth weight n (%); mean ± SD
Accuracy measures (%)
Perceived birth size
Normal BW LBW Sensitivity Specificity PPVa NPVb
Large/average
11002 (91.2); 3101.8 ± 513.3
1304 (47.3); 2066.3 ± 259.8
Smaller than average
1057 (8.8); 2803.5 ± 440.1
1451 (52.7); 1849.3 ± 384.8
60.0 89.4 53.0 91.2
a. Positive predictive value
b. Negative predictive value

65
Table 3.2: Descriptive characteristics of the study participants and their households by
regions
Characteristics National estimate
Regionsa
n = 14407
North n= 1495
East n= 2712
North-East n= 456
South n= 4822
Central-West n= 4922
pb
Socio-demographic characteristics
n (%)
Maternal age < 0.00115- 19 922(6.4) 16
(4.5)275
(10.1)21
(4.6)274
(5.7) 285
(5.8)
20-24 5168 (35.9)
472 (31.6)
1031 (38.0)
135 (29.6)
1752 (36.3)
1778 (36.1)
25-29 5124 (35.6)
605 (40.5)
893 (32.9)
146 (32.0)
1688 (35.0)
1792 (36.4)
30-34 2339 (16.2)
269 (18.0)
389 (14.3)
95 (20.8)
796 (16.5)
791 (16.1)
35-39 689 (4.8)
66 (4.4)
101 (3.7)
48 (10.5)
244 (5.1)
230 (4.7)
40+c 165 (1.1)
16 (1.1)
22 (0.8)
20 (2.4)
68 (1.4)
47 (0.8)
Religion < 0.001Hindu 11562
(80.3)1136
(76.0)2309
(85.1)327
(71.7)3831
(79.4) 3959
(80.4)
Muslim 1892 (13.1)
114 (7.6)
355 (13.1)
31 (6.8)
677 (14.0)
715 (14.5)
Christian 442 (3.1)
7 (0.5)
22 (0.8)
78 (17.1)
302 (6.3)
34 (0.7)
Otherd 511 (3.5)
238 (15.9)
26 (1.0)
20 (4.4)
13 (0.3)
214 (4.3)
Type of caste or tribe < 0.001Scheduled caste 2359
(16.4)238
(16.2)537
(20.6)56
(13.6)817
(17.5) 710
(14.5)
Scheduled tribe 874 (6.1)
57 (3.9)
165 (6.3)
132 (32.1)
163 (3.5)
356 (7.3)
Other backward class 5453 (37.9)
365 (24.8)
599 (23.0)
85 (20.7)
2714 (58.3)
1690 (34.6)
None of them (general) 5340 (37.1)
811 (55.1)
1301 (50.0)
138 (33.6)
964 (20.7)
2126 (43.5)
Education level < 0.001No education 2795
(19.4)318
(21.3)643
(23.7)57
(12.5)827
(17.2) 949
(19.3)

66
Primary 1871 (13.0)
144 (9.6)
418 (15.4)
61 (13.4)
716 (14.9)
531 (10.8)
Secondary 7682 (53.3)
701 (46.9)
1399 (51.6)
281 (61.6)
2595 (53.8)
2707 (55.0)
Higher 2059 (14.3)
332 (22.2)
252 (9.3)
57 (12.5)
683 (14.2)
735 (14.9)
Employed Yes 3654
(25.4)319
(21.4)462
(17.0)107
(23.5)1399
(29.1) 1367
(27.8) < 0.001
No 10732 (74.5)
1174 (78.6)
2248 (83.0)
348 (76.5)
3416 (70.9)
3545 (72.2)
Autonomy < 0.001High 2820
(19.6)262
(17.7)393
(14.8)95
(21.4)1044
(22.0) 1027
(21.1)
Medium 7753 (53.8)
797 (53.7)
1401 (52.6)
305 (68.8)
2633 (55.5)
2617 (53.8)
Low 3621 (25.1)
424 (28.6)
870 (32.7)
43 (9.7)
1069 (22.5)
1216 (25.0)
Biomedical characteristics Prenatal care received < 0.001
Yes 13891 (96.4)
1453 (97.2)
2529 (93.3)
435 (95.4)
4752 (98.7)
4721 (95.9)
No 512 (3.6)
42 (2.8)
182 (6.7)
21 (4.6)
65 (1.3)
201 (4.1)
Parity < 0.001Primiparous 5629
(39.1)622
(41.6)1215
(44.8)226
(49.5)1178
(36.9) 1789
(36.3)
Multiparous 8778 (60.9)
874 (58.4)
1496 (55.2)
231 (50.5)
3044 (63.1)
3133 (63.7)
Household characteristics Sex of HH head < 0.001
Male 12858 (89.3)
1367 (91.4)
2374 (87.5)
396 (86.7)
4186 (86.8)
4536 (92.2)
Female 1549 (10.7)
129 (8.6)
338 (12.5)
61 (13.3)
636 (13.2)
386 (7.8)
Socio-economic status Poor 2960
(20.5)113
(7.6)951
(35.1)78
(17.1)886
(18.4) 932
(18.9) < 0.001
Middle 2682 (18.6)
166 (11.1)
528 (19.5)
126 (27.6)
1164 (24.1)
698 (14.2)
Rich 8765 (60.8)
1216 (81.3)
1232 (45.4)
253 (55.4)
2772 (57.5)
3292 (66.9)
a. North: Jammu & Kashmir, Himachal Pradesh, Haryana, Punjab, Delhi, Uttar Pradesh,
Uttaranchal; East: Bihar, Jharkhand, Chhattisgarh, West Bengal, Orissa; North-East:
67
Assam, Arunachal Pradesh, Manipur, Meghalaya, Mizoram, Nagaland, Sikkim, Tripura;
South: Andhra Pradesh, Karnataka, Kerala, Tamil Nadu; Central-west: Maharashtra,
Goa, Gujarat, Madhya Pradesh, Rajasthan.
b. Significant difference between maternal characteristics by region (χ2 test)
c. Includes women aged 40–49 years. d. Other religions: Sikh, Buddhist, Zoroastrian, Doni-polo, and no religion.
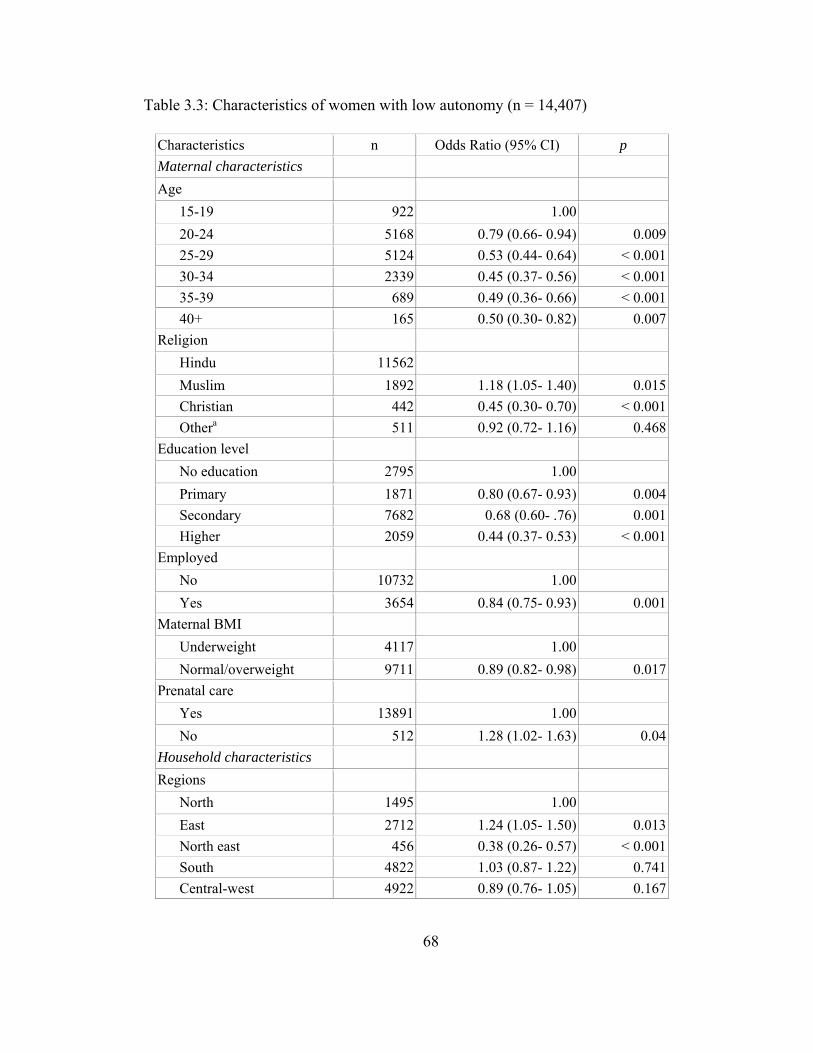
68
Table 3.3: Characteristics of women with low autonomy (n = 14,407)
Characteristics n Odds Ratio (95% CI) p Maternal characteristics Age
15-19 922 1.00 20-24 5168 0.79 (0.66- 0.94) 0.00925-29 5124 0.53 (0.44- 0.64) < 0.00130-34 2339 0.45 (0.37- 0.56) < 0.00135-39 689 0.49 (0.36- 0.66) < 0.00140+ 165 0.50 (0.30- 0.82) 0.007
Religion Hindu 11562 Muslim 1892 1.18 (1.05- 1.40) 0.015Christian 442 0.45 (0.30- 0.70) < 0.001Othera 511 0.92 (0.72- 1.16) 0.468
Education level No education 2795 1.00 Primary 1871 0.80 (0.67- 0.93) 0.004Secondary 7682 0.68 (0.60- .76) 0.001Higher 2059 0.44 (0.37- 0.53) < 0.001
Employed No 10732 1.00 Yes 3654 0.84 (0.75- 0.93) 0.001
Maternal BMI Underweight 4117 1.00 Normal/overweight 9711 0.89 (0.82- 0.98) 0.017
Prenatal care Yes 13891 1.00 No 512 1.28 (1.02- 1.63) 0.04
Household characteristics Regions
North 1495 1.00 East 2712 1.24 (1.05- 1.50) 0.013North east 456 0.38 (0.26- 0.57) < 0.001South 4822 1.03 (0.87- 1.22) 0.741Central-west 4922 0.89 (0.76- 1.05) 0.167
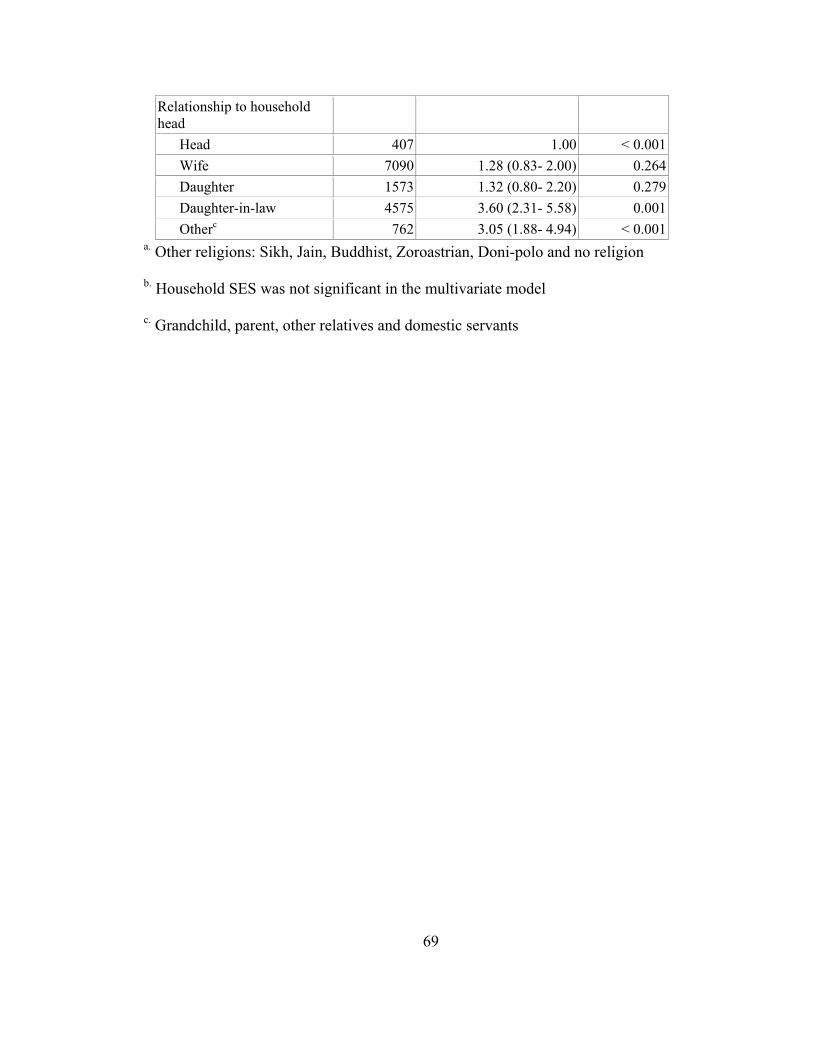
69
a. Other religions: Sikh, Jain, Buddhist, Zoroastrian, Doni-polo and no religion
b. Household SES was not significant in the multivariate model
c. Grandchild, parent, other relatives and domestic servants
Relationship to household head
Head 407 1.00 < 0.001Wife 7090 1.28 (0.83- 2.00) 0.264Daughter 1573 1.32 (0.80- 2.20) 0.279Daughter-in-law 4575 3.60 (2.31- 5.58) 0.001Otherc 762 3.05 (1.88- 4.94) < 0.001

70
Table 3.4: Predictors of birth weight (n = 14,407)
Low birth weight
Independent variables n Unadjusted
Odds ratio (95% CI)
p Adjusted Odds ratio (95% CI)
p
Maternal characteristics Autonomy
High 2820 1.00 1.00 Medium 7753 1.12 (1.03-
1.25) 0.040 1.05 (0.91- 1.30) 0.520
Low 3621 1.40 (1.22- 1.57)
0.001 1.28 (1.07- 1.53) 0.007
Education level No education 2795 1.00 1.00 Primary 1871 0.95 (0.83-
1.09) 0.645 0.94 (0.78- 1.12) 0.510
Secondary 7682 0.70 (0.63- 0.78)
0.001 0.78 (0.67- 0.92) 0.003
Higher 2059 0.47 (0.41- 0.55)
0.001 0.48 (0.37- 0.64) < 0.001
Religion Hindu 11562 1.00 1.00 Muslim 1892 0.95 (0.84-
1.08) 0.461 0.87 (0.72- 1.07) 0.193
Christian 442 0.80 (0.62- 1.03)
0.086 0.93 (0.60- 1.45) 0.744
Otherc 511 1.24 (1.01- 1.53)
0.041 1.23 (0.91- 1.66) 0.183
Prenatal care received Yes 13891 1.00 1.00 No 512 2.01 (1.61-
2.45) 0.001 1.70 (1.32- 2.20) < 0.001
Nutritional status Underweight 4117 1.00 1.00 Normal/overweight 9711 0.67 (0.62-
0.74) < 0.001
0.69 (0.61- 0.78) < 0.001
Household characteristics
Region North 1495 1.00 1.00 East 2712 0.70 (0.60-
0.81) 0.001 0.50 (0.40- 0.63) < 0.001
North- East 456 0.55 (0.42- 0.73)
0.001 0.38 (0.24- 0.61) < 0.001
South 4822 0.53 (0.46- 0.61)
0.001 0.63 (0.52- 0.76) < 0.001
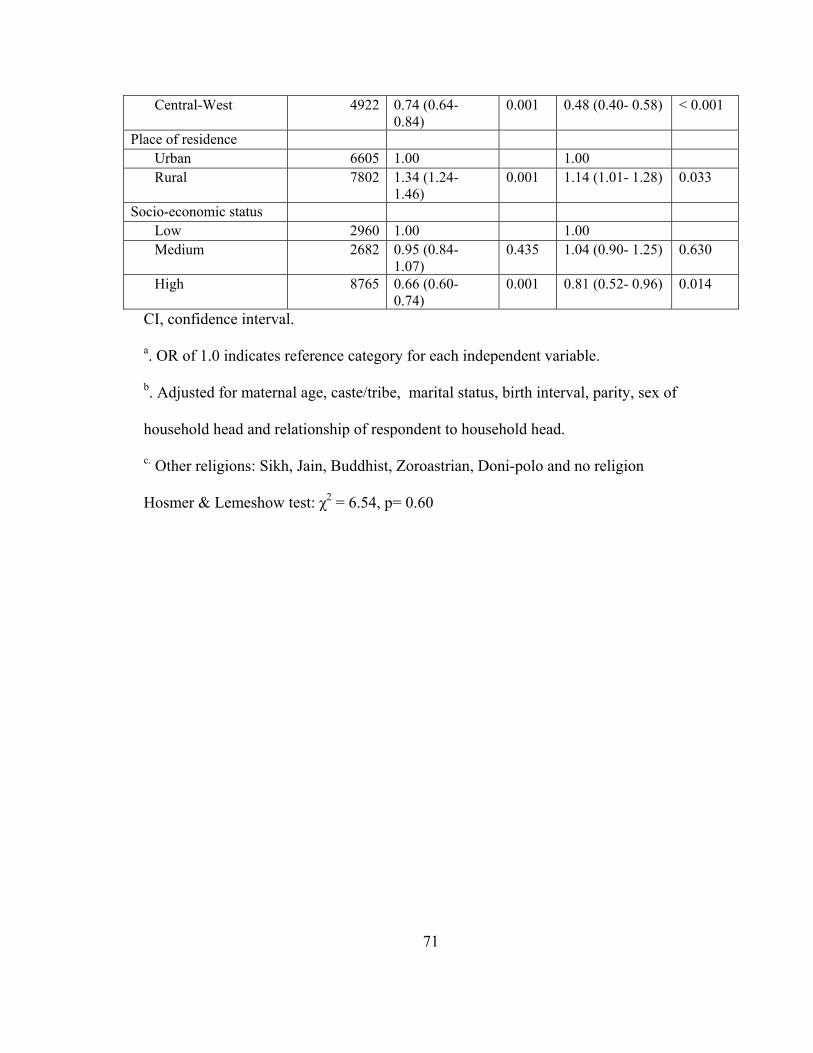
71
Central-West 4922 0.74 (0.64- 0.84)
0.001 0.48 (0.40- 0.58) < 0.001
Place of residence Urban 6605 1.00 1.00 Rural 7802 1.34 (1.24-
1.46) 0.001 1.14 (1.01- 1.28) 0.033
Socio-economic status Low 2960 1.00 1.00 Medium 2682 0.95 (0.84-
1.07) 0.435 1.04 (0.90- 1.25) 0.630
High 8765 0.66 (0.60- 0.74)
0.001 0.81 (0.52- 0.96) 0.014
CI, confidence interval.
a. OR of 1.0 indicates reference category for each independent variable.
b. Adjusted for maternal age, caste/tribe, marital status, birth interval, parity, sex of
household head and relationship of respondent to household head.
c. Other religions: Sikh, Jain, Buddhist, Zoroastrian, Doni-polo and no religion
Hosmer & Lemeshow test: χ2 = 6.54, p= 0.60
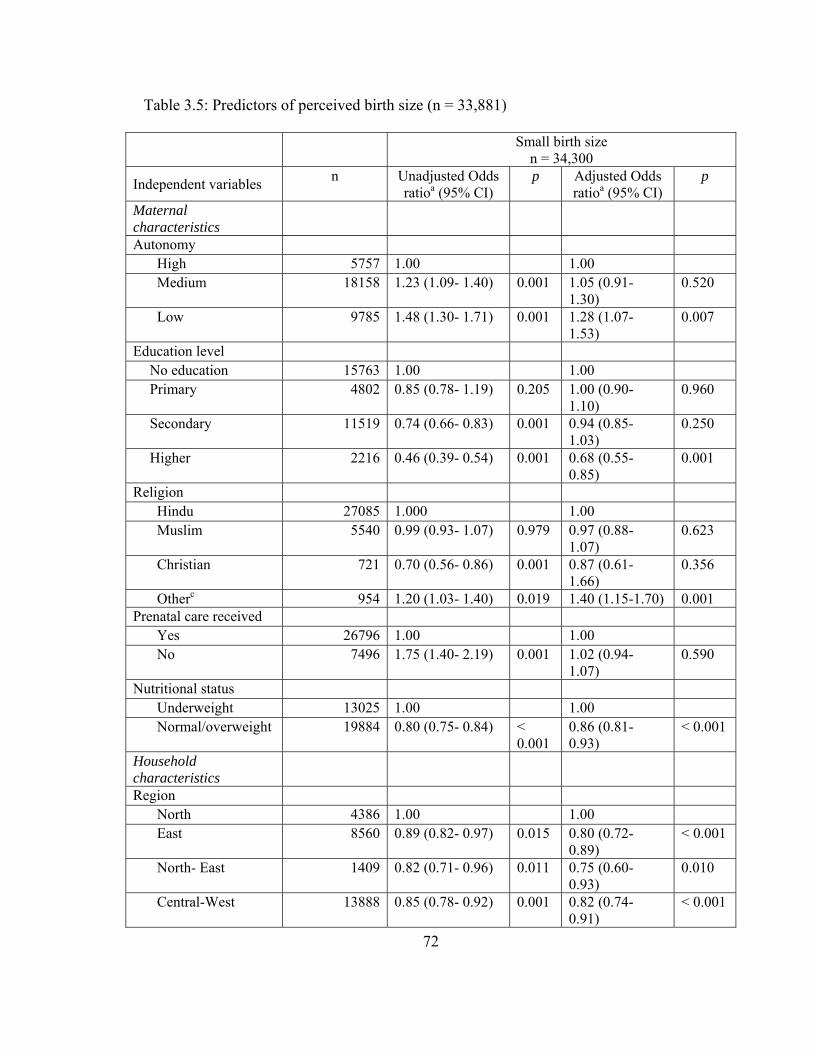
72
Table 3.5: Predictors of perceived birth size (n = 33,881)
Small birth size n = 34,300
Independent variables n Unadjusted Odds ratioa (95% CI)
p Adjusted Odds ratioa (95% CI)
p
Maternal characteristics
Autonomy High 5757 1.00 1.00 Medium 18158 1.23 (1.09- 1.40) 0.001 1.05 (0.91-
1.30) 0.520
Low 9785 1.48 (1.30- 1.71) 0.001 1.28 (1.07- 1.53)
0.007
Education level No education 15763 1.00 1.00 Primary 4802 0.85 (0.78- 1.19) 0.205 1.00 (0.90-
1.10) 0.960
Secondary 11519 0.74 (0.66- 0.83) 0.001 0.94 (0.85- 1.03)
0.250
Higher 2216 0.46 (0.39- 0.54) 0.001 0.68 (0.55- 0.85)
0.001
Religion Hindu 27085 1.000 1.00 Muslim 5540 0.99 (0.93- 1.07) 0.979 0.97 (0.88-
1.07) 0.623
Christian 721 0.70 (0.56- 0.86) 0.001 0.87 (0.61- 1.66)
0.356
Otherc 954 1.20 (1.03- 1.40) 0.019 1.40 (1.15-1.70) 0.001 Prenatal care received
Yes 26796 1.00 1.00 No 7496 1.75 (1.40- 2.19) 0.001 1.02 (0.94-
1.07) 0.590
Nutritional status Underweight 13025 1.00 1.00 Normal/overweight 19884 0.80 (0.75- 0.84) <
0.001 0.86 (0.81- 0.93)
< 0.001
Household characteristics
Region North 4386 1.00 1.00 East 8560 0.89 (0.82- 0.97) 0.015 0.80 (0.72-
0.89) < 0.001
North- East 1409 0.82 (0.71- 0.96) 0.011 0.75 (0.60- 0.93)
0.010
Central-West 13888 0.85 (0.78- 0.92) 0.001 0.82 (0.74- 0.91)
< 0.001

73
South 6057 0.67 (0.61- 0.74) 0.001 0.66 (0.58- 0.75)
< 0.001
Place of residence Urban 9455 1.00 1.00 Rural 24845 1.24 (1.13- 1.35) 0.001 1.03 (0.94-
1.13) 0.463
Socio-economic status Low 15313 1.00 1.00 Medium 6711 0.86 (0.80- 0.92) 0.001 0.87 (0.80-
0.96) 0.003
High 12277 0.67 (0.63- 0.72) 0.001 0.74 (0.67- 0.81)
< 0.001
CI, confidence interval.
a. OR of 1.0 indicates reference category for each independent variable.
b. Adjusted for maternal age, caste/tribe , marital status, birth interval, parity, sex of
household head and relationship of respondent to household head.
c. Other religions: Sikh, Jain, Buddhist, Zoroastrian, Doni-polo and no religion
Hosmer & Lemeshow test: χ2 = 5.34, p= 0.72
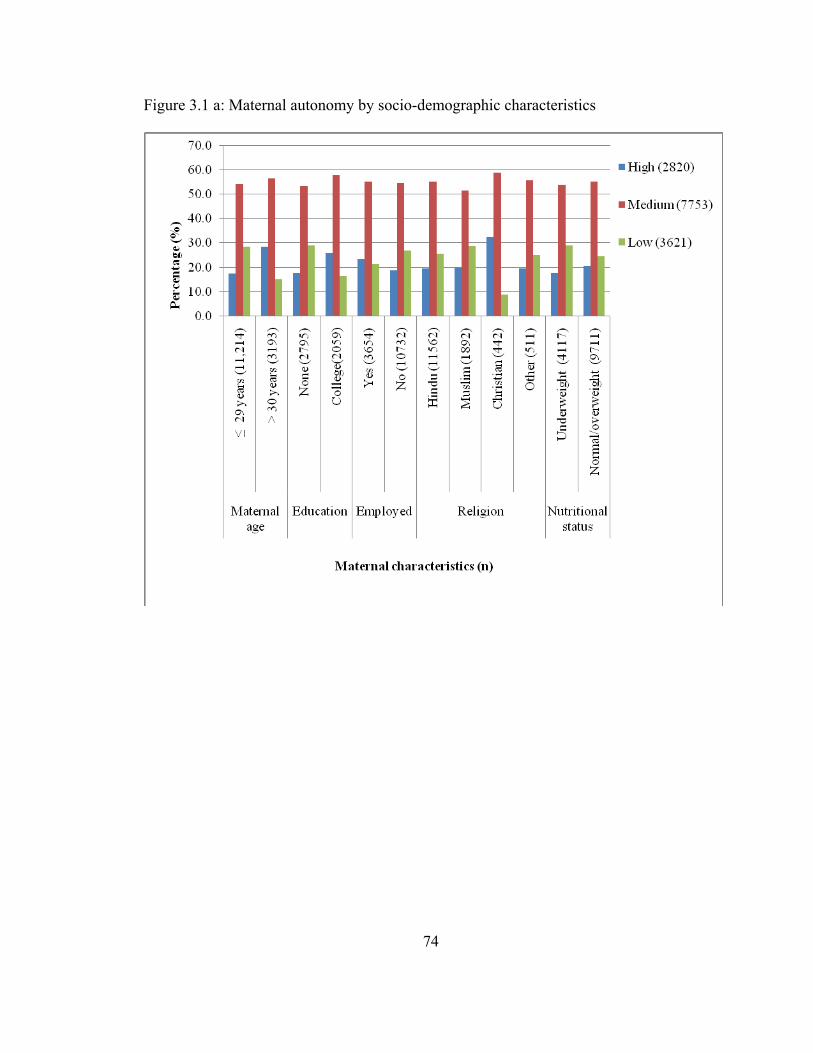
74
Figure 3.1 a: Maternal autonomy by socio-demographic characteristics
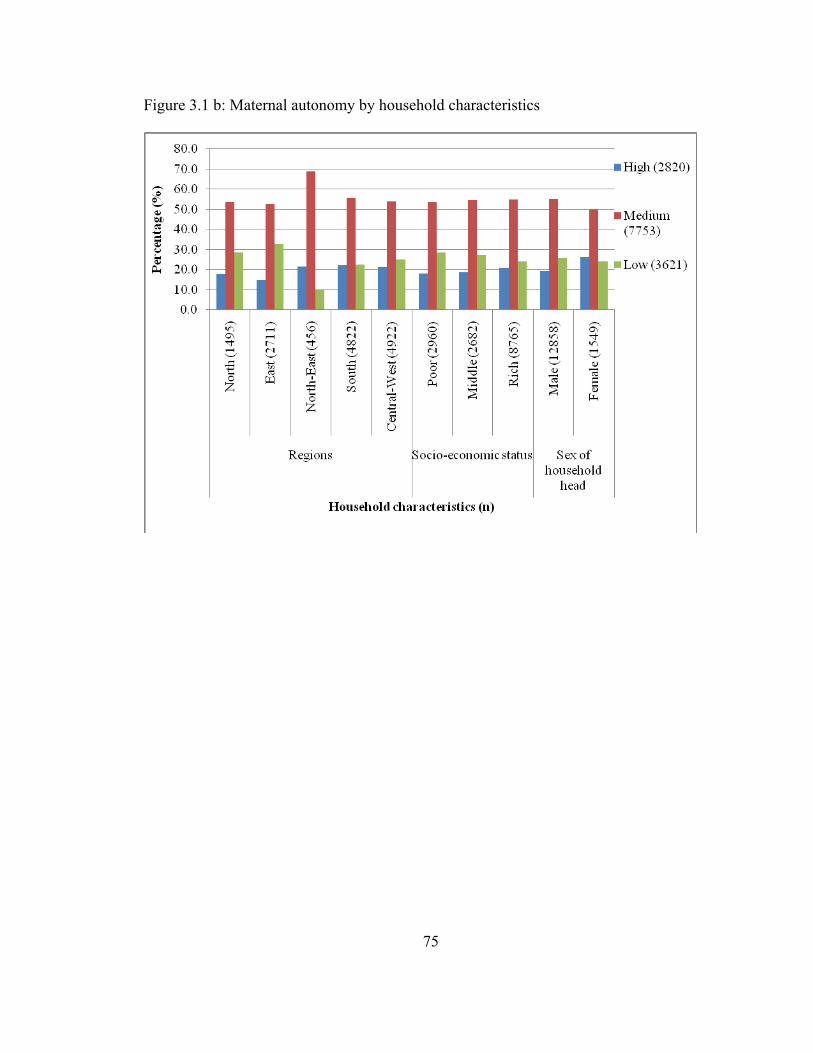
75
Figure 3.1 b: Maternal autonomy by household characteristics

76
**
Figure 3.2 a: Prevalence of pregnancy outcome by region
Regions: North: Jammu & Kashmir, Himachal Pradesh, Haryana, Punjab,
Delhi, Uttar Pradesh, Uttaranchal; East: Bihar, Jharkhand, Chhattisgarh, West
Bengal, Orissa; North-East: Assam, Arunachal Pradesh, Manipur, Meghalaya,
Mizoram, Nagaland, Sikkim, Tripura; South: Andhra Pradesh, Karnataka,
Kerala, Tamil Nadu; Central-west: Maharashtra, Goa, Gujarat, Madhya
Pradesh, Rajasthan
*. Significant difference between pregnancy outcomes by region, p < 0.001
(χ2 test)

77
Figure 3.2 b: Prevalence of pregnancy outcome by urban and rural areas
*. Significant difference between LBW prevalence by urban and rural areas, p < 0.001
(χ2 test)
78
CHAPTER 4
HOUSEHOLD AND INDIVIDUAL FACTORS ASSOCIATED WITH
UNDERNUTRITION OF CHILDREN < 3 YEARS FROM INDIA1
1 Chakraborty, P. and A. K. Anderson. To be submitted to Maternal & Child Nutrition.
79
Abstract
This is a secondary data analysis using the National Health and Family Survey
(NFHS) conducted between 1992 and 2006. The main aims of the study were to examine
the prevalence and predictors of undernutrition in children aged 0-35 months in India.
Childhood nutritional status was assessed using the WHO growth standards for height-
for-age (HAZ), weight-for-age (WAZ) and weight-for-height (WHZ) and WHO
recommended cut-off values for hemoglobin level. Weighted descriptive and ordinal
logistic regression analyses were used. The proportional odds ratio for the associations
between nutrition status and dependent variables was estimated suing the ordinal logistic
regression. There was a notable decline in the prevalence of stunting and underweight
between the first and last survey waves (1992- 2006), while prevalence of wasting
remained almost unchanged. There was a slight increase in the prevalence of anemia
between the second and third survey waves. Children from East and Central-west regions
showed the highest prevalence of undernutrition. Our multivariate analysis showed that
maternal illiteracy, employment, rural residence, socio-economic status and diet quality
were significant independent predictors of undernutrition. Factors such as household
structure and immunization status were not independent predictors in the multivariate
analysis. However, significant interaction was observed between diet quality and
immunization status for the indicators of undernutrition confirming the importance of up-
to-date immunization for optimal nutritional status of children. Children residing in joint
households with grandparents were also protected against chronic undernutrition, i.e.
stunting. The results from this study confirm urban-rural and socio-economic disparity in

80
nutritional outcomes of children in India. Hence, the need for programs and policies to
close these gaps in India.
81
Introduction
The nutritional status of children has been successfully assessed by the use of the
anthropometric indices such as height and weight, and biomarkers such as hemoglobin (1,
2). Height and weight measurements have been used to derive indicators for
undernutrition such as stunting (low height-for-age), wasting (low weight-for-height) and
underweight (low weight-for-age). Stunting, the indicator of chronic undernutrition, may
be due to extended food deprivation and/or illnesses, while wasting indicates acute or
more recent undernutrition. Underweight on the other hand may reflect both chronic and
acute undernutrition without making a definite distinction between them (3). Hemoglobin
level, an indicator of iron nutriture is one of the most common biomarker used for
population based assessment of iron status and iron deficiency anemia (2).
Undernutrition among young children is closely associated with lowered immune
system (4) and incidence of infectious diseases (5), predisposing them to severe
undernutrition and morbidity. It is also one of the leading causes of under-five mortality
in developing countries (6). According to UNICEF, the basic underlying causes of
undernutrition are dietary insufficiency and recurring infections. With decreased nutrient
intake, immune system weakens resulting in further aggravation of the disease condition
(7). Furthermore, undernourished children are at a higher risk of developing functional
impairment in adult life, thereby negatively affecting economic productivity and the
society as a whole (8).
National survey data from 22 developing countries reported an overall decrease of
chronic undernutrition by 3.0% over the years (8). In spite of this, the overall prevalence
of stunting (34.0%), underweight (23.0%) and wasting (13.0%) remains high (7). In

82
addition, iron deficiency anemia afflicts more than 40.0% of pre-school children in
developing countries and is deemed to be a severe public health problem (9). These
statistics are evidence that undernutrition is a public health burden in these countries.
While a number of countries in Asia are hard hit, the observed prevalence of underweight
(16.0%) and stunting (48.0%) among children in India is one of the highest in this region
(7).
Previous studies have examined the influence of socio-demographic factors on the
nutritional status of children (10). Household income, parental educational level and
dietary habits were major contributors of weight gain in children living in low-income
area in Kolkata, India (10). Children from low socio-economic households were found to
have twice the risk of being stunted than children from rich households in Ghana (11). A
recent study from Northeastern Brazil reported a significant decline in child
undernutrition by increasing years of maternal education, economic status and health care
facilities (12). Studies have also demonstrated the influence of place of residence on the
nutritional status of children (13). Shen et al. (1996) have observed that despite economic
reforms in both rural and urban China, a higher percentage of rural children aged 2 to 5
years (38.0%) were stunted as compared with urban children (10%). Also, poor social
and economic conditions for the child are important factors associated with the
occurrence of anemia (14).
In addition, feeding practices have long been recognized as potential determinant
of children’s nutritional status (15). Inadequate intake of macro and micro-nutrients by
children < 5 years were found to have a negative influence on their nutritional status (16,
17). Delayed initiation of breastfeeding and improper weaning practices have been
83
identified as important dietary risk factors for undernutrition among children < 5 years
(18).
Over the past years, India has witnessed few changes in feeding practices for
infants and children. The National Family and Health Survey reports indicate that
breastfeeding is universally practiced by more than 90.0% of Indian women (19- 21).
However, breastfeeding initiation within the first hour of birth has remained relatively
low (24.5%), in spite of its increase since the first survey wave (9.5%) (19- 21).
Moreover, rates of exclusive breastfeeding for infants < 4 months have remained constant
at around 50.0%. On the other hand it is of concern to note that more than 50.0% of
infants at 6-9 months are fed liquids such as cow’s milk but do not receive solid foods,
thereby increasing their risks of nutritional deficiencies (19- 21).
The prevalence of undernutrition and the impact of socio-economic disparities
(10, 22, 23) and feeding practices (24, 25) on children’s nutritional status in India have
been previously examined. Som et al. in 2007, examined factors influencing child
stunting from 3 states of India, namely Bihar, Kerala and West Bengal and reported the
influence of child feeding practices and maternal education on stunting (26). However,
literature on the relationship between regional disparities, household characteristics, diet
quality and undernutrition in India is limited. The current study therefore aims to examine
the different predictors of undernutrition at the individual and household levels and the
interplay between each of these predictors.
84
Methods
Study design and data
This study is a secondary data analysis of the third wave of India’s National
Family Health Survey (NFHS 3) conducted from 2005-2006 (20). This is a nationally
representative multi-stage household survey that interviewed women in the reproductive
age group (15-49 years) from the states of India, covering 124,285 women. Details about
the data collection and sample stratification are reported elsewhere (20).
To compare the regional prevalence of childhood undernutrition (stunting,
underweight, wasting and anemia), the country was divided into 5 geographical regions:
North, East, North-East, South and Central-West regions (20). Prevalence of
undernutrition was also examined by place of residence (urban and rural) of the index
children. We also examined the trend in undernutrition prevalence over the three survey
waves (NFHS 1-3) from 1992-2006.
Subjects
For the purpose of this study, information pertaining to non-pregnant women at
the time of interview with a child < 5 years (index child) from singleton births, with
complete anthropometric measurements (height and weight) was extracted. The final
analytical sample-size for NFHS 3 and the pooled data (NFHS 1, 2 and 3) set were
19,918 and 53,834, respectively.
Outcome measure
The World Health Organization’s (WHO) growth standards for children aged
below 5 years were used to categorize their nutritional status (2). Height-for-age z-score
was categorized as normal (HAZ ≥ -2.0 SD), mild stunting (-2.0 SD > HAZ ≥ -3.0 SD)

85
and severe stunting (HAZ < -3.0 SD). Normal weight-for-age and weight-for height as z-
scores ≥ -2.0 SD. Moderate underweight/wasting and severe underweight/wasting as -2.0
SD > WAZ/WHZ ≥ -3.0 SD and WAZ/WHZ < -3.0 SD, respectively. Hemoglobin level
of the index child aged 6-35 months was categorized as severe anemia (Hb ≤ 7.0 g/dl),
moderate/mild anemia (10.9 g/dl ≥ Hb > 7.0 g/dl) and non-anemic (Hb ≥ 11.0g/dl) (2).
Independent variables
Independent variables examined included socio-demographic characteristics,
household characteristics, feeding practices and immunization status of the child.
Variables on socio-demographic characteristics were maternal age, religion, education
and employment status, and age and gender of the index child. Household characteristics
examined were geographic location, i.e. urban/rural residents and region, socio-economic
status (SES) and household type. For the purpose of this study we created several
variables as discussed below:
Household socio-economic status (SES): We used the wealth indices, computed
from household ownership of assets and housing characteristics (20) to categorize
household SES as poor, medium and high.
Type of household: Household type was classified as nuclear and joint based on
the mother’s response. Nuclear households comprised of the index child living with
parents and other siblings (if any), while joint households comprised of index child living
with parents and/or siblings and other family members. We further categorized joint
households as joint with child’s grandparents/joint without child’s grandparents with
respect to the mother’s relationship to the household head (daughter-in-law/daughter).

86
Diet Quality: Feeding practices were captured using variables describing the
duration of the child being breastfed, frequency of receiving solid foods and foods
received 24 hours prior to the survey. Foods received by the child were further grouped
as protein (meat, beans, pulses, nuts, eggs, milk and milk products) rich foods, cereal and
cereal products (porridge, bread and other grain products), fruits and vegetables
(potatoes, tubers, green leafy vegetables, yellow or orange fruits and vegetables) and fats
and oil. To assess overall diet quality we computed a score based on the different food
group consumption and frequency of receiving these foods by the child as reported by the
mother. The score (mean: 6.98 ± 4.62, range: 0 to 32) was further divided into tertiles and
categorized as ‘poor’ = 0-5, ‘medium’ = 6-8 and ‘good’ = ≥ 9. Breastfeeding status was
considered in computing the diet quality score for infants < 6 months. As per the
mother’s report, infants being breastfed and not consuming any other liquid/solid food
items were identified as having good diet quality. Similarly, infants being breastfed and
also consuming some liquid/solid foods were categorized as having a medium diet
quality. Poor diet quality indicated not being breastfed but receiving other liquid/solid
foods.
Immunization status: Information on immunizations received by the child was
obtained from health card or mother’s recall. A cumulative vaccine score (range: 0 to 9)
was created based on whether the child had received the recommended vaccines till age 9
months. These are namely BCG (1 dose), Polio (4 doses), DPT (3 doses) and measles (1
dose) according to the National Immunization Schedule (27). The score was further
categorized as ‘up-to-date immunization,’ ‘some/incomplete immunization’ and ‘no
immunization’ taking into consideration the age of the child and vaccines received. For
87
example, index child < 2 months and having received BCG and Polio (score = 2) was
classified as having ‘up-to-date immunization’ status. Children (< 2 months) with a score
= 1 were classified as having ‘incomplete immunization’ status and those with score = 0
as having ‘no immunization.’
Statistical Analysis
The NFHS data sets were downloaded from Measure DHS (28), and analyzed
using SPSS for windows version 16.0 (SPSS Inc, Chicago, IL). A sample weight
(national women’s weight) was used to adjust for oversampling and non-response from
various places within the country. Descriptive characteristics are reported as weighted
percentage, means and standard deviations. Prevalence of undernutrition is reported as
weighted percentages. Bivariate comparisons of undernutrition prevalence, feeding
practices and immunization coverage by regions were examined with chi-square tests.
The nutritional status of the children was grouped into 3 ordinal categories namely
normal, mildly undernourished (mild stunting, underweight, wasting and anemia) and
severely undernourished (severe stunting, underweight, wasting and anemia). To examine
the predictors of nutritional status we used the proportional odds model (ordinal logistic
regression analyses). The normal height-for-age, weight-for-age, weight-for-height and
hemoglobin categories were used as the reference categories in the ordinal logistic
regression analysis. Variables that came up significant in the univariate analyses were
further examined in the multivariate models to determine the independent influence of the
variable on nutritional status, after adjusting for other important covariates. The
correlation between birth weight and the nutrition indicators was weak and explained
only about 5.0% of the variability for each of them. The individual correlation

88
coefficient between birth weight and the four indicators are as follows: HAZ:r = 0.16, p
< 0.001, WAZ: r = 0.25, p < 0.001, WHZ: r = 0.15, p < 0.001 and hemoglobin level: r =
0.05, p < 0.001. However, based on previous studies indicating the influence of birth
weight on nutrition indicators, the multivariable models were adjusted for this covariate.
We also examined interactions between several independent variables in the multivariate
model. All results were considered significant if p < 0.05.
Results
Characteristics of study participants and households from NFHS 3
Descriptive characteristics of the participants and their households are presented
in Table 4.1. More than 60.0% of the mothers were aged between 20- 29 years, with a
mean age of 25.7 ± 5.3 years. Nearly 80.0% of the mothers were Hindu, while the
remaining belonged to Muslim, Christian, Sikh and other minor religions (Buddhist, Jain,
Zoroastrian, Doni-polo and no religion). With respect to education levels, a greater
proportion (47.6%) of the mothers had no formal education, while only 5.7% had
received higher or college education (Table 4.1). The mean age of the index children
included in the analysis for height and weight indicators was 16.18 ± 9.7 months (range:
0 to 35 months) while mean age of children examined for anemia was 18.80 ± 8.50
months (range: 6-35 months). Notable characteristic of the households were that majority
(75.3%) were resided in rural areas. Nearly 47.0% of the households were of low socio-
economic status while the remaining were either middle income (19.6%) or high income
(33.8%) households. Household structures included nuclear and joint families

89
with/without the child’s grandparents (Table 4.1). Also, 90.0% of the households were
headed by a male member.
Nutritional status of children aged 0- 35 months: NFHS 1-3
The three survey waves of NFHS were used to assess the trend of undernutrition
(stunting, underweight, wasting) prevalence over the years. The prevalence of child
undernutrition significantly varied in the three survey waves (Figure 4.1; p < 0.001).
There was a notable decline in the prevalence of stunting and underweight between
NFHS 1 (1992-1993) and NFHS 3 (2005-2006). While 43.0% of the children were
stunted in NFHS 3, it was as high as 50.0% in NFHS 1. A 7.0% decline in underweight
was also observed across the three survey waves. However, prevalence of wasting was
almost similar for NFHS 1 (25.7%) and 3 (24.2%), with a slight decline (21.1%) for
NFHS 2. There was a slight increase in mild/moderate anemia prevalence between
NFHS 2 (65.4%) and NFHS 3 (75.6%) while severe anemia prevalence decreased from
4.8% to 3.6% during the two survey waves. Hemoglobin levels for children were not
measured in NFHS 1.
Distribution of the nutritional status of index children from the third survey wave
(NFHS 3) by regions and urban/rural residence is presented in Figure 4.2 (a- d). The
mean z-scores for HAZ, WAZ and WHZ and hemoglobin level were lower among rural
children compared to their urban counterparts (Figure 4.2 a-d). Children from Central-
west rural areas had the lowest HAZ scores while the mean z-scores for WAZ and WHZ
was lowest for rural East region compared to children from rural areas of the other
regions (Figures 4.2a- 3c). Also with respect to hemoglobin level, children from Central-
west rural areas had the lowest level, while it was observed to be highest among children

90
from urban East and North east regions (Figure 4.2d). We observed a significant regional
difference in the prevalence of undernutrition (Table 4.2). The prevalence of mild
stunting (24.7%) and severe stunting (22.8%) were profound in the East and Central-west
regions respectively (p < 0.001; Table 4.2) as compared to North, North east and South
regions. Also, a higher proportion of children from East region were severely
underweight (19.0%) and wasted (9.4%). In contrast, the highest prevalence of severe
anemia was observed in North (5.9%) and Central-west (4.1%) regions (Table 4.2).
However, children from the South region had better nutritional status, compared to their
counterparts from the other regions (Table 4.2). Undernutrition prevalence in some states
was higher than others. The highest prevalence of undernutrition, i.e. stunting (46.2%),
underweight (54.0%), wasting (34.6%) and anemia (88.0%) were observed in Bihar
(East). Other states with poor growth indicators were Jharkhand and Chhattisgarh in the
East and Madhya Pradesh in the Central west regions (data not shown). In contrast, more
than 70.0% of children were of normal height-for-age category in Sikkim (71.3%) and
Manipur (74.4%) in the North east, Goa (77.0%) in the Central west and Kerala (72.0%)
in the South. Majority of children of normal weight-for-age and weight-for-height were
from the states of Sikkim (83.3% and 86.3%), Mizoram (85.5% and 88.6%), Manipur
(82.3% and 88.6%), Goa (81.1% and 87.1%) and Kerala (77.5% and 83.3%). In addition,
non-anemic children belonged to Manipur (46.0%), Mizoram (44.0%), Goa (50.0%), and
Kerala (43.2%).
Characteristics of children with poor nutritional status
The results of chi-square tests examining the different characteristics of children
with normal, low and very low HAZ, WAZ and WHZ scores are presented in Table 4.3.
91
As shown in Table 4.3, higher proportions of children aged 13-24 months had poor
indicators for all the three categories status compared to children in the other age groups
(p < 0.001). The prevalence of undernutrition was also more pronounced among male
children (> 50.0%) compared to their female counterparts. Results from the chi-square
test also showed a significant association (p < 0.001) between maternal socio-
demographic characteristics (age, religion, education level and employment status) and
the different nutrition indicators (Table 4.3).
Household characteristics such as socio-economic status (SES) and household
type also had significant association with each of the nutrition indicators (Table 4.3).
Majority (> 50.0%) of the mildly undernourished or severely undernourished (59.0% -
69.0%) children were from households with poor SES (p < 0.001; Table 4.3). Among the
three types of households (nuclear, joint with/without grandparents), children from
nuclear families were more likely to be undernourished compared to those from joint
family households (Table 4.3). The characteristics of children with normal hemoglobin
level, and mild/moderate and severe anemia were similar to our above observations
(Appendix A).
The associations between feeding practices and nutritional status of the index
child are presented in Table 4. A sub-analysis of infant feeding practices for index
children < 6 months of age revealed no significant association between breast feeding
practices (exclusive breastfeeding and BF on demand) with their current nutritional status
(data not shown). The quality of the child’s diet, and consuming the following: protein
rich foods (animal and plant proteins), fruits and vegetables, cereals and fats and oils
were all significantly associated with the child’s nutritional status (Table 4.4). A very
92
high prevalence of severe underweight (77.0%) and severe wasting (84.0%) were
observed among children whose mothers reported did not consume any protein rich foods
compared to children who received animal and/or plant proteins. Higher prevalence of
poor nutrition status was also noted among children not fed fruits and vegetables and fats
and oils according to mothers report. Contrast to this, prevalence of undernutrition was
higher among children who received cereals and cereal based products compared to
children who did not consume this food group (Table 4.4). Prevalence of undernutrition
was significantly higher among children fed a diet of poor quality compared to their
counterparts who were reported to consume a diet of good quality (Table 4.4). Similarly,
prevalence of mild/moderate and severe anemia were lower among children fed protein
rich foods and diet of good quality. However, children consuming cereals and related
products were more likely to be anemic (Figure 4.3).
Immunization status was significantly associated with the nutritional indicators
examined (p < 0.001). Children with incomplete/some immunization or no immunization
were significantly undernourished, compared to children with up-to-date immunization
(Figure 4.4). Prevalence of stunting, underweight, wasting and anemia were 36.1%,
31.0%, 17.7% and 73.2% respectively, among children with up-to-date immunization. In
contrast, 41.2%, 42.0%, 30.0% and 82.5% of the children with no immunization were
either stunted, underweight, wasted or anemic, respectively (Figure 4.4).
Feeding practices and immunization coverage by region and state
We observed significant regional differences between feeding practice and
immunization status of children (p < 0.001). Percentage of children receiving diets of
good quality was highest in the East (51.2%) and South (50.0%) regions, followed by

93
North east (45.6%), Central-west (40.0%) and North (37.8%). However, only 20.0% of
children in the East region had received up-to-date immunization, compared to 53.4% in
the South. Up-to-date immunization rates in the North, North east and Central west
regions were 27.2%, 17.0% and 22.1% respectively. From examination of the individual
states, we observed that percentage of children receiving a diet of good quality was
lowest in the Eastern states of Jharkhand (39.2%) and Bihar (49.1%) and Central-west
state of Madhya Pradesh (41.0%). In contrast, Kerala (83.4%) and Goa (77.4%) had the
highest proportion of children receiving good diet quality. More than 50.0% of children
in Sikkim (43.0%), Manipur and Mizoram in the North east were reported to consume a
diet of good quality. With respect to immunization status, nearly 72.0% of children in
Kerala and Goa had received up-to-date immunization. This was relatively lower in
Sikkim (43.0%) and Mizoram (23.2%) in the North east and lowest in Bihar (10.6%).
Determinants of nutritional status
Univariate ordinal logistic regression: The results of univariate ordinal logistic
regression examining the determinants of nutritional status of children are presented in
Table 4.5. Maternal socio-demographic characteristics, household features and feeding
practices were significantly associated with the three indicators of nutritional status.
Unlike the results from our chi-square analysis (Table 4.3), maternal age between 20-29
years was an important determinant of normal nutritional status. Children whose mothers
reported being Christian, Sikh and Jain were more likely, while those of mothers
following other religions were less likely to be of normal height-for-age compared to
children of mothers practicing Hinduism (Table 4.5). With respect to underweight and
wasting, Sikh children were more likely to have normal weight-for-age (OR = 2.46, 95%

94
CI = 1.85- 3.28, p < 0.001) and weight-for-height (OR = 2.42, 95% CI = 1.67- 3.49, p <
0.001). Furthermore, Christian and Jain children were more likely to have normal
hemoglobin level compared to children of Hindu mothers. Similar to the findings from
the bivariate analysis (Table 4.3), children of mothers with higher than secondary
education, were nearly 50.0% more likely to have normal nutritional indicators (Table
4.5). Interestingly, children of mothers employed in income generating services were less
likely to have a normal nutritional status compared to children of mothers who were
employed.
We observed significant associations between the geographic location of
household resident (region and urban or rural areas), household SES and structure, and
the nutritional status of the index child (Table 4.5). Children from rural households were
less likely to have normal indicators for nutrition status (Table 4.5). Among the five
regions, children from the South had higher probability of being well nourished, i.e. had
normal nutrition indicators, as compared to children from North regions. In addition,
children from North-East region were also more likely to be non-anemic, as compared to
children from North region. Higher SES household was a significant determinant of
normal nutritional status, compared to middle and low SES households (Table 4.5).
While joint households had a protective effect on the child’s nutritional status as
compared to nuclear households, joint households with the child’s grandparents had a
higher odds of having children with normal height-for-age (OR = 1.48; 95% CI = 1.39-
1.58; p < 0.001), weight-for-age (OR = 1.46, 95% CI = 1.37- 1.56, p < 0.001) ,weight-
for-height (OR = 1.19, 95% CI = 1.10- 1.28, p < 0.001) and hemoglobin level (OR =
95
1.25; 95% CI = 1.16- 1.35, p < 0.001) compared to nuclear or joint households without
the grandparents (Table 4.5).
Children whose diet included food groups such as protein foods, fruits and
vegetables, fats and oils had increased likelihood of being of normal nutritional status
compared to those not receiving these food groups (Table 4.5). On the other hand, cereals
and cereal products intake had a negative association with height-for-age (OR = 1.09;
95% CI = 1.01- 1.19; p < 0.031) and hemoglobin level (OR = 1.55; 95% CI = 1.40- 1.72,
p < 0.001) of the index child. However, not including them in the diet decreased the odds
of the child having a normal weight-for-age (OR = 0.81; 95% CI = 0.75- 0.88; p < 0.001)
and weight-for-height (OR =0.87; 95% CI = 0.79- 0.95; p < 0.001) significantly
(Table4.5). As expected, the nutritional status of the index child was positively associated
with good diet quality (Table 4.5). Having received up-to-date or some immunization
significantly increased the odds of being of normal nutritional status compared to no
immunization for the four indicators (Table 4.5).
Multivariate ordinal logistic regression: The significant variables from Table 4.5
were included in the final models to examine the independent predictors for stunting,
underweight, wasting and anemia in the study population (Tables 4.6- 4.9). The models
were adjusted for important covariates such as maternal age, religion, age and gender of
the index child. In the model examining independent predictors of stunting, maternal
socio-demographic and household characteristics such as employment status, household
structure and region of residence were not significant predictors. Household SES was
positively associated with height-for-age, by more than doubling the odds of having
normal linear growth for children belonging to high SES households. Moreover, children
96
from rural households were less likely to have normal height-for-age (OR = 0.84; 95% CI
= 0.74- 0.96, p = 0.006) than children from urban households (Table 4.6). Diet quality of
the child also remained an important significant predictor in the final model for height-
for-age when controlled for important covariates (Table 4.6). It was interesting to note
that significant association of immunization status with stunting occurred when interacted
with diet quality. Children with an up-to-date immunization status but receiving diets of
medium (OR = 5.32, 95% CI = 1.85- 15.28, p = 0.002) quality were more likely to have
normal linear growth than children with no immunization and receiving good diet quality.
Although, household structure had no independent association with stunting, children
form joint households with grandparents present and reported consuming quality diet
increased their odds of having a normal linear growth (Table 4.6). Although, household
SES was a significant main effect for normal linear growth, children from high SES
household but consuming a diet of medium quality had a reduced odds of having a
normal height-for-age (OR = 0.38, 95% CI = 0.21- 0.71, p = 0.002; Table 6).
Independent predictors of underweight in children were household SES, and diet
quality, in the presence of other important covariates (Table 4.7). While maternal
education and regional residence had no independent association with underweight, there
was a strong interaction effect between the two factors. Children belonging to households
in the East and having mothers with no education were at lower odds of normal weight-
for-age (OR = 0.33, 95% CI = 0.13- 0.85, p = 0.021; Table 4.7). Other significant
interactions were between diet quality (good quality) and Central-west region that
significantly increased the likelihood of normal weight (Table 4.7).
97
In the multivariate model examining the determinants of wasting, regional
location of the household, SES and diet quality were the significant independent
predictors. Residents of the East region were less likely to have normal weight children
(OR = 0.50, 95% CI = 0.33- 0.77, p = 0.001, Table 4.8). In addition, households with
high SES had the highest probability of having normal weight children (Table 4.8). As
observed for the other indicator, here again children receiving good quality diets were
more likely to have normal weight (OR = 2.51, 95% CI = 1.38- 3.14; p = 0.033).
Although immunization status did not influence weight status independently, its
interaction with diet quality was significant (Table 4.8). Based on the interaction effects
we observed that children who although had received a diet of poor quality but up-to-date
on their immunization (OR = 2.17, 95% CI = 1.05- 4.50, p = 0.037) were more likely to
be normal weight-for-height compared to children who received diet of good quality but
were not up-to-date on their immunization. Interaction between household SES and
maternal education also influenced normal weight status. Children of mothers with only
primary education and from households with high SES were at a higher risk of being
wasted compared to children of more educated mothers (Table 4.8).
The Independent predictors of anemia in children were maternal education level,
household SES and diet quality in the presence of other important covariates (Table 4.9).
Children of mothers with primary or no formal education were less likely to have normal
hemoglobin levels compared to children of educated mothers (Table 4.9). In addition,
belonging to high SES households significantly increased the odds of being non-anemic
(OR = 1.96; 95% CI = 1.31- 2.94, p = 0.001). Moreover, having received a medium
quality diet but from a household with medium SES increased the odds of being non-

98
anemic (OR = 1.92; 95% CI = 1.03- -2.88, p = 0.0082), indicating the importance of both
diet quality and SES on anemia prevention. Surprisingly, children from households in the
East region and receiving poor quality diet were protected from anemia compared to
children from the other regions (OR = 1.71; 95% CI = 1.03- 2.84, p = 0.038, Table 4.9).
We also observed a significant association between immunization status and anemia and
their interaction with the quality of the child’s diet. Children with an up-to-date
immunization status but receiving diets of poor (OR = 2.32, 95% CI = 1.01- 5.34, p =
0.047) quality were more likely to be non-anemic than children with no immunization
and receiving good quality diet. It was interesting to note that children with some
immunization and also receiving medium quality diet were associated with three times
the odds of having normal hemoglobin level (Table 4.9).
Discussion
The current study examined the different factors associated with nutritional status
of children aged < 3 years from India. Results from our study confirm that undernutrition
prevalence; in terms of stunting, underweight, wasting and iron deficiency anemia
continue to be high in spite of the steady increase in Gross Domestic Product (GDP) over
the past three decades (29). According to the WHO, anemia prevalence greater than
40.0% is a significant public health problem and iron-deficiency is the most probable
cause (2). In this study, nearly 80.0% of children aged less than 3 years were found to be
anemic according to their hemoglobin values. Interestingly, we also observed an increase
in anemia prevalence among children between NFHS 2 and 3. In both surveys waves,
similar methods for data collection were used except for Nagaland in the Northeast
Region where blood hemoglobin levels were not assessed in NFHS 3. However, the small
99
sample size from Nagaland, and its exclusion from the survey could not have contributed
to the increased prevalence of anemia in NFHS 3. Future time trend studies for different
sub-groups are necessary to identify the cause of increased anemia prevalence in NFHS
3.
In addition to iron-deficiency anemia, 42.4 %, 39.7 % and 23.7 % children were
stunted, underweight and wasted, respectively. These results clearly show the graveness
of the undernutrition situation during early childhood in India. The vast rural-urban
disparity in undernutrition prevalence in India confirmed by our results, shows that rural
children continue to be at an increased risk of undernutrition compared to their urban
counterparts (22). Results of this study show that children from the East and Central-west
regions are more likely to be wasted, but surprisingly those from the East region and also
receiving poor quality diet were less likely to be anemic (Hb < 11.0 gm/dl). The dietary
pattern in the East region comprises mainly of non-vegetarian foods such as fish and
poultry, while lacto-vegetarians are more common in the other regions (30). It is
plausible that while the intake of non-vegetarian foods protect the children from
becoming anemic, high incidence of poverty and lack of up-to-date immunization in the
East region negatively affect short term nutritional status of these children. Moreover,
children from these regions seem to meet their iron requirement from the non-vegetarian
diets, their protein and other macronutrient intake remain lower than the recommended
levels, thus affecting their overall nutritional status. It is therefore paradoxical that
although children from East region are at a reduced risk for anemia, they are more
susceptible to acute undernutrition (wasting).
100
State specific analysis showed that more than one-third of children in the states of
Bihar, Chhattisgarh and Jharkhand in the East and Madhya Pradesh in the Central-west
region had the highest prevalence of stunting, underweight, wasting and anemia. The
India State Hunger Index (ISHI) developed from the NFHS 3 and the 61st National
Sample Survey (NSS; 2004-05) captures the interconnectedness between hunger, poverty
and mortality (31). It reported the state specific prevalence of undernutrition and
mortality for the period 2004- 2006 (31). Consistent with our findings, Chhattisgarh,
Bihar, Jharkhand and Madhya Pradesh had the highest ISHI, that is indicative of the
highest prevalence of calorie under-nourishment, underweight among children < 5years
and under five mortality rates. In addition, as our findings suggest, these states also
reported a poor dietary intake and incomplete immunization records for most children,
thus explaining the increased undernutrition prevalence. In contrast, low prevalence of
undernutrition was observed in Kerala and Goa where greater proportions of children
received good quality diet and had complete immunization as recommended. Moreover,
maternal literacy was comparatively higher in Kerala and Goa than the other states. These
findings clearly support the notion that nutritional status of children is positively
associated with the development and environment of their place of residence (26).
In line with the above findings, we also observed that maternal education level
was an important determinant of child’s nutritional status, specifically for anemia. As
observed by Reed et al. (1996), children of mothers with no/primary education were more
likely to be underweight (32). This confirms the importance of maternal education as a
determinant of child’s nutritional status. An examination of the Bangladesh Demographic
and Health Survey also reported that undernutrition was most profound among children

101
of illiterate mothers (33). Mothers with low levels of education generally lack awareness
on the nutritional and health care requirements of the child that increases their risk of
undernutrition. In India, nearly 76.6% of illiterate women belonged to the lowest wealth
category compared to only 8.2% in the highest wealth quintile (20). In addition, almost
50.0% of rural mothers have had no formal education compared to 22.0% of their urban
counterparts (20). This disparity in educational attainment by mother’s SES and place of
residence may have contributed to the lack of significant association between maternal
education level and nutritional status (stunting, underweight and wasting) of the child in
the multivariate analysis. However, consistent with previous findings from Indonesia
(34), maternal education remained an independent predictor for childhood anemia in our
study population.
Another interesting observation from our study was the protective effect of
maternal unemployment on child’s nutritional status. In India, a higher proportion of
unemployed women are more likely to come from urban affluent households, while
working women mostly come from rural lower socio-economic household (20). Thus, it
is plausible that unemployed mothers were in a better position to afford diverse food
groups and provide a nutritious diet and appropriate nurturing environment to their
children, thereby improving their nutritional status. Although it is expected that an
employed mother would benefit child’s health by improving economic condition and
purchasing power, our findings imply that mothers employed outside the home may have
a negative influence on children’s nutritional status, through reduced time allocation for
child care and supervised feeding. In the study by Engel (1991), infants of employed
mothers in urban Guatemala were found to be stunted compared to infants of non-
102
employed mothers (35). Employed mothers are more likely to return to work post-
delivery and may be unable to exclusively breastfeed their infants till 6 months as
recommended (36). Similarly, Abbi et al. (1991) examined the association between
maternal employment and child health in rural India and reported a negative influence of
maternal employment on the height-for-age and weight-for-age of children aged 0-35
months (37), a confirmation of findings from the current study.
While maternal characteristics play a significant role in determining the
nutritional status of children, household characteristics such as SES and structure
(nuclear/joint households) were found to be equally important. We observed that children
from affluent households had reduced risks of poor nutritional status. In a recent study,
Kanjilal et al (2010) documented that nearly 50.0% of children from the highest SES
quintile were of better nutritional status compared to those in the poorest wealth quintile
(38), a confirmation of our findings. Similar observations have been made in the lower
Sindh area of Pakistan, where stunted pre-school children were more likely to come from
households with low family income (39). Moreover, in our study, rural children from
medium SES households were more likely to be non-anemic compared to children living
in low SES households. These results further reinforce the evidence that economic status
of the household or family play an important role in childhood nutritional status.
Household SES can influence nutritional status through several ways, such as low quality
and inadequate dietary intake, unsanitary living conditions and therefore increased
infections and morbidity. Children < 5 years living in households with piped water
system are reported to experience significantly reduced prevalence and shorter duration

103
of diarrhea reflecting in their overall health status compared to those without access to
piped water (40).
We also observed that the presence of grandparents of children living in the same
household significantly protected against undernutrition. A previous study from Tanzania
also reported that the presence of grandparents, specifically grandmothers in the
household improved the nutritional status of children through better child care practices
(41). Moreover, children benefit from the presence of grandmothers, with respect to
cognitive and health outcomes (42) and psychological and sociological well being (43).
Sear et al. (2000) confirmed the positive influence of grandparents on the health and
wellbeing of children in their study but also distinguished between the influence by
maternal and paternal grandmothers (44). They concluded that maternal grandmothers
were more likely to influence the nutritional and health outcomes of children compared to
paternal grandmothers (44). In the present study, presence of grandparents was assessed
based on the relationship of the mother with the household head and only 5.0% (n =
1036) of the children were in households with maternal grandparents. We therefore did
not distinguish between maternal and paternal grandparents in our analysis. However,
children belonging to joint households with grandparents but receiving medium quality
diet were more likely to be of normal linear growth. These children probably received
better care and attention from their grandparents that improved their long-term nutritional
status. These results therefore suggest that apart from diet, child care practices such as
hygiene behaviors, caregiver’s attention and health care enhances the long-term
nutritional status of the child.
104
The other important factor that influenced nutritional status of the children was
diet quality. The comprehensive diet quality score used in our analysis accounted for
breastfeeding practices for infants aged 0-6 months and dietary diversity and frequency of
receiving foods for children aged 6-35 months. Exclusive breastfeeding (EBF) has been
recognized to have a potential effect on growth and nutritional status of infants < 6
months and has been recommended by the World Health Organization (45). As expected,
infants in our study population who were being exclusively breastfed (identified as
receiving good diet quality) were more likely to have better nutritional status compared to
non-exclusively breast fed infants. Additionally, for older children aged 6-35 months,
receiving a wide variety of foods frequently, i.e. receiving a diet of good quality
promoted optimal growth and maintained a normal nutritional status. Arimond and Ruel
(2004) reported the positive impact of dietary diversity on nutritional status of children
aged 6-23 months using data from 11 Demographic and Health Surveys (46). In the study
by Zhang et al. (2009), an infant and child feeding index (ICFI) was created that
accounted for breast feeding, bottle feeding, meal frequency, variety and frequency of
food groups consumed by children aged 6-11 months (47). Both Zhang et al. (2009) and
Sawadogo et al. (2005) reported positive correlations between ICFI and the
anthropometric indices (47, 48), which is a confirmation of our findings. Similar to our
findings, Assis et al (2004) have also reported significant association between dietary
intake and childhood anemia in Brazil (14).
The importance of proper feeding practices for optimal growth and nutritional
status of children have been well recognized (45, 49- 51). In India, in spite of universal
breastfeeding, non-exclusive breastfeeding, delayed initiation of breastfeeding and

105
complementary feeding and lack of dietary diversity are widespread (20). Inadequate
feeding practices such as prolonged breastfeeding and delayed weaning have also been
observed among mothers in rural Bundelkhand area in India (52). Prevailing food beliefs
related to delayed introduction of semi-solid foods and type of foods could also be
possible contributors of undernutrition. Mothers usually feed diluted cow's and buffalo
milk, soups and gruels made of rice, sago, tapioca and mashed banana to the infant that
are nutritionally inadequate (53). In our study population, cereals and related products
were the major foods consumed by the child, while consumption of other food groups
remained very low (20), resulting in a low diet quality score. While cereal based foods
may be energy dense, they lack other essential nutrients, such as proteins and
micronutrients, required for optimal growth in infants and children. A cross-sectional
study in Tanzania reported increased prevalence of undernutrition among children fed
energy-dense but low in nutrient foods such as maize porridge (54). Similarly, an
increased intake of cereals, poor dietary diversity and low intake of micronutrients
resulted in stunting among children aged < 5 years in a rural South African community
(15, 55). These studies further support our observation of high undernutrition prevalence
and its association with poor diet quality.
Finally, immunization status of the study children was found to be an important
predictor of their nutritional status. Nearly 2.5 million children in India die every year
due to illnesses, most of which are preventable through timely immunization (20). The
Universal Immunization Program (UIP) launched by the Ministry of Health and Family
Welfare includes vaccination of children against six preventable diseases (tuberculosis,
measles, diphtheria, whooping cough, tetanus, and polio). Surprisingly, in the present
106
study, immunization status of the child did not have an independent effect on nutritional
status. While this is in accord with the Tanzania based study (56), it is in contrast to
previous studies that have reported that undernourished children were more likely to have
incomplete immunization status (39, 57). A case-control study in Bangladesh observed
that non-immunized children were twice as likely to be stunted, underweight, and wasted
than children with complete immunization records (58). It is noteworthy to mention here
that while these studies included children aged 12-23 months with complete/incomplete
immunization status, our study considered age specific up-to-date immunization for
children 0-35 months. Significant disparities in immunization coverage between urban
and rural population and the different socio-economic class exist in India (20). Only
39.0% of children in rural areas were completely immunized versus 58.0% in urban
areas. Moreover, complete immunization coverage rate was 24.0% for children from low
SES households compared to 71.0% in high SES households (20). This could have
contributed to the insignificant association of immunization status and the nutrition
indicators in the multivariate analysis in the presence of place of residence and household
SES. One of the possible causes of missed immunization in rural areas and low SES
households could be lack of awareness and access to health care services. The ‘perception
of long distance to immunization site’ of mothers and care givers in Greece was one of
the major barriers to complete and age-appropriate childhood immunization (59). Even
within India, poor service delivery of health care facilities and social access were primary
reasons for incomplete immunization status of children (60).
However, significant interaction effect between immunization and diet quality
observed in the current study confirms the protective role of immunization against
107
undernutrition in children. The importance of immunization as a public health strategy to
prevent the onset of infectious diseases and reduce childhood mortality has been widely
recognized (61). Simultaneously, the synergistic relationship between infection and
nutritional status of children is well documented (62, 63). These evidences are a
confirmation that children with complete/ up-to-date immunizations have increased
immunity and are less susceptible to infections, thereby maintaining their overall
nutritional and health status, compared to children with partial or no immunization.
Study limitations and significance
A potential limitation of the study is that NFHS data sets do not provide adequate
information on dietary patterns of children with respect of quantity of foods received.
Although the diet quality score was inclusive of breastfeeding practices for infants aged
below 6 months and foods received by children aged 6-35 months, the employed cross-
sectional method for data collection may lack reliability and not be a true representation
of the child’s normal dietary intake. Moreover, exclusive breast feeding of infants < 6
months was assessed based on mother’s report of current breastfeeding status and
whether the infant had received any liquids/solids 24 hours prior to the survey, while
dietary information of children aged 6- 35 months was assessed through a 24-hour dietary
recall of different foods. This form of data collection may suffer from recall bias and
therefore their association with childhood undernutrition needs to be interpreted with
caution. A high proportion of the surveyed women had missing information on the index
child’s anthropometric and hemoglobin measurements and was therefore excluded from
the final analysis. Characteristics of households included and excluded from the final
analysis were similar except for place of delivery and maternal education level. In

108
addition, due to the cross-sectional nature of the data, causality between maternal and
household characteristics and nutritional status of children cannot be ascertained.
However, the large analytical sample-size and representativeness of the study sample add
to the strengths of the study’s findings.
Results from our study suggest the need for future longitudinal studies focusing
on dietary practices of mothers with respect to quantity and quality of foods consumed by
children. Longitudinal studies controlling for childhood morbidity, need to examine the
association between dietary diversity, nutrient intake and child’s nutritional status in this
population. This is of particular interest as there may be a potential deficiency of
nutrients among children, specifically those identified to be at risk of being
undernourished. Moreover, our findings suggest the need to include older
adults/grandparents living in joint households in existing health promotion programs such
as the Integrated Child Development Services (ICDS) scheme and the National Rural
Health Mission (NRHM). Nutrition education programs need to target rural and urban
poor population. Previous community intervention trials have reported the significant
effect of nutrition and health education programs in improving feeding practices of urban
slum dwellers (64). Our findings further suggest the need for grass-root programs
promoting Infant and Young Child Feeding (IYCF) and care practices.

109
References
1. WHO Multicentre Growth Reference Study Group. WHO Child Growth
Standards: Length/height-for-age, weight-for-age, weight-for-length, weight-for-
height and body mass index-for-age: Methods and development. Geneva: World
Health Organization. 2006.
2. World Health Organization. Iron Deficiency Anaemia: Assessment, prevention and
control. A guide for programme managers. WHO: Geneva. 2001.[Available from:
http://www.who.int/nutrition/publications/micronutrients/anaemia_iron_deficienc
y/WHO_NHD_01.3/en/index.html]
3. World Health Organization. Physical status: The use and interpretation of
anthropometry. WHO: Geneva. 1995. [Available from:
http://www.who.int/childgrowth/publications/physical_status/en/index.html]
4. Chandra RK. Interactions of nutrition, infection and immune response
immunocompetence in nutritional deficiency. Methodological considerations and
intervention strategies. Acta Pædiatr. 1979;68(2):137-144.
5. Tomkins A. Nutritional status and severity of diarrhoea among pre-school
children in rural Nigeria. Lancet. 1981;317(8225):860-862.
6. Pelletier DL, Frongillo Jr EA. The effects of malnutrition on child mortality in
developing countries. Bull World Health Organ. 1995;73(4):443-448.
7. United Nations Children's Fund. The state of the world's children- Maternal and \
new born health. UNICEF: New York. 2009. [Available from:
http://www.unicef.org/sowc09/docs/SOWC09-FullReport-EN.pdf]

110
8. de Onis M, Frongillo Jr EA. Is malnutrition declining? An analysis of changes in
levels of child malnutrition since 1980. Bull World Health Organ.
2000;78(10):1222.
9. de Benoist B, McLean E, Egli I, Cogswell M. Worldwide prevalence of anaemia
1993-2005 : WHO global database on anaemia. WHO: Geneva. 2008 [Available
from: http://whqlibdoc.who.int/publications/2008/9789241596657_eng.pdf]
10. von Laer Tschudin L, Chattopadhyay C, Pandit S, Schramm-Garaj K, Seth U,
Debnath PK, Keller U. Risk factors for under- and overweight in school children
of a low income area in Kolkata, India. Clin Nutr. 2009;28(5):538-542.
11. Hong R. Effect of economic inequality on chronic childhood undernutrition in
Ghana. Public Health Nutr. 2007;10(4):371-378.
12. Lima AL, Silva AC, Konno SC, Conde WL, Benicio MH, Monteiro CA. Causes
of the accelerated decline in child undernutrition in Northeastern Brazil (1986-
1996-2006). Rev Saude Publica. 2010;44:17-27.
13. Shen T, Habicht JP, Chang Y. Effect of economic reforms on child growth in
urban and rural areas of China. N Engl J Med. 1996;335(6):400-406.
14. Assis AM, Barreto ML, Gomes GS, Prado Mda S, Santos NS, Santos LM,
Sampaio LR, Ribeiro Rde C, Oliveira LP, et al. Childhood anemia prevalence and
associated factors in Salvador, Bahia, Brazil. Cadernos de Saúde Pública.
2004;20:1633-1641.
15. Faber M, Benadé A. Nutritional status and dietary practices of 4-24-month-old
children from a rural South African community. Public Health Nutr.
1999;2(2):179-185.
111
16. Blaney S, Beaudry M, Latham M. Determinants of undernutrition in rural
communities of a protected area in Gabon. Public Health Nutr. 2009;12(10):1711-
1725.
17. Blaney S, Beaudry M, Latham M, Thibault M. Nutritional status and dietary
adequacy in rural communities of a protected area in Gabon. Public Health Nutr.
2009;12(10):1946-1959.
18. Kumar D, Goel NK, Mittal PC, Misra P. Influence of infant-feeding practices on
nutritional status of under-five children. Indian J Pediatr. 2006;73(5):417-21.
19. International Institute for Population Sciences (IIPS), National Family Health
Survey (MCH and Family Planning)- India 1992-93. 1995: Bombay:IIPS.
20. International Institute for Population Sciences (IIPS) and Macro International,
National Family Health Survey (NFHS-3), 2005-06: India: Volume I. 2007, IIPS:
Mumbai.
21. International Institute for Population Sciences (IIPS) and O. Macro, National
Family Health Survey (NFHS-2), 1998-99:India. . 2000: Mumbai: IIPS.
22. Dutta A, Pant K, Puthia R, Sah A. Prevalence of undernutrition among children in
the Garhwal Himalayas. Food Nutr Bull. 2009;30(1):77-81.
23. Subramanyam MA, Kawachi I, Berkman LF, Subramanian SV. Socioeconomic
inequalities in childhood undernutrition in India: Analyzing trends between 1992
and 2005. PLoS One. 2010;5(6):e11392.
24. Lakshmi AJ, Khyrunnisa B, Saraswathi G, Jamuna P. Dietary adequacy of Indian
rural preschool children—influencing factors. J Trop Pediatr. 2005;51(1):39-44

112
25. Ramji S. Impact of infant & young child feeding & caring practices on nutritional
status & health. Indian J Med Res. 2009;130(5):624-626.
26. Som S, Pal M, Bharati P. Role of individual and household level factors on
stunting: A comparative study in three Indian states. Ann Hum Biol.
2007;34(6):632-646.
27. Department of Health and Family Welfare. Immunization handbook for medical
officers. Ministry of Health and Family Welfare, Government of India: New
Delhi. 2008. [Available from:
http://www.whoindia.org/LinkFiles/Routine_Immunization_Immunization_Hand
book_for_Medical_Officers_.pdf]
28. Demographic and Health Surveys. [Available from: www.measuredhs.com/]
29. Rodrik D, Subramanian A. Why India can grow at 7 Percent a year or more:
Projections and reflections. IMF working paper, 2004. [Available from:
http://www.imf.org/external/pubs/ft/wp/2004/wp04118.pdf]
30. Singh K. People of India, national series, in identity, ecology, social organization,
economy, linkages and development process: A quantitative profile.
Anthropological Survey of India: New Delhi. 1996.
31. Menon P, Deolalikar A, Anjor B. India State Hunger Index. Comparisons of
hunger across states. International Food Policy Research Institute: Washington,
D.C. 2009. [Available from: http://www.ifpri.org/publication/comparisons-
hunger-across-states-india-state-hunger-index]

113
32. Reed BA, Habicht HA, Niameogo C. The effects of maternal education on child
nutritional status depend on socio-environmental conditions. Int J
Epidemiol.1996;25(3):585-592.
33. Rayhan MI, Khan MSH. Factors causing malnutrition among under five children
in Bangladesh. Pakistan J Nutr. 2006;5:558-62.
34. De Pee S, Bloem MW, Sari M, Kiess L, Yip R, Kosen S. The high prevalence of
low hemoglobin concentration among indonesian infants aged 3-5 months is
related to maternal anemia. J. Nutr. 2002;132(8):2215-2221.
35. Engle PL. Maternal work and child-care strategies in peri-urban guatemala:
nutritional effects. Child Dev. 1991;62(5):954-965.
36. Ukwuani FA, Suchindran CM. Implications of women's work for child nutritional
status in sub-Saharan Africa: a case study of Nigeria. Soc Sci Med.
2003;56(10):2109-2121.
37. Abbi R, Christian P, Gujral S. The impact of maternal work on the nutritional and
health status of children. Food Nutr Bull. 1991;13(1):20-25.
38. Kanjilal B, Mazumdar PG, Mukherjee M, Rahman MH. Nutritional status of
children in India: household socio-economic condition as the contextual
determinant. Int J Equity Health. 2010;9(1):19.
39. Shah SM, Selwyn BJ, Luby S, Merchant A, Bano R. Prevalence and correlates of
stunting among children in rural Pakistan. Pediatr Int. 2003;45(1):49-53.
40. Jalan J, Ravallion M. Does piped water reduce diarrhea for children in rural
India? J Econom. 2003;112(1):153-173.
114
41. Hawkes K, O'connell JF, Jones NGB. Hadza women's time allocation, offspring
provisioning, and the evolution of long postmenopausal life spans. Current
Anthropology. 1997;38(4):551-577.
42. Pope SK, Whiteside L, Brooks-Gunn J, Kelleher KJ, Rickert VI, Bradley RH,
Casey PH. Low-birth-weight infants born to adolescent mothers: effects of
coresidency with grandmother on child development. JAMA. 1993;269(11):1396-
1400.
43. Al Awad A, Sonuga-Barke EJS. Childhood problems in a Sudanese city: A
comparison of extended and nuclear families. Child Dev. 1992;63(4):906-914.
44. Sear R, Mace R, McGregor IA. Maternal grandmothers improve nutritional status
and survival of children in rural Gambia. Proc Biol Sci. 2000;267(1453):1641-
1647.
45. World Health Organization, United Nations Childrens Fund. Global strategy for
infant and young child feeding. WHO: Geneva. 2003
46. Arimond M, Ruel MT. Dietary diversity is associated with child nutritional
status: evidence from 11 demographic and health surveys. J Nutr.
2004;134(10):2579-2585.
47. Zhang J, Shi L, Wang J, Wang Y. An infant and child feeding index is associated
with child nutritional status in rural China. Early Hum Dev. 2009;85(4):247-252.
48. Sawadogo PS, Martin-Prével Y, Savy M, Kameli Y, Traissac P, Traoré AS,
Delpeuch F. An infant and child feeding index is associated with the nutritional
status of 6- to 23-month-old children in Rural Burkina Faso. J Nutr.
2006;136(3):656-663.

115
49. Mamiro PS, Kolsteren P, Roberfroid D, Tatala S, Opsomer AS, Van Camp JH.
Feeding practices and factors contributing to wasting, stunting, and iron-
deficiency anaemia among 3-23-month od children in Kilosa District, rural
Tanzania. J Health Popul Nutr. 2005;23(3):222-30.
50. Michaelsen KF, Friis H. Complementary feeding:A global perspective. Nutrition.
1998;14(10):763-6.
51. Vaahtera M, Kulmala T, Hietanen A, Ndekha M, Cullinan T, Salin ML, Ashorn P.
Breastfeeding and complementary feeding practices in rural Malawi. Acta
Paediatr. 2001;90(3):328-332.
52. Awasthi NN, Kaushik A, Mathur BD. Feeding and rearing practices in rural area
of Jhansi-Bundelkhand. Indian J Pediatr. 1983;50(402):33-37.
53. Minocha AA. Mother's position in child feeding and nutrition: some sociological
considerations. Econ Polit Wkly. 1984;19(48):2045-2048.
54. Nyaruhucha CNM, Msuya JM, Mamiro PS, Kerengi AJ. Nutritional status and
feeding practices of under-five children in Simanjiro District, Tanzania. Tanzania
Health Res Bull. 2006;8(3):162-167.
55. Faber M, Jogessar VB, Benadé AJ. Nutritional status and dietary intakes of
children aged 2-5 years and their caregivers in a rural South African community.
Int J Food Sci Nutr. 2001 Sep;52(5):401-11.
56. Mbago MCY, Namfua PP. Some determinants of nutritional status of one- to
four-year-old children in low income urban areas in Tanzania. J Trop Pediatr.
1992;38(6):299-306.
116
57. Semba RD, de Pee S, Berger SG, Martini E, Ricks MO, Bloem MW. Malnutrition
and infectious disease morbidity among children missed by the childhood
immunization program in Indonesia. Southeast Asian J Trop Med Public Health.
2007;38:120-29.
58. Chowdhury F, Khan AI, Hossain MI, Malek MA, Faruque AS, Ahmed T, Salam
MA. Young children non-immunized against measles: characteristics and
programmatic implications. Acta Paediatri. 2006;95(1): 44-49.
59. Danis K, Georgakopoulou T, Stavrou T, Laggas D, Panagiotopoulos T.
Socioeconomic factors play a more important role in childhood vaccination
coverage than parental perceptions: a cross-sectional study in Greece. Vaccine.
2010;28(7):1861-1869.
60. Agarwal S, Srivastava A. Social determinants of children’s health in urban areas
in India. J Health Care Poor Underserved. 2009;20(4 Suppl):68-69
61. Lang-Runtz H. Immunization: should it be compulsory? Can Med Assoc J.
1984;130(2):199-203.
62. Pelletier DL. The relationship between child anthropometry and mortality in
developing countries: Implications for policy, programs and future research. J
Nutr. 1994;124(10_Suppl): 2047S-2081.
63. Scrimshaw N, SanGiovanni J. Synergism of nutrition, infection, and immunity:
an overview. Am J Clin Nutr. 1997;66(2):464S-477.
64. Palwala M, Sharma S, Udipi SA, Ghugre PS, Kothari G, Sawardekar P.
Nutritional quality of diets fed to young children in urban slums can be improved
by intensive nutrition education. Food Nutr Bull. 2009;30(4):317-326.
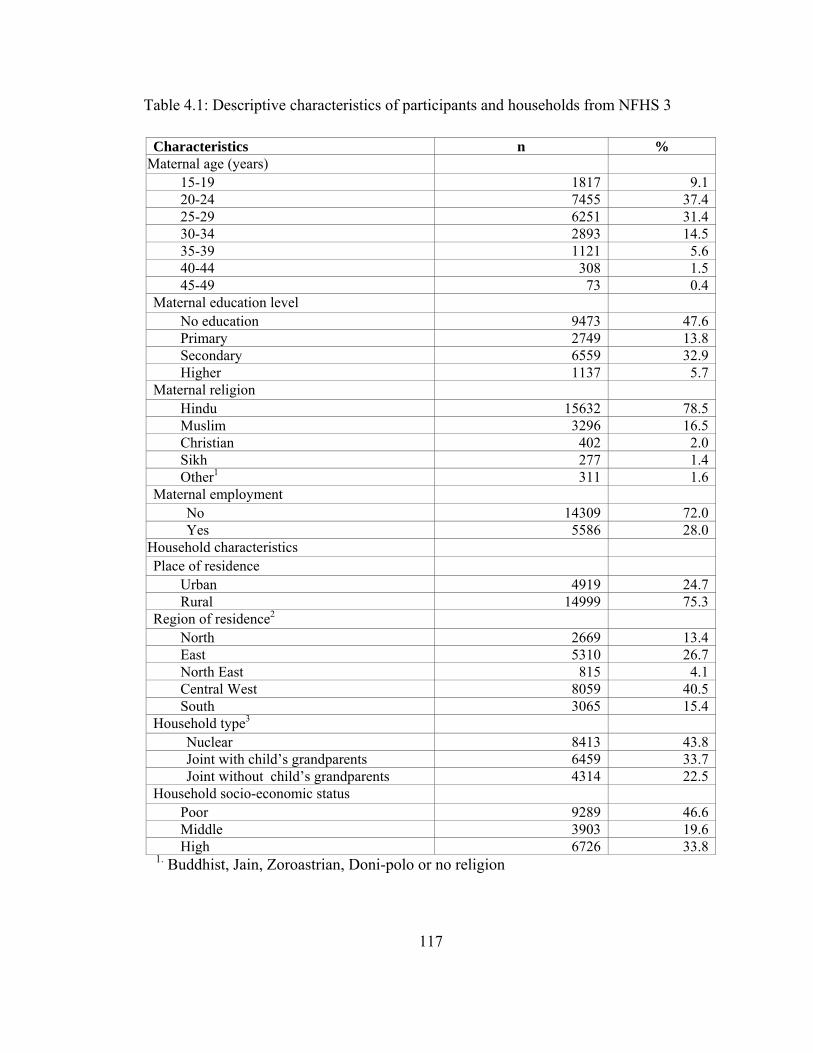
117
Table 4.1: Descriptive characteristics of participants and households from NFHS 3
1. Buddhist, Jain, Zoroastrian, Doni-polo or no religion
Characteristics n %Maternal age (years)
15-19 1817 9.120-24 7455 37.425-29 6251 31.430-34 2893 14.535-39 1121 5.640-44 308 1.545-49 73 0.4
Maternal education level No education 9473 47.6Primary 2749 13.8Secondary 6559 32.9Higher 1137 5.7
Maternal religion Hindu 15632 78.5Muslim 3296 16.5Christian 402 2.0Sikh 277 1.4Other1 311 1.6
Maternal employment No 14309 72.0Yes 5586 28.0
Household characteristics Place of residence
Urban 4919 24.7Rural 14999 75.3
Region of residence2 North 2669 13.4East 5310 26.7North East 815 4.1Central West 8059 40.5South 3065 15.4
Household type3 Nuclear 8413 43.8Joint with child’s grandparents 6459 33.7Joint without child’s grandparents 4314 22.5
Household socio-economic status Poor 9289 46.6Middle 3903 19.6High 6726 33.8

118
2. North: Jammu & Kashmir, Himachal Pradesh, Haryana, Punjab, Delhi, Uttar Pradesh,
Uttaranchal; East: Bihar, Jharkhand, Chhattisgarh, West Bengal, Orissa; North-East:
Assam, Arunachal Pradesh, Manipur, Meghalaya, Mizoram, Nagaland, Sikkim,
Tripura; South: Andhra Pradesh, Karnataka, Kerala, Tamil Nadu; Central-west:
Maharashtra, Goa, Gujarat, Madhya Pradesh, Rajasthan.
3. Type of household: Nuclear: Index child living with parents and siblings, Joint with
grandparents: Index child living with parents, siblings, relatives including grandparents,
Joint with grandparents: Index child living with parents, siblings and other relatives
excluding grandparents
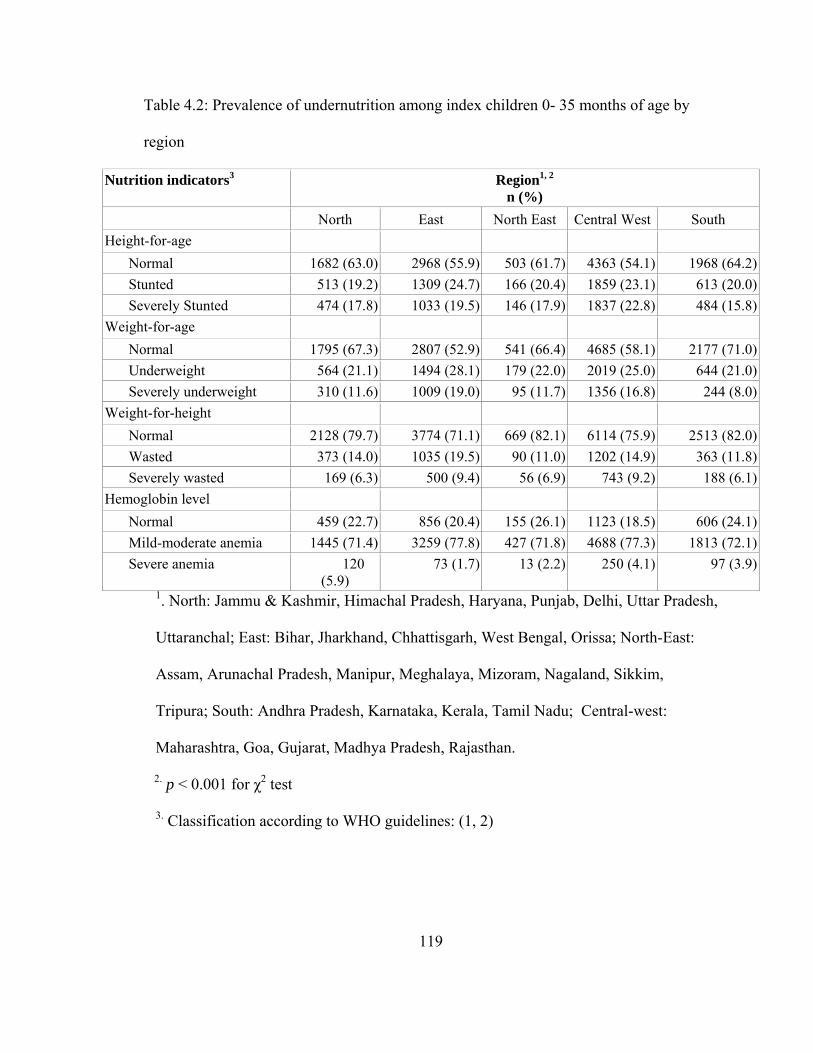
119
Table 4.2: Prevalence of undernutrition among index children 0- 35 months of age by
region
Nutrition indicators3 Region1, 2 n (%)
North East North East Central West South Height-for-age
Normal 1682 (63.0) 2968 (55.9) 503 (61.7) 4363 (54.1) 1968 (64.2)Stunted 513 (19.2) 1309 (24.7) 166 (20.4) 1859 (23.1) 613 (20.0)Severely Stunted 474 (17.8) 1033 (19.5) 146 (17.9) 1837 (22.8) 484 (15.8)
Weight-for-age Normal 1795 (67.3) 2807 (52.9) 541 (66.4) 4685 (58.1) 2177 (71.0)Underweight 564 (21.1) 1494 (28.1) 179 (22.0) 2019 (25.0) 644 (21.0)Severely underweight 310 (11.6) 1009 (19.0) 95 (11.7) 1356 (16.8) 244 (8.0)
Weight-for-height Normal 2128 (79.7) 3774 (71.1) 669 (82.1) 6114 (75.9) 2513 (82.0)Wasted 373 (14.0) 1035 (19.5) 90 (11.0) 1202 (14.9) 363 (11.8)Severely wasted 169 (6.3) 500 (9.4) 56 (6.9) 743 (9.2) 188 (6.1)
Hemoglobin level Normal 459 (22.7) 856 (20.4) 155 (26.1) 1123 (18.5) 606 (24.1)Mild-moderate anemia 1445 (71.4) 3259 (77.8) 427 (71.8) 4688 (77.3) 1813 (72.1)Severe anemia 120
(5.9) 73 (1.7) 13 (2.2) 250 (4.1) 97 (3.9)
1. North: Jammu & Kashmir, Himachal Pradesh, Haryana, Punjab, Delhi, Uttar Pradesh,
Uttaranchal; East: Bihar, Jharkhand, Chhattisgarh, West Bengal, Orissa; North-East:
Assam, Arunachal Pradesh, Manipur, Meghalaya, Mizoram, Nagaland, Sikkim,
Tripura; South: Andhra Pradesh, Karnataka, Kerala, Tamil Nadu; Central-west:
Maharashtra, Goa, Gujarat, Madhya Pradesh, Rajasthan.
2. p < 0.001 for χ2 test
3. Classification according to WHO guidelines: (1, 2)
120
Severely stunted/underweight/wasted < -3.0 HAZ, Stunted/underweight/wasted -
2.99 to -2.0 HAZ, Normal > -2.0 HAZ; Severe anemia < 7.0 g/dl; moderate/mild
anemia: 10.9 g/dl > Hb > 7.1 g/dl; normal: Hb ≥ 11.0g/dl
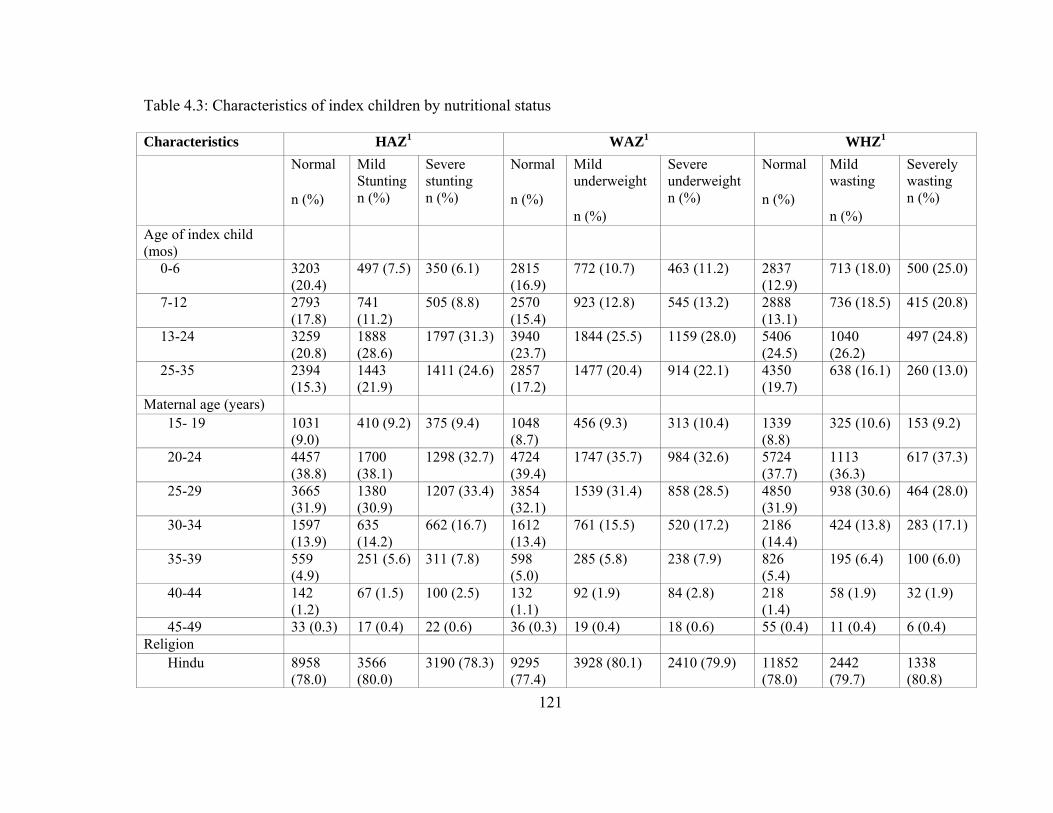
121
Table 4.3: Characteristics of index children by nutritional status
Characteristics HAZ1 WAZ1 WHZ1 Normal
n (%)
Mild Stunting n (%)
Severe stunting n (%)
Normal n (%)
Mild underweight n (%)
Severe underweight n (%)
Normal n (%)
Mild wasting n (%)
Severely wasting n (%)
Age of index child (mos)
0-6 3203 (20.4)
497 (7.5) 350 (6.1) 2815 (16.9)
772 (10.7) 463 (11.2) 2837 (12.9)
713 (18.0) 500 (25.0)
7-12 2793 (17.8)
741 (11.2)
505 (8.8) 2570 (15.4)
923 (12.8) 545 (13.2) 2888 (13.1)
736 (18.5) 415 (20.8)
13-24 3259 (20.8)
1888 (28.6)
1797 (31.3) 3940 (23.7)
1844 (25.5) 1159 (28.0) 5406 (24.5)
1040 (26.2)
497 (24.8)
25-35 2394 (15.3)
1443 (21.9)
1411 (24.6) 2857 (17.2)
1477 (20.4) 914 (22.1) 4350 (19.7)
638 (16.1) 260 (13.0)
Maternal age (years) 15- 19 1031
(9.0) 410 (9.2) 375 (9.4) 1048
(8.7) 456 (9.3) 313 (10.4) 1339
(8.8) 325 (10.6) 153 (9.2)
20-24 4457 (38.8)
1700 (38.1)
1298 (32.7) 4724 (39.4)
1747 (35.7) 984 (32.6) 5724 (37.7)
1113 (36.3)
617 (37.3)
25-29 3665 (31.9)
1380 (30.9)
1207 (33.4) 3854 (32.1)
1539 (31.4) 858 (28.5) 4850 (31.9)
938 (30.6) 464 (28.0)
30-34 1597 (13.9)
635 (14.2)
662 (16.7) 1612 (13.4)
761 (15.5) 520 (17.2) 2186 (14.4)
424 (13.8) 283 (17.1)
35-39 559 (4.9)
251 (5.6) 311 (7.8) 598 (5.0)
285 (5.8) 238 (7.9) 826 (5.4)
195 (6.4) 100 (6.0)
40-44 142 (1.2)
67 (1.5) 100 (2.5) 132 (1.1)
92 (1.9) 84 (2.8) 218 (1.4)
58 (1.9) 32 (1.9)
45-49 33 (0.3) 17 (0.4) 22 (0.6) 36 (0.3) 19 (0.4) 18 (0.6) 55 (0.4) 11 (0.4) 6 (0.4) Religion
Hindu 8958 (78.0)
3566 (80.0)
3190 (78.3) 9295 (77.4)
3928 (80.1) 2410 (79.9) 11852 (78.0)
2442 (79.7)
1338 (80.8)
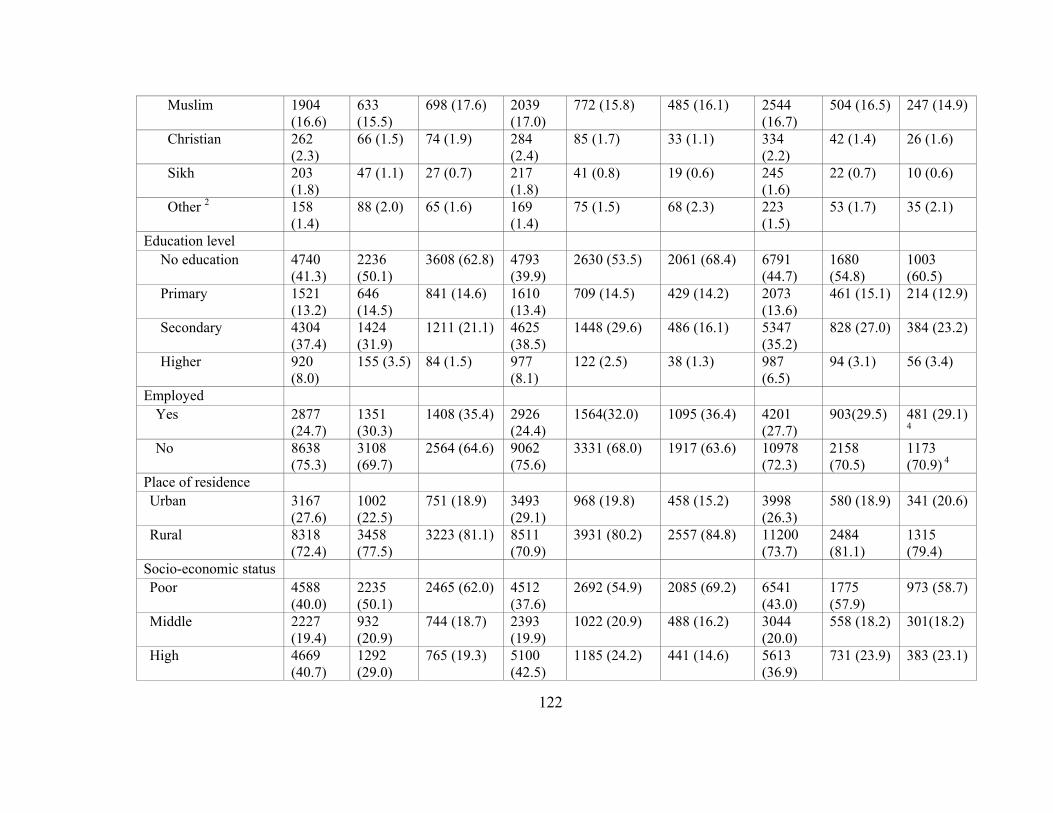
122
Muslim 1904 (16.6)
633 (15.5)
698 (17.6) 2039 (17.0)
772 (15.8) 485 (16.1) 2544 (16.7)
504 (16.5) 247 (14.9)
Christian 262 (2.3)
66 (1.5) 74 (1.9) 284 (2.4)
85 (1.7) 33 (1.1) 334 (2.2)
42 (1.4) 26 (1.6)
Sikh 203 (1.8)
47 (1.1) 27 (0.7) 217 (1.8)
41 (0.8) 19 (0.6) 245 (1.6)
22 (0.7) 10 (0.6)
Other 2 158 (1.4)
88 (2.0) 65 (1.6) 169 (1.4)
75 (1.5) 68 (2.3) 223 (1.5)
53 (1.7) 35 (2.1)
Education level No education 4740
(41.3) 2236 (50.1)
3608 (62.8) 4793 (39.9)
2630 (53.5) 2061 (68.4) 6791 (44.7)
1680 (54.8)
1003 (60.5)
Primary 1521 (13.2)
646 (14.5)
841 (14.6) 1610 (13.4)
709 (14.5) 429 (14.2) 2073 (13.6)
461 (15.1) 214 (12.9)
Secondary 4304 (37.4)
1424 (31.9)
1211 (21.1) 4625 (38.5)
1448 (29.6) 486 (16.1) 5347 (35.2)
828 (27.0) 384 (23.2)
Higher 920 (8.0)
155 (3.5) 84 (1.5) 977 (8.1)
122 (2.5) 38 (1.3) 987 (6.5)
94 (3.1) 56 (3.4)
Employed Yes 2877
(24.7) 1351 (30.3)
1408 (35.4) 2926 (24.4)
1564(32.0) 1095 (36.4) 4201 (27.7)
903(29.5) 481 (29.1)
4 No 8638
(75.3) 3108 (69.7)
2564 (64.6) 9062 (75.6)
3331 (68.0) 1917 (63.6) 10978 (72.3)
2158 (70.5)
1173 (70.9) 4
Place of residence Urban 3167
(27.6) 1002 (22.5)
751 (18.9) 3493 (29.1)
968 (19.8) 458 (15.2) 3998 (26.3)
580 (18.9) 341 (20.6)
Rural 8318 (72.4)
3458 (77.5)
3223 (81.1) 8511 (70.9)
3931 (80.2) 2557 (84.8) 11200 (73.7)
2484 (81.1)
1315 (79.4)
Socio-economic status Poor 4588
(40.0) 2235 (50.1)
2465 (62.0) 4512 (37.6)
2692 (54.9) 2085 (69.2) 6541 (43.0)
1775 (57.9)
973 (58.7)
Middle 2227 (19.4)
932 (20.9)
744 (18.7) 2393 (19.9)
1022 (20.9) 488 (16.2) 3044 (20.0)
558 (18.2) 301(18.2)
High 4669 (40.7)
1292 (29.0)
765 (19.3) 5100 (42.5)
1185 (24.2) 441 (14.6) 5613 (36.9)
731 (23.9) 383 (23.1)

123
Type of household3 Nuclear 4555
(41.3) 1896 (43.9)
1962 (51.2) 4745 (41.2)
2182 (45.8) 1486 (51.0) 6285 (42.9)
1383 (46.8)
745 (46.7)
Joint with child’s grandparents
4057 (36.7)
1401 (32.5)
1001(26.1) 4207 (36.5)
1466(30.8) 787 (27.0) 5034 (34.4)
902 (30.5) 523 (32.8)
Joint without child’s grandparents
2428 (22.0)
1017 (23.6)
868 (22.7) 2561 (22.2)
1112 (23.4) 641 (22.0) 3317 (22.7)
669 (22.6) 327 (20.5)
1. p value < 0.001 for χ2 test
2. Buddhist, Jain, Zoroastrian, Doni-polo or no religion
3. Type of household: Nuclear: Index child living with parents and siblings, Joint with grandparents: Index child living with
parents, siblings, relatives including grandparents, Joint with grandparents: Index child living with parents, siblings and other
relatives excluding grandparents
4. Not significant across type of employment

124
Table 4.4: Feeding practices by nutritional status of index children 0- 35 months of age
Feeding practices HAZ WAZ WHZ Normal
n (%)
Mild Stunting n (%)
Severe stunting n (%)
Normal n (%)
Mild underweight n (%)
Severe underweight n (%)
Normal n (%)
Mild wasting n (%)
Severe wasting n (%)
Duration of BF Never BF 190 (1.2) 70 (1.1) 57 (1.0) 219
(1.3)66 (0.9) 31 (0.8) 266
(1.2) 28 (0.7) 23 (1.2)
Still BF 10248 (65.4)
4300 (65.3)
4101 (71.4)
10557 (63.4)
4925 (68.1) 3167 (76.6) 14043 (63.7)
3024 (76.2)
1582 (79.1)
0-6 months 739 (4.7) 238 (3.6) 187 (3.3) 803 (4.8)
262 (3.6) 100 (0.9) 978 (4.4)
131 (3.3) 56 (2.8)
7-12 months 1232 (7.9) 428 (6.5) 323 (5.6) 1378 (8.3)
426 (5.9) 178 (4.3) 1731 (7.9)
152 (3.8) 100 (5.0)
> 12 months 3267 (20.8)
1553 (23.6)
1077 (18.7)
3686 (22.6)
1554 (21.5) 657 (15.9) 5023 (22.8)
636 (16.0)
238 (11.9)
Received protein rich foods
Yes 3067 (26.8)
1435 (32.3)
1051 (26.7)
3542 (29.7)
1321 (27.1) 690 (23.0) 4613 (30.5)
668 (21.9)
271 (16.4)
No 8363 (73.2)
3001 (67.7)
2883 (73.3)
8393 (70.3)
3550 (72.9) 2304 (77.0) 10489 (69.5)
2379 (78.1)
1379 (83.6)
Received fruits & vegetables
Yes 4201 (36.7)
2147 (48.4)
1800 (45.5)
4897 (41.0)
2066 (42.3) 1184 (14.5) 6592 (43.6)
1055 (34.6)
500 (30.3)
No 7239 (63.3)
2288 (51.6)
2157 (54.5)
7053 (59.0)
2819 (57.7) 1812 (60.5) 8538 (56.4)
1998 (65.4)
1149 (69.7)
Received cereals/cereal based foods
Yes 7756 3626 3320 8673 3748 (76.7) 2281 (76.3) 3593 925 626
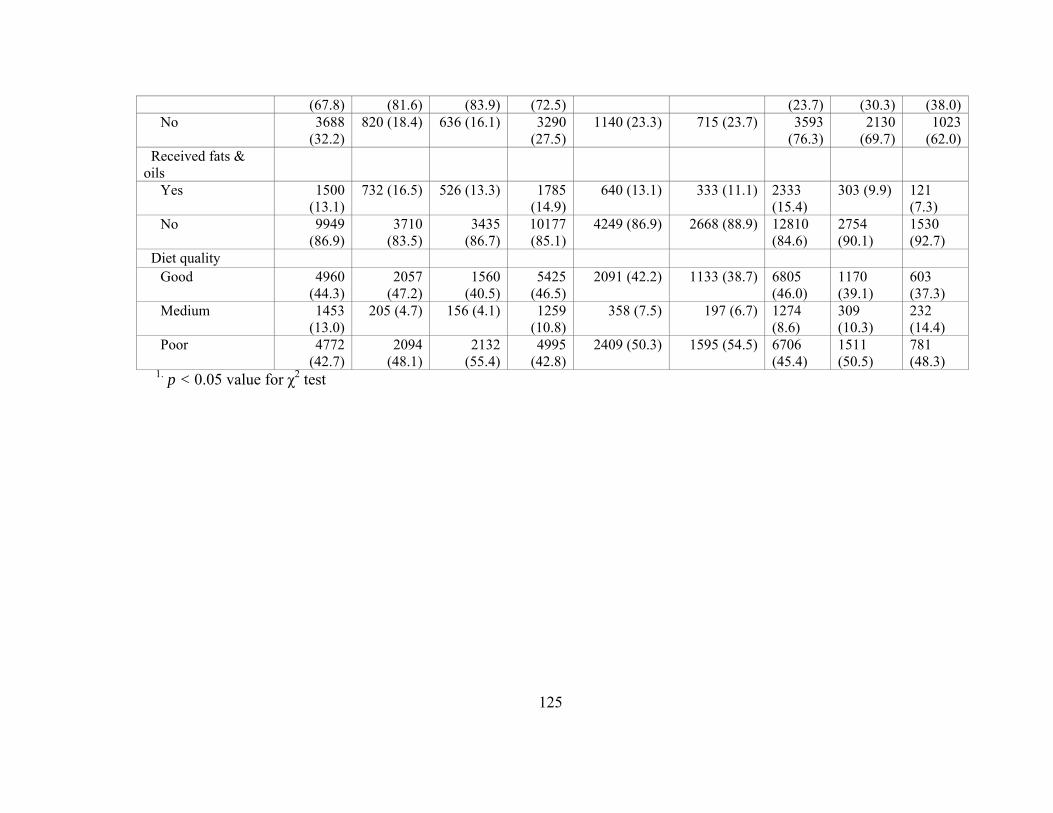
125
(67.8) (81.6) (83.9) (72.5) (23.7) (30.3) (38.0)No 3688
(32.2)820 (18.4) 636 (16.1) 3290
(27.5)1140 (23.3) 715 (23.7) 3593
(76.3)2130
(69.7)1023
(62.0) Received fats & oils
Yes 1500 (13.1)
732 (16.5) 526 (13.3) 1785 (14.9)
640 (13.1) 333 (11.1) 2333 (15.4)
303 (9.9) 121 (7.3)
No 9949 (86.9)
3710 (83.5)
3435 (86.7)
10177 (85.1)
4249 (86.9) 2668 (88.9) 12810 (84.6)
2754 (90.1)
1530 (92.7)
Diet quality Good 4960
(44.3)2057
(47.2)1560
(40.5)5425
(46.5)2091 (42.2) 1133 (38.7) 6805
(46.0) 1170 (39.1)
603 (37.3)
Medium 1453 (13.0)
205 (4.7) 156 (4.1) 1259 (10.8)
358 (7.5) 197 (6.7) 1274 (8.6)
309 (10.3)
232 (14.4)
Poor 4772 (42.7)
2094 (48.1)
2132 (55.4)
4995 (42.8)
2409 (50.3) 1595 (54.5) 6706 (45.4)
1511 (50.5)
781 (48.3)
1. p < 0.05 value for χ2 test

126
Table 4.5: Factors associated with higher/normal nutritional status of children: Univariate ordinal logistic regression
Variables Low HAZ score vs. normal
Low WAZ score vs. normal
Low WHZ score vs. normal
Low Hb level vs. normal
OR (95% CI); p Maternal characteristics Maternal age
15- 19 1.00 1.00 1.00 1.00 20-24 1.16 (1.05- 1.28);
0.005 1.29 (1.17- 1.43); < 0.001
1.16 (1.03- 1.31); 0.012
1.30 (1.14- 1.48); < 0.001
25-29 1.08 (0.98- 1.20); 0.134
1.20 (1.09- 1.33); 0.201 1.22 (1.09- 1.38); 0.001
1.31 (1.15- 1.50); < 0.001
30-34 0.92 (0.82- 1.03); 0.147
0.93 (0.83- 1.04); 0.201 1.07 (0.94- 1.22); 0.307
1.31 (1.13- 1.51); < 0.001
35-39 0.73 (0.63- 0.84); < 0.001
0.82 (0.71- 0.94); 0.006 0.99 (0.84- 1.17); 0.918
1.21 (1.01- 1.45); 0.040
40-44 0.60 (0.63- 0.48); < 0.001
0.55 (0.44- 0.69); < 0.001
0.86 (0.66- 1.11); 0.244
1.02 (0.76- 1.37); 0.898
45-49 0.62 (0.40- 0.96); 0.033
0.69 (0.44- 1.07); 0.094 1.11 (0.65- 1.91); 0.703
0.69 (0.38- 1.24); 0.217
Religion Hindu 1.00 1.00 1.00 1.00 Muslim 0.99 (0.92- 1.07);
0.860 1.10 (1.02- 1.18); 0.016 1.09 (0.99- 1.19);
0.067 1.08 (0.99- 1.18); 0.077
Christian 1.33 (1.09- 1.62); 0.006
1.69 (1.36- 2.09); < 0.001
1.55 (1.20- 2.02); 0.001
1.93 (1.56- 2.39); < 0.001
Sikh 2.05 (1.57- 2.67); < 0.001
2.46 (1.85- 3.28); < 0.001
2.42 (1.67- 3.49); < 0.001
1.02 (0.77- 1.36); 0.877
Buddhist 0.84 (0.62- 1.15); 0.288
1.14 (0.82- 1.58); < 0.001
0.99 (0.68- 1.45); 0.970
1.29 (0.90- 1.86); 0.162
Jain 2.13 (1.08- 4.18); 0.028
2.51 (1.21- 5.17); 0.013 1.72 (0.76- 3.90); 0.195
2.39 (1.28- 4.44); 0.006
Minor/ no religion 0.58 (0.42- 0.81); 0.001
0.35 (0.25- 0.48); < 0.001
0.52 (0.36- 0.75); < 0.001
0.93 (0.60- 1.43); 0.737
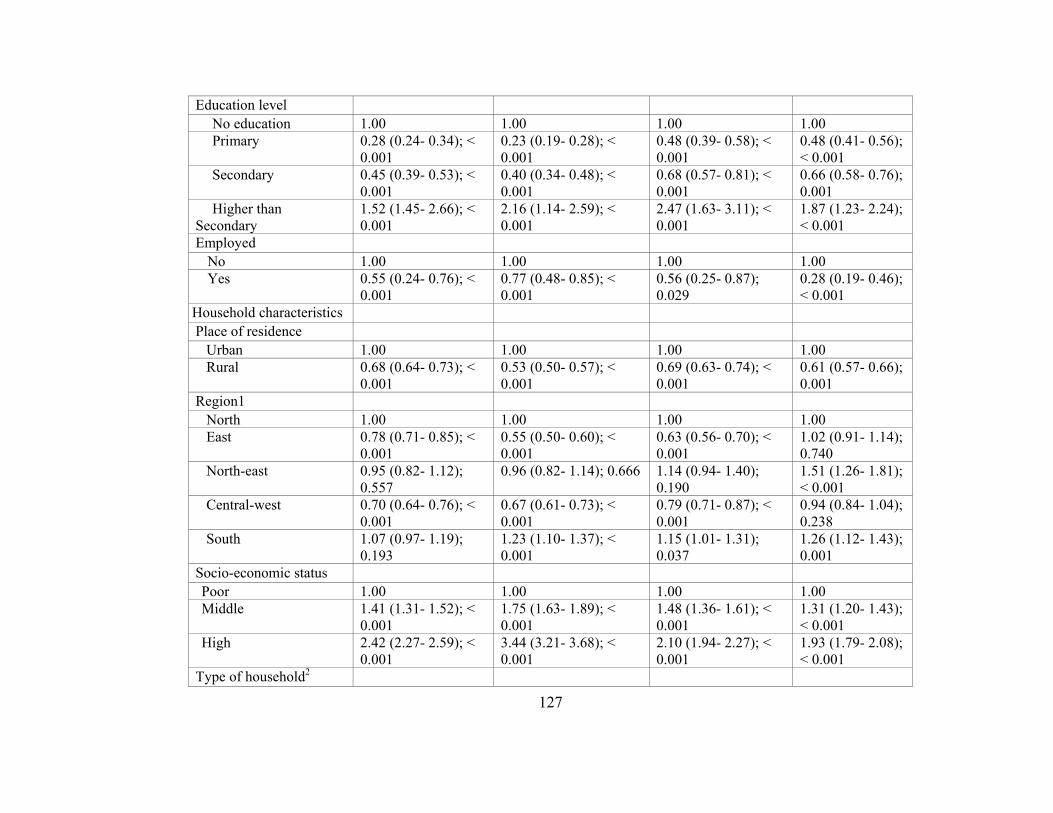
127
Education level No education 1.00 1.00 1.00 1.00 Primary 0.28 (0.24- 0.34); <
0.001 0.23 (0.19- 0.28); < 0.001
0.48 (0.39- 0.58); < 0.001
0.48 (0.41- 0.56); < 0.001
Secondary 0.45 (0.39- 0.53); < 0.001
0.40 (0.34- 0.48); < 0.001
0.68 (0.57- 0.81); < 0.001
0.66 (0.58- 0.76); 0.001
Higher than Secondary
1.52 (1.45- 2.66); < 0.001
2.16 (1.14- 2.59); < 0.001
2.47 (1.63- 3.11); < 0.001
1.87 (1.23- 2.24); < 0.001
Employed No 1.00 1.00 1.00 1.00 Yes 0.55 (0.24- 0.76); <
0.001 0.77 (0.48- 0.85); < 0.001
0.56 (0.25- 0.87); 0.029
0.28 (0.19- 0.46); < 0.001
Household characteristics Place of residence
Urban 1.00 1.00 1.00 1.00 Rural 0.68 (0.64- 0.73); <
0.001 0.53 (0.50- 0.57); < 0.001
0.69 (0.63- 0.74); < 0.001
0.61 (0.57- 0.66); 0.001
Region1 North 1.00 1.00 1.00 1.00 East 0.78 (0.71- 0.85); <
0.001 0.55 (0.50- 0.60); < 0.001
0.63 (0.56- 0.70); < 0.001
1.02 (0.91- 1.14); 0.740
North-east 0.95 (0.82- 1.12); 0.557
0.96 (0.82- 1.14); 0.666 1.14 (0.94- 1.40); 0.190
1.51 (1.26- 1.81); < 0.001
Central-west 0.70 (0.64- 0.76); < 0.001
0.67 (0.61- 0.73); < 0.001
0.79 (0.71- 0.87); < 0.001
0.94 (0.84- 1.04); 0.238
South 1.07 (0.97- 1.19); 0.193
1.23 (1.10- 1.37); < 0.001
1.15 (1.01- 1.31); 0.037
1.26 (1.12- 1.43); 0.001
Socio-economic status Poor 1.00 1.00 1.00 1.00 Middle 1.41 (1.31- 1.52); <
0.001 1.75 (1.63- 1.89); < 0.001
1.48 (1.36- 1.61); < 0.001
1.31 (1.20- 1.43); < 0.001
High 2.42 (2.27- 2.59); < 0.001
3.44 (3.21- 3.68); < 0.001
2.10 (1.94- 2.27); < 0.001
1.93 (1.79- 2.08); < 0.001
Type of household2

128
Nuclear 1.00 1.00 1.00 1.00 Joint with child’s
grandparents 1.48 (1.39- 1.58); < 0.001
1.46 (1.37- 1.56); < 0.001
1.19 (1.10- 1.28); < 0.001
1.25 (1.16- 1.35); < 0.001
Joint without child’s grandparents
1.12 (1.05- 1.21); 0.001
1.15 (1.07- 1.24); < 0.001
1.13 (1.04- 1.23); < 0.001
0.96 (0.88- 1.06); 0.429
Feeding practices3 Received protein rich foods
Yes 1.00 1.00 1.00 1.00 No 0.71 (0.66- 0.75); <
0.001 0.64 (0.60- 0.68); < 0.001
0.67 (0.61- 0.73); < 0.001
0.81 (0.76- 0.87); < 0.001
Received fruits & vegetables
Yes 1.00 1.00 1.00 1.00 No 0.82 (0.77- 0.87); <
0.001 0.73 (0.68- 0.78); < 0.001
0.81 (0.75- 0.87); < 0.001
0.90 (0.84- 0.97); 0.005
Received cereals/cereal based foods
Yes 1.00 1.00 1.00 1.00 No 1.09 (1.01- 1.19);
0.031 0.81 (0.75- 0.88); < 0.001
0.87 (0.79- 0.95) < 0.001
1.55 (1.40- 1.72); < 0.001
Received fats & oils Yes 1.00 1.00 1.00 1.00 No 0.77 (0.71- 0.84); <
0.001 0.66 (0.61- 0.72); < 0.001
0.64 (0.56-0.74); < 0.001
0.94 (0.86- 1.03); 0.173
Diet quality Poor 1.00 1.00 1.00 1.00 Medium 1.18 (1.04- 1.35);
0.013 0.86 (0.77- 0.97); 0.015 0.90 (0.80- 1.02);
0.095 0.72 (0.66- 0.78); 0.001
Good 1.68 (1.53- 1.77); < 0.001
1.55 (1.33- 1.85); < 0.001
1.21 (1.10- 1.96); < 0.001
1.84 (1.77- 2.92); 0.001
Immunization status4 No immunization 1.0 1.0 1.0 1.00 Some 1.17 (1.06- 1.30); 1.15 (1.04- 1.27); 0.006 1.12 (1.01- 1.25); 0.92 (0.80- 1.07);

129
immunization/incomplete 0.002 0.050 0.276 Up-to-date
immunization 2.16 (1.92- 2.42); < 0.001
2.21 (1.97- 2.47); < 0.001
1.66 (1.46- 1.88); < 0.001
1.35 (1.16- 1.57); < 0.001
Hb: Hemoglobin; HAZ: Height-for-age z score; WAZ: weight-for-age z score; WHZ: weight-for-height z score; OR: Odds
Ratio; CI: Confidence Interval
1. North: Jammu & Kashmir, Himachal Pradesh, Haryana, Punjab, Delhi, Uttar Pradesh, Uttaranchal; East: Bihar, Jharkhand,
Chhattisgarh, West Bengal, Orissa; North-East: Assam, Arunachal Pradesh, Manipur, Meghalaya, Mizoram, Nagaland,
Sikkim, Tripura; South: Andhra Pradesh, Karnataka, Kerala, Tamil Nadu; Central-west: Maharashtra, Goa, Gujarat, Madhya
Pradesh, Rajasthan.
2. Type of household: Nuclear: Index child living with parents and siblings, Joint with grandparents: Index child living with
parents, siblings, relatives including grandparents, Joint with grandparents: Index child living with parents, siblings and other
relatives excluding grandparents
3. Corrected for age of index child
4. Corrected for age of index child and recommended vaccines
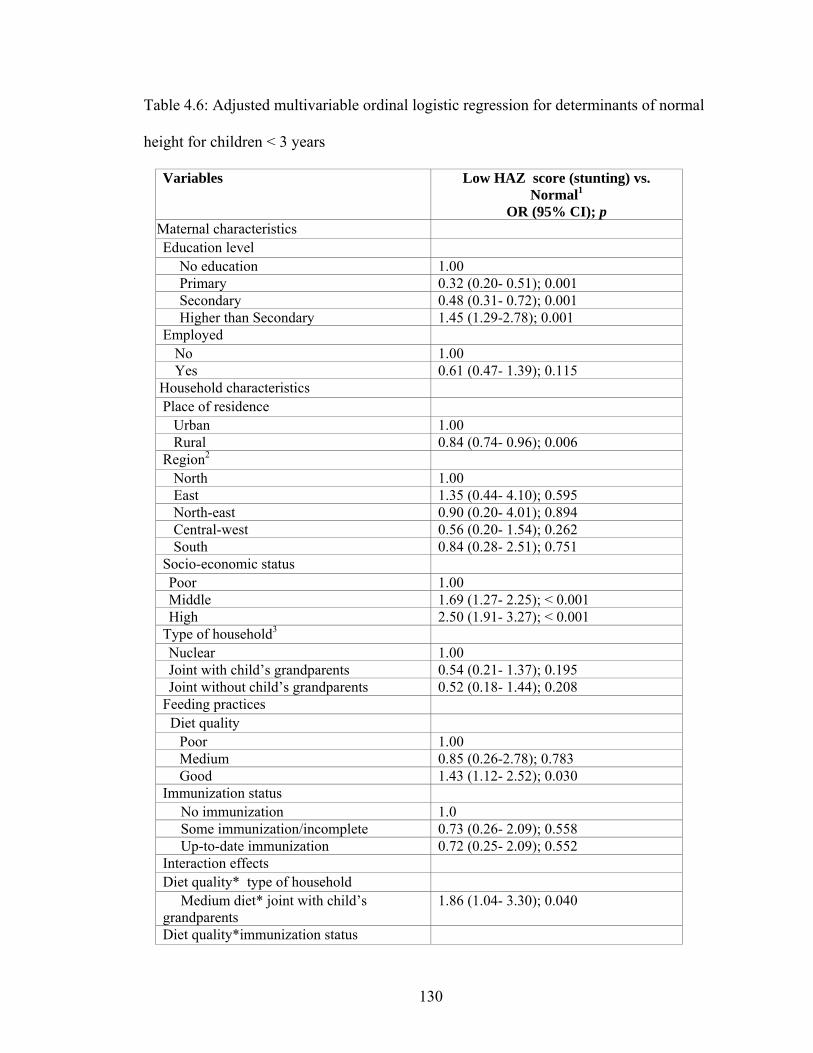
130
Table 4.6: Adjusted multivariable ordinal logistic regression for determinants of normal
height for children < 3 years
Variables Low HAZ score (stunting) vs. Normal1
OR (95% CI); p Maternal characteristics Education level
No education 1.00 Primary 0.32 (0.20- 0.51); 0.001 Secondary 0.48 (0.31- 0.72); 0.001 Higher than Secondary 1.45 (1.29-2.78); 0.001
Employed No 1.00 Yes 0.61 (0.47- 1.39); 0.115
Household characteristics Place of residence
Urban 1.00 Rural 0.84 (0.74- 0.96); 0.006
Region2 North 1.00 East 1.35 (0.44- 4.10); 0.595 North-east 0.90 (0.20- 4.01); 0.894 Central-west 0.56 (0.20- 1.54); 0.262 South 0.84 (0.28- 2.51); 0.751
Socio-economic status Poor 1.00 Middle 1.69 (1.27- 2.25); < 0.001 High 2.50 (1.91- 3.27); < 0.001
Type of household3 Nuclear 1.00 Joint with child’s grandparents 0.54 (0.21- 1.37); 0.195 Joint without child’s grandparents 0.52 (0.18- 1.44); 0.208
Feeding practices Diet quality
Poor 1.00 Medium 0.85 (0.26-2.78); 0.783 Good 1.43 (1.12- 2.52); 0.030
Immunization status No immunization 1.0 Some immunization/incomplete 0.73 (0.26- 2.09); 0.558 Up-to-date immunization 0.72 (0.25- 2.09); 0.552
Interaction effects Diet quality* type of household
Medium diet* joint with child’s grandparents
1.86 (1.04- 3.30); 0.040
Diet quality*immunization status
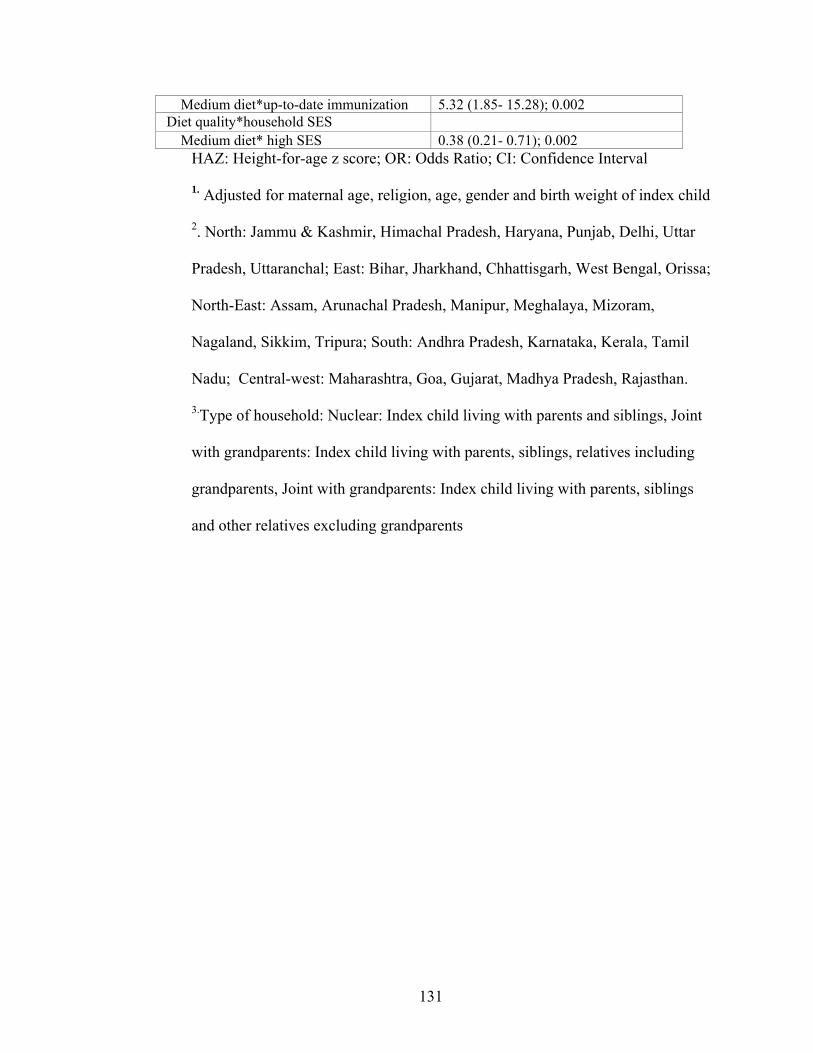
131
Medium diet*up-to-date immunization 5.32 (1.85- 15.28); 0.002 Diet quality*household SES
Medium diet* high SES 0.38 (0.21- 0.71); 0.002 HAZ: Height-for-age z score; OR: Odds Ratio; CI: Confidence Interval
1. Adjusted for maternal age, religion, age, gender and birth weight of index child
2. North: Jammu & Kashmir, Himachal Pradesh, Haryana, Punjab, Delhi, Uttar
Pradesh, Uttaranchal; East: Bihar, Jharkhand, Chhattisgarh, West Bengal, Orissa;
North-East: Assam, Arunachal Pradesh, Manipur, Meghalaya, Mizoram,
Nagaland, Sikkim, Tripura; South: Andhra Pradesh, Karnataka, Kerala, Tamil
Nadu; Central-west: Maharashtra, Goa, Gujarat, Madhya Pradesh, Rajasthan.
3.Type of household: Nuclear: Index child living with parents and siblings, Joint
with grandparents: Index child living with parents, siblings, relatives including
grandparents, Joint with grandparents: Index child living with parents, siblings
and other relatives excluding grandparents

132
Table 4.7: Adjusted multivariable ordinal logistic regression for determinants of normal
weight-for-age for children < 3 years
Variables Low WAZ score (underweight) vs. Normal1
OR (95% CI); p Maternal characteristics Education level
No education 1.00 Primary 0.99 (0.21- 4.73); 0.987 Secondary 1.89 (0.42- 8.55); 0.406 Higher than Secondary 2.15 ( 0.70- 3.58); 0.569
Employed No 1.00 Yes 1.54 (0.46- 2.81); 0.214
Household characteristics Place of residence
Urban 1.00 Rural 1.02 (0.90- 1.16); 0.776
Region North 1.00 East 1.99 (0.52- 7.58); 0.314 North-east 3.21 ( 0.34- 29.95); 0.306 Central-west 1.00 (0.32- 3.16); 0.900 South 1.73 (0.48- 6.19); 0.400
Socio-economic status Poor 1.00 Middle 1.29 (0.27- 6.09); 0.745 High 5.10 (1.27- 20.50); 0.022
Type of household3 Nuclear 1.00 Joint with child’s grandparents 1.05 (0.90- 3.93); 0.052 Joint without child’s grandparents 0.95 (0.43- 2.08); 0.900
Feeding practices Diet quality
Poor 1.00 Medium 1.44 (0.92- 2.55);0.109 Good 2.41 (1.24- 3.45); 0.011
Immunization status No immunization 1.0 Some immunization/incomplete 1.61 (0.56- 4.81); 0.373 Complete 1.65 (0.56- 4.81); 0.362
Interaction effects Maternal education* region No education* East 0.33 (0.13- 0.85); 0.021 Diet quality* region Good diet* Central-west 1.67 (1.07- 2.60); 0.024

133
WAZ: weight-for-age z score; OR: Odds Ratio; CI: Confidence Interval
1. Adjusted for maternal age, religion, age, gender and birth weight of index child
2. North: Jammu & Kashmir, Himachal Pradesh, Haryana, Punjab, Delhi, Uttar Pradesh,
Uttaranchal; East: Bihar, Jharkhand, Chhattisgarh, West Bengal, Orissa; North-East:
Assam, Arunachal Pradesh, Manipur, Meghalaya, Mizoram, Nagaland, Sikkim, Tripura;
South: Andhra Pradesh, Karnataka, Kerala, Tamil Nadu; Central-west: Maharashtra,
Goa, Gujarat, Madhya Pradesh, Rajasthan.
3.Type of household: Nuclear: Index child living with parents and siblings, Joint with
grandparents: Index child living with parents, siblings, relatives including grandparents,
Joint with grandparents: Index child living with parents, siblings and other relatives
excluding grandparents

134
Table 4.8: Adjusted multivariable ordinal logistic regression for determinants of normal
weight-for-height for children < 3 years
Variables Low WHZ (wasting) score vs. Normal1
OR (95% CI); p Maternal characteristics Education level
No education 1.00 Primary 2.33 (0.59- 9.30); 0.229 Secondary 4.23 (0.66- 16.23); 0.342 Higher than Secondary 5.65 (0.57- 7.46); 0.122
Employed No 1.00 Yes 0.72 (0.54- 2.04); 0.121
Household characteristics Place of residence
Urban 1.00 Rural 1.04 (0.90- 1.21); 0.563
Region2 North 1.00 East 0.50 (0.33- 0.77); 0.001 North-east 1.06 (0.33- 0.77); 0.876 Central-west 0.67 (0.44- 1.01); 0.058 South 0.59 (0.39- 1.89); 0.120
Socio-economic status Poor 1.00 Middle 2.91 (0.59- 14.26); 0.189 High 5.24 (1.32- 20.79); 0.019
Type of household3 Nuclear 1.00 Joint with child’s grandparents 0.98 (0.47- 2.03); 0.952 Joint without child’s grandparents 1.91 (0.70- 5.16); 0.205
Feeding practices Diet quality
Poor 1.00 Medium 1.27 (0.37- 4.36); 0.699 Good 2.51 (1.38- 3.14); 0.033
Immunization status No immunization 1.00 Some immunization/incomplete 0.60 (0.31- 1.15); 0.125 Up-to-date immunization 0.76 (0.40- 1.46); 0.415
Interaction effects Diet quality*immunization status
Poor diet*up-to-date immunization 2.17 (1.05- 4.50);0.037 Maternal education level* Household SES
Primary education* high SES 0.19 (0.05- 0.76); 0.019

135
WHZ: weight-for-height z score; OR: Odds Ratio; CI: Confidence Interval
1. Adjusted for maternal age, religion, age, gender and birth weight of index child
2. North: Jammu & Kashmir, Himachal Pradesh, Haryana, Punjab, Delhi, Uttar Pradesh,
Uttaranchal; East: Bihar, Jharkhand, Chhattisgarh, West Bengal, Orissa; North-East:
Assam, Arunachal Pradesh, Manipur, Meghalaya, Mizoram, Nagaland, Sikkim, Tripura;
South: Andhra Pradesh, Karnataka, Kerala, Tamil Nadu; Central-west: Maharashtra,
Goa, Gujarat, Madhya Pradesh, Rajasthan.
3.Type of household: Nuclear: Index child living with parents and siblings, Joint with
grandparents: Index child living with parents, siblings, relatives including grandparents,
Joint with grandparents: Index child living with parents, siblings and other relatives
excluding grandparents
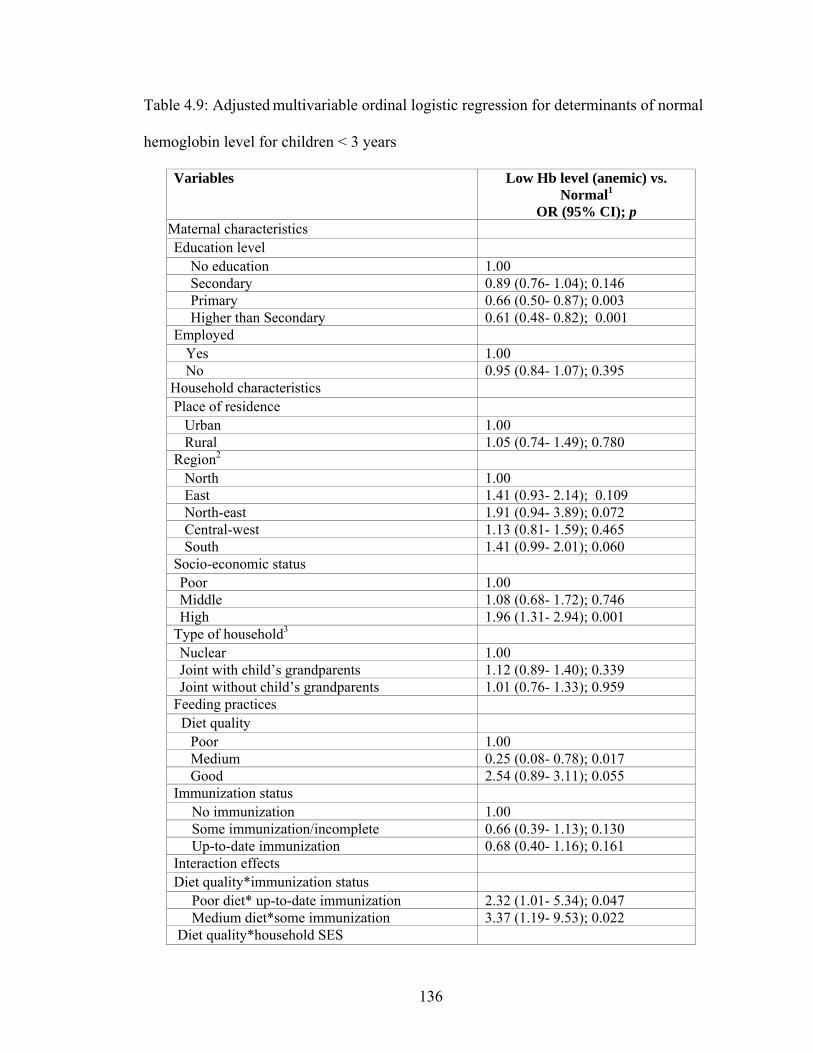
136
Table 4.9: Adjusted multivariable ordinal logistic regression for determinants of normal
hemoglobin level for children < 3 years
Variables Low Hb level (anemic) vs. Normal1
OR (95% CI); p Maternal characteristics Education level
No education 1.00 Secondary 0.89 (0.76- 1.04); 0.146 Primary 0.66 (0.50- 0.87); 0.003 Higher than Secondary 0.61 (0.48- 0.82); 0.001
Employed Yes 1.00 No 0.95 (0.84- 1.07); 0.395
Household characteristics Place of residence
Urban 1.00 Rural 1.05 (0.74- 1.49); 0.780
Region2 North 1.00 East 1.41 (0.93- 2.14); 0.109 North-east 1.91 (0.94- 3.89); 0.072 Central-west 1.13 (0.81- 1.59); 0.465 South 1.41 (0.99- 2.01); 0.060
Socio-economic status Poor 1.00 Middle 1.08 (0.68- 1.72); 0.746 High 1.96 (1.31- 2.94); 0.001
Type of household3 Nuclear 1.00 Joint with child’s grandparents 1.12 (0.89- 1.40); 0.339 Joint without child’s grandparents 1.01 (0.76- 1.33); 0.959
Feeding practices Diet quality
Poor 1.00 Medium 0.25 (0.08- 0.78); 0.017 Good 2.54 (0.89- 3.11); 0.055
Immunization status No immunization 1.00 Some immunization/incomplete 0.66 (0.39- 1.13); 0.130 Up-to-date immunization 0.68 (0.40- 1.16); 0.161
Interaction effects Diet quality*immunization status
Poor diet* up-to-date immunization 2.32 (1.01- 5.34); 0.047 Medium diet*some immunization 3.37 (1.19- 9.53); 0.022
Diet quality*household SES

137
Medium diet* medium SES 1.92 (1.27- 2.88); 0.002 Diet quality* regions
Poor diet* East region 1.71 (1.03- 2.84); 0.038 Hb: Hemoglobin; OR: Odds Ratio; CI: Confidence Interval
1. Adjusted for maternal age, religion, age, gender and birth weight of index child
2. North: Jammu & Kashmir, Himachal Pradesh, Haryana, Punjab, Delhi, Uttar
Pradesh, Uttaranchal; East: Bihar, Jharkhand, Chhattisgarh, West Bengal, Orissa;
North-East: Assam, Arunachal Pradesh, Manipur, Meghalaya, Mizoram, Nagaland,
Sikkim, Tripura; South: Andhra Pradesh, Karnataka, Kerala, Tamil Nadu; Central-
west: Maharashtra, Goa, Gujarat, Madhya Pradesh, Rajasthan.
3.Type of household: Nuclear: Index child living with parents and siblings, Joint with
grandparents: Index child living with parents, siblings, relatives including
grandparents, Joint with grandparents: Index child living with parents, siblings and
other relatives excluding grandparents
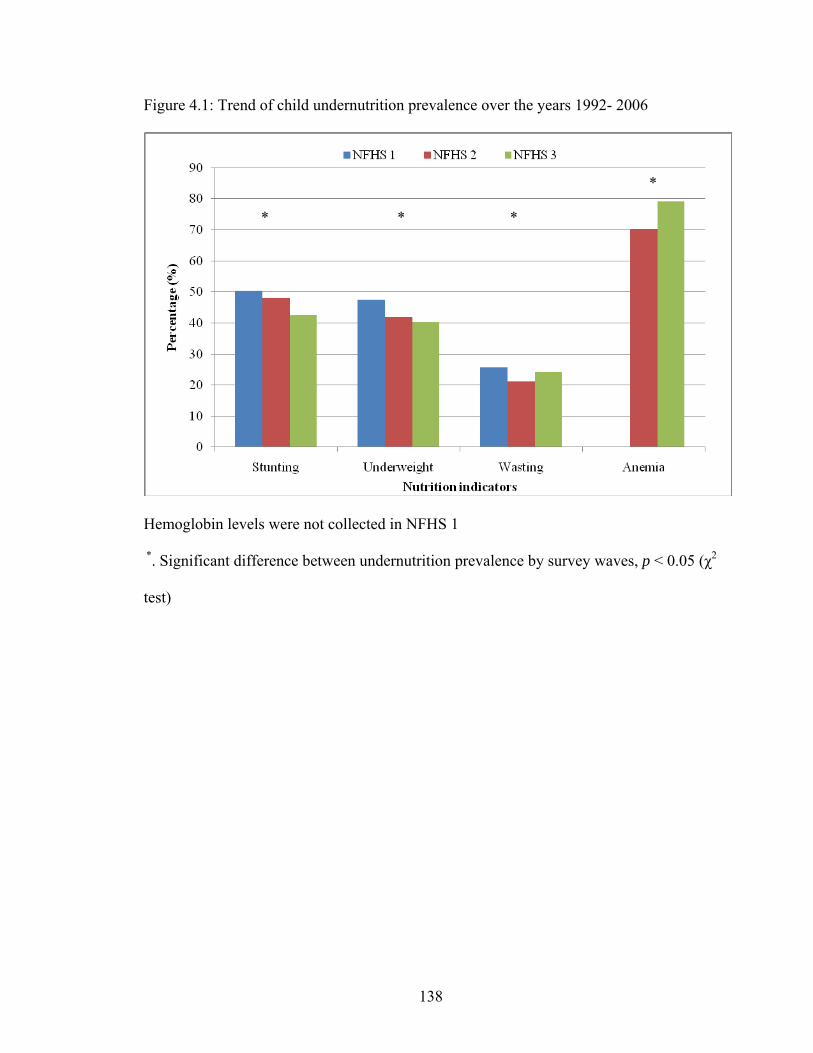
138
Figure 4.1: Trend of child undernutrition prevalence over the years 1992- 2006
Hemoglobin levels were not collected in NFHS 1
*. Significant difference between undernutrition prevalence by survey waves, p < 0.05 (χ2
test)
* * *
*

139
Figure 4.2 a: Mean HAZ score by place of residence

140
Figure 4.2 b: Mean WAZ score by place of residence

141
Figure 4.2 c: Mean WHZ score by place of residence

142
Figure 4.2 d: Mean hemoglobin level by place of residence
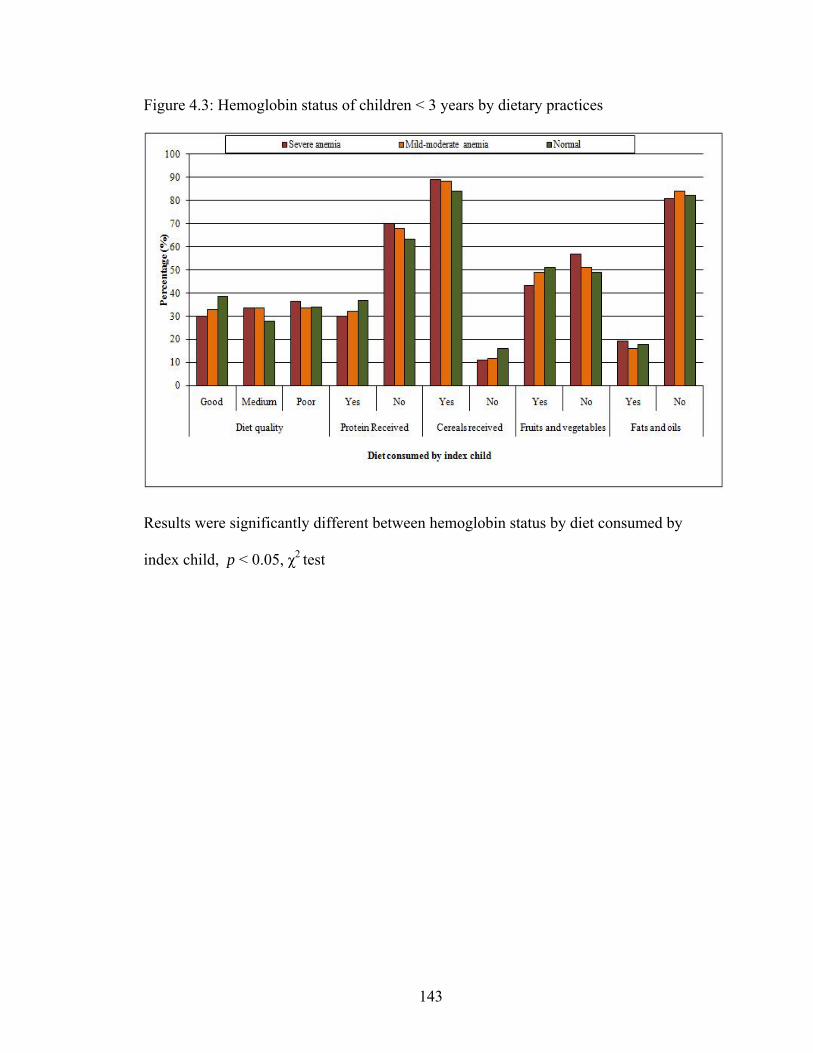
143
Figure 4.3: Hemoglobin status of children < 3 years by dietary practices
Results were significantly different between hemoglobin status by diet consumed by
index child, p < 0.05, χ2 test
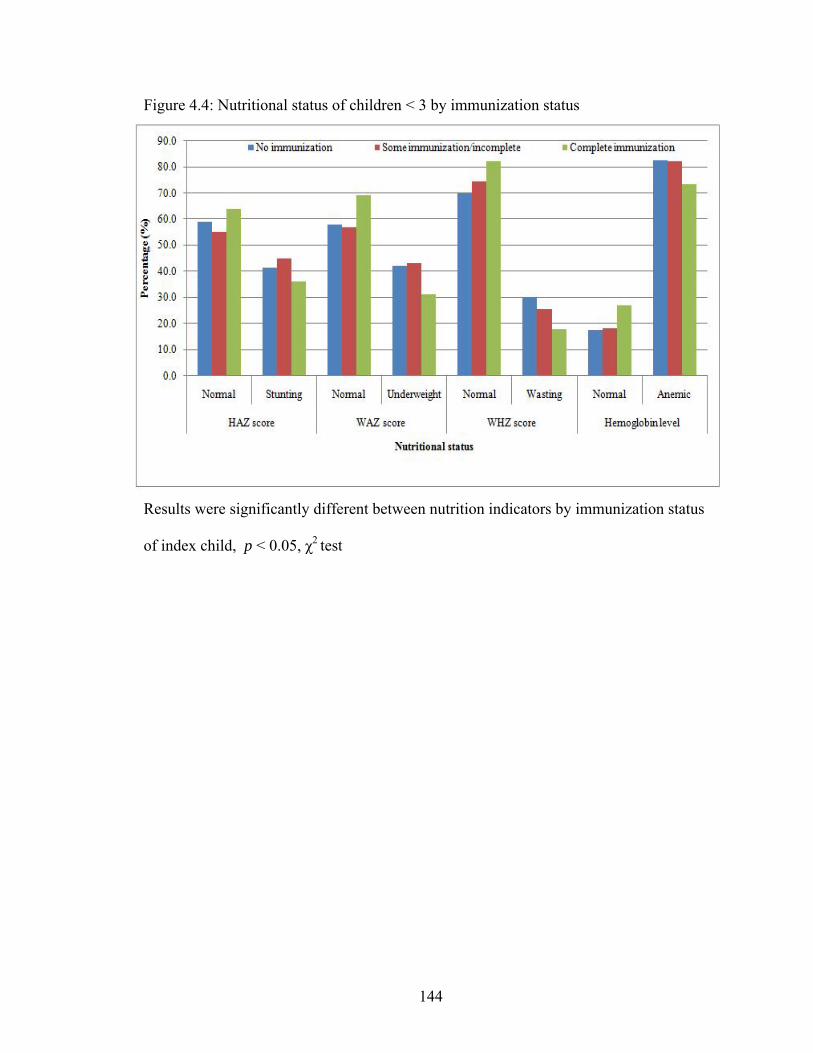
144
Figure 4.4: Nutritional status of children < 3 by immunization status
Results were significantly different between nutrition indicators by immunization status
of index child, p < 0.05, χ2 test
145
CHAPTER 5
PREDICTORS OF OVERWEIGHT IN CHILDREN UNDER 5 YEARS IN INDIA1
1 Chakraborty, P. and A. K. Anderson. 2010. Current Research Journal of Social Science. 2:138-146. Reprinted here with permission of publisher.
146
Abstract
The prevalence of early childhood overweight has increased dramatically in developing
countries such as India. Lifestyle factors and socioeconomic status have been linked to
the increasing prevalence of overweight in older children. The present study aimed to
examine the predictors of overweight among children < 5 years in India. We performed a
secondary data analysis using the most recent wave of India’s National Health and
Family Survey (NFHS 3) conducted from 2005-2006. The survey was conducted in all
the 29 states in India and covered households from both rural and urban areas. Mothers
aged 15-49 years with a child 5 years or younger (index child) were interviewed as part
of the survey. For the purpose of the current study, participants with complete
information on anthropometric indices on the index child were included in the final
analysis. Our final analytical sample was therefore 23,814. Maternal characteristics such
as urban residency, education and overweight/obese status increased the risk of
overweight in index children. Children from the East- North East region were less likely
to be overweight compared to their counterparts from North, South and Central-west
regions of India. In addition to this, stunted children were at the greatest risk of having a
Body Mass Index-for-age z score (BAZ) > 2.0. Dietary fat intake of the index child
significantly increased the risk of childhood overweight. The study suggests the need to
target nutrition and health programs towards the urban affluent households and educated
women to prevent the onset of overweight during early childhood.
147
Introduction
The increasing prevalence of childhood overweight has become a growing
concern for public health, as nearly one-third of overweight children grow up to become
overweight or obese adults (1) with increased risks of chronic diseases (2, 3). Children
from industrialized countries are at an increasing risk of being overweight where the
prevalence has more than doubled in the past three decades (4). It is estimated that nearly
40% of school-age children will be overweight in America, Eastern Mediterranean and
European regions in recent years (4). Consequently, studies conducted on preschool
children from industrialized and developing countries provide evidence of an increasing
trend of overweight prevalence in this age group (5- 7).
The cause of increasing childhood overweight in developing countries is
attributed to the growing urbanization, transition towards a high fat Western diet and
physical inactivity (8). The existence of chronic undernutrition (stunting) in early
childhood also seems to magnify the risks of being overweight and increased adiposity in
these children (9). With respect to increasing weight gain in early childhood, maternal
socio-demographic characteristics such as education, employment and socio-economic
status and genetic factors may predispose a child to the risks of being overweight (5, 9).
Similar to the observations in most developing countries, adaptation of a high
caloric Western diet of refined cereals, fast foods and sedentary lifestyle in India are
reported to be the primary causes of the increasing prevalence of overweight, insulin-
resistance, metabolic syndromes and dyslipidemia in children (10- 12). While children
and adolescents (aged 5 to 18 years) from the country’s capital Delhi, were reported to
consume energy dense fast foods nearly 4 times a week (12), a noticeable increase in

148
overweight prevalence from 16.0% in 2002 to 24.0% in 2006-2007 was observed among
this subpopulation (11). Previous studies conducted with urban school and preschool
children document an overweight prevalence greater than 10.0% (12) and 4.5%
respectively (13). Although the national prevalence of overweight among preschool
children in India is similar to the estimated prevalence in developing countries (3.5% and
3.3% respectively), it is higher than the overall prevalence in Asia (2.9%) (14). In
addition to this a noticeable increase in overweight and obesity prevalence among older
children have been reported in India (12, 15). Simultaneously, with majority of Indian
children < 5 years still suffering from underweight and stunting, others are more prone to
becoming overweight, which has public health impact on the country. It is therefore
imperative to understand and identify the underlying causes of the growing public health
problem in this subpopulation. To the best of our knowledge, there is a dearth of
literature on factors associated with overweight among Indian children < 5 years of age.
The present study therefore examines the predictors of overweight in these children.
Methods
Study design and data
This study is a secondary data analysis of the most recent wave of India’s
National Family Health Survey (NFHS 3) conducted during 2005- 2006. This survey is
periodically conducted by the Ministry of Health and Family Welfare, Government of
India, with technical assistance from ORC Macro, USA (16). Sampling design of NFHS
consisted of two-stage and three-stage stratifications in rural and urban areas respectively.
The survey interviewed women aged 15-49 years and obtained information on
demographic, socio-economic and health of 124,285 women. Details about survey
149
procedure and sampling are reported elsewhere (17). To compare the regional differences
in participants’ characteristics and predictors of childhood overweight in the current
study, we divided the country into 4 regions- namely: North, East-North East, South and
Central-West regions (18).
Subjects
For the present study, we included non-pregnant women with a living child < 5
years (index child) from singleton births, with complete information on anthropometric
indices resulting in an analytical sample size of 23,814.
Dependent variable
Childhood overweight was assessed using the World Health Organization’s
(WHO) cut-off value of > 2.0 standard deviation for BAZ (19). This is a standardized
variable that has been shown to predict overweight/obesity related complications in
children (20). We used BAZ in the current study because of the lack of information on
other reliable indicators of adiposity such as body composition and skin fold thickness
measurements in the NFHS data sets.
Independent variables
Independent variables were grouped into different categories namely socio-
demographic characteristics, place of residence and infant/child feeding practices.
Variables of interest capturing the socio-demographic characteristics were age,
employment, religion, education and economic status of the respondent together with age
and gender of the index child. Socio-economic status of the respondents were based on
the wealth index classifications of NFHS (17). Region and urban/rural area were
variables capturing the respondent’s place of residence.

150
The NFHS 3 obtained information on height and weight measurements of women
aged 15 to 49 years and children born between January 2000 and 2001. These
measurements were used as a proxy to assess the nutritional status of mothers and the
index child. Long term nutritional status (stunting) of the index child was captured using
height-for-age z score (HAZ) categorized as stunted (HAZ < -2.0) or normal (HAZ ≥ -
2.0) (19). Maternal Body Mass Index (BMI) was used to classify mothers as underweight
(< 18.5 kg/m2), normal (18.5–24.9 kg/m2), overweight (25.0- 29.9 kg/m2) and obese (≥
30.0 kg/m2) based on WHO’s recommendations (21).
Variables capturing infant/child feeding practices included foods fed 24 hours
prior to the survey. These foods were further grouped as carbohydrate (e.g., porridge,
potatoes/tubers and/or bread/other grain products) and protein rich foods (e.g., meat,
beans, pulses, nuts, eggs, milk and milk products), fruits and vegetables (e.g., green leafy
vegetables, yellow or orange fruits and vegetables) and fats and oil.
Statistical Analysis
The NFHS data sets were downloaded from Demographic and Health Survey
(Measure DHS), and analyzed using SPSS for windows version 16.0 (SPSS Inc, Chicago,
IL). We used a sample weight (national women’s weight) to adjust for oversampling and
non-response from different places within the country. General description of the data is
reported as weighted means ± standard deviation (SD) and percentages. Covariates were
analyzed primarily as categorical variables in bivariate analysis.
BAZ score of the index child was dichotomized as BAZ score >2.0 (overweight)
versus -2.0 ≤ BAZ score ≤ 2.0 (normal weight) and used as the dependent variable for
logistic regression. Univariate and multivariate logistic regression were performed to

151
identify the predictors of childhood overweight. Variables from each of the groups of
independent variables (as described above) that came up significant in the univariate
analyses were further used in multivariate logistic regression to determine the
independent influence of each variable on childhood overweight after adjusting for other
important covariates. Results were considered significant if p≤0.05.
Results
Characteristics of participants
The socio-demographic characteristics of the participants from the four regions
are presented in Table 5.1. Hinduism was the primary religion practiced across the
country, along with Muslim, Christianity, Sikhism and other minor religions (Buddhism,
Jainism Zoroastrian, Doni-polo) and no religion. Almost 98.0% of the participants were
married in the four regions. Majority (> 60.0%) of the participants were aged between 20-
29 years (26.7 ± 5.5 years). While there was a significant regional difference in education
levels and employment status of participants, the highest illiteracy (48.0%) and
unemployment (75.0%) rates were observed in the East-North East region (Table 5.1).
Additionally, a greater proportion of rural women (35.2%) of the four regions were
employed as compared to their urban counterparts (19.0%), with nearly 75.0% engaged
in agricultural related activities. In contrast, the few employed urban women were
professionals and of a higher socio-economic status (data not shown). With respect to
socio-economic status, a greater percentage of participants (30.9%) from the poorest
socio-economic category came from the East- North East region as compared to only
9.4% of the participants from the Southern region (Table 5.1). The mean age of the index
152
child was 26.0 ± 16.4 months (range: 0 to 59 months). More than 50.0% of the children
included in our analysis were males.
Distribution and characteristics of overweight children
Childhood overweight was widely prevalent in urban areas (3.5%) as compared to
rural areas (2.1%). There was a significant (p<0.001) regional difference in overweight
prevalence, with the highest observed in the Southern region (3.3%), followed by North
(2.6%), Central-West (2.6%) and East-North East (1.8%) regions. Interestingly,
overweight prevalence was similar in the urban areas of the four regions (North: 2.7% ;
East North East: 3.3%; South: 3.5%; Central West: 3.9% ). Childhood overweight was
highest in rural parts of the Southern region (3.2%) compared to the other regions (North:
2.6%; East North East: 1.4%; Central west: 2.0%)
Table 5.2 presents the characteristics of children according to their weight status
(normal weight vs. overweight). Compared to normal weight children, overweight
children were likely to be 12.0 to 23.9 months of age (p<0.001; Table 5.2). Additionally,
overweight children belonged to: Hindu and affluent households (high socio-economic
status) (Table 5.2). There were significant differences between maternal characteristics
for normal weight and overweight children (Table 5.2). Over 66.0% of the overweight
children were also stunted compared to normal weight counterparts (p<0.001). There was
no association between gender of the index child and overweight prevalence in the study
population.
Predictors of childhood overweight
Results from the univariate logistic regression are presented in Table 5.3.
Residing in the East- North East region had a protective effect on childhood overweight
153
(OR = 0.6; 95% CI: 0.5 to 0.8, p = 0.004; Table 5.3). Children from urban areas were
nearly twice as likely to be overweight (p<0.01; Table 5.3) compared to rural counterpart.
Index children from Christian (OR = 1.8; 95% CI: 1.2 to 2.9, p = 0.005) and other minor
religion (OR = 2.5; 95% CI: 1.2 to 5.1, p = 0.008) households had greater risks of being
overweight as compared to children from other religions (Hindu, Muslim, Sikh, Jain,
Zoroastrian, Doni-polo and no religion). The odds of being overweight was almost
doubled for children of mothers with either secondary or higher education compared to
children of mothers with no formal education (Table 5.3). Other significant predictors of
childhood overweight were maternal unemployment (OR= 1.4; 95% CI: 1.2 to 1.7,
p<0.001), affluent households (OR= 1.8; 95% CI: 1.4 to 2.4, p<0.001) and maternal
overweight (OR= 1.8; 95% CI: 1.4 to 2.5, p<0.001) and obesity (OR= 2.6; 95% CI: 1.6 to
4.2, p<0.001) (Table 5.3). Children aged > 24.0 months were less likely to be overweight
compared to younger children. Stunted children were at a three-fold increased risk of
being overweight compared to children with normal stature/height.
Results of the multivariate logistic regression analysis are presented in Table 5.4.
In model 1 (Table 5.4), higher maternal BMI, residing in an urban area, maternal
education level (secondary education) and unemployment, were significant independent
predictors of childhood overweight, while residing in East-North East remained a
protective factor (Table 5.4). In the second model stunting was the only independent
predictor of childhood overweight, with an odds ratio of 2.9 (95% CI: 2.4 to 3.4,
p<0.001; Table 5.4). The final model (Model 4; Table 5.4) examined the independent
influence of all significant predictors from models 1-3. Stunting, maternal
overweight/obesity, urban residence, maternal education and consumption of a high fat

154
diet by the index child remained significant independent predictors of childhood
overweight, after adjusting for important covariates (Table 5.4). Moreover, East- North
East region had a protective effect on childhood overweight (Table 5.4).
Discussion
The current study presents the predictors of overweight among children < 5 years
in India. The observation of an increased risk of childhood overweight in urban compared
to rural areas in the present study is a confirmation of reports from previous studies
conducted on preschool children from India (13) and other developing countries (14).
Even in the less developed East- North East region, overweight prevalence remained
significantly higher in the urban area, confirming the impact of urban lifestyle as
observed previously (13, 14). With respect to household socio-economic status, our
univariate logistic regression showed an increased risk for childhood overweight with
higher wealth categories. This finding is similar to a previous study of 9-15 years old
Indian children from three different socio-economic status (15). This observation is in
contrast to observations reported from industrialized countries such as the US, where
child food insecurity increased the risks of overweight in children aged 3 to 5 years (22).
Low socioeconomic households in industrialized countries face the crisis of food
insecurity, a factor associated with higher consumption of low cost calorie dense diets
and physical inactivity, culminating in increased prevalence of childhood overweight (23,
24). These practices on the other hand are speculated to be profound amongst children
from affluent households in India, thereby increasing the risks of overweight in this
section of the population. This is also evident from findings of the present study and a
previous report by Kaur et al. (2008) (12). According to the NFHS 3 report (17), 48.0%

155
of the urban population belonged to the highest socioeconomic households as compared
to only 7.4% in the rural areas. This may have contributed to the insignificant association
of socioeconomic status with overweight in the multivariate analysis in the presence of
place of residence.
Our results also indicate a strong influence of maternal BMI on childhood
overweight. Children of overweight/obese mothers were at an increased risk of being
overweight compared to their counterparts of underweight/normal weight mothers, that is
consistent with previous report by Bell et al. (2007). The authors reported a significant
positive correlation between maternal BMI and child’s BAZ, and observed an increase of
0.07 BAZ for every unit increase in maternal BMI (20). The influence of maternal
adiposity on childhood overweight can be explained by genetic predisposition, as 50.0%
of the variation in BMIs of twins reared apart was attributed to genes alone (25).
Association between parental and childhood overweight is also attributed to familial
similarities in dietary practice and environment, as reported by Fisher and Birch (1995)
(26). Other researchers have observed fat consumption and adiposity in children aged 3 to
5 years to strongly correlate (r = 0.75, p<0.01) with parental adiposity (25). Our findings
from the current study are also confirmed by a study from Germany which found
preschool children (< 6 years) of overweight mothers to be at an increased risk of having
higher BAZ (27).
Increased risk of overweight among children of mothers with secondary education
observed in the present study is in agreement with findings by Martorell et al. (5). Our
observation of maternal unemployment to be a risk factor for childhood overweight in the
current study, although not significant in the multivariate analysis was surprising. This is

156
in contrast to what has been reported by Takahasi et al. (1999) and Anderson et al.(2003)
who studied children from Japan and US respectively (28, 29). Moreover, Armar-
Klemesu et al. (2000) have documented an association between maternal employment
and childhood overweight among advantaged households in Ghana, a developing country
(30). In India, a higher proportion of educated and unemployed women were from urban
affluent households (17), while working rural women with lower literacy rates were
usually engaged in daily-labor or agriculture related activities belonged to lower socio-
economic status (17). Thus, it can be speculated that unemployed urban mothers, with
greater purchasing power, are possibly shifting towards a high calorie Western diet and
sedentary lifestyle, thereby influencing the dietary practice and physical activity levels of
their children. Transition to calorie dense diet comprising of fast foods and sweetened
beverages and inadequate physical activity in children have been identified as leading
causes of overweight in developing countries (10, 31). Further studies on lifestyle and
physical activity pattern of urban children are essential to understand the underlying
causes of the higher prevalence of overweight in children of educated, non-working
mothers.
Another interesting finding from the present study was the increased risk of
overweight among children from Christian and minor religious group (Buddhist, Jain,
Zoroastrian, Doni-polo and no religion ) compared to other religions (Hindu, Muslim and
Sikh). This finding could be due to the diversity in socioeconomic standing, dietary
practice and lifestyle/behavioral practices dictated by the different religious teachings. As
evident in the NFHS 3 report, a greater proportion of Christian (31.1%) and Jain (87.0%)
women were from higher socioeconomic household and had received more years of
157
formal education (Christian: 23.5%; Jain: 52.0% ) (17). A second reason for the increased
risk of overweight in these groups could be the relatively small proportion of the sub-
population belonging to Christianity and minor religious groups (3.0% and1.5%
respectively) as compared to Hindus (81.6%) (17). However, in the presence of other
socio-demographic characteristics, religion was no longer a significant predictor of
childhood overweight, possibly due to its relationship with other maternal demographic
and lifestyle characteristics.
Results from this study also show a strong relationship between childhood
stunting and overweight, indicating the coexistence of under and over nutrition in this
population. This finding is consistent with a previous study by Fernald and Neufeld
(2007) that reports the dual prevalence of stunting and overweight in 10.0% of children
aged 24 to 60 months in a rural community in Mexico (32). Similarly, Popkin et al.
(1996) have reported a strong significant association between stunting and overweight in
children from the Republic of South Africa and Russia (8). Stunted or undernourished
children with reduced lean body mass and lower basal metabolic rate are at an increased
risk of excess adipose tissue deposition, in the absence of nutrient dense foods required
for linear growth (8). Additionally, ‘early nutritional programming’ may affect the
potential for linear growth but not weight gain (8). Due to limited information in the data,
the various biological and environmental factors that may affect stunting and thereby lead
to the onset of overweight were not explored in the current study.
Decreased risk of childhood overweight in children > 2 years is an important
finding of the study. Children > 2 years of age are less likely to be overweight possibly
due to the decreased growth rate and stabilization of adipocytes after the first year of life
158
(33) that may influence their appetite and reduce food consumption. Children in this age
group also develop feeding skills, dietary preferences and are more physically active,
thereby expending more energy and reducing their risks of being overweight. In contrast,
parental control of infant feeding practices and restricted physical movement during
infancy may be a potential cause of rapid weight gain and adiposity (34). Additionally,
accelerated weight gain or ‘catch up growth’ between birth to 2 years significantly
increases the risks of overweight and central adiposity in children at 5 years (35), with a
higher population attributable risk (15.7%) for rapid weight gain in infancy than in early
childhood (11.7%) (36). Moreover, the prevalence of low birth weight deliveries in India
is one of the highest (28.0%) among developing countries (15.0%) (37), which may
explain a rapid catch-up growth in infancy that increase the risk of overweight in
childhood and later adulthood. Our finding of higher risk of overweight for children < 2
years is also in line with observations made by Schroeder et al.(1995) (38). The study
observed a rapid growth rate in height and weight of Guatemalan children below 2 years
of age, in contrast to children beyond 2 years. It can therefore be speculated that
prevalence of stunting in children < 2 years (‘the critical period of life’), if severe may
increase the risk of a child becoming overweight later in life. These findings also
accentuate the need for future studies to examine the biological mechanism between
growth rate, stunting and overweight in this population.
Our study also identified the intake of dietary fats as a potential predictor of
childhood overweight. Although this is in accord with other studies of older children aged
6 to 11 years (39, 40), it is in contrast to studies of children aged below 5 years (41, 42).
Assessment of fat intake in the current study was based on the mother’s report of foods
159
(containing fats and oil) consumed by the child within 24 hours prior to the survey. In the
absence of the quantity of foods consumed, we were not able to analyze the food to
estimate the fat content of such foods. On the other hand, studies reporting insignificant
association between childhood overweight and fat intake in preschool children used the
actual fat content of the diet in the assessment (41, 42). It is therefore difficult to interpret
the association between fat intake and overweight in the study population.
Study limitations and significance
A potential limitation of the study is that NFHS data sets do not provide adequate
information on infant/child feeding practice and lifestyle factors of children, and hence
their association with childhood overweight could not be examined satisfactorily. A high
proportion of the surveyed women had missing information on the index child’s
anthropometric measurements and was therefore excluded from the final analysis.
Characteristics of households included and excluded from the final analysis were similar
except for place of delivery and maternal education level. The large analytical sample-
size and representativeness of the study sample add to the strengths of the study’s
findings. Due to the cross-sectional nature of the data, causality between maternal
characteristics, dietary practices and childhood overweight cannot be confirmed.
Therefore the results need to be interpreted with caution.
So far, the focus of existing health policies and nutrition programs in India has
been on infectious diseases, undernutrition and mortality. Additionally, supplementary
nutrition programs in developing countries including India, may be contributing to the
increasing overweight prevalence being seen among previously undernourished
population. Data from 19 Latin American countries reported that while 20.0% of the
160
population received supplementary nutrition, only 12.0% of the population was
undernourished (43) suggesting possible overfeeding of well nourished children. The two
major food assistance programs in Latin America, the Chilean supplementary feeding
program and the National Nursery Schools Council Program were associated with over
nutrition among children < 6 years inspite of the reduction in undernutrition (44).
Similarly in India children (< 5 years) from low SES receive supplementary nutrition
through mid-day meal programs (in public schools) and the Integrated Child
Development Scheme (ICDS) (45). It is plausible that these supplementary feeding
programs while reducing the burden of undernutrition may be predisposing the same
children overweight (excess weight gain). Therefore, nutrition programs need to be
designed and well targeted to reduce the prevalence of undernutrition while preventing
the onset of overweight in children < 5 years. These programs also need to target lifestyle
modification, specifically for urban children from affluent households. Child feeding
practices, focusing on the concepts of variety and moderation of the different food groups
as well as adequate physical activity need to be integrated into health promotion
programs. In conclusion, factors such as urban residency, socioeconomic status, maternal
education and overweight/obesity, and childhood stunting identified as predictors of
childhood overweight in our study population have significant public health implications
in the fight against rising prevalence of overweight obesity worldwide. There is therefore
a need for longitudinal studies to examine whether these predictors have actual causal
relationships to childhood overweight in India.

161
References
1. Whitaker RC, Wright JA, Pepe MS, Seidel KD, Dietz WH. Predicting obesity in
young adulthood from childhood and parental obesity. N Engl J Med.
1997;337(13):869-873.
2. Freedman DS, Khan LK, Serdula MK, Dietz WH, Srinivasan SR, Berenson GS.
The relation of childhood BMI to adult adiposity: The Bogalusa Heart Study.
Pediatrics. 2005;115(1): 22-27.
3. Wang Y, Lobstein T. Worldwide trends in childhood overweight and obesity. Int
J Pediatr Obes. 2006;1(1):11-25.
4. Ogden CL, Troiano RP, Briefel RR, Kuczmarski RJ, Flegal KM, Johnson CL.
Prevalence of overweight among preschool children in the United States,
1971 through 1994. Pediatrics. 1997;99(4):e1-7
5. Martorell R, Khan LK, Hughes ML, Grummer-Strawn LM. Overweight and
obesity in preschool children from developing countries. Int J Obes. 2000;24(8):
59-967.
6. Canning PM, Courage ML, Frizzell LM. Prevalence of overweight and obesity in
a provincial population of Canadian preschool children. CMAJ. 2004;171(3):240-
242.
7. Popkin B M. The Nutrition Transition and Obesity in the Developing World J
Nutr. 2001;131(3):871S-873.
8. Popkin B M, Richards MK, Montiero CA. Stunting is associated with overweight
in children of four nations that are undergoing the nutrition transition. J Nutr.
1996;126(12): 3009-3016.
162
9. Vogels N, Posthumus DLA, Mariman ECM, Bouwman F, Kester ADM, Rump
ADP, Hornstra G, Westerterp-Plantenga MS. Determinants of overweight in a
cohort of Dutch children. Am J Clin Nutr. 2006;84(4):717-724.
10. Popkin BM, Horton S, Kim S, Mahal A, Jin SG. Trends in diet, nutritional status,
and diet-related noncommunicable diseases in China and India: The economic
costs of the nutrition transition. Nutr Rev. 2001;59(12):379-390.
11. Bhardwaj, S., A. Misra, L. Khurana, S. Gulati, P. Shah and N. K. Vikram.
Childhood obesity in Asian Indians: a burgeoning cause of insulin resistance,
diabetes and sub-clinical inflammation. Asia Pac J Clin Nutr. 2008;17 (S1): 172-
175.
12. Kaur S, Sachdev HP, Dwivedi SN, Lakshmy R, Kapil U. Prevalence of
overweight and obesity amongst school children in Delhi, India. Asia Pac J Clin
Nutr. 2008;17(4):592- 596.
13. Kumar HN, Mohana P, Kotian S, Sajjan BS, Kumar SG. Prevalence of
overweight and obesity among pre-school children in semi urban South India.
Indian Pediatr. 2008;45(6):497- 499.
14. de Onis M, Blossner M. Prevalence and trends of overweight among preschool
children in developing countries. Am J Clin Nutr. 2000;72(4):1032-1039.
15. Chhatwal, J., M. Verma and S. K. Riar, 2004. Obesity among preadolescents of a
developing country (India). Asia. Pac. J. Clin. Nutr., 13 (3): 231- 235.
16. Measure DHS, Demographic and health surveys. Maryland, USA.
www.measuredhs.com.
163
17. IIPS and Macro International. National Family Health Survey (NFHS-3), 2005-
06: India: Volume I. Mumbai: IIPS. 2007.
18. Mishra V, Retherford RD, Smith KR. Cooking smoke and tobacco smoke as risk
factors for stillbirth. Int J Environ Health Res. 2005;15(6):397-410.
19. WHO Multicentre Growth Reference Study Group. WHO Child Growth
Standards: Length/height-for-age, weight-for-age, weight-for-length, weight-for-
height and body mass index-for-age: Methods and development. Geneva: World
Health Organization.2006.
20. Bell LM, Byrne S, Thompson A, Ratnam N, Blair E, Bulsara M, Jones TW, Davis
EA. Increasing Body Mass Index z-score is continuously associated with
complications of overweight in children, even in the healthy weight range. J Clin.
Endocrinol Metab. 2007;92(2):517-522.
21. World Health Organization. Physical status: The use and interpretation of
anthropometry. WHO. Geneva, Switzerland:1995.
22. Casey PH, Simpson PM, Gossett JM, Bogle ML, Champagne CM, Connell C,
Harsha D, McCabe-Sellers B, Robbins JM, et al. The association of child and
household food insecurity with childhood overweight status. Pediatrics.
2006;118(5):e1406- e1413.
23. Casey PH, Szeto K, Lensing S, Bogle M, Weber J. Children in food-insufficient,
low-income families: prevalence, health, and nutrition status. Arch Pediatr
Adolesc Med. 2001;155(4):508-514.
24. Drewnowski A. Obesity and the food environment: Dietary energy density and
diet costs. Am J Prev Med. 2004;27(3):154-162.

164
25. Allison DB, Kaprio J, Korkeila M, Koskenvuo M, Neale MC, Hayakawa K. The
heritability of Body Mass Index among an international sample of monozygotic
twins reared apart. Int J Obes. 1996;20(6):501-506.
26. Fisher J O, Birch LL. Fat preferences and fat consumption of 3- to 5-year-old
children are related to parental adiposity. J Am Diet Assoc. 1995;95 (7):759-764.
27. Bergmann KE, Bergmann RL, von Kries R, Böhm O, Richter R, Dudenhausen
RW, Wahn U. Early determinants of childhood overweight and adiposity in a
birth cohort study: role of breast-feeding. Int J Obes. 2003;27 (2):162- 172.
28. Takahashi E, Yoshida K, Sugimori H, Miyakawa M, Izuno T, Yamagami T,
Kagamimori S. Influence factors on the development of obesity in 3-year-old
children based on the Toyama study. Prev Med. 1999;28(3):293-296.
29. Anderson PM, Butcher KF, Levine PB. Maternal employment and overweight
children. J Health Econ. 2003;22(3): 477-504.
30. Armar-Klemesu M, Ruel MT, Maxwell DG, Levin CE, Morris SS. Poor maternal
schooling is the main constraint to good child care practices in Accra J Nutr.
2000;130(6): 1597-1607.
31. Popkin BM. The nutrition transition in low-income countries: an emerging crisis.
Nutr Rev. 1994;52(9): 285-298.
32. Fernald LC, Neufeld LM. Overweight with concurrent stunting in very young
children from rural Mexico: Prevalence and associated factors. Eur J Clin Nutr.
2007;61(5): 623-632.
165
33. Rolland-Cachera M, Deheeger M, Bellisle F, Sempe M, Guilloud-Bataille M,
Patois E. Adiposity rebound in children: A simple indicator for predicting obesity.
Am J Clin Nutr. 1984;39(1): 129-135.
34. Ong KK, Emmett PM, Noble S, Ness A, Dunger DB, the ALSPAC Study Team.
Dietary energy intake at the age of 4 months predicts postnatal weight gain and
childhood Body Mass Index. Pediatrics. 2006;117 (3): e503-e508.
35. Ong KK, Ahmed ML, Emmett PM, Preece MA, Dunger DB, the ALSPAC Study
Team. Association between postnatal catch-up growth and obesity in childhood:
prospective cohort study. BMJ. 2000;320 (7240): 967-971.
36. Ekelund U, Ong KK, Linne Y, Søren Brage MN, Dunger DB, Wareham NJ,
Rössner S. Upward weight percentile crossing in infancy and early childhood
independently predicts fat mass in young adults: the Stockholm Weight
Development Study (SWEDES). Am J Clin Nutr. 2006;83 (2): 324-330.
37. United Nations Children's Fund. The State of the World's Children- Maternal and
New born health. UNICEF: New York. 2009. [Available from:
http://www.unicef.org/sowc09/docs/SOWC09-FullReport-EN.pdf]
38. Schroeder DG, Martorell R, Rivera JA, Ruel MT, Habicht JP. Age-differences in
the impact of nutritional supplementation on growth. J Nutr. 1995;125(4): S1051-
S1059.
39. Tucker LA, Seljaas GT, Hager RL. Body fat percentage of children varies
according to their diet composition. J Am Diet Assoc. 1997;97 (9): 981-986.
40. Moreno LA, Sarria A, Lazaro A, Bueno M. Dietary fat intake and Body Mass
Index in Spanish children. Am J Clin Nutr. 2000;72 (5): 1399S-1403.

166
41. Davies PSW. Diet composition and Body Mass Index in pre-school children. Eur
J Clin Nutr. 1997;51(7): 443- 448.
42. Newby P K, Peterson KE, Berkey CS, Leppert J, Willett WC, Colditz GA.
Dietary composition and weight change among low-income preschool children.
Arch Pediatr Adolesc Med. 2003;157 (8): 759-764.
43. Kain J, Uauy R. Targeting strategies used by the Chilean National Supplementary
Feeding program. Nutr Res. 2001;21 (4): 677- 688.
44. Uauy R, Albala C, Kain J. Obesity trends in Latin America: Transiting from
under- to overweight. J Nutr. 2001;131(3): 893S-899.
45. Misra A, Khurana L. Obesity and the metabolic syndrome in developing
countries. J Clin Endocrinol Metab. 2008;93(11): s9-30.

167
Table 5.1: Socio-demographic characteristics of women in NFHS 3 (2005-2006) by
region of residence
Regions1
Characteristics North n = 3222
East-North East
n = 7103
South n =
4152
Central-West
n = 9337
p value2
(%) Religion < 0.001
Hindu 76.8 73.5 80.5 83.0 Muslim 12.0 21.8 13.1 14.6 Christian 0.4 3.0 6.1 0.3 Sikh 10.6 0.1 0.0 0.3 Other3 0.0 1.6 0.3 2.0
Maternal age (years) < 0.001 15-19 4.4 9.0 5.4 5.4 20-24 30.8 32.0 35.3 31.2 25-29 36.4 31.4 36.7 34.0 30-34 18.8 17.0 15.6 18.3 35-39 6.5 7.1 5.3 8.3 40-44 2.5 2.6 1.6 2.3 45-49 0.6 0.9 0.1 0.5
Education level of respondent
< 0.001
No education 47.1 48.0 26.9 47.2 Primary 12.3 16.7 15.1 12.4 Secondary 32.7 31.6 46.5 33.9 Higher/college 8.0 3.7 11.5 6.5
Respondent employed < 0.001 Yes 33.6 25.1 35.0 32.3 No 66.4 74.9 65.0 67.7
Place of residence < 0.001 Urban 28.8 17.7 38.1 29.5 Rural 71.2 82.3 61.9 70.5
Socio-economic status (wealth index)4
< 0.001
Poorest 12.8 30.9 9.4 22.9 Poorer 13.1 26.2 15.8 21.0 Middle 20.6 19.3 25.3 18.4 Richer 24.4 14.5 26.7 18.7
1 North: Jammu & Kashmir, Himachal Pradesh, Haryana, Punjab, Delhi, Uttar Pradesh,
Uttaranchal; East-North East: Bihar, Jharkhand, Chhattisgarh, West Bengal, Orissa,
Assam, Arunachal Pradesh, Manipur, Meghalaya, Mizoram, Nagaland, Sikkim, Tripura;

168
South: Andhra Pradesh, Karnataka, Kerala, Tamil Nadu; Central-west: Maharashtra,
Goa, Gujarat, Madhya Pradesh, Rajasthan.
2 Significant difference between the four regions (χ2 test)
3 Other religions include Buddhist, Jain, Zoroastrian, Doni-polo and no religion
4Wealth index: definition based on NFHS classification (17).

169
Table 5.2: Characteristics of normal weight vs. overweight children in NFHS 3 (2005-
2006); (N = 23,814)
Characteristics Normal weight
children1 n = 23227
Overweight children1 n = 587
p value2
(%) Age of index child < 0.001
< 6.0 months 10.6 13.0 6.0 to 11.9 months 12.8 17.2 12.0 to 23.9 months 25.7 32.6 24.0 to 35.9 months 20.8 15.9 ≥ 36.0 months 30.5 21.3
Gender 0.07 Male 54.8 58.4 Female 45.2 41.6
Religion < 0.01 Hindu 79.0 75.1 Muslim 16.1 17.4 Christian 2.1 3.7 Sikh 1.6 1.5 Other3 1.1 2.2
Socio-economic status (wealth index)4 0.001
Poorest 21.7 16.4 Poorer 20.7 15.2 Middle 20.2 17.9 Richer 19.5 25.2 Richest 17.9 25.4
Index child’s HAZ1 < 0.001 Stunted 45.1 66.8 Normal 54.9 33.2
Mother working < 0.001 Yes 31.0 23.7 No 69.0 76.3
Education level of mother < 0.001 No education 44.1 34.1 Primary 14.2 12.4 Secondary 35.0 45.5 Higher/college 6.7 8.0
Maternal BMI (kg/m2) < 0.001 Underweight 37.8 30.2 Normal 53.5 55.7 Overweight 7.1 10.6
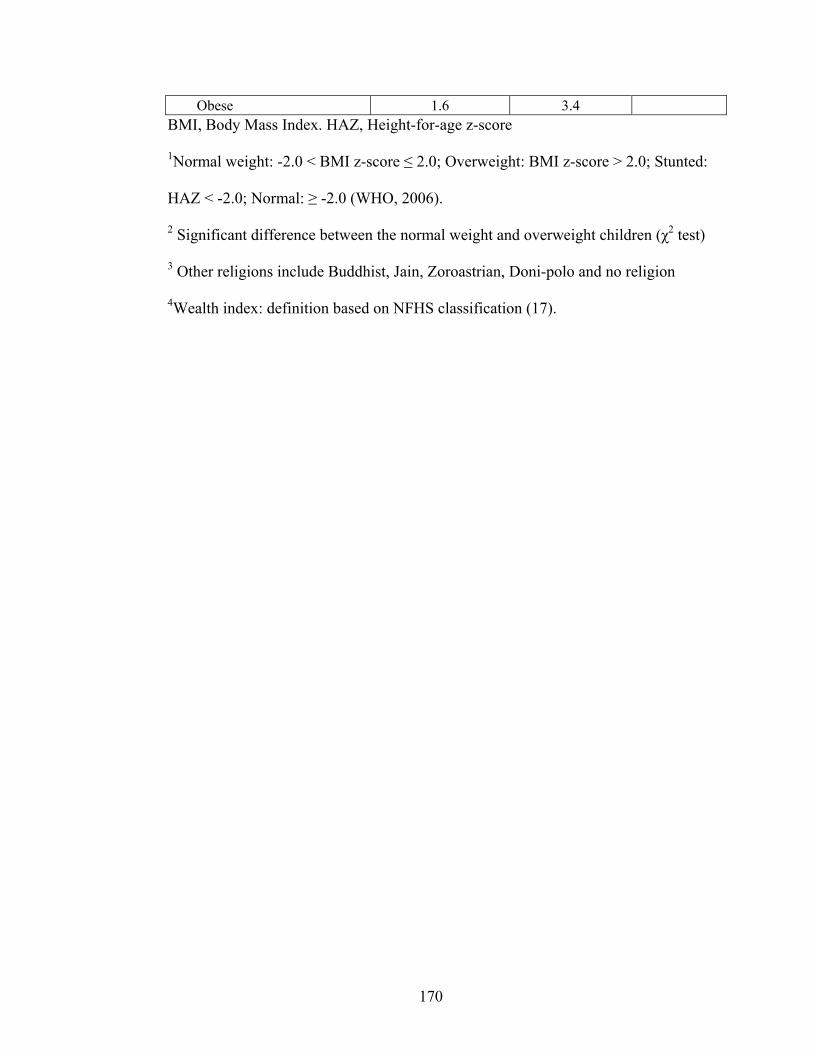
170
Obese 1.6 3.4 BMI, Body Mass Index. HAZ, Height-for-age z-score
1Normal weight: -2.0 < BMI z-score ≤ 2.0; Overweight: BMI z-score > 2.0; Stunted:
HAZ < -2.0; Normal: ≥ -2.0 (WHO, 2006).
2 Significant difference between the normal weight and overweight children (χ2 test)
3 Other religions include Buddhist, Jain, Zoroastrian, Doni-polo and no religion
4Wealth index: definition based on NFHS classification (17).
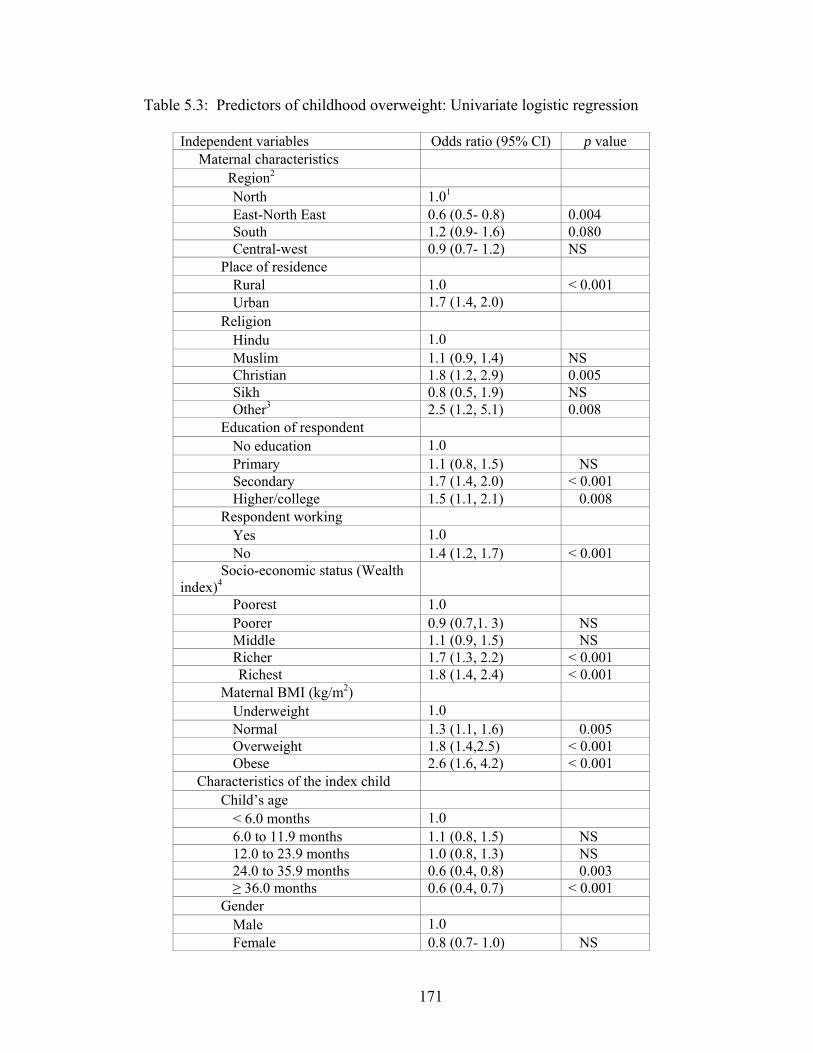
171
Table 5.3: Predictors of childhood overweight: Univariate logistic regression
Independent variables Odds ratio (95% CI) p value Maternal characteristics Region2
North 1.01 East-North East 0.6 (0.5- 0.8) 0.004 South 1.2 (0.9- 1.6) 0.080 Central-west 0.9 (0.7- 1.2) NS
Place of residence Rural 1.0 < 0.001 Urban 1.7 (1.4, 2.0)
Religion Hindu 1.0 Muslim 1.1 (0.9, 1.4) NS Christian 1.8 (1.2, 2.9) 0.005 Sikh 0.8 (0.5, 1.9) NS Other3 2.5 (1.2, 5.1) 0.008
Education of respondent No education 1.0 Primary 1.1 (0.8, 1.5) NS Secondary 1.7 (1.4, 2.0) < 0.001 Higher/college 1.5 (1.1, 2.1) 0.008
Respondent working Yes 1.0 No 1.4 (1.2, 1.7) < 0.001
Socio-economic status (Wealth index)4
Poorest 1.0 Poorer 0.9 (0.7,1. 3) NS Middle 1.1 (0.9, 1.5) NS Richer 1.7 (1.3, 2.2) < 0.001
Richest 1.8 (1.4, 2.4) < 0.001 Maternal BMI (kg/m2)
Underweight 1.0 Normal 1.3 (1.1, 1.6) 0.005 Overweight 1.8 (1.4,2.5) < 0.001 Obese 2.6 (1.6, 4.2) < 0.001
Characteristics of the index child Child’s age
< 6.0 months 1.0 6.0 to 11.9 months 1.1 (0.8, 1.5) NS 12.0 to 23.9 months 1.0 (0.8, 1.3) NS 24.0 to 35.9 months 0.6 (0.4, 0.8) 0.003 ≥ 36.0 months 0.6 (0.4, 0.7) < 0.001
Gender Male 1.0 Female 0.8 (0.7- 1.0) NS

172
Index child’s HAZ Normal (HAZ ≥ -2.0) 1.0 Stunted (HAZ < -2.0) 2.6 (2.0, 3.0) < 0.001
Child feeding practices5 Received carbohydrate rich
foods
No 1.0 Yes 0.9 (0.7, 1.2) NS
Received protein rich foods No 1.0 Yes 1.1 (0.0,1.4) 0.100
Received fruits and vegetables No 1.0 Yes 1.1 (0.8, 1.2) NS
Received foods made from fats and oil
No 1.0 Yes 1.5 (1.1, 1.8) 0.020
BMI, body mass index; CI, confidence interval. HAZ, Height-for-age z-score
1 OR of 1.0 indicates reference category for each independent variable.
2North: Jammu & Kashmir, Himachal Pradesh, Haryana, Punjab, Delhi, Uttar
Pradesh, Uttaranchal; East-North East: Bihar, Jharkhand, Chhattisgarh, West
Bengal, Orissa, Assam, Arunachal Pradesh, Manipur, Meghalaya, Mizoram,
Nagaland, Sikkim, Tripura; South: Andhra Pradesh, Karnataka, Kerala, Tamil
Nadu; Central-west: Maharashtra, Goa, Gujarat, Madhya Pradesh, Rajasthan.
3 Other religions include Buddhist, Jain, Zoroastrian, Doni-polo and no religion
4 Wealth index: definition based on NFHS classification (17)
5 Variables adjusted for age of the index child
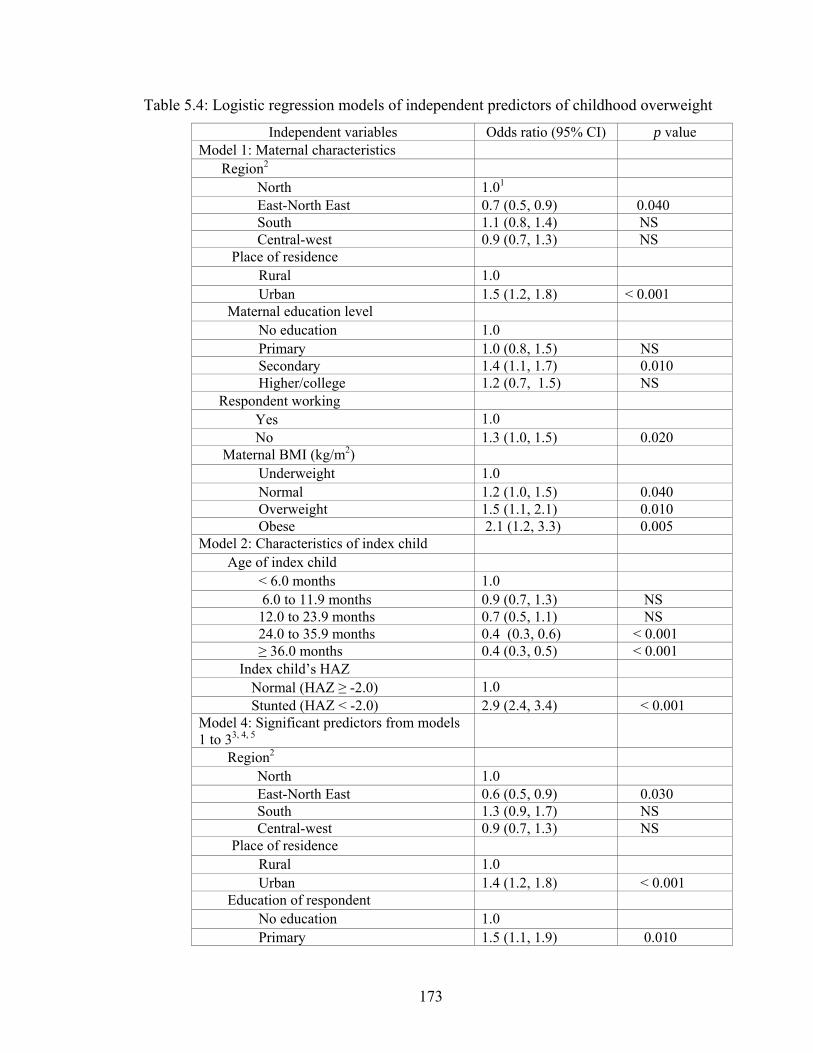
173
Table 5.4: Logistic regression models of independent predictors of childhood overweight
Independent variables Odds ratio (95% CI) p value Model 1: Maternal characteristics
Region2 North 1.01 East-North East 0.7 (0.5, 0.9) 0.040 South 1.1 (0.8, 1.4) NS Central-west 0.9 (0.7, 1.3) NS
Place of residence Rural 1.0 Urban 1.5 (1.2, 1.8) < 0.001
Maternal education level No education 1.0 Primary 1.0 (0.8, 1.5) NS Secondary 1.4 (1.1, 1.7) 0.010 Higher/college 1.2 (0.7, 1.5) NS
Respondent working Yes 1.0 No 1.3 (1.0, 1.5) 0.020
Maternal BMI (kg/m2) Underweight 1.0 Normal 1.2 (1.0, 1.5) 0.040 Overweight 1.5 (1.1, 2.1) 0.010 Obese 2.1 (1.2, 3.3) 0.005
Model 2: Characteristics of index child Age of index child
< 6.0 months 1.0 6.0 to 11.9 months 0.9 (0.7, 1.3) NS 12.0 to 23.9 months 0.7 (0.5, 1.1) NS 24.0 to 35.9 months 0.4 (0.3, 0.6) < 0.001 ≥ 36.0 months 0.4 (0.3, 0.5) < 0.001
Index child’s HAZ Normal (HAZ ≥ -2.0) 1.0 Stunted (HAZ < -2.0) 2.9 (2.4, 3.4) < 0.001
Model 4: Significant predictors from models 1 to 33, 4, 5
Region2 North 1.0 East-North East 0.6 (0.5, 0.9) 0.030 South 1.3 (0.9, 1.7) NS Central-west 0.9 (0.7, 1.3) NS
Place of residence Rural 1.0 Urban 1.4 (1.2, 1.8) < 0.001
Education of respondent No education 1.0 Primary 1.5 (1.1, 1.9) 0.010

174
Secondary 1.6 (1.3, 2.0) < 0.001 Higher/college 1.5 (0.9, 2.2) 0.060
Maternal BMI (kg/m2) Underweight 1.0 Normal 1.3 (1.0, 1.6) 0.020 Overweight 1.9 (1.3, 2.7) 0.001 Obese 2.5 (1.4, 4.6) 0.003
Index child’s HAZ Normal (HAZ ≥ -2.0) 1.0 Stunted (HAZ < -2.0) 4.0 (3.2, 5.0) < 0.001
Received foods made from fats and oil No 1.0 Yes 1.3 (1.0, 1. 8) 0.030
BMI, body mass index; CI, confidence interval. HAZ, Height-for-age z-score
1 OR of 1.0 indicates reference category for each independent variable.
2North: Jammu & Kashmir, Himachal Pradesh, Haryana, Punjab, Delhi, Uttar Pradesh,
Uttaranchal; East-North East: Bihar, Jharkhand, Chhattisgarh, West Bengal, Orissa,
Assam, Arunachal Pradesh, Manipur, Meghalaya, Mizoram, Nagaland, Sikkim, Tripura;
South: Andhra Pradesh, Karnataka, Kerala, Tamil Nadu; Central-west: Maharashtra, Goa,
Gujarat, Madhya Pradesh, Rajasthan.
3Adjusted for age of the index child.
4 Model 3 was not created because only fat intake was a significant predictor of childhood
overweight
5Hosmer and Lemeshow test χ2 value = 7. 9 (p = 0.4).
175
CHAPTER 6
CONCLUSION
Nutritional status of children is a world-wide concern, negatively or positively
influenced by several factors at individual and household level. Poverty, lack of
education of the mother, poor pregnancy outcome and poor dietary diversification of the
child are among the important determinants of a child’s nutritional status, in developing
countries (1- 7). In a country like India, which is undergoing a rapid economic growth,
prevalence of low birth weight and undernutrition in children < 5 years continue to be
major public health issues (8, 9). Adding to this burden is the increasing prevalence of
childhood overweight (10- 13).
Considering the nutrition scenario in India, the overarching goal of this
dissertation was to examine the various factors at individual and household levels that
influence the nutritional status of children aged below 5 years. The different parameters
that were considered in this dissertation were 1) birth weight and birth size of children
and related determinants, 2) determinants of undernutrition (stunting, underweight,
wasting and anemia), and 3) determinants of childhood overweight.
The results of the first study presented in Chapter 3 indicate that prevalence of
poor pregnancy outcome (measured as low birth weight and small birth size infants as
reported by the mother) is high (20.0%) in India and is in accord with a recent UNICEF
report (14). Maternal perception of the infant’s birth size is significantly correlated (r =
0.70) with the infant’s measured birth weight, which makes it a reliable indicator for
176
assessing pregnancy outcome. Poor pregnancy outcome remained high in rural compared
to urban areas. Within the country, we observed regional disparities in the prevalence of
poor pregnancy outcome. These findings suggest that children from less developed
regions and rural areas are more likely to be born low birth weight/small birth size.
In this dissertation research using data from India’s NFHS, we observed maternal
education, religion, age, household SES and regional location to be important predictors
of pregnancy outcome. One of the most important maternal characteristic that
independently predicted poor pregnancy outcome was low autonomy. This was also
significantly associated with other factors such as maternal age, educational level,
employment status, religion, utilization of prenatal care, nutritional status, household
socio-economic status and place of residence. While few studies have examined the
association between maternal autonomy and child’s nutritional status (stunting) (15),
results of this study fills the gap by showing the independent effect of maternal autonomy
on pregnancy outcome.
Majority of the health reform programs in India are based on nutrition
supplementation and nutrition and health education as strategies to combat the problem of
low birth weight, overlooking the issues of women’s status in the household. Therefore,
our observation of maternal autonomy as a significant predictor of pregnancy outcome
suggests that improving women’s status in the household may be an important strategy to
decreasing the prevalence of poor pregnancy outcome. Existing evidence suggests that
women’s mental health, influenced by her status/autonomy in the household (16, 17) is
important for favorable pregnancy outcome (18, 20). Epidemiological studies with this
population examining the mental health of women with low autonomy may be needed to

177
understand the mechanism through which low maternal autonomy influences poor
pregnancy outcome.
There was a significant positive correlation between birth weight of the index
child and their height-for-age, weight-for-age, weight-for-height z scores and hemoglobin
level that are in accord with findings from a previous study (21). These results indicate
that children born low birth weight are at an increased risk for poor nutritional status (21).
The second study which examined the prevalence and determinants of undernutrition
observed childhood stunting, underweight, wasting and anemia to be considerably high in
India. Consistent with previous reports (22, 23), rural children were more susceptible to
be undernourished compared to their urban counterparts. We also observed a significant
regional disparity in undernutrition prevalence reflective of the state of development by
region.
As observed in our first study, maternal and household characteristics were
important predictors of undernutrition. Low maternal education level, maternal
employment, household SES and geographic location were among the important factors
influencing child’s nutritional status. In addition, dietary intake by the index child also
had significant association with their nutritional status. One of the most important finding
of this study was that joint households with grandparents attenuated the risks of
undernutrition, specifically stunting in children receiving poor or medium quality diet.
This observation therefore adds to the present body of evidence that presence of older
adults and most importantly grandparents in the household enhances child care practices
and influences the long term nutritional status of children. This evidence suggests that
involving older adults/grandparents in nutrition intervention programs addressing

178
undernutrition may enhance program outcome. In addition, our observation of a positive
association of up-to-date immunization with nutritional status is also a confirmation of
previous studies documenting this evidence. The study results add to the literature that
children at risk of suffering from undernutrition (stunting, underweight, wasting and
anemia), i.e. those belonging to low SES households, rural areas, having mothers with no
education and receiving low quality diet need to be targeted through the Universal
Immunization Program of India.
Due to the lack of information on composite nutrient intake, we were unable to
examine the association between this variable and indicators of nutritional status. Future
studies should therefore assess nutrient intake of children in this population and examine
its association with the different nutritional indicators. Information on dietary intake of
the child was collected through a 24-hour dietary recall that is not reflective of long-term
dietary practices. Longitudinal studies are needed to understand the dietary pattern of
children in this population accounting for regional food habits, seasonality and food
availability.
Previous studies have shown a strong association between chronic undernutrition,
i.e. stunting and childhood overweight (24, 25). In addition, India has been undergoing a
nutrition transition, thereby exposing its population to the risk of overweight and obesity
(26). Studies have reported an increased consumption of calorie dense foods and the
prevalence of overweight in children aged 5-18 years (11). In the third study we therefore
examined the predictors of childhood overweight, details of which have been presented in
Chapter 5. Although the prevalence of overweight in children < 5 years have remained
stable across 1992-2005 (27), we observed urban children to be at an increased risk of

179
being overweight than their rural counterparts. In line with our previous findings
(chapters 3 and 4), other important determinants of childhood overweight in this
population were maternal education, overweight/obese status of the mother, religion,
child’s age, household SES and residing in more developed regions of the country
specifically North, South and Central-west regions. Dietary fat intake of children, as
assessed through the 24-hour dietary recall of the mother, also increased the risks of
childhood overweight.
In addition, two major findings of this study were the association between
stunting and maternal employment with childhood overweight. Stunted children were
nearly three times at an increased risk of being overweight, suggesting the dual presence
of under and over nutrition problems in this population. It therefore emphasizes the need
to direct health and nutrition intervention programs to combat chronic undernutrition and
thereby prevent the onset of childhood overweight in the country. Another interesting
finding from this dissertation work is our observation of significant association between
maternal unemployment and childhood overweight. This suggests that unemployed
mothers, possibly from high SES households may be indulging their children in high
calorie western diet and physical inactivity. It may therefore be of public health
importance for health promotion programs to target urban affluent mothers as a means of
addressing the emerging issue of childhood overweight in India.
The NFHS did not collect information on physical activity pattern of children and
therefore, future epidemiological studies need to examine the association between
physical activity among urban and rural children and overweight status. Furthermore, our
finding suggests that children < 5 years, specifically from urban areas are vulnerable to
180
the consequences of ongoing nutrition transition in the country. Therefore, in order to
prevent the rise of childhood overweight in India, health programs should reconsider this
emerging public health issue and incorporate relevant strategies to deal with the ongoing
nutrition transition.
Overall, our results suggest that interventions need to have a holistic approach and
consider both household and individual level factors. At the individual level mothers
need to be aware of their nutritional needs and pregnancy care for better pregnancy
outcome. In addition they need to be aware of the nutritional and health care
requirements of their child. Awareness with respect to favorable practices for child’s
nutritional status needs to be present at the household level. Moreover, intervention
strategies at these levels need to consider regional differences and cultural practices while
developing and implementing such programs. In conclusion, results from the three
studies confirm the importance of maternal and household characteristics as determinants
of nutritional status of children in India. The study results therefore, call for an evaluation
of current health programs in India and adoption of different strategies addressing these
risk factors.

181
References
1. Assis AM, Barreto ML, Gomes GS, Prado Mda S, Santos NS, Santos LM,
Sampaio LR, Ribeiro Rde C, Oliveira LP, et al. Childhood anemia prevalence and
associated factors in Salvador, Bahia, Brazil. Cadernos de Saúde Pública.
2004;20:1633-1641.
2. Bharati S, Pal M, Bharati P. Determinants of nutritional status of pre-school
children in India. J Biosoc Sci. 2008;40(6):801-814.
3. Bloss E, Wainaina F, Bailey RC. Prevalence and predictors of underweight,
stunting, and wasting among children aged 5 and under in Western Kenya. J Trop
Pediatr. 2004;50(5): 260-270.
4. Chevalier A, O'Sullivan V. Mother's education and birth weight. Paper presented
at the IZA Discussion Paper No. 2640. February 2007.
http://ftp.iza.org/dp2640.pdf Accessed May 2010.
5. Dhall K, Bagga R, Maternal determinants of birth weight of North Indian babies.
Indian J Pediatr. 1995;62(3):333-344.
6. Martorell R, Kettel Khan L, Hughes ML, Grummer-Strawn LM. Overweight and
obesity in preschool children from developing countries. Int J Obes Relat Metab
Disord. 2000;24(8): 959-967.
7. Mavalankar DV, Gray RH, Trivedi CR. Risk factors for preterm and term low
birthweight in Ahmedabad, India. Int J Epidemiol. 1992;21(2):263-2728.
8. United Nations Children’s Fund & World Health Organization. Low Birthweight:
Country, regional and global estimates. UNICEF, New York:2004.
9. United Nations Childrens Fund. The State of the World's Children- Child

182
Survival. UNICEF: New York. 2008. [Available from:
http://www.unicef.org/sowc08/docs/sowc08.pdf]
10. Bhardwaj S, Misra A, Khurana L, Gulati S, Shah P, Vikram NK. Childhood
obesity in Asian Indians: a burgeoning cause of insulin resistance, diabetes and
sub-clinical inflammation. Asia Pac J Clin Nutr. 2008;17 (S1): 172-175.
11. Kaur S, Sachdev HP, Dwivedi SN, Lakshmy R, Kapil U. Prevalence of
overweight and obesity amongst school children in Delhi, India. Asia Pac J Clin
Nutr. , 2008.17(4).
12. Kelishadi R. Childhood overweight, obesity, and the metabolic syndrome in
developing countries. Epidemiol Rev. 2007; 29:62-76.
13. Ramachandran A, Snehalatha C, Vinitha R, Thayyil M, Kumar CK, Sheeba L,
Joseph S, Vijay V. Prevalence of overweight in urban Indian adolescent school
children. Diabetes Res Clin Prac. 2002;57(3):185-190.
14. United Nations Children's Fund. The state of the world's children- Maternal and
new born health. UNICEF: New York. 2009. [Available from:
http://www.unicef.org/sowc09/docs/SOWC09-FullReport-EN.pdf]
15. Shroff M, Griffiths P, Adair L, Suchindran C, Bentley M. Maternal autonomy is
inversely related to child stunting in Andhra Pradesh, India. Matern Child Nutr.
2009;5(1):64-74.
16. Chen YY, Subramanian SV, Acevedo-Garcia D, Kawachi I. Women's status and
depressive symptoms: A multilevel analysis. Soc Sci Med. 2005;60(1):49-60.
17. Patel V, Kirkwood B, Pednekar S, Pereira B, Barros P, Fernandes J, Datta J, Pai
R, Weiss H, et al. Gender disadvantage and reproductive health risk factors for
183
common mental disorders in women: A community survey in India. Arch Gen
Psychiatry. 2006;63(4):404-413.
18. Hoffman S, Hatch MC. Depressive symptomatology during pregnancy: Evidence
for an association with decreased fetal growth in pregnancies of lower social class
women. Health Psychol. 2000;19(6):535-543.
19. Patel V, DeSouza N, and Rodrigues M, Postnatal depression and infant growth
and development in low income countries: a cohort study from Goa, India. Arch
Dis Child, 2003;88:34-37.
20. Rahman A, Bunn J, Lovel H, Creed F. Association between antenatal depression
and low birthweight in a developing country. Acta Psychiatr Scand.
2007;115(6):481-486.
21. Sachdev H. Low birth weight in South Asia. Int J Diabetes Dev Ctries.
2001;21(1):13-33.
22. Dutta A, Pant K, Puthia R, Sah A. Prevalence of undernutrition among children in
the Garhwal Himalayas. Food Nutr Bull. 2009;30(1):77-81.
23. International Institute for Population Sciences (IIPS) and Macro International,
National Family Health Survey (NFHS-3), 2005-06: India: Volume I. 2007, IIPS:
Mumbai.
24. Fernald LC, Neufeld LM. Overweight with concurrent stunting in very young
children from rural Mexico: prevalence and associated factors. Eur J Clin Nutr.
2007;61(5):623-632.

184
25. Popkin BM, Richards MK, Montiero CA. Stunting is associated with overweight
in children of four nations that are undergoing the nutrition transition. J Nutr.
1996;126(12):3009-3016.
26. Popkin BM, Horton S, Kim S, Mahal A, Shuigao J. Trends in diet, nutritional
status, and diet-related noncommunicable diseases in China and India: The
economic costs of the nutrition transition. Nutr Rev. 2001;59(12):379-390.
27. Wang Y, Chen HJ, Shaikh S, Mathur P. Is obesity becoming a public health
problem in India? Examine the shift from under- to overnutrition problems over
time. Obes Rev. 2009;10(4):456-74.
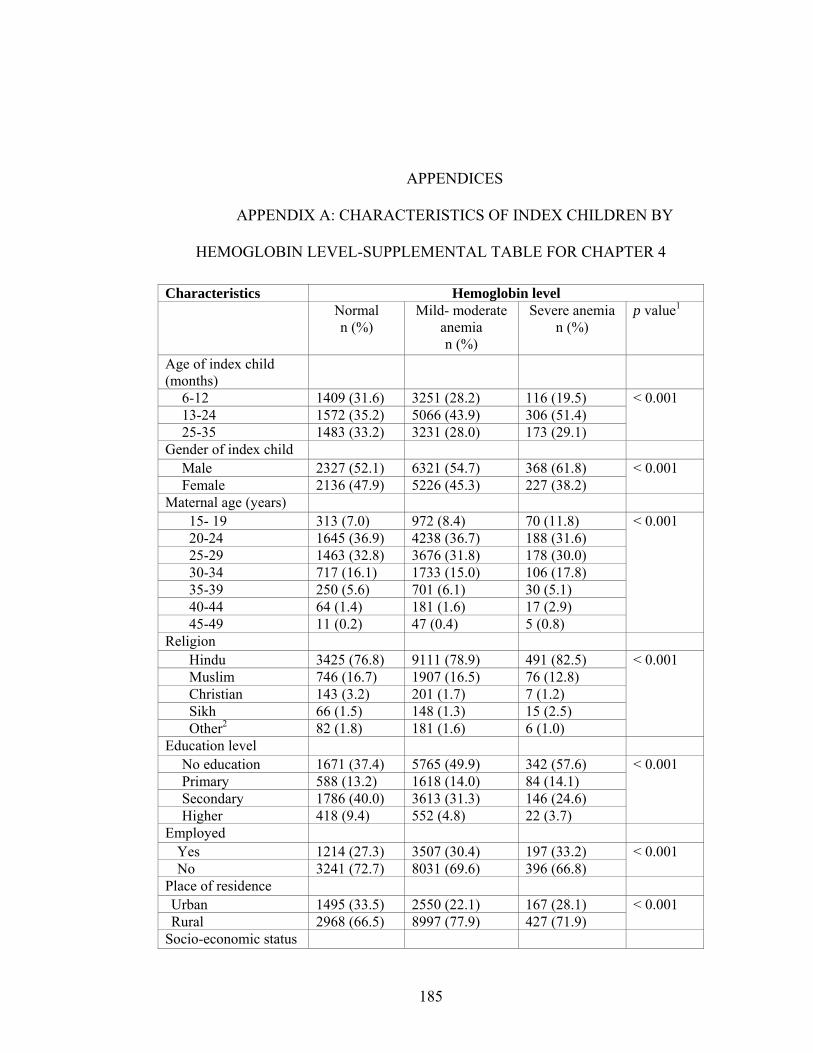
185
APPENDICES
APPENDIX A: CHARACTERISTICS OF INDEX CHILDREN BY
HEMOGLOBIN LEVEL-SUPPLEMENTAL TABLE FOR CHAPTER 4
Characteristics Hemoglobin level Normal
n (%) Mild- moderate
anemia n (%)
Severe anemia n (%)
p value1
Age of index child (months)
6-12 1409 (31.6) 3251 (28.2) 116 (19.5) 13-24 1572 (35.2) 5066 (43.9) 306 (51.4) 25-35 1483 (33.2) 3231 (28.0) 173 (29.1)
< 0.001
Gender of index child Male 2327 (52.1) 6321 (54.7) 368 (61.8) Female 2136 (47.9) 5226 (45.3) 227 (38.2)
< 0.001
Maternal age (years) 15- 19 313 (7.0) 972 (8.4) 70 (11.8) 20-24 1645 (36.9) 4238 (36.7) 188 (31.6) 25-29 1463 (32.8) 3676 (31.8) 178 (30.0) 30-34 717 (16.1) 1733 (15.0) 106 (17.8) 35-39 250 (5.6) 701 (6.1) 30 (5.1) 40-44 64 (1.4) 181 (1.6) 17 (2.9) 45-49 11 (0.2) 47 (0.4) 5 (0.8)
< 0.001
Religion Hindu 3425 (76.8) 9111 (78.9) 491 (82.5) Muslim 746 (16.7) 1907 (16.5) 76 (12.8) Christian 143 (3.2) 201 (1.7) 7 (1.2) Sikh 66 (1.5) 148 (1.3) 15 (2.5) Other2 82 (1.8) 181 (1.6) 6 (1.0)
< 0.001
Education level No education 1671 (37.4) 5765 (49.9) 342 (57.6) Primary 588 (13.2) 1618 (14.0) 84 (14.1) Secondary 1786 (40.0) 3613 (31.3) 146 (24.6) Higher 418 (9.4) 552 (4.8) 22 (3.7)
< 0.001
Employed Yes 1214 (27.3) 3507 (30.4) 197 (33.2) No 3241 (72.7) 8031 (69.6) 396 (66.8)
< 0.001
Place of residence Urban 1495 (33.5) 2550 (22.1) 167 (28.1) Rural 2968 (66.5) 8997 (77.9) 427 (71.9)
< 0.001
Socio-economic status
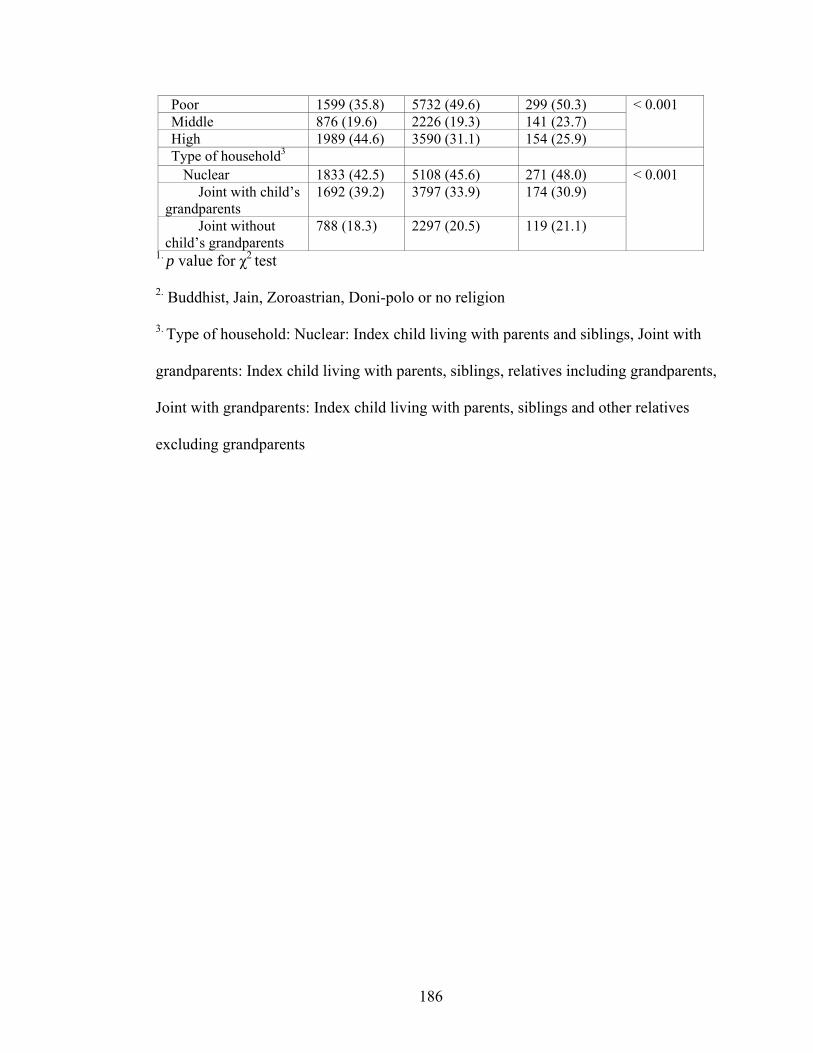
186
1. p value for χ2 test
2. Buddhist, Jain, Zoroastrian, Doni-polo or no religion
3. Type of household: Nuclear: Index child living with parents and siblings, Joint with
grandparents: Index child living with parents, siblings, relatives including grandparents,
Joint with grandparents: Index child living with parents, siblings and other relatives
excluding grandparents
Poor 1599 (35.8) 5732 (49.6) 299 (50.3) Middle 876 (19.6) 2226 (19.3) 141 (23.7) High 1989 (44.6) 3590 (31.1) 154 (25.9)
< 0.001
Type of household3 Nuclear 1833 (42.5) 5108 (45.6) 271 (48.0)
Joint with child’s grandparents
1692 (39.2) 3797 (33.9) 174 (30.9)
Joint without child’s grandparents
788 (18.3) 2297 (20.5) 119 (21.1)
< 0.001

187
APPENDIX B: CLASSIFICATION OF Z-SCORES TO INTERPRET GROWTH
INDICATOR
Z score Growth indicators
Length/height-
for age (HAZ)
Weight-for-age
(WAZ)
Weight-for-
length/height
(WHZ)
BMI-for-age
(BMZ)
> 3.0 Very tall May have a growth
problem
Obese Obese
> 2.0 May have a growth
problem
Overweight Overweight
0.0 to 2.0
< -1.0
< -2.0 Stunted Underweight Wasted Underweight
< -3.0 Severely stunted Severely
underweight
Severely wasted Severely
underweight
The shaded region indicates growth indicator within the normal range
(Adapted from: WHO Child growth standards)
Top Related