


Languages
Pages
Legal

Design of a Lithium Ion Battery Pack for 400 MPH Electric Landspeed Racing
THESIS
Presented in Partial Fulfillment
of the Requirements for Graduation with Distinction
By
David W. Cooke
Undergraduate Program in Mechanical Engineering
The Ohio State University
2012
Examination Committee:
Professor Giorgio Rizzoni, Advisor
Professor Yann Guezennec

Copyright
David W. Cooke
2012

ii
Abstract
For more than a decade the Buckeye Bullet landspeed racing team at The Ohio State
University's Center for Automotive Research has pushed the absolute limits of electric
vehicle racing. From batteries to hydrogen fuel cells, the team holds every national and
international speed record in the unlimited class, with top speeds well into the 300 MPH
range. The mission statement of the team is to push the technologies of tomorrow to their
absolute performance limits. With this mission in mind the team is currently developing
the ultimate landspeed electric vehicle, the Buckeye Bullet 3, which will be powered by
the latest generation of lithium ion batteries. For the first time since 1899, an electric
vehicle will be designed with the intent of directly competing with its fossil fueled
counterparts. The team hopes to push the electric landspeed record over 400 MPH and
eventually set the ultimate wheel driven record in excess of 450 MPH. This document
investigates the design of the lithium ion battery pack with respect to battery cell testing
and selection, electrical power performance, system safety design, thermal management,
component testing and integration, mechanical packaging, and modeling and simulation.
This project reports on and builds upon work on the development of this system from
2009 to 2012. The document concludes with a description of future work needed to
complete the battery pack integration and prepare the energy storage systems of the
vehicle to break a 400 MPH+ world record.

iii
Dedication
This document is dedicated to my parents for their extraordinary dedication to,
involvement in, and support of all aspects of my life. I am eternally grateful for their
extreme sacrifices in the name of their children's success. They have always been and
will always be my greatest inspiration in life.

iv
Acknowledgments
I would like to thank a number of people who have made this program and my personal
mission a reality. First of all, Buckeye Bullet graduate students LingChang Wang and
Josh Terrell, for their direct assistance in this project. Ling, Josh, and I have worked
together as a team on the development of the battery system and a great deal of the work
presented in this document is a collaborative effort. It has been a pleasure to work with
such talented and dedicated student engineers. I would also like to thank all of the
Buckeye Bullet team members, sponsors, and advisors for their continued support and
dedications. I would especially like to recognize the efforts of our faculty advisor Dr.
Giorgio Rizzoni in his assistance in the development of the program and specifically for
his support of my academic and professional career. I would also like to recognize our
drive Roger Schroer and thank him for his extreme dedication to the students and for
being an excellent mentor and roll model. In addition the entire faculty and staff of the
Center for Automotive research have been instrumental in our success as a team. The
efforts of John Neal and Dr. Yann Guezennc in providing access to the battery labs, and
testing assistance have been extraordinary. Finally I would like to thank Venturi
Automobiles and their president Gildo Pastor for his amazing level of support for our
racing program, as well as my academic career. His support has allowed us to transform
our dreams into reality.

v
Vita
January 1st 1986 ............................................Born, Columbus, Ohio
June 2004 .......................................................Logan Elm High School, Circleville, OH
........................................................................Class Valedictorian
December 2004 to Present .............................Member, Buckeye Bullet Team
........................................................................OSU Center for Automotive Research
June, 2005 to Present .....................................Student Research Associate
........................................................................ OSU Center for Automotive Research
2007 to 2010 .................................................Engineering Intern,
........................................................................Honda Research and Development
2010 - 2012 ....................................................Engineering Intern, Venturi Automobiles
June, 2012 ......................................................B.S Mechanical Engineering, With
........................................................................Distinction, The Ohio State University
Fields of Study
Major Field: Mechanical Engineering - Focus In Automotive Engineering
Minor Field: Business

vi
Table of Contents
Abstract ............................................................................................................................... ii
Dedication .......................................................................................................................... iii
Acknowledgments.............................................................................................................. iv
Vita ...................................................................................................................................... v
Table of Contents ............................................................................................................... vi
List of Tables ................................................................................................................... viii
List of Figures .................................................................................................................... ix
Chapter 1: Introduction .................................................................................................... 13
1.1 Program History ..................................................................................................... 13
1.2 Landspeed Racing .................................................................................................. 15
1.3 Motivation: Buckeye Bullet 3 ................................................................................ 20
1.4 Thesis Objectives ................................................................................................... 27
1.5 Thesis Summary ..................................................................................................... 28
Chapter 2: Literature Review ........................................................................................... 29
2.1 Introduction To Batteries ....................................................................................... 29
2.2 The Battery Cell ..................................................................................................... 31
2.3 Battery Systems - Forming A Pack ........................................................................ 34

vii
2.4 Buckeye Bullet Battery Packs - A Historical Prospective ..................................... 39
Chapter 3: Battery Testing ............................................................................................... 43
3.1 Types of Test .......................................................................................................... 43
3.2 Experimental Setup and Procedures ....................................................................... 44
3.3 Power Testing ......................................................................................................... 47
3.4 Thermal Testing ..................................................................................................... 58
3.5 Proposed Pack Specifications................................................................................. 67
Chapter 4: Safety System Design and Component Selection .......................................... 69
4.1 Safety Considerations ............................................................................................. 69
4.2 Pack Protection ....................................................................................................... 70
4.3 Component Testing and Specifications .................................................................. 76
4.4 Charging Considerations ........................................................................................ 85
4.5 Other Safety Considerations .................................................................................. 89
Chapter 5: Pack Design .................................................................................................... 95
5.1 Packing Design Background .................................................................................. 95
5.2 Proposed Packing Design ..................................................................................... 100
Chapter 6: Modeling and Simulation ............................................................................. 109
Chapter 7: Future Work ................................................................................................. 115
References ....................................................................................................................... 117
viii
List of Tables
Table 1: Wheel-Driven Runs Over 400 MPH .................................................................. 22
Table 2: Sample Pack Sizing Comparison for BB2.5 - Manufacturer Specs .................. 54
Table 3: Sample Pack Sizing Comparison for BB2.5 - After Testing ............................. 56
Table 4: Wire Testing Results......................................................................................... 80
ix
List of Figures
Figure 1: OSU Smokin' Buckeye - Formula Lightning Series Race Vehicle .................. 13
Figure 2: Buckeye Bullet 1 - 314 MPH - NiMH Batteries - 2001 to 2004 ...................... 14
Figure 3: Buckeye Bullet 2 - 303 MPH - Hydrogen Fuel Cell - 2006 to 2009 ................ 14
Figure 4: Buckeye Bullet 2.5 - 308 MPH Li-Ion Batteries - 2010 .................................. 15
Figure 5: Bonneville Salt Flats, Utah ............................................................................... 16
Figure 6: Landspeed Racing Course Layout .................................................................... 18
Figure 7: Burkland 411 Streamliner ................................................................................ 21
Figure 8: Vesco Turbinator .............................................................................................. 21
Figure 9: Buckeye Bullet 3 Concept ................................................................................ 23
Figure 10: BB3 Proposed Layout .................................................................................... 23
Figure 11: BB3 Performance Potential ............................................................................ 24
Figure 12: Effect Of Vehicle Weight On Speed .............................................................. 26
Figure 13: How A Battery Works (Courtesy of www.altenergymag.com) ..................... 29
Figure 14: Effect of Discharge Rate On Voltage ............................................................. 32
Figure 15: Effect of Operating Temperature On Voltage ................................................ 34
Figure 16: Parallel (Top) and Series (Bottom) Configurations ....................................... 35
Figure 17: Parallel Groups Of Series Cells and Series Groups Of Parallel Cells ............ 37
Figure 18: System Hierarchy ........................................................................................... 39
Figure 19: History of OSU EV Racing Battery Packs ..................................................... 39

x
Figure 20: Power and Energy Density (Gravimetric) Over Time..................................... 41
Figure 21: Power and Energy Density (Volumetric) Over Time ..................................... 41
Figure 22: Battery Testing Equipment ............................................................................. 45
Figure 23: Cell Compression Test Fixture ....................................................................... 46
Figure 24: Environmental (Thermal Control) Chamber .................................................. 47
Figure 25: Capacity Test .................................................................................................. 48
Figure 26: FreedomCar HPPC Test ................................................................................. 49
Figure 27: Race Profile Test Matrix ................................................................................ 50
Figure 28: BB2.5 Race Profile - Current Draw ............................................................... 51
Figure 29: BB2.5 Race Profile - Voltage Performance ................................................... 51
Figure 30: BB2.5 Race Profile - Voltage Performance - 2 Different Cell Models .......... 52
Figure 31: Competitor Cell Race Profile Voltage Performance ...................................... 55
Figure 32: BB3 Race Profile - Current Request .............................................................. 57
Figure 33: BB3 Race Profile - Voltage Performance ...................................................... 58
Figure 34: Affect of Preheating on Voltage Performance ............................................... 61
Figure 35: Thermal Performance During Racing Profile - Non-Insulated Case ............. 62
Figure 36: Thermal Performance During Racing Profile - Insulated Case ...................... 63
Figure 37: Heat Generation and Transfer Rate ................................................................ 64
Figure 38: Thermal Profile Of Electrical Bus Bars - Module .......................................... 66
Figure 39: Thermal Profile of Electrical Bus Bars - Cell ................................................ 66
Figure 40: Proposed Battery System Architecture........................................................... 67
Figure 41: Proposed Cooling Prime Mover ..................................................................... 68

xi
Figure 42: Pack Protection Concept Schematic ............................................................... 70
Figure 43: Thermal Runaway Characteristics of Li-Ion Batteries ................................... 72
Figure 44: A123 Battery Module Design ......................................................................... 74
Figure 45: Pack Protection Schematic ............................................................................. 75
Figure 46: Fuse Usage Specification Chart ..................................................................... 77
Figure 47: Fuse Testing Experimental Set-Up................................................................. 78
Figure 48: Fuse Testing Thermal Images ........................................................................ 79
Figure 49: Wire Testing Thermal Images ........................................................................ 80
Figure 50: Kilovac EV 200 Czonka III ............................................................................ 83
Figure 51: TE Connectivity HPV 800 High Current Power Connector .......................... 84
Figure 52: BB3 Battery Pack Schematic ......................................................................... 85
Figure 53: Battery Charging Current Profile ................................................................... 86
Figure 54: Battery Charging Rate .................................................................................... 87
Figure 55: Battery Charger Hardware.............................................................................. 88
Figure 56: Vehicle Service and Charging Trailer Components ....................................... 89
Figure 57: External Safety Indicator Layout Proposal .................................................... 91
Figure 58: 1000 Volt Rated Electrical Tools ................................................................... 92
Figure 59: Possible Module Mounting Schemes ............................................................. 96
Figure 60: Laser-Cut and Bent Sheet Metal Packaging Design Concept ........................ 97
Figure 61: Laser-Cut and Riveted Sheet Metal Packaging Design Concept ................... 97
Figure 62: Stamped Sheet Metal Packaging Design Concept ......................................... 98
Figure 63: Simple Rail Mount Packaging Design Concept ............................................. 98
xii
Figure 64: 2011 Battery Pack Proposal ........................................................................... 99
Figure 65: Packaging Design - Module Configuration .................................................. 101
Figure 66: Packaging Design - Carbon Fiber Tub ......................................................... 102
Figure 67: Packaging Design - Tub Finite Element Analysis........................................ 102
Figure 68: Packaging Design - Tub Configuration and Supports .................................. 103
Figure 69: Packaging Design - Module Level Bus Bars ................................................ 104
Figure 70: Packaging Design - Supervisory Electronics ............................................... 105
Figure 71: Packaging Design - Manual Service Disconnect and Fuses ......................... 106
Figure 72: Packaging Design - Complete Electrical System ......................................... 107
Figure 73: Packaging Design - Complete Pack Without Tubs ...................................... 107
Figure 74: Packaging Design - Complete Battery Pack Left Side View ....................... 108
Figure 75: Packaging Design - Complete Battery Pack Right Side View ..................... 108
Figure 76: Zero Order Battery Model Circuit ................................................................ 109
Figure 77: First Order Battery Model Circuit ................................................................. 110
Figure 78: Battery Model Schematic ............................................................................. 111
Figure 79: Top Level of Simulink Battery Model ......................................................... 113
Figure 80: Second Level of Simulink Battery Model .................................................... 113
Figure 81: Simulated vs. Experimental Battery Voltage with Zero Order Model ......... 114
13
Chapter 1: Introduction
1.1 Program History
For the past 20 years, students at The Ohio State Universities' Center for Automotive
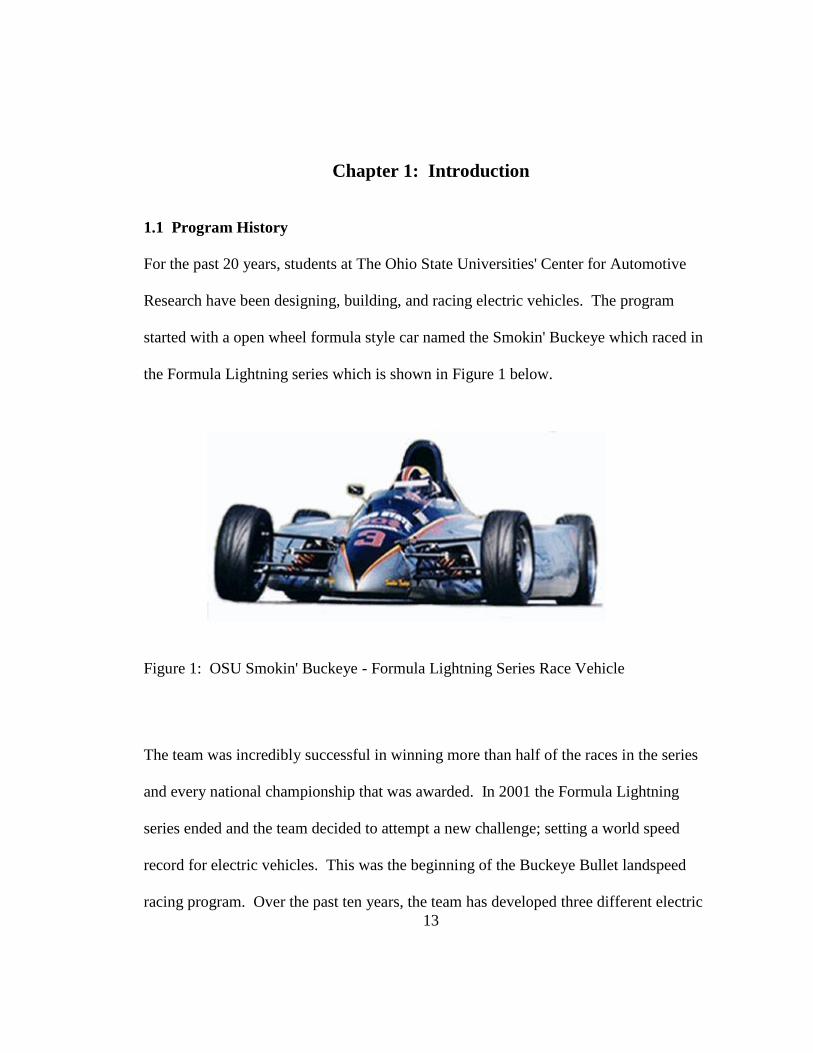
Research have been designing, building, and racing electric vehicles. The program
started with a open wheel formula style car named the Smokin' Buckeye which raced in
the Formula Lightning series which is shown in Figure 1 below.
Figure 1: OSU Smokin' Buckeye - Formula Lightning Series Race Vehicle
The team was incredibly successful in winning more than half of the races in the series
and every national championship that was awarded. In 2001 the Formula Lightning
series ended and the team decided to attempt a new challenge; setting a world speed
record for electric vehicles. This was the beginning of the Buckeye Bullet landspeed
racing program. Over the past ten years, the team has developed three different electric
14
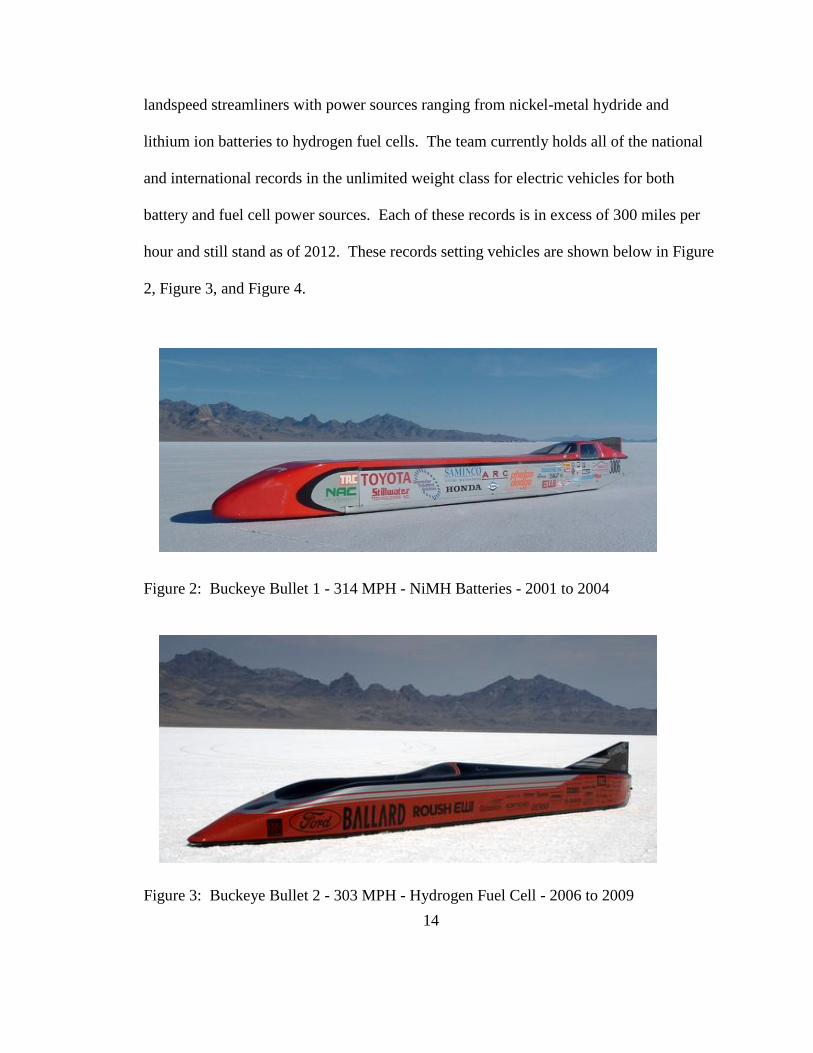
landspeed streamliners with power sources ranging from nickel-metal hydride and
lithium ion batteries to hydrogen fuel cells. The team currently holds all of the national
and international records in the unlimited weight class for electric vehicles for both
battery and fuel cell power sources. Each of these records is in excess of 300 miles per
hour and still stand as of 2012. These records setting vehicles are shown below in Figure
2, Figure 3, and Figure 4.
Figure 2: Buckeye Bullet 1 - 314 MPH - NiMH Batteries - 2001 to 2004
Figure 3: Buckeye Bullet 2 - 303 MPH - Hydrogen Fuel Cell - 2006 to 2009

15
Figure 4: Buckeye Bullet 2.5 - 308 MPH Li-Ion Batteries - 2010
The team has established two main missions. The first to provide a truly unique
opportunity for students to apply their engineering knowledge outside the classroom, and
to develop the next generation of leading edge automotive engineers. The second
mission is to take the powertrain technology of tomorrow and test it to its' ultimate limits
today, showing the world that green technologies of the future can still be rooted in
performance. The ecologically friendly innovations of the auto industry do not have to
bring an end to racing, merely a revolution.
1.2 Landspeed Racing
Landspeed racing quite different from any other form of racing. Many herald it as "The
last pure form of grassroots motorsports." Each year thousands of gear-heads travel to
the Mecca of landspeed racing, The Bonneville Salt Flats, in Utah. The flats is a 50
square mile, dry lake bed. Each winter year the entire area floods, becoming a salt lake,
16
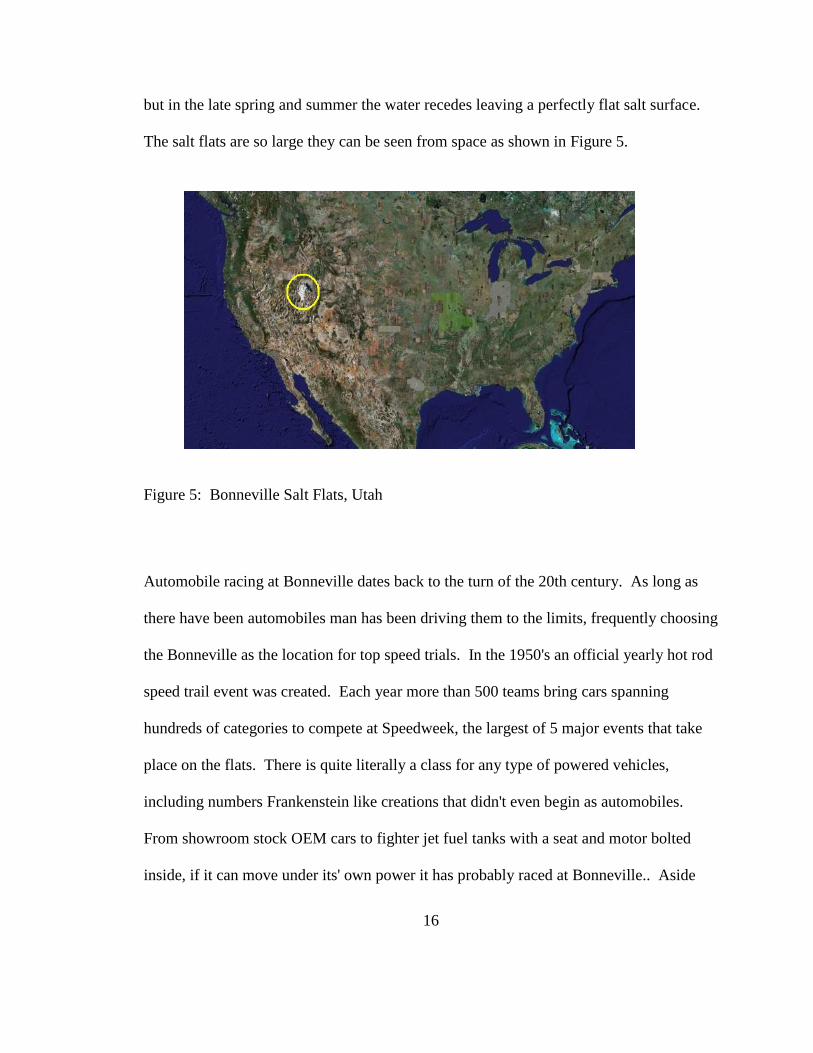
but in the late spring and summer the water recedes leaving a perfectly flat salt surface.
The salt flats are so large they can be seen from space as shown in Figure 5.
Figure 5: Bonneville Salt Flats, Utah
Automobile racing at Bonneville dates back to the turn of the 20th century. As long as
there have been automobiles man has been driving them to the limits, frequently choosing
the Bonneville as the location for top speed trials. In the 1950's an official yearly hot rod
speed trail event was created. Each year more than 500 teams bring cars spanning
hundreds of categories to compete at Speedweek, the largest of 5 major events that take
place on the flats. There is quite literally a class for any type of powered vehicles,
including numbers Frankenstein like creations that didn't even begin as automobiles.
From showroom stock OEM cars to fighter jet fuel tanks with a seat and motor bolted
inside, if it can move under its' own power it has probably raced at Bonneville.. Aside

17
from the location, the track, and the cars, the most unique part of the landspeed racing
community is the relationship between the competitors. Most other forms of racing have
a very closed feel, with development happening behind locked doors and limited access
pits at the track. The rules of the racing body are very specific and hinder engineering
creativity. Slight advantages from minor changes in tuning is all that separate first and
last place so the winning configurations are highly guarded. The Bonneville experience
is quite the opposite. Though there is a rule book, nearly all of the rules are dictated by
safety and great work is taken to make sure that creativity is not limited, but instead
encouraged. The majority of the rules are simply to classify the vehicles into the various
categories. At the track the pits are completely open and the competitors are more than
willing to discuss their designs, experiences, and trade secrets. It is not uncommon to see
the current record holder coaching a competitor and suggesting design improvements, or
even taking parts from their own vehicle to help repair a competitors vehicle so they can
have a shot at a new record.
There are many different sanctioning bodies which grant landspeed records. In the
United States, sanctioning body which grants national records is the Southern California
Timing Association. Internationally sanctioned records are granted by the FIA
(Federation Internationale de l'Automobile). Records are always based on the average of
two runs, a qualifying run in which the previous record must be surpassed by at least
0.001 mile per hour, and a record run which occurs after a successful qualifying run. The
specific rules of vehicle classification, track layout, and record certification vary greatly

18
among sanctioning bodies. The course layout for national and international records are
shown in Figure 6 below.
Figure 6: Landspeed Racing Course Layout
For the national record two untimed miles of acceleration are followed by three time
miles. The average speed over each mile is calculated and the fastest mile is considered
the attempt speed. At least two miles of stopping distance follow the timed miles. If the
run qualifies for a record, the vehicle must report to impound and the team has four hours
to service the vehicle. The vehicle is kept in impound overnight and a record run takes

19
place first thing the next morning, in the same direction on the same track. During the
record run the average speeds over miles 3,4, and 5 are again recorded. It is important to
note that the speeds averaged for a record must occur in the same physical mile for both
the qualifying and record runs.
The course layout and rules for an international record vary greatly. In the case of the
international record the acceleration period and overall track length are not specified.
The only requirement is that a "flying mile" be marked somewhere on the course. This is
the only timed section of the course. Like the national records, the speed is calculated as
the average speed over the timed mile. The rules are such that a record attempt course
could be set up anywhere in the world. In the case of Bonneville the longest high quality
stretch of salt is approximately 11 miles. The flying mile is set up in the middle with
approximately 5 miles of acceleration approach on either side. The two runs must be
completed in opposite directions within one hour of each other. This is to account for
changes in grade and wind speed. While there is nearly no grade at Bonneville, this rule
is necessary to ensure fair conditions at other tracks around the world. The one hour
turnaround time becomes a huge factor in racing strategy for the teams. The clock starts
as soon as the vehicle enters the timed mile and the vehicle must exit the timed mile on
the return run within the allotted 60 minutes. This means that after considering the
stopping period in the first run and setup and acceleration periods during the second run,
approximately 30 minutes are left for vehicle service in the pits. In the case of a battery
vehicle this leads to the major decision of whether to charge or swap batteries. If a

20
charging strategy is chosen, the amount of charge that can be put into the batteries
becomes a major design parameter and has a large effect on the maximum speed of the
return run.
1.3 Motivation: Buckeye Bullet 3
In 2009 the team concluded the Buckeye Bullet 2 (BB2) hydrogen fuel cell program and
actively began the search for a new challenge. Staying within the program mission of
utilizing alternative technology to break world speed records the team became very
interested in many of the new battery technologies on the market. The team had not been
engaged in battery research since the conclusion of the Buckeye Bullet 1 (BB1) program
in 2004. During the 5 years of the hydrogen program, battery technology changed
drastically. It became evident very quickly that a with the increased power and energy
density of modern batteries, a much more efficient and thus faster battery vehicle could
be developed. In late 2009 the team began the concept phase of defining a new battery
vehicle program, The Buckeye Bullet 3 (BB3). With the electric vehicle records in hand,
it was time to raise the level of expectation of the program and begin to compare electric
vehicles to their gasoline counterparts. In landspeed racing the first digit of a speed
record is the only one that really matters. A 299 MPH record still places you in the 200
MPH club, but increase that by one MPH and suddenly you are in the 300 MPH club.
The Bullet program had performed at the 300 MPH level repeatedly and successfully, so
400 MPH was decided to be the next obvious challenge. Further investigation into the
top speeds of internal engine powered traction vehicles showed that the fastest piston

21
engine vehicle is currently the Burkland Streamliner at 415 MPH, as seen in Figure 7.
The ultimate wheel-driven record is held by a turbo shaft powered vehicle, the Vecso
Turbinator at 458 MPH, as seen in Figure 8..
Figure 7: Burkland 411 Streamliner - Current Fastest Piston Engine Vehicle 415 MPH
Figure 8: Vesco Turbinator - Current Wheel Driven Record - 458 MPH

22
Very few wheel-driven vehicles have ever broken 400 MPH. A listing of all of the
vehicles that have achieved this feat are listed in Table 1 below. There have only been 9
vehicles to exceed 400 MPH and not even all of those established an actual 2 direction
certified record.
Table 1: Wheel-Driven Runs Over 400 MPH
With these records in mind the team set out with a renewed passion to develop the
Buckeye Bullet 3. It was evident that to create a vehicle to exceed 400 MPH and
eventually contest the ultimate wheel driven record, every system would have to be
designed from the ground up as a purpose built and fully optimized solution. Nearly
every area of automotive and aerospace engineering would need to be implemented
including optimization in aerodynamics, energy storage, powertrain design, lightweight
structures, materials joining, control systems, and power electronics. Early concepts of
the aerodynamic and packaging studies are shown in Figure 9 and Figure 10. To get
Vehicle Team Year Speed Powered By Bluebird CN7 Donald Campbell 1964 403.100 1 Engine, TurboShaft, 4WD
Goldenrod Summers Brothers 1965 409.277 4 Engine, Unblown, 4WD
Speed-O-Motive Al Teague 1991 409.86 1 Engine, Blown, Fuel, 2WD
Turbinator Team Vesco 2001 458.440 1 Engine, TurboShaft, Fuel, 4WD
Spirit of Auto Power Nolan & Rick White 2002 413.000 2 Engine, Blown, Fuel
Burkland s 411 Burkland Family 2008 415.896 2 Engine, Blown, Fuel, 4WD
Spirit of Rett Charles Nearburg 2010 414.316 1 Engine, Unblown, Fuel, 2WD
Speed Demon Poteet and Main 2010 404.562 1 Engine, Blown, Fuel, 2WD
Spectre SpeedLiner Spectre 2010 408.000 1 Engine, Blown, Gas, 2WD

23
maximum powered to the ground both axles needed to be powered making the BB3 the
team's first all-wheel drive vehicle. The driver was also moved in front of the front axle
for optimal aerodynamic performance and packaging efficiency.
Figure 9: Buckeye Bullet 3 Concept
Figure 10: BB3 Proposed Layout

24
The only components carried over directly from previous vehicles were the driver and the
tires. While every other system was completely new for BB3, the previous knowledge
gained from 10 years of electric landspeed racing experience was called upon frequently
in defining each system. An intensive simulation exercise was preformed to better
understand the performance capabilities of a modern electric traction drive system. A full
sweep of many vehicle configurations and power levels were considered. Simulation
results show a properly designed, implemented, and optimized electric traction vehicle
could actually exceed 500 MPH on the current FIA course at Bonneville, as seen in
Figure 11.
Figure 11: BB3 Performance Potential

25
While most of this simulation is rooted in well proven models and historically accurate
methods, the one major idealized assumption to this exercise is that a perfect traction
control system can be implemented and that the surface consistently exhibits a coefficient
of friction of 0.6. In reality the coefficient along the salt varies greatly in both time and
location. A range of more than 0.3 can be seen at different points along the track on a
single run. In addition, implementing and tuning a perfect traction control system is large
undertaking, and will definitely not be completed in the initial testing phases of the
project.
While all of the systems require a high level of engineering optimization, the two most
critical systems are the electric powertrain, and the on board energy storage, or battery
system. The powertrain specifications have been established by the team, and the system
is currently being developed in conjunction with Venturi Automobiles, a European
electric vehicle specialization company. A detailed look into the development of the
battery system is the subject of this document.
A critical part of landspeed vehicle development is first understanding what power is
required to overcome the vehicle losses, aerodynamic drag, mass accelerations, rolling
resistance, etc; and then to gain an understanding of which areas have the potential to be
improved. While it is very true that at high speed from a magnitude perspective
aerodynamic losses dominate, the window of possible improvement is very narrow. The
difference between a well designed aerodynamic strategy and an extremely optimized

26
system is very narrow. On the other hand the mass and volume of the battery system is
an area that can be highly optimized an lead to significant overall performance gains. An
early high level estimation of energy storage needs showed the battery system could vary
more than 2000 pounds based on the use of various technologies, packaging strategies,
and integration methods. This variance led to a total vehicle mass of 6000 to 8500
pounds. As seen in Figure 12, this range of mass leads to more a performance window
gain of more than 50 MPH at the end of the run.
Figure 12: Effect Of Vehicle Weight On Speed

27
In a world where every 0.1 MPH is difficult to gain, and the difference between setting
records and going home empty handed is quite small, 50 MPH from one system
optimization is noting shy of amazing. From a mass prospective along, this sensitivity
study sets the tone for the importance of complete battery system optimization. When
coupled with the relationship to the power capabilities of the driveline, and the overall
vehicle safety which is the number one concern of the team, it becomes clear that the
proper development of a battery system is one of the most important objectives of the
entire Buckeye Bullet 3 program.
1.4 Thesis Objectives
The objectives of this document are to:
Introduce Battery Technology and Concepts Relevant to Battery Pack Design
Document and Detail All Battery Pack Development Work From 2009-2012
Present Battery Testing Procedures and Results
Present Component Selection and Design
Review Safety Considerations and Safety System Implementation
Present Complete System Design Proposal
Introduce Battery Modeling Concepts
Document Future Planned Development

28
1.5 Thesis Summary
This document is divided into 7 chapters. The first chapter provides an introduction to
Buckeye Bullet program and sets the context for the battery pack development project.
The second chapter introduces battery technology and system architecture and presents
the historical prospective of Buckeye Bullet battery packs. The third chapter describes
battery testing procedures and presents an overview of test results. The fourth chapter
explores safety consideration as well as the process of defining additional system
components needed and the methods for the design and selection of these components.
The fifth chapter details the mechanical packaging layout, design, and component
integration. The sixth chapter introduces battery modeling concepts and describes the
work completed thus far. The seventh and final chapter describes plans for future work.

29
Chapter 2: Literature Review
2.1 Introduction To Batteries
From cell phones and laptops, pacemakers, to cars, batteries are a part of the daily life of
nearly individual living and working in a developed county. In scientific terms, a battery
is an electro-chemical energy storage device. This means that through a chemical
reaction a battery has the ability to sore and later deliver electrical energy. There
numerous types of batteries in all shapes and sizes. The basic configuration of a battery
is shown in Figure 13 below.
Figure 13: How A Battery Works (Courtesy of www.altenergymag.com)

30
The cell is made up of an anode or negative terminal and a cathode or positive terminal.
The battery is also filled with an electrolyte, usually a liquid. The chemical interactions
between the materials that make up the anode and cathode and the electrolyte created a
difference in electrical potential, or voltage between the positive and negative poles.
Connecting these poles to an electrical circuit allows electrical energy to be removed
from the battery as the chemical reaction occurs, until the reaction is complete and the
battery is "empty." Depending on the specific chemistry the reaction may or may not be
reversible, or in other terms the battery may or may not be rechargeable.
The most common way to classify batteries is by their chemistry, or the materials and
reactions taking place in the cell. A few of the more common chemistries are:
Alkaline
Lead Acid
Nickel Cadmium (NiCd)
Nickel Metal Hydride (NiMH)
Lithium Ion (Li-Ion)
Zinc-Carbon
Molten Salt (Sodium-Sulfur)
For the remainder of this document only Li-Ion batteries will be considered. The
Buckeye Bullet team and the researchers at the OSU Center for Automotive research
have many years of experience in working with batteries of all types. Under the scope of
this document it is assumed that all battery types have been considered and Lithium-Ion

31
chemistries are most appropriate for the application. From this point forward the
difference between different types and suppliers within the Li-Ion family will be
considered.
2.2 The Battery Cell
From the consumer prospective the only battery parameter that really matters is capacity.
From cell phones to electric vehicles, all people want to know is how long it will last
before a recharge, making the selection of a battery fairly straightforward, the bigger the
better. From an engineering design prospective though a battery is a relatively complex
device. The smallest unit of a battery system is the cell. One cell usually represents the
smallest useable unit of anode and cathode producing the voltage established by the
chemistry. In some cases, such as automotive lead acid batteries several cells are
combined in one inseparable package to meet certain system parameter, but this is
actually a small system, not a single cell.
A great deal of battery performance can be studied on the cell level. For the most, with
the exception of thermal considerations, battery performance scales quite well from the
cell level. If complete characterization of cell parameters is performed, simulations of
complete systems is very straight forward. With this in mind it is important to understand
the parameters that effect battery performance. Electrical power is the combination of the
current flow and the operating voltage of the system. While the minimum and maximum
bounds of the voltage of a battery are defined by the chemistry, the actual operation

32
voltage is a reasonably complex parameter. Voltage is heavily affected by operation
temperature, state of charge, and discharge rate. Figure 14 below shows typical discharge
curves for a lithium-ion battery. The plot displays the cell voltage over the state of
charge (SOC) of the battery with 100% SOC on the left transitioning to 0% SOC on the
right. By following one discharge curve, it can be seen that for this chemistry the cell
begins at a high open circuit voltage at full charge, but quickly decreases after 1%
discharge. The voltage is reasonably flat for majority of the operating range of the cell,
but decreases sharply at about 20% SOC.
Figure 14: Effect of Discharge Rate On Voltage

33
A common metric for discharge rates of batteries is the C rate. This metric does not only
consider the actual magnitude of the current flow, but instead relates the current flow to
the overall battery capacity. The C rate is directly proportional to the discharge current
and inversely proportional to the length of time it takes to fully discharge the battery. A
C rate of 1 corresponds to a one hour full discharge. A C rate of 30 corresponds to a 2
minute full discharge, but at a much higher discharge current than a C rate of 1 for the
same battery. In addition to demonstrating the general shape of the voltage discharge
curve, Figure 14 above also displays discharge curves for several different C rates. It can
be seen that discharging a cell at a higher rate results in an overall downward shift of the
voltage concern. While this phenomenon might not have significant impact on the single
battery present in a TV remote control, when the battery system is instead powering an
electrical motor and the 300 mV difference is multiplied across many batteries in series,
there is a significant overall voltage drop which can lead to a significant impact on
overall system performance.
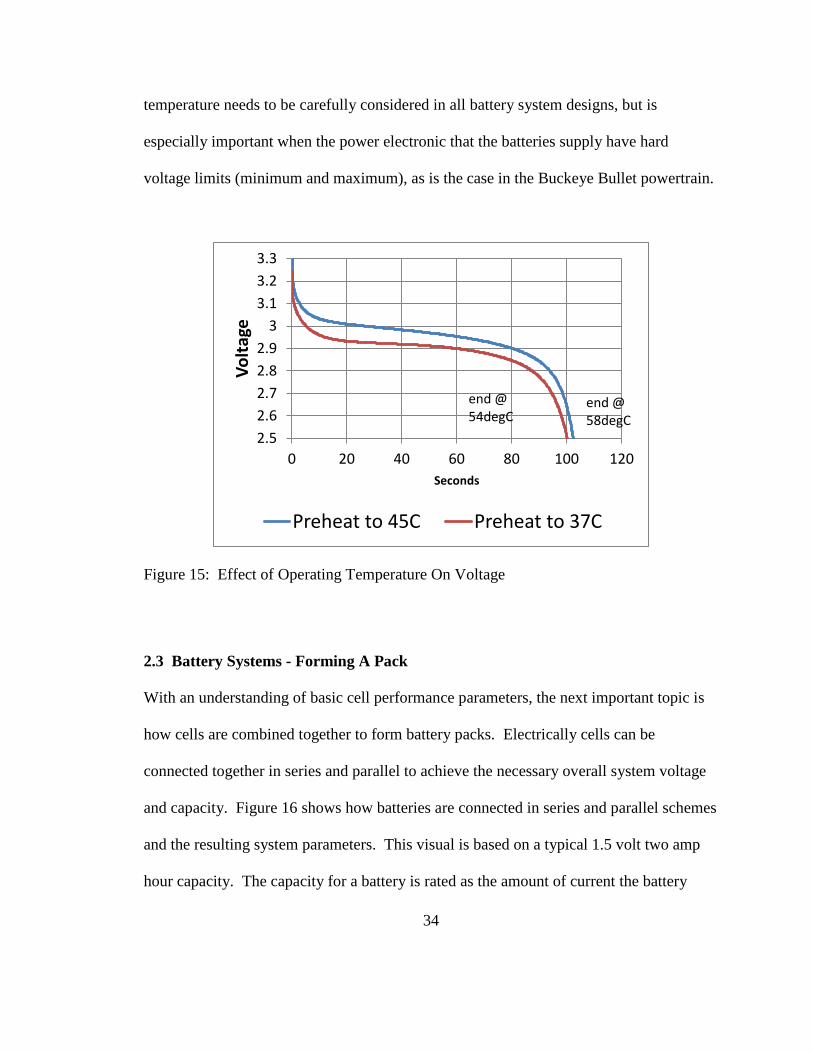
The next major factor affecting cell performance is temperature. The voltage of a cell is
highly dependent on the operating temperature. In general, within the acceptable
operating bounds, the higher the temperature the higher the voltage. Figure 15 shows two
discharge curves for the same cell and discharge rate, but with an 8 degree difference in
the cell temperature at the start of the test. Even at this small temperature differential, the
effect on voltage is clear. As stated above, even small deviations in the voltage at the cell
level compound to significant pack level voltage for the entire system. Operating
34
temperature needs to be carefully considered in all battery system designs, but is
especially important when the power electronic that the batteries supply have hard
voltage limits (minimum and maximum), as is the case in the Buckeye Bullet powertrain.
Figure 15: Effect of Operating Temperature On Voltage
2.3 Battery Systems - Forming A Pack
With an understanding of basic cell performance parameters, the next important topic is
how cells are combined together to form battery packs. Electrically cells can be
connected together in series and parallel to achieve the necessary overall system voltage
and capacity. Figure 16 shows how batteries are connected in series and parallel schemes
and the resulting system parameters. This visual is based on a typical 1.5 volt two amp
hour capacity. The capacity for a battery is rated as the amount of current the battery
2.5
2.6
2.7
2.8
2.9
3
3.1
3.2
3.3
0 20 40 60 80 100 120
Vo
ltag
e
Seconds
Preheat to 45C Preheat to 37C
end @ 58degC
end @ 54degC
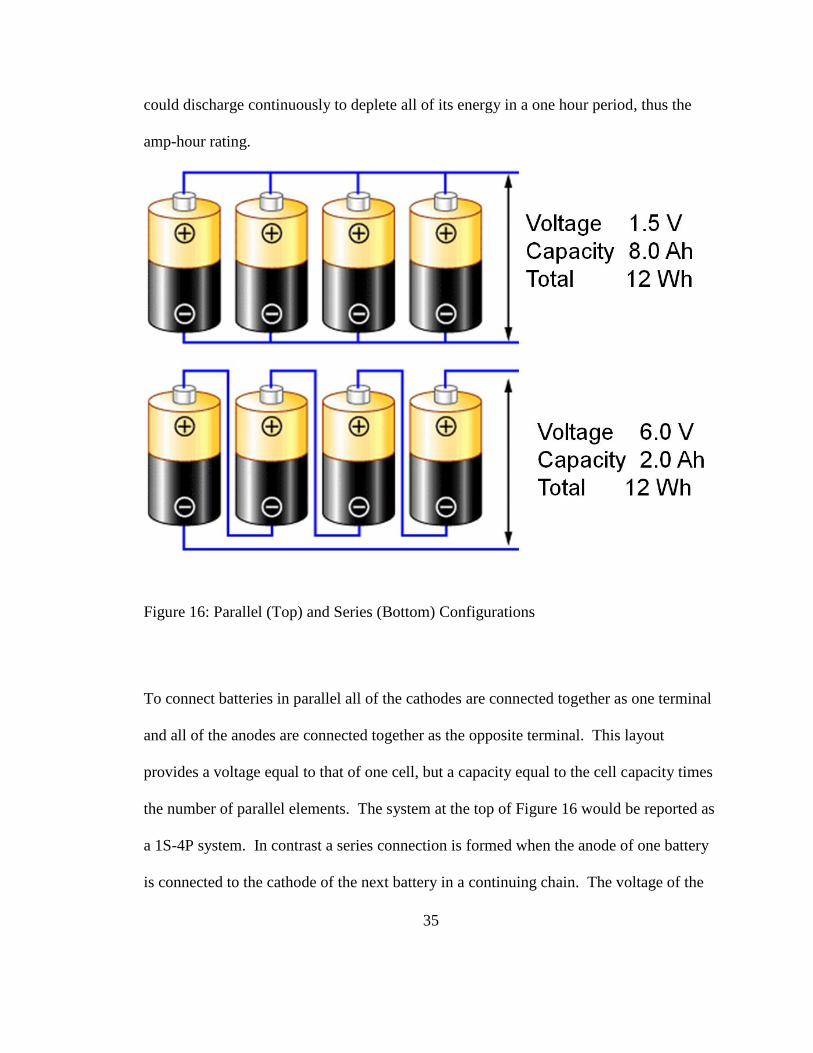
35
could discharge continuously to deplete all of its energy in a one hour period, thus the
amp-hour rating.
Figure 16: Parallel (Top) and Series (Bottom) Configurations
To connect batteries in parallel all of the cathodes are connected together as one terminal
and all of the anodes are connected together as the opposite terminal. This layout
provides a voltage equal to that of one cell, but a capacity equal to the cell capacity times
the number of parallel elements. The system at the top of Figure 16 would be reported as
a 1S-4P system. In contrast a series connection is formed when the anode of one battery
is connected to the cathode of the next battery in a continuing chain. The voltage of the

36
system is equal to the voltage of a cell times the number of series elements, but the
capacity is only that of one cell. The system at the bottom of Figure 16 would be
reported as a 4S-1P system. is important to note that the power-capacity rating is
conserved in both cases. With this example it can be seen that series elements are added
to achieve the required voltage and parallel elements are added to achieve the required
capacity, or in other terms, divide the current draw among multiple cell strings. To
calculate the needed number of series and parallel elements Equation 1 and Equation 2
below can be used.
Equation 1: Number of Series Cells
Equation 2: Number of Parallel Cells
After determining the number of series and parallel elements needed, the electrical
structure must be determined. In the simplest terms the designer must decide if cells will
be connected in series first and then the series string in parallel, or the opposite. The two
basic options are displayed in Figure 17.
VV
cell
busdcSeries
max_
max__#
max_
max
max_
max#ratecell CCapacity
I
I
IParallel

37
Figure 17: (Left) Parallel Groups Of Series Cells, (Right) Series Groups Of Parallel Cells
The decision of which strategy to use is one of continual debate and requires
consideration of many system parameters and design constraints. In general is it
reasonable to state that the preferred method is to have parallel connections at the cell
level. This strategy has a few benefits. First of all this keeps parallel string forced to the
same voltage and thus prevents the possibility of circulating currents from an imbalance
in charge between parallel elements. Circulating currents between strings can cause a
great deal of harm and even complete failure of a battery system. If the alternative
strategy is used with series strings in parallel diodes must be used on each string to

38
prevent circulating currents, which leads to a great deal of additional system complexity
and added components. The parallel first strategy also keeps sub modules at lower
voltages that are safer to handle since there are less series elements in within each
module. Finally the parallel first strategy requires less control electronics. In a lithium
pack, as will be discussed in Chapter 4, it is critical to monitor voltage at ever series
connection to ensure proper operation. If the cells are in parallel the total number of
voltage measurements is equal to the number of series elements, but if the cells are in
series first the number of measurements is the number of series cells times the number of
parallel cells. Every cell in the pack must be monitored. This adds cost and complexity
to the control system. On the other hand, when cells are put in parallel first, all of the
system components see the full pack current meaning that all of the wiring, connectors,
and system components must be able to handing the full discharge current. In large
systems this could mean a significant increase in the size of all of the sub pack
components.
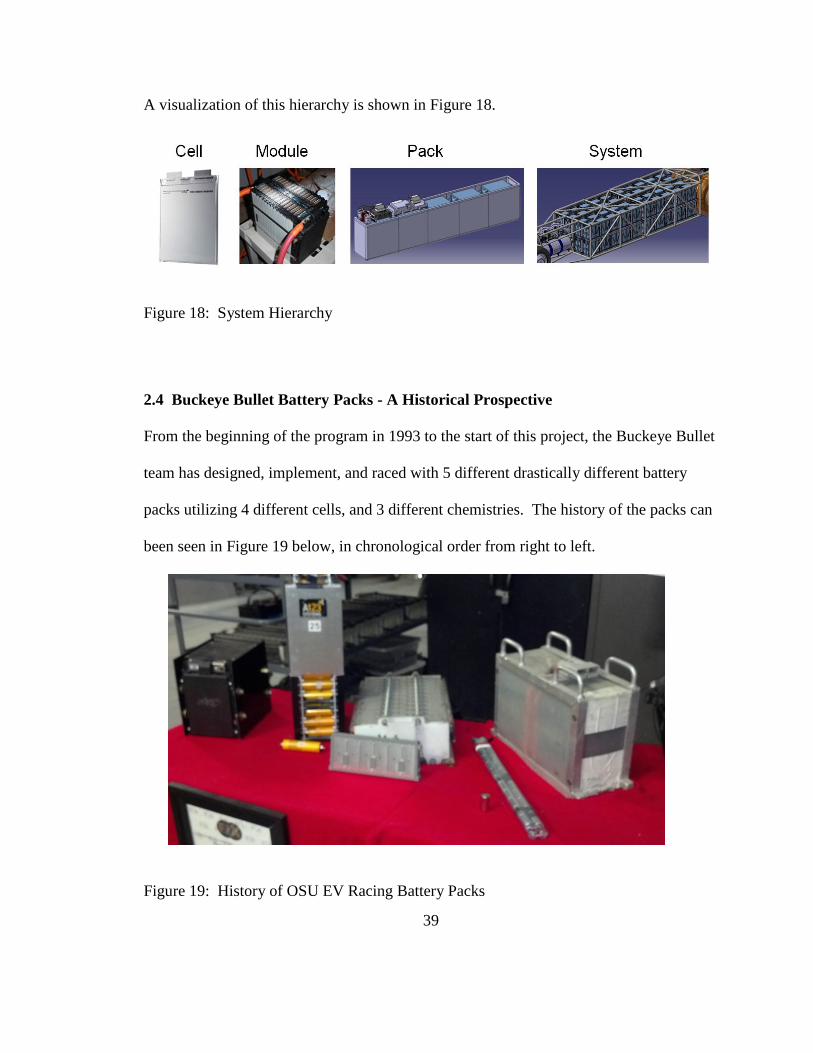
The general terminology for battery unit hierarchy used in this document are as follows:
Cell - The Simplest and Smallest Battery Unit, No Control Or Monitoring
Module - A Collection of Cells Contained Within Factory Packaging and
Including A Voltage and Temperature Measurement Board
Battery Pack - A Complete System Containing Multiple Modules, an Overall
Supervisory Management System, and a Thermal Management System
Vehicle System - A Complete System That Consists of Multiple Battery Packs To
Meet the Overall Vehicle Power Needs. This Includes a Master Controller.
39
A visualization of this hierarchy is shown in Figure 18.
Figure 18: System Hierarchy
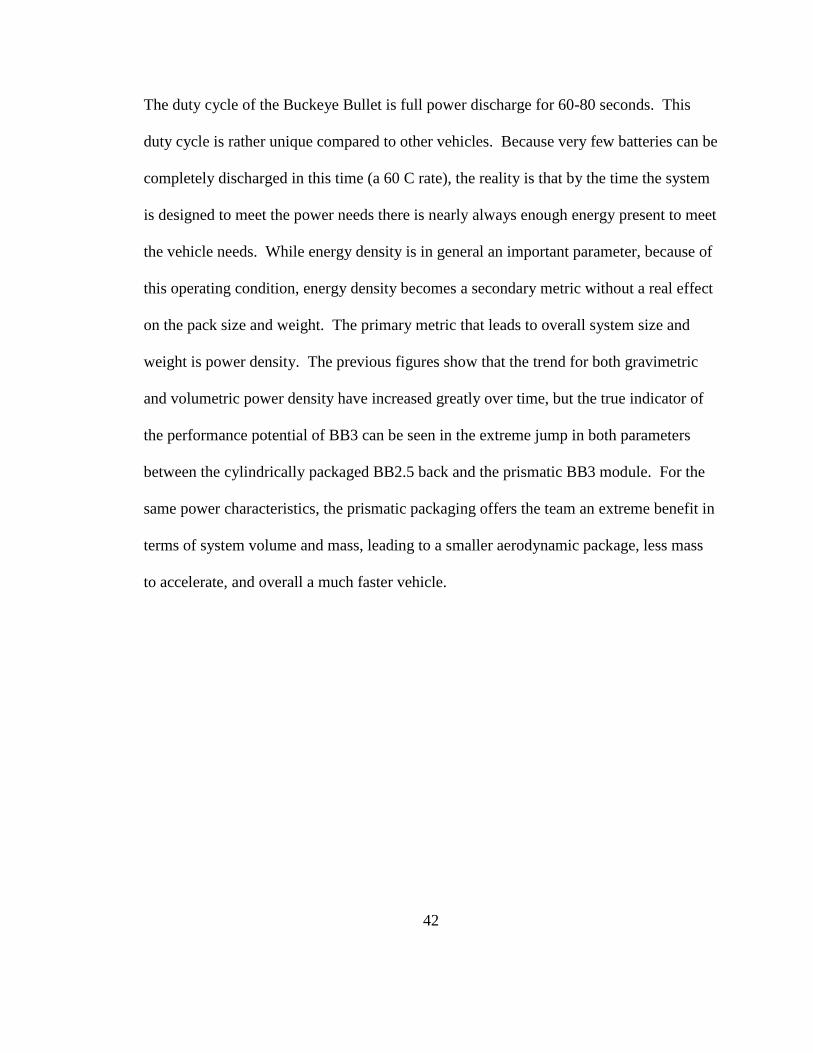
2.4 Buckeye Bullet Battery Packs - A Historical Prospective
From the beginning of the program in 1993 to the start of this project, the Buckeye Bullet
team has designed, implement, and raced with 5 different drastically different battery
packs utilizing 4 different cells, and 3 different chemistries. The history of the packs can
been seen in Figure 19 below, in chronological order from right to left.
Figure 19: History of OSU EV Racing Battery Packs

40
The team has had experience with lead acid, NiMH, and Li-ion batteries in cylindrical
and prismatic form. The cylindrical Li-ion cells from A123 systems utilized in the
Buckeye Bullet 2.5 provided a very useful design and integration experience to help the
team learn about modern battery systems before attempting to develop the BB3 pack. In
fact the entire BB2.5 program was designed as a test application for the team to gain
knowledge and experience in battery systems. A great deal of the data presented in this
report relate to the BB2.5 cell testing, and battery pack. Where possible data from the
BB3 pack is used, but in many cases this data is still in progress and/or protected by
current non-disclosure agreements. Where necessary BB2.5 data is presented as a
substitute for the BB3 data. The cell used in the BB2.5 was A123 systems cylindrical
32113 HEV cell, while the cell used in BB3 will be a modified chemistry version of
A123's prismatic cell offering. The cells will be referred to from this point forward as
either the 32113 or the prismatic cell to distinguish which model is being discussed.
As an interesting aside, an investigation to compare the battery performance over time
was completed and the results presented in Figure 20 and Figure 21. Two common
metrics to compare battery performance are power density and energy density. This
metrics relate the amount of power and energy to either the unit mass (gravimetric
efficiency) or volume (volumetric efficiency). It is important to note that the reported
power and energy densities are not the absolute maximum for the particular cell, but
instead the calculated values based on actual vehicle utilization as implemented.

41
Figure 20: Power and Energy Density (Gravimetric) Over Time
Figure 21: Power and Energy Density (Volumetric) Over Time
42
The duty cycle of the Buckeye Bullet is full power discharge for 60-80 seconds. This
duty cycle is rather unique compared to other vehicles. Because very few batteries can be
completely discharged in this time (a 60 C rate), the reality is that by the time the system
is designed to meet the power needs there is nearly always enough energy present to meet
the vehicle needs. While energy density is in general an important parameter, because of
this operating condition, energy density becomes a secondary metric without a real effect
on the pack size and weight. The primary metric that leads to overall system size and
weight is power density. The previous figures show that the trend for both gravimetric
and volumetric power density have increased greatly over time, but the true indicator of
the performance potential of BB3 can be seen in the extreme jump in both parameters
between the cylindrically packaged BB2.5 back and the prismatic BB3 module. For the
same power characteristics, the prismatic packaging offers the team an extreme benefit in
terms of system volume and mass, leading to a smaller aerodynamic package, less mass
to accelerate, and overall a much faster vehicle.
43
Chapter 3: Battery Testing
3.1 Types of Test
The design of a battery system begins with fully understanding the capabilities and limits
of the selected battery technology at the cell level. A full development program requires
cell characterization and validation at the module, pack, and system levels. While a full
research program might be interested in a wide ranges of test over a vast range of
operation conditions, but Bullet program can somewhat simplify testing by narrowing the
scope to the specific operation conditions of Bonneville racing. There is little point in
investigating the effects of cell aging, cold temperature operations, and low discharge
current performance curves. In reality the Bullet will have an extremely low number of
cycles over its life, always be extremely hot environments, and always be pulling high
levels of current. There are however still a large number of tests required to really
characterize a battery, even under these limited operating conditions.
The relevant test to our program include:
Capacity Testing
Hybrid Pulse Power Characterization Testing (HPPC)
Racing Power Profile Testing
Thermal Testing

44
Capacity testing allows the actual cell capacity to be compared to the manufacturers
claim, and gives some indication to the age and health of the battery. While it is not
critical for the Bullet program, a capacity result that deviates highly from other similar
cells can quickly indicate a problem. The HPPC test is a standardized test that allows
characteristic necessary for battery modeling to be determined experimentally. This will
be discussed further in the following sections and in Chapter 6. The two test most
relevant to the program are the race power profile testing and various thermal testing
exercises. In the power profile tests, the cells are run through the exact current request
cycle that will be seen in the race vehicle as determined by the motor needs. This test is
the most representative of what to expect in actual operation. As discussed in Chapter 1,
the thermal operation conditions are extremely important to the actual cell performance.
A matrix of tests related to thermal performance are performed to determine the cooling
strategy needed, optimum starting temperature, and understand the failure potentials of
the pack if a race doesn't go according to plan.
3.2 Experimental Setup and Procedures
The OSU Center for Automotive research which houses the Buckeye Bullet program has
extensive battery testing capabilities and equipment. All of the testing for this program is
completed in the OSU-CAR labs under the advisement of the OSU CAR staff. Recently
lab a dedicated to student projects battery testing has been donated by Denso
Corporation and we are excited to utilize this equipment in the future. In general all
testing takes place on some form of battery cycling setup. A cycler consists of a power
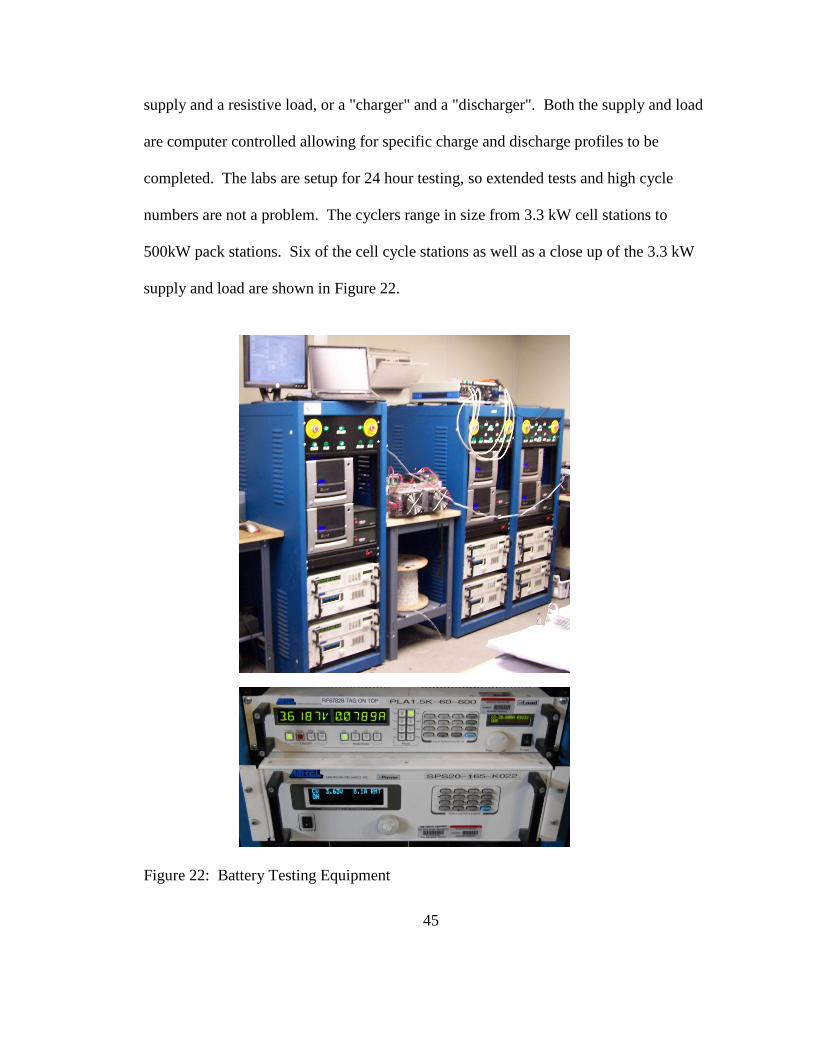
45
supply and a resistive load, or a "charger" and a "discharger". Both the supply and load
are computer controlled allowing for specific charge and discharge profiles to be
completed. The labs are setup for 24 hour testing, so extended tests and high cycle
numbers are not a problem. The cyclers range in size from 3.3 kW cell stations to
500kW pack stations. Six of the cell cycle stations as well as a close up of the 3.3 kW
supply and load are shown in Figure 22.
Figure 22: Battery Testing Equipment
46
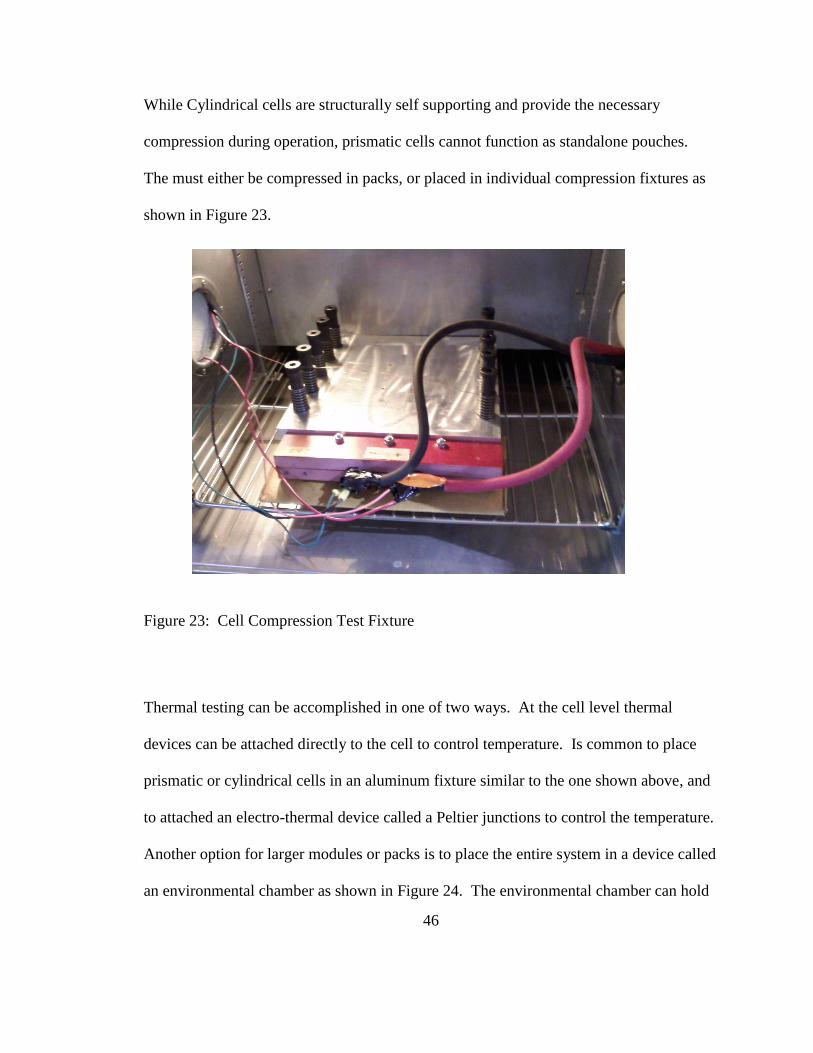
While Cylindrical cells are structurally self supporting and provide the necessary
compression during operation, prismatic cells cannot function as standalone pouches.
The must either be compressed in packs, or placed in individual compression fixtures as
shown in Figure 23.
Figure 23: Cell Compression Test Fixture
Thermal testing can be accomplished in one of two ways. At the cell level thermal
devices can be attached directly to the cell to control temperature. Is common to place
prismatic or cylindrical cells in an aluminum fixture similar to the one shown above, and
to attached an electro-thermal device called a Peltier junctions to control the temperature.
Another option for larger modules or packs is to place the entire system in a device called
an environmental chamber as shown in Figure 24. The environmental chamber can hold

47
a very wide range of temperatures quite accurately and has the option of also performing
humidity control.
Figure 24: Environmental (Thermal Control) Chamber
3.3 Power Testing
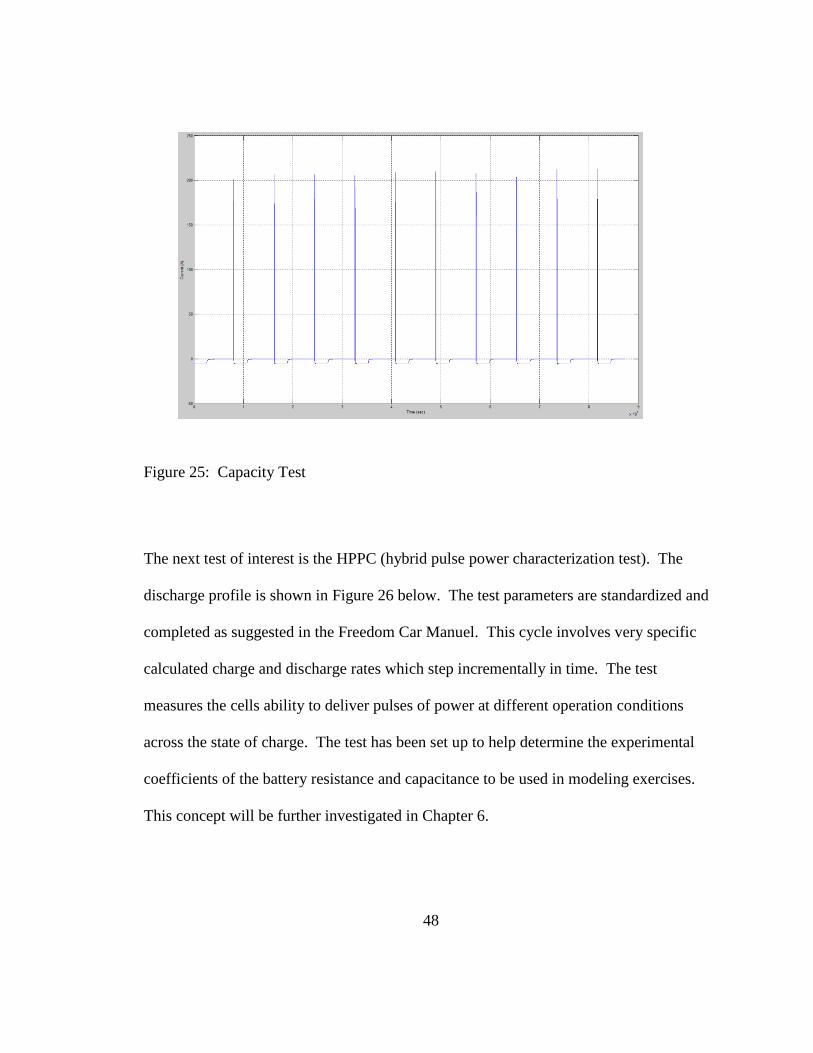
As discussed above the first test is the capacity test. The discharge profile is shown in
Figure 25. The cell is discharged to a specified voltage which is designated as the
minimum voltage by the manufacturer. The current and discharge time are closely
monitored and from this the amp-hour rating can be determined. This test is repeated
multiple times and the results are averaged to produce an actual capacity rating.
48
Figure 25: Capacity Test
The next test of interest is the HPPC (hybrid pulse power characterization test). The
discharge profile is shown in Figure 26 below. The test parameters are standardized and
completed as suggested in the Freedom Car Manuel. This cycle involves very specific
calculated charge and discharge rates which step incrementally in time. The test
measures the cells ability to deliver pulses of power at different operation conditions
across the state of charge. The test has been set up to help determine the experimental
coefficients of the battery resistance and capacitance to be used in modeling exercises.
This concept will be further investigated in Chapter 6.

49
Figure 26: FreedomCar HPPC Test
With the initial capacity and HPPC test completed the next step is to look at the cells
specific response to the Buckeye Bullet power cycle. As previously introduced discharge
rates are reported at C rates. For a cell to be effective for use in the Buckeye Bullet it
needs to be able to be deliver all of its energy relatively quickly. A cell capable of a 30 C
rate is preferred, meaning it can deliver all of its energy in two minutes. A cell with a
lower maximum C rate results in carrying extra energy and thus mass on board the
vehicle. When performing power test, a maximum C rate is determined in consultation
with the manufacturer, and then the test matrix shown in Figure 27 implemented. The
program involves testing at 1/3, 2/3, and full discharge rates. The time to discharge for
each of these test can be seen in the Figure.

50
Figure 27: Race Profile Test Matrix
In the case of the BB2.5, a multi speed transmission was used, so the motor current
demand involved a segments in each gear as seen in Figure 28. When this current profile
was applied to the BB2.5 32113 cell the resulting voltage profile becomes the output of
interest. This profile can be seen in Figure 29. The current profile is followed exactly,
but the voltage changes as a result of current, change in rate of current, and temperature.
The motor performance is ultimately dictated by power delivery which is a function of
both the current requested and the resulting voltage. From this prospective the current is
considered a known input and the voltage response is the parameter that is actively
monitored and studied.

51
Figure 28: BB2.5 Race Profile - Current Draw
Figure 29: BB2.5 Race Profile - Voltage Performance

52
To demonstrate the difference in cell chemistry and form factor, two different A123
Systems products were tested using the same BB2.5 power cycle. The results are shown
in Figure 30. The 26650 is a more energy driven cell targeted to application such as the
long range electric vehicle market. The 32113 is the power driven cell which was
developed for pulse power applications such as the hybrid vehicle market.
Figure 30: BB2.5 Race Profile - Voltage Performance Between 2 Different Cell Models
The power cell maintained a voltage of approximately 2.8 V under load while the energy
cell dropped to 2.3V. For a pack sized for a 900V open circuit fully charged voltage this
means the voltage under load would drop to 700 V for the power pack but only 575 V for
the energy pack. In this case the minimum acceptable voltage is 680 V so the power cell
53
made the cut but the energy cell did not. More energy cells could be added in series, but
this would take the open circuit voltage above 900 V, which is unfortunately the
maximum acceptable voltage of the inverter. In this case this led to the decision that this
cell was not a good fit for the program. While some more exotic solutions such as adding
series elements and then starting at a less than 100% SOC could allow the cell to be used,
it is not an necessary effort when there are better cells for the application available.
Another example of defining an optimized system is matching the cell form factor and
capacity to the application. While a superior chemistry in terms of voltage response,
power delivery, and reliability is very important, nearly equally important is the ability to
match the needed capacity to the application. During the initial cell selection phase the
team investigated many different cells. In each case a maximum C rate was established
and the cell was tested at that rate. If the voltage dropped too low to deliver proper
power to the motor, then the C rate was decreased. Decreasing the acceptable C rate
specification effectively means adding parallel components to the pack. In the case of a
small form factor cell this might may not have a large effect on the system size and
weight, but in a larger form factor cell that was only being used in a 1P configuration this
might mean doubling the size and weight of the pack. This precise issue came up with
one of the A123 competitor cells investigated. In this case it was a large form factor
prismatic cell. On paper, a four parallel elements provided enough power and energy to
meet the needs of the BB2.5 race vehicle. When the manufacturers specifications for
both the competitor cell and A123's 32113 were considered, the system described in

54
Table 2 were established as system parameters and requirements. It can be seen that
based on the manufacturers specifications, the packs would result in similar size and
volume with a slight advantage to A123, but the competitor pack contained more than
twice the energy. This indicated that the vehicle might be able to complete two runs
without recharging which could be a trade off worth the slight increase in volume and
mass.
Table 2: Sample Pack Sizing Comparison for BB2.5 - Manufacturer Specs
Parameter Competitor A123 32113 Nominal Voltage/Cell 3.65V 3.6V
Nominal Capacity 16Ah 4.4Ah
Weight/Cell 450g 225g
Maximum Pack Voltage (No Load) 900V 900V
Minimum Pack Voltage (Under Load) 730V 730V
Current/Cell Maximum Requested 213A 121A
Used kWHrs/run for Pack ~13.5kWHrs ~13.5kWHrs
Nominal kWHrs/Pack ~52kWHrs ~25kWHrs
Used Ah/run for Pack ~17Ah ~17Ah
Nominal Ah/Pack 64Ah 30.8Ah
Series Cells/Pack 245 275
Parallel Cells/Pack 4 7
Total Cells/Pack 980 1925
Pack Volume (Batteries Alone) .252m^3 .191m^3
Pack Weight (Batteries Alone) 441kg 433kg
55
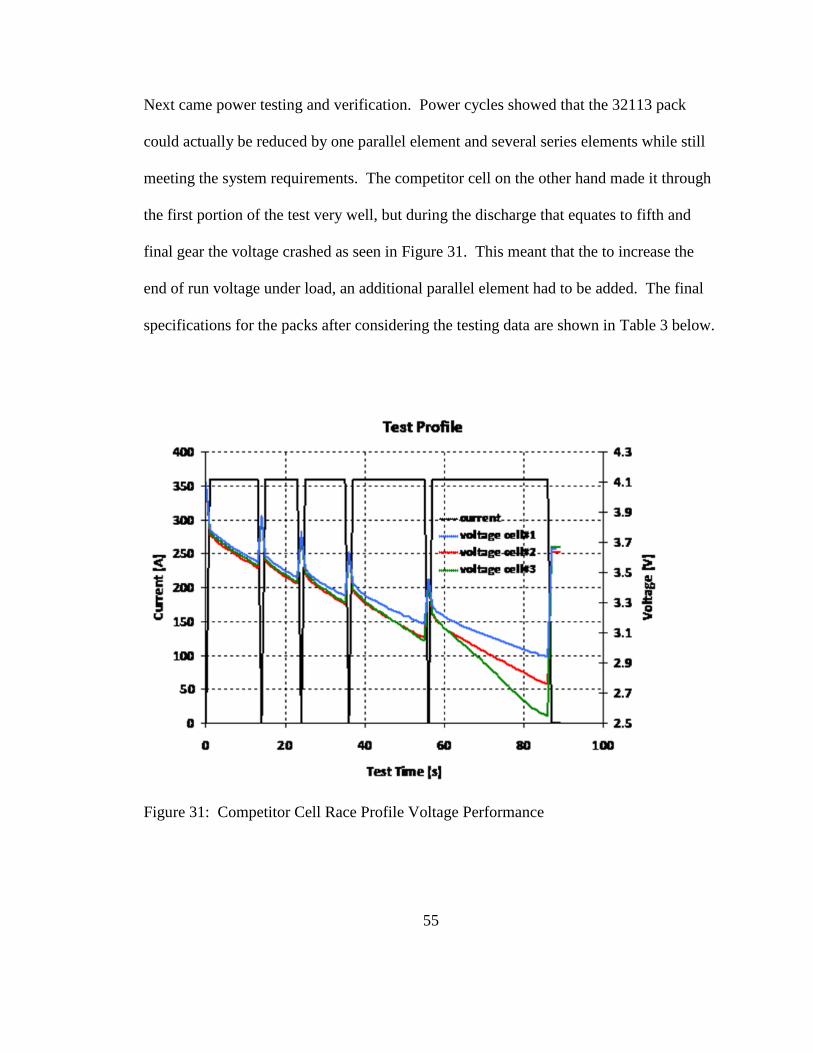
Next came power testing and verification. Power cycles showed that the 32113 pack
could actually be reduced by one parallel element and several series elements while still
meeting the system requirements. The competitor cell on the other hand made it through
the first portion of the test very well, but during the discharge that equates to fifth and
final gear the voltage crashed as seen in Figure 31. This meant that the to increase the
end of run voltage under load, an additional parallel element had to be added. The final
specifications for the packs after considering the testing data are shown in Table 3 below.
Figure 31: Competitor Cell Race Profile Voltage Performance

56
Table 3: Sample Pack Sizing Comparison for BB2.5 - After Testing
Parameter Competitor A123 32113 Nominal Voltage/Cell 3.65V 3.6V
Nominal Capacity 16Ah 4.4Ah
Weight/Cell 450g 225g
Maximum Pack Voltage (No Load) 900V 900V
Minimum Pack Voltage (Under Load) 750V 700V
Current/Cell Maximum Requested 170A 141A
Used kWHrs/run for Pack ~13.5kWHrs ~13.5kWHrs
Nominal kWHrs/Pack ~65kWHrs ~21.4kWHrs
Used Ah/run for Pack ~17Ah ~17Ah
Nominal Ah/Pack 80Ah 26.6Ah
Series Cells/Pack 245 250
Parallel Cells/Pack 5 6
Total Cells/Pack 1225 1500
Pack Volume (Batteries Alone) .315m^3 .149m^3
Pack Weight (Batteries Alone) 551kg 337kg
When the actual needs are updated to reflect the testing data, the two packs that initially
seemed to be quite comparable in terms of volume and mass became drastically different.
The competitor pack is more than twice the volume and more than 60% heavier. The
competitor pack also forces the vehicle to carry along more than four time times the
required energy. With this exercise in mind, the concept of matching a cell both in terms
of absolute performance and appropriate size to the specific application, becomes quite
clear.
57
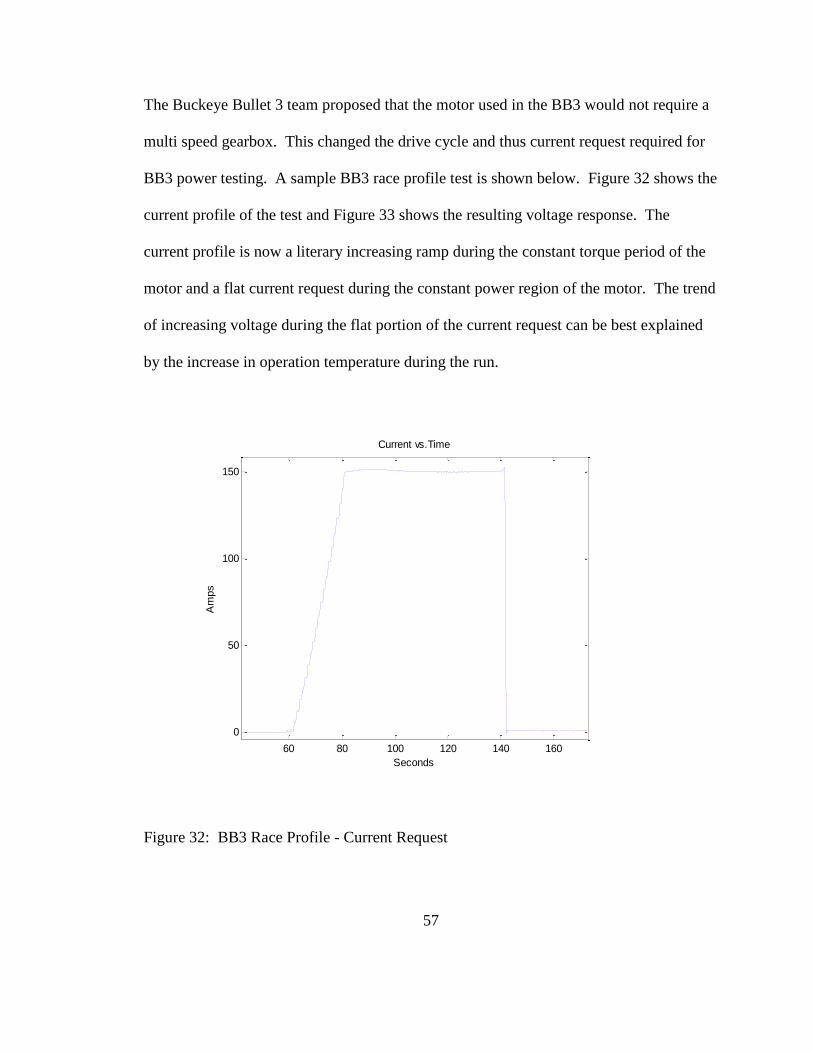
The Buckeye Bullet 3 team proposed that the motor used in the BB3 would not require a
multi speed gearbox. This changed the drive cycle and thus current request required for
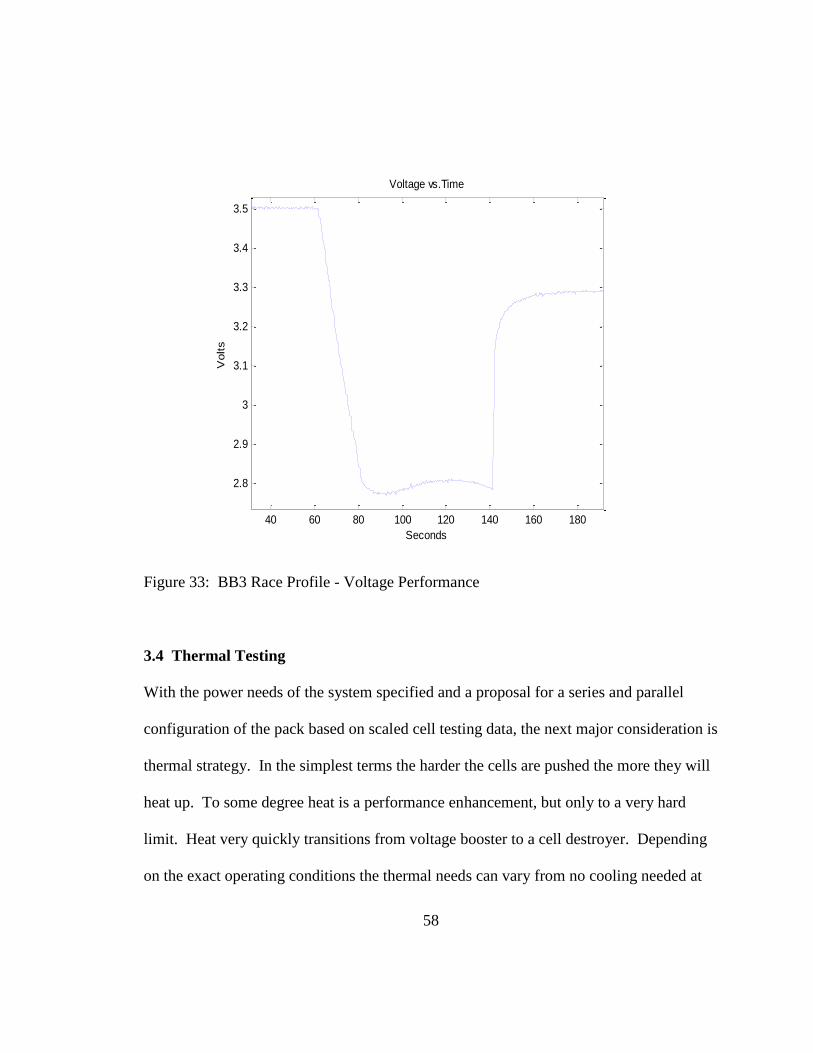
BB3 power testing. A sample BB3 race profile test is shown below. Figure 32 shows the
current profile of the test and Figure 33 shows the resulting voltage response. The
current profile is now a literary increasing ramp during the constant torque period of the
motor and a flat current request during the constant power region of the motor. The trend
of increasing voltage during the flat portion of the current request can be best explained
by the increase in operation temperature during the run.
Figure 32: BB3 Race Profile - Current Request
60 80 100 120 140 160
0
50
100
150
Current vs.Time
Seconds
Am
ps
58
40 60 80 100 120 140 160 180
2.8
2.9
3
3.1
3.2
3.3
3.4
3.5
Voltage vs.Time
Seconds
Volts
Figure 33: BB3 Race Profile - Voltage Performance
3.4 Thermal Testing
With the power needs of the system specified and a proposal for a series and parallel
configuration of the pack based on scaled cell testing data, the next major consideration is
thermal strategy. In the simplest terms the harder the cells are pushed the more they will
heat up. To some degree heat is a performance enhancement, but only to a very hard
limit. Heat very quickly transitions from voltage booster to a cell destroyer. Depending
on the exact operating conditions the thermal needs can vary from no cooling needed at

59
all, to a requirement very complex actively managed liquid cooling system. When
considering the thermal system design, the following concepts were carefully considered:
Cooling Capacity Need - What if any cooling will be needed?
Cooing Strategy - What type of cooling system best meets systems needs?
Pre Heating - is beginning at an elevated temperature worth the effort and risk?
Regenerative Braking - if used what thermal effects does it have on the system?
Each of these questions can be answered by performing thermal characterization of the
battery in much the same way that a power characterization was performed in the
previous section. The main difference thermally motivated testing is that in most cases
the testing cannot simply be performed at the cell level and scaled. As should be
expected, the thermal tests are heavily influenced factors such as cell proximity to one
another, air gap, packaging materials, bus bar materials, and ambient conditions.
When considering the cooling strategy to implement there are many options including:
Natural Free Convection
Forced Air Convection
Liquid Cooling with Cold Plates
Submersion Cooling
Expanded Gas Cooling

60
In the context of a race car the most efficient system would have no onboard components
that add volume and mass to the car. This leads to the concept that in the ideal case either
the batteries would be sized such that the duty cycle did not produce enough heat to
require cooling, or that a system that could be kept completely off board and used
between runs to condition the batteries.
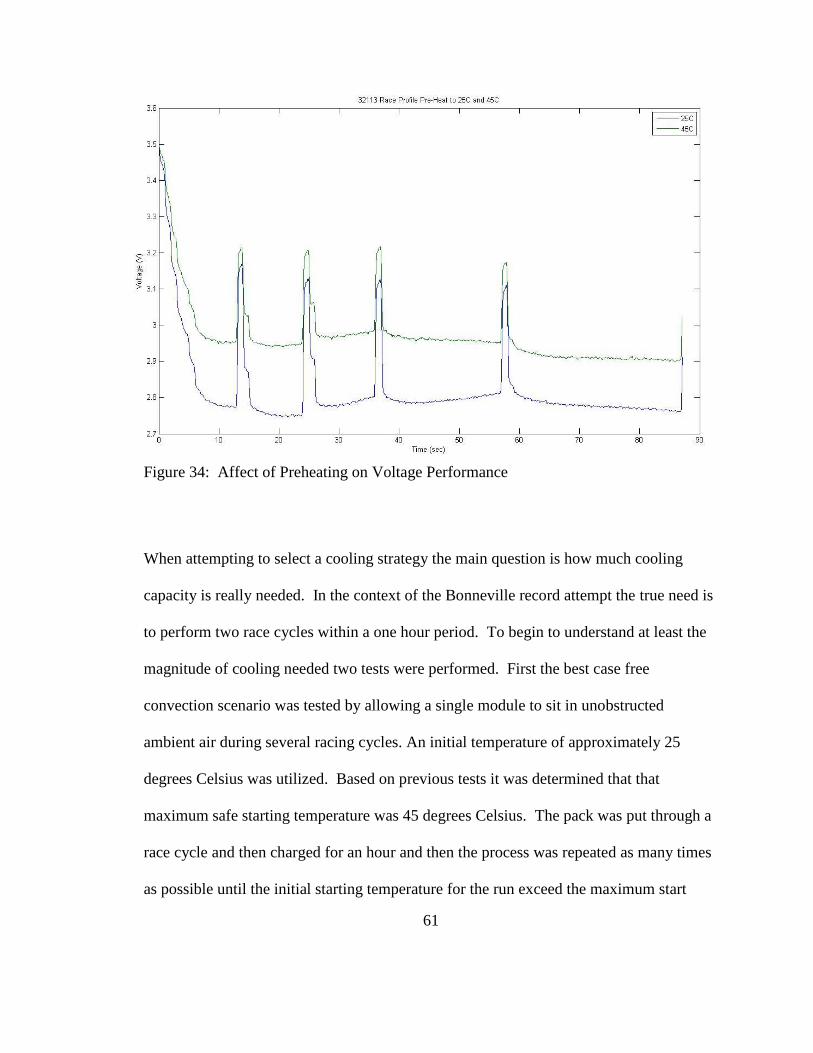
All of the testing in the following section represents the thermal analysis of a BB2.5
racing cycle. The first case studied was the affect of initial temperature on system
performance. Figure 34 shows the voltage profile for two different initial temperatures,
one at 25 degrees Celsius and the other at 45 degrees. It can be seen that the high initial
temperature leads to more than 200 mV increase per cell over the entire run. In a 250S
pack this means a 50V increase in the bus voltage. The penalty is obviously the elevated
end of run temperature, which means more cooling is needed to prepare for the next run.
61
Figure 34: Affect of Preheating on Voltage Performance
When attempting to select a cooling strategy the main question is how much cooling
capacity is really needed. In the context of the Bonneville record attempt the true need is
to perform two race cycles within a one hour period. To begin to understand at least the
magnitude of cooling needed two tests were performed. First the best case free
convection scenario was tested by allowing a single module to sit in unobstructed
ambient air during several racing cycles. An initial temperature of approximately 25
degrees Celsius was utilized. Based on previous tests it was determined that that
maximum safe starting temperature was 45 degrees Celsius. The pack was put through a
race cycle and then charged for an hour and then the process was repeated as many times
as possible until the initial starting temperature for the run exceed the maximum start

62
temperature. The results of this test can be seen in Figure 35. More than 5 runs were
successfully completed. This shows that if the modules were in fact sitting in open air
then no cooling system would be needed at all to achieve two consecutive races without
thermal concern. Next the test was repeated, but for the worst case scenario of a
completely insulated module. This simulated modules tightly packed in the race vehicle
with no access to ambient air. The results of this test can be seen in Figure 36. In this
case two runs could be completed back to back but a third run could not be completed
until a several hour rest period allowed the cells to cool to the maximum run start
temperature. At the time of this testing the actual cell to be used in the BB3 was not
available for testing, so this data is based on scaled testing with a similar product.
Figure 35: Thermal Performance During Racing Profile - Non-Insulated Case

63
Figure 36: Thermal Performance During Racing Profile - Insulated Case
The results of this test lead to the conclusion that on board vehicle active cooling would
probably not be needed, but it would be necessary to remove heat from the system during
the pit stop. Because the testing was based on scaled performance and not the actual cell
to be used, it was initially decided to plan on the conservative side and develop a liquid
cooling system that would be in place on board, but with the cooling agent and prime
mover off board. During a pit stop a cold water supply would be connected to the vehicle
and cycled. At a later date when the actual cell was available for testing, the results
showed that the real cell preformed better than expected and even in the completely
insulated case 3 racing runs could be performed without thermal issue. This data is
omitted from the report due to non disclosure issues, but was instrumental in the final
cooling strategy decision presented in the next section.

64
Another interesting consideration is the amount of time it take the heat to be generated
and then to propagate to the outside of the cell. Even though current is being delivered at
a high rate for approximately 80 seconds it is not until after the run that the cells start to
heat up in their core, and often it is not until several minutes after the run that the
maximum temperature is seen at the outside of the cell. This phenomenon is shown in
Figure 37 below.
Figure 37: Heat Generation and Transfer Rate

65
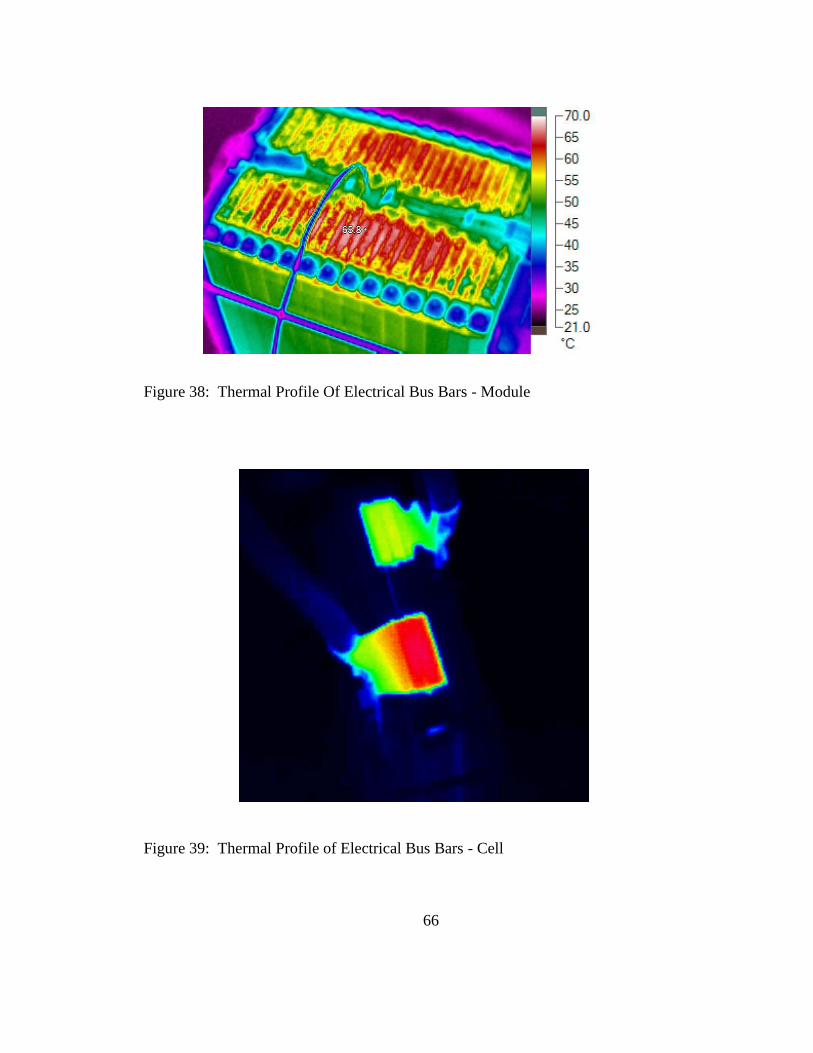
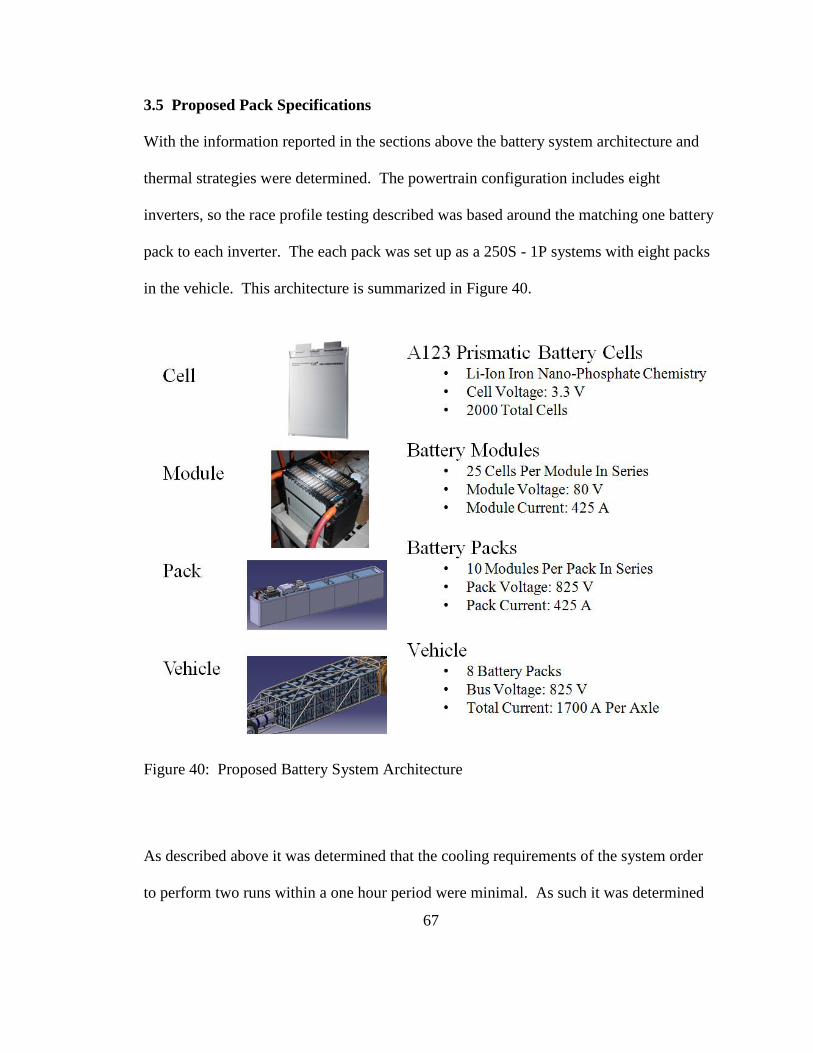
The final thermal consideration tested was the bus bar temperature. While the rated
operating temperatures are around 50 degrees Celsius in a short term racing application it
is acceptable to push the maximum temperature closer to the ultimate failure temperature
of 85 degrees Celsius. At high current rates the cells did not exhibit any thermal
problems, but the copper bus bars also heat significantly from the resistive losses of the
power they are carrying. At very high current rates the bus bars actually reach
temperatures significantly higher than the cells. At the current proposed operating
conditions this is not a problem, but if any more current is required form the powertrain a
bus bar cooling solution will have to be investigated as the bus bars will begin to reject
heat into the cell and cause the cells to fail. The bus bars are difficult to access making
forced convection difficult, there are many of them meaning the system would be large
and complex, and they are conductive so any tradition all liquid cooling methods will not
work. It is the sincere hope of the designers that this does not become a need as such a
system brings up these significant design challenges. Thermal images of bus bar testing
are shown in Figure 38 and Figure 39. It should be noted that in a lithium cell the anode
and cathode terminals are made of different materials (usually one aluminum and one
steel) with different heat transfer properties. This causes significant temperature
differences between the two terminals as seen in Figure 39.
66
Figure 38: Thermal Profile Of Electrical Bus Bars - Module
Figure 39: Thermal Profile of Electrical Bus Bars - Cell
67
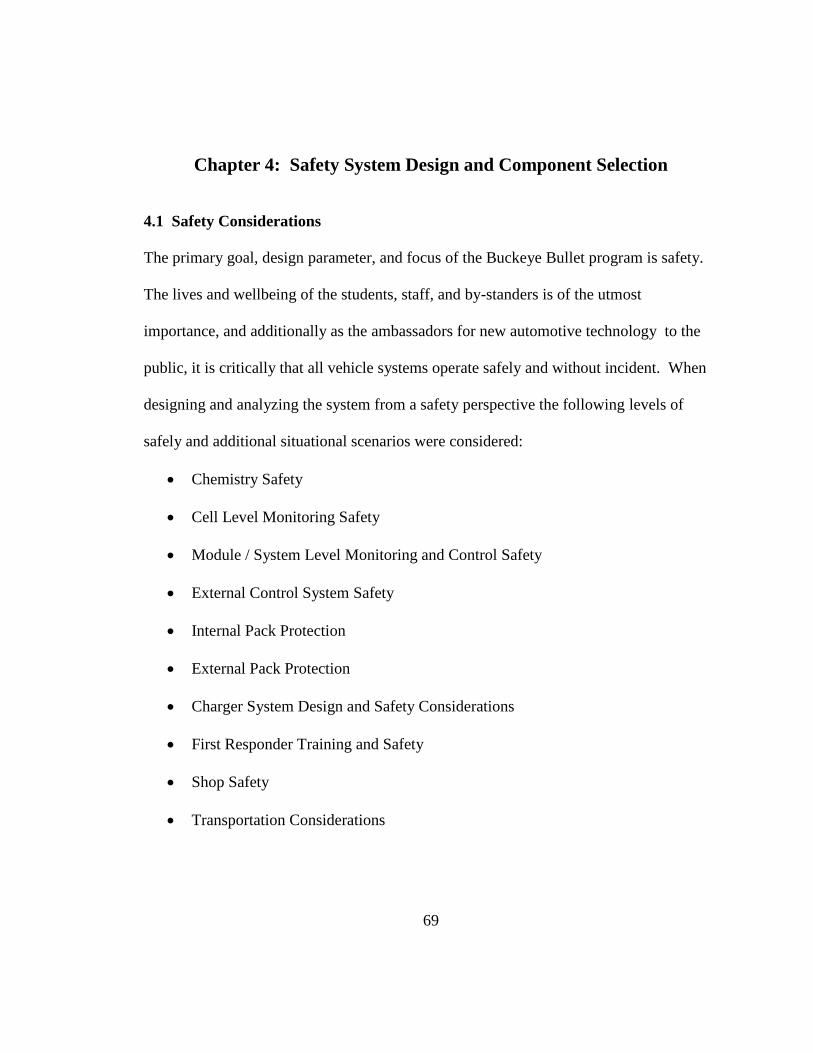
3.5 Proposed Pack Specifications
With the information reported in the sections above the battery system architecture and
thermal strategies were determined. The powertrain configuration includes eight
inverters, so the race profile testing described was based around the matching one battery
pack to each inverter. The each pack was set up as a 250S - 1P systems with eight packs
in the vehicle. This architecture is summarized in Figure 40.
Figure 40: Proposed Battery System Architecture
As described above it was determined that the cooling requirements of the system order
to perform two runs within a one hour period were minimal. As such it was determined

68
to forgo an active cooling system, and simply leave provisions in the mechanical
packaging for airflow around the modules. It was proposed that a simple solution to
provide a large quantity of cold air for forced induction would be to utilize a refrigeration
unit from a semi truck refrigerated trailer or "refer unit" as shown in Figure 41. This
system is completely self contained, operates at temperatures as low as -20 C which align
with the battery capabilities, offers an appropriate flow rate, and can easily be powered
with the on board diesel generator at the most remote locations including the salt flats.
Figure 41: Proposed Cooling Prime Mover
69
Chapter 4: Safety System Design and Component Selection
4.1 Safety Considerations
The primary goal, design parameter, and focus of the Buckeye Bullet program is safety.
The lives and wellbeing of the students, staff, and by-standers is of the utmost
importance, and additionally as the ambassadors for new automotive technology to the
public, it is critically that all vehicle systems operate safely and without incident. When
designing and analyzing the system from a safety perspective the following levels of
safely and additional situational scenarios were considered:
Chemistry Safety
Cell Level Monitoring Safety
Module / System Level Monitoring and Control Safety
External Control System Safety
Internal Pack Protection
External Pack Protection
Charger System Design and Safety Considerations
First Responder Training and Safety
Shop Safety
Transportation Considerations
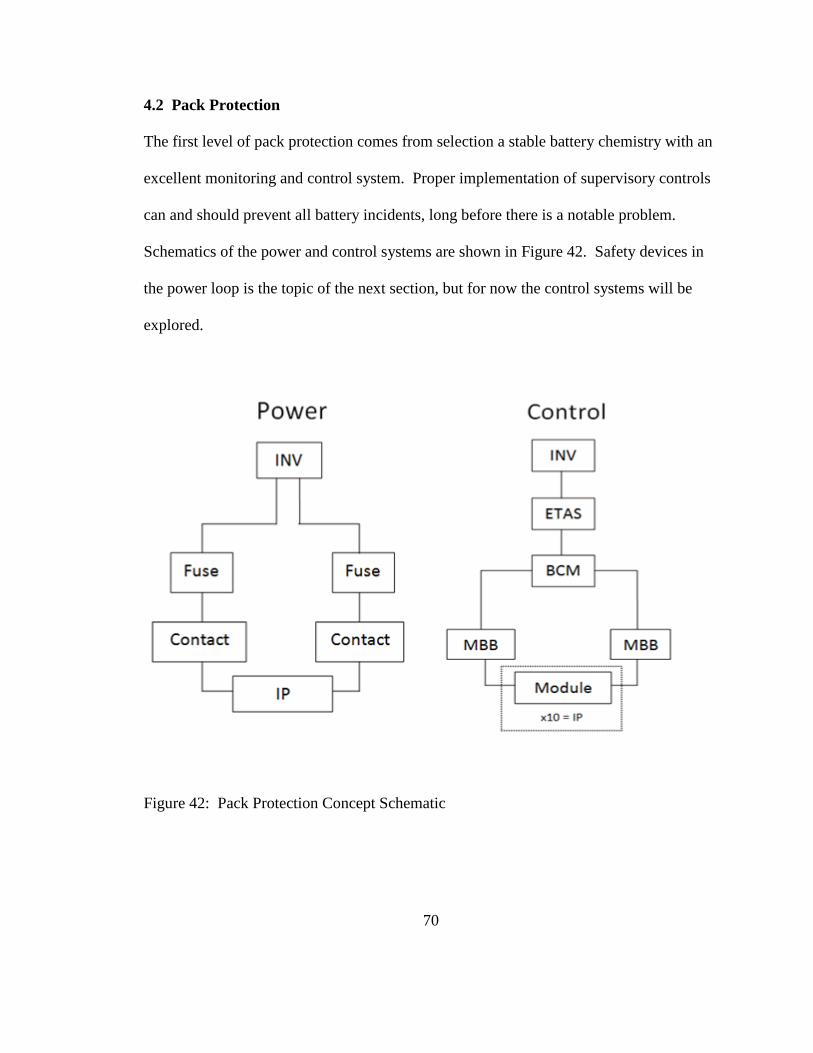
70
4.2 Pack Protection
The first level of pack protection comes from selection a stable battery chemistry with an
excellent monitoring and control system. Proper implementation of supervisory controls
can and should prevent all battery incidents, long before there is a notable problem.
Schematics of the power and control systems are shown in Figure 42. Safety devices in
the power loop is the topic of the next section, but for now the control systems will be
explored.
Figure 42: Pack Protection Concept Schematic

71
4.2.1 Safety At The Cell Level
The first level of pack protection comes from the inherent safety of the battery chemistry.
Aside from the excellent power and thermal characterizes one of the driving forces
behind selection the A123 systems battery was the safety and stability of their iron nano-
phosphate chemistry. When compared to the common metal-oxide lithium battery
variants, iron-phosphate batteries are extremely safe. The primary reason for this is that
the reaction that takes place in metal-oxide batteries requires the presence of an excess of
lithium ions. Under normal operation this is not a problem, but in the event of
overcharging too much lithium can propagate to the anode and actually cause a build-up
of unstable lithium metal, a phenomenon known as lithium plating. When lithium plating
occurs the metal itself begins to burn and leads to nearly uncontrollable thermal
runaways. With iron-phosphate chemistry there is no excess lithium so this simply
cannot happen. The cells can be forced over temperature an vent their electrolyte, but the
can never reach the thermal runaway state that are seen as a result of lithium plating. The
simultaneously amazing and scary aspect of the thermal run away characteristics is how
quickly they can happen. Figure 43 shows the rate of change in temperature as different
cell chemistries are heated. Without zooming in the A123 chemistry appears to be a
complete flat line at zero degrees. In fact when the A123 cells reach failure from
overcharging they spike at a rate of 20 degrees C per minute, a very controllable
condition. Metal oxide batteries on the other hand can spike at rates of more than 1800 C
per minute under thermal runaway conditions. The buffer of safety in chemistry adds a
great deal of comfort to the BB3 battery system.

72
Figure 43: Thermal Runaway Characteristics of Li-Ion Batteries (Courtesy of A123 Systems)
4.2.2 Battery Control System Safety
The next level of system protection is the various control systems on board the battery
pack and the race vehicle. The battery pack itself as a complete battery management
system. This system is made up of several pieces of hardware that perform specific
functions to ensure the safety of operation of the pack. The overall system is referred to
as the battery management system or BMS. The first component of the BMS is the MBB
or module balancing board. This board measure the voltage at every series connection
and the temperature of each module. The data is reported over a CAN network to the
battery control module or BCM. The BCM interprets the data from all of the modules
and takes corrective action when a problem is detected. The BCM overseas the electrical
control devices found in the EDM or electrical distribution module. This includes the

73
contactors that open and close to control the ability of the pack to output power and the
pre-charge circuit. Contactors will be covered further in the next section. The pre-charge
circuit allows the battery pack to first be exposed to a high resistance limiting the current
draw to ensure there are no ground faults downstream of the pack. If the correct
operating conditions are met then the pre-charge circuit is bypassed and full pack current
is allowed to flow. The final BMS module is the current sensing module or CSM. The
CSM measures the pack output current and reports it back to the BCM. This allows the
BCM to calculate expected operating parameters based on the amount of power being
produced. The BMS is an incredibly well designed and reliable system, but there are a
few potential failure methods. Most are non catastrophic and would simple lead to an
unwanted system shutdown. The one really catastrophic failure that can occur is if the
system attempts to shut down and open the contactors but due to high current the
contactors weld shut keeping power flowing. The battery module including the MBB
boards and connection is shown in Figure 44.
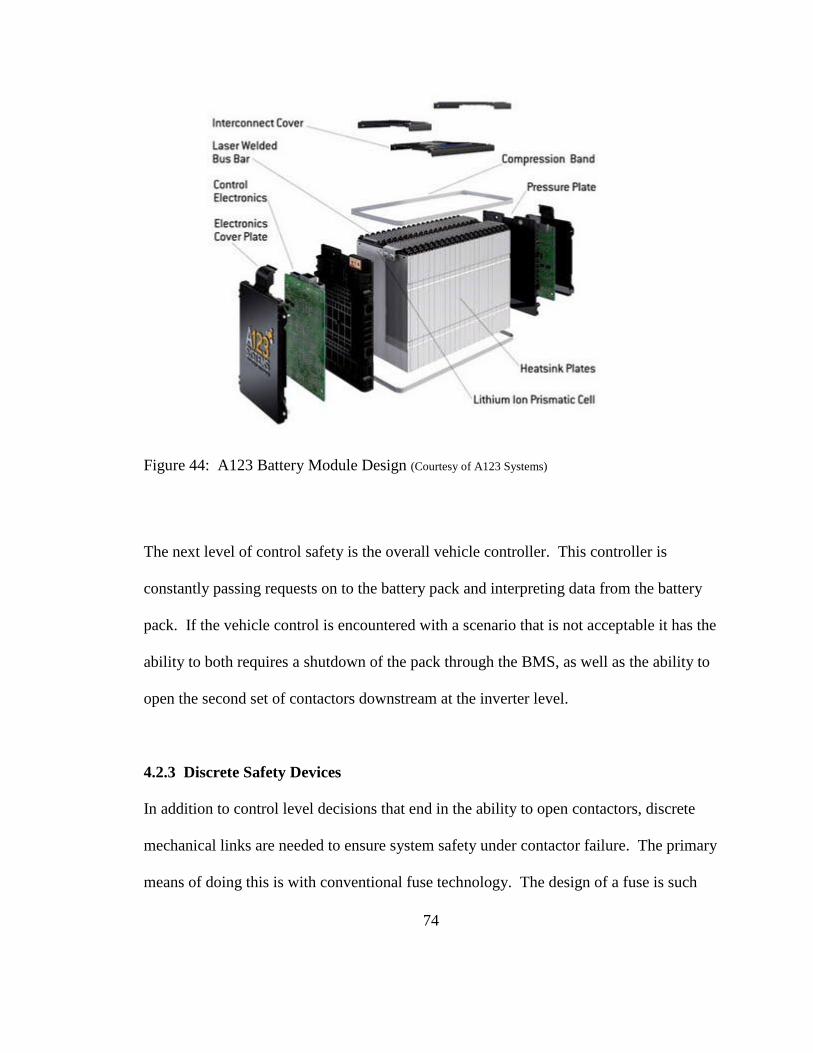
74
Figure 44: A123 Battery Module Design (Courtesy of A123 Systems)
The next level of control safety is the overall vehicle controller. This controller is
constantly passing requests on to the battery pack and interpreting data from the battery
pack. If the vehicle control is encountered with a scenario that is not acceptable it has the
ability to both requires a shutdown of the pack through the BMS, as well as the ability to
open the second set of contactors downstream at the inverter level.
4.2.3 Discrete Safety Devices
In addition to control level decisions that end in the ability to open contactors, discrete
mechanical links are needed to ensure system safety under contactor failure. The primary
means of doing this is with conventional fuse technology. The design of a fuse is such

75
that a calibrated wire is packaged in a sand casing. The wire is designed to break from
thermal failure corresponding to a particular current/time relationship. While under
normal conditions a BB3 battery pack will only draw a maximum of about 400 amps, the
extremely low internal resistance of the batteries leads to the potential of more than 5000
amps of current draw under shot circuit conditions. The battery fuse and contactor
schematic is shown in Figure 45.
Figure 45: Pack Protection Schematic
4.2.4 Manual Service Disconnect
The manual service disconnect is a device that allows the high voltage loop to be
mechanically divided. The allows the packs and thus the vehicles to be mechanically
disabled ensuring that the vehicle cannot be operated and no electrical power can leave
the batteries. This mode is ideal for service, transportation, and trade show type events.
4.3 Component Testing and Specifications
While it is true that every electrical device from fuses to contractors, to wiring comes
with a specification sheet, it is not universally true that the specified ratings are

76
appropriate for every application. The NEMA type ratings supplied are for continuous
operation in industrial and commercial settings. If the BB3 electrical components were
sized for the industrial ratings, there would be more weigh and volume consumed by
power wiring than there is in the entire electrical driveline. It is of critical important to
test each of the system components under racing conditions and establish 2 minute duty
cycle ratings to define the appropriate devices. The following sections describe the
testing and selection of fuses, wiring, contactors, and connectors.
4.3.1 Fuse Selection
Fuses are arguably the most difficult device to specify in the BB3 application. There are
two considerations when selection a fuse. First is should not fail under normal operating
conditions and second it should fail at a reasonable threshold. A fuse could be sized to
never fail under normal operation, but in effect also never fail at elevated problematic
current levels. In contrast an undersized fuse could fail during normal operation ruining a
record attempt. The fuse manufactures supply very detail performance that specify the
current vs time to fail for each fuse model. If these curves were complete this would be
very useful data, but in reality the BB3 operating conditions always fall in the
"imaginary" linearly extrapolated region such as is sown by the green trace in Figure 46.

77
Figure 46: Fuse Usage Specification Chart
Another proposed problem that affects fuse performance is the claim of fuse fatigue. The
idea is that fuses perform differently after many operational cycles. At the current time
the team lacks the hardware to test the fuses for fast acting high current failure, but
possible testing locations to complete this study are currently being investigated.
However the other two parameters, resistance to failure under normal operation and
fatigue studies could be investigated. The proposal is to use the smallest fuse possible
that does not fail under the duty cycle of BB3 racing. The testing involved connecting

78
the fuse a large battery pack cycler and performing similar racing profiles. The
experimental set-up is shown in Figure 47.
Figure 47: Fuse Testing Experimental Set-Up
Two fuses were tested. The first was simply operated at the continuous racing current
until failure. This fuse accepted fully vehicle current for more than 33 minutes before
failing, far exceeding the two minute needed run time. The second fuse was run through
30 race cycles, allowed to cool, and then run until failure. This fuse failed after 25
minutes, leading to the conclusion that there are some effects of fatigue present in high
current cycles. Pending high power fast blow testing, the Cooper Bussmann 170M3697
fuse was deemed to be appropriate for use in the BB3. Thermal images from the testing
can be seen in Figure 48.

79
Figure 48: Fuse Testing Thermal Images
4.3.2 Wire Selection
In a similar manor to the fuse testing, various wire sizes were studied to pick the
optimum combination of performance and weight for use in the BB3. Measures of
temperature increase and resistive losses were considered for this study. Thermal images
from the testing can be seen in Figure 49 and the test results can be seen in Table 4.

80
Figure 49: Wire Testing Thermal Images
Table 4: Wire Testing Results
Wire Size Conductor Area Current Density Losses Temperature
[AWG] [mm^2] [Amps/mm^2] [mV/ft] [C]
2 33.6 33.6 76-89 27-58
2/0 67.4 7.2 42-46 25-38
4/0 107 4.5 28-30 31-36
As expected the largest wire, 4/0, had the best overall performance, but is the largest,
heaviest, and most difficult to route in the vehicle. The smallest wire, 2 Gage, showed
significant heating and losses and was deemed unworthy. The middle wire size, 2/0
showed reasonable performance while greatly improving on the size, weight, and routing
abilities of the larger wire. 2/0 wire was selected as the primary power wire for all pack
level electrical wiring.
4.3.3 Contactor Selection
Contactors, unlike the other electrical devices investigated, do relay fairly heavily on
their operating specifications. The two specifications of great important are the voltage
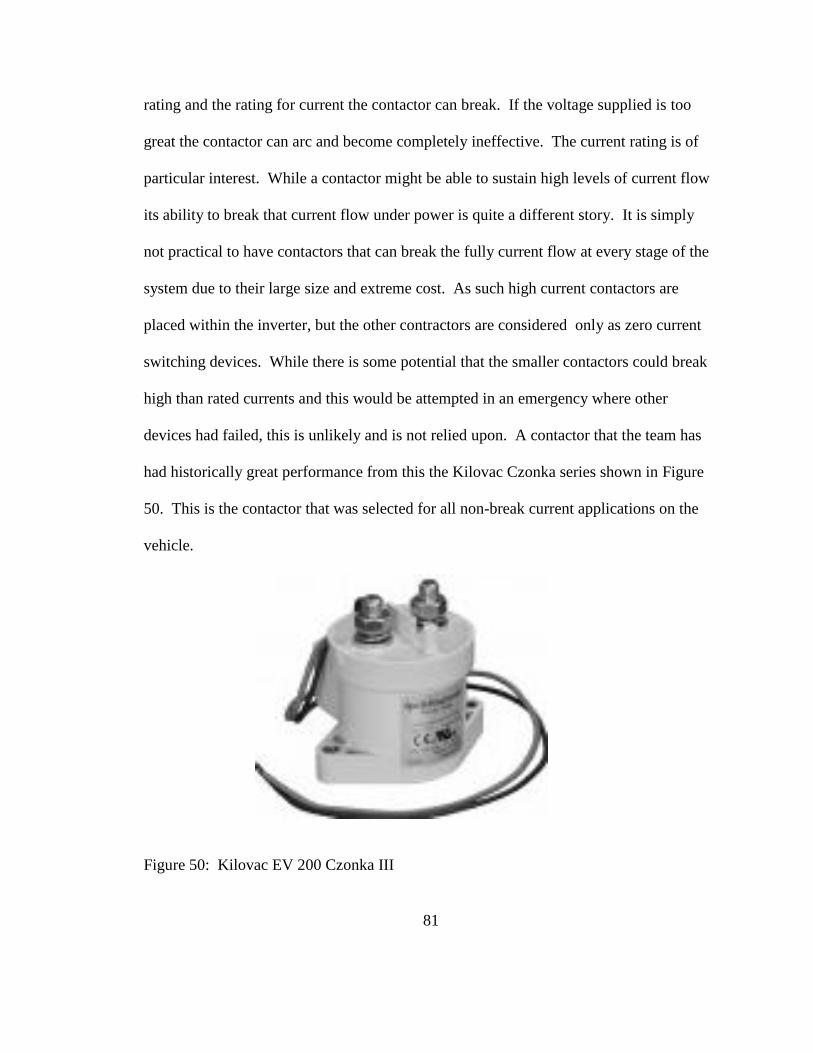
81
rating and the rating for current the contactor can break. If the voltage supplied is too
great the contactor can arc and become completely ineffective. The current rating is of
particular interest. While a contactor might be able to sustain high levels of current flow
its ability to break that current flow under power is quite a different story. It is simply
not practical to have contactors that can break the fully current flow at every stage of the
system due to their large size and extreme cost. As such high current contactors are
placed within the inverter, but the other contractors are considered only as zero current
switching devices. While there is some potential that the smaller contactors could break
high than rated currents and this would be attempted in an emergency where other
devices had failed, this is unlikely and is not relied upon. A contactor that the team has
had historically great performance from this the Kilovac Czonka series shown in Figure
50. This is the contactor that was selected for all non-break current applications on the
vehicle.
Figure 50: Kilovac EV 200 Czonka III
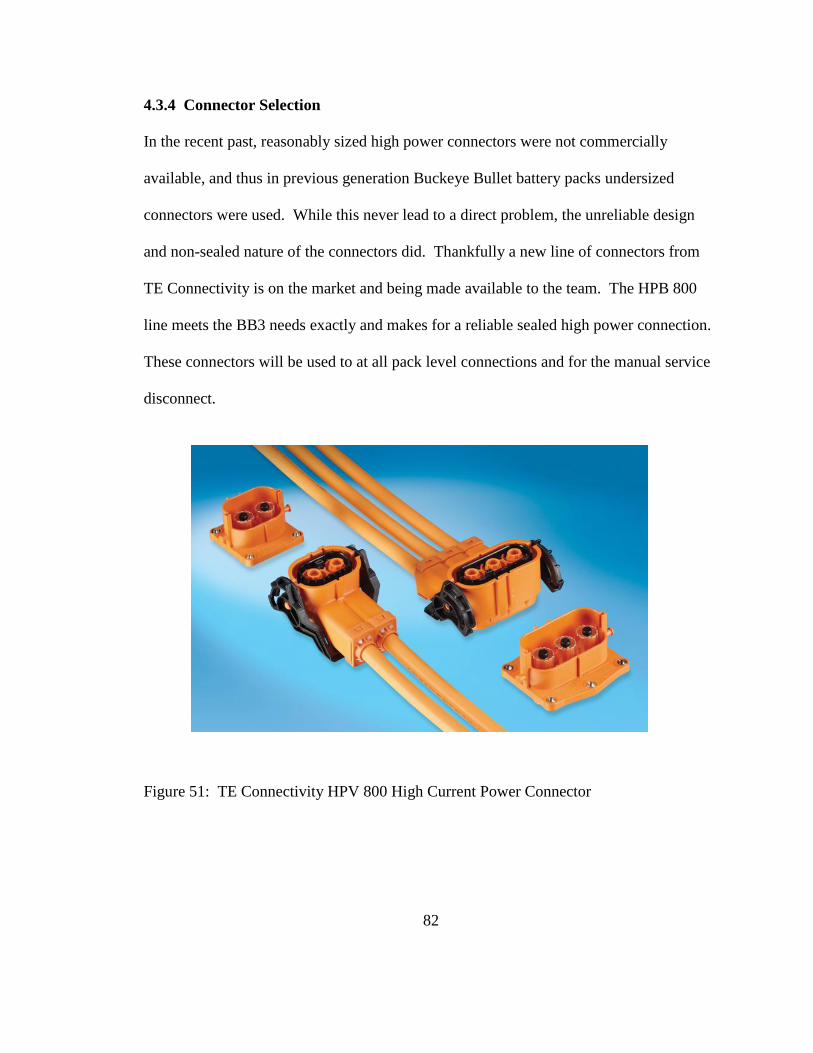
82
4.3.4 Connector Selection
In the recent past, reasonably sized high power connectors were not commercially
available, and thus in previous generation Buckeye Bullet battery packs undersized
connectors were used. While this never lead to a direct problem, the unreliable design
and non-sealed nature of the connectors did. Thankfully a new line of connectors from
TE Connectivity is on the market and being made available to the team. The HPB 800
line meets the BB3 needs exactly and makes for a reliable sealed high power connection.
These connectors will be used to at all pack level connections and for the manual service
disconnect.
Figure 51: TE Connectivity HPV 800 High Current Power Connector
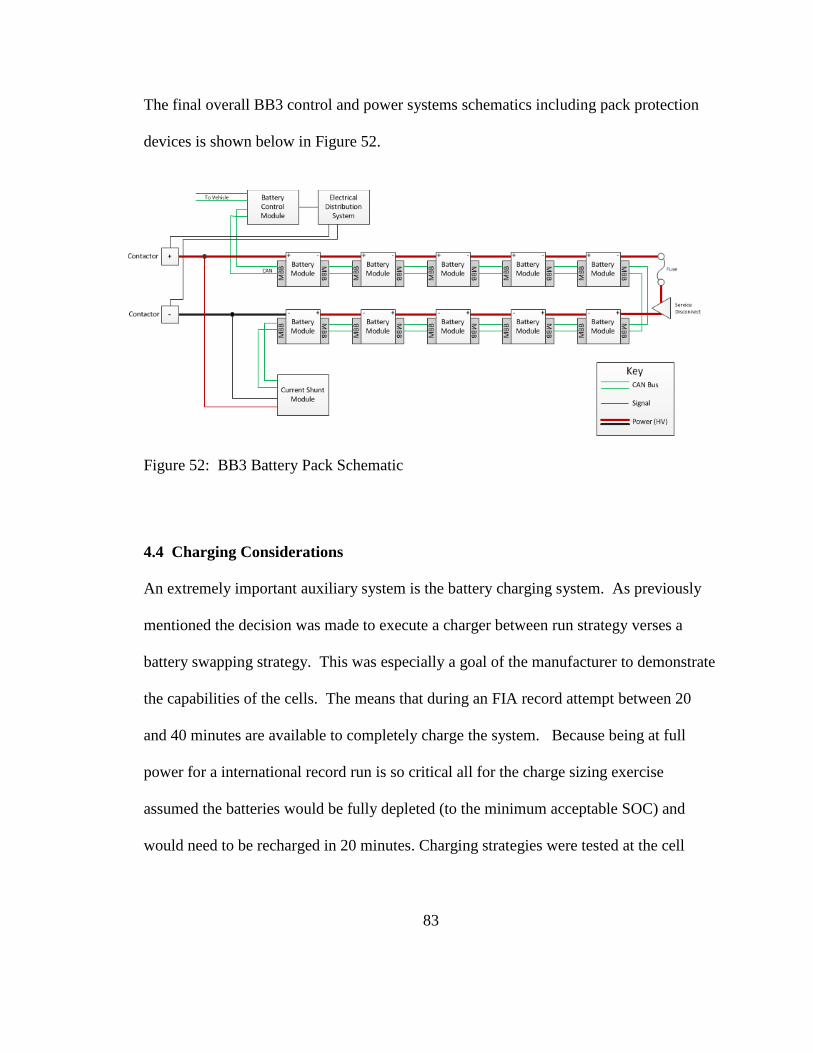
83
The final overall BB3 control and power systems schematics including pack protection
devices is shown below in Figure 52.
Figure 52: BB3 Battery Pack Schematic
4.4 Charging Considerations
An extremely important auxiliary system is the battery charging system. As previously
mentioned the decision was made to execute a charger between run strategy verses a
battery swapping strategy. This was especially a goal of the manufacturer to demonstrate
the capabilities of the cells. The means that during an FIA record attempt between 20
and 40 minutes are available to completely charge the system. Because being at full
power for a international record run is so critical all for the charge sizing exercise
assumed the batteries would be fully depleted (to the minimum acceptable SOC) and
would need to be recharged in 20 minutes. Charging strategies were tested at the cell

84
level to verify sizing calculation. The proposed current SOC profiles are shown in Figure
53 Figure 54 respectively.
Figure 53: Battery Charging Current Profile
Figure 54: Battery Charging Rate

85
Assuming that 60 amp hours will be consumed during the run, approximately 180 kW of
charging power is needed. After a long search for companies capable of supplying the
needed equipment on a few solutions were found. In the end it was decided that three
75kW programmable DC power supplies would best fit the specifications. Because of
the need for operation in harsh conditions of the salt flats including high levels of salt,
water, wind, and heat, completely sealed water cooled models were selected. This use of
3 charges to simultaneously charge 8 battery packs will require some interesting
connections and power balancing schemes that are still being developed. Also in
development is the computer controlled optimized charging cycle. The selected
hardware is shown in Figure 55 below.
Figure 55: Battery Charger Hardware

86
Once it was realized that due to national record rules the team need to be able to fully
service the vehicle, including battery charging, away from the pits; an entirely new
design project was presented in the form of a charging and service trailer. Since there is
no "grid" water source on the salt flats a closed loop water chiller system to cool the
chargers was needed. This system could also potentially cool vehicle motors and
inverters during the turnaround period. The large and heavy refrigerant system specified
to cool the battery cooling air was also included in the scope of the support trailer.
Finally the trailer needed to contain some form of vehicle lift system so the tires,
suspension, and body could be removed for complete vehicle inspection and service.
This system is still in the design phase. With each of the chargers taking up a significant
footprint and weighing in at nearly 1000 lbs as well as the water cooling system and tool
boxes also hitting the 1000 pound mark as well it became clear that this is no small
support trailer. Additionally a ~300 kVA gen-set to power the trailer with 480 V 3 phase
power will also have to be hauled by a separate truck to the service site. A summary of
the necessary equipment is shown in Figure 56.
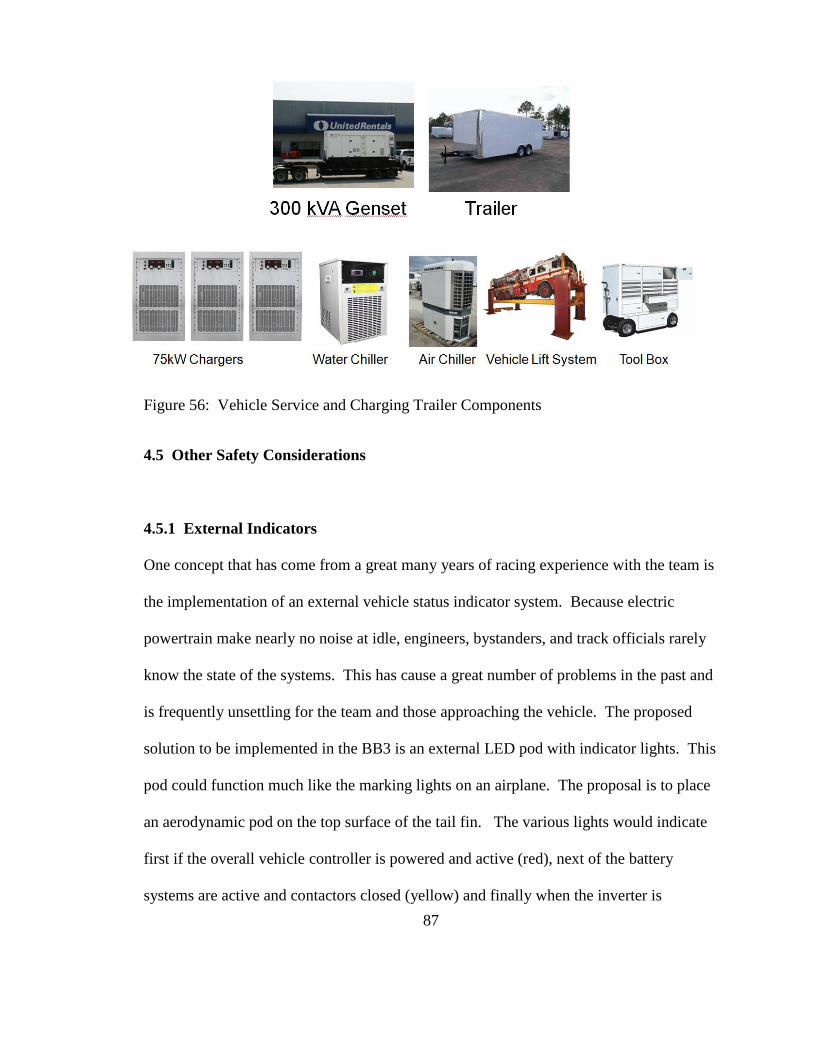
87
Figure 56: Vehicle Service and Charging Trailer Components
4.5 Other Safety Considerations
4.5.1 External Indicators
One concept that has come from a great many years of racing experience with the team is
the implementation of an external vehicle status indicator system. Because electric
powertrain make nearly no noise at idle, engineers, bystanders, and track officials rarely
know the state of the systems. This has cause a great number of problems in the past and
is frequently unsettling for the team and those approaching the vehicle. The proposed
solution to be implemented in the BB3 is an external LED pod with indicator lights. This
pod could function much like the marking lights on an airplane. The proposal is to place
an aerodynamic pod on the top surface of the tail fin. The various lights would indicate
first if the overall vehicle controller is powered and active (red), next of the battery
systems are active and contactors closed (yellow) and finally when the inverter is

88
activated and contactors closed (green). The color scheme like a stop light indicates the
vehicle's readiness to accelerate from a stop. A final set of lights would be very bright
strobe lights which would be used to indicated an emergency. The possible triggers for
these lights are currently under heavy investigation. Fatal error signals from any of the
vehicle or battery controllers could trip emergency lights. The team is also investigating
ground fault detection methods which could indicate a connection between the high
voltage system and the vehicle chassis. Also included in this pod can be from and rear
facing cameras. In addition to providing entertaining videos of the run, these cameras
actually become a very important part of the data acquisition system as they are one of
the few ways to monitor parachute performance and capture events as the unfold during
the course of the run. A concept of the pod system layout is shown in Figure 57 below.
Figure 57: External Safety Indicator Layout Proposal
89
4.5.2 First Responder Preparedness
In the case of emergency first responders need to be informed quickly and effectively of
the contents and protocols of dealing with a high power electric vehicle. In the context of
racing this means preparing the onsite emergency teams at the track PRIOR to the racing
event of the operation and specifications of the vehicle. Ideally this includes giving the
teams an overview of the vehicle and allowing them to ask questions. The system
proposed in the section above is a solution to give first responders a preparing of
conditions that might be occurring. While they will probably not trust that no lights
means the car is safe, a bright flashing light will indicate that there is a known problem
and they should proceed with extreme caution. In the context of the workshop first
responders to incidents need to be informed of the contents of the building and the
location of specialized equipment needed for dealing with battery incidents. This
equipment should be readily available and well marked.
4.5.3 Shop Safety
While it is not the focus of this document it should be noted that working with high
voltage high power battery systems brings a number of needed safety protocols in the
workshop. The team is currently in to process of performing a facility safety assessment.
High power batteries in large quantities are not something a typical race shop is use to
working around, and this brings concerns especially in an academic, mixed discipline
shop. Many by-standers and students working on other programs have no idea what
these devices are capability and do not know how to respect them. Proper labeling,
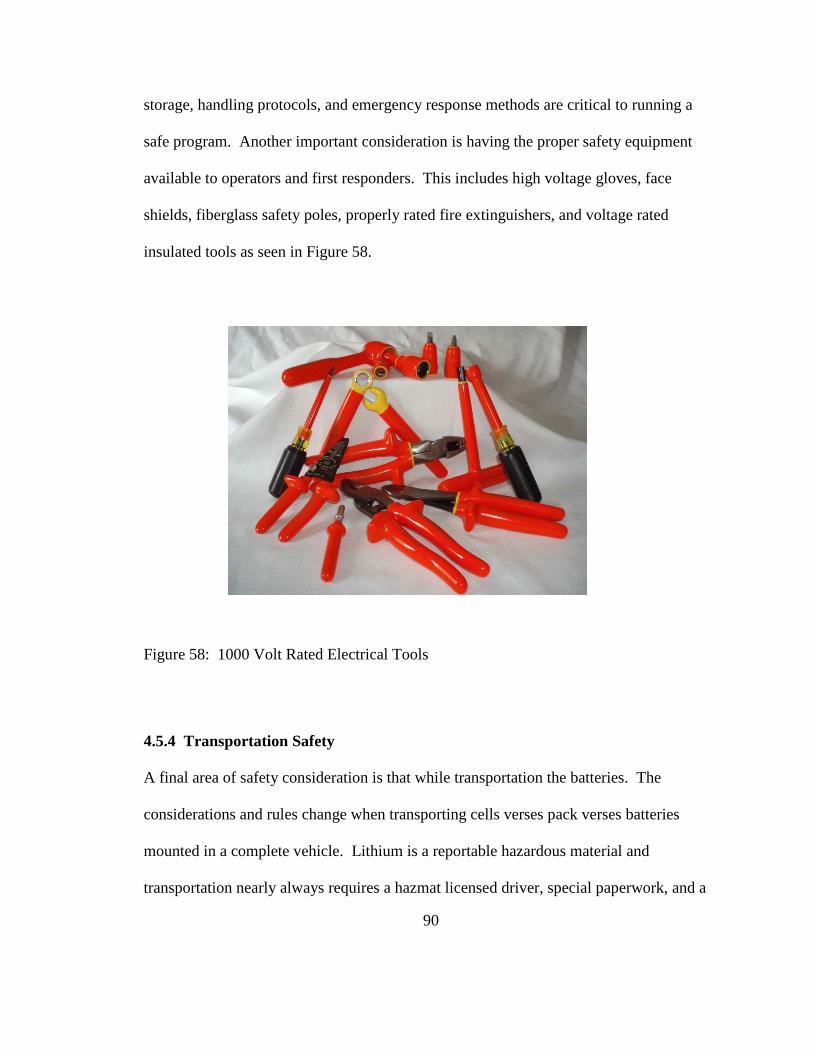
90
storage, handling protocols, and emergency response methods are critical to running a
safe program. Another important consideration is having the proper safety equipment
available to operators and first responders. This includes high voltage gloves, face
shields, fiberglass safety poles, properly rated fire extinguishers, and voltage rated
insulated tools as seen in Figure 58.
Figure 58: 1000 Volt Rated Electrical Tools
4.5.4 Transportation Safety
A final area of safety consideration is that while transportation the batteries. The
considerations and rules change when transporting cells verses pack verses batteries
mounted in a complete vehicle. Lithium is a reportable hazardous material and
transportation nearly always requires a hazmat licensed driver, special paperwork, and a
91
plagued equipped vehicle. There are two exceptions to these requirements. The first
way avoid these complications is to transport less than 1001 pounds of batteries at a time.
This weight requirement includes the batteries and the packaging they are in. While
lithium batteries transported in small quantities still need to be in the proper packaging
and well marked the transportation rules are much more friendly. The other way to avoid
these complications and the preferred method of the Bullet team is to mound the vehicle
in the race car. Batteries permanently mounted in a vehicle are considered part of the
vehicle system and are allowed to bypass hazardous transportation rules. It is important
for the team to consider these rules the consequences each time the batteries need to be
moved. A violation of such rules can lead to thousands of dollars in fines and even time
in jail. It is preferred that the modules come directly from the factory and only every
leave the race shop as complete packs mounted in the vehicle. In the past the team has
even found a way to mount space modules in the vehicle during transportation to the
racetrack. Regardless of the laws of transportation each time the batteries are out of the
direct control of the system engineers, precautions need to be taking to ensure the
batteries are properly packaged and in a disabled mode. For the BB3 this means
removing the manual safety disconnect and disabling the controller. It is also very
importation to inform any drivers transporting the system of what they are carrying and
what precautions should be taken in case of an accident.

92
Chapter 5: Pack Design
5.1 Packing Design Background
Work in the area of mechanical packaging and system integration into the vehicle began
before the a battery cell was officially selected, and long before sample batteries were
available for testing. A great deal of conceptual models were investigated. As previously
discussed volumetric efficiency and minimizing the weight of the packaging components
are key aspects of the battery packaging design and have a direct effect on overall vehicle
performance. When developing a packing system the following concepts were
considered:
Safety
Efficiency (Mass and Volume)
Cooling Scheme Implemented
Serviceability
Readiness for Harsh Condition Operations (Salt, Wind, and Water at the Flats)
Manufacturability
Handling and Transportation
Rigidity
First consideration is the module mounting strategy. Like any cube the modules have six
sides. The modules have two possible mounting methods retaining bolts oriented
vertically, or horizontally to the module. These two factors lead to 12 possible mounting

93
schemes. Some of those 12 are duplicates of each other, and some would never be used,
i.e. sitting the module on its top covers. In the end the 12 options were reduced to the
two basic mounting schemes shown in Figure 59.
Figure 59: Possible Module Mounting Schemes
With these concepts in mind a great number of possible solutions were investigated. In
fact more than 30 complete design concepts were designed and compared. Concepts
utilizing machined elements, laser cut and bent sheet metal, stamped sheet metal, simple
rail amounting, and composite shelves and tubes were investigated. Samples of this work
can be seen in Figure 60 thought Figure 64.

94
Figure 60: Laser-Cut and Bent Sheet Metal Packaging Design Concept
Figure 61: Multi Element Laser-Cut and Riveted Sheet Metal Packaging Design Concept

95
Figure 62: Stamped Sheet Metal Packaging Design Concept
Figure 63: Simple Rail Mount Packaging Design Concept

96
As discussed in Chapter 3, scaled testing with similar cells and project power and thermal
performance data led the team to utilize an aggressive cooling strategy with onboard
liquid cooling plates. The plan was to have the system on board, but not actively cycle
coolant during a run, but instead to flow off-board water during the record run turn-
around (charging) period. In early 2011, this decision lead the team down a specific
design path and a complete system was designed and proposed. As part of a senior
capstone design project the pack shown in Figure 64 below was developed .
Figure 64: 2011 Battery Pack Proposal
While a great deal of good things came a result of this design, it had three fatal flaws
which led to the need for a new packaging system. The first and main flaw was the
mounting scheme chosen. While the side clamp, compression scheme worked very well
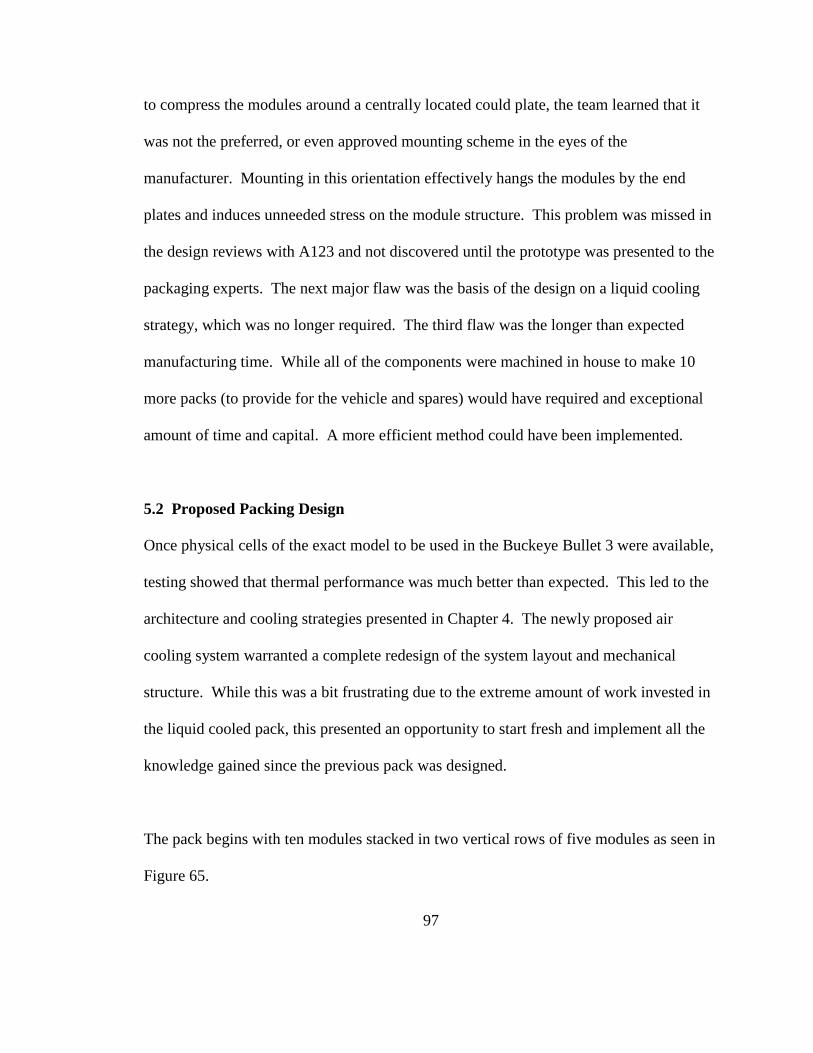
97
to compress the modules around a centrally located could plate, the team learned that it
was not the preferred, or even approved mounting scheme in the eyes of the
manufacturer. Mounting in this orientation effectively hangs the modules by the end
plates and induces unneeded stress on the module structure. This problem was missed in
the design reviews with A123 and not discovered until the prototype was presented to the
packaging experts. The next major flaw was the basis of the design on a liquid cooling
strategy, which was no longer required. The third flaw was the longer than expected
manufacturing time. While all of the components were machined in house to make 10
more packs (to provide for the vehicle and spares) would have required and exceptional
amount of time and capital. A more efficient method could have been implemented.
5.2 Proposed Packing Design
Once physical cells of the exact model to be used in the Buckeye Bullet 3 were available,
testing showed that thermal performance was much better than expected. This led to the
architecture and cooling strategies presented in Chapter 4. The newly proposed air
cooling system warranted a complete redesign of the system layout and mechanical
structure. While this was a bit frustrating due to the extreme amount of work invested in
the liquid cooled pack, this presented an opportunity to start fresh and implement all the
knowledge gained since the previous pack was designed.
The pack begins with ten modules stacked in two vertical rows of five modules as seen in
Figure 65.
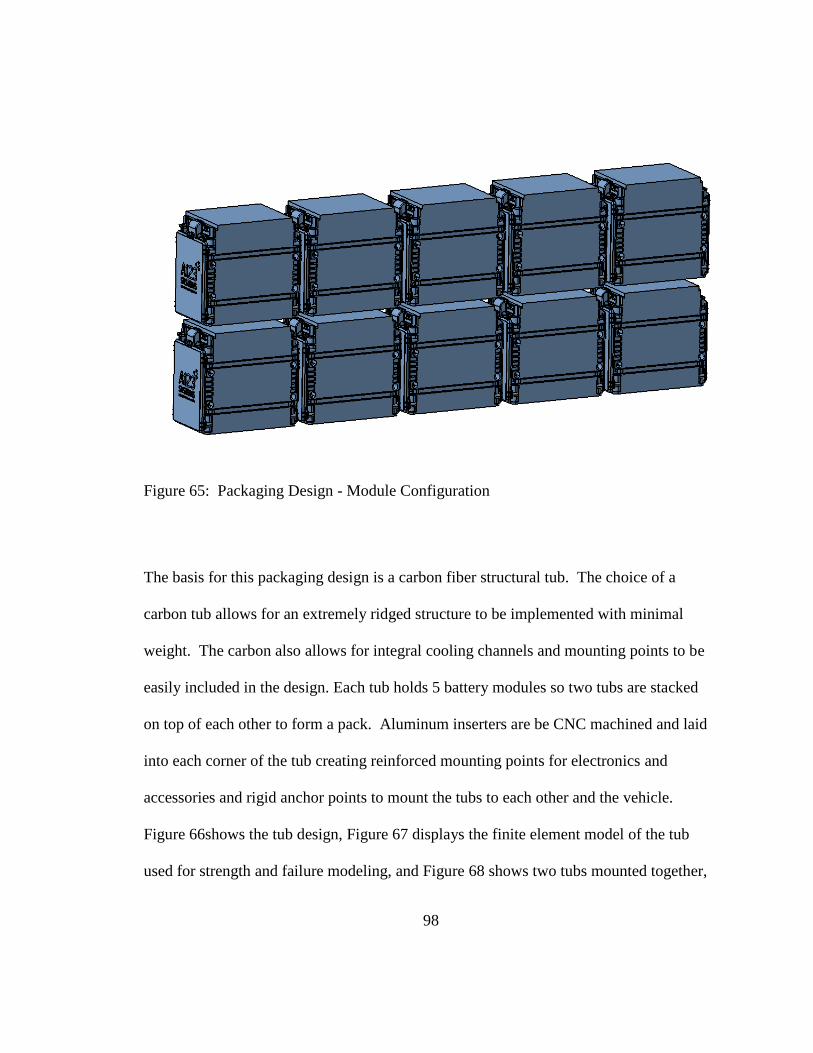
98
Figure 65: Packaging Design - Module Configuration
The basis for this packaging design is a carbon fiber structural tub. The choice of a
carbon tub allows for an extremely ridged structure to be implemented with minimal
weight. The carbon also allows for integral cooling channels and mounting points to be
easily included in the design. Each tub holds 5 battery modules so two tubs are stacked
on top of each other to form a pack. Aluminum inserters are be CNC machined and laid
into each corner of the tub creating reinforced mounting points for electronics and
accessories and rigid anchor points to mount the tubs to each other and the vehicle.
Figure 66shows the tub design, Figure 67 displays the finite element model of the tub
used for strength and failure modeling, and Figure 68 shows two tubs mounted together,

99
the structural inserts, and top view of the tub. In the top view the cover is included which
shows the slots provided to channel air down each side of the modules.
Figure 66: Packaging Design - Carbon Fiber Tub
Figure 67: Packaging Design - Tub Finite Element Analysis

100
Figure 68: Packaging Design - Tub Configuration and Supports
The next consideration was the integration of the electrical control and circuit protection
components. During the BB2.5 battery module build the team learned the importance of
simple and easy access inter-module electrical connections. The previous pack's
connections were very difficult to reach and tedious to install. This made the assembly
process very time consuming and somewhat dangerous. Great care was taking to design
a simple and easy system to integrate. Because the modules are very close to each other
and the power connection are located on a vertical wall, before the module is installed in
the pack an adapter block is bolted to the connection to create a 90 degree adapter for the
connection face. Once all the modules are installed interconnections are made by bolting
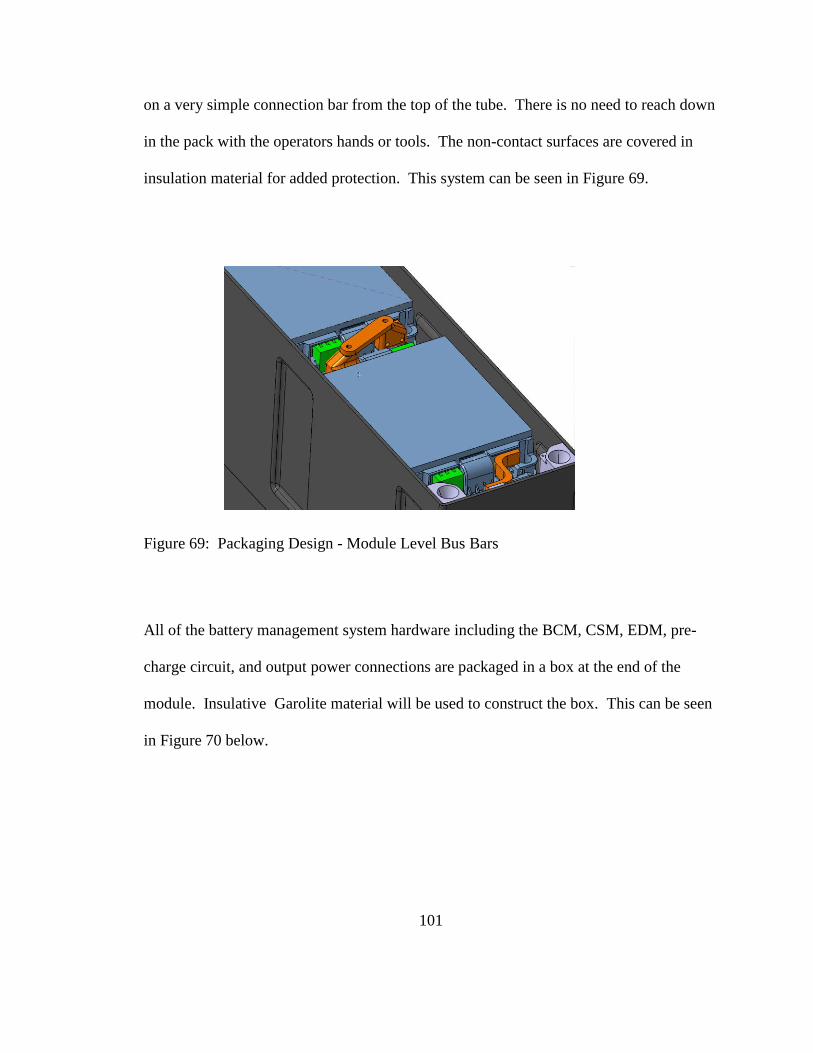
101
on a very simple connection bar from the top of the tube. There is no need to reach down
in the pack with the operators hands or tools. The non-contact surfaces are covered in
insulation material for added protection. This system can be seen in Figure 69.
Figure 69: Packaging Design - Module Level Bus Bars
All of the battery management system hardware including the BCM, CSM, EDM, pre-
charge circuit, and output power connections are packaged in a box at the end of the
module. Insulative Garolite material will be used to construct the box. This can be seen
in Figure 70 below.

102
Figure 70: Packaging Design - Supervisory Electronics
On the opposite side of the pack the manual service disconnect and the fuses are
packaged. The half pack location was chosen for these devices as it when either device is
utilized it brakes the pack voltage in half, leaving two 450 V isolated systems as opposed
to one 900 V system. The fuses are redundant and placed in series so that there is one
fuse with each pack. The allows a fuse to stay with every half pack when the packs are in
an assembly or service setting. If an accident occurs placing a pack in direct short, there
103
will always be a fuse in each string of batteries. The manual service disconnect serves
two purposes. First of all the connectors allow the two tubes that make up each pack to
be electrically disconnected and separated very quickly and without tools. In addition
this connecting cable can act as a manual system disconnect which allows the packs and
thus the vehicles to be mechanically disabled ensuring that the vehicle cannot be operated
and no electrical power can leave the batteries. This mode is ideal for service,
transportation, and trade show type events. This system can be seen in Figure 71 and the
entire electrical system integration can be seen in Figure 72.
Figure 71: Packaging Design - Manual Service Disconnect and Fuses

104
Figure 72: Packaging Design - Complete Electrical System
The entire pack design without the tubes can be seen in Figure 73 and the complete pack
can be seen in Figure 74 and Figure 75.
Figure 73: Packaging Design - Complete Pack Without Tubs
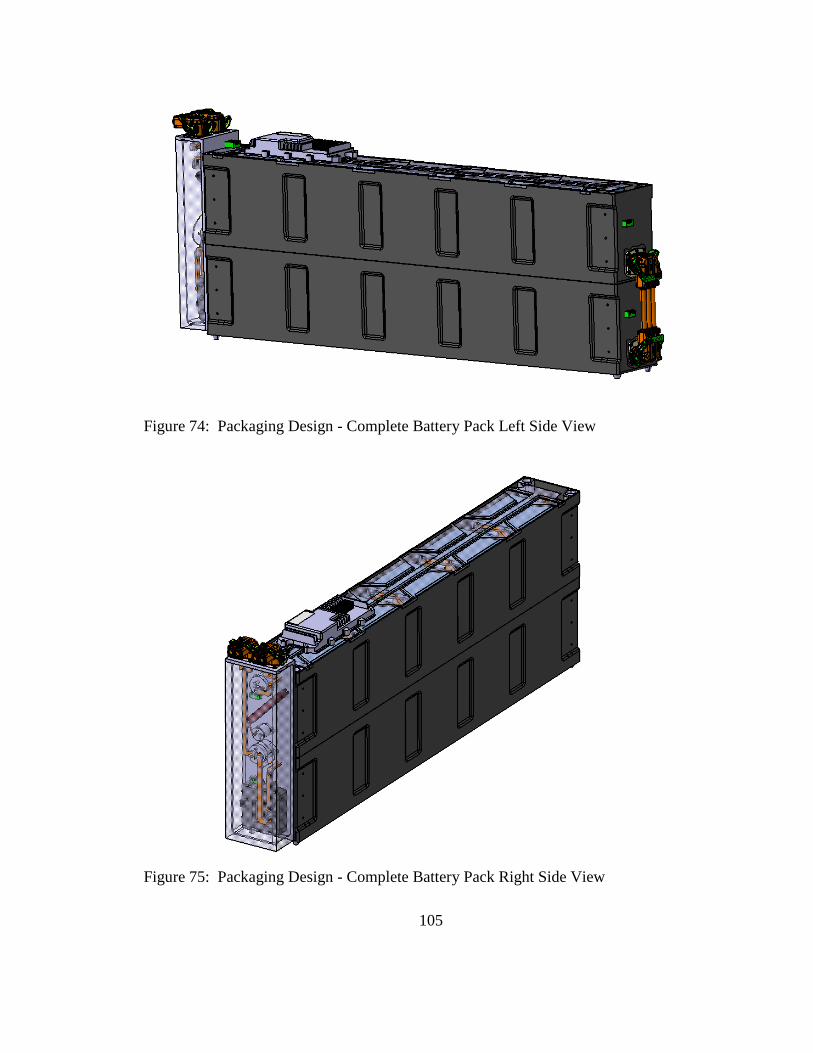
105
Figure 74: Packaging Design - Complete Battery Pack Left Side View
Figure 75: Packaging Design - Complete Battery Pack Right Side View
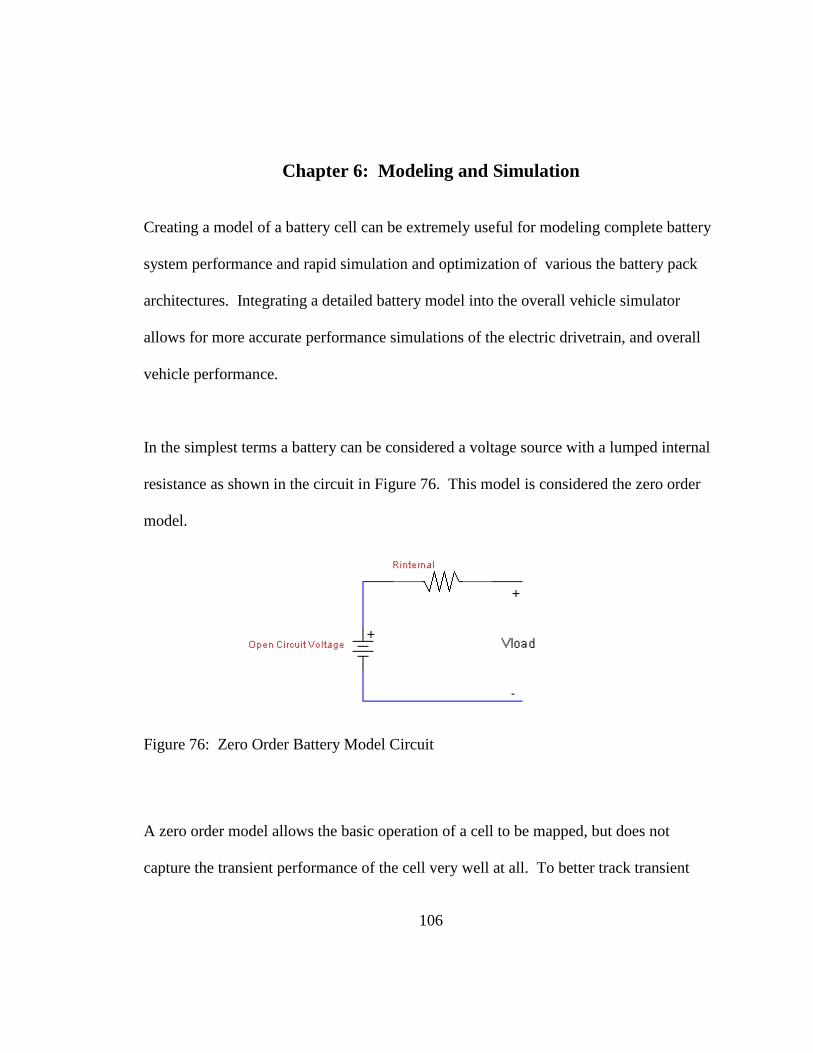
106
Chapter 6: Modeling and Simulation
Creating a model of a battery cell can be extremely useful for modeling complete battery
system performance and rapid simulation and optimization of various the battery pack
architectures. Integrating a detailed battery model into the overall vehicle simulator
allows for more accurate performance simulations of the electric drivetrain, and overall
vehicle performance.
In the simplest terms a battery can be considered a voltage source with a lumped internal
resistance as shown in the circuit in Figure 76. This model is considered the zero order
model.
Figure 76: Zero Order Battery Model Circuit
A zero order model allows the basic operation of a cell to be mapped, but does not
capture the transient performance of the cell very well at all. To better track transient

107
performance a higher order model must be implemented. The first order model shown in
Figure 77, known as the Randal model, is a very common and effective modeling
technique. In this model an additional resistive and capacitive element are placed in
parallel and the parallel block is combined in series with the first order model. If
extremely accurate tracking of transient response is required, even higher order models
can be used, but they are not necessary for the scope of this project.
Figure 77: First Order Battery Model Circuit
Once a modeling scheme is chosen the next task is to obtain coefficients for the
resistances and capacitances present in the model circuit. This task is accomplished using
the standardized HPPC tests presented in Chapter 3. From these experimental
procedures, calculations to obtain the coefficients are also defined in the Freedom Car
Manuel which specifies the HPPC testing procedures.

108
The general schematic of the model layout is shown in Figure 78 below. State of charge
and current temperature are continuously calculated. Base on current request as an input,
and the estimated SOC and cell temperature, a voltage under load is calculated and
output.
Figure 78: Battery Model Schematic
The next step towards creating a model is developing the necessary equations. These
equations are presented in Equation 3 through Equation 7 below.
Equation 3: State of Charge Calculation for Battery Model
Equation 4: Temperature Calculation for Battery Model
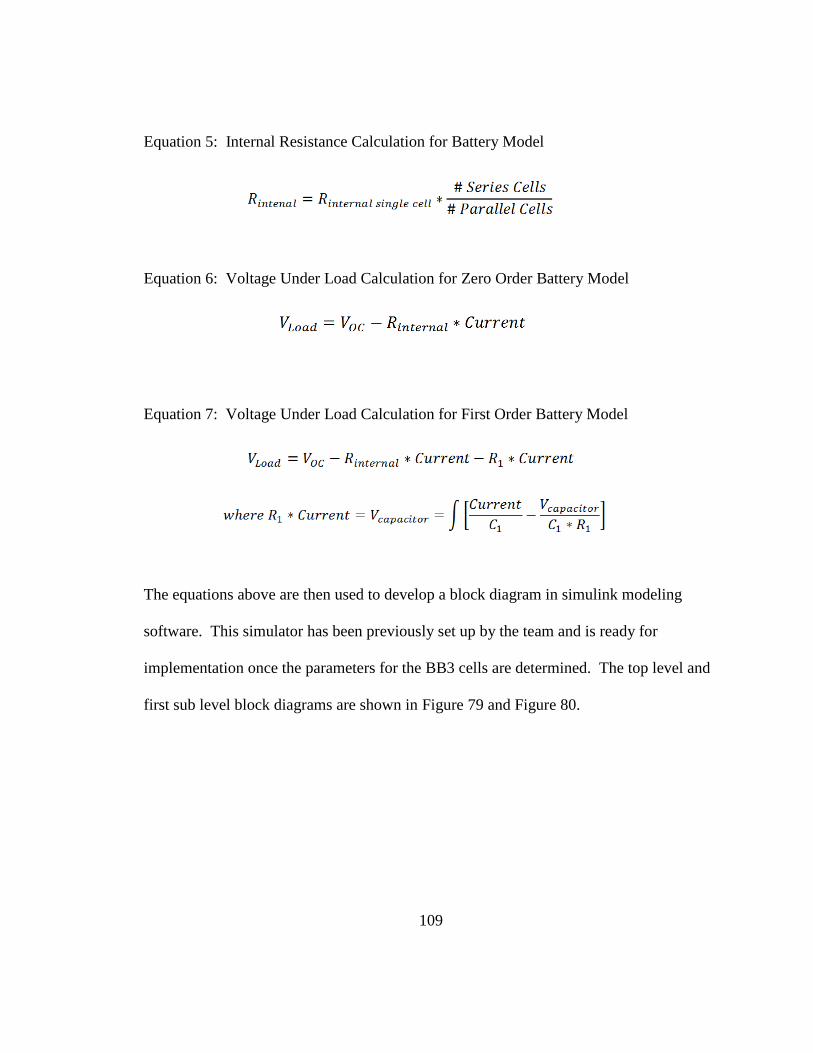
109
Equation 5: Internal Resistance Calculation for Battery Model
Equation 6: Voltage Under Load Calculation for Zero Order Battery Model
Equation 7: Voltage Under Load Calculation for First Order Battery Model
The equations above are then used to develop a block diagram in simulink modeling
software. This simulator has been previously set up by the team and is ready for
implementation once the parameters for the BB3 cells are determined. The top level and
first sub level block diagrams are shown in Figure 79 and Figure 80.
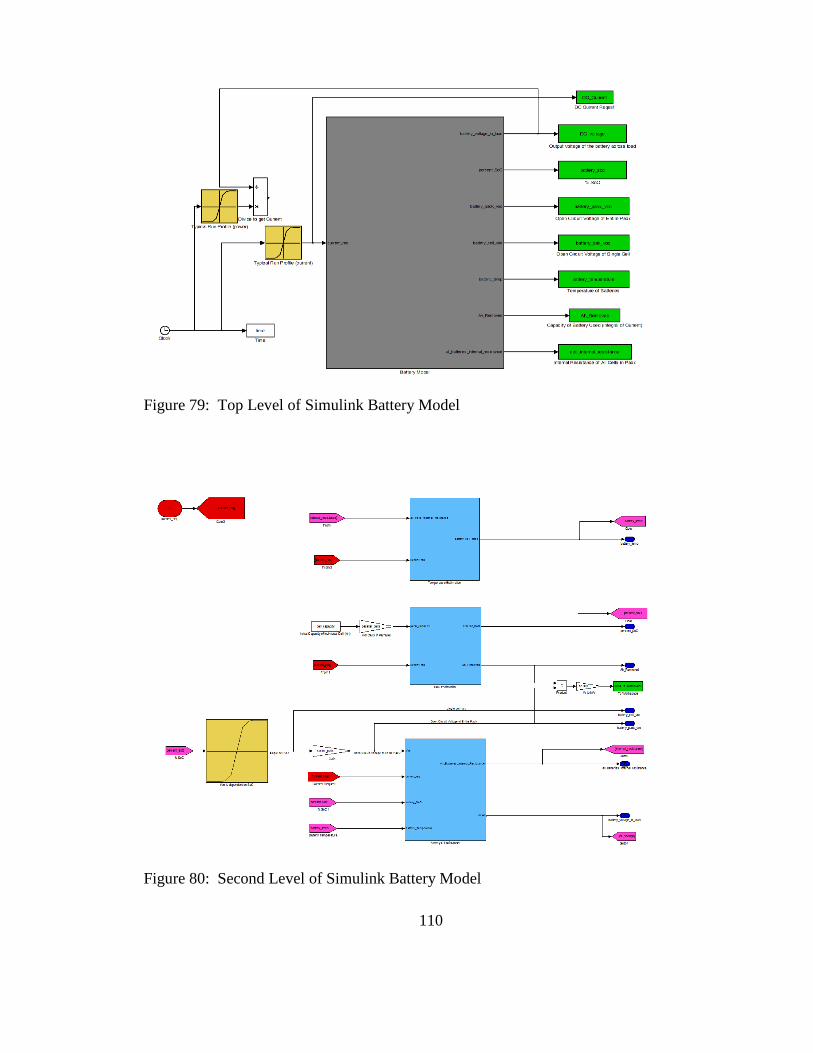
110
Figure 79: Top Level of Simulink Battery Model
Figure 80: Second Level of Simulink Battery Model

111
Some baseline testing was done to prove the validity and implementation of the model.
Parameters for a zero order model were developed and the data form simulation was
plotted with the experimental test data. As seen in Figure 81 the basic operating points
showed reasonable coloration, but the transient response to varying inputs did not
correlate well as all. In the first a first order model as described above will be
implemented to better match the experimental conditions.
Figure 81: Simulated vs. Experimental Battery Voltage with Zero Order Model

112
Chapter 7: Future Work
The author will continue on to a masters degree in mechanical engineering and continue
to developed the work presented in this thesis. The first step will be to build a complete
prototype of the battery pack described in chapter 5. A physical prototype will allow the
proposed manufacturing and assembly methods to be proven as well as providing an
opportunity to test the entire integrated system. In parallel with the prototyping of the
pack additional thermal testing of the proposed cooling strategy will be investigated.
Fully insulated thermal tests showed that a minimal amount of heat needed to be removed
from the packs between racing runs so the team moved forward with confidence in the
decision that an air cooling system would be sufficient. While the packaging design
includes air flow channels along the side of each module, very little testing has been
completed to investigate the actual heat removal capabilities of forced conduction system,
or to optimize the flow channels design. With a mock up of the system complete, a great
deal of validation and optimization testing can be completed.
The next area of future work involves additional fuse testing. During fuse selection, the
fuses were tested to make sure they would not blow under normal race operation
conditions, and the concept of fuse fatigue was investigated, but the fuses were not tested
for fast acting failure current. It is of interest to know how much current needs to be

113
drawn to cause the fuses to fail at a time of 1 second, 10 seconds, and 60 seconds. This
type of extreme current testing cannot currently be performed at the Center for
Automotive Research, but testing strategies and outside suppliers are currently being
investigated for future testing.
Now that the actual battery cell (correct chemistry and packaging) to be used in the
Buckeye Bullet 3 is available for testing a full set of characterization tests as described in
Chapter 3 will be preformed. The data from additional power and thermal tests will help
to validate the design proposal presented in this document. More importantly the full
characterization utilization HPPC tests across many temperature and states of charge will
allow for the development and implementation of a full battery model, as described in
Chapter 6, into the Buckeye Bullet 3 complete vehicle simulator. The framework for
thermal and power models has been created, but a great deal of testing and validation is
needed to produce a functional and accurate model. The scope of the graduate thesis will
expand to include the interactions between the battery system and the electric traction
powertrain. Optimization of the operating parameters will be investigated to promote
overall vehicle performance. The final steps will be building the battery system and
implementing it into the vehicle, and testing and tuning the system for optimal
performance. Following recommendations presented in this document and continuing to
develop the system as described in this chapter will allow for the greatest opportunity to
safely and efficiently set an electric vehicle world speed record in excess of 400 miles per
hour.
114
References
K. King, B. Schwemmin, and D. Zhu. Full Hybrid Electrical Vehicle Battery Pack
System Design, CFD Simulation and Testing. SAE Paper, 2010-01-1080, 2010.
C. Merkle and L. Kennedy. High Voltage Safety for the Service Technician. SAE Paper,
2010-01-2014, 2010.
K. Miyatake, T. Abe, Y. Hisamitsu, T. Kinoshita, Y. Shimoida, and H. Horie. Research
of Large Capacity, High Power Lithium-ion Batteries. SAE Paper, 2009-01-1389, 2009.
J. Belt. Battery Test Manual For Plug-In Hybrid Electric Vehicles. U.S. Department of
Energy Vehicle Technologies Program, 2008.
D. Doughty and C Crafts. FreedomCAR Electrical Energy Storage System Abuse Test
Manual for Electric and Hybrid Electric Vehicle Applications. Sandia National
Laboratories, 2006.
C. Motloch, J. Christophersen, J. Belt, R. Wright, G. Hunt, R. Sutula, T. Duong, T.
Tartamella, H. Haskins, and T. Miller. High-Power Battery Testing Procedure and
Analytical Methodologies for HEV's. SAE Paper, 2002-01-1950, 2002.
M. Origuchi, T. Miyamoto, H. Horie, and K. Katayama. Development of a Li-ion
Battery system for EVs. SAE Paper, 970238, 1997.
Top Related