


Languages
Pages
Legal


Samsung Electronics
LM561X, LM231X
Design Guide
for T8 Application rev1.0
2
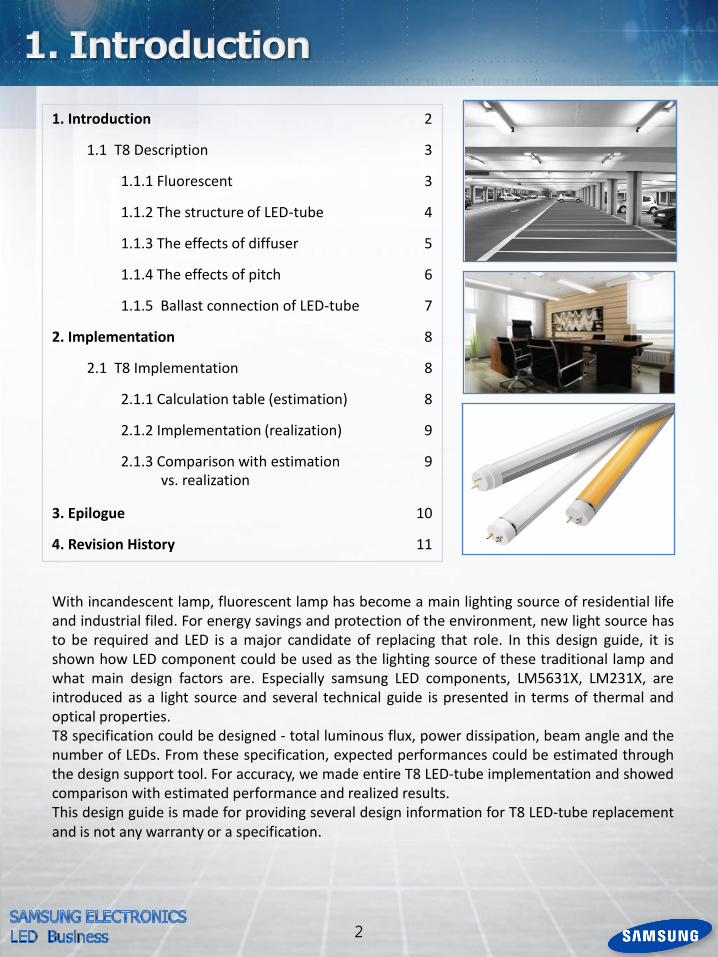
1. Introduction 2
1.1 T8 Description 3
1.1.1 Fluorescent 3
1.1.2 The structure of LED-tube 4
1.1.3 The effects of diffuser 5
1.1.4 The effects of pitch 6
1.1.5 Ballast connection of LED-tube 7
2. Implementation 8
2.1 T8 Implementation 8
2.1.1 Calculation table (estimation) 8
2.1.2 Implementation (realization) 9
2.1.3 Comparison with estimation vs. realization
9
3. Epilogue 10
4. Revision History 11
With incandescent lamp, fluorescent lamp has become a main lighting source of residential life and industrial filed. For energy savings and protection of the environment, new light source has to be required and LED is a major candidate of replacing that role. In this design guide, it is shown how LED component could be used as the lighting source of these traditional lamp and what main design factors are. Especially samsung LED components, LM5631X, LM231X, are introduced as a light source and several technical guide is presented in terms of thermal and optical properties. T8 specification could be designed - total luminous flux, power dissipation, beam angle and the number of LEDs. From these specification, expected performances could be estimated through the design support tool. For accuracy, we made entire T8 LED-tube implementation and showed comparison with estimated performance and realized results. This design guide is made for providing several design information for T8 LED-tube replacement and is not any warranty or a specification.
3
1.1 T8 Description
1.1.1 Fluorescent
Hg & Ar gas Filament
PhosphorGlass tube
Electron
UV rays
Visible light
BallasterSwitch
AC power
input consent
Condenser
Starter
Reflector Fluorescent
Lighting
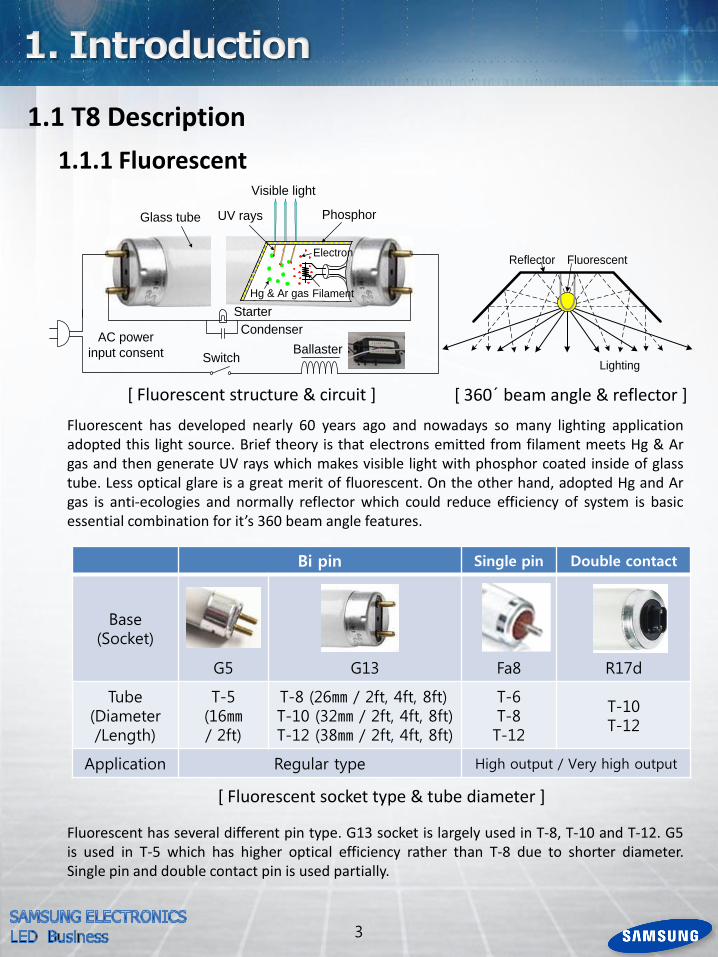
[ Fluorescent structure & circuit ] [ 360′ beam angle & reflector ]
Fluorescent has developed nearly 60 years ago and nowadays so many lighting application adopted this light source. Brief theory is that electrons emitted from filament meets Hg & Ar gas and then generate UV rays which makes visible light with phosphor coated inside of glass tube. Less optical glare is a great merit of fluorescent. On the other hand, adopted Hg and Ar gas is anti-ecologies and normally reflector which could reduce efficiency of system is basic essential combination for it’s 360 beam angle features.
Bi pin Single pin Double contact
Base (Socket)
G5 G13 Fa8 R17d
Tube (Diameter /Length)
T-5 (16㎜ / 2ft)
T-8 (26㎜ / 2ft, 4ft, 8ft) T-10 (32㎜ / 2ft, 4ft, 8ft) T-12 (38㎜ / 2ft, 4ft, 8ft)
T-6 T-8 T-12
T-10 T-12
Application Regular type High output / Very high output
[ Fluorescent socket type & tube diameter ]
Fluorescent has several different pin type. G13 socket is largely used in T-8, T-10 and T-12. G5 is used in T-5 which has higher optical efficiency rather than T-8 due to shorter diameter. Single pin and double contact pin is used partially.

4
1.1 T8 Description
1.1.2 The structure of LED-tube
Diffuser cover
Heat sink
Cap
PCBLED
Reflector Fluorescent
Lighting
LED-tube have begun to replace fluorescent light source for high optical efficiency, energy saving, eco-friendly material and long lifetime. Especially as for LED-tube’s long lifetime, demand of LED-tube has been requested from garage lighting application of large market and storage. After early time, many indoor application start to replace fluorescent lamp with LED-tube as a main lighting source.
LED FR-PCB
Heat sink
Diffuser cover
PSU
[ Structure of LED-tube ]
General structure of the LED-tube consists of LED, PCB, heat sink, diffuser cover, socket and power supply unit(PSU) instead of ballast in fluorescent. LED emit optical light directionally, therefore actually reflector doesn’t be required as much as fluorescent lamp. This makes LED-tube has less optical loss rather than fluorescent. But LED-tube needs function of scattering directional light characteristics through the diffuser cover which could reduce glare property also.

5
1.1 T8 Description
1.1.3 The effects of diffuser
Lighting
Heat Sink
PCB
LED
Lighting
Diffuser
LED has a directional optic property and needs to adopt heat sink, large PCB which makes longish beam angle of T8. In order to increase viewing angle more wider, diffuser cover could be used and additionally this cover also makes less glare level.
[ The difference of beam angle between without and with diffuser @ side view ]
[ Without diffuser cover ] [ With diffuser cover ]
Without diffuser cover With diffuser cover
shadow Diffusion of light
Diffuser Heat sink
In above picture, we can observe shadow line from heat sink edge (without diffuser) and also could see more wide diffused light performance (with diffuser).
6
1.1 T8 Description
1.1.4 The effects of LED pitch
Heat
Light
LED
PCB
Heat Sink
Diffuser (side view)
H-1 H-2H-3
P-3P-2P-1
Uniform intensity Hot spot intensity
Diffuser
(top view)
Uniform intensity
0 1 2 3 4 5 6 7 8 9 10
0.1
0.2
0.3
0.4
0.5
0.6
0.7
0.8
MH(Length of LED-diffuser cover / Pitch of LED-LED)
Un
ifo
rmity r
atio
of ill
um
ina
nce
(min
imu
m / m
axim
um
)
Targeting uniformityMinimum uniformity
2nd optic design is required region
Pitch : 10.8mm
Height : 16.8mm
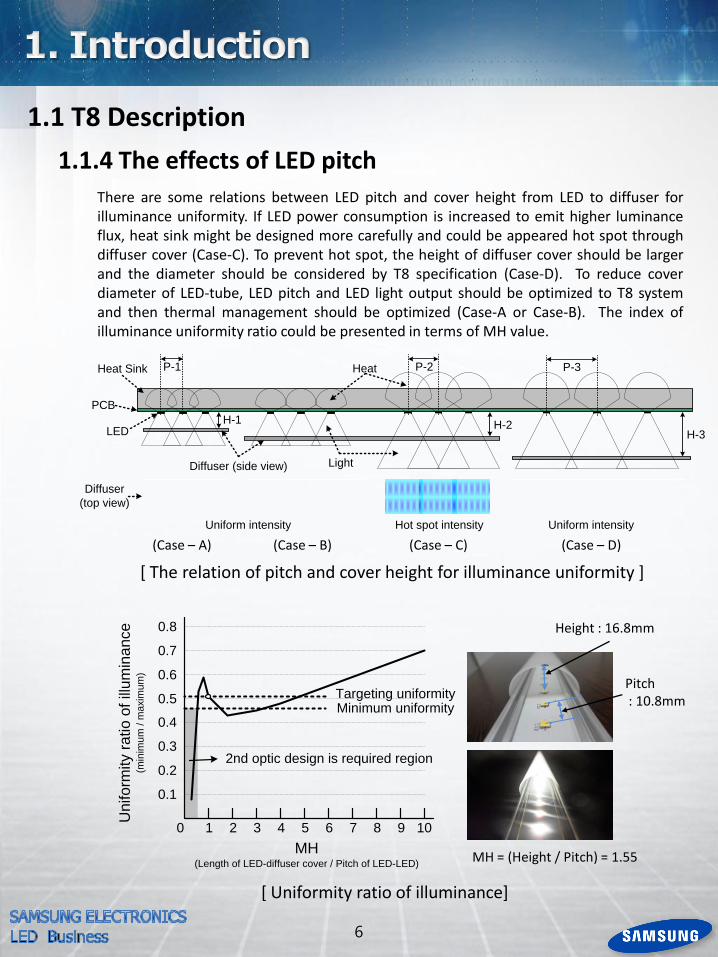
MH = (Height / Pitch) = 1.55
There are some relations between LED pitch and cover height from LED to diffuser for illuminance uniformity. If LED power consumption is increased to emit higher luminance flux, heat sink might be designed more carefully and could be appeared hot spot through diffuser cover (Case-C). To prevent hot spot, the height of diffuser cover should be larger and the diameter should be considered by T8 specification (Case-D). To reduce cover diameter of LED-tube, LED pitch and LED light output should be optimized to T8 system and then thermal management should be optimized (Case-A or Case-B). The index of illuminance uniformity ratio could be presented in terms of MH value.
(Case – A) (Case – B) (Case – C) (Case – D)
[ The relation of pitch and cover height for illuminance uniformity ]
[ Uniformity ratio of illuminance]

7
1.1 T8 Description
1.1.5 Ballast connection of LED-tube
Magnetic Ballast
Starter
Electronic Ballast
LED driver
Traditional fluorescent lamp is driven by ballast which is divided into magnetic ballast and electronic ballast. The work of these ballast is AC charging and discharging not the conversion of AC to DC power(SMPS). But LED –tube should be driven by constant current mode. Therefore AC to DC power converter is generally required as a ballast of LED-tube. At first, for the compatibility between already installed magnetic or electronic ballast of traditional T8 lamp and LED-tube, compatible converter should be required for LED-tube.
LED-tube
[ compatible converter type with installed ballast of fluorescent ]
[ Interior converter type ] [ Exterior converter type ]
The exclusive converter for LED-tube is divided into interior type and exterior type. Interior converter type is embedded in LED-tube body and tube socket is connected to AC plug directly. And another is exterior type which is separated with LED-tube body like as fluorescent ballast.

8
2.1 T8 Implementation
2.1.1 Calculated table (estimation)
LM231A Efficiency of PSU 0~100 78% LED Vf : AZ,A1,A2,A3,A4 A3 (Datasheet) TJ_max. = 110℃
sellect : LM231A,LM231B,LM561A,LM561B,LM362A Efficiency of Optical 0~100 89% Rank Flux : S1,S2,S3 S2 (Datasheet) IF_max. = 150㎃
CASE
Input filed LED performances at operating Estimations of system Derating performance
CCT [K] IF_driving (A) # of LED Ts (℃) Ta (℃) VF (V) Flux (㏐) TJ (℃) Flux (㏐) Power (W) Efficacy (Lm/W) Rth(J-a) IF_max. (A) IF_margin (A) Comment
A 2700
0.056 110 51 25 2.95 20.4 54.3 1997 23.30 85.7 256 0.150 0.094 inside of derating curve
0.063 100 55 25 2.97 22.7 58.7 2020 23.99 84.2 258.2 0.150 0.087 inside of derating curve
0.071 90 59 25 2.99 25.2 63.2 2019 24.50 82.4 256.1 0.150 0.079 inside of derating curve
B 5000
0.056 110 51 25 2.95 20.9 54.3 2046 23.30 87.8 256 0.150 0.094 inside of derating curve
0.100 110 75 25 3.05 34.8 81.1 3407 43.01 79.2 255.5 0.150 0.050 inside of derating curve
0.150 110 105 25 3.13 46.2 114.4 4523 66.21 68.3 255.6 0.143 -0.007 Out of current range
C 5000
0.056 110 64 25 2.92 20.4 67.3 1997 23.06 86.6 373.1 0.113 0.057 inside of derating curve
0.100 110 99 25 2.99 32.2 105.0 3152 42.17 74.7 371.5 0.106 0.006 Warning for current
0.114 110 111 25 3.03 36.0 117.9 3524 48.71 72.3 370 0.104 -0.010 Out of current range
2700~6500 0.04~0.15 Input # measured data ※ derating characteristics is based on Ts (LED solder temperature)
※ IF_margin = IF_max.-IF_driving
LM561B Efficiency of PSU 0~100 78% LED Vf : AZ,A1,A2,A3,A4 A3 (Datasheet) TJ_max. = 110℃
sellect : LM231A,LM231B,LM561A,LM561B,LM362A Efficiency of Optical 0~100 89% Rank Flux : S1,S2,S3 S2 (Datasheet) IF_max. = 150㎃
CASE
Input filed LED performances at operating Estimations of system Derating performance
CCT [K] IF_driving (A) # of LED Ts (℃) Ta (℃) VF (V) Flux (㏐) TJ (℃) Flux (㏐) Power (W) Efficacy (Lm/W) Rth(J-a) IF_max. (A) IF_margin (A) Comment
D 2700
0.056 110 52 25 2.96 22.4 54.7 2193 23.38 93.8 258.2 0.150 0.094 inside of derating curve
0.063 100 56 25 2.98 24.9 59.0 2216 24.07 92.1 259.3 0.150 0.087 inside of derating curve
0.071 90 60 25 3.00 27.7 63.4 2219 24.58 90.3 256.3 0.150 0.079 inside of derating curve
E 5000
0.056 110 52 25 2.96 24.9 54.7 2438 23.38 104.3 258.2 0.150 0.094 inside of derating curve
0.100 110 77 25 3.07 41.0 81.9 4014 43.29 92.7 257.5 0.149 0.049 inside of derating curve
0.150 110 109 25 3.18 56.0 116.6 5482 67.27 81.5 257.9 0.139 -0.011 Out of current range
F 5000
0.056 110 65 25 2.94 24.3 67.6 2379 23.22 102.5 373.8 0.112 0.056 inside of derating curve
0.100 110 102 25 3.03 39.0 106.8 3818 42.73 89.4 375.2 0.104 0.004 Warning for current
0.114 110 115 25 3.07 43.7 120.6 4278 49.36 86.7 375.7 0.101 -0.013 Out of current range
2700~6500 0.04~0.15 Input # measured data
System estimation and compare tool of samsung led is supported for user convenience. First, user could sellect LED type and detail rank information (CCT, VF, Flux rank). Then optical and electrical efficiency of system information could be inserted. If there’s non information of system level, then just board level results might be shown. Second, target driving current and the number of LEDs should be inserted. After this, unit LED performance(Flux, VF) and system expected value(total flux, power consumption, lumen per watt) could be shown. And this value is just only relevant to 25℃ solder point temperature case(Ts). If user want real value at operating condition, for example when Ts is 70℃ or 85℃ etc,. do the next stage. Third, insert expected Ts temperature to tool. Then LED performance might be changed as to inserted Ts information and system results might be changed also. Furthermore the thermal resistance of system could be known. From these system information, allowable current level related with derating curve is shown and some comments would be presented and expected lifetime becomes to be shown.

9
2.1 T8 Implementation
2.1.2 Implementation (realization)
2.1.3 Comparison with estimation vs. realization
LED Rank (VF : A3, Flux : S2)
LM561B LM231A LM561B LM231A
Estim. Imple. Estim. Imple. Estim. Imple. Estim. Imple.
CCT (K) 2700 5000
# of LED 110 110
Total lumen (lm)
2193 2242 1997 1994 2438 2442 2046 2162
(102.2%) (99.8%) (100.2%) (105.6%)
Total power (W)
23.4 23.9 23.3 23.8 23.4 23.5 23.3 24.0
(102.1% (102.1%) (100.4%) (103.0%)
Set efficacy (lm/W)
93.8 93.8 85.7 83.8 104.3 104.1 87.8 90.2
(100.0%) (97.8%) (99.8%) (102.7%)
※ ( ) : ratio of ‘implementation value / estimation value’
Real implementation of LED-tube is made for 4ft T8 replacement. Adopted LED components are LM561B and LM231A and 110 number of LEDs are used respectively.
The measured value of LED-tube implementation and the estimated value from estimation software tool is compared as below table.

10
Total cost
Time
Initial cost
+
Running cost
Fluorescent
LED-tube (A-condition)
LED-tube (B-condition)
Pa
yb
ack B
-po
int
LED-tube (B’-condition)
Pa
yb
ack B’-
po
int
Pa
yb
ack A
-po
int
The market price of LED-tube falls down rapidly year by year. But actually the cost of LED-tube is still expensive compared with fluorescent lamp. Therefore manufacturer should consider 2 kind of main factor. One is initial price of LED-tube itself and install cost. Another is running cost related with electric bill and this cost is closely correlated with LED-tube efficiency. From these relations, the concept of payback becomes important. Below graph show a simple payback curve. Both of A-condition and B-condition has same initial price. But LED-tube efficiency or electric bill might be different. Therefore payback time could be different like as below graph(payback A-point and B-point, the efficiency of B is more higher than A). Surely as initial cost falls down, payback time could be advanced like B’-condition. Therefore LED-tube could have various market positioning according to each country and installed site .
[ Example of payback]

11
Date Revision History Writer
Drawn Approved
2013.03.21 New Version Y.J. Lee D.M. Jeon
Top Related