


Languages
Pages
Legal


As
of 0
6/20
12
Desi
gn a
nd A
sses
smen
t of B
RT S
tatio
ns
Design and Assessment of BRT Stations Eliana Chila | Richard Mejía | Matthias Hoffmann
www.mercedes-benz.com/brt
EvoBus GmbH, Neue Straße 95, 73230 Kirchheim unter Teck
BRT Handbuch Umschlag neues CI.indd 2-3 17.05.13 10:56
Project Leader:
Dipl.-Ing. Richard Mejía ([email protected])
Authors:
Dipl.-Ing. Eliana Chila M.Sc.
Dipl.-Ing. Richard Mejía
Dipl.-Ing. Matthias Hoffmann M.Sc.
Design and Assessment of BRT Stations
Handbook
Design and Assessment of BRT Stations – Foreword III
Foreword
The world is changing at rapid pace and the effects of global mega-trends such as expeditious
population growth and increasing urbanisation call for the provision of new, convenient urban
mobility solutions. Thus, solutions need to meet the individual demands of each city and its in-
habitants. Sustainable mobility enables access to education, employment, research, public life
and culture, leads to further personal, social and economic development, while preserving the
natural environment. In this context Daimler provides a wide range of concepts to improve life in
urban areas.
Bus Rapid Transit is viewed as the solution for large cities to improve their urban transport sys-
tems, which are often operating at their limits due to ever worsening road-traffic and increasing
demand for fast and convenient passenger transport. BRT systems are essentially determined by
dedicated bus lanes to ensure the prioritisation and fast operation of buses. Further key-
elements are: barrier-free boarding and vehicles optimised in terms of size and design.
Thus, the implementation of such BRT systems is characterised by high complexity as a result of
the numerous components influencing the planning process. Due to our commitment to sustain-
able development we - Daimler Buses – have been supporting cities worldwide in developing
environmental-friendly public transport solutions since the 1980s. Our experts provide assis-
tance through all stages, from planning to implementation, and advice on topics such as
transport planning, implementation, operation and aftersales.
This handbook has been developed by our transport experts and it focuses on transport planning
and BRT station design. I hope it provides you a useful tool during the planning or improvement
of your BRT systems. This handbook is also intended to create a common understanding and to
facilitate cooperation among stakeholders in the planning process, by compiling content of high
complexity and relevance to the process of creating highly efficient public transport systems.
I am sure with this work Daimler Buses is contributing to the development of top class public
transport systems with BRT to improve mobility and the quality of life in our cities.
Hartmut Schick
CEO Daimler Buses
Stuttgart, June 2012
Design and Assessment of BRT Stations – Preface V
Preface
Cost-efficiency, environmental friendliness, quality of service and comfort: these key words
characterise clearly areas of conflict facing public transport system requirements nowadays.
These requirements should not constitute either/or decisions, but should rather be met as a
whole. Bus Rapid Transit systems have received widespread global attention in recent years as
they prove to be an effective alternative to expensive mass rapid systems like Light Rail Transit
(LRT) or metro. For more than 35 years BRT systems have been implemented or considered by
cities. Theory and practice have confirmed that beyond right of way, stations and station design
are the most crucial parts for assuring an efficient operation of these systems. Station capacity
impacts the capacity of an entire system and attractive stations can be decisive for users’ ac-
ceptance of a transport system. Although worldwide there are very successful examples of effi-
cient station design, achieving a functional, operational and attractive design of stations is fre-
quently underestimated.
This handbook develops a methodology for designing, planning and assessing BRT stations
worldwide. It is based on the review of station design criteria given in literature, following a com-
parative approach. Based on findings from the literature, a proposal for globally applicable levels
of service for station design assessment is derived and tested in the context of selected stations
from Istanbul’s Metrobüs BRT system. The results derived from the application of this work can
be suitable both in the planning process as well as in the ongoing review and improvement of
existing BRT systems. This handbook is intended to support transport planners, operators and all
other stakeholders involved in improving the quality of the decision-making process for BRT sta-
tion design. This handbook has its origins in the responsibility and approach of Daimler to pro-
vide eco-friendly technology as well as sustainable mobility solutions, promoting worldwide effi-
cient bus-based public transport solutions such as BRT.
I would like to thank all the people associated with this work, especially Mrs. Eliana Chila, for her
dedication in the preparation of this handbook, Prof. Bolze from the Technical University Darm-
stadt for his support and provision of strategic ideas, as well as Mrs. Christine Hofmann, Mr. Leif
Fornauf and Mr. Wolfgang Kittler for their constructive input and continuous support. Thanks to
Mercedes-Benz Türk, especially to Mr. Selim Dalli, for the support in the data collection in Istan-
bul. Furthermore I would like to thank Dr. Dario Hidalgo, Dr. Barghab Maitra, Mr. Paulo Custodio
and Dr. Arturo Ardila who shared their expertise and enabled many fruitful discussions.
I hope you enjoy immersing in the exciting world of designing BRT stations as one of the most
crucial parts of the cost-effective public transport system BRT.
Richard Mejía
Stuttgart, June 2012
Design and Assessment of BRT Stations – The Authors VII
The Authors
Richard Mejía was born in Quito/Ecuador in 1971. He studied Transportation Engineering at the
Technical University Berlin, with a major in Planning and Operating of Transport Systems. Since
2008 Richard Mejía has been the head of the BRT Transport Planning team of Daimler Buses in
Germany. His focus and experience in the management of worldwide transport planning and ITS
projects including project evaluation, planning and technical and economic implementation are
the result of more than 13 years work in transport planning, ITS and consult in Germany, the
United Kingdom and Spain. He has long-standing planning expertise in the transport sector in-
cluding Bus Rapid Transit, public transport policy, traffic modelling, electronic toll collection and
traffic management systems, park-and-ride programmes and ITS.
Eliana Chila Vidaurre graduated in Civil Engineering from the University of Tarija/Bolivia and
obtained her MSc in Traffic and Transport from the Technical University Darmstadt/Germany.
Since 2002 her engagement has been directed towards transport infrastructure, ranging from
planning and supervision of key public road and railway projects in Bolivia to coordination of the
introduction of a ISO 9000 quality management system. At present Ms. Chila Vidaurre acts as
technical advisor for a large PPP transportation infrastructure project for the municipal authority
of Frankfurt/Germany. Her expertise includes the tender evaluation process of public investment
projects.
Matthias Hoffmann was born in Hanover/Germany in 1976. He holds a Dipl.-Ing. and B.Sc. in
Urban Planning from the Hamburg University of Technology as well as a M.Sc. and B.Sc. in For-
estry Sciences from the University of Goettingen. Matthias Hoffmann is an urban and transport
planning consultant at Daimler Buses in Germany with a focus on Bus Rapid Transit. Previously
he worked in research with a focus on modelling accessibility effects, traffic cost estimation,
urban design and planning, Bus Rapid Transit, urban development policy, capacity building and
gender issues.

Design and Assessment of BRT Stations – Table of Contents IX
Table of Contents
1 Introduction ............................................................................................................. 1
1.1 Background .......................................................................................................................... 1
1.2 Purpose and Scope of the Hanbook ................................................................................... 3
1.3 Structure of the Handbook ................................................................................................. 4
2 Characteristics of Bus Rapid Transit (BRT) ............................................................ 7
2.1 Definitions of BRT in Literature ........................................................................................... 7
2.2 Design Concepts .................................................................................................................. 7
2.3 Benefits ................................................................................................................................ 8
2.3.1 Cost Advantages .................................................................................................................. 8
2.3.2 Environmental Benefits from BRT ....................................................................................... 8
2.3.3 Land Use and Land Value Potential .................................................................................... 9
2.3.4 Positive Social Impacts of BRT ........................................................................................ 10
2.3.5 Fast and Flexible Implementation ................................................................................... 10
2.4 Obstacles and Lessons Learned ...................................................................................... 11
2.4.1 Constraints to BRT Dissemination ................................................................................... 11
2.4.2 Lessons Learned ............................................................................................................... 11
2.5 System Components ........................................................................................................ 14
2.5.1 Infrastructure .................................................................................................................... 14
2.5.2 Buses ................................................................................................................................. 21
2.5.3 Bus Configuration ............................................................................................................. 21
2.5.4 Operational Issues ............................................................................................................ 23
2.5.5 Intelligent Transport Systems .......................................................................................... 25
3 Elements of BRT Stations...................................................................................... 29
3.1 Platforms and Bus Loading Areas .................................................................................... 29
3.1.1 Platforms ........................................................................................................................... 29
3.1.2 Bus Loading Areas ............................................................................................................ 34
3.1.3 The Platform-Vehicle Interface ........................................................................................ 46
3.2 Integration with Other Transport Modes ......................................................................... 49
3.2.1 Pedestrian Access to/from the Station .......................................................................... 49
3.2.2 Parking Facilities ............................................................................................................... 57
3.2.3 Interface between BRT and other Public Transport Modes ........................................... 59
3.3 Architecture ...................................................................................................................... 59
3.3.1 Weather Protection ........................................................................................................... 61
3.3.2 Aesthetic Design ............................................................................................................... 62
3.3.3 Image and Identity ............................................................................................................ 64
Design and Assessment of BRT Stations – Table of Contents X
3.4 Fare Collection and Verification ....................................................................................... 64
3.4.1 Fare Collection .................................................................................................................. 65
3.4.2 Fare Verification ................................................................................................................ 65
3.5 Passenger Information Systems at BRT Stations ........................................................... 66
3.5.1 Station Information ........................................................................................................... 67
3.5.2 Service Information .......................................................................................................... 68
3.5.3 Further Passenger Information ........................................................................................ 69
3.6 Security and Safety ........................................................................................................... 70
3.6.1 Security ............................................................................................................................. 70
3.6.2 Safety ................................................................................................................................. 71
3.7 Considerations for Passengers with Reduced Mobility .................................................. 72
3.8 Additional Considerations ................................................................................................ 73
3.8.1 Features ............................................................................................................................. 73
3.8.2 Maintenance and Cleanliness .......................................................................................... 74
3.8.3 Customer Service ............................................................................................................. 75
3.9 Summary of all Station Elements ..................................................................................... 75
4 BRT Station Design Process and Methodology .................................................... 79
4.1 BRT Station Design Process ............................................................................................. 79
4.1.1 Conditions ......................................................................................................................... 79
4.1.2 Requirements .................................................................................................................... 81
4.2 Level of Service Methodology .......................................................................................... 83
4.2.1 Availability ......................................................................................................................... 85
4.2.2 Comfort and Convenience ................................................................................................ 95
4.2.3 Summary of Level of Service Tables .............................................................................. 103
5 Case Study: Validation of the BRT Station Design Process ............................... 107
5.1 Description of the Conditions ........................................................................................ 107
5.1.1 Local Conditions ............................................................................................................. 107
5.1.2 Economic and Legal Framework .................................................................................... 107
5.1.3 The Metrobüs BRT System ............................................................................................. 108
5.2 Assessment of the Current Level of Service ................................................................. 109
5.2.1 Description of the Assessed Stations ........................................................................... 109
5.2.2 General Performance Parameters Measured at Stations ............................................. 113
5.2.3 Level of Service Assessed for Availability ..................................................................... 114
5.2.4 Level of Service Assessed for Comfort and Convenience ........................................... 124
5.2.5 Assessment of Comfort .................................................................................................. 126
5.2.6 Summary of the Level of Service Assessment .............................................................. 127
5.3 Recommendations for the Improvement of the Stations’ Level of Service ................ 128
5.3.1 Recommendations for the Improvement of Availability ............................................... 128

Design and Assessment of BRT Stations – Table of Contents XI
5.3.2 Recommendations for the Improvement of Comfort and Convenience ..................... 136
5.3.3 Summary of the Recommended Measures ................................................................... 139
6 Conclusions and Outlook .................................................................................... 143
Design and Assessment of BRT Stations – 1 Introduction 1
1 Introduction
1.1 Background
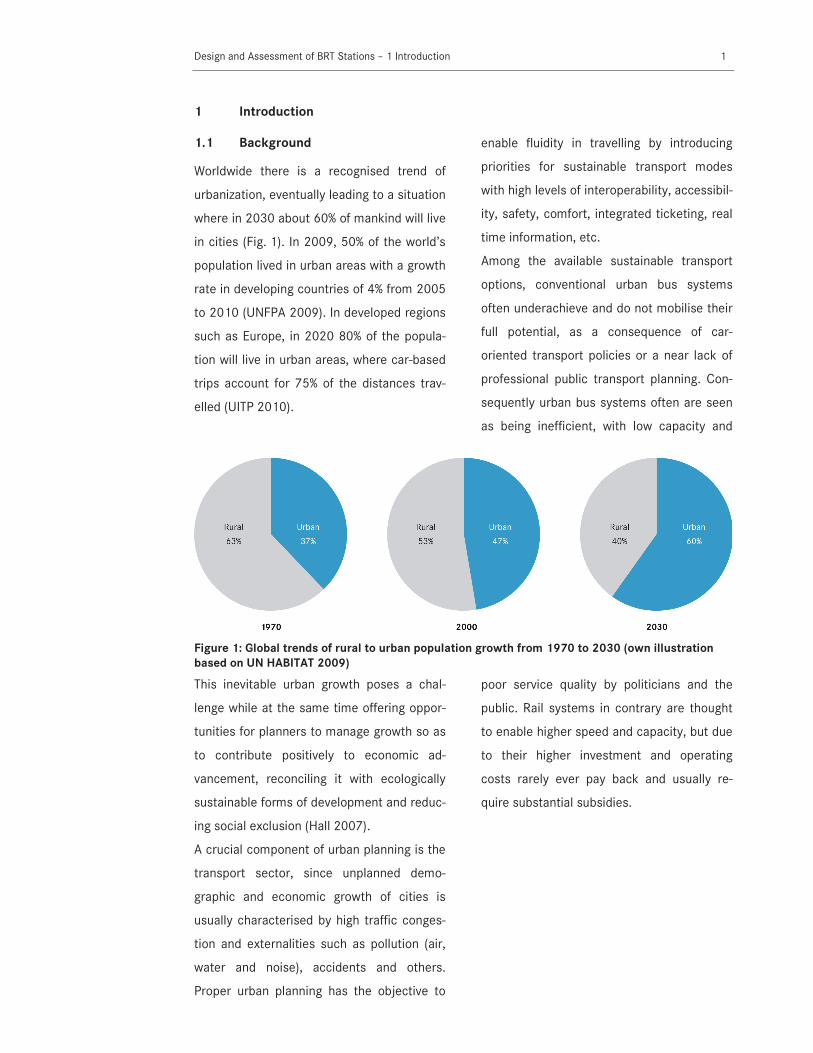
Worldwide there is a recognised trend of
urbanization, eventually leading to a situation
where in 2030 about 60% of mankind will live
in cities (Fig. 1). In 2009, 50% of the world’s
population lived in urban areas with a growth
rate in developing countries of 4% from 2005
to 2010 (UNFPA 2009). In developed regions
such as Europe, in 2020 80% of the popula-
tion will live in urban areas, where car-based
trips account for 75% of the distances trav-
elled (UITP 2010).
This inevitable urban growth poses a chal-
lenge while at the same time offering oppor-
tunities for planners to manage growth so as
to contribute positively to economic ad-
vancement, reconciling it with ecologically
sustainable forms of development and reduc-
ing social exclusion (Hall 2007).
A crucial component of urban planning is the
transport sector, since unplanned demo-
graphic and economic growth of cities is
usually characterised by high traffic conges-
tion and externalities such as pollution (air,
water and noise), accidents and others.
Proper urban planning has the objective to
enable fluidity in travelling by introducing
priorities for sustainable transport modes
with high levels of interoperability, accessibil-
ity, safety, comfort, integrated ticketing, real
time information, etc.
Among the available sustainable transport
options, conventional urban bus systems
often underachieve and do not mobilise their
full potential, as a consequence of car-
oriented transport policies or a near lack of
professional public transport planning. Con-
sequently urban bus systems often are seen
as being inefficient, with low capacity and
poor service quality by politicians and the
public. Rail systems in contrary are thought
to enable higher speed and capacity, but due
to their higher investment and operating
costs rarely ever pay back and usually re-
quire substantial subsidies.
Figure 1: Global trends of rural to urban population growth from 1970 to 2030 (own illustration
based on UN HABITAT 2009)

Design and Assessment of BRT Stations – 1 Introduction 2
In many developing and developed countries
there is renewed interest in finding ways of
providing efficient and effective public
transport that does not impose additional
risks to public budgets. Especially in times of
financial crisis, careful consideration must be
given to risks associated with debt service
and liabilities and budget deficits associated
with excessive spending on public transport
infrastructure. An increasing number of na-
tions are asking what type of public transport
system can deliver value for money. BRT1 is
an attractive, established solution, which can
combine the capacity and speed of rail sys-
tems at the moderate cost and flexibility of
bus systems. BRT can be understood as a
flexible, rubber-tired rapid-transit mode that
combines stations, vehicles, services, run-
ning ways and Intelligent Transport System
(ITS) elements into an integrated system with
a strong, positive identity evoking a unique
image (TCRP 2003a). One important element
of BRT is station design, as underlined by P.
Custodio (2008): “BRT capacity is the capaci-
ty available at the station.”
A study commissioned in order to assess the
extent to which BRT can equal the image of
rail-based transit systems concluded that:
“Full-Service BRT is capable of replicating
both the functionality standards (tangible
attributes) and image qualities (intangible
attributes) normally associated with Light Rail
transit, at least in the perception of the gen-
eral public” (FTA 2009b).
1 A variety of terms is available for “Bus Rapid Transit”: e.g. high-capacity bus system, high-quality bus system, surface metro, express bus system, busway systems, metrobus etc.
BRT represents a major trend in the devel-
opment of public transport systems around
the world (Hensher and Golob 2008). At pre-
sent over 130 BRT systems in Latin America,
Northern America, Europe, Australasia and
Asia are in operation and a lot more are in
construction, expansion and planning stages
(Daimler AG). This is based on successful
projects in South America that started in
Brazil in the 1970’s (GTZ and Castro 2008).
The above definition underlines the im-
portance of a comprehensive design concept
emphasising the high significance of BRT
stations. The Transit Cooperative Research
Program (TCRP) identifies station infrastruc-
ture as a major characteristic of BRT system
design and a key element in providing ade-
quate capacity (TCRP 2003a).
The Institute for Transportation and Devel-
opment Policy (ITDP) reports that in general,
the bottleneck of most BRT systems is vehi-
cle congestion at stations. Approaches that
help to decongest BRT station areas (Fig. 2)
and allow for rapid boarding and alighting of
passengers will be likely to return the great-
est dividends in terms of speed and capacity
(ITDP 2007).
Although there are very successful examples
of efficient station design worldwide, the
functional, operational and attractive design
of stations is frequently underestimated. The
consequences are manifold, ranging from
capacity problems to non-acceptance of the
transport system by the users. Considering
that stations are the first point of contact
between the passenger and the bus service,
their importance cannot be underestimated.

Design and Assessment of BRT Stations – 1 Introduction 3
An example of less successful BRT station
design was exposed in the BRT system in
Jakarta/Indonesia, opened in February 2004.
Since its initial phase the BRT system experi-
enced problems with inadequate sizes of
stations and transfer terminals, resulting in
low capacity and speeds due to more delays
at stations and terminals, more buses, ser-
vice irregularities, higher fares due to in-
creased operating costs and lower quality of
service (Custodio 2005).
The design of BRT stations in Pune, India
causes inconvenience, too (Fig. 3). The circu-
lation of passengers on platforms is difficult
due to the presence of barriers, obstacles
(seats, columns) and narrow sections. There-
fore passengers are required to step down
from the platforms to reach the pedestrian
walkways at the intersection. Level boarding
has not been achieved as buses do not dock
close to the platforms, requiring passengers
to step down from the platforms to climb up
to the bus entrances. Insufficient loading
areas for buses create queuing at stations,
resulting in spillover effects. The information
system (maps, signs etc.) is scarce or vandal-
ized (Pai 2009).
The motivation for the development of a
handbook for the design and assessment of
BRT stations arose from the interest in im-
proving the quality of service provided at BRT
stations.
1.2 Purpose and Scope of the Hand-
book
In recognition of the importance of stations
for BRT systems’ operation and performance,
this handbook will develop a manual to assist
Figure 2: Station capacity problems at the BRT corridor in Istanbul/Turkey (Daimler AG)
Figure 3: Undersized stations in Pune/India (Daimler AG)

Design and Assessment of BRT Stations – 1 Introduction 4
the process of the design and assessment of
such stations. This manual can be applied
worldwide and takes into account a wide
range of design alternatives. Supporting the
primary objective, secondary objectives
were:
Collection and review of relevant infor-
mation for the design and assessment of
the BRT station elements (research, plan-
ning guides, studies, reports about BRT
systems and the design of stations for
public transport in general). Assembling
and compressing the information into a
single document provides developers and
evaluators with a comprehensive and
compact reference document about BRT
stations.
Analysis of concepts for assessing the
capacity of BRT stations. Methodologies
relative to the design of conventional bus
stations and Light Rail Transit (LRT) sta-
tions are compared to experience gained
from actual BRT systems.
Introduction of quality of service concepts
for the design and assessment of BRT sta-
tions.
Optimisation and validation of this hand-
book through its application to a BRT sys-
tem in operation.
Following the purpose and scope of this
handbook, limitations are:
The location of a BRT station (along the
BRT corridors), and its placement (in rela-
tion to a road intersection and to a street
cross section) are conditioned on an ex-
amination of numerous on-site particulari-
ties, and assumed as a result of a prior
definition process. Therefore station loca-
tion and placement are not part of this
handbook and only a brief description
about their main characteristics is pre-
sented in Chapter 2.
The handbook is limited to design and
management capacity problems and oth-
er service requirements of the BRT sys-
tem that can only be influenced by solu-
tions emerging from the characteristics of
the stations’ elements. Design review of
routes, operation or other BRT elements
is not included.
1.3 Structure of the Handbook
Chapter 1 introduces the materials included
within this handbook.
A compact overview of the main characteris-
tics of BRT systems is offered in Chapter 2.
The design concept, main components (in-
frastructure, buses and operation system),
benefits and obstacles are briefly described.
Chapter 3 describes the elements of BRT
stations, classified in eight categories. The
elements' main characteristics, essential
functions and key design concepts are out-
lined. The analysis is supported by infor-
mation about conventional bus
stops/stations and rail-based stations. Plan-
ning guides and technical reports about BRT
systems worldwide and lessons learned from
currently operating BRT systems with em-
phasis on problems at stations, passenger
complaints about stations as result of sur-
veys, etc. also important feedback in this
chapter.

Design and Assessment of BRT Stations – 1 Introduction 5
Once the station elements and their essen-
tial functions have been identified, the focus
in Chapter 4 is the BRT station design pro-
cess, as the core subject of this handbook.
The station design process is a complex in-
teraction between various condi-
tions/constraints and stakeholders’ re-
quirements for the station elements.
These conditions/constraints and require-
ments for the BRT station design are identi-
fied, described and categorized. However,
the stakeholders’ requirements are not al-
ways compatible with each other, thus to
reach a balance among all these variables, a
Level of Service (LOS) based methodology is
introduced. The LOS are designated ranges
of values for particular service measures
based on passenger perception but depend-
ing on operating decisions made by the plan-
ners and service providers within the given
conditions or constraints for the station.
Accordingly, individual passenger require-
ments are translated into comprehensive
service requirements to be achieved.
In the respective literature, quantitative crite-
ria are given almost exclusively for the defini-
tion of the LOS values for capacity. For ser-
vice requirements such as accessibility, in-
formation, safety and security, time saving,
comfort and customer service few if any
concrete references are available. Conse-
quentially they were developed from scratch
in this chapter.
In Chapter 5, the process and methodology
defined in Chapter 4 are applied at four sta-
tions at the Metrobüs BRT system in Istan-
bul/Turkey each with specific particularities
and conditions. The objective is the optimisa-
tion and validation of the defined LOS values
(and their relation to the station elements)
through their application and comparison to
concrete data resulting from on-site meas-
urements at operating BRT stations.
Finally, Chapter 6 summarises the key find-
ings of the handbook and provides recom-
mendations on critical aspects of BRT station
design and assessment, along with potential
improvements.
Design and Assessment of BRT Stations – 2 Characteristics of Bus Rapid Transit (BRT) 7
2 Characteristics of Bus Rapid Transit (BRT)
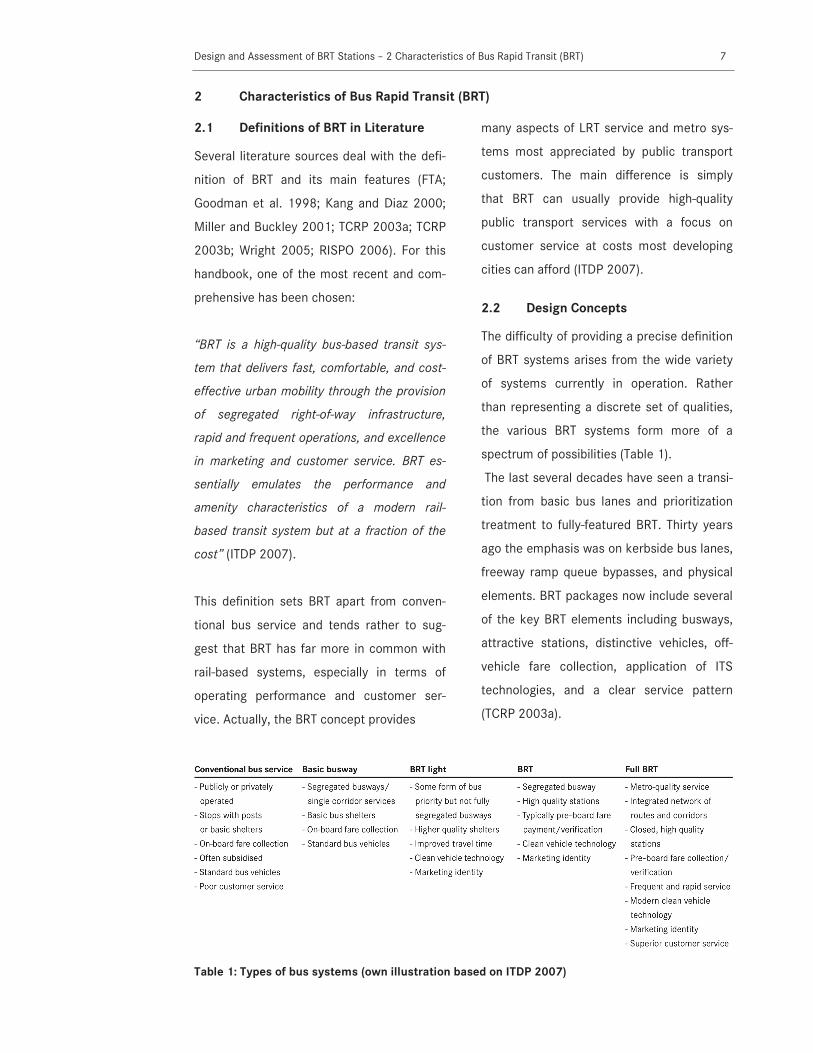
2.1 Definitions of BRT in Literature
Several literature sources deal with the defi-
nition of BRT and its main features (FTA;
Goodman et al. 1998; Kang and Diaz 2000;
Miller and Buckley 2001; TCRP 2003a; TCRP
2003b; Wright 2005; RISPO 2006). For this
handbook, one of the most recent and com-
prehensive has been chosen:
“BRT is a high-quality bus-based transit sys-
tem that delivers fast, comfortable, and cost-
effective urban mobility through the provision
of segregated right-of-way infrastructure,
rapid and frequent operations, and excellence
in marketing and customer service. BRT es-
sentially emulates the performance and
amenity characteristics of a modern rail-
based transit system but at a fraction of the
cost” (ITDP 2007).
This definition sets BRT apart from conven-
tional bus service and tends rather to sug-
gest that BRT has far more in common with
rail-based systems, especially in terms of
operating performance and customer ser-
vice. Actually, the BRT concept provides
many aspects of LRT service and metro sys-
tems most appreciated by public transport
customers. The main difference is simply
that BRT can usually provide high-quality
public transport services with a focus on
customer service at costs most developing
cities can afford (ITDP 2007).
2.2 Design Concepts
The difficulty of providing a precise definition
of BRT systems arises from the wide variety
of systems currently in operation. Rather
than representing a discrete set of qualities,
the various BRT systems form more of a
spectrum of possibilities (Table 1).
The last several decades have seen a transi-
tion from basic bus lanes and prioritization
treatment to fully-featured BRT. Thirty years
ago the emphasis was on kerbside bus lanes,
freeway ramp queue bypasses, and physical
elements. BRT packages now include several
of the key BRT elements including busways,
attractive stations, distinctive vehicles, off-
vehicle fare collection, application of ITS
technologies, and a clear service pattern
(TCRP 2003a).
Table 1: Types of bus systems (own illustration based on ITDP 2007)

Design and Assessment of BRT Stations – 2 Characteristics of Bus Rapid Transit (BRT) 8
2.3 Benefits
Some of the benefits of BRT systems have
already been mentioned, but at this stage the
intention is to corroborate these benefits
through concrete data of BRT systems in
operation.
2.3.1 Cost Advantages
A handbook based on data of worldwide
public transport projects compared alterna-
tive transport modes such as BRT, LRT, ele-
vated rail and subway systems. The compari-
son clearly underlines the cost-efficiency of
BRT systems compared to transport modes
with comparable transport capacities (ITDP
2007). These findings were also confirmed
by a study comparing the hypothetical in-
vestment costs for a 20 km BRT and LRT
system, indicating that investment costs for
BRT would be significantly lower (Table 2)
(FGSV 2008).
Moreover, construction times of BRT sys-
tems tend to be much shorter than those of
other urban transport options, thus offering
quicker returns on investment and reduction
of financial risks. Subsidies for operational
BRT systems usually are not necessary, in
contrast to most metro systems around the
world (UNEP 2009).
2.3.2 Environmental Benefits from BRT
In comparison to other transport systems,
BRT reduces carbon dioxide (CO2) emissions
per passenger transported. This effect is
mainly achieved by using buses with high
capacity and state of the art, fuel-efficient
technologies operated at high passenger
occupancy rates. In the following some spe-
cific examples of BRT systems and their envi-
ronmental benefits are shown:
Metrobús, Mexico-City/Mexico: Annual
environmental benefits include a reduc-
tion of 100,000 tons of CO2 per year,
690 tons of nitrogen oxides (NOX),
2.8 tons of fine particulate matter and
144 tons of hydrocarbons, which are as-
sociated with smog, acid rain, global
warming, and a variety of health problems
(CTS-México 2009; EMBARQ 2011). The
Metrobús BRT system in Mexico-
Table 2: Costs comparison for a 20 km long system with BRT-style buses and LRT (own illustration
based on FGSV 2008)

Design and Assessment of BRT Stations – 2 Characteristics of Bus Rapid Transit (BRT) 9
City/Mexico won Harvard University’s
2009 Roy Family Award for Environmental
Partnership.
Metrobüs, Istanbul/Turkey: The local BRT
system was awarded an honourable men-
tion at the 2009 Sustainable Transport
Awards in Washington, which recognise
projects that reduce greenhouse gases
and improve the quality of life in city cen-
tres of large metropolises worldwide.
The Janmarg BRT system in Ahmeda-
bad/India won this award in 2010, be-
cause it reduced carbon emissions and
improved resident access dramatically
(ITDP 2010a).
TransMilenio, Bogotá/Colombia: Trans-
Milenio’s phases II-III transport an aver-
age of 1.69 million passengers per day on
84 kilometres of exclusive bus lanes with
around 1200 articulated buses and more
than 500 large feeder buses. It reduces
annual CO2 emissions by around
250,000 tons (Grütter 2008). The Trans-
Milenio project is one of the first trans-
portation projects approved under the
Kyoto Protocol Clean Development
Mechanism (Grütter 2007).
United States: In US cities, BRT was
found to provide significantly greater CO2
reduction potential than LRT. The main
reason appears to be the technology used
for electric power generation and the en-
ergy mix used to power LRT. Electricity
generated from fossil fuels produces a
large amount of CO2. In the US, the elec-
tricity generation energy mix contains a
large share of fossil fuels. CO2 emissions
related to LRT therefore are comparative-
ly higher than those of BRT. The per pas-
senger mile CO2 emissions of a BRT sys-
tem are considered to be significantly
lower than those of LRT systems almost
everywhere in the country (Vincent and
Jerram 2006).
Differences in emission savings from BRT
arise from emission standard requirements
for the buses in BRT systems set by national
or local legislation. Some examples are: Is-
tanbul/Turkey requires Euro IV and V stand-
ards, Mexico Euro V, South Africa Euro IV
and Surat/India Euro IV (a brief description
of Euro norms is found in 2.5.2.6).
2.3.3 Land Use and Land Value Poten-
tial
Land valuation and accessibility in crowded,
congested, and land-constrained cities like
Seoul/South Korea are closely related. Im-
proved accessibility prompted property own-
ers and developers to intensify land use
along BRT corridors, mainly by converting
single-family residences to multi-family units,
apartments, and mixed-use projects. Moreo-
ver, land markets capitalised these accessi-
bility gains, particularly among parcels used
for condominiums and higher density resi-
dential uses. Land price premiums in the 5–
10% range were estimated for residences
within 300 metres of BRT stations. For retail
shops and other non-residential uses, im-
pacts were more varied, ranging from 3–26%
premiums over a smaller impact zone of
150 metres from the nearest BRT station
(Cervero and Kang 2009).

Design and Assessment of BRT Stations – 2 Characteristics of Bus Rapid Transit (BRT) 10
2.3.4 Positive Social Impacts of BRT
Lower operating costs allow BRT systems to
be self-financing at much lower fare levels,
providing services affordable to poorer popu-
lations. Further, many new systems have
focused on initial corridors for the lowest-
income neighbourhoods. This helps ensure
that new systems can play a role in improv-
ing access to jobs and public services as
indicated by examples from Colombia and
Indonesia (ITDP 2007).
In Colombia the population is differentiated
into six income groups (Fig. 4). Groups 1 and
2 are considered poor under Colombian law,
while groups 5 and 6 can be considered
rich. Figure 4 implies that in 2001 the
TransMilenio BRT system mainly served in-
come group 3. However, changes applied to
the system until 2003 led to the result of
better access of the poor to the BRT system.
Passengers save roughly US$ 134 per year in
travel costs and 325 hours per year in travel
time.
In the TransJakarta BRT system in Jakar-
ta/Indonesia, from a sample of 350 system
users, 40% of passengers were defined as
low-income based on proxy indicators. Some
87% of passengers said that their travel time
had been reduced.
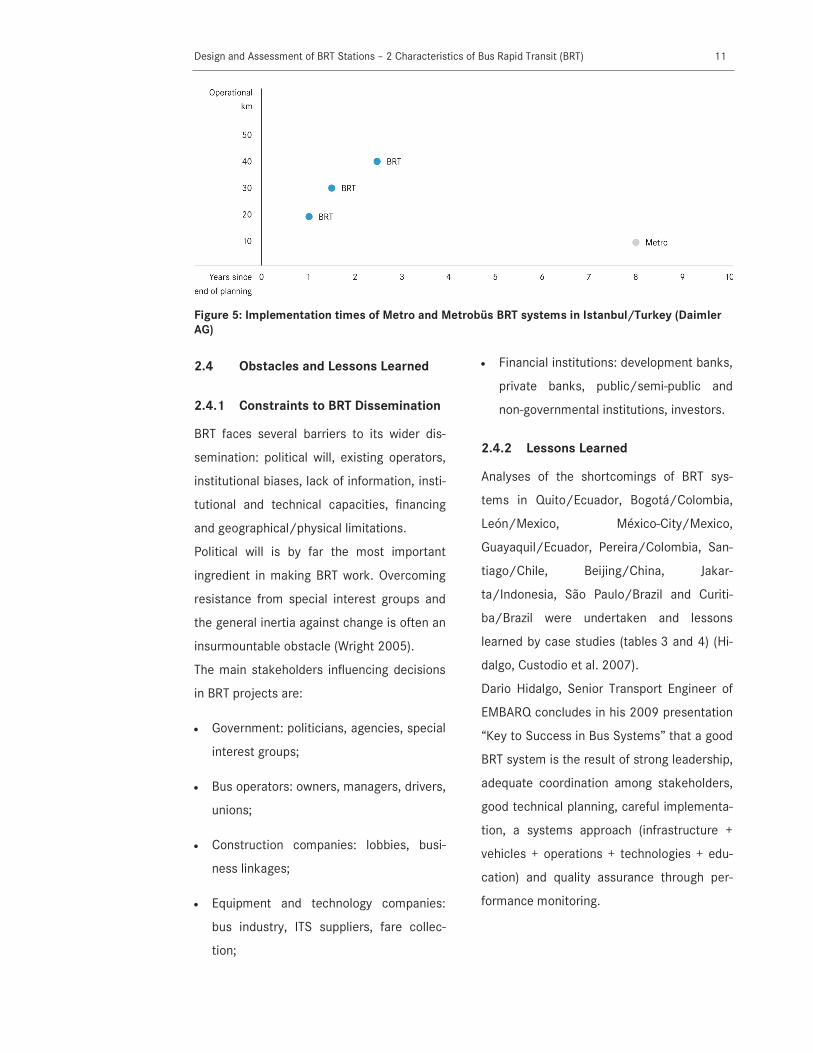
2.3.5 Fast and Flexible Implementation
Planning and implementation of BRT systems
require significantly less time than those of
LRT or Metro projects. In Istanbul/Turkey,
the planning phase took less than 12 months
(Fig. 5) (Daimler AG). This underlines BRT’s
potential to be a highly flexible mass rapid
transit system compared to other options.
Figure 4: Income groups in Bogotá/Colombia, and their coverage by TransMilenio (own illustration
based on ITDP 2007)
3%
12%
48%
38%
3%
17%
67%
18%
5%
7%
42%
44%
0% 10% 20% 30% 40% 50% 60% 70% 80%
Rich: 5 & 6
4
3
Poor: 1 & 2
Inco
me g
roup
s
Percentage of users per income group
Bogotá Total Population
TransMilenio Users 2001
TransMilenio Users 2003
Design and Assessment of BRT Stations – 2 Characteristics of Bus Rapid Transit (BRT) 11
2.4 Obstacles and Lessons Learned
2.4.1 Constraints to BRT Dissemination
BRT faces several barriers to its wider dis-
semination: political will, existing operators,
institutional biases, lack of information, insti-
tutional and technical capacities, financing
and geographical/physical limitations.
Political will is by far the most important
ingredient in making BRT work. Overcoming
resistance from special interest groups and
the general inertia against change is often an
insurmountable obstacle (Wright 2005).
The main stakeholders influencing decisions
in BRT projects are:
Government: politicians, agencies, special
interest groups;
Bus operators: owners, managers, drivers,
unions;
Construction companies: lobbies, busi-
ness linkages;
Equipment and technology companies:
bus industry, ITS suppliers, fare collec-
tion;
Financial institutions: development banks,
private banks, public/semi-public and
non-governmental institutions, investors.
2.4.2 Lessons Learned
Analyses of the shortcomings of BRT sys-
tems in Quito/Ecuador, Bogotá/Colombia,
León/Mexico, México-City/Mexico,
Guayaquil/Ecuador, Pereira/Colombia, San-
tiago/Chile, Beijing/China, Jakar-
ta/Indonesia, São Paulo/Brazil and Curiti-
ba/Brazil were undertaken and lessons
learned by case studies (tables 3 and 4) (Hi-
dalgo, Custodio et al. 2007).
Dario Hidalgo, Senior Transport Engineer of
EMBARQ concludes in his 2009 presentation
“Key to Success in Bus Systems” that a good
BRT system is the result of strong leadership,
adequate coordination among stakeholders,
good technical planning, careful implementa-
tion, a systems approach (infrastructure +
vehicles + operations + technologies + edu-
cation) and quality assurance through per-
formance monitoring.
Figure 5: Implementation times of Metro and Metrobüs BRT systems in Istanbul/Turkey (Daimler
AG)

Design and Assessment of BRT Stations – 2 Characteristics of Bus Rapid Transit (BRT) 12
Table 3: Synthesis of findings from major bus system improvement projects in Latin America and
Asia (part I) (own illustration based on Hidalgo, Custodio et al. 2007)

Design and Assessment of BRT Stations – 2 Characteristics of Bus Rapid Transit (BRT) 13
Table 4: Synthesis of findings from major bus system improvement projects in Latin America and
Asia (part II) (own illustration based on Hidalgo, Custodio et al. 2007)
Design and Assessment of BRT Stations – 2 Characteristics of Bus Rapid Transit (BRT) 14
2.5 System Components
BRT is an integrated system, with all compo-
nents working together to optimise perfor-
mance. It is not a one-size-fits-all solution,
but rather an approach, tailored to a city’s
needs but with common features or princi-
ples. If certain features are left out of the
design, performance will decrease. Hence
planners may choose among component
groups to assemble systems that best meet
their city’s needs. There are three major
components of BRT systems:
Infrastructure: running ways, stations
(and facilities), terminals and depots
Buses
Operation: routing and service options,
fare collection and ITS, identity and im-
age.
2.5.1 Infrastructure
2.5.1.1 Running Ways
Running ways are the key element of BRT
systems around which all other components
revolve, as the running way defines where
BRT vehicles travel. The definition of running
ways for the BRT system has major impact
on the entire system. They are the most crit-
ical element in determining the speed and
reliability of BRT services. Moreover, the
construction of the running ways represents
approximately 50% of the total infrastructure
costs (FTA 2009a).
Running Way Segregation Types
The primary planning parameter for running
ways is the level of separation from other
traffic. Running way options range from gen-
eral traffic lanes to fully grade-separated BRT
busways. Table 5 summarises the range of
options.
Apart from physical separation, the effect of
running ways is also determined by two other
components: decisions have to be taken
regarding access and types of vehicles. If
there are no restrictions on operators’ ac-
cess or the types of vehicles allowed, run-
ning ways may perform inefficiently. As more
vehicles enter the busway, the resulting con-
gestion at stations and intersections will
gradually reduce average speeds and thus
increase customer travel times. Based on an
operating concept, limiting access up to an
optimum number of operators and vehicles
can help ensure the essential objectives of
BRT systems: speed, reliability, capacity as
well as identity and image. Considering the
organisation of BRT operation and infrastruc-
ture design, BRT systems could be defined as
open or closed systems (although the divi-
Table 5: BRT running ways classified by degree of segregation (own illustration based on TCRP
2003b)
Design and Assessment of BRT Stations – 2 Characteristics of Bus Rapid Transit (BRT) 15
sion is not clearly delineated). Both have
advantages and disadvantages regarding
impact on average vehicle speeds, customer
travel times and comfort.
Closed Systems
Systems that limit access to designated op-
erators are known as closed systems. Typi-
cally, access is granted to carefully selected
operators through a competitive selection
process. The busway is exclusively reserved
for BRT buses and separated from other traf-
fic by some form of physical barrier, such as
raised cement blocks or pylons. Busways can
be at-grade or grade separated. At-grade
refers to busways eventually crossing
through signalised intersections while grade-
separated systems are constructed in a
manner completely separating them from
potential conflicts with other traffic, e.g. via
overpasses, underpasses or – like the BRT in
Istanbul/Turkey – running separate from
other lanes along a highway (without inter-
sections). Closed systems tend to operate
high-capacity vehicles that will likely result in
service being provided every three minutes,
with average commercial speeds of
25 kilometres per hour or higher (ITDP
2007). The BRT in Istanbul even reaches an
average commercial speed of 40 kilometres
per hour. Closed systems have the ad-
vantage of creating a clear marketing identity
when using special buses, a simple metro-
like map of routes, and hence form a fully
separated system, usually served by feeder
buses. Due to the positive impact on cus-
tomer perception linked to these characteris-
tics, the BRT systems with the highest capac-
ity and operating speeds have all been de-
signed as closed systems.
Open Systems
The busways in open systems are designed
for the utilisation by BRT buses and eventual-
ly other public transport systems and special
groups (police, ambulances, etc.). Bus lanes
are separated from other traffic either by
painted lines or poor enforcement of pre-
venting traffic entering the system, which
can undermine free-flow movement of buses
and thus reduce travel time advantages.
Without any rationalisation of existing ser-
vices, open systems can lead to severe con-
gestion in the bus lanes. Open systems tend
to lack a clear marketing identity, and remain
unrecognised as a system by the general
public as usually normal buses that also op-
erate citywide are used.
Bus Lanes/Busway Configurations
The configuration of any particular bus lane
or busway depends on the width of streets,
the amount of mixed traffic, pedestrians,
bicycles and frequency of buses within and
outside the BRT system.
Basically, bus lanes and busways can be
placed either in median or kerbside posi-
tions:
Median lanes: this concept reduces turn-
ing conflicts, and provides more integra-
tion options with crossing busway-routes
in other streets. It is the most commonly
applied option for BRT systems world-
wide.
Kerbside lanes: this configuration only
functions well if at least one side of a
Design and Assessment of BRT Stations – 2 Characteristics of Bus Rapid Transit (BRT) 16
road has few turns and slip roads to adja-
cent properties (e.g. favourable situations
when a road runs parallel to a body of wa-
ter or large park) or comprises significant-
ly fewer lanes. Primarily, kerbside running
ways cause conflicts with turning traffic,
taxis, delivery vehicles and non-motorized
traffic stopping. Such conflicts inhibit sys-
tem capacity and reliability.
Streets exclusively for BRT: in situations
with narrow road widths, such as in cen-
tral business districts or historical cen-
tres, access is permitted for BRT buses or
non-motorized traffic only.
A standard vehicle lane width is typically
3.5 metres; however, lanes can be as narrow
as 3.0 metres. More narrow lanes tend to
reduce speeds and increase the risk of acci-
dents (ITDP 2007).
Bus Lanes or Busways at Stations
A further consideration is the configuration
of busways at stations. Under certain condi-
tions it is recommended that BRT corridors
should be equipped with passing-lanes:
In BRT systems with very high passenger
demand (over 10,000 passengers per
hour per direction [pphpd]) (Wright 2005);
In order to provide local and express ser-
vice (buses not stopping at every station);
When the station has more than a single
loading area in linear configuration, vehi-
cles should be able to pass one another
at the stations.
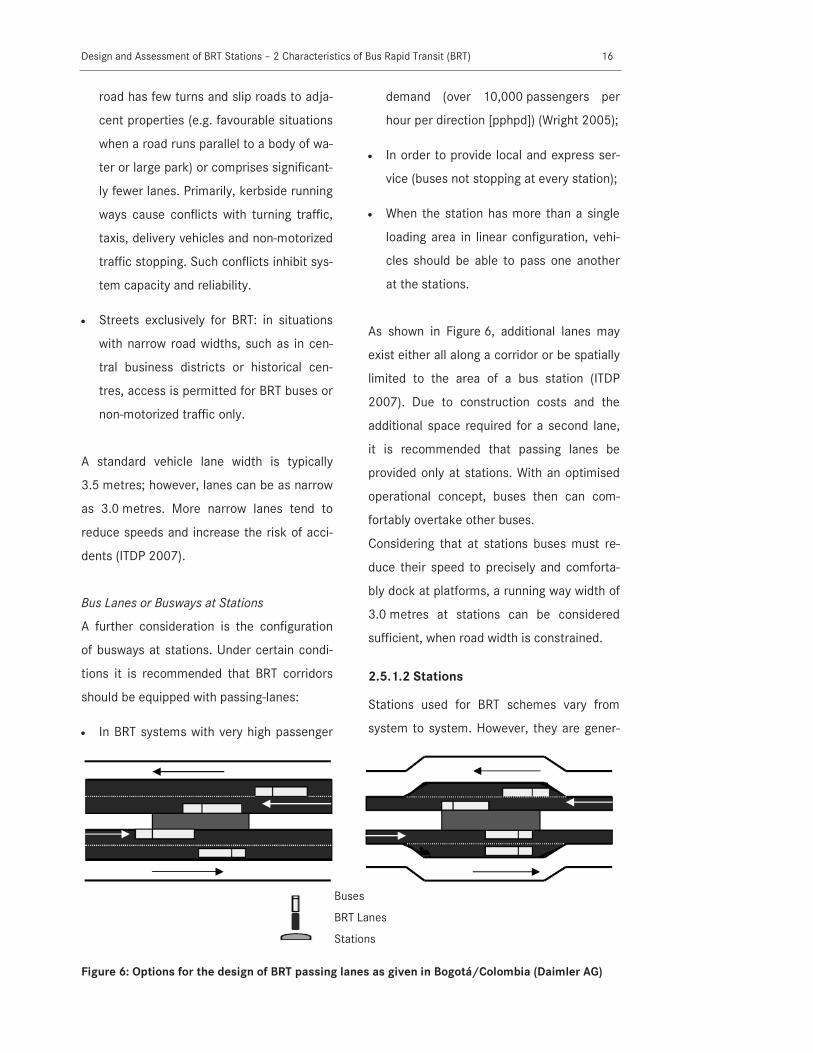
As shown in Figure 6, additional lanes may
exist either all along a corridor or be spatially
limited to the area of a bus station (ITDP
2007). Due to construction costs and the
additional space required for a second lane,
it is recommended that passing lanes be
provided only at stations. With an optimised
operational concept, buses then can com-
fortably overtake other buses.
Considering that at stations buses must re-
duce their speed to precisely and comforta-
bly dock at platforms, a running way width of
3.0 metres at stations can be considered
sufficient, when road width is constrained.
2.5.1.2 Stations
Stations used for BRT schemes vary from
system to system. However, they are gener-
Figure 6: Options for the design of BRT passing lanes as given in Bogotá/Colombia (Daimler AG)
Buses
BRT Lanes
Stations

Design and Assessment of BRT Stations – 2 Characteristics of Bus Rapid Transit (BRT) 17
ally of a more advanced nature than those
typically used for conventional bus services,
ideally combining state-of-the-art passenger
information technology with the comfort and
convenience of rail stations, along with im-
proved safety and fare collection systems.
Location
A key element in improving bus transit effi-
ciency, convenience and safety is the station
location. The selection of the location for a
station is the result of a rational analysis
process and in the course of this work as-
sumed to be a given condition. It involves the
analysis of origins and destinations of travel,
access to primary destinations such as
shopping complexes, residential or employ-
ment centres, educational centres, etc. The
integration with new or expanding commer-
cial and institutional developments should be
encouraged, too. Therefore, only a brief de-
scription of the factors to consider for the
selection of station locations is given here. A
wide-ranging description about station ele-
ments and design issues follows in chap-
ters 3 and 4.
After the ridership potential has been estab-
lished and the general location is decided
(Wright 2005), critical factors to be consid-
ered in finding station locations are safety
and other risks that could otherwise obstruct
passenger access to stations. This includes
connections to other public transport modes,
passenger walking distances, signal timing,
driveway locations, physical obstructions,
and the potential for implementing transit
preferential measures. The final decision on
a bus station’s location depends on several
safety and operating elements that require
on-site evaluation. In general, placing sta-
tions in prominent, visible locations will in-
crease their presence, security and utilisa-
tion. The optimum distance between stations
is a trade-off between demand at key loca-
tions and the time penalty incurred to the
total trip time. A standard distance between
stations is around 500 metres but can range
from 300 to 1000 metres (VDV 2001; ITDP
2007), depending upon local circumstances.
Another option is to define optimum station
distances by calculating catchment areas
measured in travel time. A walking time of
approximately five minutes is considered an
acceptable value for ensuring accessibility.
More detailed measures, particularly the
analysis and adjustment of service coverage,
usually require geographic information sys-
tem (GIS) software. Results can be used to
optimally match accessibility, spatial cover-
age and urban structures.
Design and Assessment of BRT Stations – 2 Characteristics of Bus Rapid Transit (BRT) 18
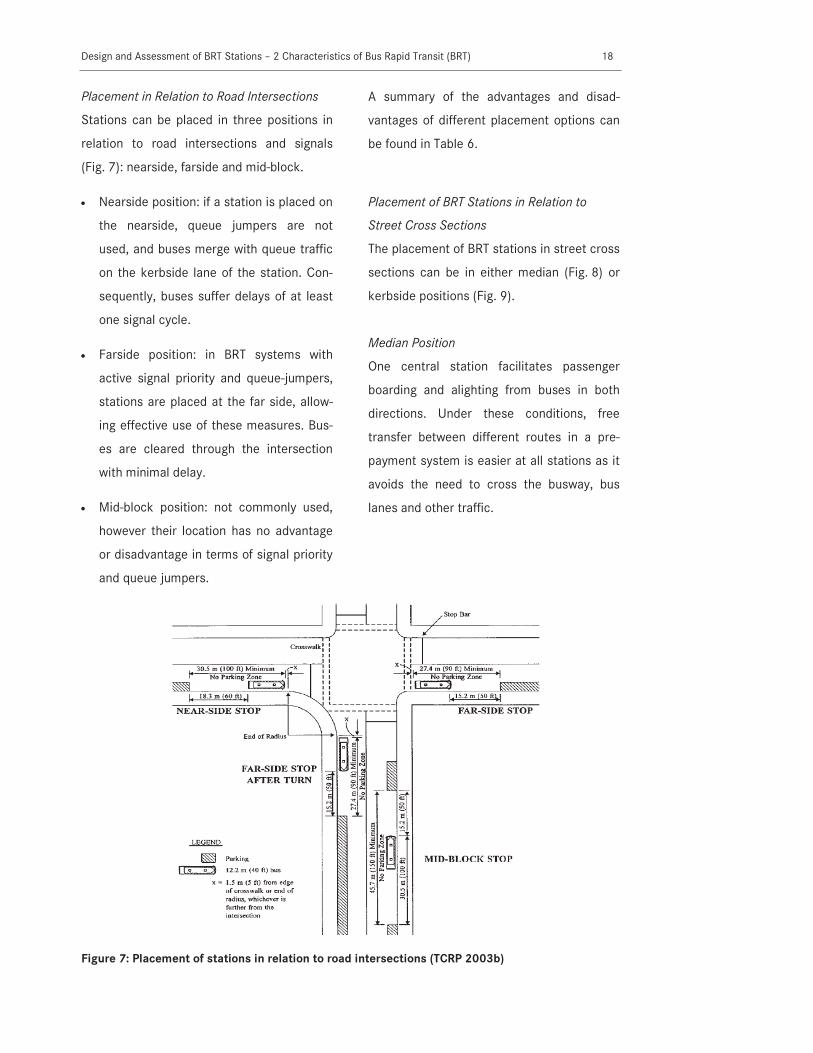
Placement in Relation to Road Intersections
Stations can be placed in three positions in
relation to road intersections and signals
(Fig. 7): nearside, farside and mid-block.
Nearside position: if a station is placed on
the nearside, queue jumpers are not
used, and buses merge with queue traffic
on the kerbside lane of the station. Con-
sequently, buses suffer delays of at least
one signal cycle.
Farside position: in BRT systems with
active signal priority and queue-jumpers,
stations are placed at the far side, allow-
ing effective use of these measures. Bus-
es are cleared through the intersection
with minimal delay.
Mid-block position: not commonly used,
however their location has no advantage
or disadvantage in terms of signal priority
and queue jumpers.
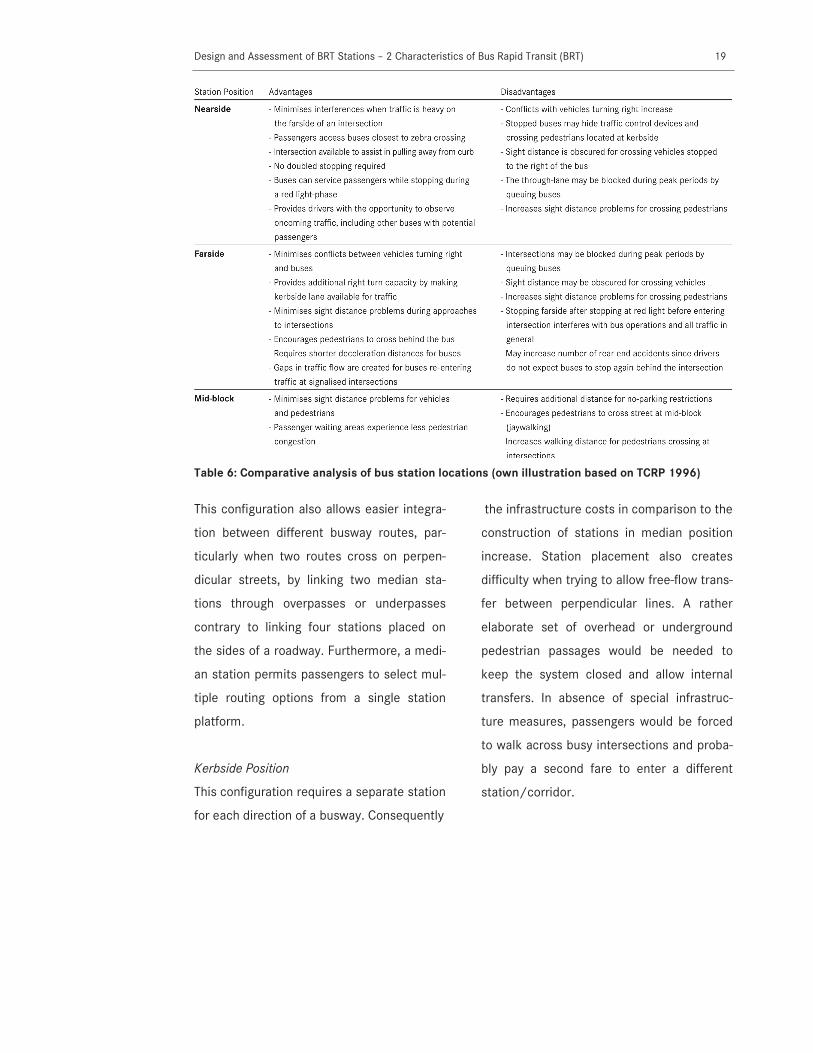
A summary of the advantages and disad-
vantages of different placement options can
be found in Table 6.
Placement of BRT Stations in Relation to
Street Cross Sections
The placement of BRT stations in street cross
sections can be in either median (Fig. 8) or
kerbside positions (Fig. 9).
Median Position
One central station facilitates passenger
boarding and alighting from buses in both
directions. Under these conditions, free
transfer between different routes in a pre-
payment system is easier at all stations as it
avoids the need to cross the busway, bus
lanes and other traffic.
Figure 7: Placement of stations in relation to road intersections (TCRP 2003b)
Design and Assessment of BRT Stations – 2 Characteristics of Bus Rapid Transit (BRT) 19
This configuration also allows easier integra-
tion between different busway routes, par-
ticularly when two routes cross on perpen-
dicular streets, by linking two median sta-
tions through overpasses or underpasses
contrary to linking four stations placed on
the sides of a roadway. Furthermore, a medi-
an station permits passengers to select mul-
tiple routing options from a single station
platform.
Kerbside Position
This configuration requires a separate station
for each direction of a busway. Consequently
the infrastructure costs in comparison to the
construction of stations in median position
increase. Station placement also creates
difficulty when trying to allow free-flow trans-
fer between perpendicular lines. A rather
elaborate set of overhead or underground
pedestrian passages would be needed to
keep the system closed and allow internal
transfers. In absence of special infrastruc-
ture measures, passengers would be forced
to walk across busy intersections and proba-
bly pay a second fare to enter a different
station/corridor.
Table 6: Comparative analysis of bus station locations (own illustration based on TCRP 1996)

Design and Assessment of BRT Stations – 2 Characteristics of Bus Rapid Transit (BRT) 20
BRT Station Types
There are many possibilities of classifying
BRT stations. In this handbook, the following
categorisation was applied:
Simple stations: located along trunk
routes and served by a single BRT line in
one or both directions without transfer
possibility to other routes. Passengers
must have a ticket to enter the BRT sys-
tem.
Interchange stations: located along trunk
routes and served by more than one BRT
line, permitting transfers between differ-
ent trunk lines as well as transfer be-
tween trunk and feeder lines. The objec-
tive of developing these stations focuses
on smooth, fast and effective transfer of
the passengers.
Main line stations/terminals: these sta-
tions are located at the end points of
trunk routes and serve more than one
BRT line. These stations act as transfer
points between trunk and feeder lines and
- if applicable - with other (public)
transport modes. Terminals are provided
with parking lots and other infrastructure
facilities.
Figure 8: Median-side station at median lanes (Daimler AG)
Figure 9: Kerbside stations: at kerb lanes (left) and at median lanes (right) (Daimler AG)
Buses
BRT Lanes
Stations
Buses
BRT Lanes
Stations
Design and Assessment of BRT Stations – 2 Characteristics of Bus Rapid Transit (BRT) 21
2.5.1.3 Depots
Bus depot areas are used to park and main-
tain buses that are not in use. Usually depots
comprise refuelling facilities, maintenance
areas and office space for bus operators. The
location of a bus depot is ideally within close
proximity of the actual system, since opera-
tors need to rapidly deploy buses either to
meet peak demand, provide replacements
upon vehicle breakdown or other unforeseen
events. However, since bus depots can con-
sume considerable space, site selection of-
ten depends on the economics of acquiring
sufficient property (Wright 2005).
2.5.2 Buses
Key considerations in the design of BRT vehi-
cles are: sufficient capacity, ease of passen-
ger boarding and alighting, improved com-
fort, adequate circulation space, reduced
noise and emissions (TCRP 2003a). Buses
are the core element of BRT systems, in
which customers spend most of their time,
and are one of the most visible system ele-
ments to non-customers. They can play an
important role in successful branding (FTA
2009a).
2.5.3 Bus Configuration
The primary vehicle planning/design param-
eters are represented by the combination of
length, passenger capacity, body type, and
floor height. All of these parameters affect
the vehicle’s ability to transport passengers
efficiently and with reasonable comfort.
High-capacity (e.g. articulated) buses on
heavily frequented routes can achieve an
optimum balance between frequent bus ser-
vice for passengers and efficient bus opera-
tions without having buses queuing at sta-
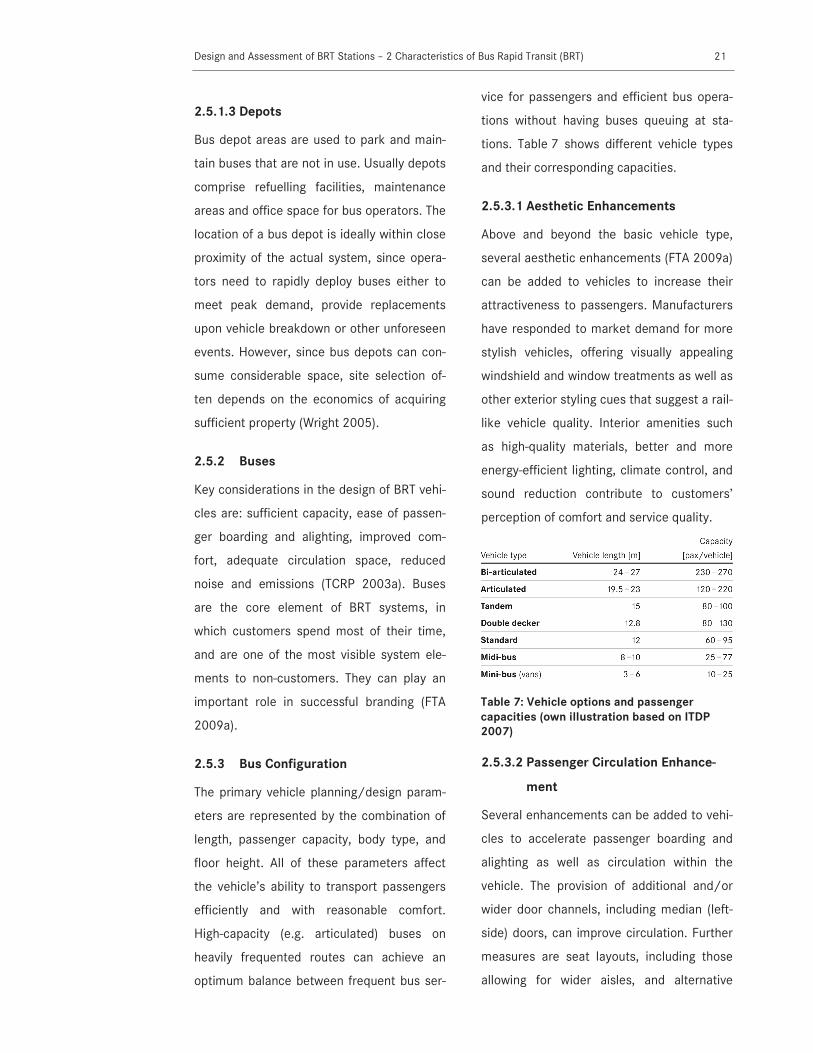
tions. Table 7 shows different vehicle types
and their corresponding capacities.
2.5.3.1 Aesthetic Enhancements
Above and beyond the basic vehicle type,
several aesthetic enhancements (FTA 2009a)
can be added to vehicles to increase their
attractiveness to passengers. Manufacturers
have responded to market demand for more
stylish vehicles, offering visually appealing
windshield and window treatments as well as
other exterior styling cues that suggest a rail-
like vehicle quality. Interior amenities such
as high-quality materials, better and more
energy-efficient lighting, climate control, and
sound reduction contribute to customers’
perception of comfort and service quality.
2.5.3.2 Passenger Circulation Enhance-
ment
Several enhancements can be added to vehi-
cles to accelerate passenger boarding and
alighting as well as circulation within the
vehicle. The provision of additional and/or
wider door channels, including median (left-
side) doors, can improve circulation. Further
measures are seat layouts, including those
allowing for wider aisles, and alternative
Table 7: Vehicle options and passenger
capacities (own illustration based on ITDP
2007)
Design and Assessment of BRT Stations – 2 Characteristics of Bus Rapid Transit (BRT) 22
wheelchair positions. The characteristics of
the BRT vehicle doors are a key factor for the
estimation of the station capacity in buses
per hour. Detailed considerations follow in
chapters 3 and 4.
2.5.3.3 Intelligent Vehicle Systems
Intelligent Vehicle Systems (IVS) comprises
technologies such as automated controls –
lateral (i.e. steering) and longitudinal (i.e.
starting, speed control, stopping) – for BRT
vehicles. They reduce the probability and
severity of crashes and collisions, running
and station dwell times by consistently
achieving small gaps at stations, facilitating
level boarding. Furthermore, precision dock-
ing and lane-assist technologies can help
reduce the lane width required to operate
BRT vehicles (Baltes 2007). Guidance sys-
tems can be mechanical (e.g. BRT systems in
Leeds/UK; Adelaide/Australia; Nan-
cy/France), optical (e.g. Rouen/France), or
magnetic (e.g. Eindhoven/Netherlands).
2.5.3.4
Propulsion System
Spurred by the evolution of clean air regula-
tions, the number of choices in vehicle pro-
pulsion systems is increasing. Technology is
evolving to provide new systems that use
cleaner, alternative fuels and new controls
on emissions, resulting in reduced pollution
and lower noise emissions. As new technolo-
gies are being introduced, market conditions
such as demand and production costs are
evolving.
2.5.3.5 Emission Standards for Heavy-
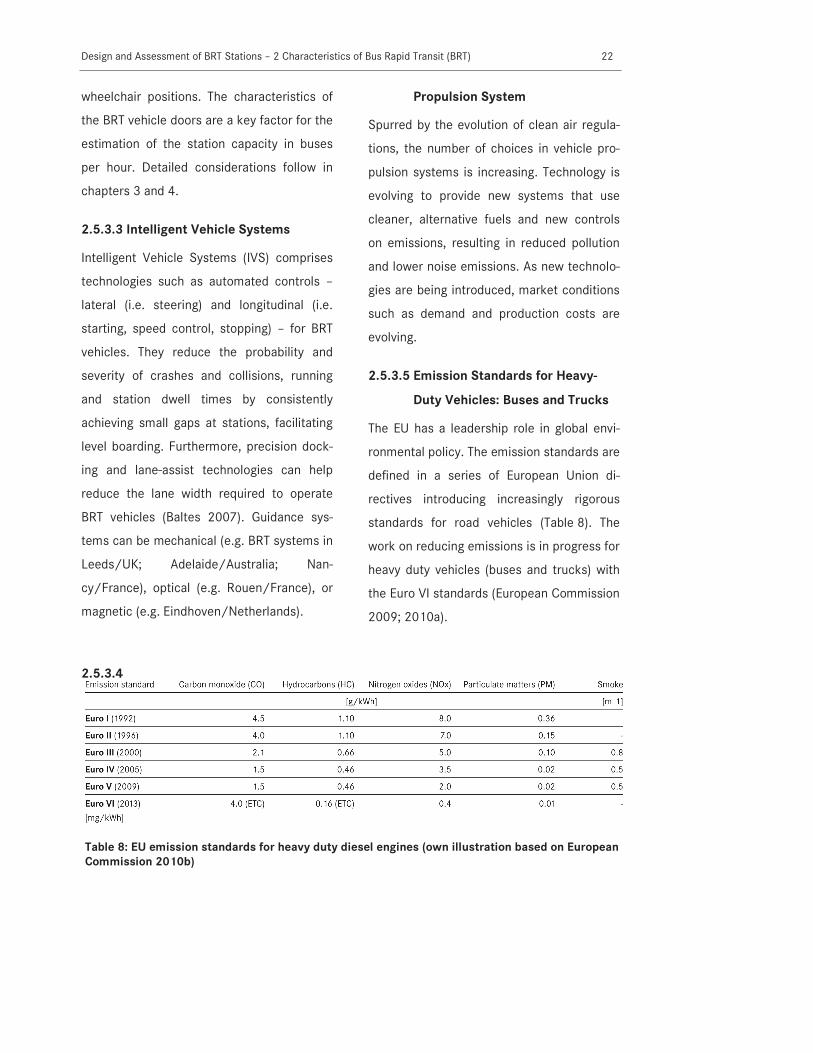
Duty Vehicles: Buses and Trucks
The EU has a leadership role in global envi-
ronmental policy. The emission standards are
defined in a series of European Union di-
rectives introducing increasingly rigorous
standards for road vehicles (Table 8). The
work on reducing emissions is in progress for
heavy duty vehicles (buses and trucks) with
the Euro VI standards (European Commission
2009; 2010a).
Table 8: EU emission standards for heavy duty diesel engines (own illustration based on European
Commission 2010b)

Design and Assessment of BRT Stations – 2 Characteristics of Bus Rapid Transit (BRT) 23
2.5.4 Operational Issues
2.5.4.1 Operational Procedures
Providing public transport service to all major
residential and commercial sectors of a city
can be challenging from a standpoint of sys-
tem efficiency and cost-effectiveness. Serv-
ing the densest portions of the city often
requires high-capacity vehicles, while lower-
density residential areas may be most eco-
nomically served with smaller vehicles. The
relationship between trunk line corridors and
feeder lines from smaller communities also
impacts BRT system routing. Matching route
structures to bus and throughput capacities
will affect system cost-effectiveness, bus
specifications and service frequency.
Trunk-Feeder Services
Larger buses service the principal corridors
and operate mostly in segregated running
ways. At the endpoints of these corridors,
integrated terminal stations allow the effi-
cient transfer to smaller feeder buses (oper-
ating in mixed traffic lanes) that continue
into smaller communities. The principal ben-
efit is an improved possibility to match bus
sizes and spatially differentiated passenger
demand; the disadvantage is that passengers
have to transfer. In addition, this type of
routing may result in longer trip times and
extra costs in case of absence of an inte-
grated ticketing system. Another disad-
vantage is the need to construct transfer
terminals or intermediate transfer stations,
which are likely to be more costly than
standard stations without transfer possibili-
ties.
Direct Services
Buses with different ultimate routes all run in
the same line corridor. At a certain point,
each of these buses leaves the main corridor
and continues into individual routes, with or
without segregated busways. The principal
benefit is that fewer passengers require
transfers between routes, making it possible
for vehicles to function both as feeder and
trunk service in one trip, carrying passengers
from residential areas directly into trunk
corridors. This technique provides a concen-
tration of service on high-demand corridors,
while permitting different bus types to enter
smaller communities without a need to trans-
fer. Thus terminal stations with transfer facil-
ities are not required. The disadvantage is
that it may produce an oversupply of bus
seating on the feeder portion of the route,
especially if large buses are utilized. If the
population density changes and the demand
between main and feeder lines is less varia-
ble, then the convoy technique (a group of
buses travelling together with similar opera-
tion) can be the better option.
Express and Limited Stop Service
A BRT service can also include an overlaid
express or semi-express operation as a sup-
plement to an all-stops service. This type of
operation can provide quicker service on
trips running longer distance but is usually
only justified when passenger demand is
high enough to support both types of ser-
vices operating at rapid transit frequencies.
Typically this service is provided during peak
hours only and can be applied to either a BRT
busway or bus lane. A passing lane at sta-

Design and Assessment of BRT Stations – 2 Characteristics of Bus Rapid Transit (BRT) 24
tions is required, to allow express vehicles to
bypass vehicles in all-stop operation at a
station not served by express service.
2.5.4.2 Fare Collection and Verification
One component influencing travel time and
system efficiency is fare collection and veri-
fication (ITDP 2007). Principally there are
two concepts of fare collection systems: off-
board and on-board.
In general the time required for on-board fare
collection slows bus operations significantly.
In BRT system design, fare collection policy
should therefore focus on bus dwell time and
passenger convenience. Moving all fare col-
lection off the bus offers the greatest poten-
tial to reduce dwell times. Consequently, fare
payment time is reduced to zero and all
doors of a bus docking can be used for load-
ing and unloading simultaneously.
Off-Board Systems: Controlled Access
One of the advantages of off-board fare col-
lection and verification systems is that when
entering an enclosed bus station, passengers
pay travel fares and stay within the system
as long as they travel on one of the desig-
nated vehicles. Once inside the station, a
quick boarding and alighting of BRT buses is
possible, as well as free transfer to other
buses that stop at the same station. Through
controlled access, transparency of the fare
collection process and generation of reve-
nues through passenger count at turnstiles is
enhanced.
Although off-board fare collection is not nec-
essarily the only way to reduce boarding and
alighting times, there are institutional rea-
sons why this approach in general is consid-
ered successful in developing countries, as it
can overcome the problem of ineffective
ticket control and enforcement. However, a
disadvantage of this system is the need to
construct and operate off-board facilities like
ticket vending machines, cashier counters,
fare verification devices and turnstiles, which
all require both investment and physical
space.
Off-Board Systems: Proof-of-Payment or Hon-
our System
Passengers board with either a pass or a
validated ticket, and can be asked by inspec-
tors to show proof of payment at any time.
Inspectors randomly board buses and give
fines to passengers who cannot show the
required pass or ticket. The major advantage
of this approach is that the construction and
operation of off-board facilities is not re-
quired. A major disadvantage though is the
higher risk of fare evasion and the need for
additional staff to perform the inspections.
On-Board Systems
With the introduction of on-board fare verifi-
cation and collection systems, passengers
still need to pay inside the bus or have their
tickets verified or validated by a bus driver.
This procedure increases the boarding time
compared to off-board systems. The principal
advantage of this system is that enclosed
stations are not needed and thus infrastruc-
ture costs and physical space consumption
are reduced.
However, for transfers, passengers might be
required to purchase new tickets after each
transfer. To solve the problem of additional
transfer costs, a free transfer system should

Design and Assessment of BRT Stations – 2 Characteristics of Bus Rapid Transit (BRT) 25
be introduced, for instance by introducing
smart-card ticketing systems or enclosed
stations.
An analysis of the fare collection system and
its integration into station design is given in
chapters 3 and 4.
2.5.5 Intelligent Transport Systems
ITS (FTA 2009a) applications are designed to
monitor bus performance, systematically
allow traffic signal priorities, provide real-
time passenger information, accelerate fare
collection, improve surveillance and security,
facilitate precise docking at BRT stations and
other related functions.
Signal Priority
In order to ensure rapid operation in urban
corridors, the signal priority function of an
ITS helps give ROW preference to BRT buses
at intersections or sections of roadways.
Signal priority improves schedule adherence,
reduces travel times and delays for passen-
gers and consequently may attract new rid-
ers. Further, the transit capacity is increased
and the quality of transit service improved. A
variety of signal priority treatments exist for
different applications with different effects
(Table 9).
Researchers examined the impacts of traffic
signal priority (TSP) on travel time, reliability
(schedule adherence), operating costs and
general traffic in several cities in the USA
and other countries, showing that benefits
vary, depending on the type and degree of
application (Table 10).
Table 9: Common signal priority treatments for public transport (own illustration based on TCRP
2003c)

Design and Assessment of BRT Stations – 2 Characteristics of Bus Rapid Transit (BRT) 26
Operations Management Systems
Public transport operations software applica-
tions of different complexity assist agencies
with functions like computer-aided dispatch-
ing, automatic vehicle location (AVL), auto-
mated scheduling and vehicle/crew assign-
ment, automated passenger counters and
vehicle component monitoring systems.
These systems offer the advantage of quick-
er response to service disruptions and emer-
gencies (FTA 2009a).
Passenger Information
Passenger information systems provide pas-
sengers with relevant information regarding
the status of the BRT and services. These
systems improve the passenger satisfaction
and reduce the subjective waiting time. Con-
sequently passenger information systems
increase the ridership potential.
Passenger information can be provided ei-
ther in static or real-time form. Another cat-
egorisation of information provision can be
made based on the location of the passenger
within the travel chain: pre-trip, en-route,
station/terminal, and in-vehicle. These sys-
tems disseminate information via a variety of
media including internet, wireless devices,
kiosks, dynamic message signs (DMS), on-
board electronic signs, public address sys-
tem, or interactive voice response (IVR) sys-
tem. A detailed discussion of passenger in-
formation at stations follows in chapters 3
and 4.
Electronic Fare Collection
Electronic fare collection technologies are
used to enable fast, cashless interfaces for
passengers to reduce dwell times and in-
crease the passenger convenience. Common
carriers are magnetic stripe cards and
smartcards.
Other Technologies
There are numerous other systems to sup-
port management, passengers and other
functions, for example, the use of archived
data and automatic passenger counts to
support management and planning efforts for
operating and optimising a BRT fleet. Silent
alarms and monitoring systems can improve
security functions and help to increase pas-
senger satisfaction.
2.5.5.1 Identity and Image
The negative image of existing general bus-
based systems is a considerable barrier to
overcome in promoting the BRT concept. The
Table 10: Reported initial estimates of benefits to buses from TSP (own illustration based on
Chang, Collura et al. 2003; TCRP 2003a; TCRP 2003c)
Design and Assessment of BRT Stations – 2 Characteristics of Bus Rapid Transit (BRT) 27
image of BRT and its attributes therefore
should be clearly expressed through the
marketing of its specific features and bene-
fits (FTA 2009b). Marketing should include
the consistent use of logos, colour and
branding throughout every component such
as vehicles, stations and maps. Marketing
should also emphasise the unique service
and properties of BRT such as speed, clean
vehicles, reliability, segregation from traffic
and community identity.
The BRT image is the consumer’s overall
perception of the style, aesthetics and com-
patibility of the system, determining its sta-
tus among other public transport options. To
increase BRT’s appeal to passengers, it is
important to establish an image and identity
clearly differentiated from the conventional
local bus services.
Attractive running ways and modern, com-
fortable vehicles and stations convey the
idea that BRT service provides the style,
amenities and capacity of rail. Image can
also be enhanced with distinct and highly
visible design features. Design that comple-
ments the brand identity of a BRT system
can strengthen the service’s image and rein-
force the core marketing message aimed at
passengers. Most BRT systems have stations
with design cues to distinguish BRT routes
from regular local bus service. Unique, eye-
catching architecture and design elements
can also be used to indicate where to gain
access to the system. Elements of BRT sta-
tions that may contribute to a positive image
are discussed in more detail in chapters 3
and 4.
If you are interested in the full version of the BRT handbook please contact:

As
of 0
6/20
12
Desi
gn a
nd A
sses
smen
t of B
RT S
tatio
ns
Design and Assessment of BRT Stations Eliana Chila | Richard Mejía | Matthias Hoffmann
www.mercedes-benz.com/brt
EvoBus GmbH, Neue Straße 95, 73230 Kirchheim unter Teck
BRT Handbuch Umschlag neues CI.indd 2-3 17.05.13 10:56
Top Related