


Languages
Pages
Legal


Master’s thesisPhysical Geography and Quaternary Geology, 60 Credits
Department of Physical Geography
Diatom distribution in the lower Save River, Mozambique
Taxonomy, salinity gradient and taphonomy
Marie Christiansson
NKA 1562016

Preface
This Master’s thesis is Marie Christiansson’s degree project in Physical Geography and
Quaternary Geology at the Department of Physical Geography, Stockholm University. The
Master’s thesis comprises 60 credits (two terms of full-time studies).
Supervisor has been Jan Risberg at the Department of Physical Geography, Stockholm
University. Examiner has been Stefan Wastegård at the Department of Physical Geography,
Stockholm University.
The author is responsible for the contents of this thesis.
Stockholm, 11 September 2016
Steffen Holzkämper
Director of studies


1
Abstract
In this study diatom distribution within the lower Save River, Mozambique, has been
identified from surface sediments, surface water, mangrove cortex and buried sediments.
Sandy units, bracketing a geographically extensive clay layer, have been dated with optical
stimulated luminescence (OSL). Diatom analysis has been used to interpret the spatial
salinity gradient and to discuss taphonomic processes within the delta. Previously, one study
has been performed in the investigated area and it is of great importance to continue to
identify diatom distributions since siliceous microfossils are widely used for
paleoenvironmental research. Two diatom taxa, which were not possible to classify to
species level have been identified; Cyclotella sp. and Diploneis sp. It is suggested that these
represent species not earlier described; however they are assigned a brackish water affinity.
Diatom analysis from surface water, surface sediments and mangrove cortex indicate a
transition from ocean water to a dominance of freshwater taxa c. 10 km upstream the delta
front. Further, ratios between marine/brackish taxa for samples from surface water and
surface sediments do not correspond. It is therefore suggested that diatoms in surface
sediments underestimate prevailing salinity conditions in water. In the investigated area
extensive taphonomic processes seem to have large impact on diatom frustules in sediments
and may bias interpretations. Therefore it is recommended to carefully investigate geology,
geomorphology and vegetation before diatom analysis is applied in studies of delta
paleoenvironments.
2
Table of contents Abstract ................................................................................................................................................... 1
Table of contents ..................................................................................................................................... 2
1. Introduction ........................................................................................................................................ 3
1.1 Objectives ...................................................................................................................................... 6
1.2 Background ................................................................................................................................... 6
1.2.1 Salinity stratification .............................................................................................................. 6
1.2.2 Diatoms .................................................................................................................................. 7
1.2.3 SEM/ESEM ............................................................................................................................. 9
1.2.4 OSL ......................................................................................................................................... 9
2. Description of the investigated area ................................................................................................ 10
3. Methodology..................................................................................................................................... 13
3.1 Siliceous microfossils................................................................................................................... 15
3.2 ESEM ........................................................................................................................................... 19
3.3 OSL .............................................................................................................................................. 19
4. Result and interpretation ................................................................................................................. 19
4.1 Surface water samples ................................................................................................................ 20
4.2 Surface sediment samples .......................................................................................................... 21
4.3 Mangrove cortex samples ........................................................................................................... 21
4.4 Buried sediments ........................................................................................................................ 28
4.5 Taxonomic remarks ..................................................................................................................... 38
5. Discussion.......................................................................................................................................... 41
5.1 Taxonomy .................................................................................................................................... 41
5.2 Salinity gradient .......................................................................................................................... 42
5.3 Taphonomy ................................................................................................................................. 44
5.4 OSL and radiocarbon dating ........................................................................................................ 49
5.5 Future studies ............................................................................................................................. 50
6. Conclusions ....................................................................................................................................... 51
7. Acknowledgement ............................................................................................................................ 52
8. References ........................................................................................................................................ 53
9. Appendix 1 ........................................................................................................................................ 69
10. Appendix 2 ...................................................................................................................................... 71
11. Appendix 3…………………………………………………………………………………………………………………………………76
12. Appendix 4…………………………………………………………………………………………………………………………………80
13. Appendix 5…………………………………………………………………………………………………………………………………81
14. Appendix 6………………………………………………………………………………………………………………….................82

3
1. Introduction
Research on past climate is required to forecast future global climate changes (e.g. Palmer &
Abbott, 1986; Shennan et al., 1993; Denys and de Wolf 1999; Zong & Horton, 1999; Church
et al., 2013). One aspect implies changes of the global mean sea level, which can involve
either a rise or a lowering affecting coastal environments, e.g. deltas (Tamura et al., 2012;
Church et al., 2013). A rising sea-level involves effects on wave-induced erosion,
tides and currents influencing shorelines and mangrove forests holding complex ecosystems
(Nicholls & Cazenave, 2010). A lowering could imply an increased erosion by fluvial
and terrestrial processes combined with effects on floras and faunas. As the global sea-level
has fluctuated over time, especially during the Quaternary (Lowe & Walker, 1997), changes
can be traced in coastal environments (Woodroffe, 1990). To increase knowledge of the
effects from approaching eustatic sea-level rise, past fluctuations should be
elaborated. Paleoenvironmental research is often hampered by chronological drawbacks (cf.
Andrews et al., 1999; Wang et al., 2013; Bala et al., 2016). Deltaic sediments have an
advantage since they may be dated by optically stimulated luminescence (OSL) as a
complement to radiocarbon dating (cf. Bishop et al., 2004; Zhao et al., 2008; Erginal et al.,
2009).
One potential approach to study paleo-climate and paleo-environment is analysis of siliceous
microfossils, mainly diatoms (e.g. Simonsen, 1969; Palmer & Abbott, 1986; Vos & de Wolf,
1993:1; Espinosa, 1994; Denys, 1999; Denys and de Wolf, 1999). As living diatoms are
sensitive to changes of salinity, pH and nutrition (Cooper, 1999; Jiang, et al., 2001; Hassan, et
al., 2006) and fossil frustules (shells) in sediments normally are well preserved (Ferguson
Wood, 1967), they may indicate environmental changes such as tidal currents, flooding
events and sea level fluctuations (Swan, 1983; Vos & de Wolf, 1988). Previous studies have
shown benefits of using diatom analyses to reconstruct these changes in delta environments
(cf. e.g. John, 1987; Zalat, 1995; Zong et al., 2009; Ellison, 2008; França et al., 2015). To
improve the interpretation of fossil diatoms, further investigations on recent assemblages
are beneficial as they are a key to understand fossil communities (John, 1987; Castro et al.,
2013; Zong & Horton, 1998; Zong et al., 2006). This study is thus focusing on diatom analysis
from surface material from the lower Save River, Mozambique, and factors that may affect

4
the interpretation of past diatom compositions. Here, the lower Save River include the delta
area and c. 70 km upstream.
Most of the global stratigraphic diatom investigations are from the northern hemisphere
(Holmgren et al., 2012). Along the east African coast, diatom studies are most frequently
conducted in South Africa (e.g. Schuette & Schrader, 1981; Talbot & Bate, 1987; Abrantes,
2000). Norström et al. (2012) conducted a paleoenvironmental study on the Macassa Bay,
Mozambique, which is located c. 150 km south of the investigated area. At present,
Massuanganhe et al. (2016a) is the only study from the Save River delta.
Parts of the Save River delta are occupied by mangrove forest, which is habitat for complex
ecosystems (e.g. Lugo & Snedaker, 1974; Burchett et al., 1984; Smith et al., 1991; Ball &
Pidsley, 1995; Lee, 1999). This vegetation is currently experiencing an increasing degradation
(Woodroffe & Grime, 1999; Santos et al., 2014; Chaudhuri et al., 2015), argued to be caused
by human activities (Bandeira et al., 2009; Erftemeijer & Hamerlynck, 2015) and/or by
changing coastal dynamics as a result of eustatic sea level fluctuations (e.g. Ellison &
Stoddart, 1991; Fujimoto et al., 1996; Behling et al., 2004; Reinhardt et al., 2010; Srivastava
& Farooqui, 2013). Therefore, researchers of previous studies on mangrove wetland
dynamics (e.g. Woodroffe et al., 1985; Ellison & Stoddart, 1991; Fujimoto et al., 1996)
encourage further studies on coastal areas to increase the understanding of processes
within these environments (Nicholls et al., 1999, Nicholls, 2004, Gedan et al., 2011).
Diatom frustules can be affected during sedimentation and after accumulation due to their
sensitivity to physical, biological and chemical changes, i.e. taphonomy (Round et al., 1990;
Bennion, 1995; Hillebrand & Sommer, 2000; Riviera & Diaz, 2004; Hassan et al., 2006;
Korhola, 2000). This phenomenon refers to processes affecting diatom frustules after their
death. Dynamic environments, such as deltas, imply several of these mechanisms, which can
bias the interpretation (Brzezinski et al., 1999; Kato et al., 2003; Ryves et al., 2013).
Sediment traps are often used to determine processes on taphonomy in an area (e.g. Kato et
al., 2003; Cameron, 1995). Comparisons between surface and fossil diatom taxa can,
however, also indicate taphonomic mechanisms (cf. Barker et al., 1999; Sawai, 2001). Ryves
et al. (2009) emphasize the importance of using living diatom assemblages (biocoenosis) and

5
fossil communities (thanatocoenosis) to analyze taphonomy, i.e. the connection between
present environment and the fossil signal. In tidal environments processes as erosion,
resuspension and redepositing of sediments occur on diurnal basis (de Blij et al., 2004).
Taphonomy involves e.g. breakage and/or repositioning of frustules. Breakage can occur
during both reworking and compaction of sediments. Biological and chemical processes
mainly include presence of roots and their uptake of dissolved silica. Dissolution of silica in
soil increases during high temperatures and bacterial activity (Struyf et al., 2005). Diatom
frustules can then be affected by chemical corrosion in varying extent (cf. Massuanganhe et
al., 2016a) as they have different thicknesses, thus thinly silicified diatoms are less resistant
(Castro et al., 2013; Ryves et al., 2013; Brzezinski et al., 1999; Jørgensen, 1955; Lewin, 1961).
Fossil diatom frustules can be of autochthonous or allochthonous origin. Identification of
origin of certain species may be useful in environmental studies, as it facilitates
interpretation and understanding of geomorphological processes. Marine planktonic species
are known to be allochthonous and represent the tidal water influence. Benthic freshwater
taxa are proposed to be autochthonous and characterize the input from the river (Vos & de
Wolf, 1993:1). Simonsen (1969) suggests benthic species to be autochthonous thus providing
the most reliable information. Taphonomic processes do, however, aggravate analysis of
allochthonous and autochthonous species (Andrews, 1972; Beyens & Denys, 1982; Vos & de
Wolf, 1993:1). Therefore, further studies of surface and fossil diatom assemblages are
required to increase knowledge about taphonomy and effects on diatom frustules.
Furthermore, there is a widespread problem with diatom taxonomy (species identification)
and corresponding ecology (Mann, 1999). To ensure accurate interpretations it is
recommended to carefully study the morphology under both light microscope and with SEM
Scanning Electron Microscope). In general, the study of environmental conditions in an
investigated area can be used to enhance literature information (John, 1987; Castro et al.,
2013; Zong & Horton, 1998; Zong et al., 2006; Mann, 1999).

6
1.1 Objectives
The main aims of present study are to increase knowledge about:
(i) diatom distribution in the lower Save River,
(ii) diatom taxonomy and ecology,
(iii) intrusion of marine water into the lower Save River,
(iv) taphonomic processes affecting the diatom flora.
1.2 Background
This study is an off-spring of the doctoral thesis by Elidio Massuanganhe (2016). In his thesis,
Massuanganhe used siliceous microfossils to evaluate geomorphological and environmental
dynamics within the Save River delta. His results, however, showed only scattered
occurrences of diatoms in the investigated sequences and therefore taphonomic processes
were discussed. In June 2015, an opportunity was opened to join during the field trip to the
area. In connection with this, a number a samples were collected in order to receive more
information on diatom distribution and taphonomic processes.
Four subjects are presented here as they are essential for the forthcoming results and
discussions.
1.2.1 Salinity stratification
Salinity in seawater is varying with depth as density increases with greater amounts of
dissolved salt. Between the surface water of low salinity and the saline deep water there is a
layer of rapid change in salinity, i.e. the halocline (Trujillo & Thurman, 2014). Accordingly,
different local stratification patterns arise in coastal areas. In dynamic environments such as
deltas, a vertical and horizontal salinity gradient is present from the river to the ocean
(Cameron & Pritchard, 1963; Pritchard, 1967). The stratification is fluctuating depending on
effects from mainly tides, waves, currents, rainfall in the catchment area and amount of
evaporation in the delta area. Amounts of suspended sediment do, however, also influence
the stratification since it increases the density (Semeniuk, 2016).

7
In delta environments with perennially flowing rivers, the landward part of the water can
consist of almost entirely freshwater. If the river flow is seasonally, a mixture from fresh- to
marine water is present. During intense river flows, plumes of freshwater can reach out into
the ocean. The stratification in the delta is thus depending on both seaward processes and
the features of the river (Haas, 1977; Geyer & Farmer, 1989; MacCready, 1999; Semeniuk,
2016).
During low tide the water in deltas is highly stratified with an almost vertical halocline and a
thinning of the freshwater layer towards the delta front. When high tide is present, marine
water is pressed further into the river channel and the halocline slightly decline landwards
(Largier, 1986; Largier, 1992). Flooding events imply a halocline with a steep gradient
landwards as freshwater pressure is high. During both high tide and floods, the freshwater
and brackish/marine water is mixed in a greater extent than during low tide (Largier &
Taljaard, 1991; Semeniuk, 2016). Estuaries with several river channels leading to the ocean
increase the complexity of mixing and stratification even more (Semeniuk, 2016).
1.2.2 Diatoms
These organisms have been studied since the late 18th century. The initial taxonomy work
was done during the early 19th century by Müller, Nitsch and Gray. Further fundamental
research was performed by e.g. Ehrenberg, Kützing, W.W. Smith, Gregory, Greville, Ralfs,
Donkin, Grunow, P.T. Cleve, A. Cleve-Van Heurck and Hustedt (Ferguson Wood, 1967).
Diatoms are siliceous microfossils and have cell-walls composed of amorphous hydrated
silica. They have two shells (also named frustules), which are attached to each other (Lowe &
Walker, 1997). The outer shape of the diatom frustule is divided into two groups; pennate or
centric. Pennate diatoms have bilateral symmetric valves and centric are radial symmetric.
Centric diatoms cannot move by themselves; however, some pennate diatoms are capable
of moving by the raphe structure (Round et al. 1990; Krammer & Lange-Bertalot, 2000).
These unicellular algae belong to Bacillariophyta (Brasier, 1980; Round et al., 1990), which is
the most species-rich group (Mann, 1999). The length of the frustules is generally between c.
5 and 2000 µm, but size can diverge, especially during the early and late stages of the life
cycle (Brasier, 1980; Round et al., 1990; Lowe & Walker, 1997).

8
Siliceous microfossils live in aquatic and semi-aquatic environments, both as planktonic and
benthic. Planktonic species are suspended in the pelagic zone and benthic are attached to
sediment surfaces and vegetation in the benthic zone. There are, however, benthic diatoms
which can be brought up into the plankton habitat through e.g. currents and winds. These
are referred to as tychoplanktonic species (Ferguson Wood, 1967; Round et al., 1990).
Diatoms can also be redeposited from their habitat through for example birds (Atkinson,
1980; Figuerola & Green, 2002) and boats (Hallegraeff & Bolch, 1992).
Access to light is an essential factor for diatoms. They are photosynthetic and grow in the
photic zone (Round et al., 1990). Diatom blooms, i.e. flourish of species, occur during
favorable conditions such as during the spring. Conditions, which imply access to light,
optimal temperature and pH, and access to silica, nitrogen and phosphorous are beneficial
for diatom reproduction (Furnas, 1990; Round et al., 1990; Martin-Jézéquel et al., 2000;
Litchman et al., 2008).
Diatoms have a significant role in the global carbon, silica and oxygen cycles and therefore
contributes to the global ecosystem primary production (e.g. Hsaio, 1988; Cota et al., 1991;
Glud et al., 2002). Furthermore, diatoms are alone accountable for a quarter of the inorganic
carbon (e.g. CO2) fixed in the oceans every year, nevertheless researchers have not clarified
all aspects of the complex processes which fix the inorganic carbon (Granum et al., 2005).
During phases of cell division in the diatom life cycle, silica is naturally dissolved and partly
used by other organisms and vegetation (Mann, 1999; Smetacek, 1999). When the diatom
cell divide, cell walls usually become significantly thinner as energy and silica are used to
form new frustules (Ehrlich & Newman, 2008). Diatoms reproduce through vegetative
division, which implies a cell division inside the parent cell. Therefore, daughter cells are
significantly smaller than parent cells. The new cells have one new frustule, which is formed
during the division, and one from the parent. Reduction of size of the parent cell thus occurs
during every reproduction. The life cycle of a diatom thus implies several stages of frustule
size, which is termed “size reduction series” and means young and old diatoms have
frustules reduced in size. This is an important factor to consider during diatom analysis
(Round et al., 1990; Falkowski & Knoll, 2007; Hense & Beckmann, 2015).

9
1.2.3 SEM/ESEM
Scanning Electron Microscopes (SEM) are microscopes which allow magnification to atomic
level. In SEM the chamber, where the sample for analysis is placed, is a gaseous vacuum
environment. Instead of light, which is used in a light-microscope, electrons are used in an
SEM to reflect the surface of the specimen. The microscope has a primary concentrated
electron ray which is used towards the sample. The secondary rays are collected and create
a detailed visualization of the surface of e.g. diatoms (Danilatos, 1993).
Environmental Scanning Electron Microscope (ESEM) has usually the same basics
specifications as SEM, but ESEM tolerates even higher pressure in the chamber. It also allows
the device to operate at conditions other than only high vacuum by using different sets of
detectors (Danilatos, 1988). SEM and ESEM are frequently used for investigate frustule
structures and identification to species level (cf. e.g. Siver et al. 2003; Ponander & Potapova,
2007).
1.2.4 OSL
Optically Stimulated Luminescence (OSL) dating relies on measurements of light
(luminescence) emitted from light sensitive electron traps in crystals, where quartz and
feldspar comprises the most commonly used mineral types (Lowe & Walker, 1997). OSL ages
ideally represents the timing of burial or last exposure to sunlight of sedimentary deposits
After burial the luminescence signal gradually accumulates due to background radiation
occurring in the surroundings of the deposit. When the minerals are exposed to sunlight the
luminescence signal is zeroed (Yukihara & McKeever, 2011; Preusser et al., 2008). For dating
applications, the luminescence signal is released in laboratory conditions through artificial
stimulation, during which the signal is measured and further related to a radioactive dose.
Stimulation with green light is typically used for quartz, whereas infrared light are used for
feldspar (Lowe & Walker, 1997; Yukihara & McKeever, 2011; Preusser et al., 2008). The
luminescence measurements are used to determine the amount of radiation the sample has
been exposed to during time of burial. For age calculations, the amount of dose is divided
with the rate of radioactive energy acting on the sample per year, also termed dose rate. The
dose rate can be measured in field or in laboratory (Preusser et al., 2008).
10
The luminescence signal can, however, be incompletely zeroed prior to deposition of the
sediment, also referred to as incomplete bleaching. This occurs when the minerals have not
been sufficiently exposed to sunlight, which results in an overestimation of the age of burial
since a signal is preserved. Transport by and/or deposition in water may also increase the
risk for incomplete bleaching. During age calculation, it should be considered whether these
factors are likely to have affected sediments and certain statistical approaches can detect if
samples are incomplete bleached. If so, several measurements of the absorbed dose are
made to investigate the dose distribution (Bailey & Arnold, 2006). Furthermore, sedimentary
water content in the samples collected for OSL dating can influence the dose rate and could
imply uncertainties for the final age.
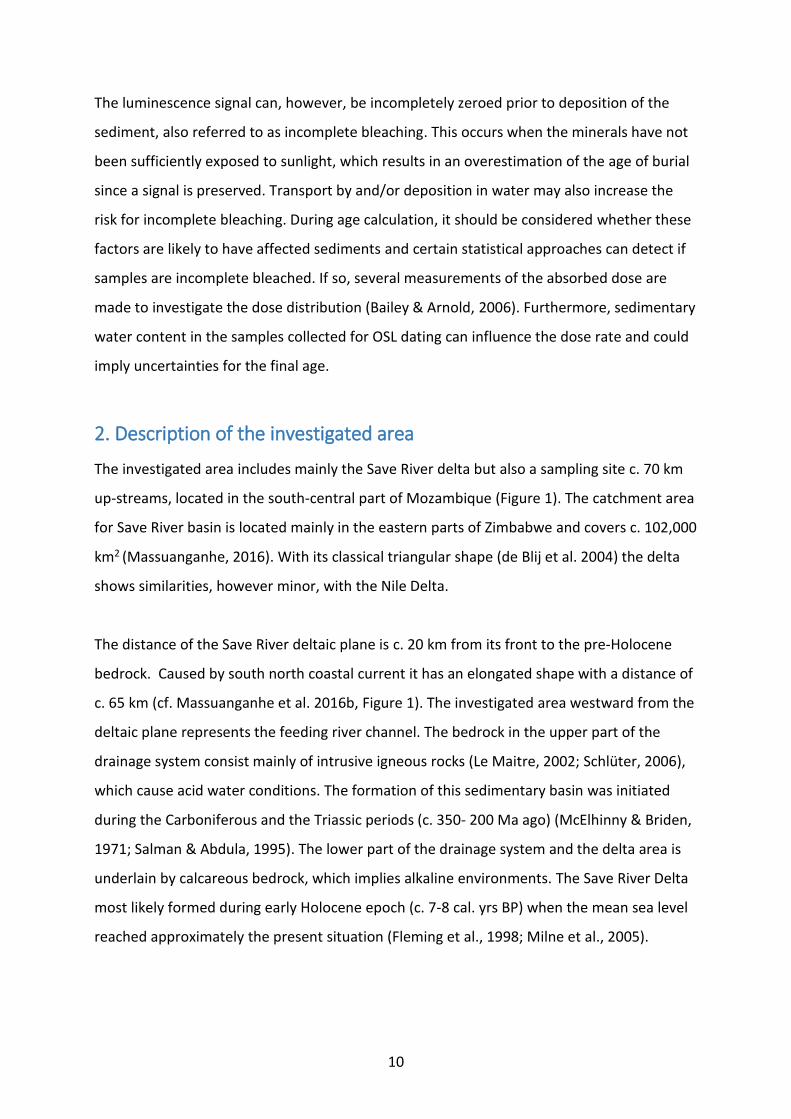
2. Description of the investigated area
The investigated area includes mainly the Save River delta but also a sampling site c. 70 km
up-streams, located in the south-central part of Mozambique (Figure 1). The catchment area
for Save River basin is located mainly in the eastern parts of Zimbabwe and covers c. 102,000
km2 (Massuanganhe, 2016). With its classical triangular shape (de Blij et al. 2004) the delta
shows similarities, however minor, with the Nile Delta.
The distance of the Save River deltaic plane is c. 20 km from its front to the pre-Holocene
bedrock. Caused by south north coastal current it has an elongated shape with a distance of
c. 65 km (cf. Massuanganhe et al. 2016b, Figure 1). The investigated area westward from the
deltaic plane represents the feeding river channel. The bedrock in the upper part of the
drainage system consist mainly of intrusive igneous rocks (Le Maitre, 2002; Schlüter, 2006),
which cause acid water conditions. The formation of this sedimentary basin was initiated
during the Carboniferous and the Triassic periods (c. 350- 200 Ma ago) (McElhinny & Briden,
1971; Salman & Abdula, 1995). The lower part of the drainage system and the delta area is
underlain by calcareous bedrock, which implies alkaline environments. The Save River Delta
most likely formed during early Holocene epoch (c. 7-8 cal. yrs BP) when the mean sea level
reached approximately the present situation (Fleming et al., 1998; Milne et al., 2005).

11
The East African rift system is located north of the Save River Delta. It is c. 6000 km long
reaching Ethiopia in the north. Several earthquakes have occurred during the last decade
along the distal parts of the Save River, indicating tectonic activity in the surrounding area
(Chorowicz, 2005). Macassa Bay c. 120 km south of the investigated area has, however, been
tectonically stable during the late Quaternary period and no activity has been recognized
during the Holocene epoch along the southeastern African coast (Miller et al., 1993; Ramsay,
1995; Ramsay & Cooper, 2002).
Figure 1. An overview map of the investigated area. A – Shows the location of the investigated area in southeastern Africa. B – The subareas within the investigated area and M32, which is located further upstream the Save River. Subarea 1 shows the lower part of the Save River delta, Subarea 2 shows the upper part of the delta and Subarea 3 shows the riverine part. C – SPOT image taken in 2011 with red-green-blue band combination showing landscape structures. The darker red color in the coastal area indicates mangrove forest distribution. Sampling sites are labelled M1-32. M16 and M27 are not shown as these sites are not used in the study. Color and shape of site symbols indicate collected sample type. “M” represents sites sampled for the present study and “P” sites used by Massuanganhe (2016). White rectangles display the three subareas.

12
The coastline of Mozambique is a tidal environment and influenced by southeastern winds
and northward ocean currents (Sete et al., 2002) transporting large amounts of sand. When
deposited, sand dunes and spits pointing northward are formed.
Mozambique has a humid equatorial climate with dry winters (de Blij et al., 2004) and the
rainy season is from October to March (De Boer et al., 2000; Yang et al., 2015). Local
evaporation increases during February to April when the sea surface temperature reaches its
maximum (Rouault, 2003; de Blij et al., 2004).
Extreme rainfall within the drainage area cause flooding events in the investigated area and
further up-stream the river channel. These, together with the tides, form local differences in
salinity stratification in the water (Semeniuk, 2016). The most severe flooding events
commonly co-occur with tropical cyclones. Several major cyclones have affected the area
during the last 15 years. During floods, the transport and reworking of sediment in the Save
River and its delta increase (Massuanganhe et al., 2015). These events and tides amplitudes
of c. 4.5 m (Sete et al., 2002) cause the investigated area to be highly dynamic concerning
geomorphological processes.
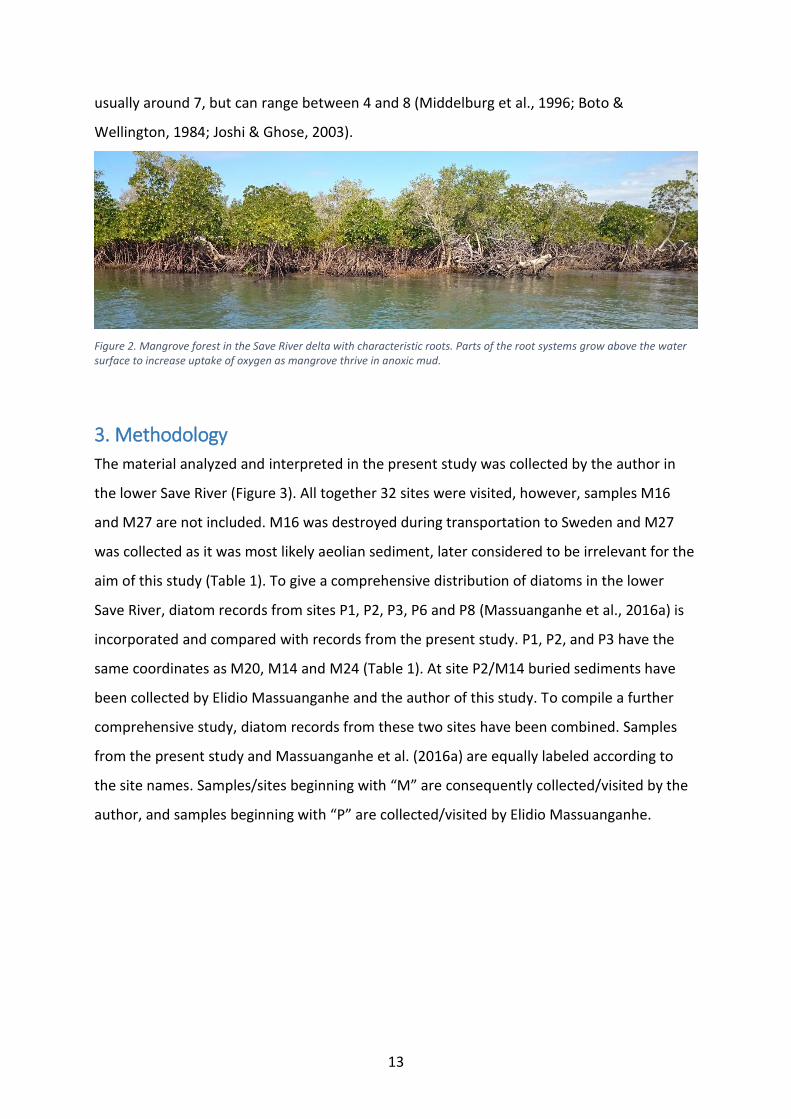
Parts of the Save River deltaic plane are occupied by mangrove forest (Figure 2), an
ecosystem with rich biodiversity. This type of vegetation is well adapted to rapid changes of
e.g. temperature and salinity, which are natural stressors present in coastal environments
(Kathiresan & Bingham, 2001). Mangrove thrives in anoxic mud and has characteristic roots,
which are partly growing above the water surface to breathe. The roots are efficient
sediment traps and form layers of fines with high organic content (Scoffin, 1970; Kristensen
et al., 2008). Intense erosion and reworking of sediment in coastal environments do,
however, occasionally cause mangrove dieback (Alongi, 2002; Massuanganhe et al., 2016a).
During field work for the present study mangrove forest occurred from the delta front to
approximately M13 (Figure 1). Mangrove forests are commonly halophytes, resulting in high
tolerance to a wide range of salinity and high levels of salt in the water (Thom, 1967;
Fujimoto et al., 1996), however, they are mostly found in estuaries and rarely in freshwater
environments (Gilmore & Snedaker, 1993). The pH in mangrove sediments and soils is
13
usually around 7, but can range between 4 and 8 (Middelburg et al., 1996; Boto &
Wellington, 1984; Joshi & Ghose, 2003).
Figure 2. Mangrove forest in the Save River delta with characteristic roots. Parts of the root systems grow above the water surface to increase uptake of oxygen as mangrove thrive in anoxic mud.
3. Methodology
The material analyzed and interpreted in the present study was collected by the author in
the lower Save River (Figure 3). All together 32 sites were visited, however, samples M16
and M27 are not included. M16 was destroyed during transportation to Sweden and M27
was collected as it was most likely aeolian sediment, later considered to be irrelevant for the
aim of this study (Table 1). To give a comprehensive distribution of diatoms in the lower
Save River, diatom records from sites P1, P2, P3, P6 and P8 (Massuanganhe et al., 2016a) is
incorporated and compared with records from the present study. P1, P2, and P3 have the
same coordinates as M20, M14 and M24 (Table 1). At site P2/M14 buried sediments have
been collected by Elidio Massuanganhe and the author of this study. To compile a further
comprehensive study, diatom records from these two sites have been combined. Samples
from the present study and Massuanganhe et al. (2016a) are equally labeled according to
the site names. Samples/sites beginning with “M” are consequently collected/visited by the
author, and samples beginning with “P” are collected/visited by Elidio Massuanganhe.

14
Table 1. Details of visited sampling sites. Samples at M sites are collected by the author of this study and Elidio Massuanganhe has collected the sediments from P sites. Coordinate differences for P1/M14, P2/M20 and P3/M24 could be related to erosion between sampling events.
Site Latitude (South)
Longitude (East)
Character of sample*
Physiography Classification of sediments**
M1 20° 57' 36.72" 35° 07' 30.47" SW, SS, MC Shoreline Sand
M2 20° 57' 40.96" 35° 07' 24.31" SW, SS, MC Back-swamp Fines
M3 20° 57' 46.69" 35° 06' 57.02" SW, SS, MC Sandbank middle of river channel Sand
M4 20° 57' 43.23" 35°06' 27.54" SW, SS, MC Riverbank. SW; M4a: Riverside, M4b: Middle of river channel
Fines
M5 20° 57' 43.48" 35° 05' 52.30" SW, MC Sandbank middle of river channel Fines
M6 20° 57' 6.731" 35° 04' 44.44" SW, MC Riverbank Fines
M7 20° 53' 51.82" 35° 05' 41.96" SS Shoreline Fines
M8 20° 54' 37.00" 35° 04' 13.37" SS Riverbank Fines
M9 20° 55' 40.94" 35° 03' 56.05" SW, SS, BS, OSL Riverbank Fines and sand
M10 20° 57' 35.74" 35° 03' 34.52" SW, SS River bay Fines
M11 20° 58' 05.66" 35° 03' 8.89" SW, SS Riverbank Sand
M12 20° 58' 08.01" 35° 03' 11.09" SS SS; M12a: Overflow area, M12b: River channel
M13 20° 58' 37.59" 35°02' 38.54" SW Riverbank Sand
M14 20° 59' 14.81" 35° 00' 39.16" SW,SS, BS, OSL Riverbank Fines and sand
M16 21° 02' 36.45" 34° 52' 26.00" SS Riverbank. Not included in the study, destroyed during transportation.
Fines
M17 21° 03' 22.07" 34° 51' 51.87" SS Building area for irrigation pipes Fines
M18 21° 04' 01.70" 34° 51' 36.03" SS Sand/gravel pit Sand
M19 21° 02' 52.44" 34° 53' 15.43" SS Pond Fines
M20 21° 00' 22.90" 34° 56' 21.58" SW River
M21 20° 59' 07.66" 35° 00' 46.51" SS Riverbank Fines
M22 21° 01' 04.26" 35° 01' 39.83" SS Overflow levee Fines
M23 21° 01' 30.04" 35° 01' 56.28" SW River
M24 20° 59' 05.86" 35° 02' 06.07" SW River
M25 20° 58' 19.92" 35° 02' 29.47" BS Riverbank Fines and sand
M26 20° 56' 43.18" 35° 02' 52.58" SW M26a: Overflow area, M26b: River channel
M27 20° 56' 24.97" 35° 02' 9.92" SS. Most likely aeolian sediments
Riverbank. Not included in the study, irrelevant.
Sandy silt
M28 20° 56' 11.47" 35° 02' 46.28" SW, SS Riverbank Fines
M29 20° 56' 47.00" 35° 02' 50.89" SW, SS Riverbank Fines
M30 20° 59' 36.27" 35° 59' 55.42" SS Riverbank Fines
M31 21° 01' 37.88" 34° 54' 23.25" SS Riverbank Sand
M32 21° 07' 58.37" 34° 33' 55.15" SW, SS, Riverbank Sand
P1*** 21° 00' 22.96" 34° 56' 21.44" BS, OSL, 14C Riverbank Fines and sand
P2*** 20° 59' 14.82" 35° 00' 39.17" BS, OSL, 14C Riverbank Fines and sand
P3*** 20° 59' 06.71" 35° 02' 05.55" BS, OSL, 14C Riverbank Fines and sand
P6*** 21° 01' 24.04" 35° 04' 05.87" BS Transition upper-lower deltaic plane Fines and sand
P8*** 21° 01' 12.77" 34° 59' 35.22" BS Transition upper-lower deltaic plane Fines and sand
*SW: Surface water. SS: Surface sediments. BS: Buried sediments. MC: Mangrove cortex **Classified during field work. ***Massuanganhe et al. (2016a)

15
Figure 3. The tributary river channel in the Save River delta. Mangrove forest grows in parts of the delta and especially along the river channel. The picture is taken close to M5.
The described fieldwork was performed June 9-20, 2015, by the author and concerns M1-
M32. Four types of samples were collected; surface sediments, buried sediments, surface
water and mangrove cortex. Samples were titled with the same name as the site where they
were collected.
3.1 Siliceous microfossils
Samples for siliceous microfossil analysis were collected from surface sediments, buried
sediments, surface water and mangrove cortex.
Surface sediment samples were collected with a small spade from ground surfaces. Buried
sediments were sampled using the same technique, but collected from riverbanks (Figures 4
and 5). When surface water samples were collected, 1.5 liter plastic bottles were filled at
maximum 50 cm water depth. Samples were taken from boat or from the river bank. Bottles
were decanted after c. 12 h of sedimentation (Figure 6). Decanting was repeated every
second hour until c. 30 ml remained. Samples containing large amounts of sand were stirred
and decanted after 5 s of sedimentation. Remaining 30 ml of water were kept in tubes of 45
ml during transportation to Sweden. Two pH measurements were made with litmus in the
middle of the river channel at M1 and M10, both indicating neutral pH levels.

16
The outer most cortexes were scraped with a knife from living mangrove trees growing in
water. All scraping were made below the water surface (at the time of sampling).
Figure 4. A section from the river bank of the Save River with vertical layers of alluvial sediment with different grain sizes. The picture is taken close to M11. Surface and buried sediment samples were taken from similar sections along the river bank.
Figure 5. Parts of a section showing a fine grained layer at M9, which was sampled for diatom analysis. Sand with iron precipitation is present below and above.

17
Subsamples of 0.5-1.0 cm3 were extracted from surface and buried sediments and put into
100 ml beakers. Regarding samples from mangrove cortex, the outermost from the cortex
were scraped off and also put into 100 ml beakers. Surface water samples were decanted
after 2 hours of sedimentation and then poured into 100 ml beakers. 10 % HCl were added
to remove carbonates and organics were removed by boiling samples in 17-35 % H2O2 until
reaction terminated (Battarbee, 1986). Samples were then repeatedly decanted to remove
sand and clay particles using settling time times in water based on Stoke’s law. To dissolve
clay flocculates NH3 was added and the decanting procedure repeated until the liquid was
clear. Remaining water and fractions of silt-size were mounted in Naphrax® on microscope
slides to increase the refraction index.
Figure 6. Plastic bags containing surface and buried sediment samples. The 1.5 liter plastic bottles are samples collected from surface water. They were repeatedly decanted until c. 30 ml of water and sediments remained. Residuals were poured into plastic tubes of 45 ml and transported to Sweden.
Siliceous microfossils were analyzed under a Zeiss Axiophot light microscope using
immersion oil and X1008 magnification. Frustules were identified following Foged (1975),
Gasse (1986), Snoeijs (1993), Snoeijs & Vilbaste (1994), Snoeijs & Potapova (1995), Snoeijs &
Kasperovičienė (1996), Krammer & Lange-Bertalot (1986, 1988, 1991a, b, 2000), Metzeltin
(1998) and Witkowski et al. (2000). For practical reasons and available literature, new names
of certain species have not been applied. For example Synedra ulna and Biddulphia aurita

18
are at present named Ulnaria ulna and Odontella aurita, respectively (Lange-Bertalot &
Compére, 2001; Hoppenrath, 2004).
Eight groups based on salinity tolerance of diatom species were established; marine,
brackish, halophilic, indifferent, freshwater, aerophilic, unknown and extinct. Halophilic taxa
prefer increased salinities, which freshwater species do not. Indifferent taxa tolerate low
salinity levels, they can thus live in both fresh and brackish water. The group unknown
includes diatom frustules, which were not possible to identify because of breakage, chemical
dissolution or large amounts of mineral fractions covering the frustule. Characteristic/
commonly occurring species for a sample were based on frustule occurrences in relation to
other taxa.
Diatom assemblages within samples from surface sediments, surface water and mangrove
cortex are presented in pie charts on SPOT images of the investigated area. The groups
brackish and halophilic, indifferent and aerophilic were combined to explicate results. Based
on the same argument, the investigated area was divided into subareas 1, 2 and 3. Data for
the pie charts is presented in a geographical order perpendicular to the river, from east to
west (Appendix 1). M22 and M23 are not incorporated into the pie charts as they are not
located close to the present river channel. Samples where no frustules were found are not
visualized. Samples with low basic sums (<50 diatom frustules) were interpreted accordingly.
Diatom assemblages from buried sediment samples are presented as diagrams made in Tilia
1.7.16. P2/M14 is presented as percentage and P1, P3, P6, P8, M9 and M25 are presented as
counts since basic sums were too low. Diatom assemblage zones within P1, P3, P6 and P8
are modified from Massuanganhe et al. (2016a) to emphasize data important for the aim of
this study. In Massuanganhe et al. (2016a) zones are based on the lithological units while in
the present study they are defined according to diatom occurrences and ecologies (cf.
Appendices 2 and 3). The lithology is based on Troels-Smith (1955) classification of
sediments. Cluster analysis based on CONISS and eye matching was added into P2/M14 to
display zonation. Cluster analysis was not applied to diagrams with counts.

19
3.2 ESEM
Residuals from surface sediment samples M1-M4, M6, M10, from mangrove cortex samples
M1, M2, M5 and from surface water sample M1. Subsamples were paved with gold and
studied using ESEM (FEI, Quanta FEG 650) high vacuum. Diatom taxa particularly examined
to identify to species level were e.g. Diploneis interrupta, Opephora minuta, Luticola mutica,
Diploneis sp. and Cyclotella sp.
3.3 OSL
Two OSL-samples were collected at site M9. Opaque plastic tubes were driven into the sandy
layers. During the sampling procedure, black tarpaulin was used for light protection and
tubes were then covered with several layers of black tape (Figure 7). OSL-sample M9V was
collected vertically because of rising tidal water, which implied limited time for digging.
Approximately 1 kg of sediments was collected for dose rate measurement. Preparation
technique of luminescence samples is presented in Massuanganhe et al. (2016a). Sediment
for dose rate measurements for M9 and M9V was sent to VKTA, Laboratory for
Environmental and Radionuclide Analyses, Dresden, Germany.
Figure 7. The vertical OSL samples from M9. Black tarpaulin was used for light protection during collection. The plastic sample tube was covered with black tape to ensure tight coverage.
4. Result and interpretation
Four categories of material have been collected; surface water (20), surface sediments (21),
mangrove cortex (5) and buried sediments (16). The latter category has partly been collected
by Elidio Massuanganhe and analyzed by Annika Berntsson and the author of this study

20
(Massuanganhe et al., 2016a). During analysis 63 diatom genera and 258 species were
identified (Appendix 3). Phyotoliths, sponge spiculae and chrysophyte cysts were identified
but not counted as they were not relevant for the objectives of this investigation. Most
common species are Nitzschia granulata, N. littoralis, Hantzschia distinctepunctata,
Cyclotella sp., Thalassiosira eccentrica, Diploneis sp. and D. interrupta. (Appendices 3 and 6).
Numbers of brackish and marine diatom species are overall higher in samples from surface
water, surface sediment and cortex than in buried sediments, exemplified by Amphora
ventricosa, Opephora pacifica and Navicula alpha.
Diatom assemblages in surface sediments, surface water and mangrove cortex are
presented as pie charts overlying geographical maps to show the salinity gradient in the
lower Save River (Figures 8, 9, 10 and Appendix 1). Identified diatoms are grouped according
to associated ecology and presented as percentages. The basic sums of identified frustules in
each sample vary between 0 and 353.5 (Figures 8C, 9D and 10B). Differences in diatom
assemblages indicate a spatial variation in salinity. Marine and brackish species are generally
decreasing up-streams while indifferent and freshwater taxa are increasing. Diatoms can
thus indicate a latitudinal salinity gradient in the lower Save River. Brackish taxa are present
in nearly all samples, which indicate influences of tidal water up-stream.
4.1 Surface water samples
20 surface water samples were collected (Figure 8 A and B). No surface water samples were
collected in Subarea 3. In Subarea 1, brackish and halophilic taxa are dominant (Figure 8 A).
The number of indifferent and aerophilic taxa in the diagram at site M1 is relatively low as
the basic sum is only eight and should be interpreted accordingly (Figure 8 B). The sample at
site M11 shows a high occurrence of marine species in relation to samples closer to the
ocean.
Samples from Subarea 2 show a significantly higher occurrence of brackish and halophilic
taxa than in Subarea 1 (Figure 8 B). Low numbers of marine diatoms are identified in the
sample at site M13. The occurrence of indifferent and aerophilic taxa starts to increase at
site M24 and continuous in samples at site M20 and M32. The occurrence of freshwater
diatoms is, however, limited in water samples throughout the delta and the river channel.

21
4.2 Surface sediment samples
21 surface sediment samples were collected (Figure 9 A, B and C). Brackish taxa are
dominating most of the samples from Subarea 1 (Figure 9 A). M11 contain a relatively high
number of freshwater species. In sample M25 marine taxa occur in the same proportions as
in Subarea 1 (Figure 9 B). In the other two samples visualized in Subarea 2 (M21 and M30)
the indifferent and aerophilic taxa increase and marine species decrease. The brackish taxa
are still dominating. Amount of freshwater species are significantly higher in M31 and M32,
Subarea 3, (Figure 9 C), however, they do not occur in M15, M17 and M18. Brackish taxa are
highly represented in M15 and M17. Note the low basic sums in samples M15, M17 and M18
(Figure 9C).
4.3 Mangrove cortex samples
During fieldwork five mangrove cortex samples were collected. Samples from mangrove
cortex were collected within Subarea 1 at sites M1-M5 (Figure 10), i.e. in the delta front. The
diatom communities indicate mostly brackish water conditions. In M1 and M3 there is a
marine signal, however, the basic sum in M1 is too low to be valid (Figure 10). The diatom
assemblage in M5 indicates some influence of freshwater since frustules of Cymbella spp are
present.

22
Figure 8 A. Identified diatom frustules from surface water samples. Counts are grouped according to optimal salinity and
presented as percentages in pie charts. Colors in the pie charts represent different salinity levels and are explained in the
legend. The overview map in the lower right corner display the geographical position of subarea 1.

23
Figure 8 B. Counted diatoms from surface water samples within Subarea 2. The table below the map display basic sums for each sample. See Figure 8 A for additional details.
M3
2
26
7
M2
9
12
0
M2
8
19
4.5
M2
6b
35
3.5
M2
6a
17
7
M2
4
94
M2
0
39
.5
M1
4
53
M1
3
91
M12
229
M11
136
M10
49
M 9
33
M6
97.5
M5
72.5
M4
b
37
M4a
32.5
M3
44
M2
43.5
M1
8
Sam
ple
Bas
ic
sum

24
Figure 9 A. Diatom counts from surface sediment samples displayed as percentages. Counts are grouped according to
optimal salinity. The colors within the pie charts represent different salinities and are explained in the legend in Figure 8A.
Overview map in the lower right corner show the geographical position of Subarea
1

25
.
Figure 9 B. Diatom counts from surface sediment samples within Subarea 2. See Figure 9 A for further details.

26
Figure 9 C. Diatom frustules from surface sediment samples within Subarea 3. See Figure 9 A for further details. The table below the figure show basic sums for the samples.
M3
2
7.5
M1
8
11
M1
7
1
M1
5
14
.5
M3
1
36
M3
0
20
5
M2
1
13
8
M2
5
13
4
M1
2b
20
2
M12
a
208.
5
M11
33
M29
110
M28
63.5
M10
162.
5
M6
369
M8
14
M4
42
M3
70
M7
91
M2
204.
5
M1
32
Sam
ple
Bas
ic
sum

27
Figure 10. Identified diatoms from mangrove cortex. Pie charts contain identified frustules counted as percentages and represented with different colors depending on their optimal salinity. Legend of the colors are available in Figure 8 A. The table below the map show basic sums for the samples. Geographical position of Subarea 1 is showed in the overview map in the lower right corner.
M5
359
M4
75
M3
54
M2
45
M1
4.5
Sam
ple
Bas
ic
Sum

28
4.4 Buried sediments
Buried sediment samples were collected at P1, P2/M14, P3, P6, P8, M9, and M25 and
presented in seven Tilia diagrams (Figures 11-17). Detailed lithologic information of P1, P3,
P6 and P8 is modified from Massuanganhe et al. (2016a). 16 samples were collected at M-
sites and 126 samples at P-sites. Samples P2 and M14 are merged as their geographical
location coincide. The lithology at all sites shows a clay layer bracketed by units consisting of
sand and/or silt.
The diagram from P1 is divided into two zones, however diatom frustules only occur in zone
1) (Figure 11). Basic sums of diatoms are high in the lowest part of the core, c. 620-560 cm
depth. In zone 1 variations between the ecological groups are minor. The frustules counted
represent mainly brackish (e.g. Diploneis interrupta and D. pseudovalis) and indifferent
conditions (e.g. Amphora copulata), however, marine (Nitzschia granulata) and freshwater
(e.g. Fragilaria ulna) diatoms co-occur. Two samples were collected for radiocarbon dating
suggesting ages of 3216-2980 cal. yrs BP (Poz-67397) at c. 570 cm depth and 1072-956 cal.
yrs BP (Poz-60019) at c. 320 cm depth (Figure 11 and Table 2). At c. 350 cm depth a sample
for OSL dating was collected, indicating an age of 1300±160 years (Figure 11 and Table 3).
In P3, zone 1 identified diatom frustules are few, but those occurring represent marine and
brackish conditions (Figure 12). Zone 2 contain a higher number of diatoms and the marine
and brackish signal is more clear and represented by e.g. Paralia sulcata and Diploneis
interrupta. In zone 3 the brackish and marine signal remains strong, additionally
characterized by Nitzschia granulata and Hyalodiscus sp. Aerophilic species (e.g. Hantzschia
amphioxys) are highly occurring in zone 4, however, brackish, indifferent and freshwater
taxa co-occur, mostly represented by Diploneis interrupta, Fragilaria brevistrata and Eunotia
spp. The OSL date at c. 370 cm depth indicates an age of 210±20 years (Figure 12 and Table
3).

29
Figure 11. Diatom diagram from P1. Sums of identified diatom frustules are displayed as counts. DAZ (diatom assemblage zones) are constructed based on frustule occurrences. The chronology comprises both OSL and radiocarbon dates. OSL is marked with ± and radiocarbon as a time interval.
240
290
340
390
440
490
540
590
640D
epth
(cm
)
13
00
±1
60
10
72
-95
6
32
16
-29
80C
hron
olog
y
Nitz
schi
a gr
anul
ata
20
40
Dip
lone
is in
terr
upta
20
40
60
80
Dip
lone
is p
sued
oval
is
20
Han
tzsc
hia
dist
inct
epun
ctat
a
20
Hya
lodi
scus
sp. 2
0
Nitz
schi
a co
ccon
eifo
rmis
20
40
Am
phor
a co
pula
taE
pith
emia
adn
ata
Rho
palo
dia
gibb
a
Rho
palo
dia
oper
cula
ta
Dip
lone
is e
llipt
ica
20
Fragi
laria
uln
a
Gyr
osig
ma
obtu
satu
m
Han
tzsc
hia
amph
ioxy
s
00
00
00
00
00
00
00
00
00
02
10
00
40
33
60
28
55
32
97
15
23
04
Bas
ic s
um
20
Mar
ine
taxa
50
100
150
Bra
ckis
h ta
xa
Hal
ophi
lic ta
xa 20
40
60
80
100
Indi
ffere
nt ta
xa
20
40
Fresh
wat
er ta
xa
Aer
ophi
lic ta
xa
20
Unk
now
n ta
xaD
AZ
2 1
Ma
rine
ta
xaB
rackis
h ta
xaIn
diffe
rent ta
xaF
reshw
ate
r ta
xaA
ero
phili
c ta
xa
Mo
difie
d f
rom
Be
rnts
so
n 2
01
5-2
01
6
Lith
olog
y
Silt
Sa
nd
Cla
yS
ilty
sa
nd
Silt
y cla
y

30
Figure 12. Diatom diagram from P3. Sums of identified diatom frustules are displayed as counts. DAZ (diatom assemblage zones) is constructed based on frustule occurrences. One OSL date is visible in the chronology.
The occurrence of diatoms is relatively low in samples from P6 and merely 11 of 29 samples
contain frustules (Figure 13). In zone 1 there is a brackish-marine signal dominated by mainly
Diploneis interrupta and Terpsinoë americana. Zone 2 indicates the same signal as zone 1,
however, the occurrence of frustules is higher. Aerophilic species is most common in zone 3.
Significant taxa are Navicula mutica and Pinnularia borealis.
70
120
170
220
270
320
370D
epth
(cm
)
21
0±
20C
hron
olog
y
Dip
lone
is c
affra
20
Nitz
schi
a gr
anul
ata
20
Par
alia
sul
cata
20
Dip
lone
is in
terr
upta
Dip
lone
is p
seud
oval
is
Han
tzsc
hia
dist
inct
epun
ctat
a
20
Hya
lodi
scus
sp. Fra
gila
ria b
revi
stria
ta
Eun
otia
spp 2
04
0
Han
tzsc
hia
amph
ioxy
s
Nav
icul
a m
utic
a
Nav
icul
a pa
ram
utic
a
18
33 2
17
37
65 4 6 3
52
48
86
60
11
Bas
ic s
um
20
40
Mar
ine
taxa
20
40
Bra
ckis
h ta
xa
Hal
ophi
lic ta
xa
Indi
ffere
nt ta
xa
20
Fresh
wat
er ta
xa 20
40
Aer
ophi
lic ta
xaU
nkno
wn
taxa
DAZ
4 3 2 1
Ma
rine
ta
xaB
rackis
h ta
xaIn
diffe
rent ta
xaF
reshw
ate
r ta
xa Ae
rop
hili
c ta
xa
Modifi
ed fro
m B
ern
tsson 2
015-2
016
Lith
olog
y
Sa
nd
Silt
y cla
yS
ilt
31
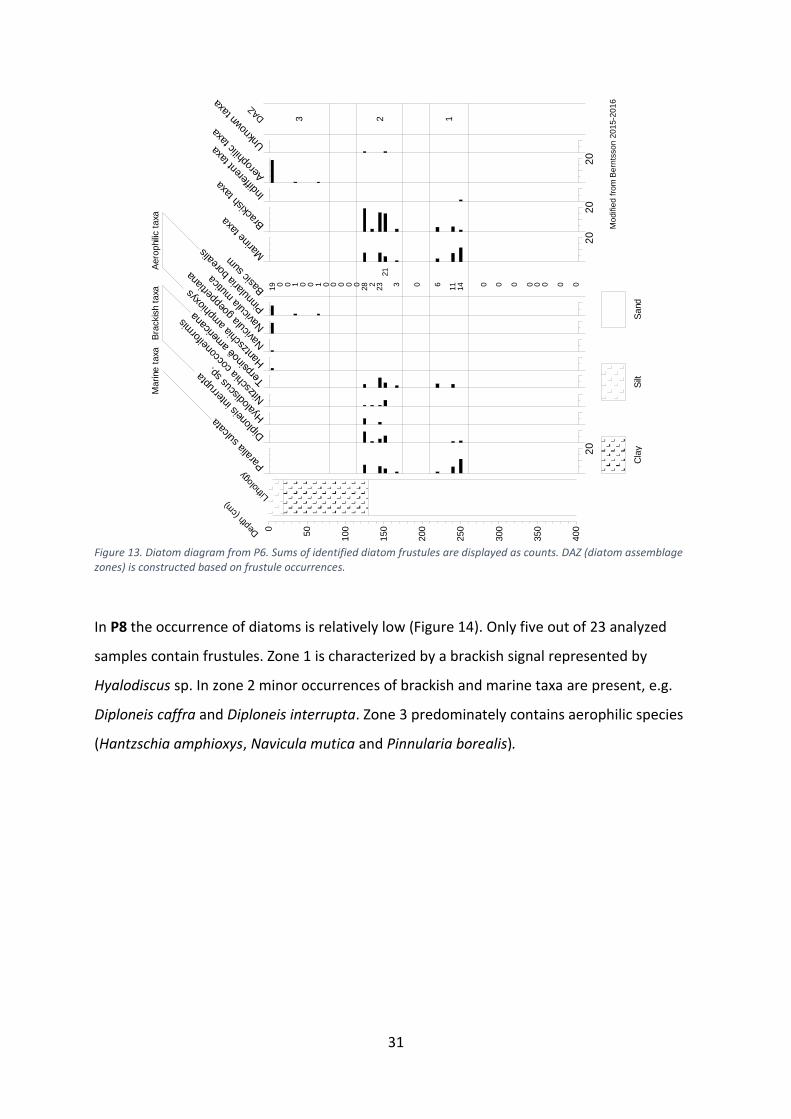
Figure 13. Diatom diagram from P6. Sums of identified diatom frustules are displayed as counts. DAZ (diatom assemblage zones) is constructed based on frustule occurrences.
In P8 the occurrence of diatoms is relatively low (Figure 14). Only five out of 23 analyzed
samples contain frustules. Zone 1 is characterized by a brackish signal represented by
Hyalodiscus sp. In zone 2 minor occurrences of brackish and marine taxa are present, e.g.
Diploneis caffra and Diploneis interrupta. Zone 3 predominately contains aerophilic species
(Hantzschia amphioxys, Navicula mutica and Pinnularia borealis).
0
50
100
150
200
250
300
350
400D
epth
(cm
)
20
Paral
ia s
ulca
ta
Dip
lone
is in
terr
upta
Hya
lodi
scus
sp.
Nitz
schi
a co
ccon
eifo
rmis
Terps
inoë
am
eric
ana
Han
tzsc
hia
amph
ioxy
s
Nav
icul
a go
eppe
rtian
a
Nav
icul
a m
utic
a
Pinnu
laria
bor
ealis
19 0 0 1 0 0 1 0 0 0 0 0
28 2
23
21
3 0 6
11
14 0 0 0 0 0 0 0 0Bas
ic s
um
20
Mar
ine
taxa
20
Brack
ish
taxa
Indi
ffere
nt ta
xa
20
Aerop
hilic
taxa
Unk
now
n ta
xa
DA
Z
3 2 1
Marine t
axa
Bra
ckis
h t
axa
Aero
phili
c t
axa
Mo
difie
d f
rom
Bern
tsso
n 2
015
-201
6
Lith
olog
y
Silt
Cla
yS
and

32
Figure 14. Diatom diagram from P8. Sums of identified diatom frustules are displayed as counts. DAZ (diatom assemblage zones) is constructed based on frustule occurrences.
Diatom analyses from M9 were undertaken on samples from silty sand and two clay layers
(Figure 15). The basic sums of diatoms are relatively low. In zone 1 there is a marine-brackish
signal. Dominating taxa are Coscinodiscus asteromphalus, Nitzschia granulata, Opephora
minuta, Paralia sulcata, Cyclotella sp. and Diploneis sp. In zone 2 the occurrences of diatom
frustules are low. Identified taxa indicate marine and brackish water conditions. Zone 3 is
also dominated by marine and brackish species. Most common taxa are Nitzschia granulata,
Paralia sulcata, Diploneis interrupta and Nitzschia littoralis. Below 320 cm depth a sand layer
of unknown thickness is present, followed by a clay layer 220-320 cm depths. Above the clay,
silty sand is present at 220-195 cm depth. Between 195 and 145 cm depth sand follows. A
relatively thin layer of clay is present above, at 155-145 cm depth. From 145 cm depth to the
ground surface a massive layer of sand occurs. Two samples for OSL-dating were collected at
330 and 180 cm depth (Figure 15 and Table 3). These indicate ages of 890 ± 100 yrs and 920
± 90 yrs, respectively. Accordingly, the ages are approximately equal, despite difference in
depth.
0
20
40
60
80
100
120
140
160
180
200
220
240D
epth
(cm
)
Dip
lone
is c
affra
Nitz
schi
a gr
anul
ata
Paral
ia s
ulca
ta
Dip
lone
is in
terr
upta
20
Hya
lodi
scus
sp.
Terps
inoë
am
eric
ana
20
Han
tzsc
hia
amph
ioxy
s
Nav
icul
a go
eppe
rtian
a
20
Nav
icul
a m
utic
a
20
Pinnu
laria
bor
ealis
Nitz
schi
a sp
p
14
51 0 0 0 0 0 0 0 0 4 0 0 0 0 0 0 0 0
21 4 0 0
Basic
sum M
arin
e ta
xa 20
Brack
ish
taxa
20
40
Aerop
hilic
taxa
Unk
now
n ta
xa
DA
Z
3 2 1
Marine t
axa
Bra
ckis
h t
axa
Aero
phili
c t
axa
Unknow
n t
axa
Mo
difie
d f
rom
Be
rnts
so
n 2
01
5-2
01
6
Lith
olog
y
Silt
Cla
yS
and

33
Figure 15. Diatom diagram from M9. Sums of identified diatom frustules are displayed as counts. DAZ (diatom assemblage zones) is constructed based on frustule occurrences. Two OSL dates are presented.
0
50
100
150
200
250
300
350D
epth
(cm
)
89
0±1
00
92
0±9
0Chr
onol
ogy
20
40
Cosc
inod
iscu
s as
tero
mph
alus
20
40
Nitz
schia
gra
nula
ta Ope
phor
a m
inut
a
20
Paral
ia s
ulca
ta 20
Thala
ssio
sira
ecc
entri
ca
20
40
Cyl
otel
la s
p.
Dip
lone
is in
terru
pta
Dip
lone
is s
p.
Nitz
schia
litto
ralis
97 1
13
15
152
92
Basic
sum
20
40
60
80
Mar
ine
taxa
20
40
60
Brack
ish
taxa
Indi
ffere
nt ta
xa
Aerop
hilic ta
xa
Unkn
own
taxa
Extin
ct ta
xa DA
Z
3 2 1
Ma
rine
taxa
Bra
ckis
h ta
xa
Ma
rie
Chri
stia
nsso
n 2
01
6
Lith
olog
y
Sand
Cla
yS
ilty s
and

34
The diatom diagram from P2/M14 is constructed based on samples collected by the author
combined with published data (Figure 16). Brackish diatoms dominate in zone 1 and are
represented by e.g. Actinoptychus sp., Diploneis interrupta and D. pseudovalis. Occurrences
of the freshwater taxon Gyrosigma obtusatum are also present. In zone 2, marine taxa e.g.
Paralia sulcata and Nitzschia granulata are present. There is a clear brackish signal indicated
by Diploneis interrupta, D. pseudovalis and Hantzschia distinctepunctata. In zone 3 brackish
taxa dominate, characterized by mainly Diploneis interrupta. In zone 4 the brackish signal
decreases in comparison to zone 3 and indifferent species increase. Diploneis interrupta is
still the dominant brackish taxon and Amphora copulata characterizes the indifferent
species. In zone 5 brackish taxa increase from zone 4 with high occurrences of Diploneis
interrupta. At this site four radiocarbon dates and two OSL dates were performed. The result
suggests ages which are not in chronological order in relation to the depth. The youngest
radiocarbon date occur at 410 cm depth and indicate an age of 800-682 cal. yrs BP (Poz-
53659). The two other radiocarbon dates stratigraphically above show ages 1570-1405 cal.
yrs BP (Poz-53658) (310 cm depth) and 920-766 cal. yrs BP (Poz-53657) (270 cm depth)
respectively (Figure 16 and Table 2). The OSL dates are measured at 500 and 200 cm depths,
both suggesting similar ages of 250±30 yrs and 230±20 yrs (Figure 16 and Table 3). The
lithology at P2/M14 comprises sand in the lower most unit, followed by clay up to 220 cm
depth. A massive sand layer is then present up to the surface, with two interlayers of sandy
silt at 220-195 and 155-145 cm depth. A detailed lithology is available in Massuanganhe et
al. (2016a).

35
Figure 16. Diatom diagram from P2/M14. Data from the two sites are combined as the samples were collected at the same geographical location. Diatom sums of identified diatom frustules are displayed as percentages. DAZ (diatom assemblage zones) is constructed based on cluster analysis constructed from CONISS combined with eye matching. The chronology comprises both OSL and radiocarbon dates. OSL is marked with ± and radiocarbon with a time interval.
200
250
300
350
400
450
500
550D
epth
(cm
)
920-7
66
230±20
250±30
1570-1
405
800-6
82
2105-1
995C
hron
olgy
20
Nitz
schi
a gr
anul
ata
Paral
ia s
ulca
ta
20
Actin
opty
chus
sp.
20
40
60
80
Dip
lone
is in
terru
pta
20
40
Dip
lone
is p
seud
oval
is 20
Han
tzsc
hia
dist
inct
epun
ctat
a
20
Nitz
schi
a lit
tora
lis
20
Cyc
lote
lla m
eneg
hini
ana
20
Amph
ora
copu
lata
20
Nav
icul
a cu
spid
ata
20
Aulac
osei
ra g
ranu
lata
20
Gyr
osig
ma
obtu
satu
m
61
86
99
10
6
85
10
0
74
66
79
54
11
2
85
80
81
89
68
59
19
7
83
70
30
3
20
0
20
79
71
75
75
31
71
0Bas
ic s
um
20
Mar
ine
taxa
20
40
60
80
100
Brack
ish
taxa
20
Hal
ophi
lic ta
xa 20
40
Indi
ffere
nt ta
xa
20
Fres
hwat
er ta
xa
20
Aerop
hilic
taxa
20
Unk
now
n ta
xa DA
Z
5 4 3 2 1
Marine taxa
Bra
cki
sh taxa
Halo
phili
c taxa Indiff
ere
nt ta
xaF
reshw
ate
r ta
xa
Be
rnts
so
n &
Ch
ris
tia
ns
so
n 2
01
5-2
01
6
24
68
10
To
tal s
um
of s
qu
are
s
CO
NIS
S
Lith
olog
y
Sand
Cla
yS
ilty
sand

36
In the diagram from M25 the diatom analysis indicates merely taxa which are associated
with marine and brackish conditions (Figure 17). The signal is distinctive throughout the
section. In zone 1 marine species dominate, e.g. Actinoptychus splendens, Paralia sulcata and
Nitzschia granulata. Zone 2 is characterized by brackish taxa represented by mainly
Cyclotella sp. In zone 3, the most commonly occurring diatom taxa are marine represented
by e.g. Actinoptychus splendens and Nitzschia granulata. M25 consists of a massive layer of
clay.
Figure 17. Diatom diagram from M25. Sums of identified diatom frustules are displayed as counts. DAZ (diatom assemblage zones) is constructed based on frustule occurrences.
0
50
100
150
200
250
300D
epth
(cm
)
20
Actin
opty
chus
spl
ende
ns
20
Cos
cino
disc
us a
ster
omph
alus
Cyc
lote
lla s
tylo
rum
Dip
lone
is s
mith
ii
Nav
icul
a al
pha
Nav
icul
a ya
rrens
is
20
Nitz
schi
a gr
anul
ata 2
0
Paral
ia s
ulca
ta 20
Thala
ssio
sira
ecc
entri
ca
Cyc
lote
lla c
rass
a
50
10
01
50
20
0
Cyl
otel
la s
p.
Dip
lone
is in
terr
upta
Dip
lone
is s
p.
14
4
24
2
10
5 5
Basic
sum
50
10
01
50
Mar
ine
taxa
50
10
01
50
20
0
Brack
ish
taxa
Indi
ffere
nt ta
xa
Fresh
wat
er ta
xa
20
Unk
now
n ta
xa DA
Z3 2 1
Ma
rine
ta
xa
Bra
ckis
h t
axa
Marie
Christiansso
n 2
01
6
Lith
olog
y

37
Table 2. Details from radiocarbon dates (Massuanganhe et al.2016a).
Sample/Site Depth (cm) Type of material Lab nr. Age BP 14C Cal. yrs BP 95.4% confidence
P1 320 Bulk sediments Poz-60019 1165±30 1072-956 (95.4%)
P1 570 Plant remains Poz-67397 2995±30 3216-2980 (95.4%)
P2/M14 270 Bulk sediments Poz-53657 965±30 920-766 (95.4%)
P2/M14 310 Bulk sediments Poz-53658 1640±35 1570-1405 (95.4%)
P2/M14 410 Roots Poz-53659 890±30 800-682 (95.4%)
P2/M14 470-480 Roots Poz-53660 2110±25 2145-2129 (2.6%)
2105-1995 (88.5%)
1960-1934 (4.2%)
Table 3. OSL dates and measurements details. Data from P2/M14 and P3 are earlier published in Massuanganhe et al. (2016a). M9 was sampled horizontally into the sediment and M9V were
collected vertically.
1 Estimated water content relative to the dry sample weight 2 Number of aliquots (2 mm) passing measurement recycling criteria (≤10%). 3 Overdispersion (Galbraith et al., 1999). 4 Central Age Model (CAM) (Galbraith et al., 1999). 5 Minimal Age Model (MAM) (Galbraith et al., 1999) at 10% overdispersion (sample P3 at 7.2%) *Massuanganhe et al. (2016a)
Site Surface
altitude
Sample
depth
Water
content1
n2,4 OD3,4 238U 226Ra 232Th 40K CAM4 De CAM4 age MAM5 De MAM5 dose
rate
MAM5 age
(m
a.s.l.)
(cm) (%) (%) (Bq kg-1) (Bq kg-1) (Bq kg-1) (Bq kg-1) (Gy) (a) (Gy) (Gy ka-1) (a)
P1* 11 36 10 ± 5 58 37.9 32.0 ± 2.0 31.4 ± 2.0 62.0 ± 4.0 865.0 ± 71.0 6.42 ± 0.32 1590 ± 180 5.26 ± 0.4 4.05 ± 0.49 1300 ± 160
P2*/M14 6 200 10 ± 5 40 44.6 25.4 ± 1.6 25.4 ± 1.6 51.0 ± 4.0 943.0 ± 77.0 1.17 ± 0.08 290 ± 40 0.94 ± 0.03 4.09±0.35 230±20
P2*/M14 6 500 15 ± 5 48 22.3 28.0 ± 5.0 18.6 ± 1.3 54.0±3.0 841.0±69.0 0.84±0.03 250±30 0.79±0.01 3.43±0.30 230±20
P3* 5 370 15 ± 5 45 7.2 9.0 ± 3.0 7.2 ± 0.6 14.3 ± 1.0 842.0 ± 69.0 0.55 ± 0.01 210 ± 20 0.55 ± 0.02 2.62 ± 0.25 210 ± 20
M9 4 180 15 ± 5 41 15.4 6.5 ± 2.3 4.8 ± 0.5 8.8 ± 0.9 933.0 ± 76.0 2.61 ± 0.07 930 ± 100 2.56 ± 0.05 2.78 ± 0.27 920 ± 90
M9V 4 330 15 ± 5 39 26.7 17.0 ± 2.8 17.0 ± 1.1 61.0 ± 4.0 470.0 ± 40.0 2.66 ± 0.12 1050 ± 110 2.26 ± 0.12 2.54 ± 0.28 890 ± 100

38
4.5 Taxonomic remarks
Diatom frustules, which were not possible to identify to species level because of
fragmentation, chemical corrosion and/or overlying of mineral particles have been labeled
“spp”. Frustules appearing as similar, but not possible to identify to species level are
categorized as “sp.”. Two diatom genera, which were not possible to identify to species
level, were selected for comprehensive identifications as they occurred in large numbers
both in sediments and water samples. These were identified to genus level as Cyclotella and
Diploneis (Tables 4 and 5). Cyclotella sp. has been compared with five taxa showing similar
morphologies in an attempt to identify to species level (Table 4). None of them corresponds
in detail, which makes it difficult to identify Cyclotella sp. Species C. stylorum and C. litoralis
show most similarities, however, there are significant differences in size and character of the
central and marginal fultoportulae. Cyclotella sp. has a higher quantity of central
fultoportulae and a different pattern of the marginal fultoportulae. Cyclotella sp. was
frequently occurring in samples geographically located east of M30 (Figure 1). Other species
identified in samples east of M30 are generally brackish and marine. Based on the
geographical distribution of Cyclotella sp. and the ecology of related taxa the unidentified
species was interpreted as being associated with brackish conditions.
The morphology of the unidentified species Diploneis sp. is most similar to Diploneis
pseudovalis (Table 5). Size and areolae structure are, however, somewhat different. The
valve size of Diploneis sp. is significant smaller than all compared species, which may be
related to differences during the life cycle or may be an indication of limiting environmental
conditions. Frustules of Diploneis sp. co-occur with Cyclotella sp., thus, the ecology for
Diploneis sp. was also associated with brackish environment based on the same arguments
as with Cyclotella sp. These two species may be identified as species not earlier described.
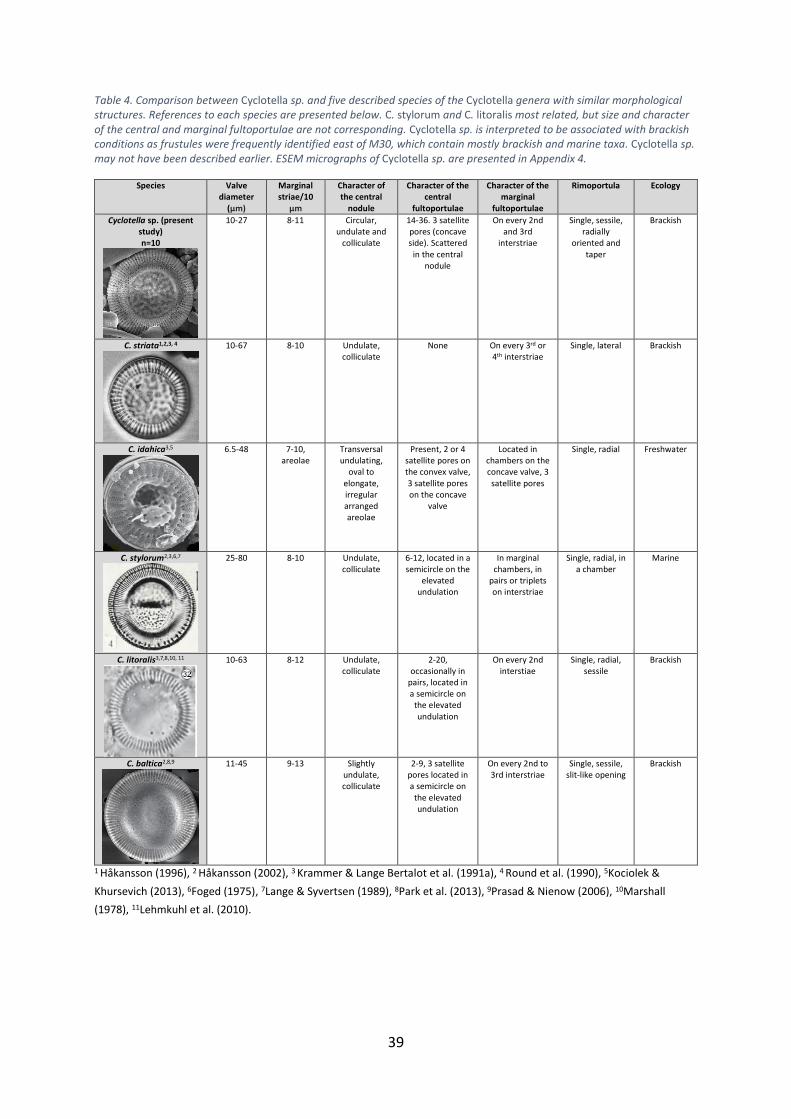
39
Table 4. Comparison between Cyclotella sp. and five described species of the Cyclotella genera with similar morphological structures. References to each species are presented below. C. stylorum and C. litoralis most related, but size and character of the central and marginal fultoportulae are not corresponding. Cyclotella sp. is interpreted to be associated with brackish conditions as frustules were frequently identified east of M30, which contain mostly brackish and marine taxa. Cyclotella sp. may not have been described earlier. ESEM micrographs of Cyclotella sp. are presented in Appendix 4.
Species Valve diameter
(µm)
Marginal striae/10
µm
Character of the central
nodule
Character of the central
fultoportulae
Character of the marginal
fultoportulae
Rimoportula Ecology
Cyclotella sp. (present study) n=10
10-27 8-11 Circular, undulate and
colliculate
14-36. 3 satellite pores (concave side). Scattered
in the central nodule
On every 2nd and 3rd
interstriae
Single, sessile, radially
oriented and taper
Brackish
C. striata1,2,3, 4
10-67 8-10 Undulate, colliculate
None On every 3rd or 4th interstriae
Single, lateral Brackish
C. idahica3,5
6.5-48 7-10, areolae
Transversal undulating,
oval to elongate, irregular arranged areolae
Present, 2 or 4 satellite pores on the convex valve, 3 satellite pores on the concave
valve
Located in chambers on the concave valve, 3 satellite pores
Single, radial Freshwater
C. stylorum2,3,6,7
25-80 8-10 Undulate, colliculate
6-12, located in a semicircle on the
elevated undulation
In marginal chambers, in
pairs or triplets on interstriae
Single, radial, in a chamber
Marine
C. litoralis3,7,8,10, 11
10-63 8-12 Undulate, colliculate
2-20, occasionally in
pairs, located in a semicircle on
the elevated undulation
On every 2nd
interstiae Single, radial,
sessile Brackish
C. baltica2,8,9
11-45 9-13 Slightly undulate, colliculate
2-9, 3 satellite pores located in a semicircle on
the elevated undulation
On every 2nd to 3rd interstriae
Single, sessile, slit-like opening
Brackish
1 Håkansson (1996), 2 Håkansson (2002), 3 Krammer & Lange Bertalot et al. (1991a), 4 Round et al. (1990), 5Kociolek &
Khursevich (2013), 6Foged (1975), 7Lange & Syvertsen (1989), 8Park et al. (2013), 9Prasad & Nienow (2006), 10Marshall
(1978), 11Lehmkuhl et al. (2010).

40
Table 5. Comparison between Diploneis sp. and five other species of the genera Diploneis with similar morphological structures. References to each species are presented below. Diploneis sp. is most similar to D. pseudovalis, however, size and areolae structures are different. Note that the valve size of Diploneis sp. is significantly smaller than compared species. This may be related to natural valve size variations during the life cycle, or be an indication of limiting environmental conditions. Diploneis sp. is interpreted to be brackish as identified frustules mainly co-occur with brackish species. Diploneis sp. may be considered as a species not earlier described. ESEM micrographs of Diploneis sp. are presented in Appendix 5.
1 Krammer & Lange-Bertalot (1986), 2Witkowski (2000), 3Hemphill-Haley & Lewis (1993), 4Foged (1975), 5Jovanovska et al. (2013)
Species Valve length (µm)
Valve width
µm
Transapical striae/10
µm
Transapical striae structure
Areolae structure
Character of the raphe
Character of the sternum
Valve outline
Ecology
Diploneis sp. (present study)
n=10
8.5-20 5-11 9-14 Slightly radiate near raphe
ends, one row of areolae
between raphe and apical
striae
Systematic, biseriate between costae,
arranged in quincunx
Slightly recurved at
proximal raphe slits and at the raphe ends
Transapical, elliptic at central nodule
Elongate-elliptic and
ends rounded
Brackish
D. pseudovalis1,2,3
16-31 9-14 8-12 Slightly radiate near raphe
ends, one row of areolae
between raphe and apical
striae
Biseriate between costae, rarely
arranged in quincunx
Slightly recurved at
proximal raphe slits
Transapical, rounded shape at central nodule
Elongate-elliptic and
ends rounded
Brackish
D. ovalis1,3
20-100 10-35 10-19 Slightly radiate near raphe
ends, one row of areolae
between raphe and apical
striae
Uniseriate between
transapical costae
Slightly recurved at
proximal raphe slits
Large oval central nodule
Wide-elliptic and
ends rounded
Indifferent
D. vetusa5
15-23 9-12.5
10-12 Slightly radiate near raphe
ends, areolae, and two rows of areolae at
the longitudinal canal
Biseriate, cribra
Slightly recurved at
proximal raphe slits
and significant
recurved at raphe ends
Transapical, elliptic
around the central nodule
Elliptic and ends
rounded
Indifferent
D. subovalis1,3
10-50 8-20 10-12 Radiate, an isolated row of areolae along longitudinal
canals and two rows of areolae
at the longitudinal
canal
Biseriate, arranged in
quincunx
Slightly broad
Large oval central nodule
Elliptical to linear-
elliptic and ends
rounded
Freshwater
D. smithii1,3,4
12-200 6.5-75
5-15 Radiate, longitudinal
canals broader in the middle
Biseriate, arranged in
quincunx
Broader at sternum
Varying size, round-square to elliptic at
central nodule
Wide-elliptic, linear-elliptic,
rhombic-elliptic and
ends rounded
Marine

41
5. Discussion
The discussion will mainly focus on taxonomic remarks, the salinity gradient and taphonomy.
It is generally suggested that the diatom assemblages within the lower Save River are
affected by several taphonomic processes. These may further aggravate the interpretation
of salinity levels, based on diatom analysis.
5.1 Taxonomy
In the present investigation two unidentified taxa of the genera Cyclotella and Diploneis
were noted and compared with earlier described species (Tables 4 and 5). Since frustule
characteristics did not agree in detail they are suggested to represent not earlier described
taxa. For example, diameter and length were generally smaller. Caution has to be taken,
however, since a limited number of frustules were encountered. Further analyses on
additional frustules using SEM should be beneficial and is also required to establish new
species with greater certainty.
Occurrences of unusually small diatoms, in relation to descriptions in floras, are especially
high in water samples and surface sediments. These are exemplified by Thalassiosira
eccentrica, Th. oestrupii, Diploneis interrupta, Diploneis sp., Luticola mutica and L. mutica v.
undulata. Size differences within a species community are commonly known as the size
reduction series (Hense & Beckmann, 2015; Falkowski & Knoll, 2007; Mann & Droop, 1996),
or caused by environmental factors (Finkel et al., 2009).
Considering all types of samples Diploneis interrupta is one of the most common taxon
(Appendices 3 and 6). Reference literature is not consistent regarding ecological preferences
for this species. Commonly, the taxon is associated with brackish water conditions (e.g. Zong
& Horton, 1998; Sandgren et al., 1999; Zalat, 2000; Zalat & Vildary, 2007). Vos & de Wolf
(1993:2) and Espinosa (2006) suggested a preference for brackish water and aerophilic
conditions. Earlier Vos & de Wolf (1988) stated that the species lived only in aerophilic
environments. D. interrupta occur together with other taxa representing various salinities.
Therefore, optimal salinity conditions for D. interrupta cannot be determined based on
geographical location and associated diatom taxa. Normally, these factors may act as guides
in dynamic environments such as deltas (Håkansson, 1996). As most of the literature refers

42
to the species as brackish, D. interrupta is in this investigation considered to be associated
with brackish conditions. Frequent occurrences of D. interrupta are also observed in the
material analyzed in Massuanganhe et al. (2016a). This species is heavily silicified and
therefore resistant to physical breakage and chemical dissolution (Furnas, 1990; Round et
al., 1990; Martin-Jézéquel et al., 2000). As this taxon has higher potential for surviving and
being well preserved under dynamic conditions there is a risk for over-representation. Thus,
interpretations based on stratigraphical and/or geographical distributions of D. interrupta
should be made with caution. In this study, observations of frustules were made up-stream
within the river channel (M32), both in surface sediments and surface water samples. This is
the single brackish water taxon in these samples representing 67 % and 2 % of taxa
identified. Note that the basic sum for diatoms observed in the surface sediment samples is
only 7.5 frustules. The surface water sample contained abundant diatoms resulting in a basic
sum of 267. The frustules identified could possibly have been brought by canoes and/or
birds (cf. Rothlisberger et al., 2010; Kilroy & Unwin, 2011), which could explain the
improbable geographical location. Some D. interrupta could theoretically live at M32 as high
evaporation may cause periods of increased salinity. It is, however, more likely that D.
interrupta is tolerant to a wide range of salinity, which previous investigations mentioned
above suggest (e.g. Vos & de Wolf, 1988; Vos & de Wolf, 1993:2; Zong & Horton, 1998;
Sandgren et al., 1999; Zalat, 2000; Espinosa, 2006; Zalat & Vildary, 2007).
5.2 Salinity gradient
The relationship between surface salinity gradients and diatom assemblages have been
studied in earlier investigations, e.g. John (1987), Bloom et al. (2003) and Jiang (1996), but
there is a lack of investigations from the east African coastal zone and deltaic environments.
Pie charts in Figures 8 A, 9 A and 10 A present the interpreted salinity based on identified
diatom species in samples from surface sediments, surface water and cortex within Subarea
1. The charts from surface sediment samples display a low occurrence of marine taxa in
relation to samples from surface water (Figures 9 A and 8 A). In samples from surface
sediments, the relation brackish/marine frustules is c.3.0. The low occurrence of marine
species may indicate a strong influence by the Save River also near the delta front. The
relation brackish/marine frustules for surface water samples is c.1.0 (Figure 8 A). This

43
number is much lower, despite sample collections from Subarea 1. It is, however, notable
that diatom communities in surface sediments and surface water samples consist of both
autochthonous and allochthonous diatoms. Therefore, these samples may not represent
salinity conditions at the sampled sites.
Diatoms scraped from mangrove cortex are likely of autochthonous origin, consisting almost
exclusively of benthic taxa (Figure 10 and Appendix 3). Those few planktonic species
identified can have been captured by mistake during the sampling procedure since scraping
was done beneath the water surface. Vos and de Wolf (1993:1) support the suggestion of
benthic diatoms being autochthonous. The relation between brackish and marine frustules
in the cortex samples is c.1.1. Since the relation in surface water samples is comparable
(c.1.0), it is suggested that those samples reflect salinity water conditions within Subarea 1.
Diatom analysis of surface sediment samples regarding salinity may underestimate prevalent
conditions within Subarea 1, due to influences by various taphonomic processes, and should
thus be interpreted with caution. This statement is supported by Hutchinson et al. (1995)
who identified inconsistences between modern and fossil diatom assemblages in the Fraser
River delta, Canada, probably caused by taphonomic processes. Because of presence of
these extensive taphonomic processes within the investigated area, diatom analysis on
sediments in paleoenvironmental studies is recommended to be interpreted with caution.
Further investigations on sediments should be conducted before results can be interpreted
as reliable.
Both the surface water sample and surface sediment at M11 show, in relation to its
geographical location, an unexpected distribution of diatom taxa (Figures 8 A and 9 A). In the
surface sediments diatoms preferring freshwater conditions are abundant representing c. 22
% (basic sum 33). The surface water sample shows a relatively high proportion of marine
taxa in comparison to nearby sites (c. 84%, basic sum 136). As M11 is relatively close to the
ocean a high abundance of marine taxa is anticipated as compared to high occurrences of
freshwater species. Therefore, frustules representing freshwater conditions are suggested to
be of allochthonous origin and thus not representative of the salinity at M11. The sample
from surface sediments has a high proportion of sand, which is in interpreted to characterize
fluvial conditions. Based on the above discussion it is suggested that the area around M11

44
(approximately 10 km upstream the delta front) may represent the transition from strong
ocean water influences to more freshwater, i.e. fluvial, conditions, at the time of sampling.
This is supported by the mangrove distribution, which was present from the delta front to
approximately M13 (c. 1.1 km upstream from M11).
5.3 Taphonomy Discussions in this section are based on diatom distributions in samples collected by the
author and Elidio Massuanganhe for his doctoral thesis (Massuanganhe, 2016).
Processes on taphonomy affect the diatom frustules during both sedimentation and
accumulation. Examples of these are chemical corrosion and reworking, which may result in
physical breakage and redistribution/re-accumulation of frustules (e.g. Behrensmeyer et al.,
2000; Hassan et al., 2006; Korhola, 2007). In the discussion above regarding the salinity
gradient it is suggested that diatom analyses of surface sediments may underestimate
contemporary salinity conditions within Subarea 1. This fact was established as relations
between marine and brackish species differ in samples from surface sediments and surface
water within the investigated area, which most likely is caused by taphonomic processes.
Before discussing probable processes within the lower Save River, it is notable that there is a
difference in the time period represented by surface water samples and surface sediment
samples. The surface water in the river is in constant motion and captured diatoms
represent only the time interval when the sample was collected. Each surface sediment
sample represent an unknown time period, however, substantially longer.
According to Fritz et al. (1993), Gasse et al. (1997), Reed (1998), Ryves et al. (2006) and
Ryves et al. (2009) poor preservation of diatoms is a potential reason to why diatom
analyses of buried sediments may generate misrepresentative salinities. A well-known
problem in brackish and/or marine conditions involves chemical dissolution of diatom
frustules (Flower, 1993; Straub, 1993; DeMaster & Pope, 1996; Bradshaw et al., 2005; Ryves
et al., 2006). Parts of the Save River delta is occupied by mangrove forest, which takes up
dissolved silica from sediments (e.g. Fulweiler & Nixon, 2005; Struyf & Conley, 2008; Epstein,
2009). High uptake may cause chemical corrosion of the inorganic amorphous silica that
builds up the frustules of diatoms in sediments (Castro et al., 2013; Ryves et al., 2013; Struyf

45
& Conley, 2008; Epstein, 2009; Das et al., 2014). The absence of unusually small frustules in
earlier accumulated sediments can be related to longer exposure-time to vegetative uptake
of silica. Thereby smaller diatoms may have been fully dissolved, resulting in a relative
increase in larger and more robust frustules. Dissolution and fragmentation of frustules are
suggested to potentially be caused by high bacterial activity (Bidle & Azam, 1999; Struyf et
al., 2005) and zooplankton grazing (Levin et al., 1999; Cohen, 2003). During high uptake of
silica in sediments (e.g. Fulweiler & Nixon, 2005; Struyf & Conley, 2008; Epstein, 2009)
and/or river flooding (Jacobs et al., 2013) the soil can be under-saturated in silica. This can
further limit diatom growth and cell division (Furnas, 1990; Round et al., 1990; Martin-
Jézéquel et al., 2000; Cohen, 2003; Litchman et al., 2008), which can be an additional cause
to the unusually small-sized diatoms.
Barker et al. (1990) suggest chemical corrosion to increase during alkaline conditions and
higher salinities. Fore & Grafe (2002) have identified several alkaliphilic diatom species in
Idaho, USA, which are also recognized in the present study. Examples of these taxa are
Aulacoseira granulata, Fragilaria construens, F. construens v. venter, F. brevistrata, F.
pinnata, F. leptostaruron, Navicula mutica, N. goeppertiana, Cyclotella meneghiniana,
Gyrosigma attenatum, Epthemia turgida, E. sorex, Rhopalodia gibba, Cocconeis placentula
and Surirella brebisonii. Gasse (1986) have also classified Hantzschia amphioxys, Nitzschia
sigma, Navicula smithii, Cyclotella striata and Campylodiscus clypeus as alkaliphilic from
samples collected in eastern Africa. These taxa are also identified in samples from the
present study, thus indicating alkaline conditions in the lower Save River. The increased pH
may derive from the underlying calcium-rich bedrock (Schetselaar et al., 2008). Mixture of
acidic water from the upper drainage system and alkaline water in the lower part and in the
delta may imply neutral pH in the studied area, which is indicated by two pH measurements.
As the diatom taxa indicate conditions of higher pH, local variations are most likely
occurring. Alkaline environments can thus be an additional cause to the absence of thinly
silicified frustules since these taxa are not easily preserved under such conditions. This is
supported by Reed (1998) who suggests that increased dissolution in alkaline conditions can
lead to absence of certain taxa, thus biasing the interpretation. Further, Cohen (2003) state
high pressure may also increase dissolution. Increased pressure may affect diatom frustules
at the deepest parts of a river channel. Note that none surface water sample in present

46
study was collected from depths exceeding 50 cm. Sediment could, however, have been re-
suspended and re-deposited after previous burial under deep water conditions.
Chaetoceros spp is one of the most common marine genus of diatoms (Round et al., 1990)
and have been identified in the northwestern Indian Ocean (e.g. Thorrington-Smith, 1971;
Sorokin et al., 1985; Vidya et al., 2013). Furthermore, Chaetoceros spp also exist in brackish
water conditions (Rijstenbil & Merks, 1981; Nwadiaro & Ezefili, 1986; Risberg, 1990) and
were therefore expected in the sediment samples from the delta area. As species of this
genus are thinly silicified they are less resistant to chemical corrosion and easily completely
dissolved. Further, the lack of vegetative cells of Chaetoceros spp in the present study
indicates that they have been dissolved in the delta. The absence of resting spores of
Chaetoceros spp may support presence of increased dissolution of silica within the
sediments, which is suggested in sub-chapter 5.1 Taxonomy. This statement is supported by
investigations in the St Helena Bay, South Africa where it is suggested that sediment traps
and samples from sediment/water interface were dominated by resting spores (cf. Pitcher,
1986). The water column, however, contained abundant vegetative cells. Further, a
relationship between authigenic mineral formation and biogenic silica may be present in
deltaic environments. This is suggested to occur either through direct conversion of the
siliceous diatom frustules or as a part of the precipitation of authigenic aluminosilicate
(Chamely & Millot, 1972; Hurd, 1973; Van Bennekom & Van der Gaast, 1976; Badaut &
Risarcher, 1982; Cole, 1985; Banfield et al., 1991). Thus, portions of biogenic silica are
potentially converted to and/or replaced by K- and Fe-rich aluminosilicate minerals in
depositional areas (Mackenzie & Garrels, 1966; Wollast & de Broeu, 1971; Ristvet, 1978;
Michalopoulos & Aller, 1995; Michalopoulos et al., 2000). This process may be an additional
cause to why sediment in the Save River delta is not representing current water salinity
conditions.
The Save River delta is a dynamic environment with tides and re-occurring flooding events,
which generate turbulent water and reworking of sediments (Overeem & Syvitski, 2009).
Strong winds can also cause resuspension of sediment and thus diatoms (cf. Mitbavkar &
Anil, 2002). During dynamic conditions diatom frustules are vulnerable for breakage, but
they may also be reworked and accumulated elsewhere. Compaction of sediments may be a

47
contributory cause of breakage, especially regarding thinly silicified frustules. Further,
mangrove roots are suggested to trap sediments more effectively than other vegetation
(Scoffin, 1970), which may cause fast compaction of sediments. Several deltaic wetland
areas are today experiencing less sediment supply due to damming of upstream rivers
(Syvitski et al., 2009). In the drainage system of Save River a number of dams have been
constructed, e.g. in Insiza River, Zimbabwe (Kileshye Onema et al., 2006) implying that
preservation could be more favorable at present. According to Sherrod (1999) and Sawai
(2001) the taphonomic problems of dynamic environments is widespread in tidal
environments and may cause inaccurate interpretations of salinity (Denys, 1994). This can be
a possible explanation for the mixture of diatom species, concerning their optimal salinity,
within the lower Save River. Reworking and re-distribution of sediment may also occur due
to fluctuations of the halocline, i.e. salinity stratification. During rising flooding conditions,
until high tide, heavier saline water reaches into river channels as an expanding tongue
along the bottom (e.g. Largier & Taljaard, 1991; Schumann & Pearce, 1997). Theoretically,
sediments and accumulated diatoms, which include planktonic, benthic, living and fossils,
could be redistributed through resuspension and/or redepositing when the halocline
oscillates (Figure 18).

48
Figure 18. An interpretation of how the salinity stratification and position of a halocline can vary during different tidal conditions within the Save River delta. Diatom frustules within the oval areas may be re-distributed and re-deposited during changes of tidal conditions. 10 km represents the distance diatoms may be transported in the Save River delta, i.e. approximately between M4 and M11. The upper picture displays positioning of the stratification and the halocline during low tide. The gradient between the freshwater and the brackish water are relatively steep and the heavier saline water do not reach far into the delta. The lower picture shows the position during high tide. Saline water expands further into the delta and the gradient is not as steep as during low tide.
This process assumes, however, that both the solid and dashed ovals (Figure 18) are located
within an accumulation area. Within the Save River delta it seems as diatoms may be
transported along a c. 10 km long stretch, approximately between M4 and M11, caused by
tidal processes. This implies that freshwater and brackish taxa, both living and fossil, could
be mixed along this section. These scenarios are only possible if the photic zone reaches
below the halocline. The before proposed underestimation of contemporary salinity
conditions in surface sediments within subarea 1, may partly be caused by the varying
position of the halocline.
All sample categories show similarity regarding the most common diatom communities, e.g.
Thalassiosira eccentrica, Nitzschia granulata, Hantzschia distinctepunctata, Diploneis sp., D.
interrupta, D. pseudovalis, Cyclotella sp. and Melosira nummuloides (cf. Appendix 3). Note

49
that these taxa represent brackish or marine conditions. Especially brackish species occur in
samples from Subareas 1-3 (Figure 1). Further, this distribution of brackish taxa can be
related to taphonomic effects caused by fluctuating halocline as discussed above. Brackish
species may have been redeposited during high tide when saline water reaches further into
the delta and the river channel. Note, however, that the number of identified brackish taxa
is varying and occasional frustules may have been brought by birds (Atkinson, 1980;
Figuerola & Green, 2002) and/or human activities (Hallegraeff & Bolch, 1992; Rothlisberger
et al., 2010; Kilroy & Unwin, 2011).
5.4 OSL and radiocarbon dating
At site M9 two samples for OSL-dating were collected, M9 and M9V. Despite the difference
in depth (330 cm and 180 cm) they indicate similar ages, i.e. 920 ± 90 yrs and 890 ± 100 yrs
BP, respectively. OSL-dates at site P2 (Massuanganhe et al., 2016a) also indicate equal ages
at two different depths; c. 250 yrs at 500 cm and 200 cm depths. Ages at deeper depths are
expected to show older ages, however, the related OSL-ages at M9 and P2 can be explain by
reworking of sediments. Similar ages may also be a result of high accumulation rates
between samples (cf. Roberts et al., 2001). Minerals may furthermore be partly incomplete
bleached, commonly occurring in fluvial environments. Incomplete bleaching can imply
overestimated ages and explain the minor difference of ages, despite different depths
(Preusser et al., 2008).
Radiocarbon samples at P2 (Massuanganhe et al., 2016a) do not show ages in chronological
order. At 410 cm depth the sample indicate an age of c. 750 cal. yrs BP, however,
radiocarbon age at 310 cm depth indicate c. 1500 cal. yrs BP. Reverse radiocarbon dates may
be a result from reworking and storage of sediments or hard water effect, commonly
occurring in deltas and fluvial environments (Stanley & Hait, 2000).
During interpretations of buried sediments in field a geographically extensive clay layer was
been noted. These layers are also identified by Massuanganhe et al. (2016a) and interpreted
as mangrove forest habitat. This interpretation is based on observations of present fine
grained sediments accumulated in mangrove areas. Fine grained layers identified in the

50
present study are also suggested to represent mangrove environments and the analysis thus
corresponds to Massuanganhe et al. (2016a).
5.5 Future studies
To further increase knowledge about the diatom flora of the lower Save River, following
suggestions would be beneficial to add into future investigations.
Collect samples from the bottom of the river channel.
Repeated sampling during different seasons and tidal conditions.
Measurements of the conductivity and pH.
Geochemical analysis of silica in water and sediment.
Hydrological measurements of the Save River; magnitude of river flow, suspended
material and tidal water.
Diatom cultivation in tanks, to distinguish optimal environmental conditions.
Additional OSL- and radiocarbon ages.
Study more frustules with ESEM.
Additional research on Cyclotella sp. and Diploneis sp. to identify them to species
level.
51
6. Conclusions
The investigation resulted in 68 diatom genera and 263 species. In general, characteristic
species are Nitzschia granulata, N. littoralis, Hantzschia distictepunctata, Cyclotella sp.,
Thalassiosira eccentrica, Diploneis sp. and D. interrupta. In Subarea 1 typical species are
Cyclotella sp., C. stylorum and Nitzschia littoralis. In Subarea 2 characteristic species are
Amphora libyca, Diploneis interrupta and Hantzschia distinctepunctata. Characteristic
species in Subarea 3 are Aulacoseira alpigena, Diploneis interrupta and Hantzschia
amphioxys.
Two commonly occurring diatom taxa were not possible to identify to species level;
Diploneis sp. and Cyclotella sp. These are associated with brackish water conditions based on
geographical occurrences and accompanying species compositions. Furthermore, small
species of Opephora spp, Nitzschia spp, Navicula mutica, Navicula spp and Melosira
nummuloides are identified.
Diatom analysis indicates that there is a latitudinal decline in salinity from east to west.
Generally, Subarea 1 is characterized by marine and brackish species. In Subarea 2
indifferent and brackish taxa occur while Subarea 3 is dominated by brackish, indifferent and
freshwater species. There are indications of a transition from ocean water influences to
more fluvial conditions at the area around M11, i.e. close the boundary Subarea 1 and
Subarea 2. Diatom assemblages from surface sediments suggest an underestimation of
prevalent salinity conditions within Subarea 1 as they do not correspond to communities
growing on mangrove cortex. These species are interpreted to be more representative for
salinity conditions as they consist of merely benthic species.
Processes on the taphonomy are interpreted to be the main reason for the underestimations
of salinity in Subarea 1. The lower Save River is affected by several geomorphological
processes and is underlain by calcareous bedrock causing alkaline conditions. Reworking of
sediments and chemical corrosion are suggested to be dominant taphonomic processes
biasing interpretations. Prevalent conditions in the lower Save River indicated that
interpretations based on diatom analysis should be treated with caution. Samples collected
from benthic habitats (cortex) and water is suggested to be more reliable compared to
52
surface and buried sediments. Further studies are recommended before interpretations of
sediments can be used with confidence.
7. Acknowledgement
I would like to thank my supervisor Jan Risberg at the Department of Physical Geography for
supporting me in my initiative to write my master thesis about the lower Save River. Jan has
also assisted during field work and helped during laboratory work, diatom analysis and the
writing process. I would also like to thank Elidio Massuanganhe at Eduardo Mondlane
University, Maputo, for invaluable support during field work and geomorphological
interpretation during the analysis. Thanks to Lars-Ove Westerberg at the Department of
Physical Geography, who participated in the field work, and to the boat driver Albino Vasco
Chidala. I would like to thank Annika Berntsson and Christos Katrantsiotis at the Department
of Physical Geography and David Siqueiros-Beltrones at the National Polytechnic Institute,
Mexico City, for indispensable help during diatom analysis. Last but not least I would like to
thank Marika Wennbom and Sven Karlsson at the Department of Physical Geography and
Marianne Ahlbom at the Department of Geological Sciences for technical assistance of GIS,
light microscopes and ESEM. Stefan Bjursäter at the Department of Physical Geography has
performed the laboratory preparations and the measurements of the OSL samples and
interpreted the ages.

53
8. References
Abrantes, F. 2000. 200 000 yr diatom records from Atlantic upwelling sites reveal maximum productivity during LGM and a shift in phytoplankton community structure at 185 000 yr. Earth and Planetary Science Letters 176:1, 7-16.
Alfinito, S., Iberite, M. & Fumati, B. 1990. The algal microflora of the salt works of Tarquinia (Italy). Hydrobiologia 203, 137-146.
Alongi, D.M. 2002. Present state and future of the world’s mangrove forests. Environmental Conservation 29:3, 331-349.
Andrews, G.W. 1972. Some fallacies of quantitative diatom paleontology. Nova Hedwigia 39, 285-295.
Andrews, J.T., Domack, E.W., Cunningham, W.L., Leventer, A., Licht, K.J., Timothy Jull, A.J., DeMaster, D.J. & Jennings A.E. 1999. Problems and possible solutions concerning radiocarbon dating of surface marine sediments, Ross Sea, Antarctica. Quaternary Research 52, 206-216.
Asmus, R. 1982. Field measurements on seasonal variation of the activity of primary producers on a sandy tidal flat in the Northern Wadden Sea. Netherlands Journal of Sea Research 16, 389-402.
Atkinson, K.M. 1980. Experiments in dispersal of phytoplankton by ducks. British Phycological Journal 15, 49-58.
Badaut, D. & Risarcher, F. 1982. Authigenic smectite on diatom frustules in Bolivian saline lakes. Geochimica et Cosmochimica Acta 47, 363-375.
Bailey, R.M. & Arnold, L.J. 2006. Statistical modelling of single grain quartz D-e distributions and an assessment of procedures for estimating burial dose. Quaternary Science Reviews 25, 2475-2502.
Bala, R.P., Nakamura, T., Sajeev, K. & Sukumar R. 2016. High-resolution age-depth chronology from tropical montane minerotrophic peat in the Sandynallah Valley, Western Ghats, southern India: Analytical issues and implications. Quaternary Geochronology 34, 12-23.
Ball, M. C. and Pidsley S. M. 1995. Growth responses to salinity in relation to distribution of two mangrove species, Sonneratia alba and S. lanceolata, in Northern Australia. Functional Ecology 9, 77-85.
Bandeira, S. O., Macamo, C. C. F., Kairo, J. G., Amade, F., Jiddawi, N. & Paula, J. 2009. Evaluation of mangrove structure and condition in two trans-boundary areas in the Western Indian Ocean. Aquatic Conservation: Marine and Freshwater Ecosystems 19, S46-S55.
Banfield, J.F., Jones, B.F. & Veblen, D.R. 1991. An AEM-TEM study of the weathering and diagenesis, Abert Lake, Oregon; II. Diagenetic modifications of the sedimentary assemblage. Geochimica et Cosmochimica Acta 55, 2795-2810.
Barker, P., Gasse, F., Roberts, N. & Taieb, M. 1990. Taphonomy and diagenesis in diatom assemblages; a Late Pleistocene palaeoecological study from Lake Magadi, Kenya. Hydrobiologia 214, 267-272.
Battarbee, R.W. 1986. Diatom analysis. In B.E. Berglund, (ed.), Handbook of Holocene Palaeoecology & Palaeohydrology. Chichester and New York: John Wiley. 527-570.
Behling, H., Cohen, M. L. & Lara. R. 2004. Late Holocene mangrove dynamics of Marajó Island in Amazonia, northern Brazil. Vegetation History and Archaeobotany 13, 73-80.

54
Behrensmeyer, A.K., Kidwell, S.M. & Gastaldo, R.A. 2000. Taphonomy and paleobiology. Paleobiology 26, 103-147.
Bennion, H. 1995. Surface-sediment diatom assemblages in shallow, artificial, enriched ponds, and implications for reconstructing trophic status. Diatom Research 10:1, 1-19.
Beyens, L. & Denys, L. 1982. Problems in diatom analysis of deposits: allochthonous valves and fragmentation. Geologie en Mijnbouw 61, 159-162.
Bidle, K.D. & Azam, F. 1999. Accelerated dissolution of diatom silica by marine bacterial assemblages. Nature 397, 508-512.
Bishop, P., Sanderson, D.C.W. & Stark, M.T. 2004. OSL and radiocarbon of a pre-Angkorian canal in the Mekong delta, southern Cambodia. Journal of Archaeological Science 31:3, 319-336.
Bloom, A.M., Moser, K.A., Porinchu, D.F. & MacDonald, G,M. 2003. Diatom-inference models for surface-water temperature and salinity developed from a 57-lake calibration set from the Sierra Nevada, California, USA. Journal of Paleolimnology 29, 235-255.
Boto, K.G. & Wellington, J.T. 1984. Soil characteristics and nutrient status in a northern Australian mangrove forest. Estuaries 7:1, 61-69.
Bradshaw, E.G., Rasmussen, P., Nielsen, H. & Anderson, N.J. 2005. Mid- to late-Holocene land-use change and lake development at Dallud So, Denmark: trends in lake primary production as reflected by algal and macrophyte remains. Holocene 15, 1130-1142.
Braiser, M.D. 1980. Microfossils. London: George Allen & Unwin. 193 pp. Brzezinski, M.A., Vilarreal, T.A. & Lipschultz, F. 1999. Silica production and the contribution of
diatoms to new and primary production in the central North Pacific. Marine Ecology Progress Series 167, 89-104.
Burchett, M. D., Field, C. D., & Pulkownik, A. 1984. Salinity, growth and root respiration in the grey mangrove, Avicennia marina. Physiologia Plantarum 60, 113-118.
Cameron, N.G. 1995. The representation of diatom communities by fossil assemblages in a small acid lake. Journal of Paleolimnology 14, 185-223.
Cameron, W.M. & Pritchard, D.W. 1963. Estuaries. In M.N Hill (ed.). The Sea. John Wiley & Sons: New York, Vol. 2. 302-324.
Castro, D.F., Rossetti, D.F., Cohen, M.C.L., Pessenda, L.C.R. & Lorente, F.L. 2013. The growth of the Doce River delta in northeastern Brazil indicated by sedimentary facies and diatoms. Diatom Research 28:4, 455-466.
Chaudhuri, P., Ghosh, S., Bakshi, M., Bhattacharyya, S. & Nath, B. 2015. A Review of Threats and Vulnerabilities to Mangrove Habitats: With Special Emphasis on East Coast of India. Journal Earth Science and Climatic Change 6:4, 1-9.
Chamely, H. & Millot, G. 1972. Neoformation de montmorillonite a partir de diatomees et de cendres dans les sediments marins de Santorin; mediterranee orientale. Paris, Academie des Sciences Comtes Rendus 274, 1132-1134.
Chorowicz, J. 2005. The East African rift system. Journal of African Earth Sciences 43, 379-410. Church, J. A. et al. in Climate Change 2013: The Physical Science Basis. Contribution of
Working Group I to the Fifth Assessment Report of the Intergovernmental Panel on Climate Change (eds Stocker, T. F. et al.) Ch. 13. Cambridge University Press.
Cleve-Euler, A., 1951. Die diatomeen von Schweden und Finnland. Almquist & Wiksells boktryckeri AB: Stockholm. 218 pp.
Cohn, S.A., Spurck, T.P., Pickett, J.D. & Edgar, L.A. 1989. Perizonium and initial valve formation in the diatom Navicula cuspidata (Bacillariophyceae). Journal of Phycology 25:1, 15-26.

55
Cohen, A.S. 2003. Paleolimnology. Oxford University Press: New York. 525 pp. Çolak Sabanci, F. & Koray, T. 2010. Four new records for the benthic diatoms (genera
Cocconeis, Seminavis, Synedra, and Trachysphenia) from the Aegean Sea. Turkish Journal of Botany 34, 531-540.
Cole, T.G. 1985. Composition, oxygen isotope geochemistry, and origin of smectite in the metalliferous sediments of the Bauer Deep, Southeast Pacific. Geochimica et Cosmochimica Acta 49, 221-235.
Cooper, S.R. 1999. Estuarine paleoenvironmental reconstructions using diatoms. In: E.F. Stroemer & J.P. Smol (eds), The diatoms: applications for the environmental and earth sciences. Cambridge University Press: London. 352-373 pp.
Cota, G.F., Legendre, L., Grosselin, M. & Ingram, R.G. 1991. Ecology of bottom ice algae: I. Environmental controls and variability. Journal of Marine Systems 2, 257–277.
Danilatos, G.D. 1988. Foundations of environmental scanning electron microscope. In P.W. Hawkes (ed.). Advances in Electronics and Electron Physics vol. 71. London: Academic Press Inc. 110-248.
Danilatos, G.D. 1993. Introduction to the ESEM Instrument. Microscopy Research and Technique 25, 354-361.
Das, S., Ghosh, R., Paruya, D.K, Yao, Y.-F., Li, C.-S. & Bera, S. 2014. Phytolith spectra in respiratory aerial roots of some mangrove plants of the Indian Sunderbans and its efficacy in ancient deltaic environment reconstruction. Quaternary International 325, 179-196.
Dawson, S. & Smith, D.E. 2000. The sedimentology of Middle Holocene tsunami facies in northern Sutherland, Scotland, UK. Marine Geology 170:1-2, 69-79.
de Blij, H.J., Muller, P.O. & Williams, R.S. Jr. 2004. Physical geography the global environment 3rd ed. New York: Oxford University Press. 702 pp.
De Boer, W.F., Ntumi, C.P., Correia, A.U. & Mafuca, J.M. 2000. Diet and distribution of elephant in the Maputo Elephant Reserve, Mozambique. African Journal of Ecology 38, 188-201.
DeMaster, D.J. & Pope, R.H. 1996. Nutrients dynamics in Amazon shelf waters: Results from AMASSEDS. Continental Shelf Research 16, 263-289.
Denys, L. & de Wolf, H. 1999. Diatoms as indicators of coastal paleo-environments and relative sea-level change. In E.F Stoermer & J.P Smol (eds), The Diatoms. Applications for the Environmental and Earth Sciences, Cambridge University Press: Cambridge. 277–297 pp.
Denys, L. 1994. Diatom assemblages along a former intertidal gradient: A paleoecological study of a Subboreal clay layer (western coastal plain, Belgium). Netherlands journal of Aquatic Ecology 28:1, 85-96.
Denys, L. 1999. A diatom and radiocarbon perspective of the palaeoenvironmental history and stratigraphy of Holocene deposits between Oostende and Nieuwpoort (western coastal plain Belgium). Geologica Belgica 2, 111–140.
Donadel, L., Cardoso, L. de S. & Torgan, L.C. 2016. Plankton community dynamics in a subtropical lagoonal system and related factors. Annals of the Brazilian Academy of Sciences 88:1, 249-267.
Dunck, B., de Souza Nogueira, I. & das Graças Machado, M. 2012. Planktonic diatoms in lotic and lentic environments in the Lago dos Tigres hydrologic system (Britânia, Goiás, Brazil): Coscinodiscophyceae and Fragilariophyceae. Brazilian Journal of Botany 35:2, 181-193.

56
Ehrlich, H.L. & Newman, D.K. 2008. Geomicrobiology 5th ed. CRC Press: Boca Raton, FL. 606 pp.
Ellison, J. C. & Stoddart, D. R.. 1991. Mangrove ecosystem collapse during predicted sea-level rise: Holocene analogues and implications. Journal of Coastal Research 7, 151-165.
Ellison, J. C. 2008. Long-term retrospection on mangrove development using sediments cores and pollen analysis: A review. Aquatic Botany 89, 93-104.
Epstein, E. 2009. Silicon: its manifold roles in plants. Annals of Applied Biology 155, 155-160. Erftemeijer, P. L. & Hamerlynck, O. 2005. Die-back of the mangrove Heritiera littoralis
dryland, in the Rufiji Delta (Tanzania) following El Nino floods. Journal of Coastal Research 42, 228-235.
Erginal, A.E., Kiyak, N.G. & Özcan, H. 2009. Optically stimulated luminescence to date coastal dunes and a possible tsunami layer on the Kavak delta (Saros Gulf, NW Turkey). Turkish Journal of Earth Sciences 18, 465-474.
Espinosa, M.A. 1994. Diatom paleoecology of the Mar Chiquita lagoon delta, Argentina. Journal of Paleolimnology 10, 17-23.
Falkowski, P.G. & Knoll, A.H. 2007. Evolution of primary producers in the Sea. London: Elsevier Academic Press. 441 pp.
Ferguson Wood, E.J. 1967. Microbiology of oceans and estuaries vol. 3. Elsevier oceanography series: Netherlands. 318 pp.
Figuerola, J. & Green, A.J. 2002. Dispersal of aquatic organisms by waterbirds: a review of past research and priorities for future studies. Freshwater Biology 47, 483.494.
Finkel, Z, V., Vaillancourt, C.J., Irwin, A.J., Reavie, E.D. & Smol, J.P. 2009. Environmental control of diatom community size structure varies across aquatic ecosystems. Proceeding of The Royal Society B 276:1662, 1627-1634.
Fleming, K., Johnston, P., Zwartz, D., Yokoyama, Y., Lambeck, K. & Chappell, J. 1998. Refining the eustatic sea-level curve since the Last Glacial Maximum using far- and intermediate-field sites. Earth and Planetary Science Letters 163, 327-342.
Flower, R.J. 1993. Diatom preservation: experiments and observations on dissolution and breakage in modern and fossil material. Hydrobiologia 268/270, 473-484.
Foged, N. 1975. Bibliotheca Phycologica band 16 – Some littoral diatoms from the coast of Tanzania. Ganter Verlag Kommanditgesellschaft, Leutershausen. 126 pp.
Fore, L.S. & Grafe, C. 2002. Using diatoms to assess the biological condition of large rivers in Idaho, (U.S.A.). Freshwater Biology 47, 2015-2037.
França, M. C., I. C. C. Alves, D. F. Castro, M. C. L. Cohen, D. F. Rossetti, L. C. R. Pessenda, F. L. Lorente, N. A. Fontes, A. Á. B. Junior, P. C. F. Giannini, and M. I. Francisquini. 2015. A multi-proxy evidence for the transition from estuarine mangroves to deltaic freshwater marshes, Southeastern Brazil, due to climatic and sea-level changes during the late Holocene. Catena 128, 155-166.
Fritz, S.C., Juggins, S. & Battarbee, R.W. 1993. Diatom assemblages and ionic characterization of lakes of the northern Great Plains, North America: a tool for reconstructing past salinity and climate fluctuations. Canadian Journal of Fisheries and Aquatic Sciences 50, 1844-1856.
Fryxell, G.A. & Hasle, G.R. 1972. Thalassiosira eccentrica (Ehrenb.) Cleve, T. symmetrica sp. nov., and some related centric diatoms. Journal of Phycology 8, 297-317.
Fryxell, G.A. & Hasle, G.R. 1980. The marine diatom Thalassiosira oestrupii: structure, taxonomy and distribution. American Journal of Botany 67:5, 804-814.

57
Fujimoto, K., Miyagi, T., Kikuchi, T. & Kawana, T. 1996. Mangrove habitat formation and response to Holocene sea-level changes on Kosrae Island, Micronesia. Mangroves and Salt Marches 1:1, 47-57.
Fulweiler, R.W. & Nixon, S.C. 2005. Terrestrial vegetation and the seasonal cycle of dissolved silica in a southern New England coastal river. Biogeochemistry 74, 115-130.
Furnas, M.J. 1990. In situ growth rates of marine phytoplankton: approaches to measurement, community and species growth rates. Journal of Plankton Research 12, 1117-1151.
Galbraith, R.F., Roberts, R.G., Laslett, G., Yoshida, H. & Olley, J.M. 1999. Optical dating of single and multiple grains of quartz from jinmium rock shelter, northern Australia: part I, experimental design and statistical models. Archaeometry 41, 339-364.
Gasse, F., 1986. Bibliotheca diatomologica band 11, East African diatoms – Taxonomy, ecological distribution. Gebrüder Borntraeger, Berlin, 291 pp.
Gasse, F., Barker, P., Gell, P.A., Fritz, S.C. & Chalié, F. 1997. Diatom inferred salinity in palaeolakes: an indirect tracer of climate change. Quaternary Science Reviews 16, 547-563.
Gedan, K., Kirwan, M., Wolanski, E., Barbier, E., & Silliman, B. 2011. The present and future role of coastal wetland vegetation in protecting shorelines: answering recent challenges to the paradigm. Climatic Change 106, 7-29.
Geyer, W.R. & Farmer, D.M. 1989. Tide-induced variation of the dynamics of a salt-wedge estuary. Journal of Physical Oceanography 19, 1060-1072.
Gilmore, Jr., R.G. & Snedaker, S.C. 1993. Mangrove Forests. In W.H., Martin, S.G., Boyce & A.C., Echternacht (eds). Biodiversity of the southeastern United States: lowland terrestrial communities. John Wiley & Sons, New York, NY. 502 pp.
Glud, R.N., Kühl, M., Wenzhöfer, F. & Rysgaard, S. 2002. Benthic diatoms of a high Artic fjord (Young Sound, NE Greenland): importance for ecosystem primary production. Marine Ecology Progress series 238, 15-29.
Gottschalk, S. Uthicke, S. & Heimann, K. 2007. Benthic diatom community composition in three regions of the Great Barrier reef, Australia. Coral Reefs 26, 345-357.
Granum, E., Raven, J.A. & Leegood, R.C. 2005. How do marine diatoms fix 10 billion tonnes of inorganic carbon per year?. Canadian Journal of Botany 83, 898-908.
Haas, L.W. 1977. The effect of the spring-neap tidal cycle on the vertical salinity structure of the James, York and Rappahannock Rivers, Virginia, U.S.A. Estuarine and Coastal Marine Science 5:4, 485-496.
Håkansson, H. 1996. Cyclotella striata complex: typification and new combinations. In D. G. Mann & M. J. Sullivan (eds). Diatom Research 11:2, 241-260.
Håkansson, H. 2002. A compilation and evaluation of species in the genera Stephanodiscus, Cylostephanus and Cyclotella with a new genus in the family Stephanodiscaceae. Diatom Research 17:1, 1-139.
Hallegaeff, G.M. & Bolch, C.J. 1992. Transport of diatom and dinoflagellate resting spores in ships’ ballast water: implications for plankton biogeography and aquaculture. Journal of Plankton Research 14:8, 1067-1084.
Harris, A.S.D., Medlin, L.K., Lewis, J. & Jones, K.J. 1995. Thalassiosira species (Bacillariophyceae) from a Scottish sea-loch. European Journal of Phycology 30, 117-131.
Harwood, D.M. 1986. Do diatoms beneath the Greenland ice sheet indicate interglacials warmer than present? Arctic 39:4, 304-308.

58
Hasle, G.R. & Lange, C.B. 1992. Morphology and distribution of Coscinodiscus species from the Oslofjord, Norway, and the Skagerrak, north Atlantic. Diatom research 7, 37-68.
Hasle, G.R. & Sims, P.A. 1986. The Diatom Genus Coscinodiscus Ehrenb.; C. argus Ehrenb. and C. radiatus Ehrenb. Botanica Marina 29:4, 305-318.
Hasle, G.R. 1962. Three Cyclotella species from marine localities studied in the light and electron microscopes. Nova Hedwigia band IV, heft 3+4, 300-307.
Hasle, G.R. 1977. Morphology and taxonomy of Actinocyclus normanii f. subsalsa (Bacillariophyceae). Phycologia 16, 321-328
Hassan, G.S., Espinosa, M.A. & Isla, F.I. 2006. Modern diatom assemblage in surface sediments from estuarine systems in the southeastern Buenos Aires Province, Argentina. Journal of Paleolimnology 35, 39-53.
Hendrarto, I.B. & Nitisuparjo, M. 2010. Biodiversity of benthic diatom and primary productivity of benthic micro-flora in mangrove forests on central Java. Journal of Coastal Development 14:1, 131-140.
Hemphill-Haley, E. & Lewis, R.C. 1993. Distribution and taxonomy of diatoms (Bacillariophyta) in surface samples and a two-meter core from Winslow marsh, Bainbridge Island, Washington. U.S department of the interior, U.S geological survey. 105 pp.
Hense, I. & Beckmann, A. 2015. A theoretical investigation of the diatom cell size reduction- restitution cycle. Ecological Modelling 317, 66-82.
Hillebrand, H. & Sommer, U. 2000. Effects of continuous nutrient enrichment on microalgae colonizing hard substrates. Hydrobiologia 426, 185-192.
Holmgren, K., Risberg, J., Freudendahl, J., Achimo, M., Ekblom, A., Mugabe, J., Norström, E. & Sitoe, S. 2012. Water-level variations in Lake Nhauhache, Mozambique, during the last 2,300 years. Journal of Paleolimnology 48, 311-322.
Hoppenrath, M. 2004. A revised checklist of planktonic diatoms and dinoflagellates from Helgoland (North Sea, German Bight). Helgoland Marine Research 58:4, 243-251.
Hurd, D.C. 1973. Interactions of biogenic opal, sediment and seawater in the central equatorial Pacific. Geochimica et Cosmochimica Acta 37, 2257-2282.
Hsiao, S.I.C. 1988. Spatial and seasonal variations in primary production of sea ice microalgae and phytoplankton in Frobisher Bay, Arctic Canada. Marine Ecology Progress Series 44, 275–285.
Hutchinson, I., Roberts, M.C. & Williams, F.L. 1995. Stratigraphy, diatom biofacies, and paleogeomorphology of a mid Holocene distributary channel system, Fraser River delta, British Columbia, Canada. Journal of Earth Sciences 32, 749-757.
Jackson, D.C. & Lowe, R.L. 1978. Valve ultrastructure of species of the diatom genera Gyrosigma and Pleurosigma from the portage river drainage system, Ohio. Transactions of the American Microscopical Society 97:4, 569-581.
Jacobs, S., Müller, F., Teuchies, J., Oosterlee, L., Struyf, E. & Meire, P. 2013. The vegetation silica pool in a developing tidal freshwater marsh. Silicon 5, 91–100.
Jiang, H. 1996. Diatoms from the surface sediments of the Skagerrak and the Kattegat and their relationship to the spatial changes of environmental variables. Journal of Biogeography 23, 129-137.
Jiang, H., Seidenkrantz, M.-S., Knudsen, K.L. & Eiriksson, J. 2001. Diatom surface sediments assemblages around Iceland and their relationships to oceanic environmental variables. Marine Micropaleontology 41, 73-96.
John, J. 1987. Phytoplankton of the Swan river estuary. In J. John (ed.) The Swan river estuary, ecology and management. Curtin University Environmental Studies Group, report no. 1,

59
71-90. Jørgensen, E.G. 1955. Solubility of the Silica in diatoms. Physiologia Plantarum 8, 846-851. Joshi, H. & Ghose, M. 2003. Forest structure and species distribution along soil salinity and
pH gradient in mangrove swamps of the Sundarbans. Tropical Ecology 44:2, 197-206. Jovanovska, E., Nakov, T. & Levkov, Z. 2013. Observations of the genus Diploneis from lake
Ohrid, Macedonia. Diatom Research 28:3, 237-262. Kathiresan, K. & Bingham, B.L. 2001. Biology of mangroves and mangrove Ecosystems.
Advances in Marine Biology 40, 81-251. Kato, M., Tanimura, Y., Matsuoka, K. & Fukusawa, H. 2003. Planktonic diatoms from sediment
traps in Omura Bay, western Japan with implications for ecological and taphonomic studies of coastal marine environments. Quaternary International 105, 25-31.
Kileshye Onema, J.-M., Mazvimavi, D., Love, D. & Mul, M.L. 2006. Effects of selected dams on river flows of Insiza River, Zimbabwe. Physics and Chemistry of the Earth, Parts A/B/C 31, issues 15-16, 870-875.
Kilroy, C. & Unwin, M. 2011. The arrival and spread of the bloom-forming, freshwater diatom, Didymosphenia geminate, in New Zealand. Aquatic Invasions 6:3, 249-262.
Kociolek, J.P. & Khursevich G.K. 2013. Morphology of some fossil lacustrine centric species from the western United States assigned to the genus Cyclotella (Bacillariophyta), including four described as new. Phytotaxa 127:1, 81-99.
Kokociński, M., Szczuciński, W., Zgrundo, A. & Ibragimow, A. 2009. Diatom assemblages in 26 December 2004 tsunami deposits from coastal zone of Thailand as sediment provenance indicators. Polish Journal of Environmental Studies 18:1, 93-101.
Korhola, A., Weckström, J., Holmström, L. & Erastö, P. 2000. A quantitative Holocene climatic record from diatoms in northern Fennoscandia. Quaternary Research 54, 284-294.
Krammer, K. & Lange-Bertalot, H. 2000. Bacillariophyceae, part 5: English and French translation of the keys, in B. Büdel, G. Gärtner, L. Krienitz, & G.M Lokhorst (eds), Süsswasserflora von Mitteleuropa. Suttguart: Gustac Fischer Verlag, 311 pp.
Krammer, K., and Lange-Bertalot, H., 1986. Bacillariophyceae, v.1. Teil: Naviculaceae, In H. Ettl, G. Gärtner, J. Gerloff, H. Heynig, and D. Mollenhauer, (eds), Süsswasserflora von Mitteleuropa. Stuttgart: Gustav Fischer Verlag, 876 pp.
Krammer, K., and Lange-Bertalot, H., 1988. Bacillariophyceae, v. 2. Teil: Bacillariaceae, Epithemiaceae, Surirellaceae, in H. Ettl, G. Gärtner, J. Gerloff, H. Heynig, and D. Mollenhauer, (eds), Süsswasserflora von Mitteleuropa. Stuttgart: Gustav Fischer Verlag, 596 pp.
Krammer, K., and Lange-Bertalot, H., 1991a. Bacillariophyceae, v. 3. Teil: Centrales, Fragilariaceae, Eunotiaceae, in H. Ettl, G. Gärtner, J. Gerloff, H. Heynig, and D. Mollenhauer, (eds), Süsswasserflora von Mitteleuropa. Stuttgart: Gustav Fischer Verlag, 596 pp.
Krammer, K., and Lange-Bertalot, H., 1991b. Bacillariophyceae, v. 4. Teil: Achnanthaceae: Kritische Ergänzungen zu Navicula (Lineolate) und Gomphonema, in H. Ettl, G. Gärtner, J. Gerloff, H. Heynig, and D. Mollenhauer (eds), Süsswasserflora von Mitteleuropa. Stuttgart: Gustav Fischer Verlag, 437 pp.
Kristensen, E., Bouillon, S., Dittmar, T. & Marchland, C. 2008. Organic carbon dynamics in mangrove ecosystems: a review. Aquatic Botany 89, 201-219.
Lange, C.B. & Syvertsen E.E. 1989. Cyclotella litoralis sp. nov. (Bacillariophyceae), and its relationship to C. striata and C. stylorum. Nova Hedwigia 48, 341-356.

60
Lange-Bertalot, H. & Compére, P. 2001. Fragilaria subgen. Ulnaria, comb. nov., the correct name of the subgenus including Synedra ulna, when treated in Fragilaria. Diatom Research 16:1, 103-104.
Largier, J.L. 1986. Structure and mixing in the Palmiet Estuary, South Africa. South African Journal of Marine Science 4, 139-152.
Largier, J.L. & Taljaard, S. 1991. The dynamics of tidal intrusion, retention, and removal of
seawater in a bar-built estuary. Estuarine, Coastal and Shelf Science 33, 325-338. Largier, J.L. 1992. Tidal intrusion fronts. Estuaries 15:1, 26-39. Le Maitre R.W., (ed.). 2002. Igneous rocks a classification and glossary of terms:
recommendations of the International Union of Geological Sciences, Sub-commission on the Systematics of Igneous Rocks, 2nd ed. Cambridge: Cambridge University Press. 256 pp.
Lee, S. Y. 1999. Tropical mangrove ecology: Physical and biotic factors influencing ecosystem structure and function. Australian Journal of Ecology 24, 355-366.
Lehmkuhl, E.G., Tremarin, P.I., Moreira-Filho, H. & Ludwig, T.A.V. 2010. Thalassiosirales (Diatomeae) da baia de Guaratuba, Estado do Paraná, Brasil. Biota Neotrop 10:2, 313-324.
Levin, S.N., Borchardt, M.A., Braner, M. & Shambaugh, A.D. 1999. The impact of zooplankton grazing on phytoplankton species composition and biomass in Lake Champlain (USA-Canada). Journal of Great Lakes Research 25:1, 61-77.
Levkov, Z. 2009. Diatoms of Europe volume 5. Ed. Lange-Bertalot, H. A.R.G. Gantner Verlag K.G., Königstein. 916 pp.
Lewin, J.C. 1961. The dissolution of silica from diatom walls. Geochimica et Cosmochimica Acta 21, 182-198.
Litchman, E. & Nguyen, B.I.V. 2008. Alkaline Phosphatase Activity as a Function of Internal Phosphorus Concentration in Freshwater Phytoplankton. Journal of Phycology 44, 1379-1383.
López Fuerte, F.O., Siqueiros-Beltrones, D.A. & Navarro, J.N. 2010. Benthic diatoms associated with Mangrove environments in the northwest region of México. Conabio Gobierno Federal: La Paz. 206 pp.
López Fuerte, F.O., Siqueiros-Beltrones, D.A. & Hernández-Almeida O.U. 2013. Epiphytic diatoms of Thalassia testudinum (Hydrocharitaceae) from the Mexican Caribbean. Marine Biodiversity Records 6, 1-11.
López Fuerte, F.O., Siqueiros Beltrones, D.A. Yabur, R. 2015. First record of benthic diatoms (Bacillariophyceae and Fragilariophyceae) from Isla Guadalupe, Baja California, Mexico. Revista Mexicana de Biodiversidad 86:2, 281-292.
Lowe, J.J. & Walker, M.J.C. 1997. Reconstructing Quaternary environments, 2nd ed. London: Pearson Prentice Hall. 446 pp.
Lugo, A. E. & Snedaker, S. C. 1974. The Ecology of Mangroves. Annual Review of Ecology and Systematics 5, 39-64.
MacCready, P. 1999. Estuarine adjustment to changes in river flow and tidal mixing. Journal of Physical Oceanography 29, 708-726.
Mackenzie, F.T. & Garrels, R.M. 1966. Chemical mass balance between rivers and oceans. American Journal of Science 264, 507-525.
Mann, D.G. & Droop, J.M. 1996. 3. Biodiversity, biogeography and conservation of diatoms. In Kristiansen, J. (ed.). Biogeography of freshwater algae. Developments in
61
Hydrobiology 118. Proceedings of the Workshop on Biogeography of Freshwater Algae, Fifth International Phycological Congress, Qingdao, China, June 1994. Springer-Science + Business Media, BV, 19-32.
Mann, D.G. 1999. Phycological reviews 18. The species concept in diatoms. Phycologia 38, 437-495.
Marshall, H.G. 1976. Phytoplankton distribution along the eastern coast of the USA. I. phytoplankton composition. Marine Biology 38, 81-89.
Marshall, H.G. 1978. Phytoplankton distribution along the eastern coast of the USA. Part II. Seasonal assemblages north of Cape Hatteras, North Carolina. Marine Biology 45, 203-208.
Martin-Jézéquel, V., Hildebrand, M. & Brzezinski, M.A. 2000. Silicon metabolism in diatoms: implications for growth. Journal of Phycology 36, 821-840.
Massuanganhe, E.A. 2016. 35 pp. Geomorphology and environmental dynamics in Save River delta, Mozambique; A cross-timescale perspective. Dissertations from the Department of Physical Geography no 53, Stockholm University. 53 pp.
Massuanganhe, E.A., Berntsson, A., Risberg, J., Westerberg, L.-O., Christiansson, M., Preusser, F., Bjursäter, S. & Achimo, M. 2016a. Paleogeography and dynamics of the deltaic wet-land of Save River, Mozambique. 23 pp. In E. Massuanganhe (ed.). 2016. Geomorphology and environmental dynamics in Save River delta, Mozambique; A cross-timescale perspective. Dissertations from the Department of Physical Geography no 53, Stockholm University. Paper II.
Massuanganhe, E., Westerberg, L.-O., Risberg, J., Preusser, F., Bjursäter, S. & Achimo, M. 2016b. Geomorphology and landscape evolution of Save River delta, South-central Mozambique. In E. Massuanganhe (ed.). 2016. Geomorphology and environmental dynamics in Save River delta, Mozambique; A cross-timescale perspective. Dissertations from the Department of Physical Geography no 53, Stockholm University. Paper I.
Massuanganhe, E.A., Macamo, C., Westerberg, L.-O., Bandeira, S., Mavume, A. & Ribeiro, E. 2015. Deltaic coasts under climate-related catastrophic events – In-sights from the Save River delta, Mozambique. Ocean and Coastal Management 116, 331-340.
Maynard, N.G. 1968. Aquatic foams as an ecological habitat. Zeitschrift für Allg. Mikrobiologie 8, 119-126.
McElhinny, M.W. & Briden, J.C. 1971. Continental drift during the Palaeozoic. Earth and Planetary Science Letters 10, 407-416.
Mereschkowsky, C. 1901. LXV. – A list of Californian diatoms. Annals and Magazine of Natural History 7, 505-520.
Metzeltin, D., 1998. Iconographica Diatomologica annotated diatom micrographs; tropical diatoms of South America volume 5. Koeltz Scientific Books: Königstein. 695 pp.
Michalopoulos, P. & Aller, R.C. 1995. Rapid clay mineral formation in Amazon delta sediments: reverse weathering and oceanic elemental cycles. Science 270, 614-617.
Michalopoulos, P., Aller, R.C. & Reeder, R.J. 2000. Conversion of diatoms to clays during early diagenesis in tropical, continental shelf muds. Geology 28:12, 1095-1098.
Middelburg, J.J., Nieuwenhuize, J., Slim, F.J., Ohowa, B. 1996. Sediments biochemistry in an east African mangrove forest (Gazi Bay, Kenya). Biogeochemistry 34, 133-155.
Miho, A. & Witkowski, A. 2005. Diatom (Bacillariophyta) Flora of Albanian coastal wetlands taxonomy and ecology: a review. Proceedings of the Californian Academy of Sciences 56, 129-145.

62
Miller, D.E., Yates, R.J., Parkington, J.E. & Vogel, J.C. 1993. Radiocarbon-date evidence relating to a mid-Holocene relative high sea-level on the south-western Cape coast, South Africa. South African Journal of Science 89, 35-44.
Milne, G.A., Long, A.J. & Bassett, S.E. 2005. Modelling Holocene relative sea-level observations from the Caribbean and South America. Quaternary Science Reviews 24, 1183-1202.
Mitbavkar, S. & Anil, A.C. 2002. Diatoms of the microphytobenthic community: population structure in a tropical intertidal sand flat. Marine Biology 140, 41-57.
Moura, A.N., Bittencourt-Oliveira, M.C. & Nascimento, E.C. 2007. Benthic Bacillariophyta of the Paripe River estuary in Pernambuco state, Brazil. Brazilian Journal of Biology 67:3, 393-401.
Naya, T. 2012. Marine Thalassiosira species from coastal Pleistocene sediments in central Kanto Plain, Japan. Diatom Research 27:3, 141-163.
Ng, S.L. & Sin, F.S. 2003. A diatom model for interfering sea level change in the coastal waters of Hong Kong. Journal of Paleolimnology 30, 427-440.
Nicholls, R. J. 2004. Coastal flooding & wetland loss in the 21st century: changes under the SRES climate and socio-economic scenarios. Global Environmental Change 14, 69-86.’
Nicholls, R.J. & Cazenave, A. 2010. Sea-level Rise and Its Impact on Coastal Zones. Science 328, 1517-1520.
Nicholls, R. J., Hoozemans, F. M. & Marchand, M. 1999. Increasing flood risk and wetland losses due to global sea-level rise: regional and global analyses. Global Environmental Change 9, 69-87.
Norström, E., Risberg, J., Gröndahl, H., Holmgren, K., Snowball, I., Mugabe, J.A. & Sitoe, S.R. Coastal paleo-environment and sea-level change at Macassa Bay, southern Mozambique, since c 6600 cal BP. Quaternary International 260, 153-163.
Nwadiaro, C.S. & Ezefili, E.O. 1986. A preliminary checklist of the phytoplankton of New Calabar River, lower Niger Delta. Hydrobiological Bulletin 19:2, 133-138.
Oanh Ta, T.K., Nguyen, V.L., Tateishi, M., Kobayashi, I. & Saito, Y. 2001. Sedimentary facies, diatom and foraminifer assemblages in a late Pleistocene-Holocene incised-valley sequence from the Mekong River Delta, Bentre Province, Southern Vietnam: the BT2 core. Journal of Asian Earth Sciences 20:1, 83-94.
Overeem, I. & Syvitski, J.P.M. (eds). (2009). Dynamics and vulnerability of delta systems. LOICZ Reports & Studies No. 35. GKSS Research Center, Geesthacht, 54 pp.
Palmer, A.J.M. & Abbott, W.H. 1986. Diatoms as indicators of sea-level change. O. van de Plassche (ed.), In Sea-Level Research - A Manual for the Collection and Evaluation of Data, Geo Books: Norwish. 457–487.
Pan, Y., Hill, B.H., Husby, P., Hall, R.K. & Kaufmann, P.R. 2006. Relationships between environmental variables and benthic diatom assemblages in California Central Valley streams (USA). Hydrobiologia 561, 119-130.
Park, J.S., Lee, S.D., Lee, J.H. 2013. Taxonomic study on the euryhaline Cyclotella (Bacillariophyta) species in Korea. Journal of ecology and environment 36 (4): 407-419.
Patrick, R. 1940. Diatoms of Northeastern Brazil. Part I: Coscinodiscaceae, Fragilariaceae and Eunotiaceae. Proceeding of the Academy of Natural Sciences of Philadelphia 92, 191-226.
Pednekar, M. S., Matondkar, S.G.P., Gomes, H.D.R., Goes, J.I., Parab, S. & Kerkar, V. 2011. Fine-scale responses of phytoplankton to freshwater influx in a tropical monsoonal

63
estuary following the onset of southwest monsoon. Journal of Earth System Science 120, 545-556.
Pennesi, C., Poulin, M., Totti, M. & Totti, C. 2012. Morphological studies of some marine Mastogloia (Bacillariophyceae) belongings to section sulcatae, including the description of new species. Journal of Phycology 48:5, 1248-1264.
Pitcher, G.C. 1986. Sedimentary flux and the formation of resting spores of selected Chaetoceros species at two sites in the southern Benguela System. South African Journal of Marine Science 4:1, 231-244.
Ponander, K.C. & Potapova, M.G. 2007. Diatoms from the genus Achnanthidium in flowing waters of the Appalachian Mountains (North America): Ecology, distribution and taxonomic notes. Limnologica-Ecology and Management of Inland Waters 37:3, 227-241.
Prasad, A.K.S.K. & Nienow, J.A. 2006. The centric diatom genus Cyclotella, (Stephanodiscacaea: Bacillariophyta) from Florida Bay, USA, with special reference to Cyclotella coctawatcheeana and Cyclotella desikacharyi, a new marine species related to the Cyclotella striata complex. Phycologica 45:2, 127-140.
Preusser, F., Degering, D., Fuchs, M., Hilgers, A., Kadereit, A., Klasen, N., Krbetschek, M., Richter, D. & Spencer, J.Q.G. 2008. Luminescence dating: basics, methods and applications. Quaternary Science Journal 57:1-2, 95-149.
Pritchard, D.W. 1967. What is an estuary: physical viewpoint. In G.H. Lauf (ed.). Estuaries. American Association for the Advancement of Science Publication 83, Washington DC. 3-5.
Ramsay, P.J. & Cooper, J.A.G. 2002. Late Quaternary sea-level change in South Africa. Quaternary Research 57, 82-90.
Ramsay, P.J. 1995. 900 Years of Sea-Level Changes along the Southern African Coastline. Quaternary International 31, 71-75.
Rattray, J. 1890. A Revision of the Genus Coscinodiscus and some Allied Genera. Proceedings of the Royal Society of Edinburgh 16, 449-692.
Redekar, P.D. & Wagh, A.B. 2000. Planktonic diatoms of the Zuari estuary, Goa (west coast of India). Seaweed Research and Utilization. 22:1-2, 107-112.
Reed, J.M. 1998. Diatom preservation in the recent sediment record of Spanish saline lakes: implications for paleoclimate study. Journal of Paleolimnology 19. 129-137.
Reinhardt, L., Jerolmack, D., Cardinale, B. J., Vanacker, V. & Wright, J. 2010. Dynamic interactions of life and its landscape: feedbacks at the interface of geomorphology and ecology. Earth Surface Processes and Landforms 35, 78-101.
Rijstenbil, J.W. & Merks, A.G.A. 1981. The influence of micro-algae on the oxygen dynamics in a brackish ditch. Hydrobiological Bulletin 15:3, 123-135.
Risberg, J. 1990. Siliceous microfossil stratigraphy in a superficial sediment core from the northwestern part of the Baltic proper. Ambio A Journal of the Human Environment 19:3, 167-172.
Risberg, J., 1986. Terpsinoë americana (Bailey) Ralfs, a rare species in the Baltic fossil diatom flora. 9th Diatom Symposium 1986, 207-218.
Ristvet, B.L. 1978. Reverse weathering reactions within recent nearshore marine sediments, Kaneohoe Bay, Oahu [Ph.D. thesis]. Kirtland Air Force Base, New Mexico, Test Directorate Field Command, 314 pp.
Riviera, R. & Diaz, Q.C. 2004. Diatomeas de pequenños rios andinos y su utilización como indicadoras de condiciones ambientales. Caldasia 26, 381-394.

64
Roberts, H.M., Wintle, A.G., Maher, B.A. & Hu, M. 2001. Holocene sediment-accumulation rates in the western Loess Plateau, China, and a 2500-year record of agricultural activity, revealed by OSL dating. The Holocene 11:4, 477-483.
Rothlisberger, J.D., Chadderton, W.L., McNulty, J. & Lodge, D.M. 2010. Aquatic invasive species transport via trailered boats: what is being moved, who is moving it, and what can be done. Fisheries 35:3, 121-132.
Rouault, M., Florenchie, P., Fauchereau, N. & Reason, C.J.C. 2003. South East tropical Atlantic warm events and southern African rainfall. Geophysical research letters 30:5, 1-4.
Round, F.E. 1965. The episammon; a relatively unknown freshwater algal association. British Phycological Bulletin 2:6, 456-462.
Round, F.E. 1972. Patterns of seasonal succession of freshwater epipelic algae. British Phycological Journal 7:2, 213-220.
Round, F.E., Crawford, R.M. & Mann, D.G. 1990. The diatom biology & morphology of the genera. Cambridge University Press: Cambridge. 747 pp.
Ryu, E., Yi, S. & Lee, S.J. 2005. Late Pleistocene-Holocene paleoenvironmental changes inferred from the diatom record of the Ulleung Basin, East Sea (Sea of Japan). Marine Micropaleontology 55, 157-182.
Ryves, D.B., Anderson, N.J., Flower, R.J. & Rippey, B. 2013. Diatom taphonomy and silica cycling in two freshwater lakes and their implications for inferring past lake productivity. Journal of Paleolimnology 49, 411-430.
Ryves, D.B., Battarbee, R.W. & Fritz, S.C. 2009. The dilemma of disappearing diatoms: Incorporating diatom dissolution data into paleoenvironmental modelling and reconstruction. Quaternary Science Reviews 28, 120-136.
Ryves, D.B., Battarbee, R.W., Juggins, S., Fritz, S.C. & Anderson, N.J. 2006. Physical and chemical predictors of diatom dissolution in freshwater and saline lake sediments in North America and West Greenland. Limnology and Oceanography 51, 1355-1368.
Sabbe, K. 1993. Short-term fluctuations in benthic diatom numbers on an intertidal sandflat in the Westerschelde estuary (Zeeland, The Netherlands). Hydrobiologia 269/270, 275-284.
Salman, G. & Abdula, I. 1995. Development of the Mozambique and Ruvuma sedimentary basins, offshore Mozambique. Sedimentary Geology 96, 7-41.
Sandgren, P., Snowball, I.F., Hammarlund, D. & Risberg J. 1999. Stratigraphic evidence for a high marine shore-line during the Late Weichselian deglaciation on the Kullen Peninsula, southern Sweden. Journal of Quaternary Science 14:3, 223-237.
Santos, L. C. M., Matos, H. R., Schaeffer-Novelli, Y., Cunha-Lignon, M., Bitencourt, M. D., Koedam, N. & Dahdouh-Guebas, F. 2014. Anthropogenic activities on mangrove areas (São Francisco River Estuary, Brazil Northeast): A GIS-based analysis of CBERS and SPOT images to aid in local management. Ocean & Coastal Management 89, 39-50.
Sar, E.A., Sunesen, I. & Fernández, P.V. 2007. Marine diatoms from Buenos Aires coastal waters (Argentina). II. Thalassionemataceae y Rhaponeidaceae. Revista Chilena de Historia Natural 80, 63-97.
Sar, E.A., Sunesen, I. & Lavigne, A.S. 2010. Cymatotheca, Tryblioptychus, Skeletonema and Cyclotella (Thalassiosirales) from Argentinian coastal waters. Description of Cyclotella cubiculata sp.nov. Vie et milieu – Life and Environment 60, 133-154.
Sato, H., Okuno, J., Nakada, M. & Maeda, Y. 2001. Holocene uplift derived from relative sea-level records along the coast of western Kobe, Japan. Quaternary Science Reviews 20, 1459-1474.

65
Sawai, Y. 2001. Distribution of living and dead diatoms in tidal wetlands of Northern Japan: relations to taphonomy. Palaeogeography, Palaeoclimatology, Palaeoecology 173, 125-141.
Schetselaar, E.M., Tiainen, M. & Woldai, T. 2008. Integrated geological interpretation of remotely sensed data to support geological mapping in Mozambique. Geological Survey of Finland, special paper 48, 35-63.
Schlüter, Thomas. 2006. Tecnostratigraphic synopsis. In geological atlas of Africa with notes on stratigraphy, tectonics, economic geology, geohazards and geosites of each country. Berlin, Heidelberg: Springer-Verlag Berlin Heidelberg. 13-29.
Schuette, G. & Schrader, H. 1981. Diatom taphocoenoses in the coastal upwelling area off south West Africa. Marine Micropaleontology 6, 131-155.
Schumann, E.H. & Pearce, M.W. 1997. Freshwater inflow and estuarine variability in the Gamtoos Estuary, South Africa. Estuaries 20:1, 124-133.
Scoffin, T.P. 1970. The trapping and binding of subtidal carbonate sediments by marine vegetation in Bimini Lagoon, Bahamas. Journal of Sedimentary Petrology 40:1, 249-273.
Semeniuk, V. 2016. Marine/freshwater mixing. In Kennish, M.J. (ed.). Encyclopedia of Estuaries. Springer: Dordrecht. 404-417.
Sete, C.I., Ruby, J. & Dove, V. 2002. Seasonal variability of tides, currents, salinity and temperature along the coast of Mozambique. Instituto Nacional de Hidrografia e Navegacao: Maputo. 72 pp.
Shennan, I., Innes, J.B., Long, A.J., Zong, Y. 1993. Late-Glacial and Holocene sea-level changes at Rumach, northwest Scotland. Norsk Geologisk Tidsskrift 73, 161-174.
Sherrod, B.L. 1999. Gradient analysis of diatom assemblages in a Puget Sound salt marsh: can such assemblages be used for quantitative paleoecological reconstruction?. Palaeogeography, Palaeoclimatology, Palaeoecology 149, 213-226.
Simonsen, R. 1969. Diatoms as indicators in estuarine environments. Velöffentl. Inst. Meeresforsch. Bremerhaven 11, 287-291.
Siver, P.A., Hamilton, P.B., Stachura-Suchoples, K. & Kociolek, J.P. 2003. Morphological observations of Neidium species with sagittate apecis, including the description of N. Cape-Codii sp. nov. Diatom research 18:1, 131-148.
Smetacek, V. 1999. Diatoms and the ocean carbon cycle. Protist 150, 25-32. Smith III, T. J., Boto K. G., Frusher S. D., & Giddins R. L. 1991. Keystone species and mangrove
forest dynamics: the influence of burrowing by crabs on soil nutrient status and forest productivity. Estuarine. Coastal and Shelf Science 33, 419-432.
Snoeijs, P. & Kasperovičienė, J. 1996. Intercalibration and distribution of a diatom species in the Baltic Sea. The Baltic Marine Biologists 16d:4, 125 pp.
Snoeijs, P. & Potapova, M., (eds). 1995. Intercalibration and distribution of a diatom species in the Baltic Sea. The Baltic Marine Biologists 16c (3), 125 pp.
Snoeijs, P. & Vilbaste, S. 1994. Intercalibration and distribution of a diatom species in the Baltic Sea. The Baltic Marine Biologists 16b:2, 125 pp.
Snoeijs, P., (ed.). 1993. Intercalibration and distribution of a diatom species in the Baltic Sea. The Baltic Marine Biologists 16a:1, 130 pp.
Sorokin, Y.I., Kopylov, A.I. & Mamaeva, N.V. 1985. Abundance and dynamics of microplankton in the central tropical Indian Ocean. Marine Ecology 24, 27-41.
Soylu, E.N., Maraşlioglu, F. & Gönülol, A. 2007. Phytoplankton seasonality of a shallow turbid lake. Algological Studies 123:1, 95-110.

66
Srivastava, J. & Farooqui, A. 2013. Late Holocene mangrove dynamics and coastal environmental changes in the Northeastern Cauvery River Delta, India. Quaternary International 298, 45-56.
Stanley, D.J., & Hait, A.K. 2000. Deltas, radiocarbon dating, and measurements of sediment storage and subsidence. Geology 28, 295-298.
Stefano, M. De. & Marino, D. 2003. Morphology and taxonomy of Ampicocconeis gen. nov. (Achnanthales, Bacillariophyceae, Bacillariophyta) with considerations on its relationship to other monoraphid diatom genera. European Journal of Phycology 38:4, 361-370.
Sterrenburg, F.A.S. 1995. Studies on the genera Gyrosigma and Pleurosigma (Bacillariophyceae): Gyrosigma acuminatum (Kützing) Rabenhorst, G. spenceri (Quekett) Griffith, and G. rautenbachiae Cholnoky. Proceeding of the Academy of Natural Sciences of Philadelphia 146, 467-480.
Sterrenburg, F.A.S., Sar, E.A. & Sunesen, I. 2014. Analysis of type material of Pleurosigma formosum and P. decorum (Pleurosigmataceae, Bacillariophyta). Boletín de la Sociedad Argentina de Botánica 49:1, 21-28-
Straub, F. 1993. Diatoms and their preservation in the sediments of Lake Neuchatel (Switzerland) as evidence of past hydrological changes. Hydrobiologia 269, 167-178.
Strelnikova, N.I., Fourtanier, E. & Kociolek, J.P. 2004. Morphological studies of Aulacodiscus species from the” Russian collection” of the Californian Academy of Sciences. Diatoms Research 19, 283-310.
Struyf, E. & Conley, D.J. 2008. Silica: an essential nutrient in wetland biochemistry. Frontiers in Ecology and the Environment 7, 88-94.
Struyf, E., Van Damme, S., Gribsholt, B. & Meire, P. 2005. Freshwater marches as dissolved silica recyclers in an estuarine environment (Schelde estuary, Belgium). Hydrobiologia 540, 69-77.
Swan, B. 1983. An Introduction to the Coastal Geomorphology of Sri Lanka. Government Press: Colombo. 182 pp.
Syvitski, J.PM., Kettner, A.J., Overeem, I., Hutton, E.W.H., Hannon, M.T., Brakenridge, G.R., Day, J., Vorosmarty, C., Saito, Y., Giosan, L. & Nicholls, R.J. 2009. Sinking deltas due to human activities. Nature Geoscience 2, 681-686.
Ta, T.K.O., Nguyen, V.L., Tateishi, M., Kobayashi, I. & Saito, Y. 2001. Sedimentary facies, diatom and foraminifer assemblage in a late Pleistocene-Holocene incised-valley sequence from the Mekong River Delta, Bentre Province, Southern Vietnam: the BT2 core. Journal of Asian Earth Sciences 20, 83-94.
Talbot, M.M.B. & Bate, G.C. 1987. Rip current characteristics and their role in the exchange of water and surf diatoms between the surf zone and nearshore. Estuarine, coastal and shelf science 25, 707-720.
Tamura, T., Y. Saito, M. D. Bateman, V. L. Nguyen, T. K. O. Ta, and D. Matsumoto. 2012. Luminescence dating of beach ridges for characterizing multi-decadal to centennial deltaic shoreline changes during Late Holocene, Mekong River delta. Marine Geology 326–328, 140-153.
Taukulis, F.E. & John, J. 2006. Diatoms as ecological indicators in lakes and streams of varying salinity from the wheatbelt region of Western Australia. Journal of the Royal Society of Western Australia 89, 17-25.
Thom, B.G. 1967. Mangrove Ecology and Deltaic Geomorphology: Tabasco, Mexico. Journal of Ecology 55:2, 301-343.

67
Thorrington-Smith, M. 1971. West Indian Ocean phytoplankton: a numerical investigation of phytohydrographic regions and their characteristic phytoplankton associations. Marine Biology 9, 115-137.
Tiffany, M.A. 2008. Valve development in Aulacodiscus. Diatom Research 23, 185-212. Trobajo, R. Quintana, X.D. & Sabater, S. 2004. Factors affecting the periphytic diatom
community in Mediterranean coastal wetlands (Empordà wetlands, NE Spain). Archiv fur Hydrobiologie 160:3, 375-399.
Troels-Smith, J. 1955. Karakterisering af løse jordarter. Danmarks Geologiske Undersøgelse Series IV. 3:10, 1-73.
Trujillo, A.P. & Thurman, H.V. 2014. Essentials of Oceanography, Eleventh Edition. Pearson: Harlow. 616 pp.
Tynni, R. 1983. Diatoms from the coast of Khawr Abdallah, Persian Gulf. Geological Survey of Finland, Report of investigation 60, 42 pp.
Van Bennekom, A.J. & Van der Gaast, S.J. 1976. Possible clay structures in frustules of living diatoms. Geochimica et Cosmochimica Acta 40, 1149-1152.
Van de Vijver, B. & Mataloni, G. 2008. New and interesting species in the genus Luticola D.G. Mann (Bacillariophyta) from Deception Island (South Shetland Islands). Phycologia 47, 451-467.
Van Heurck, H. 1896. A treatise on the Diatomaceae. Translated by Wynne E. Baxter. William Wesley & Son: London, 558 pp.
Vidya, P.J., Prasanna Kumar, S., Gauns, M., Verenkar, A., Unger, D. & Ramaswamy, V. 2013. Influence of physical and biological processes on the seasonal cycle of biogenic flux in the equatorial Indian Ocean. Biogeosciences 10, 7493-7507.
Virah-Sawmy, M., Willis, K.J. & Gillson, L. 2009. Threshold response of Madagascar’s littoral forest to sea-level rise. Global Ecology and Biogeography 18, 98-110.
Vos, P.C. & de Wolf, H. 1988. Methodological aspects of paleoecological diatom research in coastal areas of the Netherlands. Geology 67, 31-40
Vos, P.C. & de Wolf, H. 1993:1. Diatoms as a tool for reconstructing sedimentary environments in coastal wetlands; methodological aspects. Hydrobiologia 269/270, 285-296.
Vos, P.C. & de Wolf, H. 1993:2. Reconstruction of sedimentary environments in Holocene coastal deposits of the southwest Netherlands; the Poortvliet boring, a case study of palaeoenvironmental diatom research. Hydrobiologia 269/270, 297-306.
Wang, J., Kassab, C., Harbor, J.M., Caffee, M.W., Cui, H. & Zhang, G. 2013. Cosmogenic nuclide constraints on late Quaternary glacial chronology on the Dalijia Shan, northeastern Tibetan Plateau. Quaternary Research 79, 439-451.
Werner, D. 1971. Der Entwicklungscyclus mit sexualphase bei der marinen diatomee Coscinodiscus asteromphalus. Archives of Microbiology 80, 115-133.
Witkowski, A., Lange-Bertalot, H., Metzeltin, D., 2000. Iconographia Diatomologica, vol 7, Diatom flora of marine coasts. H. Lange-Bertalot (ed.). Gantner Verlag K.G.: Hofheim. 925 pp.
Wollast, R. & de Broeu, F. 1971. Study of the behavior of dissolved silica in the estuary of the Scheldt. Geochimica et Cosmochimica Acta 35, 613-620.
Woodroffe, C. D. and D. Grime. 1999. Storm impact and evolution of a mangrove-fringed Chenier plain, Shoal Bay, Darwin, Australia. Marine Geology 159, 303-321.
Woodroffe, C. D., Thom, B. G., and Chappell, J. 1985. Development of widespread mangrove swamps in mid-Holocene times in northern Australia. Nature 317, 711-713.

68
Woodroffe, C.D. 1990. The impact of sea-level rise on mangrove shorelines. Progress in Physical Geography 14:4, 483-520.
Yabe, H., Yasui, S., Urabe, A. & Takahama, N. 2004. Holocene paleoenvironmental changes inferred from the diatom records of the Echigo Plain, central Japan. Quaternary International 115/116, 117-130.
Yang, W., Seager, R., Cane, M.A. & Lyon, B. 2015. The annual cycle of east African precipitation. American Meteorological Society 28, 2385-2404.
Yukihara, E. G. & McKeever, S. W. S. 2011. Optically Stimulated Luminescence (OSL) dosimetry in medicine. Physics in Medicine and Biology 53:20, R351-R379.
Zalat, A. & Vildary, S.S. 2007. Environmental change in Northern Egyptian Delta lakes during the late Holocene, based on diatom analysis. Journal of Paleolimnology 37, 273-299.
Zalat, A. 2001. New araphid diatom species of the genus Trachysphenia petit from recent coastal sediments of the eastern side of the Gulf of Suez, Egypt. Diatom Research 16:2, 417-432.
Zalat, A.A. 1995. Diatoms from the Quaternary sediments of the Nile Delta, Egypt, and their palaeoecological significance. Journal of African Earth Sciences 20:2, 133-150.
Zalat, A.A. 2000. Distribution and paleoecological significance of fossil diatom assemblages from the Holocene sediments of lake Manzala, Egypt. Diatom research 15:1, 167-190.
Zhao, B., Wang, Z., Chen, J. & Chen, Z. 2008. Marine sediment records and relative sea level change during late Pleistocene in the Changjiang delta area and adjacent continental shelf. Quaternary International 186:1, 164-172.
Zong, Y. & Horton, B.P. 1998. Diatom zones across intertidal flats and coastal salt marches in Britain. Diatom Research 13, 153-167.
Zong, Y. & Horton, B.P. 1999. Diatom-based tidal-level transfer functions as an aid in reconstructing Quaternary history of sea-level movements in the UK. Journal of Quaternary Science 14, 153-167.
Zong, Y., Huang, G., Switzer, A.D., Yu, F. & Yim, W.W.-S. 2009. An evolutionary model for the Holocene formation of the Pearl River delta, China. The Holocene 19:1, 129-142.
Zong, Y., Lloyd, J.M., Leng, M.J., Yim, W.W.-S. & Huang, G. 2006. Reconstruction of Holocene monsoon history from the Pearl River estuary, southern China. The Holocene 19, 129-142.

69
9. Appendix 1. Basic data used to construct the pie charts in Figures 8-10. Groups are
according to optimal salinity and numbers are identified diatom frustules; absolute and
relative. Sites are presented from east to west in the following order: surface water samples,
surface sediment samples and mangrove cortex samples.
Surface water samples
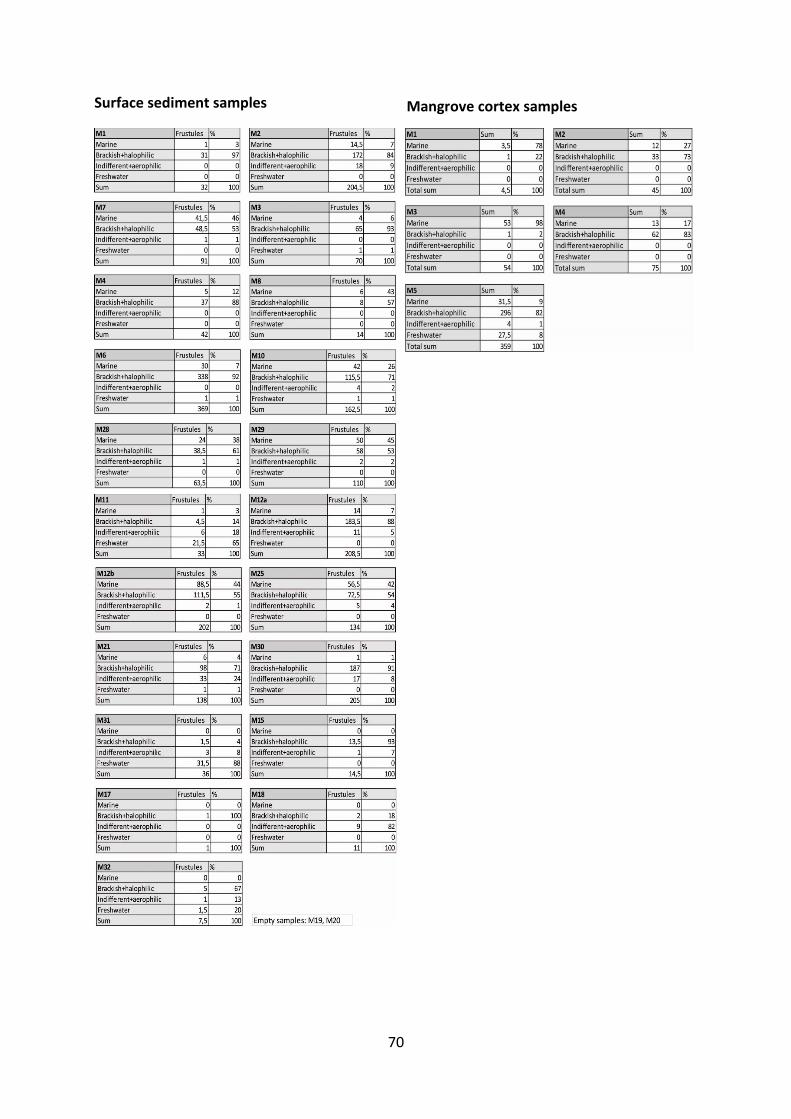
70
Mangrove cortex samples Surface sediment samples

71
10. Appendix 2. The species list includes identified diatom taxa from surface sediments,
surface water, buried sediments and mangrove cortex in the lower Save River, Mozambique.
Years for author names were not possible to find for all species. Ecology: A – Marine taxa, B – Brackish taxa, C – Halophilic taxa, D – Indifferent taxa, E – Freshwater taxa, F – Aerophilic taxa, G – Unknown taxa, H – Extinct taxa Habitat: B – Benthic, P – Planktonic, T – Tychoplanktonic
Taxa Ecology Habitat
Achnanthes brevipes C. Agardh 182468 A B
Achnanthes danica (Flögel) Grunow 188068 A B
Actinocyclus normanii (Gregory) Hustedt 195718 A P
Actinoptychus senarius Ehrenberg 184350 A P
Actinoptychus splendens (Shadbolt) Ralfs in Pritchard 18613 A T
Amphora acutiscula Kützing 184468 A B
Amphora arenaria Donkin 185868,55 A B
Amphora ostrearia v. vitrea Cleve 18958 A B
Amphora proteus Gregory 185719 A B
Amphora richardiana B.J Cholnoky 19688,12 A B
Amphora spectabilis Gregory 185768 A B
Amphora ventricosa Gregory 18574 A B
Anomoeoneis sphaerophora v. costata (Kützing) Schmid 197725 A B
Bacillaria paradoxa Gmelin 179126 A B
Biddulphia antediluviana (Ehrenberg) Van Heurck, 188534 A B
Biddulphia aurita (Lyngbye) Brébisson 183832 A B
Biddulphia plana A. Schmidt 18888 A B
Biddulphia rhombus (Ehrenberg) W. Smith 18542 A B
Caloneis bicuneata (Grunow) Boyer 192736 A B
Campylodiscus bicostatus W. Smith ex Roper 185467 A B
Campylodiscus clypeus Ehrenberg 184468 A B
Campylodiscus fastuosus Ehrenberg 18458,31 A B
Cocconeis disculoides Hustedt 195556 A B
Coscinodiscus argus Ehrenberg 183916 A P
Coscinodiscus decipiens Grunow ex Van Heurck 188246 A P
Coscinodiscus lineatus Ehrenberg 18393 A P
Coscinodiscus radiatus v. parvus Grunow 18843 A P
Cosinodiscus asteromphalus Ehrenberg 184466,15 A B
Cyclotella stylorum Brightwell 186024,39,70 A T
Delphineis minutissima (Hustedt) Simonsen53,51 A B
Dimeregramma minor (Gregory) Ralfs 186168 A B
Diploneis caffra Giffen23 A B
Diploneis smithii (Brébisson) Cleve 189425 A B
Diploneis suborbicularis (Gregory) Cleve 189468 A B
Diploneis weissflogii (A. Schmidt) Cleve 189468 A B
Eunotogramma frauenfeldii Weisse 18458,30 A B
Eunotogramma marinum (W.Smith) Peragallo 190868 A B
Eunotogramma sp. Weisse 185568 A B
Fallacia nummularia (Greville) D.G Mann 199037 A B
Fragilaria capensis Grunow 181968 A B
Fragilaria schultzii Brockmann 195024 A B
Grammatophora angulosa v. islandica Ehrenberg 18418,30 A B
Grammatophora hamulifera Kützing 184468 A B
Huttoniella reichardtii (Grunow) Hustedt 195568 A B
Hyalodiscus scoticus (Kützing) Grunow 187968 A B
Lyrella abrupta (Gregory) D.G Mann 199068 A B
Lyrella amphoroides D.G. Mann 197868 A B
Lyrella impercepta (Hustedt) Moreno 199668 A B
Lyrella lyra (Ehrenberg) Karayeva 197868 A B
Mastogloia elliptica (C.A. Agardh) Cleve 189368 A B
Mastogloia elliptica v. dansei (Thwaites) Cleve 189525 A B
Mastogloia obliqua Hagelstein 185669 A B
Mastogloia omissa Voigt 195244,8 A B
Mastogloia smithii Thwaites 185668 A B
Navicula alpha Cleve 189369 A B
Navicula fauta Hustedt 182268 A B
Navicula monilifera Cleve 18958 A B

72
Navicula xi v. Peltoides (Hendey) Hustedt8 A B
Navicula yarrensis Grunow 187633 A B
Neofragilaria nicobarica Desikachary, Prasad & Prema 197868 A B
Nitzschia granulata Grunow in Cleve & Möller68 A B
Nitzschia marginulata Grunow in Cleve & Möller68 A B
Nitzschia navicularis (Brébisson) Grunow 188068 A B
Nitzschia ocellata Cleve & Müller 188068 A B
Nitzschia panduriformis Gregory 185768 A P
Nitzschia sigmaformis Hustedt 195568,6 A P
Opephora minuta (A.Cleve) A.Witkowski; Lange-Bertalot & Metzeltin 200068 A B
Opephora pacifica (Grunow) Petit 188868 A P
Opephora schwarzii (Grunow) Petit8,68 A P
Paralia sulcata (Ehrenberg) Cleve 187368 A B
Plagiogramma pulchellum (Greville) Peragallo 185968 A B
Plagiogramma staurophorum (Gregory) Heiberg 186368 A B
Pleurosigma decorum W. Smith 185358 A B
Pleurosira laevis v. polymorpha (Ehrenberg) Compère 198224 A B
Podosira stelligera (Bailey) A. Mann 19073 A B
Psammodiscus nitidus (Gregory) Round & Mann 198068 A B
Rhaponeis amphiceros (Ehrenberg) Ehrenberg 184468 A B
Rhaponeis castracanii Grunow 184430 A B
Rhopalodia musculus (Kützing) O. Müller 190068 A B
Rhopalodia pacifica Krammer68 A B
Stephanopyxis spp (Ehrenberg) Ehrenberg 18453 A unknown
Surirella fastuosa (Ehrenberg) Kützing 184368 A B
Surirella gemma Ehrenberg 184020 A B
Thalassiosira eccentrica Ehrenberg 190438,9,13 A P
Thalassiosira oestrupii (Ostenfeld) Hasle 196010 A B
Thalassiosira symmetrica G.A. Fryxell & Hasle 19739 A P
Trachyneis aspera (Ehrenberg) Cleve 189468 A B
Trachysphenia australis Hustedt 19558,4 A B
Triceratium reticulum Ehrenberg 184468 A B
Achnanthes delicatula (Kützing) Grunow 188068 B B
Achnanthes parvula (Kützing) 184468 B P
Actinoptychus adriaticus Grunow 186330 B B
Actinoptychus grundleri A. Schmidt8 B P
Actinoptychus sp. Ehrenberg 18438 B B
Amphora coffeaeformis (C.A. Aargard) Kützing 184468 B B
Amphora staurophora Juhlin-Dannfelt 188268 B B
Anomoeoneis sphaerophora (Ehrenberg) Pfitzer 187125 B B
Auliscus sculptus (W. Smith) Brightwell 186068,5 B B
Biddulphia spp S.F Gray 182124 B B
Caloneis permagna (Baily) Cleve 189425 B P
Campylodiscus sp. Ehrenberg 184468 B B
Cocconeis scutellum Ehrenberg 183868 B B
Coscinodiscus spp Ehrenberg 183924,45 B P
Cyclotella caspia Grunow 187824,17,40 B P
Cyclotella crassa Tynni 198363 B P
Cyclotella sp (Kützing) Brébisson 193824 B P
Cyclotella striata Kützing 184411,21,24 B P
Cyclotella striata v. bipunctata Fricke 190024 B P
Delphineis surirella (Ehrenberg) G.W Andrews 200971 B B
Diploneis bombus Ehrenberg 185368 B B
Diploneis chersonensis (Grunow) Cleve 189230 B B
Diploneis crabro Ehrenberg 185468 B B
Diploneis didyma (Ehrenberg) Cleve 183968 B B
Diploneis incurvata (Gregory) Cleve68 B B
Diploneis interrupta Ehrenberg 185425,1,52 B B
Diploneis nitescens (Gregory) Cleve 189468 B B
Diploneis psuedovalis Hustedt 193068 B B
Diploneis sp Hustedt 193025 B B
Diploneis stroemii Hustedt 193768 B B
Entomoneis alata C. G. Ehrenberg 184568 B B
Entomoneis spp Ehrenberg 184525 B B
Eunotogramma laeve (W.Smith) Peragallo 187968 B B
Grammatophora macilenta W. Smith 185668 B B
Grammatophora oceanica Ehrenberg 184068 B B
Grammatophora sp. Ehrenberg 184068 B B
Gyrosigma balticum (Ehrenberg) Rabenhorst 185325 B B
Gyrosigma nodiferum (Grunow) Reimer 196625 B B
Gyrosigma wansbeckii (Grunow) Cleve 189425 B B
Hantzschia distinctepunctata Hustedt 192124 B B
Hantzschia marina (Donkin) Grunow 188068 B B

73
Hyalodiscus sp. Ehrenberg 184068 B B
Mastogloia exigua Lewis 186168 B B
Mastogloia fallax Cleve68 B B
Mastogloia peragalli Cleve68 B B
Melosira moniliformis (O.F. Müller) C.A. Agardh 182468 B B
Melosira nummuloides (Dillwyn) Aagardh 182424 B B
Navicula lyra Ehrenberg 184165 B B
Navicula normaloides Cholnoky 196862,68 B B
Navicula nummularia Greville 185970 B B
Navicula pusilla W. Smith 185325,72 B B
Nitzschia calida Grunow 188068,41 B B
Nitzschia circumsuta (Bailey) Grunow 187868 B B
Nitzschia cocconeiformis Grunow in Cleve & Möller 188068 B B
Nitzschia hungarica Grunow 186268 B B
Nitzschia hybrida Grunow 188068 B B
Nitzschia levidensis (W. Smith) Grunow 188168 B B
Nitzschia levidensis v. victoriae (Grunow) Cholnoky68 B B
Nitzschia littoralis Grunow 188068,24 B B
Nitzschia obtusa W. Smith 185368 B P
Nitzschia obtusa v. kurzii (Rabenhorst) Grunow68 B B
Nitzschia sigma (Kützing) W. Smith 185326,46 B P
Nitzschia tryblionella W. Smith 185326 B B
Opephora mutabilis (Grunow) Sabbe & Vyverman 195568 B B
Petrodictyon gemma (Ehrenberg) D.G. Mann 199068 B B
Pleurosigma spp W. Smith 185225 B B
Pleurosira laevis (Ehrenberg) Compère 198268 B B
Rhopalodia acuminata Krammer 198768 B B
Terpsinoë americana (Bailey) Ralfs 186847,54 B B
Thalassiosira spp Cleve 187324 B P
Trachysphenia sp. Petit 187768 B B
Triceratium spp Ehrenberg 183968 B B
Amphora crucifera A. Cleve 193268 C B
Amphora pediculus (Kützing) Grunow 188025 C B
Cyclotella meneghiniana Kützing 184424 C P
Epithemia turgida (Ehrenberg) Kützing 184426 C B
Nitzschia sigma v. sigmatella Grunow 187826 C P
Amphora copulata (Kützing) Schoeman & Archibald 198628 D B
Amphora libyca Ehrenberg 184028 D B
Amphora ovalis Kützing 184428 D B
Caloneis bacillum (Grunow) Cleve 189425 D B
Caloneis molaris (Grunow) Krammer 198525 D B
Caloneis silicula (Ehrenberg) Cleve 189425 D B
Cocconeis placentula Ehrenberg 183827 D B
Cocconeis placentula v. euglypta (Ehrenberg 1854) Grunow 188427 D B
Coscinodiscus nitidus W. Gregory 18573,43 D P
Cyclotella distinguenda Hustedt 192724 D P
Cymbella aspera (Ehrenberg) Pergallo 184925 D B
Denticula kuetzingii Grunow 186226 D B
Diploneis ovalis (Hilse) in Cleve 189125 D B
Epithemia adnata (Kützing) Brébisson 183826 D B
Epithemia argus (Ehrenberg) Kützing 184426 D B
Epithemia cistula (Ehrenberg) Ralfs in Pritchard 186126 D B
Epithemia smithii Carruthers 186426 D B
Epithemia sorex Kützing 184426 D B
Fragilaria brevistriata Grunow in Van Heurck 188124 D B
Fragilaria construens (Ehrenberg) Grunow 186226 D B
Fragilaria construens v. construens (Ehrenberg) Hustedt 195726 D B
Fragilaria construens v. venter (Ehrenberg) Hustedt 195726 D B
Fragilaria dilatata (Brébisson) Lange-Bertalot 198626 D B
Fragilaria leptostauron v. martyi (Héribaud) Lange-Bertalot 199126 D B
Gyrosigma attenatum (Kützing) Rabenhorst 185325 D B
Navicula capitata Ehrenberg 183825 D B
Navicula cuspidata (Kützing) Kützing 184425,29 D B
Navicula integra (W. Smith) Ralfs in Pritchard 186125 D B
Navicula rhynchocephala Kützing 184425 D B
Nitzschia amphibia Grunow 186226 D B
Rhopalodia gibba (Ehrenberg) O. Müller 189524 D B
Rhopalodia gibba v. parallella (Grunow) H. & M. Peragallo26 D B
Rhopalodia operculata (Agardh) Håkansson 197926 D B
Surirella brebissonii Krammer & Lange-Bertalot 198724 D B
Achnanthes lanceolata v. frequentissima Lange-Bertalot 199127 E B
Amphora inariensis Krammer 198025 E B
Aulacoseira alpigena (Grunow) Krammer 199024,7 E P

74
Aulacoseira ambigua (Grunow) Simonsen 197924 E P
Aulacoseira crassipunctata Krammer 199026 E P
Aulacoseira distans (Ehrenberg) Simonsen 197926 E P
Aulacoseira granulata (Ehrenberg) Simonsen 197924 E P
Aulacoseira spp Thwaites 184824,26 E P
Capartogramma crucifera (Grunow ex Cleve) Ross 196335 E B
Cocconeis neodiminuta Krammer 199127 E B
Cymatopleura solea (Brébisson) W. Smith 185126 E B
Cymbella affinis Kützing 184425 E B
Cymbella ehrenbergii Kützing 1844 (Agardh) Cleve 189425 E B
Cymbella lacustris (Agardh) Cleve 189425 E B
Cymbella laevis Naegeli in Kützing 184925 E B
Cymbella meulleri Hustedt 193825 E B
Cymbella silesiaca Bleich in Rabenhorst 186425 E B
Cymbella spp C. Agardh 183025 E B
Cymbella tumida (Brébisson) Van Heurck 188025 E B
Diploneis elliptica (Kützing) Cleve 189125 E B
Diploneis puella Cleve 189425,1 E B
Diploneis subovalis Cleve 189425 E B
Eunotia didyma Grunow 191324,42 E B
Eunotia minor (Kützing) Grunow in Van Heurck 188126 E B
Eunotia pectinalis (Kützing) Rabenhorst 186426 E B
Eunotia pectinalis v. undulata (Ralfs) Rabenhorst 186426 E B
Eunotia praerupta Ehrenberg 184324,14 E B
Eunotia soleirolii (Kützing) Rabenhorst 186424 E B
Eunotia spp Ehrenberg 183724 E B
Fragilaria biceps (Kützing) Lange-Bertalot 199124 E B
Fragilaria pinnata Ehrenberg 184348 E B
Fragilaria ulna Lange-Bertalot 198024 E B
Fragilaria virescens Ralfs 184326 E B
Fragilaria zeilleri Gasse 198011 E B
Gomphonema affine Kützing 184427 E B
Gomphonema augur v. turris (Ehrenberg) Lange-Bertalot 198527 E B
Gomphonema cleveIi Fricke 190227 E B
Gomphonema spp Ehrenberg 183227 E B
Gyrosigma acuminatum (Kützing) Rabenhorst 185357 E B
Gyrosigma obtusatum (Sullivant & Wormley) Boyer 192211 E B
Gyrosigma wormleyi (Sullivant) Boyer 192222 E B
Navicula brasiliana (Cleve) Cleve 189425 E B
Navicula confervacea (Kützing) Grunow 188025 E B
Navicula constans v. symmetrica Hustedt 195725 E B
Navicula cryptotenella Lange-Bertalot 198525 E B
Navicula laevissima v. laevissima Kützing 184425 E B
Navicula pupula Kützing 184425 E B
Navicula pupula v. nyassensis (O. Müller) Lange-Bertalot 198525 E B
Navicula radiosa Kützing 184425 E B
Navicula tuscula Ehrenberg 184125 E B
Neidum iridis (Ehrenberg) Cleve 189425 E B
Nitzschia palea (Kützing) W. Smith 185626 E B
Nitzschia sinuata v. delognei (Grunow) Lange-Bertalot 198026 E B
Nitzschia valdecostata Lange-Bertalot & Simonsen 197826 E B
Nitzschia vermicularis (Kützing) Hantzsch 186026 E B
Pinnularia divergens W. Smith 185325 E B
Pinnularia maior (Kützing) Rabenhorst 185325 E B
Pinnularia spp Ehrenberg 184325 E B
Pinnularia trevelyana (Donkin) Rabenhorst 18648 E T
Pinnularia viridis v. caudata Boyer 191625 E B
Rhopalodia gibberula (Ehrenberg) O. Müller 189924 E B
Rhopalodia gibberula v. globosa Hustedt60 E B
Rhopalodia vermicularis O. Müller11 E B
Stauroneis anceps Ehrenberg 184325,49 E P
Stauroneis phoenicenteron (Nitzsch) Ehrenberg 184325 E B
Stauroneis spp Ehrenberg 184325 E B
Stephanodiscus minutulus (Kützing) Cleve & Möller 187826 E P
Stephanodiscus sp. Ehrenberg 184626 E P
Surirella linearis W. Smith 185326 E B
Achnanthes inflata (Kützing) Grunow 184427 F B
Hantzschia amphioxys (Ehrenberg) Grunow in Cleve & Grunow 188014 F B
Navicula goeppertiana (Bleisch) H.L. Smith 1874-187925 F B
Navicula mutica v. undulata Cleve & Möller 1877-188264 F B
Navicula mutica Kützing 184425 F B
Navicula paramutica Bock 196325 F B
Pinnularia borealis Ehrenberg 184325 F B

75
Stauroneis obtusa Lagerstedt 187325 F B
Achnanthes spp Bory 182227 G B
Amphora spp Ehrenberg ex Kützing 184427 G B
Anorthoneis sp. Grunow 186827 G P
Caloneis spp Cleve 198425,27 G B
Cocconeis spp Ehrenberg 183627 G B
Cosmioneis sp. D.G Mann & Stickle 199027 G P
Cyclotella spp (Kützing) Brébisson 183824 G P
Diploneis spp Ehrenberg ex Cleve 189425 G B
Epithemia spp Kützing 184426,27 G B
Fallacia spp Stickle & D.G Mann 199027 G B
Fragilaria spp Lyngbye 181926 G B
Frustulia undosa D.Metzeltin & Lange-Bertalot 199835 G B
Gyrosigma spp Hassall 184525,27 G B
Hantzschia sp. Grunow 187727 G B
Lyrella sp. Karajeva 197827 G B
Mastogloia spp Thwaites 185627,68 G B
Navicula spp Bory 182225 G P
Nitzschia cf. valdecostata Hassall 184526 G B
Nitzschia spp Hassall 184525,26 G B
Opephora spp P. Petit 188924,68 G T
Stauroneis cf. obtusa Lagerstedt 187325 G B
Surirella spp Turpin 182826,27 G B
Synedra spp Ehrenberg 183026,27 G B
Varia G unknown
Aulacodiscus sp. Ehrenberg 184459,3,61 H P
1Alfinito et al. (1990), 2Asmus (1982), 3Cleve-Euler (1951), 4Çolak Sabanci & Koray, 2010, 5Dawson & Smith (2000), 6Donadel
et al. (2016), 7Dunck et al. (2012), 8Foged (1975), 9Fryxell & Hasle (1972), 10Fryxell & Hasle (1980), 11Gasse (1986),
12Gottschalk et al. (2007), 13Harris et al. (1995), 14Harwood (1986), 15Hasle & Lange (1992), 16Hasle & Sims (1986), 17Hasle
(1962), 18Hasle (1977), 19Hassan et al. (2006), 20Hendrarto & Nitisuparjo (2010), 21Håkansson (1996), 22Jackson & Lowe
(1978), 23Kokociński et al. (2009), 24Krammer & Lange-Bertalot (1991a), 25Krammer and Lange-Bertalot (1986), 26Krammer
and Lange-Bertalot (1988), 27Krammer and Lange-Bertalot (1991b), 28Levkov, (2009), 29Cohn et al. (1989), 30Lopez Fuerte et
al. (2010), 31López-Fuerte et al. (2015), 32Marshall (1976), 33Maynard (1968), 34Mereschkowsky (1901), 35Metzeltin (1998),
36Miho & Witkowski (2005), 37Moura et al. (2007), 38Naya (2012), 39Ng & Sin (2003), 40Ta et al. (2001), 41Pan et al. (2006),
42Patrick (1940), 43Pednekar et al. (2011), 44Pennesi et al. (2012), 45Rattray (1890), 46Redekar & Wagh (2000), 47Risberg
(1986), 48Round (1965), 49Round (1972), 50Ryu et al. (2005), 51Sabbe (1993), 52Sandgren et al. (1999), 53Sar et al. (2007), 54Sato
et al. (2001), 55López-Fuerto et al. (2013), 56Soylu et al. (2007), 57Stefano & Marino (2003), 58Sterrenburg (1995),
59Sterrenburg et al. (2014), 60Strelnikova et al. (2004), 61Taukulis & John (2006), 62Tiffany (2008), 63Trobajo et al. (2004),
64Tynni (1983), 65Van de Vijver & Mataloni (2008), 66Van Heurck (1896), 67Werner (1971), 68Virah-Sawmy et al. (2009),
69Witkowski et al. (2000), 70Yabe et al. (2004), 71Zalat (2001), 72Zong & Horton (1998), 73Zong & Horton (1999).

11. Appendix 311. Appendix 311. Appendix 311. Appendix 3 Counted diatom frustules from all samples from M- and P sites are here presented. Surface sediment samples are marked with brown color, surface water
samples with blue and mangrove cortex samples with green. M-samples are counted by the author 2016. Samples in P1, P2, P3, P6 and P8 is counted by Berntsson and the author 2015.
M1
M2
M3
M4
M6
M7
M8
M9
22
7 c
m
M9
22
2 c
m
M9
21
7 c
m
M9
21
2 c
m
M9
20
7 c
m
M9
20
2 c
m
M9
19
7 c
m
M9
15
0 c
m
M1
0
M1
1
M1
2a
M1
2b
M1
4 4
68
cm
M1
4 4
79
cm
M1
4 4
93
cm
M1
4 5
00
cm
M1
5
M1
7
M1
8
M1
9
M2
0 3
60
cm
M2
1
M2
2
M2
5 0
cm
M2
5 1
50
cm
M2
5 2
90
cm
M2
5 3
00
cm
M2
8
M2
9
M3
0
M3
1
M3
2
M1
H2
O
M2
H2
O
M3
H2
O
M4
a H
2O
M4
b H
2O
M5
H2
O
M6
H2
O
M9
H2
O
M1
0 H
2O
M1
1 H
2O
M1
2 H
2O
M1
3 H
2O
M1
4 H
2O
M1
9 H
2O
M2
0 H
2O
M2
3 H
2O
M2
4 H
2O
M2
6a
H2
O
M2
6b
H2
O
M2
8 H
2O
M2
9 H
2O
M3
2 H
2O
M1
co
rte
x
M2
co
rte
x
M3
co
rte
x
M4
co
rte
x
M5
co
rte
x
Achnanthes brevipes A 1 6 1 1 5.5 2
Achnanthes danica A 1
Actinocyclus normanii A 2
Actinoptychus
senariusA 1
Actinoptychus
splendensA 6 13 2.5 6 4.5 1 1 25 3 25 1 7 7 1 2 1 2 1 1 1 1 1 1 6 3.5 9 1
Amphora arenaria A 2
Amphora ostrearia
v. vitreaA 1 1
Amphora proteus A 1 1
Amphora richardiana A 1 3 1 1
Amphora ventricosa A 8 1 5 1 3 1 1 1 1 1 1 4 3 2.5
Biddulphia
antediluvianaA
Biddulphia aurita A 3 1 1 1 1
Biddulphia plana A 2 2 1 2.5
Biddulphia rhombus A 6 7.5 2 2
Caloneis bicuneata A 1
M-samples
Depth
Sample
Taxa Ecology
76
Caloneis bicuneata A 1
Campylodiscus
bicostatusA
Campylodiscus
fastuosusA 1 2
Cocconeis disculoides A 1.5 3 1 3
Coscinodiscus
asteromphalusA 18 11 3.5 30.5 5 8 2 30 1 6 11 14 4 4 5 1.5 5.5 8 5 5 2 4 2 1 2 2.5 1 1 14 8 6.5 9 1
Coscinodiscus lineatus A 2 1 1 2
Cyclotella stylorum A 36 10 1 87 61 5.5 38 16 41
Delphineis
minutissimaA 1 1
Dimeregramma
minorA
Diploneis caffra A 3 1 4 1 2 1 1 2.5 3
Diploneis smithii A 4.5 15 14 4 3 2 14 1 2 2 1 9 6 1 1 6.5 1 4 4 3 1 1 6 8 4.5 7.5 10 2 6 5
Diploneis
suborbicularisA 3 2 1 66 2 1.5 1
Diploneis weissflogii A 1 1 3
Eunotogramma
frauenfeldiiA 2 1.5
76

M1
M2
M3
M4
M6
M7
M8
M9
22
7 c
m
M9
22
2 c
m
M9
21
7 c
m
M9
21
2 c
m
M9
20
7 c
m
M9
20
2 c
m
M9
19
7 c
m
M9
15
0 c
m
M1
0
M1
1
M1
2a
M1
2b
M1
4 4
68
cm
M1
4 4
79
cm
M1
4 4
93
cm
M1
4 5
00
cm
M1
5
M1
7
M1
8
M1
9
M2
0 3
60
cm
M2
1
M2
2
M2
5 0
cm
M2
5 1
50
cm
M2
5 2
90
cm
M2
5 3
00
cm
M2
8
M2
9
M3
0
M3
1
M3
2
M1
H2
O
M2
H2
O
M3
H2
O
M4
a H
2O
M4
b H
2O
M5
H2
O
M6
H2
O
M9
H2
O
M1
0 H
2O
M1
1 H
2O
M1
2 H
2O
M1
3 H
2O
M1
4 H
2O
M1
9 H
2O
M2
0 H
2O
M2
3 H
2O
M2
4 H
2O
M2
6a
H2
O
M2
6b
H2
O
M2
8 H
2O
M2
9 H
2O
M3
2 H
2O
M1
co
rte
x
M2
co
rte
x
M3
co
rte
x
M4
co
rte
x
M5
co
rte
x
Eunotogramma
marinumA 1
Fallacia nummularia A 5
Fragilaria capensis A 1
Grammatophora
angulosa v. islandicaA 1
Grammatophora
hamuliferaA 1
Huttoniella reichardtii A 1 1 1 1 1 2 1 2 2 3 2 4 1 1 1
Lyrella abrupta A 2
Lyrella amphoroides A 1 1
Lyrella lyra A 1
Mastogloia oblique A 3.5
Mastogloia omissa A 3 1
Navicula alpha A 8 3 1 1 1 4 1 3.5 2.5 1 4
Navicula monilifera A 1.5 1 1 1 1 1
Navicula yarrensis A 2 2 2
Nitzschia granulata A 4 107 5.5 20 10 40 47 1 7 30 1 3 21 30 7 1 19 2 1 1 1 1 3 12 23 2 2 2 2 1 1 1
Nitzschia marginulata A 2 1
Nitzschia navicularis A 18 28 2.5 3 5 2 3.5 1 1 2 1 3.5 1.5 3 1 2 3 1 2 5 2 6.5 1 1 1 1.5 2 4 11 1
Nitzschia ocellata A 2
Nitzschia
panduriformisA 1 2 1 1 2 1 1 1 1
77
panduriformis
Nitzschia
sigmaformisA 1
Opephora minuta A 3.5
Opephora pacifica A 1 1 3
Paralia sulcata A 1 5 13 3.5 15 7 2 1 11 16 15 1 1 4 14 6 4.5 34 1 1 3 1 4 2 3 9.5
Plagiogramma
pulchellumA 1 1 1 1 1 1 1
Pleurosigma decorum A 1 3.5
Pleurosira laevis A 49 8 3.5 3 3
Podosira stelligera A 3
Psammodiscus nitidus A 1 1
Rhaponeis
amphicerosA 1 2 1 4
Rhaponeis castracanii A 1 1
Rhopalodia musculus A 8 1 1 1 1 1 1 1 6 13
Rhopalodia pacifica A
Stephanopyxis spp A 2 1 1 1 4 5 1 4 9 16 2 10 17 15
Surirella fastuosa A 1 1 1
Surirella gemma A 1 1
77

M1
M2
M3
M4
M6
M7
M8
M9
22
7 c
m
M9
22
2 c
m
M9
21
7 c
m
M9
21
2 c
m
M9
20
7 c
m
M9
20
2 c
m
M9
19
7 c
m
M9
15
0 c
m
M1
0
M1
1
M1
2a
M1
2b
M1
4 4
68
cm
M1
4 4
79
cm
M1
4 4
93
cm
M1
4 5
00
cm
M1
5
M1
7
M1
8
M1
9
M2
0 3
60
cm
M2
1
M2
2
M2
5 0
cm
M2
5 1
50
cm
M2
5 2
90
cm
M2
5 3
00
cm
M2
8
M2
9
M3
0
M3
1
M3
2
M1
H2
O
M2
H2
O
M3
H2
O
M4
a H
2O
M4
b H
2O
M5
H2
O
M6
H2
O
M9
H2
O
M1
0 H
2O
M1
1 H
2O
M1
2 H
2O
M1
3 H
2O
M1
4 H
2O
M1
9 H
2O
M2
0 H
2O
M2
3 H
2O
M2
4 H
2O
M2
6a
H2
O
M2
6b
H2
O
M2
8 H
2O
M2
9 H
2O
M3
2 H
2O
M1
co
rte
x
M2
co
rte
x
M3
co
rte
x
M4
co
rte
x
M5
co
rte
x
Thalassiosira
eccentricaA 2 3 5 12 13 2 7 10 6 11 6 4 2 4 1 13 3 7 15 29 11 4 13 23 3.5 2 1.5 24 47 90 56 4 53 6 19
Thalassiosira
oestrupiiA 2 16
Thalassiosira
symmetricaA
Trachyneis aspera A 20 2 10 3 2.5 1.5 1 1 1 3 13
Trachysphenia
australisA 2 2 1
Triceratium reticulum A 1 2 1 2 1 1
Achnanthes delicatula B 8 1 1 1 1 2
Achnanthes parvula B 1
Actinoptychus
adriaticusB 12 2.5 1 1 1 1 1
Actinoptychus sp. B 1
Amphora
coffeaeformisB 10 1 6 1 1 1 1 1 1 2 2 7 3
Amphora
staurophoraB 29 1
Anomoeoneis
sphaerophoraB 2
Auliscus sculptus B 1 1 1 1 1 1
Biddulphia spp B 3
Caloneis permagna B 1 1 3.5 1 2 2 2
Camplyodiscus sp. B 1
Cocconeis scutellum B 4 3 1
78
Cocconeis scutellum B 4 3 1
Coscinodiscus spp B 5 2 3 1 2 1 5
Cyclotella caspia B 27 15 7 9 5 5 2 4 13 7 1 1 4 5
Cyclotella crassa B 2 4 1 5 4 2 1 3 2 1 1 1 2
Cyclotella striata B 2 8 3 5
Cylotella sp. B 43 22 1 41 27 2.5 14 34 154 11 22 1 1 2 3 65 45 41 42 8 11 22 73 6
Delphineis surirella B 1 1.5
Diploneis bombus B 1
Diploneis
chersonensisB 5 2 1 1 1 4 1
Diploneis crabro B 1
Diploneis incurvata B 2
Diploneis interrupta B 2 5 1 10 2.5 3.5 6 1 1 7.5 4 2 5 6 41 3 13 7 10 2 2 10 3 6 1 3 3 9.5 2 5 1 1 1 2 2 4.5 10 2 2 4.5 8 1 3
Diploneis nitescens B 1
Diploneis sp. B 79 1 1 9 1 5 5 4 11 6 1 5 1 4 70 3 1 2 4 28 33 2 4 14 10 20 23 14 17 51 5 9 91
Diploneis stroemii B 4
Entomoneis alata B 6.5 1 46 1 2 42 2
Entomoneis spp B 1 1
78

M1
M2
M3
M4
M6
M7
M8
M9
22
7 c
m
M9
22
2 c
m
M9
21
7 c
m
M9
21
2 c
m
M9
20
7 c
m
M9
20
2 c
m
M9
19
7 c
m
M9
15
0 c
m
M1
0
M1
1
M1
2a
M1
2b
M1
4 4
68
cm
M1
4 4
79
cm
M1
4 4
93
cm
M1
4 5
00
cm
M1
5
M1
7
M1
8
M1
9
M2
0 3
60
cm
M2
1
M2
2
M2
5 0
cm
M2
5 1
50
cm
M2
5 2
90
cm
M2
5 3
00
cm
M2
8
M2
9
M3
0
M3
1
M3
2
M1
H2
O
M2
H2
O
M3
H2
O
M4
a H
2O
M4
b H
2O
M5
H2
O
M6
H2
O
M9
H2
O
M1
0 H
2O
M1
1 H
2O
M1
2 H
2O
M1
3 H
2O
M1
4 H
2O
M1
9 H
2O
M2
0 H
2O
M2
3 H
2O
M2
4 H
2O
M2
6a
H2
O
M2
6b
H2
O
M2
8 H
2O
M2
9 H
2O
M3
2 H
2O
M1
co
rte
x
M2
co
rte
x
M3
co
rte
x
M4
co
rte
x
M5
co
rte
x
Eunotia didyma B 1
Eunotogramma laeve B 2 2 2 1 1 1 1 1 1
Grammatophora
macilentaB 1
Grammatophora
oceanicaB 1 1
Grammatophora sp. B
Gyrosigma balticum B 1
Gyrosigma nodiferum B 4 1
Gyrosigma
wansbeckiiB 27 2.5
Hantzschia
distinctepunctataB 9 1 3 3 3 3 12 17 1 2 2 2.5 32 3.5 1 88 1 29 11 9 27 6 30 1 3 1
Hantzschia marina B 6 3 1 11 2 1.5 4
Hantzschia marina B 1
Mastogloia exigua B 3 1
Mastogloia fallax B 2
Mastogloia peragalli B 1
Melosira moniliformis B 1 6 7 4 7 3 8 1 18 8 21 11
Melosira
nummuloidesB 21 179
Navicula lyra B
Navicula normaloides B 12 19
Navicula nummularia B 1 1 2
79
Navicula pusilla B 1
Nitzschia calida B 1
Nitzschia
cocconeiformisB 10 5.5 1
Nitzschia hybrida B 1
Nitzschia levidensis B 3 1 5 1 5 2 1 1
Nitzschia littoralis B 1 9 135 3 1 17 2 2 2 1 3 2 1 8 7 10 5 63 1
Nitzschia obtusa
v. kurziiB 1 2 1 2
Nitzschia sigma B 2 2 2
Nitzschia trybionella B 4
Opephora mutabilis B 1 1
Petrodictyon gemma B 2
Pleurosigma spp B 6 9 1
Rhopalodia
acuminataB 2 1 1 5
Terpsinoë
americanaB 1 14 4 1 1 1 1
Thalassiosira spp B 7 5 3 3 5 9 3 2 7.5 11 6 1
79

M1
M2
M3
M4
M6
M7
M8
M9
22
7 c
m
M9
22
2 c
m
M9
21
7 c
m
M9
21
2 c
m
M9
20
7 c
m
M9
20
2 c
m
M9
19
7 c
m
M9
15
0 c
m
M1
0
M1
1
M1
2a
M1
2b
M1
4 4
68
cm
M1
4 4
79
cm
M1
4 4
93
cm
M1
4 5
00
cm
M1
5
M1
7
M1
8
M1
9
M2
0 3
60
cm
M2
1
M2
2
M2
5 0
cm
M2
5 1
50
cm
M2
5 2
90
cm
M2
5 3
00
cm
M2
8
M2
9
M3
0
M3
1
M3
2
M1
H2
O
M2
H2
O
M3
H2
O
M4
a H
2O
M4
b H
2O
M5
H2
O
M6
H2
O
M9
H2
O
M1
0 H
2O
M1
1 H
2O
M1
2 H
2O
M1
3 H
2O
M1
4 H
2O
M1
9 H
2O
M2
0 H
2O
M2
3 H
2O
M2
4 H
2O
M2
6a
H2
O
M2
6b
H2
O
M2
8 H
2O
M2
9 H
2O
M3
2 H
2O
M1
co
rte
x
M2
co
rte
x
M3
co
rte
x
M4
co
rte
x
M5
co
rte
x
Trachysphenia sp. B 1
Triceratium spp B 1 1
Cyclotella
meneghinianaC 1 1 1 2 7 2 2
Amphora libyca D 4 2 3 6 1 15 13 1 10 1 5
Amphora ovalis D 1
Coscinodiscus nitidus D 2
Cyclotella
distinguendaD 1
Diploneis ovalis D 2
Epithemia adnata D 3.5
Fragilaria brevistriata D 1 1
Gyrosigma attenatum D 3.5 1 1 1
Rhopalodia gibba D 1 1 4.5 1.5 1 1 1
Surirella brebissonii D 3 2 2 3 4
Aulacoseira alpigena E 255
Aulacoseira ambigua E 4
Aulacoseira granulata E 1
Aulacoseira spp E 9
Cymbella spp E 1 3 2 1 4
Diploneis didyma E 1 1 1
Diploneis elliptica E 17
Diploneis puella E 3 10
80
Diploneis puella E 3 10
Diploneis subovalis E 2
Eunotia praerupta E 1
Fragilaria pinnata E 18
Fragilaria ulna E 1
Fragilaria zeilleri E
Gyrosigma
acuminatumE 4 3 23
Navicula brasiliana E 2
Pinnularia spp E 1 1
Pinnularia trevelyana E 1
Rhopalodia gibberula E 1 1 1
Rhopalodia gibberula
v. globosaE
Stauroneis anceps E 1
Hantzschia amphioxys F 1 1 1 1 1 22 27 1.5 1
Navicula mutica F 6 2 1 1 23.5
Navicula mutica
v. undulataF 1 1 1 4
80

M1
M2
M3
M4
M6
M7
M8
M9
22
7 c
m
M9
22
2 c
m
M9
21
7 c
m
M9
21
2 c
m
M9
20
7 c
m
M9
20
2 c
m
M9
19
7 c
m
M9
15
0 c
m
M1
0
M1
1
M1
2a
M1
2b
M1
4 4
68
cm
M1
4 4
79
cm
M1
4 4
93
cm
M1
4 5
00
cm
M1
5
M1
7
M1
8
M1
9
M2
0 3
60
cm
M2
1
M2
2
M2
5 0
cm
M2
5 1
50
cm
M2
5 2
90
cm
M2
5 3
00
cm
M2
8
M2
9
M3
0
M3
1
M3
2
M1
H2
O
M2
H2
O
M3
H2
O
M4
a H
2O
M4
b H
2O
M5
H2
O
M6
H2
O
M9
H2
O
M1
0 H
2O
M1
1 H
2O
M1
2 H
2O
M1
3 H
2O
M1
4 H
2O
M1
9 H
2O
M2
0 H
2O
M2
3 H
2O
M2
4 H
2O
M2
6a
H2
O
M2
6b
H2
O
M2
8 H
2O
M2
9 H
2O
M3
2 H
2O
M1
co
rte
x
M2
co
rte
x
M3
co
rte
x
M4
co
rte
x
M5
co
rte
x
Pinnularia borealis F 1 1 5
Achnanthes spp G 5.5 1 1 1 1
Amphora spp G 14 13 1 1 1 1 1 4 1 2 1 2 2 3
Anorthoneis sp. G 1
Caloneis spp G 2 1 1 1
Cocconeis spp G 6 1 1 1 1 1 1 1
Cosmoneis sp. G 1
Cyclotella spp G 2 2
Diploneis spp G 2 7 1 1 3 1 1
Epithemia spp G 1 1 1
Fallacia spp G 7
Gyrosigma spp G 1 1 7.5 1 1 2 1 1 2 1
Hantzschia sp. G 1
Lyrella sp. G 1
Mastogloia spp G 1 1 2 1
Navicula spp G 2 6.5 5 9 1 1 1 1 3 2 1 5 3 1 1 1 2 1 2 3 1
Nitzschia spp G 3 13 2 1.5 2 1 2 2 3 1.5 1 2 2 1 2 1 1 71 1 6
Opephora spp G 1 1 64
Surirella spp G 1 1 1 1 1.5 1
Synedra spp G 1 1 1
Varia G 2.5 3 4 2.5 2 3 2 3 5 2 3 2 3 3 5 2 1 5 1 3.5 1 1 1 5 2 3 1 6
Aulacodiscus sp. H 1
81
Aulacodiscus sp. H 1
81

P1Depth (cm)
Taxa Ecology 5 15 35 45 55 65 75 85 95 105 115 125 135 145 155 165 175 185 195 205 215 225 235 245 255 265 275 285 295 305 315 325 335 345 355
Amphora ventricosa A 1
Coscinodiscus argus A 1 1,5
Coscinodiscus radiatus v.parvus A 1 2,5
Diploneis smithii A 9
Diploneis suborbicularis A 1 3
Hyalodiscus scoticus A 3
Navicula fauta A 1
Nitzschia granulata A 1 7 1 10 8 7
Nitzschia navicularis A 2 2,5 1 1 1
Opephora schwarzii A 1
Paralia sulcata A 2 2 3 2
Plagiogramma staurophorum A 1
Psammodiscus nitidus A 1 1
Actinopticus adriaticus B 2 2
Anomoeoneis shaeorophora B 1
Caloneis permagna B 4
Cocconeis scutellum B 1
Cyclotella sp. B 1
Cyclotella striata B 1
Diploneis interrupta B 2 1 2,5 1,5 9 11 20 7,5 27,5 45 28,5
Diploneis psuedovalis B 1 1 5 76
Diploneis sp. B
Eunotogramma laeve B 1
Hantzschia distinctepunctata B 8 13,5
Hyalodiscus sp. B 5 8 14 1
Nitzschia cocconeiformis B 23,5 1
Nitzschia levidensis B 4
Nitzschia littoralis B 2 8,5
Cyclotella meneghiniana C 1
Epithemia turgida C 2
Nitzschia sigma v. sigmatella C 1
Amphora copulata D 3,5 9 47
Caloneis bacillum D 2 2
Caloneis silicula D 2
Denticula kuetzingii D 3 3 2
Diploneis ovalis D 8
Epithemia adnata D 3,5 8,5 4,5
Epithemia cistula D 1
Fragilaria brevistriata D 6
Fragilaria construens D 10
Fragilaria dilatata D 1
Fragilaria leptostauron v. martyi D 1
Navicula cuspidata D 1 1
Navicula integra D 1 1
Nitzschia amphibia D 1 3
Rhopalodia gibba D 1 3,5 6,5
Rhopalodia operculata D 2 7
Aulacoseira ambigua E 1
Aulacoseira granulata E 1,5
Aulacoseira spp E 5
Cocconeis neodiminuta E 1
Cymbella ehrenbergii E 1 1
Cymbella lacustris E 1
Cymbella laevis E 1
Cymbella meulleri E 1 1 4
Cymbella silesiaca E 2 2
Cymbella spp E 2
Diploneis elliptica E 9
Eunotia pectinalis v. undulata E 1
Eunotia spp E 2
Fragilaria biceps E 1 1
Fragilaria ulna E 13
Gomphonema affine E 1
Gyrosigma obtusatum E 10
Navicula constans v. symmetrica E 1
Navicula cryptotenella E 2
Nitzschia sinuata v. delognei E 2
Pinnularia spp. E 1 3
Pinnularia viridis v. caudata E 1
Rhopalodia gibberula E 1
Rhopalodia vermicularis E 2
Stauroneis spp E 2
Hantzschia amphioxys F 1 7
Navicula goeppertiana F 3
Pinnularia borealis F 1 1 4 1
Stauroneis obtusa F 1
Amphora spp. G 1 2 2
Epithemia spp G 1,5
Frustulia undosa G 1
Hantzschia sp. G
Navicula spp G 3
Nitzschia spp G 3
Varia G 3 2,5 1 1 16 13

P2/M14Depth (cm)
Taxa Ecology 245 255 265 275 285 295 305 315 325 335 345 355 365 375 385 395 405 415 425 435 445 455 465 468 (M14) 475 479 (M14) 485 493 (M14) 500 (M14)Amphora acutiscula A 1Amphora spectabilis A 2
Anomoeoneis sphaerophora v. costata A 1 1Bacillaria paradoxa A 1Biddulphia aurita A 1 1Campylodiscus bicostata A 1 1Coscinodiscus argus A 1 1 3Coscinodiscus decipiens A 1
Coscinodiscus radiatus v. parvus A 1 1 1,5 2 16Cosinodiscus asteromphalus A 1,5 2Cyclotella stylorum A 5Cymbella aspera A 1Diploneis caffra A 1 2 1 6 1 1Diploneis smithii A 2 6Lyrella lyra A 1Mastogloia elliptica A 1 1
Mastogloia elliptica v. dansei A 1Mastogloia smithii A 1Neofragilaria nicobarica A 1Nitzschia granulata A 1 1 1 2 1 1 1 11 1 5,5 41 4 1Nitzschia navicularis A 2Paralia sulcata A 5 3 22 1,5 1 1,5 1
Pleurosira laevis v. polymorpha A 1Rhaponeis amphiceros A 1
Stephanopyxis spp A 1Trachyneis aspera A 1Triceratum reticulum A 1 1Actinoptychus adriaticus B 1 3 1Actinoptychus grundleri B 1
Actinoptychus sp. B 1Anomoeoneis sphaerophora B 1 1 2Caloneis permagna B 1 2 1 1 1 1 1Cocconeis scutellum B 1
Coscinodiscus sp. B 1 1 2Cyclotella crassa B 1
Cyclotella striata v. bipunctata B 1Diploneis interrupta B 9 33 23,5 18,5 31 30 16 6,5 15 9 26,5 18,5 11 36,5 56,5 36,5 9,5 88,5 43 14 97 67 7,5 41 20,5 2,5 12 12,5 7Diploneis pseudovalis B 3 2 1 1 3 5,5 1 1 2 2 1 79 21,5 80,5 30,5 3,5
Diploneis sp. B 4Hantzschia distinctepunctata B 3,5 5,5 5,5 4 5 11,5 2,5 2 1,5 5,5 4 6,5 4 4,5 5 4 5 16,5 4 3 1 19 28 17 24 1 9,5 2 1,5
Hyalodiscus sp. B 1 1 1 1 2 1 1Melosira moniliformis B 4Navicula normaloides B 1Nitzschia circumsuta B 1 2 3
Nitzschia hungarica B 1
Nitzschia levidensis v. victoriae B 1 1,5 1Nitzschia littoralis B 1Nitzschia obtusa B 1 2Rhopalodia acuminata B 1 1 2,5 1 1 2 1,5 2,5 1 1 1 1 1 1 1,5 2Amphora crucifera C 2Amphora pediculus C 3Cyclotella meneghiniana C 1 2 2,5 1 3 1 1,5 2 1,5 1 2 2 4 9 1 2,5 1 1 1Epithemia turgida C 1 1 2Amphora copulata D 1 5 7 4 1 5 3 4 9 5 13 3 2 1 7 2,5 1 3 14 17,5 2,5Amphora libyca D 3 4 1 1 1 3Amphora ovalis D 1 1 1 1Caloneis bacillum D 3 1 1Caloneis molaris D 1 3 1 2Caloneis silicula D 5Cocconeis placentula D 1 1
Cocconeis placentula v. euglypta D 1 1,5Denticula kuetzingii D 1,5 2 2 3 1 1 1,5 1 4,5 1 4 1 1Epithemia adnata D 2 3,5 9,5 11,5 1,5 9,5 6 9,5 12 3 6,5 4,5 3 5 6 1,5 11,5 6,5 2 6 4,5 3,5 1,5 1Epithemia argus D 2,5Epithemia cistula D 1Epithemia smithii D 1 1Epithemia sorex D 1 2 1Fragilaria brevistriata D 5 2 3 1 2 3 6 2 2Fragilaria construens D 1 1
Fragilaria construens v. construens D 2,5 1 2 1 3 1 1 1 2 2 8 2
Fragilaria construens v. venter D 2 2 5 2 1 5Navicula capitata D 2Navicula cuspidata D 1 3 10,5 1 1 10 1 1 1 1 1 1 1Navicula integra D 1 1 2Navicula rhynchocephala D 1Nitzischia amphibia D 1 1 1 1Rhopalodia gibba D 1 2 6 1,5 2 3 2,5 5,5 4 5,5 3,5 4 1 2 1,5 1 3,5 2,5 1,5 1 1 8,5 2 4,5 1,5 2 1,5
Rhopalodia gibba v. parallella D 1 1,5Rhopalodia operculata D 1
Suriella brebissonii D 1
Achnanthes lanceolata v. frequentissima E 1Amphora inariensis E 1 3 2Aulacoseira ambigua E 1 1 3 1Aulacoseira crassipunctata E 1 1 2Aulacoseira distans E 3Aulacoseira granulata E 6 3 1 11 1 4,5 1 2 3 3 2 1 1 4 1 2 6 1 3 4
Aulacoseira spp E 1 2 2 1 2 1 1 1 2Carpartogramma crucifera E 2 2 1 1 1,5 1 2 1Cocconeis neodiminuta E 1Cymatopleura solea E 1 1 1 1Cymbella affinis E 1 1 1Cymbella ehrenbergii E 1 1 1 1 3 3Cymbella meulleri E 1 2 3 1 1,5 3 4 2 1Cymbella silesiaca E
Cymbella spp E 1 1 4 1 1 2 1Cymbella tumida E 1Diploneis elliptica E 1 5 3 3 1 4,5 1 1 1 3 1 2Eunotia minor E 1Eunotia pectinalis E 2Eunotia soleirolii E 1 1
Eunotia spp E 1 2,5 4 2,5 3 2 2 2,5 2 3,5 1 2,5 1 1 1 1,5 1,5 2 1,5 1Fragilaria pinnata E 1Fragilaria ulna E 1 1 3 1,5 1 3 2 1,5 6 3 3,5 2,5 1 2,5 3 2 1 3 1 2 1 1Fragilaria virescens E 2
Gomphonema augur v. turris E 4Gomphonema cleveii E 1 1 1
Gomphonema spp E 3 1 2Gyrosigma acuminatum E 3Gyrosigma obtusatum E 1 1 1 1 7 7 10,5 31,5 1Gyrosigma wormleyi E 7,5Navicula confervacea E 2
Navicula laevissima v. laevissima E 1Navicula pupula E 1 1 1
Navicula pupula v. nyassensis E 1Navicula radiosa E 1 1 1 1 1
Navicula tuscula E 1Neidum iridis E 1Nitzschia palea E 3Nitzschia valdecostata E 2Nitzschia vermicularis E 1Pinnularia divergens E 1Pinnularia maior E 1
Pinnularia spp E 1 1 2 4 2 1 3 5 1,5 1,5 1 1 1 1Rhopalodia gibberula E 3Rhopalodia vermicularis E 1 1 1 1 1Stauroneis anceps E 1 1 1 2 3 1 1 1Stauroneis phoenicenteron E 1
Stauroneis spp E 2 1 1 1 1Stephanodiscus minutulus E 1
Stephanodiscus sp. E 1Suriella linearis E 1Achnanthes inflata F 1
Achnanthes spp F 2Hantzschia amphioxys F 8,5 5 3,5 4 2,5 3 3 6 4 3,5 3 5 1 3 5 1 3 2 2,5 4 1 6 1 2Navicula mutica F 1 4 2 2,5 1 2 1 1 1 1 1,5 1 3 1Pinnularia borealis F 3 1,5 1 3,5 2 1,5 1 1 1 1,5 2 3 2 2,5 2,5 6 2 1 1 1 2 1 1
Amphora spp G 1 1 1 1 5 4 1
Caloneis spp G 1 2 1
Cyclotella sp. G 1 2
Diploneis spp G 3 4 1
Epithemia spp G 1,5 1 1 1
Fragilaria spp G 1 1 1 1 2
Gyrosigma spp G 3,5 1
Hantzschia sp. G 3Lyrella impercepta G 1
Mastogloia spp G 1
Navicula spp G 1,5 3 3
Nitzschia cf. valdecostata G 2 3
Nitzschia spp G 1 2 1 2 1 2 1 2 2 2 1
Opephora spp G 1
Suriella spp G 1 1 1
Synedra spp G 1 1 1Varia G 1,5 1,5 1,5 5 1 1 1 1 1,5 6 2,5 4 1 2 3,5 6 1 3 2 1 3 1

P3Depth (cm)
Taxa Ecology 105 115 125 135 145 155 175 185 195 303 308 313 350 365
Campylodiscus clypeus A 1
Coscinodiscus radiatus v. parvus A 1 3 3
Cosinodiscus asteromphalus A 1
Diploneis caffra A 6 1 3
Diploneis smithii A 3
Fragilaria schultzii A 1
Nitzschia granulata A 1 1 1 5,5 10 19,5 1 1
Nitzschia navicularis A 1 1
Paralia sulcata A 4,5 4,5 19,5 22 3
Rhaponeis amphiceros A 1
Actinoptychus adriaticus B 2 1 1 2
Diploneis interrupta B 3 1,5 9 8 1 1 3 1,5 17 14,5 11 10,5 4,5
Diploneis pseudovalis B 2 2 9 1
Hantzschia distinctepunctata B 1 1 1 6 3,5 1,5 1
Hyalodiscus sp. B 1 1 4 26 1
Melosira nummuloides B 1
Terpsinoë americana B 1
Cyclotella meneghiniana C 1 1 2 1 1
Amphora copulata D 2
Caloneis bacillum D 2
Cyclotella distinguenda D 1
Denticula kuetzingii D 1
Diploneis ovalis D 1
Epithemia adnata D 2 1,5 1,5 1,5
Fragilaria brevistriata D 8
Fragilaria construens v. venter D 2
Navicula cuspidata D 1
Navicula integra D 1
Rhopalodia gibba D 1
Aulacoseira granulata E 1 1 3 1
Cymbella affinis E 1
Cymbella spp E 2
Diploneis elliptica E 1
Eunotia spp E 1 1,5 1 5,5
Fragilaria ulna E 1
Gomphonema spp E 1
Gyrosigma obtusatum E 2
Pinnularia spp E 3
Hantzschia amphioxys F 31,5 1 3 24,5 1 1
Navicula goeppertiana F 2
Navicula mutica F 1 3 6 4,5 1
Navicula paramutica F 2,5 7,5
Pinnularia borealis F 1 1 1,5 1
Stauroneis cf. obtusa F 1
Caloneis sp. G 1
Fragilaria spp G 2
Lyrella sp. G 1
Navicula spp G 2
Nitzschia spp G 2
Varia G 2 1 1
P6Depth (cm)
Taxa Ecology 5 15 25 35 45 55 65 75 85 95 105 115 125 135 145 152 167 194 220 240 250 280 300 320 340 350 360 380 400
Eunotogramma frauerfeldii A 2
Eunotogramma sp. A 1,5
Navicula xi v. peltoides A 2 1
Paralia sulcata A 6,5 5,5 3,5 1 1 5 11,5
Psammodiscus nitidus A 1
Actinoptychus adriaticus B 1 1
Diploneis interrupta B 9 1 3 5,5 1 1,5
Hyalodiscus sp. B 5 2
Nitzschia cocconeiformis B 1 1 1 5
Terpsinoë americana B 3 8,5 4,5 2 3,5 3
Cyclotella distinguenda D 1
Hantzschia amphioxys F 1,5
Navicula goeppertiana F 1
Navicula mutica F 8,5
Pinnularia borealis F 8 1 1
Lyrella sp. G 1 1
P8Depth (cm)
Taxa Ecology 5 15 25 35 45 55 65 75 85 95 105 115 125 135 145 155 165 175 185 195 205 215 225
Diploneis caffra A 1
Nitzschia granulata A 1
Paralia sulcata A 4
Diploneis interrupta B 1 2 1
Hyalodiscus sp. B 15 4
Terpsinoë americana B 1
Hantzschia amphioxys F 2,5 15
Navicula goeppertiana F 1
Navicula mutica F 5,5 17
Pinnularia borealis F 4,5 17
Nitzschia spp G 2

85
12. Appendix 4. Micrographs of Cyclotella sp. Pictures 1-4 are from ESEM and 5-6 are from
light microscope. For discussion on taxonomy see Table 2.

86
13. Appendix 5. Micrographs of Diploneis sp. Pictures 1-2 are from ESEM and 3-4 are from
light microscope. For discussion on taxonomy see Table 3.

87
14. Appendix 6. Micrographs of diatom species from the lower Save River. Pictures 1-7 are
from ESEM and 8-9 are from light microscope.

88
Top Related