


Languages
Pages
Legal

Demography, Human Capital and Cross-Country IncomeDifferences
Anna Raggl
WiC - Wittgenstein Centre for Demography and Global Human CapitalWU - Vienna University of Economics and Business
Nairobi, October 2011
1 / 33
Outline I
1 Introduction
2 Age-structured Educational Attainment DataThe IIASA-VID DatasetBack Projections of Demographic DataForward Projections of Demographic Data
3 Age-specific Human Capital and Economic GrowthContribution to GrowthTechnology Adoption
4 Population Aging and Economic Growth
5 Demography and Institutions
6 Demography and Inclusive Growth
7 Hands-on Exercise
2 / 33

Introduction
Introduction
Positive relationship between educational attainment and income at theindividual level obvious in the data
Relationship at the macroeconomic level less clear cut
I Pritchett (2001): heterogeneous countriesI Temple (1999) shows that one reason could be ignoring outliersI Deficiencies in human capital data and measurement errors
Data on average educational attainment of entire adult population tooaggregated?
Exploit age-group and gender specific attainment levels
I education of young cohorts might have a different impact on growththan education of elderly cohorts
I further disaggregate by gender
3 / 33
Age-structured Educational Attainment Data The IIASA-VID Dataset
Educational Attainment by Age and Sex, 1970–2000
Dataset constructed by IIASA and VID (Lutz et al., 2007)
Demographic back projections of the population by age, educationalattainment and sex from 2000 to 1970 (1960), by exploiting the fact,that men and women with different educational attainment levels havedifferent mortality and migration rates (as opposed to other datasets, thatused economic capital accumulation models for projections, e.g. Barro andLee (2010))
I 5-year age groupsI 4 categories of educational attainment (no education, primary,
secondary, tertiary); due to method, the categories are strictlyconsistent over time
I males/females
Available for 120 countries (93% of 2000 world population)
Furthermore,
I Construction of mean years of schooling from the projectionsI Forward projections from 2000 to 2050
4 / 33
Age-structured Educational Attainment Data The IIASA-VID Dataset
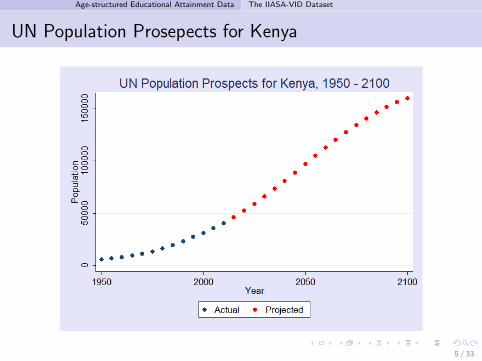
UN Population Prosepects for Kenya
5 / 33

Age-structured Educational Attainment Data The IIASA-VID Dataset
Population Pyramid for Kenya in 2000
Figure: Kenya in 2000: Population by Age, Sex and Educational Attainment6 / 33

Age-structured Educational Attainment Data Back Projections of Demographic Data
The Idea of Back Projections
Year 2000 is used as the base year: derivation of distribution of educationalattainment for each country employing census data and DHS
UN World Population Prospects provide estimates of population between1950–2000 by age and sex
Consider the group of 55–59 year old women in 2000 with no education(58.9% of all women in this age group have no education)
Conceptual logic
I The size of a cohort as it ages over time can only change throughmortality and migration
I Mortality and migration rates differ among attainment levelsI After a certain age, no further education is aquired
After correcting for education-specific mortality rates and migrationbehaviour, the above group defines the group of 50-54 year old women in1995 (59.0%), the group of 45–49 year old women in 1990 (59.1%), . . .
7 / 33
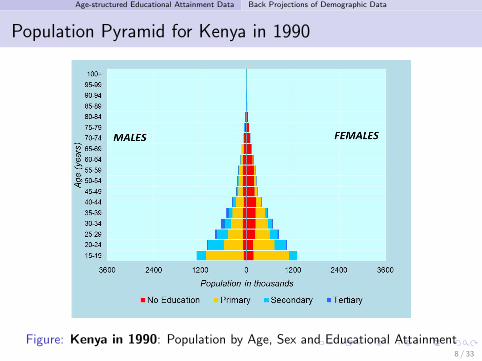
Age-structured Educational Attainment Data Back Projections of Demographic Data
Population Pyramid for Kenya in 1990
Figure: Kenya in 1990: Population by Age, Sex and Educational Attainment8 / 33
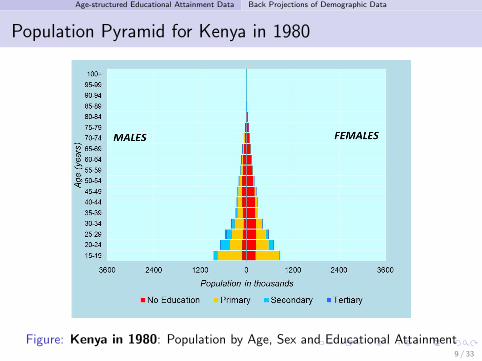
Age-structured Educational Attainment Data Back Projections of Demographic Data
Population Pyramid for Kenya in 1980
Figure: Kenya in 1980: Population by Age, Sex and Educational Attainment9 / 33
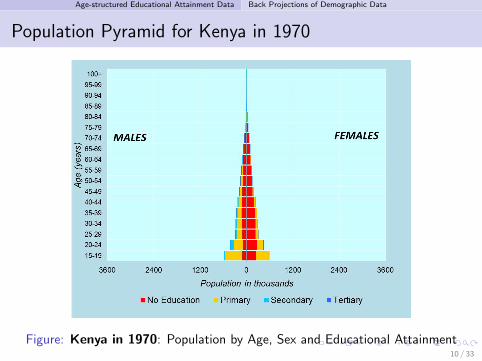
Age-structured Educational Attainment Data Back Projections of Demographic Data
Population Pyramid for Kenya in 1970
Figure: Kenya in 1970: Population by Age, Sex and Educational Attainment10 / 33

Age-structured Educational Attainment Data Forward Projections of Demographic Data
Forward Projections of Demographic Data I
Population projection by age group, sex and educational attainment (K.C.et al., 2010)
Base year 2000, projection for every 5th year until 2050
All three fundamental demographic components are affected by education
I fertility (−)I mortality (−)I migration (+)
Accounting for this,
I allows a more precise estimate of future populationI provides a useful data source for growth pontential analyses
11 / 33

Age-structured Educational Attainment Data Forward Projections of Demographic Data
Forward Projections of Demographic Data II
4 different scenarios of educational development
I Constant enrollment number (CEN) scenarioI Constant enrollment ratio (CER) scenarioI Global education trend (GET) scenarioI Fast-track (FT) scenario
F 99% of primary until 2015F 50% of secondary until 2030, 90% until 2050F 60% of tertiary until 2050
GET is considered as the most realistic one, CEN and CER constitute ratherpessimistic, and FT rather optimistic views
12 / 33
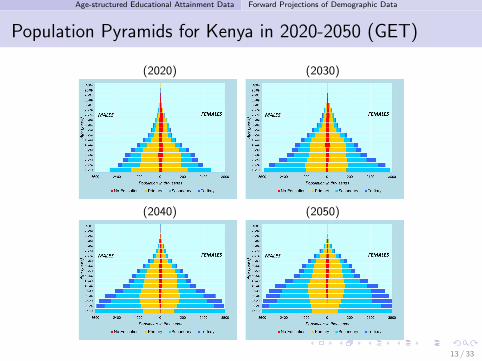
Age-structured Educational Attainment Data Forward Projections of Demographic Data
Population Pyramids for Kenya in 2020-2050 (GET)
(2020) (2030)
(2040) (2050)
13 / 33
Age-specific Human Capital and Economic Growth Contribution to Growth
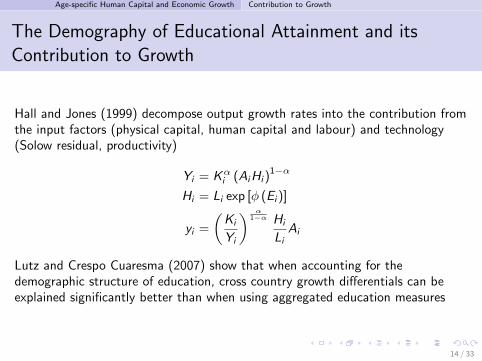
The Demography of Educational Attainment and itsContribution to Growth
Hall and Jones (1999) decompose output growth rates into the contribution fromthe input factors (physical capital, human capital and labour) and technology(Solow residual, productivity)
Yi = Kαi (AiHi )
1−α
Hi = Li exp [φ (Ei )]
yi =
(Ki
Yi
) α1−α Hi
LiAi
Lutz and Crespo Cuaresma (2007) show that when accounting for thedemographic structure of education, cross country growth differentials can beexplained significantly better than when using aggregated education measures
14 / 33
Age-specific Human Capital and Economic Growth Technology Adoption
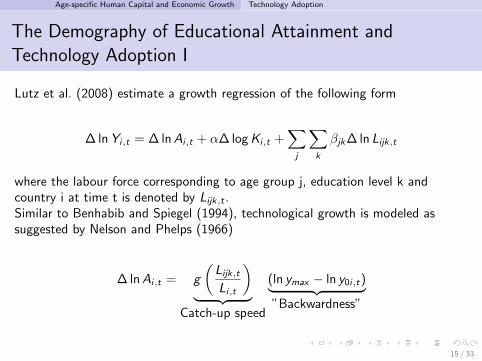
The Demography of Educational Attainment andTechnology Adoption I
Lutz et al. (2008) estimate a growth regression of the following form
∆ ln Yi,t = ∆ ln Ai,t + α∆ log Ki,t +∑j
∑k
βjk∆ ln Lijk,t
where the labour force corresponding to age group j, education level k andcountry i at time t is denoted by Lijk,t .Similar to Benhabib and Spiegel (1994), technological growth is modeled assuggested by Nelson and Phelps (1966)
∆ ln Ai,t = g
(Lijk,t
Li,t
)︸ ︷︷ ︸
Catch-up speed
(ln ymax − ln y0i,t)︸ ︷︷ ︸”Backwardness”
15 / 33
Age-specific Human Capital and Economic Growth Technology Adoption
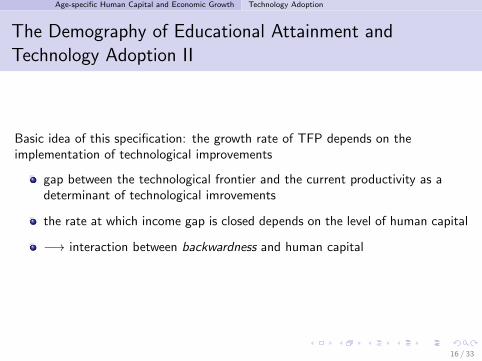
The Demography of Educational Attainment andTechnology Adoption II
Basic idea of this specification: the growth rate of TFP depends on theimplementation of technological improvements
gap between the technological frontier and the current productivity as adeterminant of technological imrovements
the rate at which income gap is closed depends on the level of human capital
−→ interaction between backwardness and human capital
16 / 33
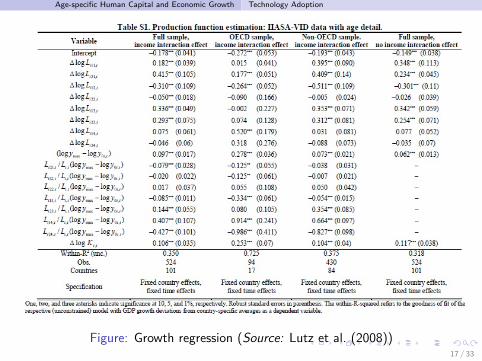
Age-specific Human Capital and Economic Growth Technology Adoption
Figure: Growth regression (Source: Lutz et al. (2008))17 / 33
Population Aging and Economic Growth
Population Aging and Economic Growth I
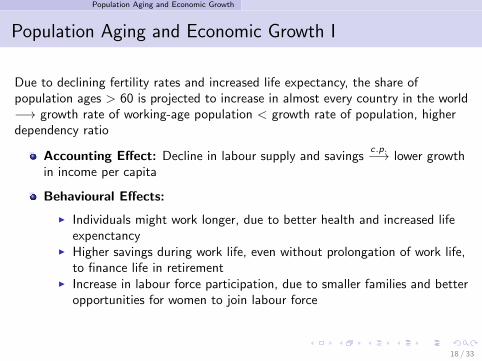
Due to declining fertility rates and increased life expectancy, the share ofpopulation ages > 60 is projected to increase in almost every country in the world−→ growth rate of working-age population < growth rate of population, higherdependency ratio
Accounting Effect: Decline in labour supply and savingsc.p.−→ lower growth
in income per capita
Behavioural Effects:
I Individuals might work longer, due to better health and increased lifeexpenctancy
I Higher savings during work life, even without prolongation of work life,to finance life in retirement
I Increase in labour force participation, due to smaller families and betteropportunities for women to join labour force
18 / 33

Population Aging and Economic Growth
Population Aging and Economic Growth II
Figure: labour force participation: 2005 vs. 2050 (Source: Bloom et al. (2011))
19 / 33

Population Aging and Economic Growth
Population Aging and Economic Growth III
Figure: labour force to population ratio: 2005 vs. 2050 (Source: Bloom et al.(2011))
20 / 33

Population Aging and Economic Growth
Population Aging and Economic Growth IV
Bloom et al. (2011) investigate how economic growth would have looked in thelast 50 years under the ”future demographic change” and find
No large deviations from average annual growth rate (1.84% vs. 1.75%);about half of the countries would have grown more slowly
OECD countries: decrease in growth rates from 2.8% to 2.1%
Most Sub-Saharan Africa countries: reversed picture due to projectedslowing population growth until 2050; increase in average growth rates by0.67% points
Note, that (policy induced) behavioural effects could mitigate parts of theaccounting effects
21 / 33
Demography and Institutions
Demography, Educational Attainment and Democracy I
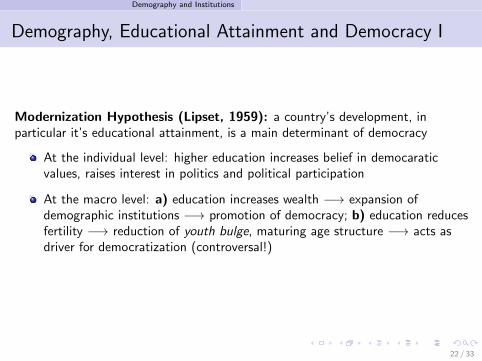
Modernization Hypothesis (Lipset, 1959): a country’s development, inparticular it’s educational attainment, is a main determinant of democracy
At the individual level: higher education increases belief in democaraticvalues, raises interest in politics and political participation
At the macro level: a) education increases wealth −→ expansion ofdemographic institutions −→ promotion of democracy; b) education reducesfertility −→ reduction of youth bulge, maturing age structure −→ acts asdriver for democratization (controversal!)
22 / 33

Demography and Institutions
Demography, Educational Attainment and Democracy II
Figure: Political rights and Education (Source: Lutz et al. (2010))
23 / 33

Demography and Institutions
Demography, Educational Attainment and Democracy III
Basic specification to analyse the link between education and democracy
Demi,t = ρDemi,t−1 + θEdi,t−1 + εi,t
εi,t = µi + λt + νi,t
The lagged form of the democracy variable on the right hand side takes intoaccount the persistent nature of political regimes. The education variable,Edi,t−1, enters as mean years of schooling in the simplest case. Furthermore,fixed country and time effects control for country and period specific shocks.
24 / 33
Demography and Institutions
Demography, Educational Attainment and Democracy IV
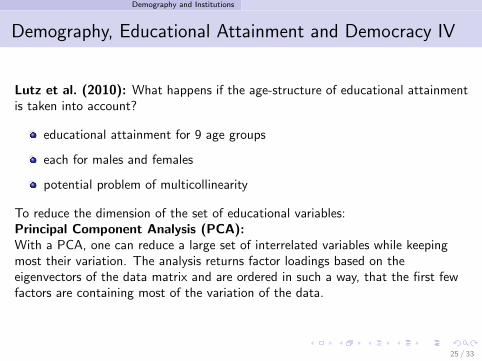
Lutz et al. (2010): What happens if the age-structure of educational attainmentis taken into account?
educational attainment for 9 age groups
each for males and females
potential problem of multicollinearity
To reduce the dimension of the set of educational variables:Principal Component Analysis (PCA):With a PCA, one can reduce a large set of interrelated variables while keepingmost their variation. The analysis returns factor loadings based on theeigenvectors of the data matrix and are ordered in such a way, that the first fewfactors are containing most of the variation of the data.
25 / 33

Demography and Institutions
Demography, Educational Attainment and Democracy V
26 / 33
Demography and Institutions
27 / 33
Demography and Institutions
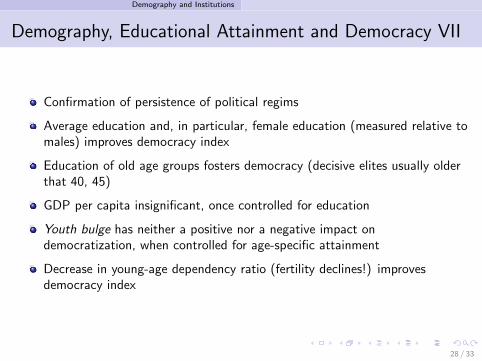
Demography, Educational Attainment and Democracy VII
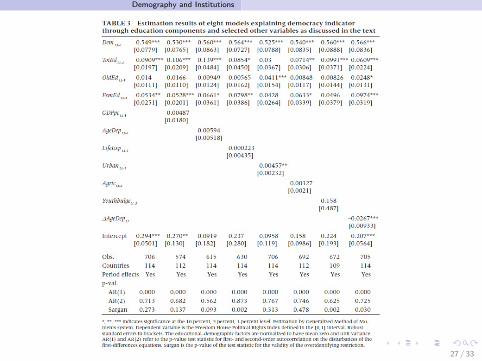
Confirmation of persistence of political regims
Average education and, in particular, female education (measured relative tomales) improves democracy index
Education of old age groups fosters democracy (decisive elites usually olderthat 40, 45)
GDP per capita insignificant, once controlled for education
Youth bulge has neither a positive nor a negative impact ondemocratization, when controlled for age-specific attainment
Decrease in young-age dependency ratio (fertility declines!) improvesdemocracy index
28 / 33
Demography and Inclusive Growth
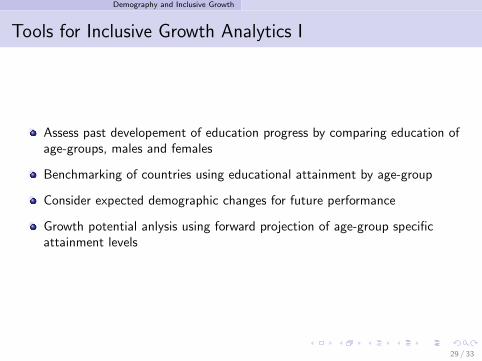
Tools for Inclusive Growth Analytics I
Assess past developement of education progress by comparing education ofage-groups, males and females
Benchmarking of countries using educational attainment by age-group
Consider expected demographic changes for future performance
Growth potential anlysis using forward projection of age-group specificattainment levels
29 / 33

Hands-on Exercise
Demographic Dimension of Educational Attainment inPakistan
Benchmarking exercise for Pakistan with a group of comparison countries interms of its educational attainment
(a) Interpretation of loadings of the two main components (iiasa.xlsx, spreadsheet loadings)
(b) Compute first and second component for each country and plot the firstagainst the second. Interpret the resulting graph. Describe the relativeposition of Pakistan compared to a group of reference countries
(c) Compute the education differential and plot it against the averageeducational attainment of the adult population. Interpret the resulting graphwith special focus on Pakistan.
30 / 33

Hands-on Exercise
References I
Barro, R. and J.-W. Lee (2010): “A New Data Set of EducationalAttainment in the World, 1950-2010,” NBER Working Paper No. 15902.
Benhabib, J. and M. M. Spiegel (1994): “The role of human capital ineconomic development. Evidence from aggregate cross-country data,” Journalof Monetary Economics, 34, 143–173.
Bloom, D. E., D. Canning, and G. Fink (2011): “Implications ofPopulation Aging for Economic Growth,” PDGA Working Paper No. 64.
Hall, R. E. and C. I. Jones (1999): “Why Do Some Countries Produce SoMuch More Output Per Worker Than Others?” The Quarterly Journal ofEconomics, 114, pp. 83–116.
K.C., S., B. Barakat, A. Goujon, V. Skirbekk, W. Sanderson, andW. Lutz (2010): “Projection of populations by level of educationalattainment, age, and sex for 120 countries for 2005-2050,” IIASA InterimReport, 22, 383–472.
31 / 33

Hands-on Exercise
References II
Lipset, S. M. (1959): “Some Social Requisites of Democracy: EconomicDevelopment and Political Legitimacy,” The American Political ScienceReview, 53, 69–105.
Lutz, W. and J. Crespo Cuaresma (2007): “Human Capital, AgeStructure and Economic Growth: Evidence from a New Dataset,” IIASAInterim Report, IR-07-11.
Lutz, W., J. Crespo Cuaresma, and W. Sanderson (2008): “TheDemography of Educational Attainment and Economic Growth,” Science, 319,1047–1048.
Lutz, W., J. C. Cuaresma, and M. J. Abbasi-Shavazi (2010):“Demography, Education, and Democracy: Global Trends and the Case ofIran,” Population and Development Review, 36, 253–281.
Lutz, W., A. Goujon, S. K.C., and W. Sanderson (2007):“Reconstruction of population by age, sex and level of educational attainmentof 120 countries for 1970-2000,” Vienna Yearbook of Population Research,2007.
32 / 33

Hands-on Exercise
References III
Nelson, R. R. and E. S. Phelps (1966): “Investment in Humans,Technological Diffusion, and Economic Growth,” The American EconomicReview, 56, pp. 69–75.
Pritchett, L. (2001): “Where Has All the Education Gone?” The World BankEconomic Review, 15, 367–391.
Temple, J. (1999): “A positive effect of human capital on growth,” EconomicsLetters, 65, 131 – 134.
33 / 33
Top Related