


Languages
Pages
Legal

January 2014 Data collected in 2011-2012
Comprehensive Food Security and Vulnerability Analysis (CFSVA)
Democratic Republic of Congo

2 Comprehensive food security and nutrition survey, Liberia
DEMOCRATIC REPUBLIC OF CONGO COMPREHENSIVE FOOD SECURITY AND VULNERABILITY ANALYSIS
(CFSVA)
Data collected from 2011-2012. Report published in January 2014. Editorial team Koffi AKAKPO, Head of VAM Unit (WFP-DRC); [email protected]; Josee RANDRIAMAMONJY (IFPRI); [email protected]; John ULIMWENGU (IFPRI); [email protected]; Composition of the design team and data collection coordination WFP Koffi AKAKPO Head of VAM Unit (Kinshasa Office); [email protected] Pembe LERO VAM National Officer (Kinshasa Office); [email protected] Constant PHAMBU VAM Assistant (Kinshasa Office); [email protected] Moustapha TOURE VAM Officer (Kivus and Maniema AO); [email protected] David MUDILO VAM National Officer (North Kivu Sub Office); [email protected]; Jules EPANZA VAM National Officer (South Kivu Sub Office); [email protected] Jesse MUZALIA VAM National Officer (Orientale Province Area Office); [email protected] Visi VISIRIRWA VAM National Officer (Katanga Area Office); [email protected] IFPRI Josee RANDRIAMAMONJY John ULIMWENGU Government National Institute of Statistics (INS) Ministry of Agriculture (MINAGRI) National Program of Nutrition (PRONANUT) Cluster FAO Other cluster members © World Food Programme, Department of Food Security Analysis (VAM) World Food Programme (WFP) Headquarters: Via C.G. Viola 68, Parco de Medici, 00148, Rome, Italie All information about the department of Food Security Assessments (VAM) and reports in electronic format on http://www.wfp.org/food-security ou [email protected] For more information, contact: Martin OHLSEN : Country Director of WFP; [email protected], Silvia CARUSO : Deputy Country Director of WFP; [email protected] Patrizia PAPINUTTI : Head of program; [email protected] Koffi AKAKPO : Head of VAM; [email protected] WFP Headquarters, Rome, Italy Joyce Kanyangwa LUMA, Deputy Director, Policy, Programme and Innovation Division- Analysis and Nutrition Service. United Nations World Food Programme, [email protected] Arif HUSAIN, Deputy Chief, Food Security Analysis Service (ODXF). United Nations World Food Programme,
Astrid MATHIASSEN, Senior Advisor, Food Security Analysis Service (ODXF). United Nations World Food Programme,
1 Contents
2 EXECUTIVE SUMMARY ..................................................................................................................... 10
3 CFSVA OBJECTIVES AND METHODOLOGY ....................................................................................... 15
4 FOOD SECURITY AND VULNERABILITY ANALYSIS ............................................................................. 16
4.1 Natural Capital ......................................................................................................................... 17
4.1.1 Agriculture at household level ......................................................................................... 17
4.1.2 Farmers’ constraints ........................................................................................................ 21
4.2 Human Capital ......................................................................................................................... 23
4.2.1 Migration ......................................................................................................................... 26
4.2.2 Education ......................................................................................................................... 28
4.3 Physical Capital ........................................................................................................................ 30
4.3.1 Household wealth index .................................................................................................. 33
4.3.2 Drinking water and sanitation facilities ........................................................................... 35
4.3.3 Source of lighting, housing, and tenure ........................................................................... 37
4.4 Economic Capital ..................................................................................................................... 38
4.4.1 Household participation in markets ................................................................................ 38
4.4.2 Food and non-food expenditures .................................................................................... 40
4.5 Livelihoods ............................................................................................................................... 45
4.5.1 Livelihood activities ......................................................................................................... 46
4.5.2 Livelihood profiles and incomes ...................................................................................... 47
4.6 Household Food Consumption: Diet Diversity & Frequency of Food Consumed .................... 52
4.6.1 Seasonality of food consumption .................................................................................... 54
4.6.2 Household food consumption groups ............................................................................. 58
4.6.3 Geographic distribution of the three food consumption groups .................................... 60
4.7 Risks and Vulnerabilities .......................................................................................................... 64
4.7.1 Exposure to risks and shocks ........................................................................................... 64
4.7.2 Capacities to cope ............................................................................................................ 64
4.8 Household Food Security Profiling .......................................................................................... 66
4.8.1 Food Insecure Households in the DRC: Where and how many are affected? ................. 66
4.8.2 Food Insecure Households in the DRC: Who are they? ................................................... 71
5 HEALTH AND NUTRITION ................................................................................................................. 79
5.1 Health and Food Security: Conceptual Framework ................................................................. 79
5.1.1 Food insecurity, poverty and health ................................................................................ 79
5.1.2 Food insecurity, nutrition, and health ............................................................................. 79
5.2 Current Health Situation in DRC .............................................................................................. 80
5.2.1 Place of delivery ............................................................................................................... 80
5.2.2 Health interventions: Insecticide Treated Net (ITN) usage, Vitamin A supplementation
and Deworming ............................................................................................................................... 82
5.2.3 Disease prevalence among children and Regional pattern of childhood disease ........... 87
5.2.4 Access to health care ....................................................................................................... 87
5.2.5 Child feeding practices ..................................................................................................... 89
5.3 Child Nutrition ......................................................................................................................... 91
5.3.1 Socio economic correlates of child nutrition ................................................................... 94
6 Conclusion ........................................................................................................................................ 95
Annex B. Prevalence and absolute number of food insecure people at the territory level ................... 99
7 References ..................................................................................................................................... 106

List of Tables
Table 1: Percent of households citing each agricultural activity as one of the three
main livelihood activities of the household by province ............................................... 18
Table 2: Percent of households who cultivated in 2011-2012 by province .................. 19
Table 3: Percent of household having experienced different types of agricultural
constraints ................................................................................................................... 22
Table 4: Household characteristics by province .......................................................... 24
Table 5: Dependency ratio (%).................................................................................... 25
Table 6: Percent of household by residency status and by province ........................... 27
Table 7: Percent of household that hosted displaced / returnee over the last 12 months
.................................................................................................................................... 27
Table 8: School attendance of children of 6-12 years old by province ........................ 29
Table 9: Education of household head by province (%) .............................................. 30
Table 10: Percent distribution of households by housing characteristics and ownership
of various household assets. ....................................................................................... 32
Table 11: Total annual average per capita expenditures by wealth tercile .................. 43
Table 12: Price of main staple food and fuel by province ............................................ 45
Table 13: Most frequently mentioned livelihood activities as main income source (%
HHs) ............................................................................................................................ 47
Table 14: Livelihood groups with their average annual per capita income .................. 49
Table 15: Livelihood of lowest wealth tercile ............................................................... 51
Table 16: Average number of meals household members ate the day preceding the
survey ......................................................................................................................... 54
Table 17: Total number of rural population by food insecurity status and by province 68
Table 18: Percent of households who cultivated less than 2 ha in 2011-2012 by food
security status ............................................................................................................. 77
Table 19: Percent of female and male, elderly and non-elderly household heads by
food security status ..................................................................................................... 78
Table 20: Trend in percentage of birth by place of delivery ......................................... 80
Table 21: Trend in ITN usage, Vitamin A supplementation, and De-worming ............. 83
Table 22: ITN usage in 2010 ....................................................................................... 86
Table 23: Disease prevalence and care seeking among children under five .............. 88
Table 24: Child feeding practices ............................................................................... 90
Table 25: Trend in prevalence of under five malnutrition ............................................ 92
Table 26: Agriculture seasonal calendar .................................................................... 97
Table 27: Average coping strategy index by province ................................................. 99
Table 28: Average coping strategy index by class of food consumption ..................... 99
Table 29: Food consumption score by coping strategy index categorie. ..................... 99
Table 30: Prevalence of food insecurity in Bas-Congo ............................................. 100
Table 31: Prevalence of food insecurity in Bandundu .............................................. 100
Table 32: Prevalence of food insecurity in Equateur ................................................ 101
Table 33: Prevalence of food insecurity in Province Orientale ................................. 102
Table 34: Prevalence of food insecurity in Nord-Kivu ................................................ 102
Table 35: Prevalence of food insecurity in Maniema ................................................ 103
Table 36: Prevalence of food insecurity in Sud-Kivu ................................................ 103
Table 37: Prevalence of food insecurity in Katanga ................................................. 104
Table 38: Prevalence of food insecurity in Kasai Oriental ......................................... 105
Table 39: Prevalence of food insecurity in Kasai Occidental .................................... 105

List of Figures
Figure 1: Food and nutrition security conceptual framework ....................................... 16
Figure 2: Percent of households who cultivated in 2011-2012 by land access and by
province ...................................................................................................................... 20
Figure 3: Average number of livestock per household by province ............................ 21
Figure 4: Population by age groups and sex ............................................................... 26
Figure 5: Wealth terciles by the variables included in the PCA ................................... 34
Figure 6: Wealth Index terciles by provinces ............................................................... 35
Figure 7: Percent of households using safe and unsafe drinking water by province ... 36
Figure 8: Percent of households using improved and unimproved sanitation facilities
by province .................................................................................................................. 37
Figure 9: Contribution of different sources of food at national level ............................. 38
Figure 10: Percent of sources of food by wealth terciles ............................................. 39
Figure 11: Sources of food by provinces ..................................................................... 39
Figure 12: Percent of food sources by households’ livelihoods ................................... 40
Figure 13: Average food and non-food expenditures at household level .................... 41
Figure 14: Percent of total food expenditures on cereals and tubers by provinces ..... 42
Figure 15: Total annual median per capita food and nonfood expenditures (1,000 CFs)
by province .................................................................................................................. 43
Figure 16: Total annual average per capita food and nonfood expenditures (1,000
CFs) by province ......................................................................................................... 44
Figure 17: Percent of household by number of livelihood activities households are
engaging and by province ........................................................................................... 46
Figure 18: Contribution of livelihood activities (%) to overall livelihood group ............. 51
Figure 19: Consumption of food groups (in days) by province over the last seven days
.................................................................................................................................... 53
Figure 20: Monthly seasonal price indices of main staple food and fuel in DRC (2008-
2012) ........................................................................................................................... 55
Figure 21: Percent of households reported to have experienced "difficulties" accessing enough
food over the past 12 months .......................................................................................... 56
Figure 22: Consumption of food groups (in days) by food consumption groups over the
last seven days ........................................................................................................... 60
Figure 23: Percent of households by food consumption groups and by provinces...... 61
Figure 24: Percent of household having experienced different types of difficulties over
the last 12 months prior the survey ............................................................................. 64
Figure 25: : Most frequently mentioned coping strategies used in response to
“difficulties” experienced over the last 30 days prior the survey .................................. 65
Figure 26: Coping Strategy Index by province ............................................................ 66
Figure 27: Prevalence of food insecure households by province ................................ 67
Figure 28: Prevalence of food insecurity by livelihood at national level ....................... 72
Figure 29: Prevalence of food insecurity by livelihood in Equateur ............................. 73
Figure 30 : Prevalence of food insecurity by wealth tercile ................................................. 74
Figure 31: Prevalence of food insecurity by main sources of foods ............................ 76
List of Maps
Map 1: Distribution of food consumption score at the provincial level ......................... 62
Map 2: Distribution of food consumption score at the territorial level .......................... 63
Map 3: Prevalence of food insecure households at the provincial level. ..................... 69
Map 4: Prevalence of food insecure households at the territorial level. ...................... 70
2 EXECUTIVE SUMMARY
The United Nations agencies in the DRC have formulated the United Nations Development
Assistance Framework (UNDAF) for the 2013-2017 periods. The DRC Government is
committed to work with UN agencies to achieve the stated objectives in UNDAF, especially
with respect to the main pillars of second growth and poverty reduction strategy paper
(DSCRP 2) that defines a wide range of priorities over the 2011-2015 periods. At the same
time, WFP and other humanitarian organizations continue to meet the needs of households
affected by food insecurity, malnutrition and hunger through their respective programs.
The majority of DRC population remains widely exposed to food insecurity, malnutrition and
hunger despite the country’s enormous agricultural potential. DRC is one of the few African
countries with tremendous potential for sustainable agricultural development (millions
hectares of potential cultivable land, a diversity of climates, an important hydrographic
network, a fishery and important livestock potential). Instead, the DRC is classified among
low-income food-deficit countries (LIFDCs). In terms of human development index, UNDP
ranked the country the 187th out of the 187 countries listed in 2011. The food security
situation remains precarious; the MICS 2010 survey reported that 57.8% of DRC people have
poor or limited food consumption. The November 2012 CPI report estimated at 5.4 million the
number of people in acute food crisis. According to IFPRI report in 2011, the global hunger
index (GHI) of the DRC has increased by 63%, mainly due to the conflict and political
instability. The results of the recent food security assessments conducted by WFP in the
Eastern province, North and South Kivu, Kasai Occidental, Province orientale, Equateur,
Maniema, and Katanga have shown that on average, more than 1/3 of households in the DRC
have a poor or limited food consumption. Recent assessments conducted in the areas
affected by the armed conflict in North Kivu, South Kivu, and Katanga indicates rates of global
acute malnutrition above the 15 percent emergency thresholds in some areas.
In this context, an in-depth analysis of food security and vulnerability (CFSVA) is intended to
provide a better understanding of food insecurity and vulnerability among rural households in
a non-emergency setting throughout the country. Such understanding will guide the design of
appropriate strategies to meet the needs of the people affected by food insecurity. The
current analysis will also help guide interventions by the Government, the UN agencies
including WFP and other humanitarian organizations. It will also help to update the database
on food security used in the CFSVA conducted by WFP in 2007-2008.
The current CFSVA report mainly builds on the Food Security and Vulnerability Analysis
household survey (as opposed to mixed-method survey, including anthropometric
measurements, a community questionnaire, and a market questionnaire) designed and
implemented in 2011-2012 by WFP in partnership with the Ministry of Agriculture,
PRONANUT, INS, FAO, UNICEF, NGOs, national and international members of the food
security cluster. The survey was conducted in 2011-2012 and covered 24884 rural households
in 10 provinces. A stratified and multi-stage sampling approach was used to provide estimates
of a set of food and nutritional security indicators at the provincial and national levels.
This report includes specific findings on the number of food insecure and vulnerable people in
the country, the geographic distribution of the food insecure and vulnerable groups, their
characteristics, their capacity to manage shocks, and the driving forces of food insecurity and
vulnerability. It includes additional findings from the Multiple Indicator Cluster Survey (MICS,
2010) and the Demographic and Health Survey (DHS, 2007).
The assessment of the state of household food security in the DRC starts with the analysis of
household food consumption, which is based on the food consumption score and
complemented by the household wealth and coping strategies.
Food consumption score (FCS): In this report, FCS is computed by grouping together food
items for which consumption was assessed over a seven-day recall period. At national level,
cereals are consumed at an average of 4.3 days a week with maize being the most frequently
eaten. Tubers are consumed every day (6.5 days) with cassava being the most important item
in the tuber group. Legumes and nuts are consumed 3.8 days a week, vegetables 5.7 days a
week. Animal protein including animal products such as eggs is consumed 2.5 days a week,
consumption of oil is high (6.1 days), while fruit and dairy products are hardly consumed (1.3
and 0.5 respectively).
The frequency of food consumption, as measured by the number of days the item was
consumed in a week, varies by provinces. The number of days households living in Nord-Kivu,
Sud-Kivu, and Equateur eat cereals is less than the national average. Consumption of cassava
remains almost seven days a week across all provinces with exception of Bas-Congo (2.7 days)
and Province orientale province (5.3 days). Consumption of legumes and nuts, source of
vegetal protein are above the national average in only three provinces: Bandundu (5.1 days),
Province orientale province (5.1 days), and Nord-Kivu (4.8 days). No significant difference has
been found in the fish and meat consumption - important sources of animal protein. The
same holds for vegetables, sources of vitamins. Milk/dairy products are only consumed in Bas-
Congo for 2.1 days a week.
Household food security is classified according to a combination of three indicators: (i) the food consumption score (FCS), which divides households into three groups: poor, borderline and acceptable food consumption, (ii) the wealth index, which is based on asset ownership and housing conditions, and divides households into terciles, and (iii) the coping strategy index (CSI), which is an indicator of the severity of households’ regular behavioral responses to food shortage and divides households into terciles.
By combining the three indicators above households are subsequently divided into three food security groups:
Severely food insecure – i) households with poor food consumption and ii) households with borderline food consumption but in the lowest wealth tercile and in the most severe coping strategy index tercile;
Moderately food insecure – i) the remaining households with borderline food consumption and ii) households with acceptable food consumption but in the most severe coping strategy index tercile;
Food secure – the remaining households with acceptable food consumption.
Food insecure households in the DRC: How many are they? Where are they?
At the national level, 54% of the rural households (about 28 million people) were considered
to be food insecure of which about 7.5 million people are severely affected. The province with
the highest absolute number of food insecure people is Equateur because of its large rural
population (7.5 million) combined with the relatively high proportion of food insecure
households (60%). In addition to Equateur, the provinces with shares of food insecure
households above the national average include Sud-Kivu (64%), Kasai Oriental (62%), Province
orientale (58%) and Katanga (57%). Map 4 which presents food insecurity in the 149
territories, the administrative units below the province, gives more insight on spatial
distribution of households most affected by food insecurity in the country.
Food insecure households in the DRC: Who are they?
Livelihood activities: engaging in just one livelihood activity is most common in the
DRC (55%), followed by two (30%). Having three livelihood activities was mentioned by 11% of
households. The first most important income source for all livelihood groups provides at least
80% of the households' average annual income. Food crop farmers and agricultural wage
laborers are the two groups that are most reliant on one single income activity contributing
up to 90% to their overall annual income. The largest share of poorest households was found
among fishermen (70%), followed by food crop farmers (57%), artisan (46%), and cash crop
and livestock farmers (36%).
The ways households access their food differ by livelihoods. Market purchases are the
dominant food source for overall household across all livelihoods (except the food crop
producers and fishermen with respectively 50% and 48 % of their food source coming from
own production); less than 40% of their food come from their own production.
At national level, notable difference was found across livelihoods in terms of food security
status. Unsurprisingly, highest shares of food secure household were found among the
fishermen (54%), and the salaried (49%). While at national level, agricultural wage labor was
the livelihood with highest share of household falling into food insecure group, in Equateur
province this livelihood was among the provinces with highest share of household being food
secure. After all, food insecurity is not necessarily related to the source of livelihood where
the poor households are involved in. Further research by province is important to better
understand the relationship between food insecurity and source of livelihood.
Household expenditure: Non-food expenditures and food expenditures covering 22 food items and 8 food groups were calculated. At national level, 67% of households’ income is spent on food. Expenditures on “meat, fish and egg” group is the largest food expenditure (20%) followed by cereals (16%), tubers (12%), legumes and nuts (7%), fats and oils (6%), and sweet (4%). Largest non-food expenditures are on health (6%), followed by education (5%), energy (5%), transport (4%), and alcohol and tabac (4%).
There are significant provincial differences especially on cereals and tubers expenditures patterns. Households living in Kasai Oriental and Bas-Congo devote the largest share of their food expenditures on cereals (36% and 32% respectively) but the smallest share on tubers (9% and 8% respectively) compared with Nord-Kivu where expenditure on tubers account for 29% with relatively small share of expenditures on cereals. This finding should be interpreted with cautious as the difference may result from substitution patterns during lean and harvest seasons of the year.
As expected, poor households spent a larger share of their income on food (72%) than rich households (62%). Similarly, there is clear difference in the share of food expenditures between the severely food unsecure households (73%), the moderately food insecure households (68%) and the food secure households (66%). The annual median and the average per capita food and non-food expenditures totaled 100 thousands CFs and 179 thousands CFs respectively. Surprisingly, share of food expenditures on meat and fish are higher among the poor households (35%), than the rich (25%). Similar distribution holds for the expenditures on fats and oils and sweets food group.
Wealth index: it is a composite index, a proxy indicator for household wealth that complements income and expenditure information. The wealth index is based on non-income information including ownership of mobile phone and housing conditions (safe drinking water, improved roof material, and improved wall material) collected during the CFSVA2011-2012. At national level, most of the population is found in the two lowest wealth terciles (70%). The distribution of wealth across surveyed provinces shows that the provinces with the share of the poor households below the national average include Equateur (87%), Bandundu (80%), Kasai Oriental (73%), Kasai Occidental (65%) Katanga (63%) and Maniema (51%). Wealthier provinces include Bas-Congo, Sud-Kivu and Nord-Kivu with about less than 15% of households considered poor. These results are in line with the findings on poverty using the DHS 2007 (Macro International Inc., 2008) when considering only the rural areas. The wealth index distribution (tercile) is also consistent with the expenditure distribution derived from the same CFSVA 2011-12 data.
Wealth is not automatically a shield against food insecurity; it is not always right to assume that a poor household is automatically food insecure, after all, 47% of poor households were found to be food secure at national level, slightly higher than the percentage in the non-poor household (45%). Similarly, 55% of the richest households were found to be food insecure. This percentage is not different from those of the households in the poor and the middle tercile.

Other household characteristics:
- Types of agricultural activities: Agriculture (including fishing) was found to generate income to 97% of households in rural DRC. Food crop farming was the most common among agricultural activities (69%), followed by livestock production (9%), fishing and forestry resources (7% respectively) and cash crop production (5%). Food crop production is a common livelihood activity for rural population across all eleven provinces. Fishing is more prevalent in Bandundu and Equateur.
- Access to land for cultivation: While access to land for cultivation is clearly an asset and potentially a sign of wealth, it does not appear to affect the Congolese food security in general and their food consumption in particular. While 72% of households with an adequate diet have access to land for cultivation, 70% of households with poor food consumption also do. Clearly, access to land does not mean much in itself; what matters is the way that land is accessed, its size, available inputs and source of labor, the level of market participation that influences the cultivator's wealth and food security status.
- Seventy two percent of all households interviewed reported that they had cultivated land during the agricultural season preceding the survey. Fifty two percent (53%) used less than 2 ha and 19% cultivated on more than 2 ha. Among rural households interviewed who cultivated land during the agricultural season preceding the survey, 86% cultivated their own land, 11% rented land and the rest accessed land through sharecropping. Land renting were most common in Bas-Congo, Province orientale province and Nord-Kivu.
- Overall mean household size is 6.8 members. At national level, the dependency ratio,
which is an age-population ratio of those typically not in the labor force (people aged
0-13 and those aged 60 and over) and those typically in the labor force (people aged
14-59), is 1.2. Higher dependency ratio is observed among food insecure households.
- Sex of household head: Female and male headed households do not differ in their food security patterns, refuting common allegations that female-headed households are more likely to be food insecure than male-headed households (as in Ndobo and Sekhampu, 2013; Felker-Kantor and Wood, 2012; Fuwa, 2000). Again, differences appear when disaggregated by province. The same conclusion holds for the difference between the food consumption of elderly and non-elderly headed households.
- In line with previous research, the more educated the household head, the better is the household's food security status. While only 13% of household heads who attended primary school are found in the severely food insecure households, 41 % and 46% of them belong to the moderately food insecure and food secure households, respectively.
The above characteristics of the severely and moderately food insecure should not be used to conclude on causal relationships. Instead they are indications, tendencies and could be considered as targeting criteria for food or non-food interventions. The list of characteristics discussed above is not exhaustive, nor should each one of them be given equal weight across different situations and locations. Development of more refined geographic- and situation-specific targeting tools is crucial.
3 CFSVA OBJECTIVES AND METHODOLOGY
The overall objective of this CFSVA is to provide information on the food security, vulnerability
to food security and nutritional status in DRC by:
- Analyzing the status of food insecure and vulnerable households in the context of the
human, social, physical and natural capital.
- Identifying the various risks that households are exposed to and the coping
mechanisms they employ.
- Evaluating the factors that determine food and nutrition security.
How to measure food security?
Food security’ defines a situation in which all people at all times have physical and economic access to sufficient, safe and nutritious food which meets their dietary needs and food preferences for an active and healthy life (FAO, 1996). Hence, food security has four main dimensions: Availability of food -This is the extent to which sufficient quantity and quality of food is
physically present in an area. This includes food found in markets, produced on local farms or
home gardens or provided as food aid or gifts.
Access to food - Even if food is available people cannot always access it. Food access is
ensured when communities, households and all individuals have enough resources to obtain
sufficient quantity and quality of food for a nutritious diet through a combination of home
production, stocks, purchase, barter, gifts, borrowing or food aid.
Utilization of food - Even if food is available and can be accessed, inefficient absorption of food by the body will lead to malnutrition. Food utilization may be affected by endemic disease, unsafe drinking water, poor sanitation or lack of appropriate nutritional knowledge, especially child feeding practices.
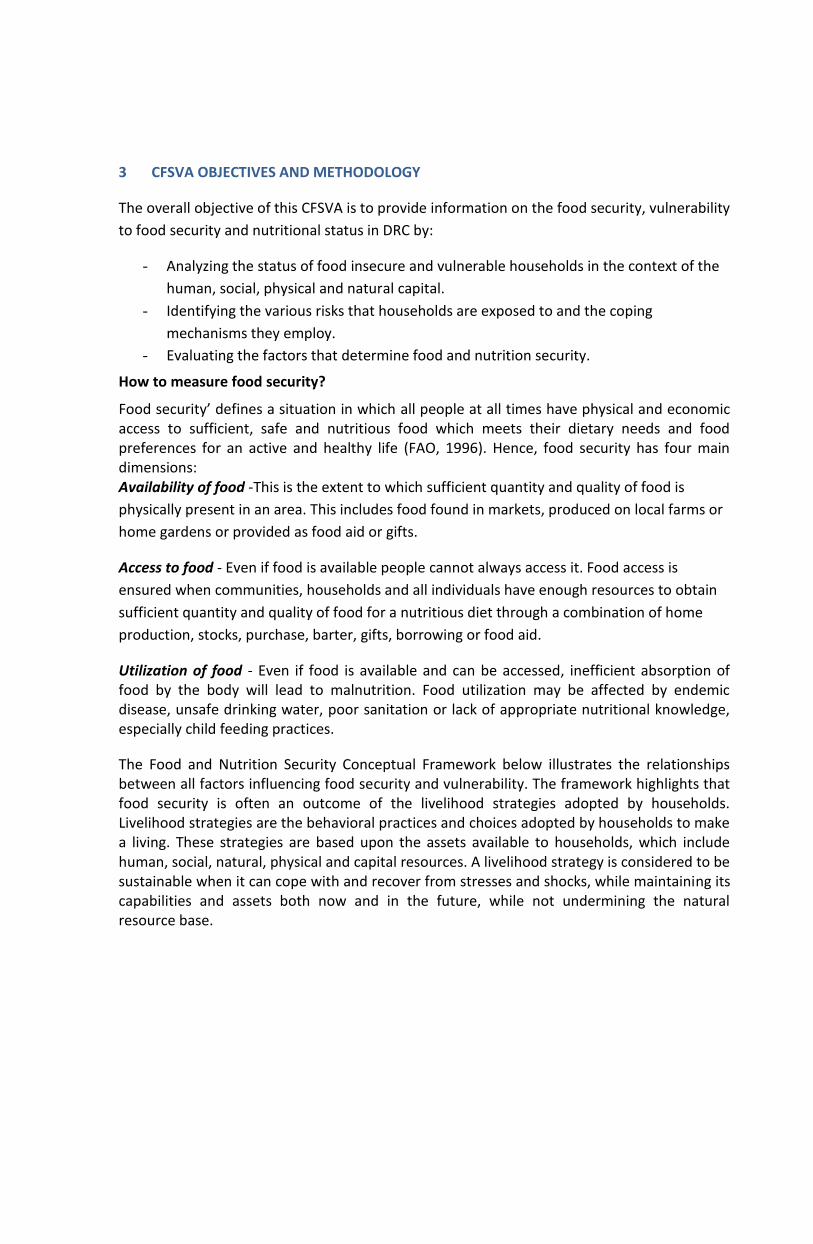
The Food and Nutrition Security Conceptual Framework below illustrates the relationships between all factors influencing food security and vulnerability. The framework highlights that food security is often an outcome of the livelihood strategies adopted by households. Livelihood strategies are the behavioral practices and choices adopted by households to make a living. These strategies are based upon the assets available to households, which include human, social, natural, physical and capital resources. A livelihood strategy is considered to be sustainable when it can cope with and recover from stresses and shocks, while maintaining its capabilities and assets both now and in the future, while not undermining the natural resource base.
Figure 1: Food and nutrition security conceptual framework
Source: WFP, 2009
4 FOOD SECURITY AND VULNERABILITY ANALYSIS
Households strive to secure sustainable, sufficient and adequate income and resources to meet basic needs which include access to food, clean water, health facilities, economic and educational opportunities, ensuring an adequate nutritional status, availability of adequate housing, physical safety and availability of time for community participation and social integration. There are six distinct assets or capitals – natural, human, physical, economic, social and political capitals - that are critical to meet these basic needs and determine the level of households' livelihood security. Shedding light on the relative importance of each of those assets and the extent to which they are available, functional, and adequate and combined, can unveil opportunities households enjoy and most importantly, point to the constraints that may be experienced with detrimental effects on households' welfare and food security.
4.1 Natural Capital
The natural capital refers to the environment in which people make a living and use the resources that are available to them. Natural capital includes land, water and other natural resources all of which play a major role not only for households' economic production but also in providing resilience in response to a shock, for example.
4.1.1 Agriculture at household level
Types of agricultural activities: Agriculture (including fishing) was found to provide an income
to 97% of households in rural area of DRC. Food crop farming was the most common among
the different agricultural activities (69%), followed by livestock production (9%), fishing and
forestry resources (7% respectively) and cash crop production (5%). Food crop production is a
common livelihood activity for rural population across all eleven provinces. Fishing is more
prevalent in Bandundu and Equateur. Agro-pastoralism is common in Bandundu and
Maniema. Forest resources are also an income source for a large share of households living in
Bandundu and Kasai Occidental. Numerous parties have been engaged in helping the country
with forest resource issues over the last several years. Working groups have identified the
need for implementation of national policies that advance the livelihoods of forest-dependent
communities, help secure their rights to the land and resources, develop mechanisms for
participatory community involvement, map community forest resources, and develop forest
management plans (USAID 2010).

Table 1: Percent of households citing each agricultural activity as one of the three main livelihood activities of the household by province
Province
Food crop
production,
home
gardening
Cash crop
production
Livestock
production/Animal
husbandry Fishing
Forest
resources,
hunting
and
gathering
Bas-Congo 77 3 4 1 6
Bandundu 35 12 24 32 22
Equateur 84 1 12 23 9
Province
orientale 54 5 10 4 4
Nord-Kivu 56 11 7 0 3
Maniema 68 9 17 7 5
Sud-Kivu 55 4 9 4 5
Katanga 86 1 3 12 8
Kasai Oriental 90 2 13 5 9
Kasai Occidental 69 6 9 8 14
Total 69 5 9 7 7
Source: CFSVA 2011-12
Cultivation of and access to land: Generally, in rural areas, the more land available, the better
the household wealth status. Seventy two percent of all households interviewed said they had
cultivated land during the agricultural season preceding the survey. Fifty two percent (53%)
used less than 2 ha and 19% cultivated on more than 2 ha. The average agricultural land size
per household is estimated at 2.5 ha given that the country has 25 million ha of agricultural
land (FAO, 2013)1 and 66% of the population is rural (WDI, 2012). In Bandundu, Equateur,
1 Agricultural area, this category is the sum of areas under:
a) Arable land - land under temporary agricultural crops, temporary meadows for mowing or pasture, land under market and
kitchen gardens and land temporarily fallow (less than five years). Data for “Arable land” are not meant to indicate the amount
of land that is potentially cultivable;
(b) permanent crops - land cultivated with long-term crops which do not have to be replanted for several years (such as
coffee); land under trees and shrubs producing flowers, such as roses and jasmine; and nurseries (except those for forest trees,
which should be classified under "forest");

Katanga, and Kasai Oriental, more than 80% of all households cultivated land on less than 2
ha. The share of household cultivating land of more than 2 ha is the highest in Province
orientale province 54%, followed by Maniema (40%) and Kasai Oriental (34%).
Table 2: Percent of households who cultivated in 2011-2012 by province
Cultivated Cultivated Cultivated
N in 2011-12 <=2ha >2ha
Bas-Congo 1565 79 78 1
Bandundu 2511 90 81 9
Equateur 2066 82 78 4
Province
orientale 1760 62 8 54
Nord-Kivu 2852 54 41 13
Maniema 2201 63 23 40
Sud-Kivu 4783 59 41 18
Katanga 2086 87 80 7
Kasai Oriental 2845 88 54 34
Kasai Occidental 2205 72 66 7
Total 24874 72 53 19
Source: CFSVA 2011-12
The way people access land may influence their use of it. Among interviewed rural
households who reported to cultivate during the agricultural season preceding the survey,
86% reported to have their own land, 11% rented land and the rest accessed land through
sharecropping. Land renting were most common in Bas-Congo, Province orientale and Nord-
Kivu. Interestingly, ownership of land does not appear to be reserved for the richer provinces
such as Katanga and Nord-Kivu. It is obvious that the widespread and persistent conflict and
violence in the highly productive zones in eastern Congo caused massive population
displacements that deprived several households of access to land.
(c) Permanent meadows and pastures - land used permanently (five years or more) to grow herbaceous forage crops, either
cultivated or growing wild (wild prairie or grazing land).

Figure 2: Percent of households who cultivated in 2011-2012 by land access and by province
Source: CFSVA 2011-12
Livestock and poultry: Most commonly owned types of livestock include goats, poultry, sheep
and cattle. The concept of Tropical Livestock Units (TLU) would provide a convenient method
for quantifying a wide range of different livestock types and sizes in a standardized manner if
information on different size of different species was collected. To account for different
livestock varieties - which may differ significantly in size, average number of animals per
household has been calculated. Poultry and goats are common in all rural provinces. Pastures
are one of the basis of the breeding of small ruminants, which have sometimes replaced cattle
in areas where conflicts have significantly reduced the breeding of large ruminants. Thus,
goats have become an important source of income for small farmers. Highest number of pig is
found in Maniema and Equateur province. Poultry is raised mostly in Maniema, followed by
Kasai Oriental, Equateur and Katanga. Cattle ownership is most common in Province orientale
and Sud-Kivu.
0
10
20
30
40
50
60
70
80
90
100
Pe
rce
nt
of
ho
use
ho
lds
Sharecrop
Rent
Own
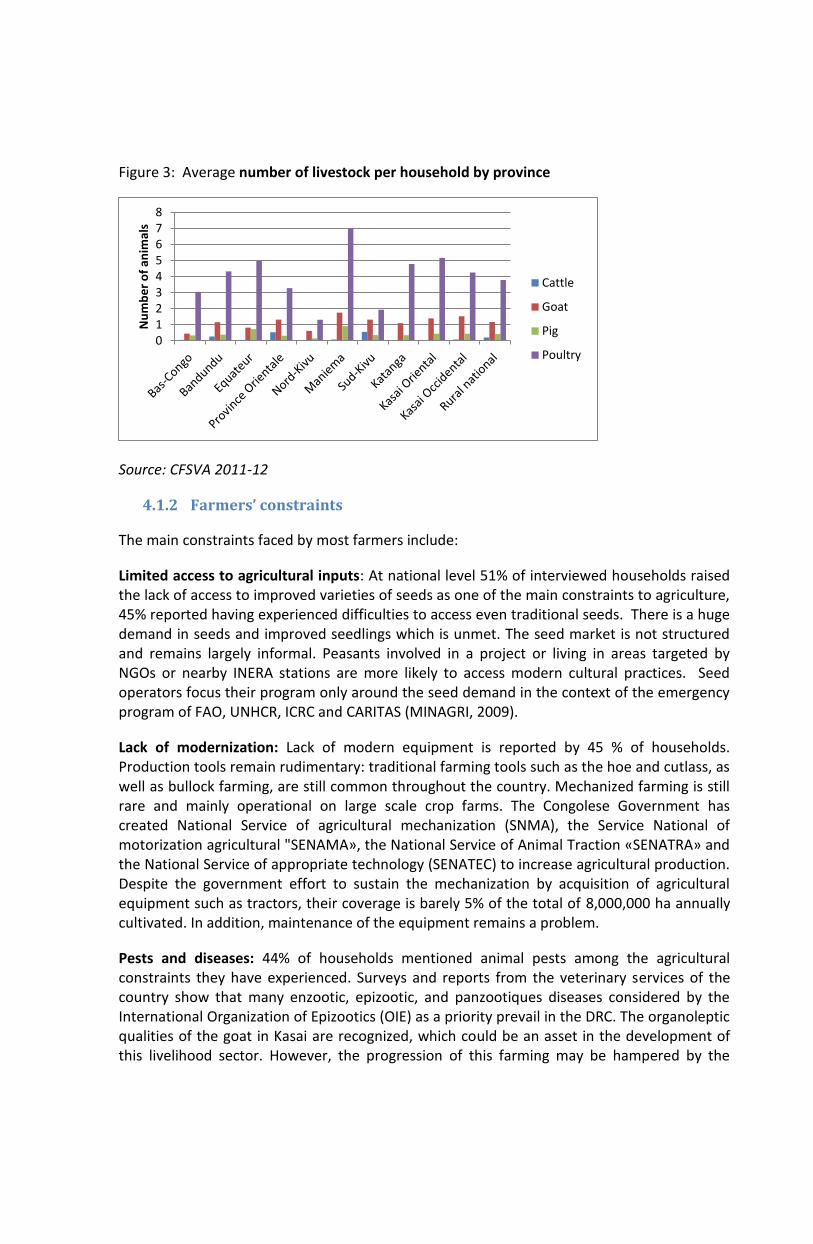
Figure 3: Average number of livestock per household by province
Source: CFSVA 2011-12
4.1.2 Farmers’ constraints
The main constraints faced by most farmers include:
Limited access to agricultural inputs: At national level 51% of interviewed households raised the lack of access to improved varieties of seeds as one of the main constraints to agriculture, 45% reported having experienced difficulties to access even traditional seeds. There is a huge demand in seeds and improved seedlings which is unmet. The seed market is not structured and remains largely informal. Peasants involved in a project or living in areas targeted by NGOs or nearby INERA stations are more likely to access modern cultural practices. Seed operators focus their program only around the seed demand in the context of the emergency program of FAO, UNHCR, ICRC and CARITAS (MINAGRI, 2009).
Lack of modernization: Lack of modern equipment is reported by 45 % of households. Production tools remain rudimentary: traditional farming tools such as the hoe and cutlass, as well as bullock farming, are still common throughout the country. Mechanized farming is still rare and mainly operational on large scale crop farms. The Congolese Government has created National Service of agricultural mechanization (SNMA), the Service National of motorization agricultural "SENAMA», the National Service of Animal Traction «SENATRA» and the National Service of appropriate technology (SENATEC) to increase agricultural production. Despite the government effort to sustain the mechanization by acquisition of agricultural equipment such as tractors, their coverage is barely 5% of the total of 8,000,000 ha annually cultivated. In addition, maintenance of the equipment remains a problem.
Pests and diseases: 44% of households mentioned animal pests among the agricultural constraints they have experienced. Surveys and reports from the veterinary services of the country show that many enzootic, epizootic, and panzootiques diseases considered by the International Organization of Epizootics (OIE) as a priority prevail in the DRC. The organoleptic qualities of the goat in Kasai are recognized, which could be an asset in the development of this livelihood sector. However, the progression of this farming may be hampered by the
012345678
Nu
mb
er
of
anim
als
Cattle
Goat
Pig
Poultry
threat of peste des petits ruminants (PPR); therefore veterinary supervision support to accompany its development is important.
The last time rinderpest was seen in the DRC was in1952. However, the various conflicts that the country experiences since 1996 expose it to various animal diseases (contagious pleuropneumonia of cattle, foot and mouth disease, Rift Valley fever), as a result of cross-border movements of people fleeing the war with their livestock (MINAGRI 2009)
Soil quality was another constraint reported by 24% of household. Mineral fertilization is rarely used, even if it is recommended depending on the nature of the soil. The issue on chemical fertilizers was studied for more than a decade in the 1980s by the Programme National Engrais (PNE) supported by FAO and the SENAFIC. For most cultures, a good response to fertilizer applications has been found. However the cost of chemical fertilizers remains a constraint as their import to the country as well as their delivery to users are very expensive. On the other hand, the private sector has little or no interested in this activity as the market is too narrow and too unstable (MINAGRI, 2009)
Lack of rain and irrigation: 24% of households indicated that they have experienced limited
irrigation and rainwater for cultivation. The estimated irrigation potential varies from 4 to 7
million hectares, including small lowland perimeters. Despite this very important potential,
irrigated perimeters did not exceed 13 500 ha. The DRC is perfectly suited to rice cultivation,
either rainfed (Maniema), irrigated (Ruzizi valley), or lowland (all provinces). Irrigation
systems on a small scale with a major participation of producers are proven to be highly
efficient (MINAGRI 2009). Moreover, irrigated horticulture and rice have high productive and
remunerative potential (e.g. on the sites of Pool Malebo - wide flood zone by seasonal and
flooding between Kinshasa and the Congo River with a potential of 6 000 ha).
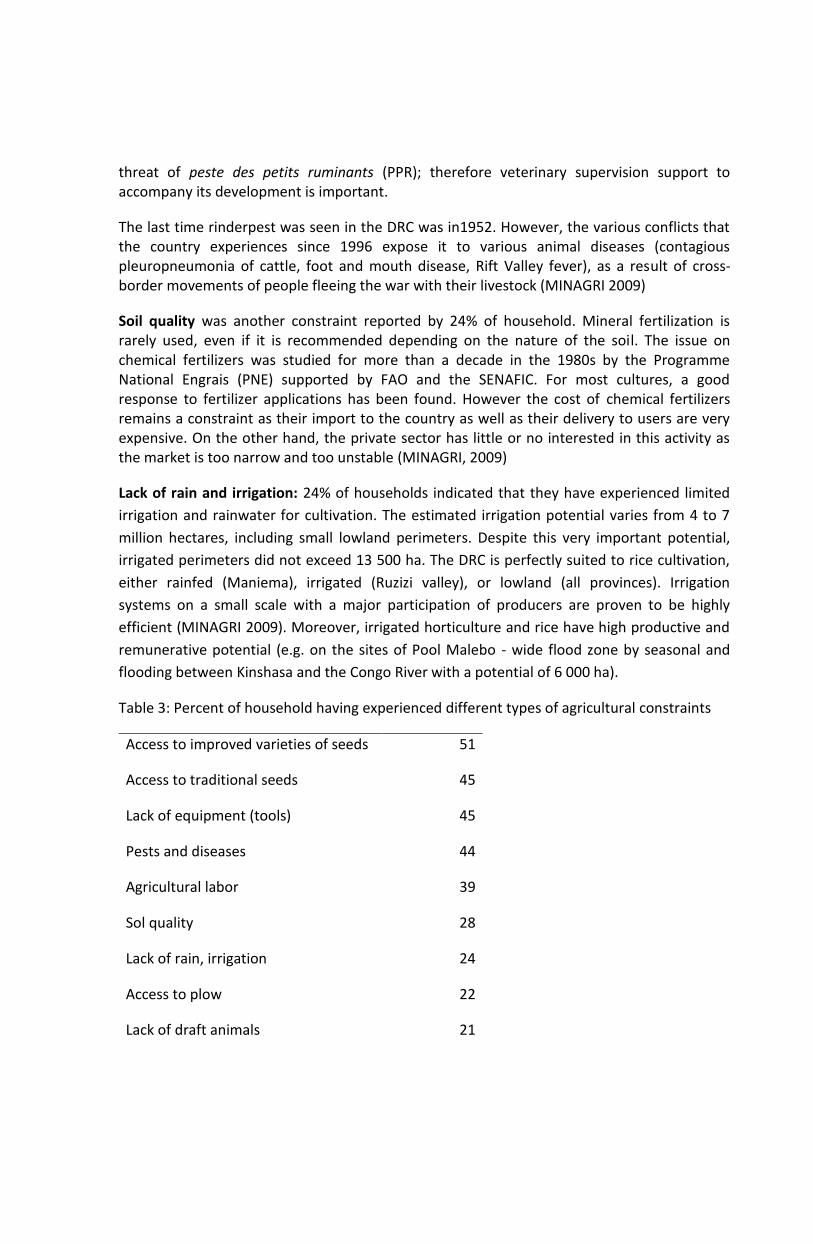
Table 3: Percent of household having experienced different types of agricultural constraints
Access to improved varieties of seeds 51
Access to traditional seeds 45
Lack of equipment (tools) 45
Pests and diseases 44
Agricultural labor 39
Sol quality 28
Lack of rain, irrigation 24
Access to plow 22
Lack of draft animals 21
Access to land 20
Insecurity 15
Flood 5
Source: CFSVA 2011-12
Limited access to land: It is paradoxal that 20% of households in a country with great
potentially cultivable land reported that they experienced difficulties to access land. For
example, the high demographic pressure in some parts of the Province oriental province (in
particular in Ituri) is responsible for the continuous parceling out of cultivated surface areas
and strong ethnic polarizations that do not foster expansion over spaces yet available but
unexploited (WFP, 2012). Unclear land tenure system might be also one reason for this claim.
Both the formal and customary systems of land dispute resolution in the DRC are facing
significant challenges to their effectiveness, especially in protecting the rights of populations
who now live in forest and agricultural areas subject to REDD/REDD+ considerations and of
those populations that have been displaced through conflict and continuing violence (USAID,
2010).
Security: The other constraint that was mentioned by 15% of the household is insecurity. This
security question to the households was broad and does not precise which security related
constraints they are.
4.2 Human Capital
Discussed in this chapter are descriptive summaries of the social, economic, and households’ demographic characteristics. One focus of this chapter is to describe the general characteristics of the population, such as household arrangements (size, headship), age-sex structure, residency status, literacy and education, and housing facilities (sources of water supply, sanitation facilities, dwelling characteristics and household possessions). A distinction is made between provinces because many of these indicators differ by province. These indicators influence and determine the amount and quality of work and income available to the individual and household, which in turn influence their overall welfare and food security status.
The size and composition of households and the sex of the household head are important factors affecting their welfare. The Table 4 below presents summary statistics on the average household size and the sex and age of the head of household. In DRC, the mean household size is 6.8 persons, with households in Maniema being the largest (9.8 persons) while households in Bandundu are the smallest (5.5 persons).
Seventeen percent of households are headed by a person 60 years or older. Elderly headed households were most commonly found in Katanga province.

Twenty two percent of households are headed by females. The highest percentage of female
headed households was found in Sud-Kivu (33%), followed by the Province orientale (30%),
Bas-Congo and Bandundu (27% respectively). The other provinces have a percentage of
female-headed household below the national average.
Table 4: Household characteristics by province
Province Average HH size Elderly HH
head (%)
Female HH
head (%)
N
Bas-Congo 5.5 18.7 27.0 1,565
Bandundu 5.4 16.7 27.0 2,511
Equateur 8.1 15.0 7.6 2,066
Province orientale 6.0 16.7 30.0 1,768
Nord-Kivu 6.4 15.3 28.2 2,852
Maniema 9.8 17.3 14.1 2,201
Sud-Kivu 7.0 17.2 33.4 4,783
Katanga 6.6 23.2 17.0 2,086
Kasai Oriental 6.6 16.2 13.3 2,846
Kasai Occidental 6.6 13.7 12.1 2,206
Rural national 6.8 16.9 22.1 24,884
Source: CFSVA 2011-12
The dependency ratio is an age-population ratio of those typically not in the labor force (the dependent part) and those typically in the labor force (the productive part). It is used to measure the pressure on productive population. Provinces were split in two based on available data on age group. Table 5 shows that the dependency at the national level is 1.2 for the first group of provinces where the number of the population of 13-60 years old is available. This ratio is 1.5 for the group of provinces where active population is defined as those between 13 and 65 years old.

Table 5: Dependency ratio (%)
Province (1) (2)
Bas-Congo 1.1 Bandundu 1.1 Equateur 1.3 Province orientale 1.8 Nord-Kivu 1.2 Maniema 1.2 Sud-Kivu 1.2 Katanga 1.4
Kasai Oriental 1.4 Kasai Occidental 1.4 Rural national 1.2 1.5 (1) dependents/ active population 13-60 years old (2) dependents/ active population 13-65 years old
Age and sex are important variables in analyzing demographic structure. Figure 4 presents the
distribution of the household population in the survey by five year age groups below the age
of 19, one group for 9 to 60 years old and another group for 61 years old and above according
to sex of household members. While the results from the first group of provinces indicate that
47 % of the population is under 13 years and 4% percent of the population is in the older
groups (61 years and above), the proportion of the population between 13 and 18 years of
age is 16%, and between 19 and 60 years of age is 33%. The age structure is typical of a young
population characterized by high fertility. This type of population structure imposes a heavy
burden on the country social and economic assets.
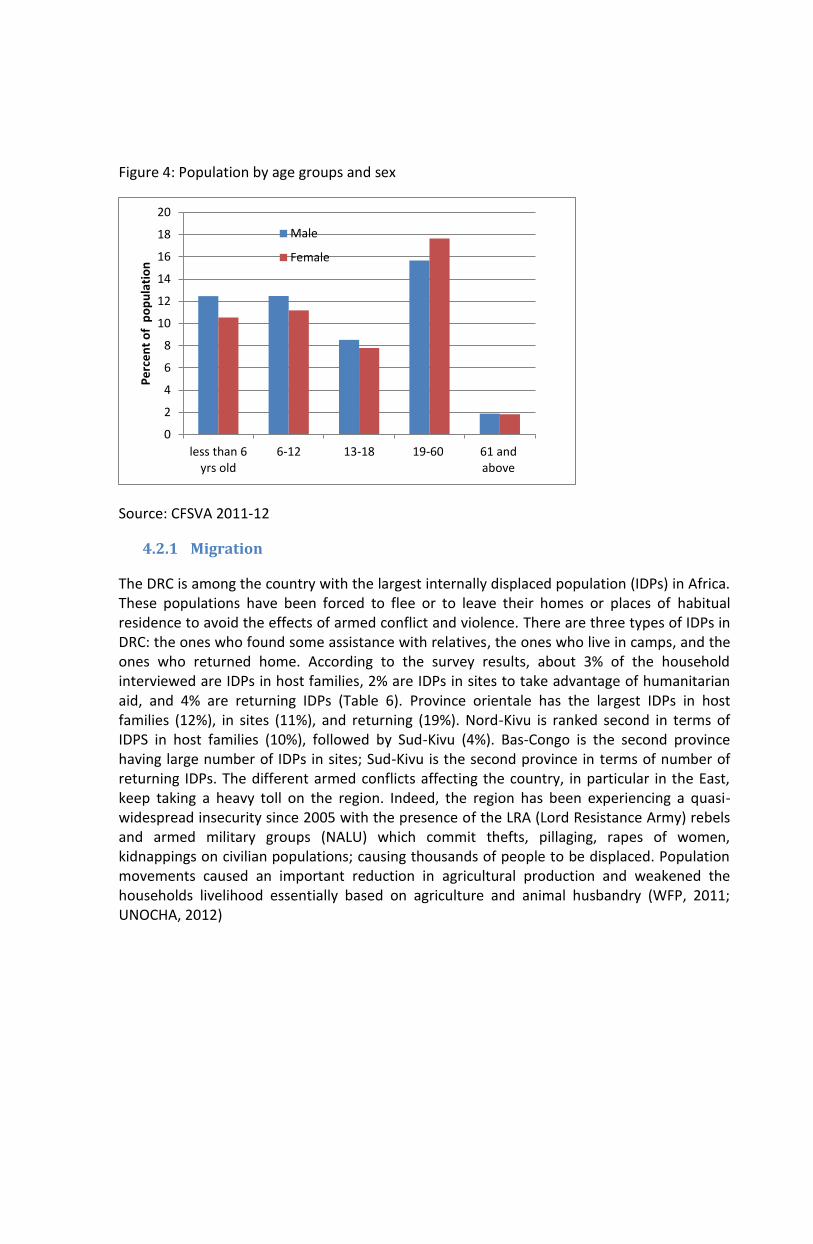
Figure 4: Population by age groups and sex
Source: CFSVA 2011-12
4.2.1 Migration
The DRC is among the country with the largest internally displaced population (IDPs) in Africa. These populations have been forced to flee or to leave their homes or places of habitual residence to avoid the effects of armed conflict and violence. There are three types of IDPs in DRC: the ones who found some assistance with relatives, the ones who live in camps, and the ones who returned home. According to the survey results, about 3% of the household interviewed are IDPs in host families, 2% are IDPs in sites to take advantage of humanitarian aid, and 4% are returning IDPs (Table 6). Province orientale has the largest IDPs in host families (12%), in sites (11%), and returning (19%). Nord-Kivu is ranked second in terms of IDPS in host families (10%), followed by Sud-Kivu (4%). Bas-Congo is the second province having large number of IDPs in sites; Sud-Kivu is the second province in terms of number of returning IDPs. The different armed conflicts affecting the country, in particular in the East, keep taking a heavy toll on the region. Indeed, the region has been experiencing a quasi-widespread insecurity since 2005 with the presence of the LRA (Lord Resistance Army) rebels and armed military groups (NALU) which commit thefts, pillaging, rapes of women, kidnappings on civilian populations; causing thousands of people to be displaced. Population movements caused an important reduction in agricultural production and weakened the households livelihood essentially based on agriculture and animal husbandry (WFP, 2011; UNOCHA, 2012)
0
2
4
6
8
10
12
14
16
18
20
less than 6yrs old
6-12 13-18 19-60 61 andabove
Pe
rce
nt
of
po
pu
lati
on
Male
Female

Table 6: Percent of household by residency status and by province
Provinces
IDPs in
host
families
IDPs
in
sites
Returning
IDPs Resident Refugee Repatriate Deported Other
Bas-Congo 0.8 3.6 2.1 93.4 0.2
Bandundu 0.4 0.6 3.0 95.9 0.1 0.0
Equateur 0.3 0.1 3.2 96.2 0.1 0.2
Province orientale 11.5 11.2 19.7 57.0 0.6
Nord-Kivu 10.0 1.6 2.0 85.6 0.1 0.1 0.6
Maniema 2.1 1.5 1.1 93.6 0.1 0.3 1.4
Sud-Kivu 3.6 2.6 4.2 86.5 1.9 0.2 0.2 0.9
Katanga 0.1 0.6 1.2 97.8 0.3
Kasai Oriental 1.5 0.9 2.5 95.0 0.1
Kasai Occidental 0.1 0.6 4.3 94.8 0.1 0.1
Rural national 3.2 2.1 4.0 89.8 0.5 0.1 0.1 0.4
Source: CFSVA 2011-12
Table 7: Percent of household that hosted displaced / returnee over the last 12 months
Provinces
Bas-Congo 6
Bandundu 10
Equateur 3
Province orientale 21
Nord-Kivu 27
Maniema 10
Sud-Kivu 25
Katanga 7

Kasai Oriental 17
Kasai Occidental 9
Rural national 15
Source: CFSVA 2011-12
4.2.2 Education
Education is important in ensuring the general well-being of a population and in strengthening people's resilience to shocks that could have damaging effects on their livelihoods. Research has proven that a good educational status among all, both men and women, results in significant decrease in their vulnerability to food insecurity. The CFSVA 2008 found that the higher the educational level of the household head, the better the family's food consumption.
Primary School Attendance Ratio (6 – 12 years)
In this report, attendance rates is considered as a proxy for formal enrolment. In the analysis, specific attention was given to the disaggregation of attendance rates by the sex of the child and provinces. At national level the percent of primary school attendance of children between six to twelve years is 87% for boys and 82% for girls. Lowest attendance rates were found in Province orientale for both boys and girls (71% and 68% respectively).
Significant gender difference was also found with regards to primary school age children who never attended school. Twelve (12%) of girls were not attending any school at all compared to only 4% for boys. Similarly, at the provincial level, the highest rate of children never attending school was in Kasai Oriental (18%) followed by Katanga (16%) for girls and in Nord-Kivu (10%) followed by Sud-Kivu for boys.
Asking about the reasons for children missing school for one month, inability of parents to fund the child's education was the main reason for more than half of households. The child’s sickness is the second reason (20% of households for boys and 17% for girls). The same reasons are reported for children not attending any school at all.

Table 8: School attendance of children of 6-12 years old by province
Male Female
Province
Go to
school
Never go
to school
Miss
school for
4 weeks in
2010-
2012
Go to
school
Never
go to
school
Miss
school for
4 weeks
in 2010-
2012
Bas-Congo 96 2 9 88 6 1
Bandundu 95 2 5 89 4 2
Equateur 90 3 9 84 9 4
Province orientale 71 4 13 68 12 4
Nord-Kivu 78 10 12 77 10 11
Maniema 90 4 11 86 10 4
Sud-Kivu 89 5 15 83 13 7
Katanga 82 2 17 71 16 2
Kasai Oriental 85 3 15 78 18 5
Kasai Occidental 96 3 11 92 11 3
Rural national 87 4 12 82 12 5
Source: CFSVA 2011-12
Education of household heads
The CFSVA 2011-2012 collected information on whether the household head can write and/ or read or not. At national level, 31% of household head do not read/write. Highest illiteracy rate was found in Bandundu (43%) followed by Province orientale and Sud-Kivu (36%). The gender difference in literacy of household head is striking: women head of household are more likely to be illiterate (53%) than men (25%).
Regarding the highest educational level attained by the household head, at national level 32% had no schooling at all, 28% of household heads have completed primary school, 37% completed secondary school, and 3% had a higher degree beyond secondary school. Similar to literacy, there is also a marked difference in household head educational attainment by province; in Bandundu 44% of household heads never attended school at all, followed by Province orientale (38%), Sud-Kivu and Katanga (35%) compared to 24% of uneducated household heads residing in Bas-Congo.
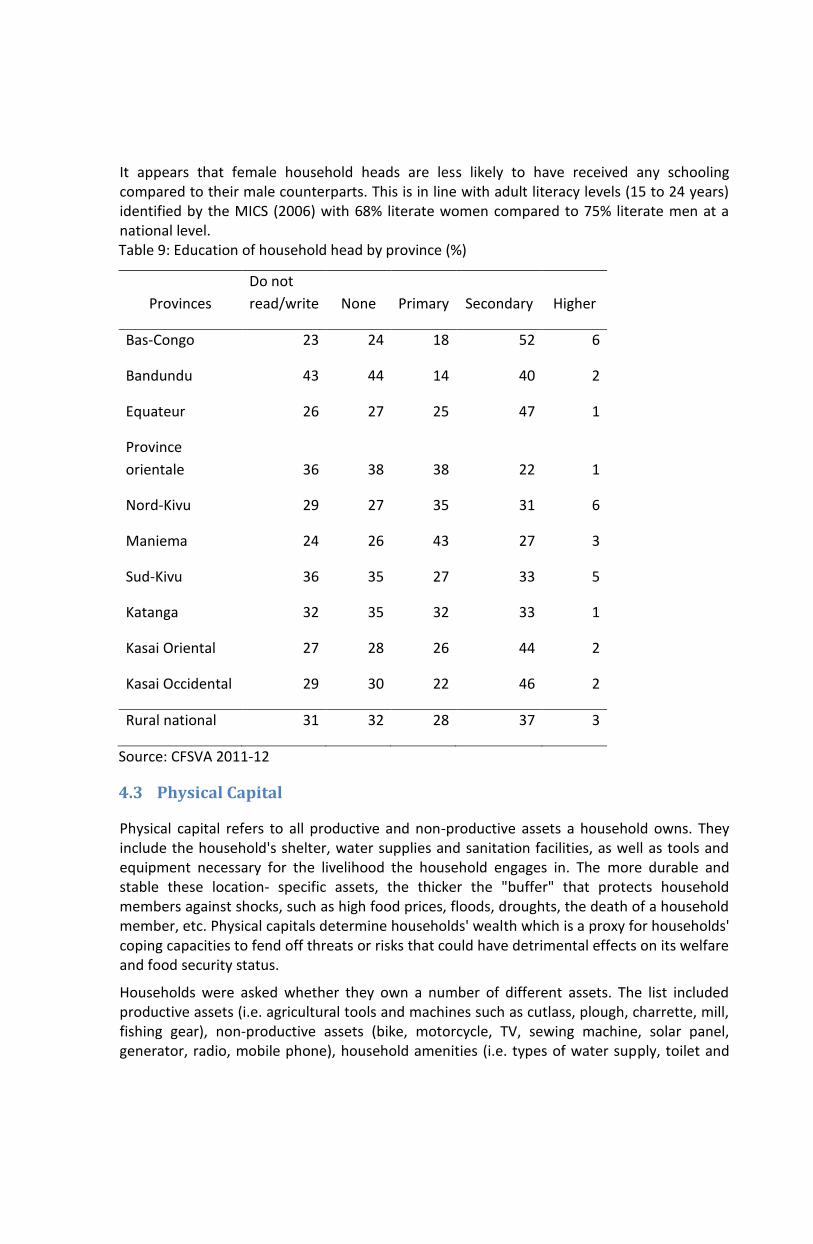
It appears that female household heads are less likely to have received any schooling compared to their male counterparts. This is in line with adult literacy levels (15 to 24 years) identified by the MICS (2006) with 68% literate women compared to 75% literate men at a national level. Table 9: Education of household head by province (%)
Provinces
Do not
read/write None Primary Secondary Higher
Bas-Congo 23 24 18 52 6
Bandundu 43 44 14 40 2
Equateur 26 27 25 47 1
Province
orientale 36 38 38 22 1
Nord-Kivu 29 27 35 31 6
Maniema 24 26 43 27 3
Sud-Kivu 36 35 27 33 5
Katanga 32 35 32 33 1
Kasai Oriental 27 28 26 44 2
Kasai Occidental 29 30 22 46 2
Rural national 31 32 28 37 3
Source: CFSVA 2011-12
4.3 Physical Capital
Physical capital refers to all productive and non-productive assets a household owns. They include the household's shelter, water supplies and sanitation facilities, as well as tools and equipment necessary for the livelihood the household engages in. The more durable and stable these location- specific assets, the thicker the "buffer" that protects household members against shocks, such as high food prices, floods, droughts, the death of a household member, etc. Physical capitals determine households' wealth which is a proxy for households' coping capacities to fend off threats or risks that could have detrimental effects on its welfare and food security status.
Households were asked whether they own a number of different assets. The list included productive assets (i.e. agricultural tools and machines such as cutlass, plough, charrette, mill, fishing gear), non-productive assets (bike, motorcycle, TV, sewing machine, solar panel, generator, radio, mobile phone), household amenities (i.e. types of water supply, toilet and

sanitation facilities, roofing material, etc.) and other assets such as the number of rooms available to the household, land and livestock ownership, etc.
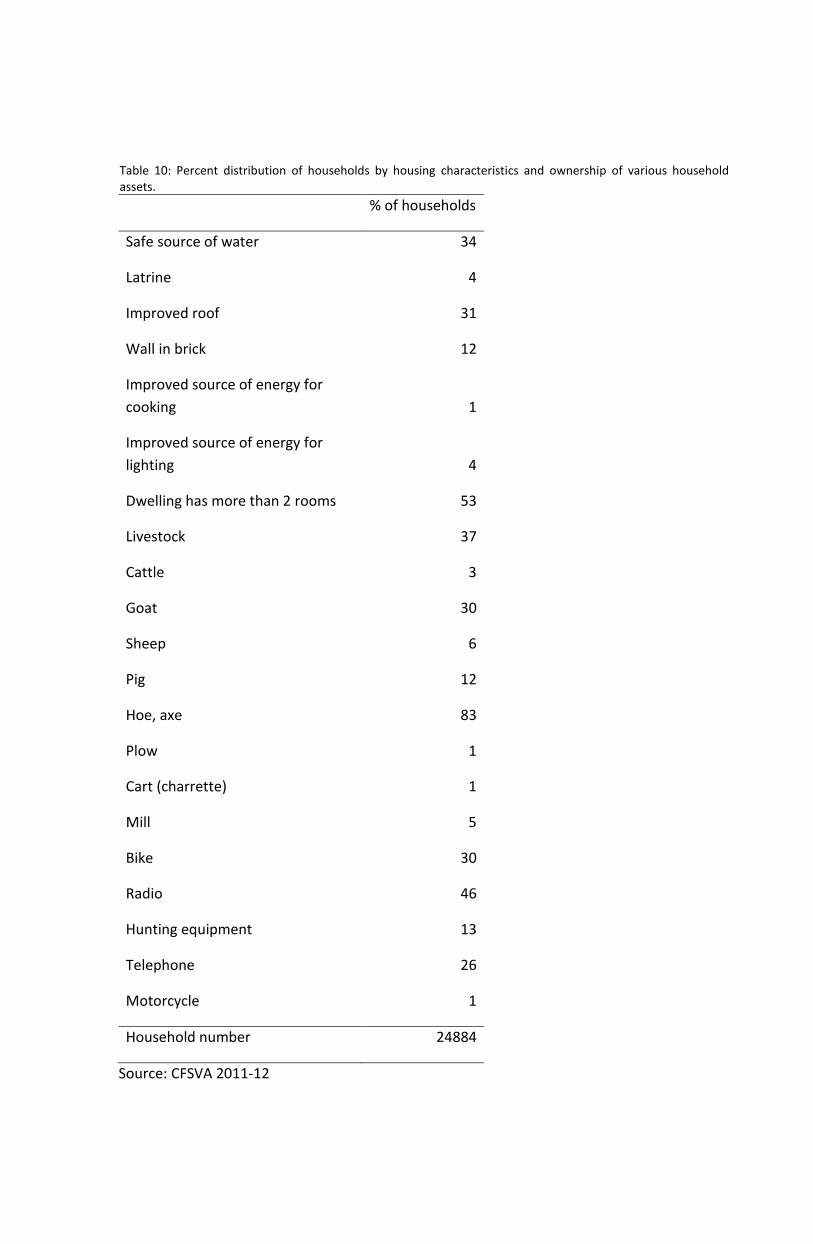
Table 10: Percent distribution of households by housing characteristics and ownership of various household assets.
% of households
Safe source of water 34
Latrine 4
Improved roof 31
Wall in brick 12
Improved source of energy for
cooking 1
Improved source of energy for
lighting 4
Dwelling has more than 2 rooms 53
Livestock 37
Cattle 3
Goat 30
Sheep 6
Pig 12
Hoe, axe 83
Plow 1
Cart (charrette) 1
Mill 5
Bike 30
Radio 46
Hunting equipment 13
Telephone 26
Motorcycle 1
Household number 24884
Source: CFSVA 2011-12

The most common non-productive assets owned by the surveyed households included radio (46%), bike (30%), and mobile phone (26%). Cutlass is the only common productive assets owned (83%).
4.3.1 Household wealth index
A composite index - the wealth index - is a proxy indicator for household wealth that complements income and expenditure information. The wealth index is based on information on ownership of certain assets and housing conditions collected during the CFSVA2011-20122. A series of iterations of the wealth index was run until an appropriate model was found. The variables used in the final model are ownership of mobile phone, safe drinking water, improved roof material, and improved wall material3. The graphs below illustrate the relationship between the factors in the model and the created wealth terciles.
2 The method used involves Principal Component Analysis (PCA) of variables relating to ownership of assets and
housing conditions. The PCA method is a form of data reduction which attempts to describe the underlying relationship between a series of variables. The PCA creates a continuous variable which explains the underlying relationship and can be used as a proxy for household wealth. As the continuous variable alone is not easily interpreted, it is used to rank households and divide them into terciles which are more easily describable. These wealth terciles allow for descriptive analysis of relative poverty. Poor (mean=-0.85, median=-0.85); Middle (mean=-0.06, median=-0.04); Wealthy (mean=1.30, median=1.08)
3 The selection of variables was based on a low level of both under- and over-correlation between variables and
a sufficient proportion of households with presence of the attribute (> 5 % of households and <95%). For example, improved sanitation facilities and improved source of energy for lighting are used by only 4% of household and excluded from the index. Livelihood specific assets were not included nor were variables showing small variance across the wealth quintiles, for example ownership of radio which was found to be common over
all wealth terciles.
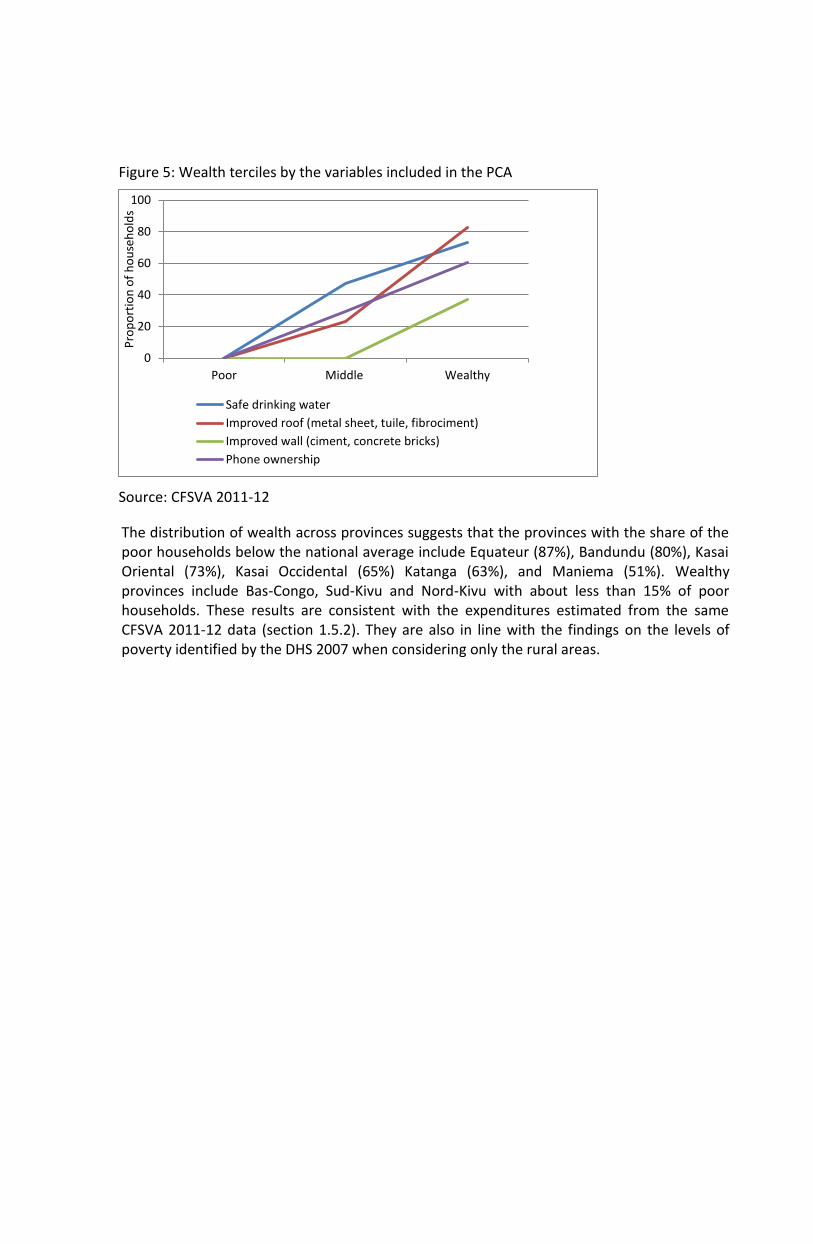
Figure 5: Wealth terciles by the variables included in the PCA
Source: CFSVA 2011-12
The distribution of wealth across provinces suggests that the provinces with the share of the poor households below the national average include Equateur (87%), Bandundu (80%), Kasai Oriental (73%), Kasai Occidental (65%) Katanga (63%), and Maniema (51%). Wealthy provinces include Bas-Congo, Sud-Kivu and Nord-Kivu with about less than 15% of poor households. These results are consistent with the expenditures estimated from the same CFSVA 2011-12 data (section 1.5.2). They are also in line with the findings on the levels of poverty identified by the DHS 2007 when considering only the rural areas.
0
20
40
60
80
100
Poor Middle Wealthy
Pro
po
rtio
n o
f h
ou
seh
old
s
Safe drinking water
Improved roof (metal sheet, tuile, fibrociment)
Improved wall (ciment, concrete bricks)
Phone ownership
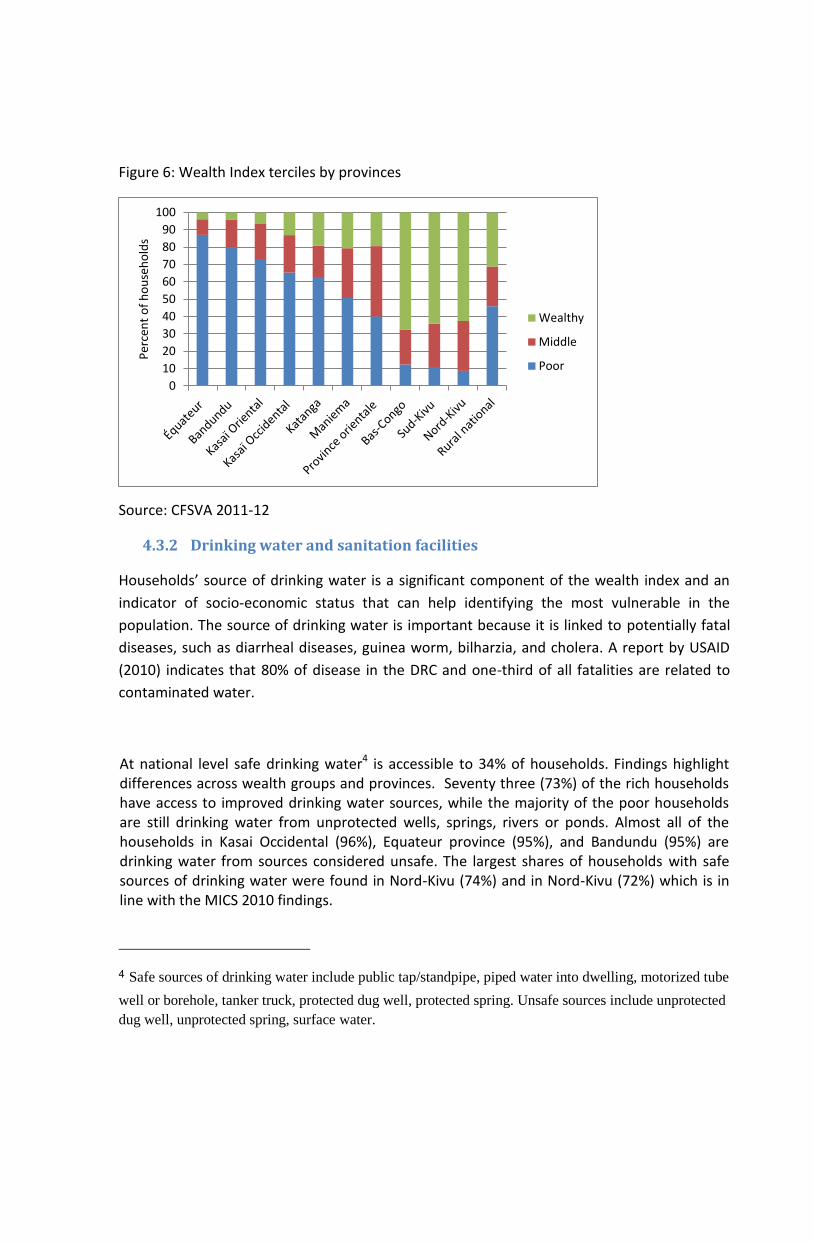
Figure 6: Wealth Index terciles by provinces
Source: CFSVA 2011-12
4.3.2 Drinking water and sanitation facilities
Households’ source of drinking water is a significant component of the wealth index and an
indicator of socio-economic status that can help identifying the most vulnerable in the
population. The source of drinking water is important because it is linked to potentially fatal
diseases, such as diarrheal diseases, guinea worm, bilharzia, and cholera. A report by USAID
(2010) indicates that 80% of disease in the DRC and one-third of all fatalities are related to
contaminated water.
At national level safe drinking water4 is accessible to 34% of households. Findings highlight differences across wealth groups and provinces. Seventy three (73%) of the rich households have access to improved drinking water sources, while the majority of the poor households are still drinking water from unprotected wells, springs, rivers or ponds. Almost all of the households in Kasai Occidental (96%), Equateur province (95%), and Bandundu (95%) are drinking water from sources considered unsafe. The largest shares of households with safe sources of drinking water were found in Nord-Kivu (74%) and in Nord-Kivu (72%) which is in line with the MICS 2010 findings.
4 Safe sources of drinking water include public tap/standpipe, piped water into dwelling, motorized tube
well or borehole, tanker truck, protected dug well, protected spring. Unsafe sources include unprotected
dug well, unprotected spring, surface water.
0
10
20
30
40
50
60
70
80
90
100
Per
cen
t o
f h
ou
seh
old
s
Wealthy
Middle
Poor
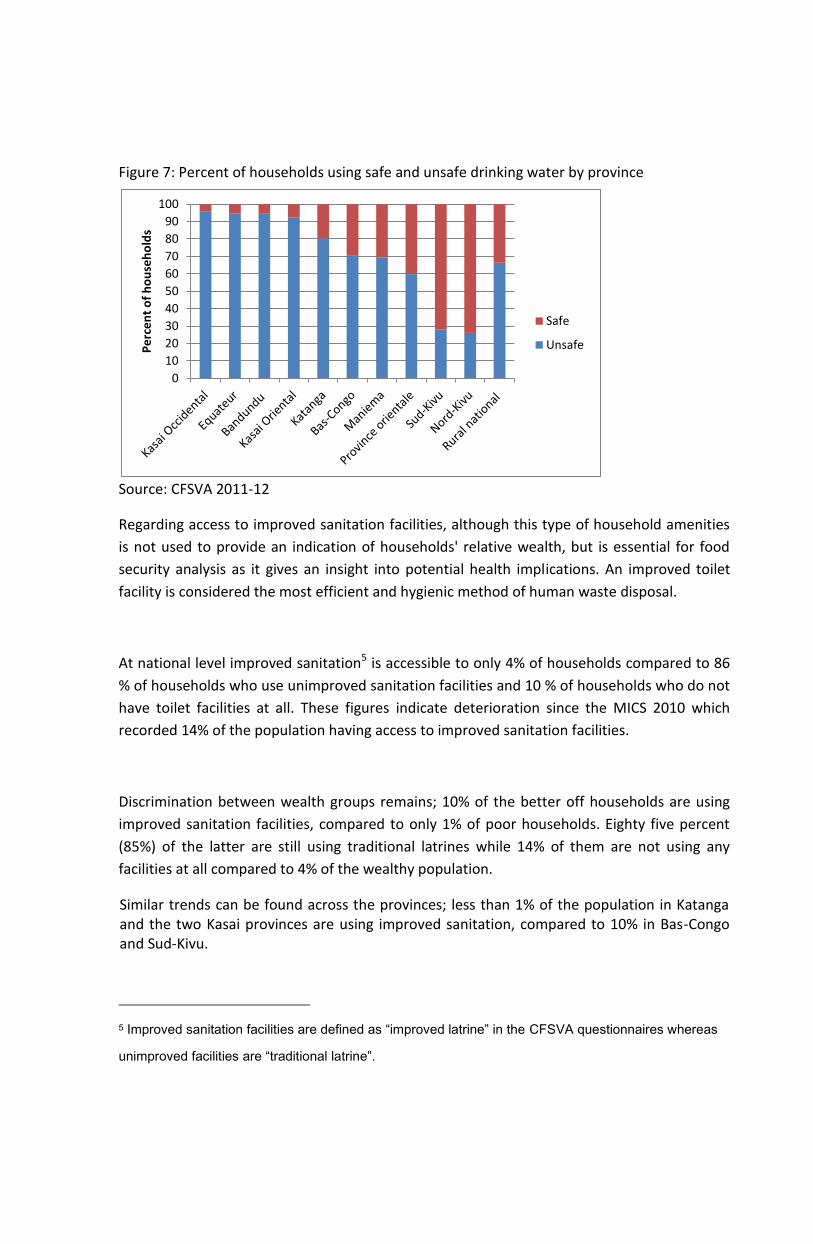
Figure 7: Percent of households using safe and unsafe drinking water by province
Source: CFSVA 2011-12
Regarding access to improved sanitation facilities, although this type of household amenities
is not used to provide an indication of households' relative wealth, but is essential for food
security analysis as it gives an insight into potential health implications. An improved toilet
facility is considered the most efficient and hygienic method of human waste disposal.
At national level improved sanitation5 is accessible to only 4% of households compared to 86
% of households who use unimproved sanitation facilities and 10 % of households who do not
have toilet facilities at all. These figures indicate deterioration since the MICS 2010 which
recorded 14% of the population having access to improved sanitation facilities.
Discrimination between wealth groups remains; 10% of the better off households are using
improved sanitation facilities, compared to only 1% of poor households. Eighty five percent
(85%) of the latter are still using traditional latrines while 14% of them are not using any
facilities at all compared to 4% of the wealthy population.
Similar trends can be found across the provinces; less than 1% of the population in Katanga and the two Kasai provinces are using improved sanitation, compared to 10% in Bas-Congo and Sud-Kivu.
5 Improved sanitation facilities are defined as “improved latrine” in the CFSVA questionnaires whereas
unimproved facilities are “traditional latrine”.
0
10
20
30
40
50
60
70
80
90
100
Pe
rce
nt
of
ho
use
ho
lds
Safe
Unsafe
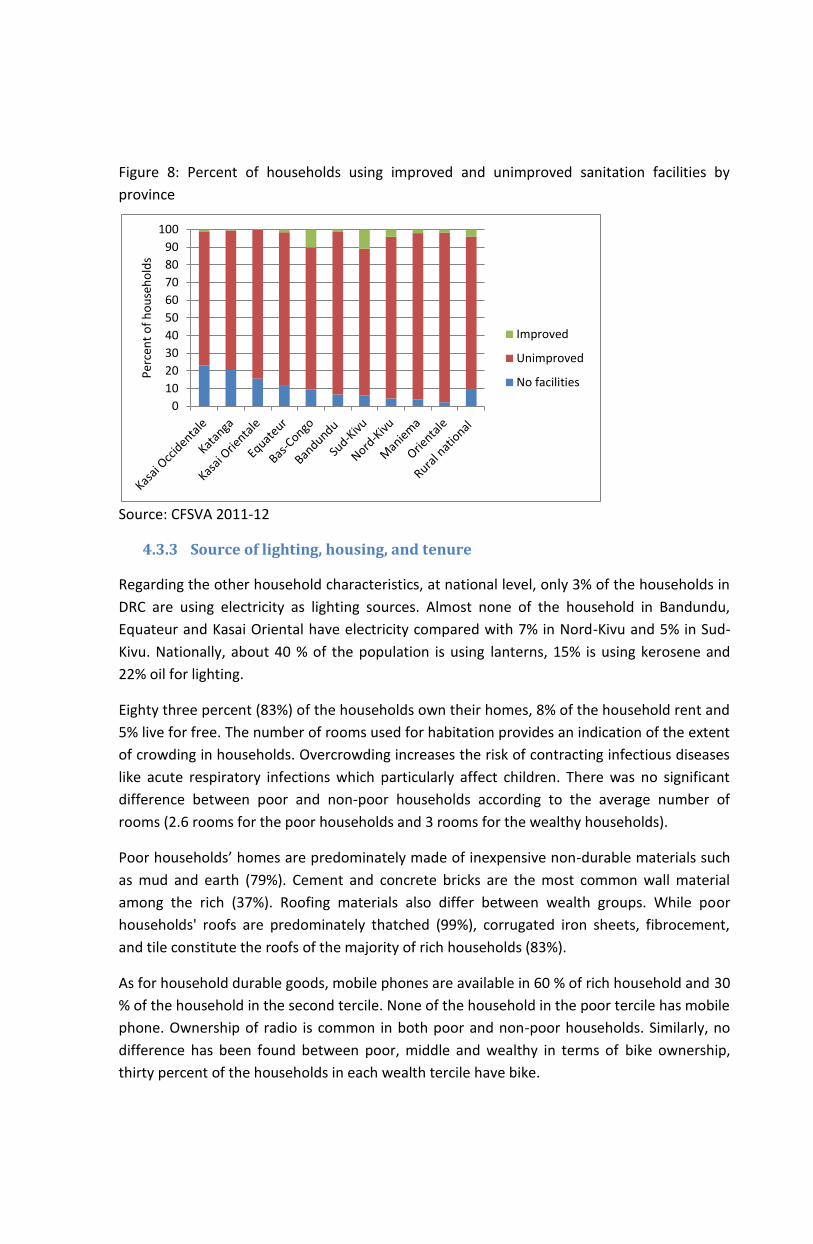
Figure 8: Percent of households using improved and unimproved sanitation facilities by
province
Source: CFSVA 2011-12
4.3.3 Source of lighting, housing, and tenure
Regarding the other household characteristics, at national level, only 3% of the households in
DRC are using electricity as lighting sources. Almost none of the household in Bandundu,
Equateur and Kasai Oriental have electricity compared with 7% in Nord-Kivu and 5% in Sud-
Kivu. Nationally, about 40 % of the population is using lanterns, 15% is using kerosene and
22% oil for lighting.
Eighty three percent (83%) of the households own their homes, 8% of the household rent and
5% live for free. The number of rooms used for habitation provides an indication of the extent
of crowding in households. Overcrowding increases the risk of contracting infectious diseases
like acute respiratory infections which particularly affect children. There was no significant
difference between poor and non-poor households according to the average number of
rooms (2.6 rooms for the poor households and 3 rooms for the wealthy households).
Poor households’ homes are predominately made of inexpensive non-durable materials such
as mud and earth (79%). Cement and concrete bricks are the most common wall material
among the rich (37%). Roofing materials also differ between wealth groups. While poor
households' roofs are predominately thatched (99%), corrugated iron sheets, fibrocement,
and tile constitute the roofs of the majority of rich households (83%).
As for household durable goods, mobile phones are available in 60 % of rich household and 30
% of the household in the second tercile. None of the household in the poor tercile has mobile
phone. Ownership of radio is common in both poor and non-poor households. Similarly, no
difference has been found between poor, middle and wealthy in terms of bike ownership,
thirty percent of the households in each wealth tercile have bike.
0
10
20
30
40
50
60
70
80
90
100
Per
cen
t o
f h
ou
seh
old
s
Improved
Unimproved
No facilities

4.4 Economic Capital
Economic capital includes a household's financial flows, such as income and expenses and access to credit which are used to maintain, strengthen or change livelihood strategies.
4.4.1 Household participation in markets
Knowing where households get the food they consume provides an insight into the level of stability, reliability and sustainability of the access to their food.
Households were asked to indicate the main source for each food item they consumed over the last seven days. Options included own production, purchase from market, gathering and hunting and fishing, in-kind payment of labor, borrowing, gift, or food aid. At national level, 51% of households food consumption6 was purchased, 42% came from their own production, 3% from fishing, hunting, and gathering and the remaining 5% was borrowed, received as gifts or food aid.
Figure 9: Contribution of different sources of food at national level
Source: CFSVA 2011-12
The results suggest that high reliance on own food production is positively related to high poverty. More than half (52%) of the food consumed by the poor household came from their own production compared with 39% and 30% for the household in the second and third terciles respectively. Market purchases is the second most important food source of the poor household (40%) followed by fishing, hunting, and gathering (4%). The contribution of food
6 Evaluated in terms of food consumption scores which was built as composite scores
measuring food frequency and dietary diversity
Own production
41.7%
Market 50.9%
Fishing, hunting & gathering
2.9%
Inkind payment 0.4%
Borrowing 0.2%
Gifts 2.9% Food aid
1.0%
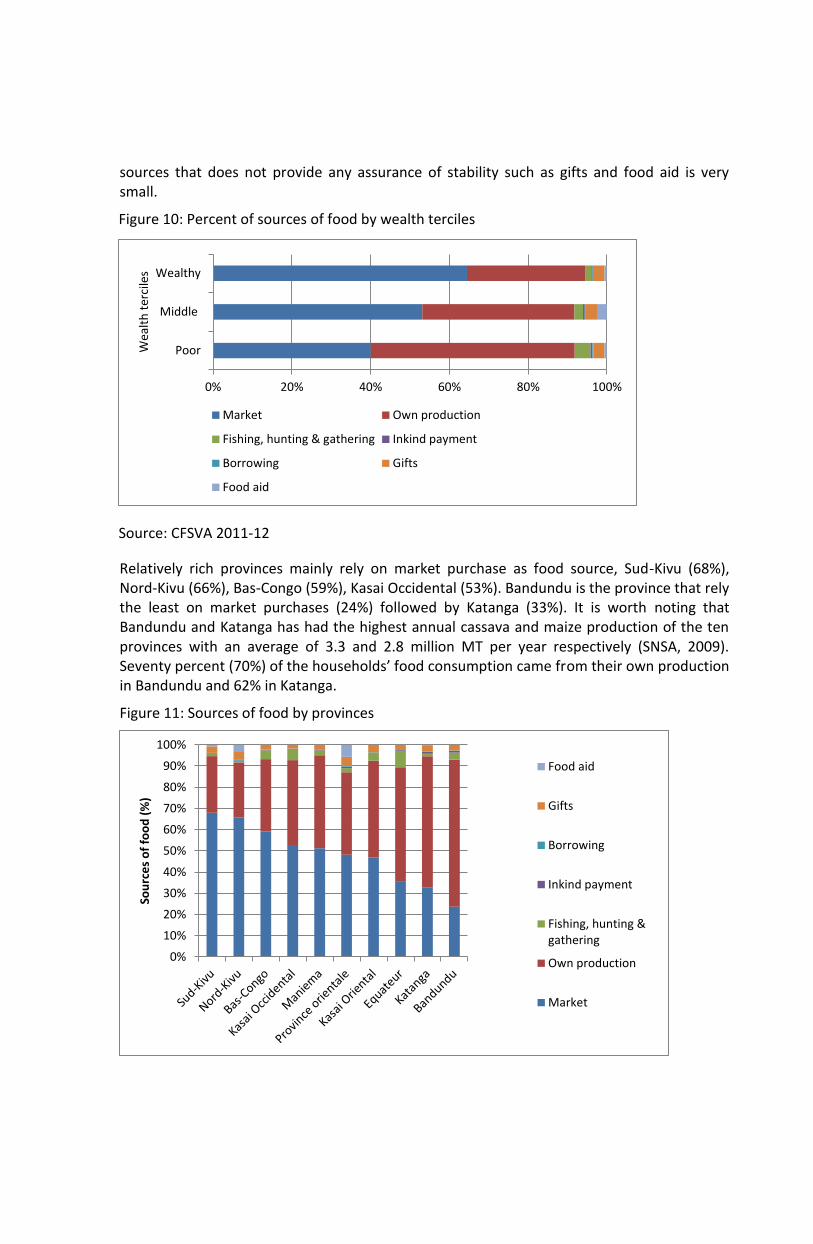
sources that does not provide any assurance of stability such as gifts and food aid is very small.
Figure 10: Percent of sources of food by wealth terciles
Source: CFSVA 2011-12
Relatively rich provinces mainly rely on market purchase as food source, Sud-Kivu (68%), Nord-Kivu (66%), Bas-Congo (59%), Kasai Occidental (53%). Bandundu is the province that rely the least on market purchases (24%) followed by Katanga (33%). It is worth noting that Bandundu and Katanga has had the highest annual cassava and maize production of the ten provinces with an average of 3.3 and 2.8 million MT per year respectively (SNSA, 2009). Seventy percent (70%) of the households’ food consumption came from their own production in Bandundu and 62% in Katanga.
Figure 11: Sources of food by provinces
0% 20% 40% 60% 80% 100%
Poor
Middle
Wealthy
Wea
lth
ter
cile
s
Market Own production
Fishing, hunting & gathering Inkind payment
Borrowing Gifts
Food aid
0%
10%
20%
30%
40%
50%
60%
70%
80%
90%
100%
Sou
rce
s o
f fo
od
(%
)
Food aid
Gifts
Borrowing
Inkind payment
Fishing, hunting &gathering
Own production
Market
Source: CFSVA 2011-12
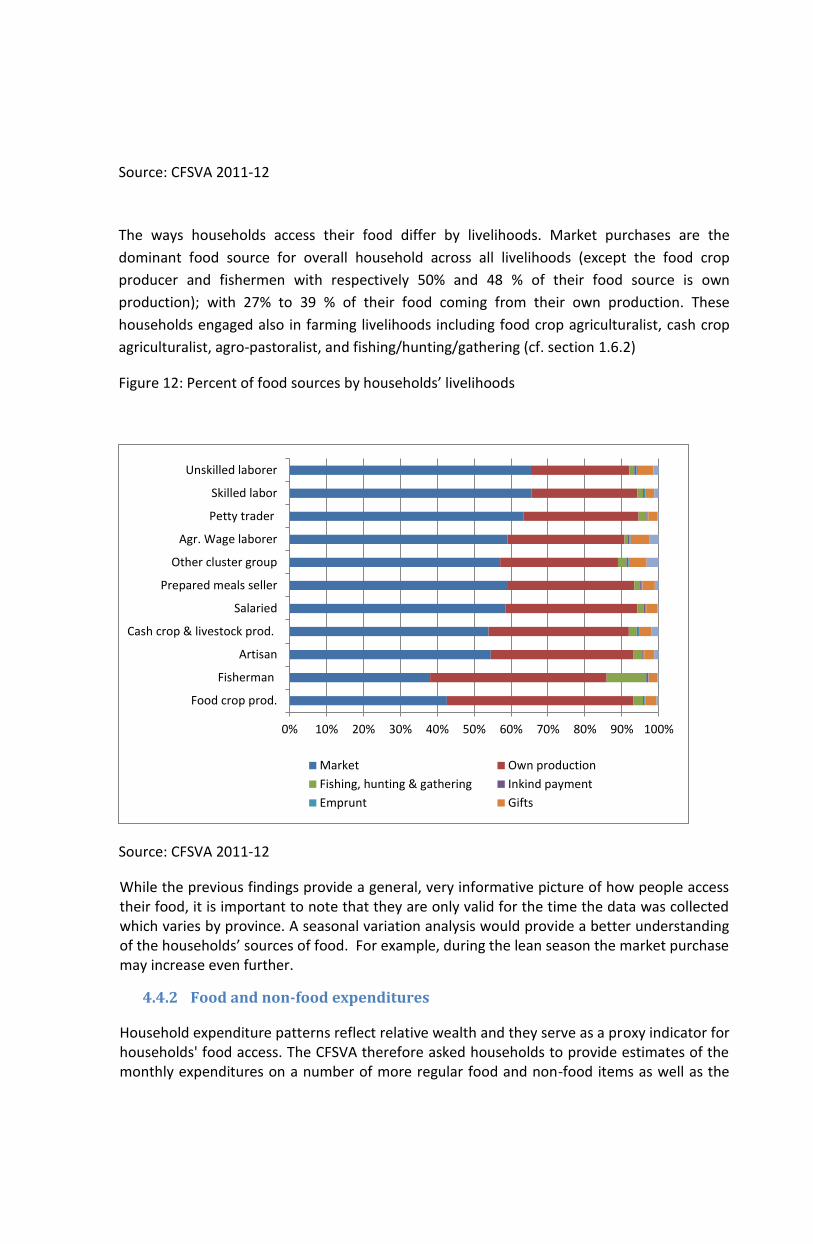
The ways households access their food differ by livelihoods. Market purchases are the
dominant food source for overall household across all livelihoods (except the food crop
producer and fishermen with respectively 50% and 48 % of their food source is own
production); with 27% to 39 % of their food coming from their own production. These
households engaged also in farming livelihoods including food crop agriculturalist, cash crop
agriculturalist, agro-pastoralist, and fishing/hunting/gathering (cf. section 1.6.2)
Figure 12: Percent of food sources by households’ livelihoods
Source: CFSVA 2011-12
While the previous findings provide a general, very informative picture of how people access their food, it is important to note that they are only valid for the time the data was collected which varies by province. A seasonal variation analysis would provide a better understanding of the households’ sources of food. For example, during the lean season the market purchase may increase even further.
4.4.2 Food and non-food expenditures
Household expenditure patterns reflect relative wealth and they serve as a proxy indicator for households' food access. The CFSVA therefore asked households to provide estimates of the monthly expenditures on a number of more regular food and non-food items as well as the
0% 10% 20% 30% 40% 50% 60% 70% 80% 90% 100%
Food crop prod.
Fisherman
Artisan
Cash crop & livestock prod.
Salaried
Prepared meals seller
Other cluster group
Agr. Wage laborer
Petty trader
Skilled labor
Unskilled laborer
Market Own production
Fishing, hunting & gathering Inkind payment
Emprunt Gifts

less frequent expenditures over a recall period of 6 months. Current expenditures were estimated for a list of 22 food items that covered the 8 food groups: Cereals, tubers, legumes and nuts, animal protein, fruits and vegetables, dairy, fats and oils, sweets and non-food items such as soap and firewood. Six month expenditures included health, education, agricultural equipment, livestock, communication, transportation, rent, and ceremony and clothing expenses.
At national level, 67% of households’ income is spent on food. Expenditures on “meat, fish and egg” group is the largest food expenditure (20%) followed by cereals (16%), tubers (12%), legumes and nuts (7%), fats and oils (6%), and sweet (4%).
Largest non-food expenditures are on health (6%), followed by education (5%), energy (5%), transport (4%), and alcohol and tobacco (4%).
Figure 13: Average food and non-food expenditures at household level
Source: CFSVA 2011-12
Cereals and tubers account for 23% and 18% of total food expenditure. As illustrated in the figure below, there are significant differences when expenditures on cereals and tubers are disaggregated at the provincial level. Households living in Kasai Oriental and Bas-Congo devote the largest share of their food expenditures on cereals (36% and 32% respectively) but the smallest share on tubers (9% and 8% respectively) compared with Nord-Kivu where expenditure on tubers account for 29% with relatively small share of expenditures on cereals.
This information should be interpreted with particular care and may call for further research as the difference may explain the substitution patterns during different times of the year. For example, during the lean season, cassava tuber provides a significant dietary supplement as a substitute for maize at a time of the year when lower household stocks and higher prices move maize out of the reach of many poor households.
Alcohol & tabac; 4%
Health; 6%
Education; 5%
Agr. Lvstk equipment
2%
Housing; 1% Transport ; 4%
Energy; 5%
Communication; 2%
Other ; 4%
Cereals; 16%
Tubers; 12%
Legumes & nuts; 7% Fruits & vegetables;
2% Meat & fish & egg;
20%
Fats & oils; 6%
Sweet; 4% Dairy; 1%
Food, 67%
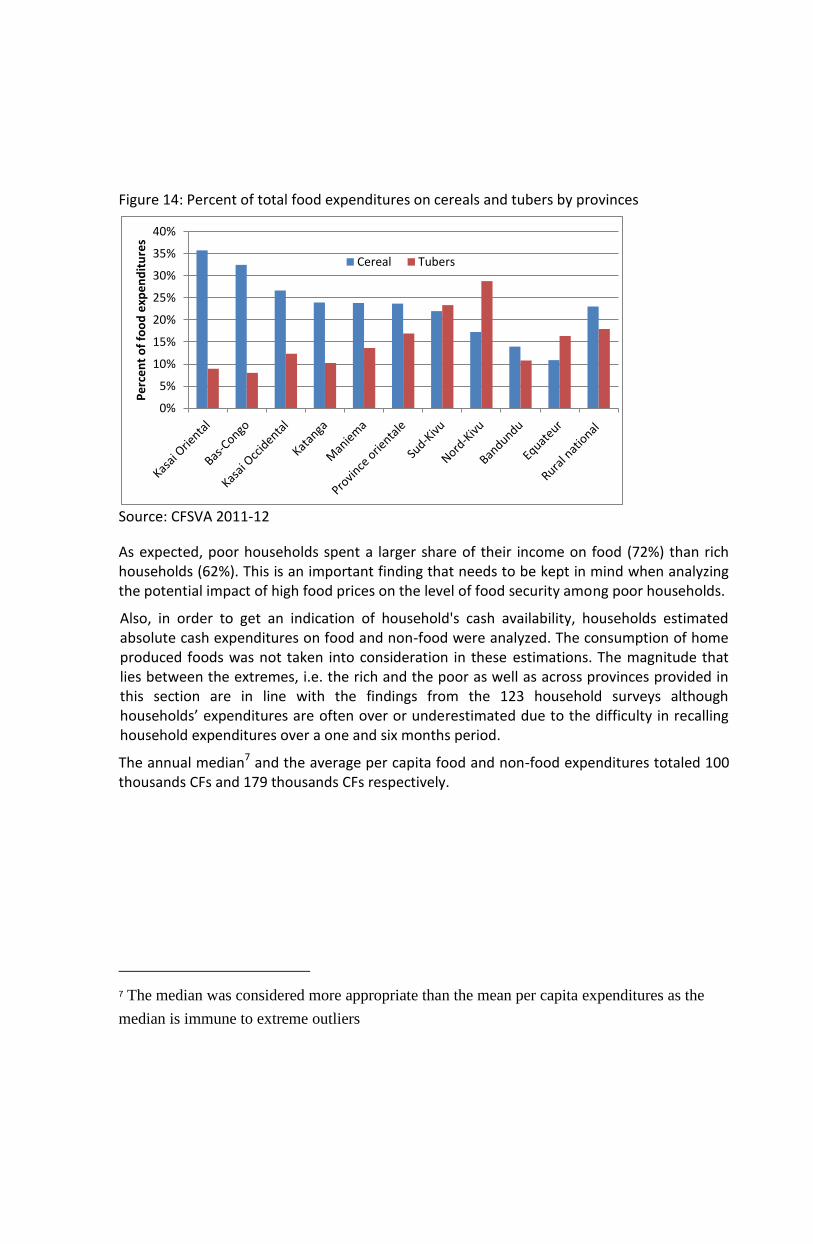
Figure 14: Percent of total food expenditures on cereals and tubers by provinces
Source: CFSVA 2011-12
As expected, poor households spent a larger share of their income on food (72%) than rich households (62%). This is an important finding that needs to be kept in mind when analyzing the potential impact of high food prices on the level of food security among poor households.
Also, in order to get an indication of household's cash availability, households estimated absolute cash expenditures on food and non-food were analyzed. The consumption of home produced foods was not taken into consideration in these estimations. The magnitude that lies between the extremes, i.e. the rich and the poor as well as across provinces provided in this section are in line with the findings from the 123 household surveys although households’ expenditures are often over or underestimated due to the difficulty in recalling household expenditures over a one and six months period.
The annual median7 and the average per capita food and non-food expenditures totaled 100 thousands CFs and 179 thousands CFs respectively.
7 The median was considered more appropriate than the mean per capita expenditures as the
median is immune to extreme outliers
0%
5%
10%
15%
20%
25%
30%
35%
40%
Pe
rce
nt
of
foo
d e
xpe
nd
itu
res
Cereal Tubers

Table 11: Total annual average per capita expenditures by wealth tercile
Poor Middle Wealthy
Food expenditures/total expenditures
(%) 72.3 71.7 62.0
Per capita annual expenditures (CF) 118,327 187,792 262,501
Cereal exp./food exp. 22.4 23.8 22.9
Tubers exp./food exp. 14.0 18.5 20.6
Legumes and nuts exp./food exp. 8.2 11.4 12.9
Fruits and veg. exp./food exp. 2.8 3.4 3.8
Meat-fish-eggs. exp./food exp. 35.4 28.2 25.3
Dairy/food exp. 1.2 1.5 2.0
Fats and oils exp./food exp. 9.6 8.0 7.8
Sweets exp./food exp. 6.3 4.5 5.1
Source: CFSVA 2011-12
Surprisingly, share of food expenditures on meat and fish are higher among the poor households (35%), than the rich (25%). Similar distributions appear for the expenditures on fats and oils and sweets food group. Apart from these exceptions, there is no significant difference in the types of food rich and poor households spend money on.
Lower annual per capita expenditures below the national average were found among households living in Bandundu, Equateur, Katanga, Kasai Oriental, and Kasai Occidental.
Figure 15: Total annual median per capita food and nonfood expenditures (1,000 CFs) by province
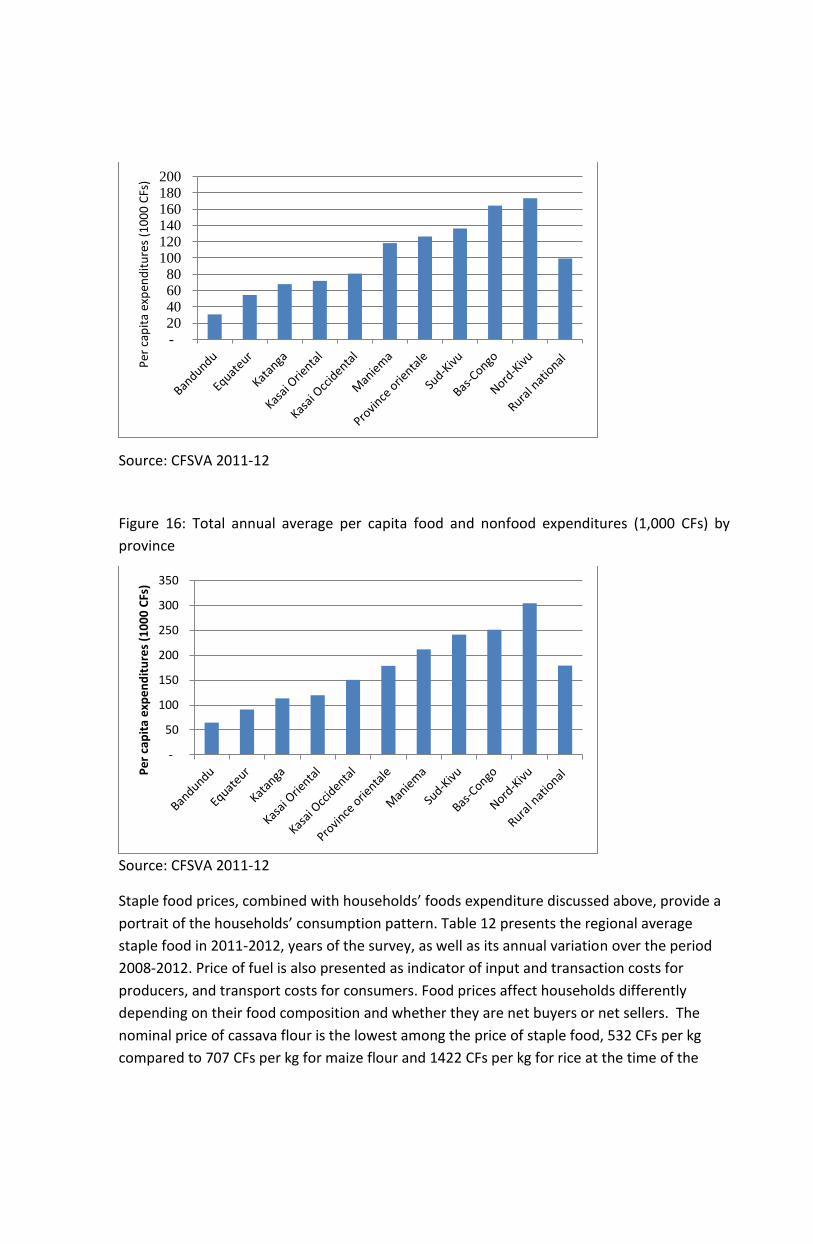
Source: CFSVA 2011-12
Figure 16: Total annual average per capita food and nonfood expenditures (1,000 CFs) by
province
Source: CFSVA 2011-12
Staple food prices, combined with households’ foods expenditure discussed above, provide a
portrait of the households’ consumption pattern. Table 12 presents the regional average
staple food in 2011-2012, years of the survey, as well as its annual variation over the period
2008-2012. Price of fuel is also presented as indicator of input and transaction costs for
producers, and transport costs for consumers. Food prices affect households differently
depending on their food composition and whether they are net buyers or net sellers. The
nominal price of cassava flour is the lowest among the price of staple food, 532 CFs per kg
compared to 707 CFs per kg for maize flour and 1422 CFs per kg for rice at the time of the
- 20 40 60 80
100 120 140 160 180 200
Per
cap
ita
exp
end
itu
res
(10
00
CFs
)
-
50
100
150
200
250
300
350
Pe
r ca
pit
a e
xpe
nd
itu
res
(10
00
CFs
)
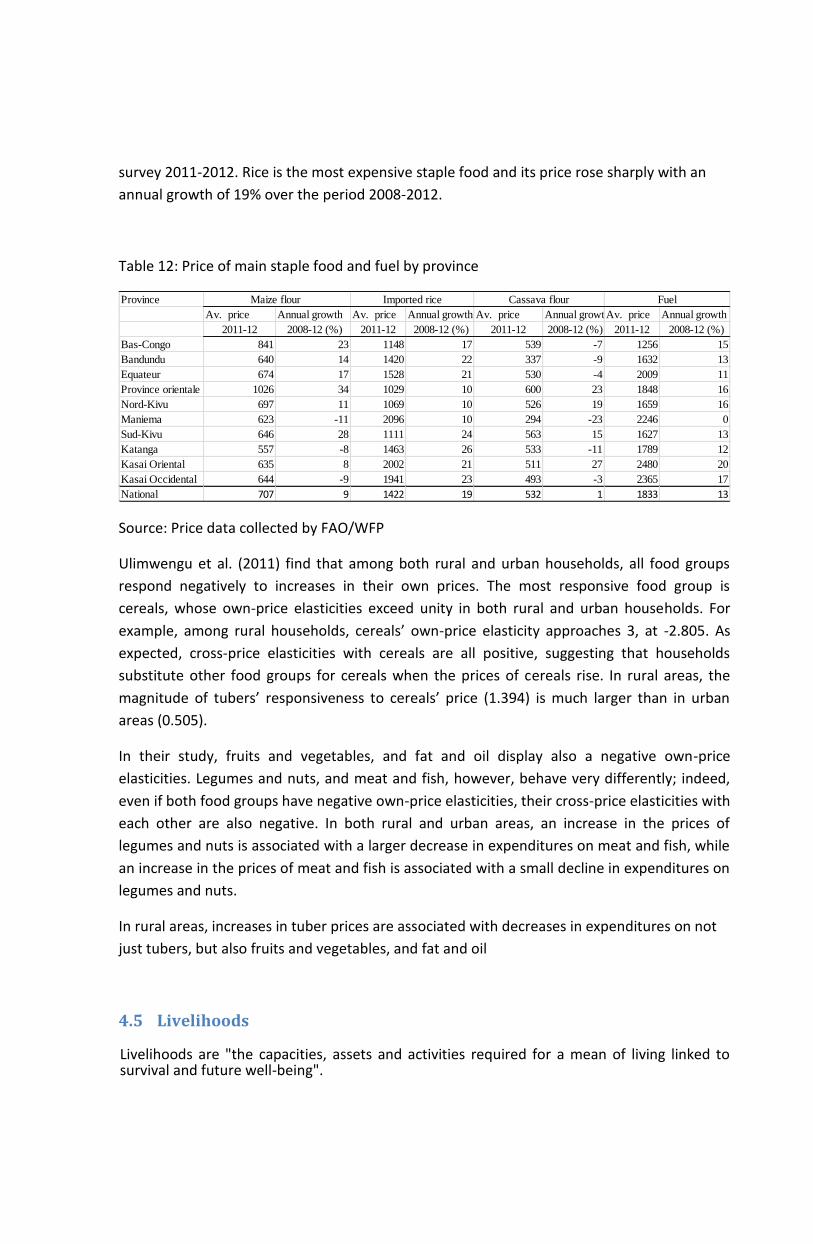
survey 2011-2012. Rice is the most expensive staple food and its price rose sharply with an
annual growth of 19% over the period 2008-2012.
Table 12: Price of main staple food and fuel by province
Source: Price data collected by FAO/WFP
Ulimwengu et al. (2011) find that among both rural and urban households, all food groups
respond negatively to increases in their own prices. The most responsive food group is
cereals, whose own-price elasticities exceed unity in both rural and urban households. For
example, among rural households, cereals’ own-price elasticity approaches 3, at -2.805. As
expected, cross-price elasticities with cereals are all positive, suggesting that households
substitute other food groups for cereals when the prices of cereals rise. In rural areas, the
magnitude of tubers’ responsiveness to cereals’ price (1.394) is much larger than in urban
areas (0.505).
In their study, fruits and vegetables, and fat and oil display also a negative own-price
elasticities. Legumes and nuts, and meat and fish, however, behave very differently; indeed,
even if both food groups have negative own-price elasticities, their cross-price elasticities with
each other are also negative. In both rural and urban areas, an increase in the prices of
legumes and nuts is associated with a larger decrease in expenditures on meat and fish, while
an increase in the prices of meat and fish is associated with a small decline in expenditures on
legumes and nuts.
In rural areas, increases in tuber prices are associated with decreases in expenditures on not
just tubers, but also fruits and vegetables, and fat and oil
4.5 Livelihoods
Livelihoods are "the capacities, assets and activities required for a mean of living linked to survival and future well-being".
Province
Av. price Annual growth Av. price Annual growth Av. price Annual growth Av. price Annual growth
2011-12 2008-12 (%) 2011-12 2008-12 (%) 2011-12 2008-12 (%) 2011-12 2008-12 (%)
Bas-Congo 841 23 1148 17 539 -7 1256 15
Bandundu 640 14 1420 22 337 -9 1632 13
Equateur 674 17 1528 21 530 -4 2009 11
Province orientale 1026 34 1029 10 600 23 1848 16
Nord-Kivu 697 11 1069 10 526 19 1659 16
Maniema 623 -11 2096 10 294 -23 2246 0
Sud-Kivu 646 28 1111 24 563 15 1627 13
Katanga 557 -8 1463 26 533 -11 1789 12
Kasai Oriental 635 8 2002 21 511 27 2480 20
Kasai Occidental 644 -9 1941 23 493 -3 2365 17
National 707 9 1422 19 532 1 1833 13
Maize flour Imported rice Cassava flour Fuel
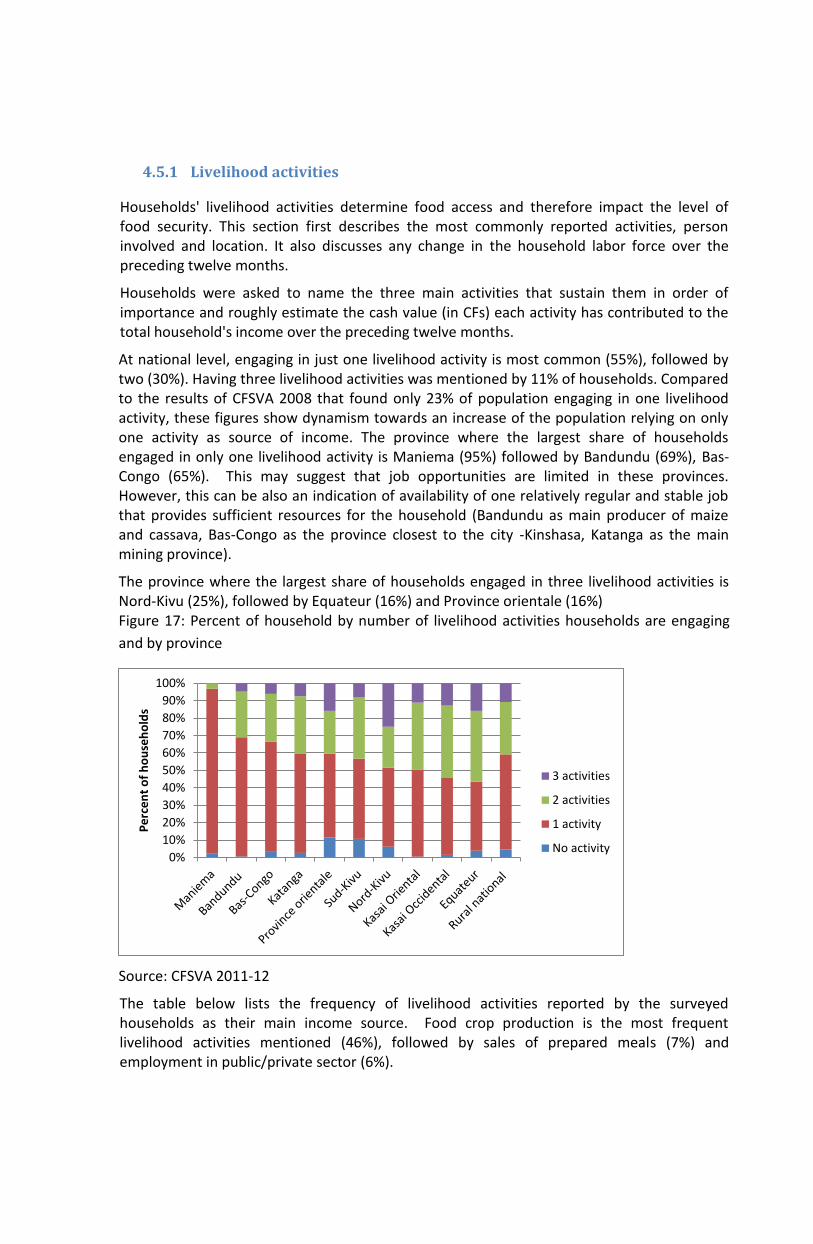
4.5.1 Livelihood activities
Households' livelihood activities determine food access and therefore impact the level of food security. This section first describes the most commonly reported activities, person involved and location. It also discusses any change in the household labor force over the preceding twelve months.
Households were asked to name the three main activities that sustain them in order of importance and roughly estimate the cash value (in CFs) each activity has contributed to the total household's income over the preceding twelve months.
At national level, engaging in just one livelihood activity is most common (55%), followed by two (30%). Having three livelihood activities was mentioned by 11% of households. Compared to the results of CFSVA 2008 that found only 23% of population engaging in one livelihood activity, these figures show dynamism towards an increase of the population relying on only one activity as source of income. The province where the largest share of households engaged in only one livelihood activity is Maniema (95%) followed by Bandundu (69%), Bas-Congo (65%). This may suggest that job opportunities are limited in these provinces. However, this can be also an indication of availability of one relatively regular and stable job that provides sufficient resources for the household (Bandundu as main producer of maize and cassava, Bas-Congo as the province closest to the city -Kinshasa, Katanga as the main mining province).
The province where the largest share of households engaged in three livelihood activities is Nord-Kivu (25%), followed by Equateur (16%) and Province orientale (16%) Figure 17: Percent of household by number of livelihood activities households are engaging
and by province
Source: CFSVA 2011-12
The table below lists the frequency of livelihood activities reported by the surveyed households as their main income source. Food crop production is the most frequent livelihood activities mentioned (46%), followed by sales of prepared meals (7%) and employment in public/private sector (6%).
0%
10%
20%
30%
40%
50%
60%
70%
80%
90%
100%
Pe
rce
nt
of
ho
use
ho
lds
3 activities
2 activities
1 activity
No activity
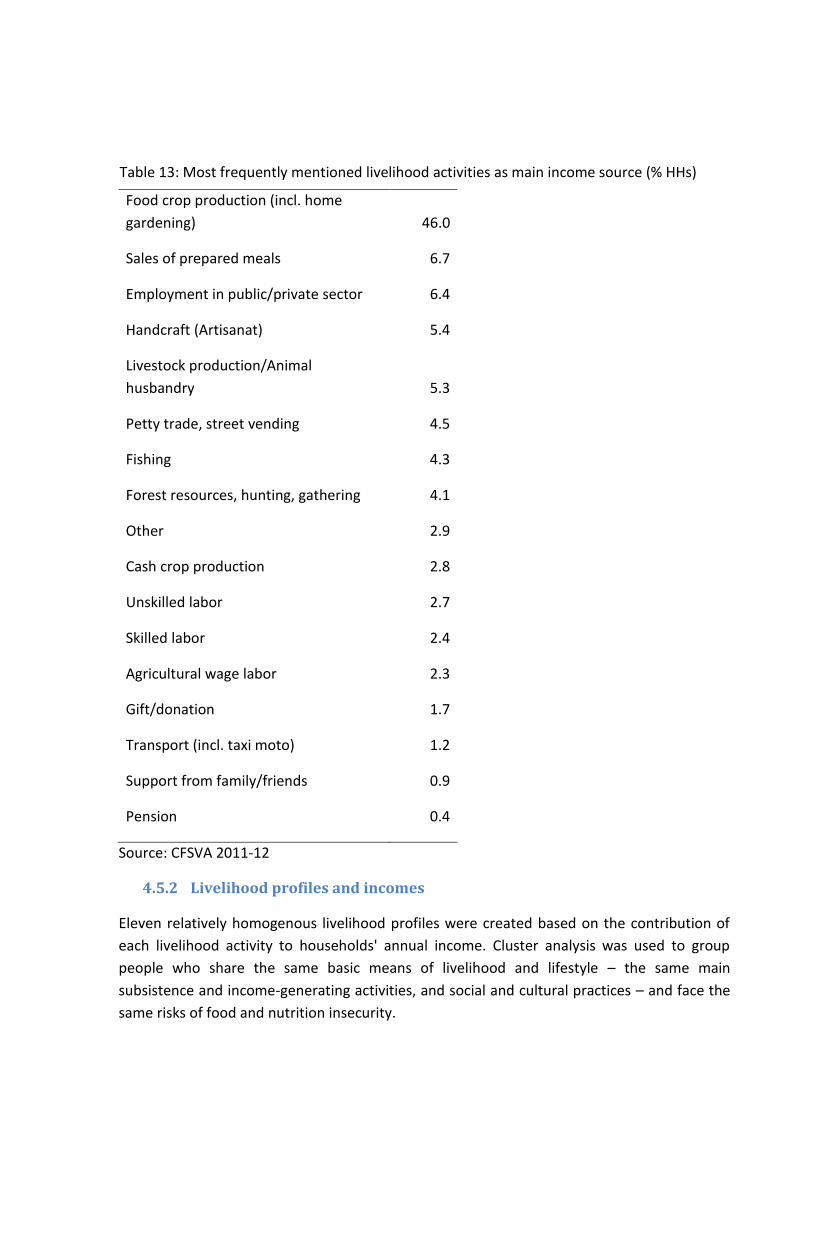
Table 13: Most frequently mentioned livelihood activities as main income source (% HHs)
Food crop production (incl. home
gardening) 46.0
Sales of prepared meals 6.7
Employment in public/private sector 6.4
Handcraft (Artisanat) 5.4
Livestock production/Animal
husbandry 5.3
Petty trade, street vending 4.5
Fishing 4.3
Forest resources, hunting, gathering 4.1
Other 2.9
Cash crop production 2.8
Unskilled labor 2.7
Skilled labor 2.4
Agricultural wage labor 2.3
Gift/donation 1.7
Transport (incl. taxi moto) 1.2
Support from family/friends 0.9
Pension 0.4
Source: CFSVA 2011-12
4.5.2 Livelihood profiles and incomes
Eleven relatively homogenous livelihood profiles were created based on the contribution of
each livelihood activity to households' annual income. Cluster analysis was used to group
people who share the same basic means of livelihood and lifestyle – the same main
subsistence and income-generating activities, and social and cultural practices – and face the
same risks of food and nutrition insecurity.

Table 14reports the eleven livelihood groups with their average annual per capita income and shows the contribution of the three most important activities that characterize each livelihood group.

Table 14: Livelihood groups with their average annual per capita income
%
o
f
H
H
Annual income
per capita Most important income
Second most
important income
Third most
important income
Livelihood groups N
Media
n Mean % contribution to total income
% contribution to
total income
% contribution to
total income
Agriculturalist (food crops)
12,
546 5
7
40,00
0
95,625 Food crop production
9
0 Handcraft 1
Sales of
prepared food 1
Agriculturalist (cash crops,
forest , livestock)
2,5
95 1
2
50,00
0
165,36
1
Cash crop production &
forest & livestock
4
6
Food crop
production
1
0 Transport
1
0
Salaried and consultant
1,6
24 7
71,25
0
270,23
8
Formal employment in
private/public sector
8
4
Food crop
production 8
Sales of
prepared food 2
Prepared meals seller
1,0
35 5
52,50
0
214,24
9 Sales of prepared food
8
6
Food crop
production 7
Formal
employment 1
Artisan
806
4
46,18
2
143,69
2 Artisan
8
4
Food crop
production
1
0 Petty trading 1
Petty trader
706
3
62,50
0
219,38
2
Petty trading and street
vending
8
4
Food crop
production 7
Sales of
prepared food 2
Fisherman
687
3
41,00
0
103,97
6 Fishing
7
9
Food crop
production
1
3 Petty trading 1
Other livelihood group
556
3
44,44
4
196,80
6 Other livelihood
8
6
Food crop
production 8 Petty trading 1
Skilled laborer
507
2
69,61
5
313,93
0 Skilled labor
8
4
Food crop
production 8
Sales of
prepared food 2
Unskilled laborer
507
2
70,00
0
308,74
6 Unskilled labor
8
5
Food crop
production 6
Sales of
prepared food 2
Agricultural wage laborer
478
2
60,00
0
225,58
6 Agricultural wage labor
9
0
Food crop
production 4
Sales of
prepared food 1
The first most important income source for all livelihood groups provides at least 80% of the households' average annual income, except the second type of agriculturalist (cash crop
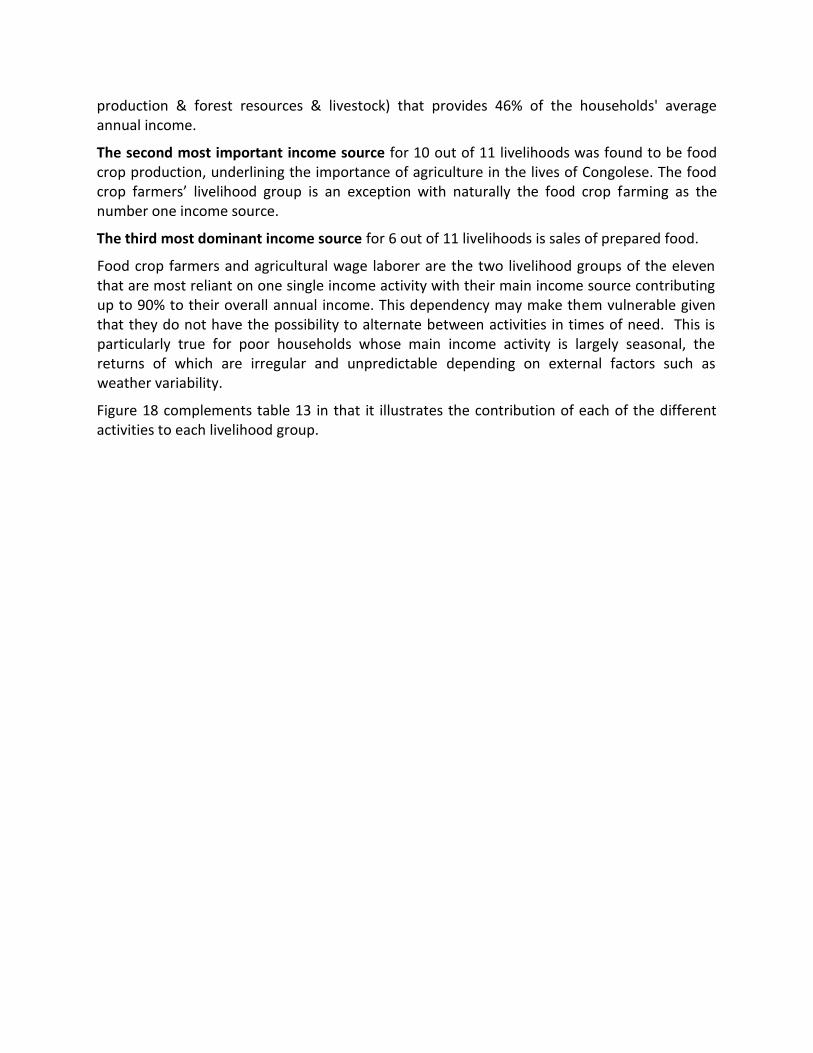
production & forest resources & livestock) that provides 46% of the households' average annual income.
The second most important income source for 10 out of 11 livelihoods was found to be food crop production, underlining the importance of agriculture in the lives of Congolese. The food crop farmers’ livelihood group is an exception with naturally the food crop farming as the number one income source.
The third most dominant income source for 6 out of 11 livelihoods is sales of prepared food.
Food crop farmers and agricultural wage laborer are the two livelihood groups of the eleven that are most reliant on one single income activity with their main income source contributing up to 90% to their overall annual income. This dependency may make them vulnerable given that they do not have the possibility to alternate between activities in times of need. This is particularly true for poor households whose main income activity is largely seasonal, the returns of which are irregular and unpredictable depending on external factors such as weather variability.
Figure 18 complements table 13 in that it illustrates the contribution of each of the different activities to each livelihood group.
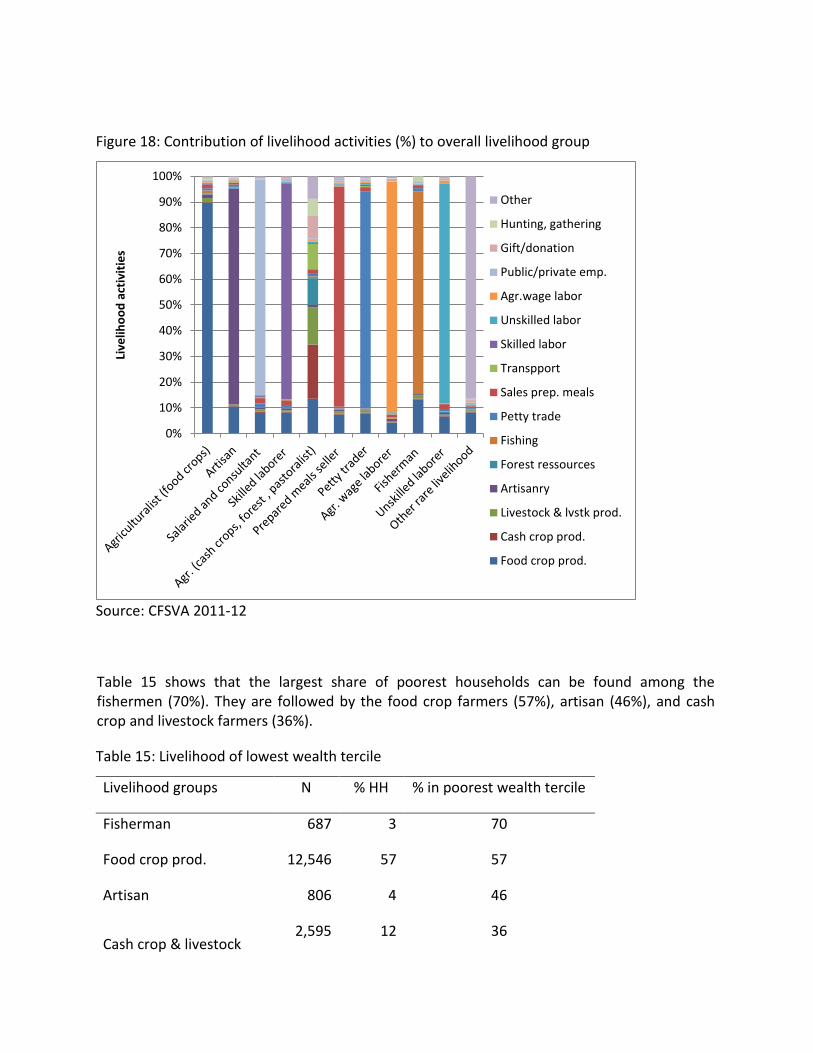
Figure 18: Contribution of livelihood activities (%) to overall livelihood group
Source: CFSVA 2011-12
Table 15 shows that the largest share of poorest households can be found among the fishermen (70%). They are followed by the food crop farmers (57%), artisan (46%), and cash crop and livestock farmers (36%). Table 15: Livelihood of lowest wealth tercile
Livelihood groups N % HH % in poorest wealth tercile
Fisherman 687 3 70
Food crop prod. 12,546 57 57
Artisan 806 4 46
Cash crop & livestock 2,595 12 36
0%
10%
20%
30%
40%
50%
60%
70%
80%
90%
100%
Live
liho
od
act
ivit
ies
Other
Hunting, gathering
Gift/donation
Public/private emp.
Agr.wage labor
Unskilled labor
Skilled labor
Transpport
Sales prep. meals
Petty trade
Fishing
Forest ressources
Artisanry
Livestock & lvstk prod.
Cash crop prod.
Food crop prod.
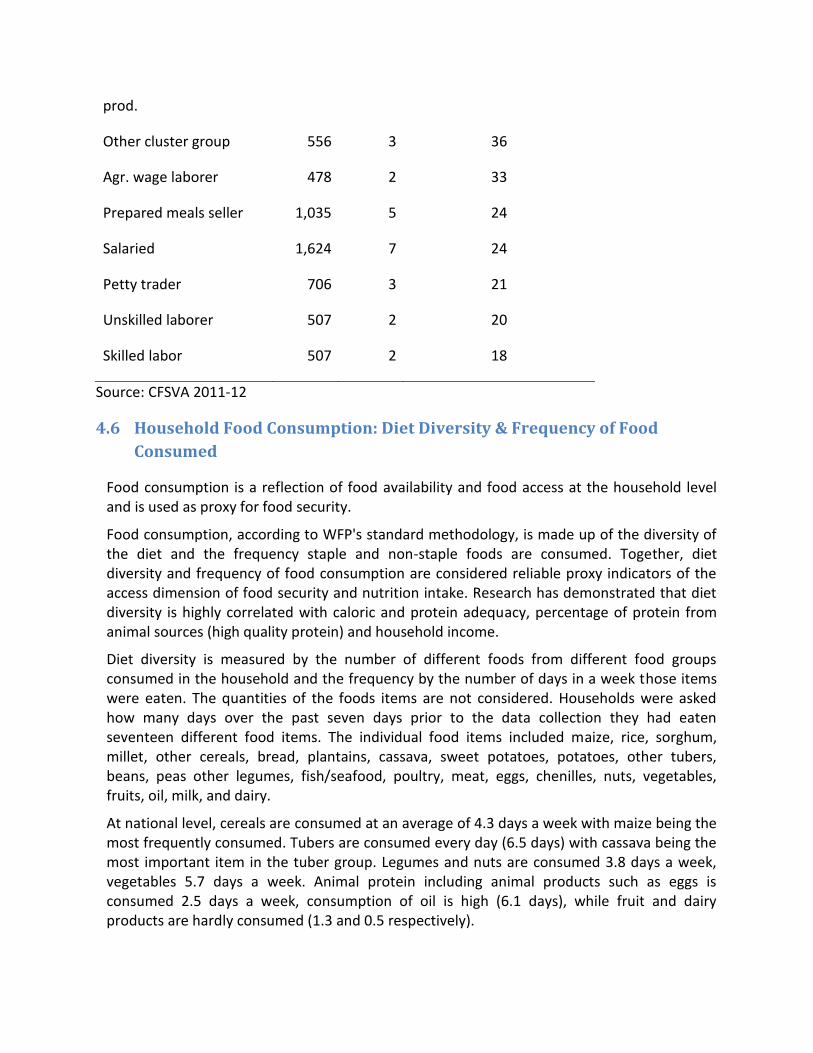
prod.
Other cluster group 556 3 36
Agr. wage laborer 478 2 33
Prepared meals seller 1,035 5 24
Salaried 1,624 7 24
Petty trader 706 3 21
Unskilled laborer 507 2 20
Skilled labor 507 2 18
Source: CFSVA 2011-12
4.6 Household Food Consumption: Diet Diversity & Frequency of Food
Consumed
Food consumption is a reflection of food availability and food access at the household level and is used as proxy for food security.
Food consumption, according to WFP's standard methodology, is made up of the diversity of the diet and the frequency staple and non-staple foods are consumed. Together, diet diversity and frequency of food consumption are considered reliable proxy indicators of the access dimension of food security and nutrition intake. Research has demonstrated that diet diversity is highly correlated with caloric and protein adequacy, percentage of protein from animal sources (high quality protein) and household income.
Diet diversity is measured by the number of different foods from different food groups consumed in the household and the frequency by the number of days in a week those items were eaten. The quantities of the foods items are not considered. Households were asked how many days over the past seven days prior to the data collection they had eaten seventeen different food items. The individual food items included maize, rice, sorghum, millet, other cereals, bread, plantains, cassava, sweet potatoes, potatoes, other tubers, beans, peas other legumes, fish/seafood, poultry, meat, eggs, chenilles, nuts, vegetables, fruits, oil, milk, and dairy.
At national level, cereals are consumed at an average of 4.3 days a week with maize being the most frequently consumed. Tubers are consumed every day (6.5 days) with cassava being the most important item in the tuber group. Legumes and nuts are consumed 3.8 days a week, vegetables 5.7 days a week. Animal protein including animal products such as eggs is consumed 2.5 days a week, consumption of oil is high (6.1 days), while fruit and dairy products are hardly consumed (1.3 and 0.5 respectively).

The frequency of food consumption varies by provinces. People living in Nord-Kivu, Sud-Kivu, and Equateur eat cereals less than the national average. Consumption of cassava remains almost seven days a week across all provinces with exception of Bas-Congo (2.7 days) and Province orientale (5.3 days). Consumption of legumes and nuts, source of vegetal protein are above the national average in only three provinces: Bandundu (5.1 days), Province orientale (5.1 days), and Nord-Kivu (4.8 days). No significant difference has been found in the fish and meat consumption - important sources of animal protein. The same holds for vegetables, sources of vitamins. Milk/dairy products are only consumed in Bas-Congo for 2.1 days a week.
Figure 19: Consumption of food groups (in days) by province over the last seven days
Source: CFSVA 2011-12
The average number of meals consumed by the adult household members the day preceding the survey was 1.9. Adults living in Bas-Congo consumed slightly more frequently than those living in other provinces (2.2). Equateur and Sud-Kivu had the lowest average number of meals per adult (1.8). Children eat more frequently than adult (2.1). Similar to adults, children living in Equateur, Sud-Kivu and Kasai Oriental had the lowest number of meal per day (1.9).
The number of meals children ate is similar whether the household is headed by a man or a woman.
0 5 10 15 20 25 30 35 40
Bas-Congo
Bandundu
Equateur
Orientale
Nord-Kivu
Maniema
Sud-Kivu
Katanga
Kasai Orientale
Kasai Occidentale
Rural national
Cereals
Tubers
Legumes & nuts
Animal protein
Vegetables
Fruits
Sugar
Oil
Dairy
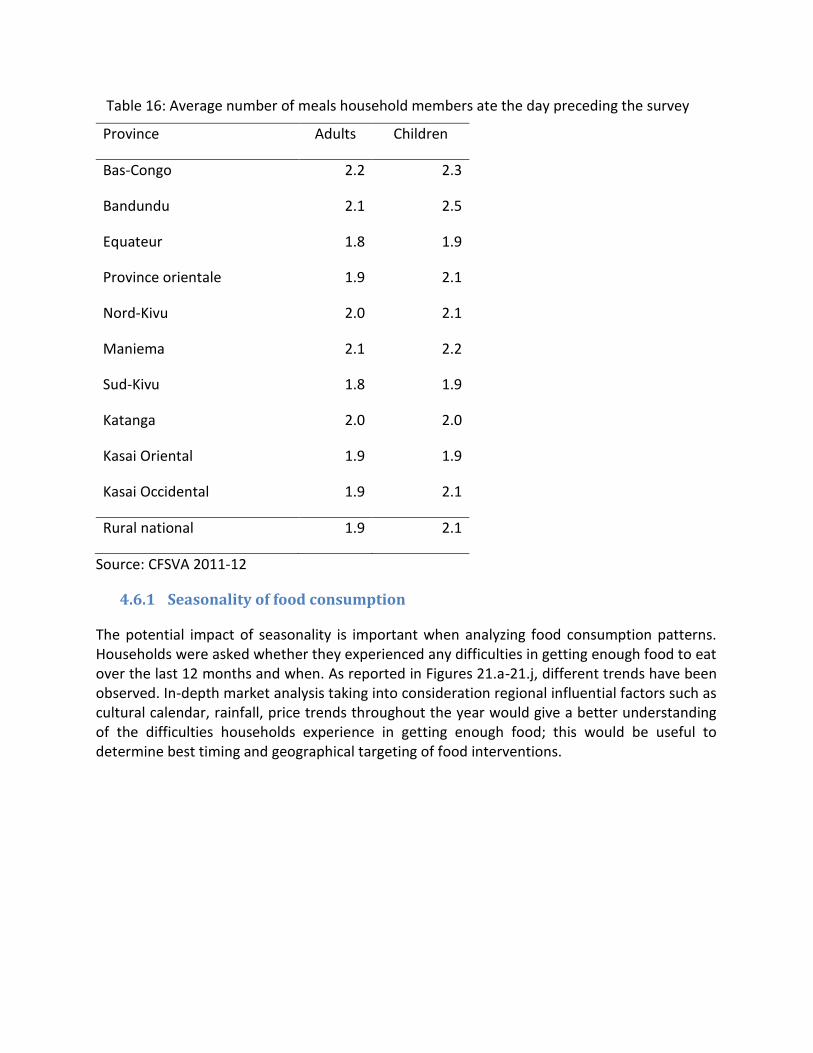
Table 16: Average number of meals household members ate the day preceding the survey
Province Adults Children
Bas-Congo 2.2 2.3
Bandundu 2.1 2.5
Equateur 1.8 1.9
Province orientale 1.9 2.1
Nord-Kivu 2.0 2.1
Maniema 2.1 2.2
Sud-Kivu 1.8 1.9
Katanga 2.0 2.0
Kasai Oriental 1.9 1.9
Kasai Occidental 1.9 2.1
Rural national 1.9 2.1
Source: CFSVA 2011-12
4.6.1 Seasonality of food consumption
The potential impact of seasonality is important when analyzing food consumption patterns. Households were asked whether they experienced any difficulties in getting enough food to eat over the last 12 months and when. As reported in Figures 21.a-21.j, different trends have been observed. In-depth market analysis taking into consideration regional influential factors such as cultural calendar, rainfall, price trends throughout the year would give a better understanding of the difficulties households experience in getting enough food; this would be useful to determine best timing and geographical targeting of food interventions.

Figure 20: Monthly seasonal price indices of main staple food and fuel in DRC (2008-2012)
Source: Prices collected by FAO/WFP
Trends in seasonal prices suggest that the prices of staple food reach their lowest level in
August when the harvest of first season reaches the markets. During the harvest of maize and
rice in the Central Basin an in the northern agro-ecological zones and that of cassava in all
regions between July and August (cf. agricultural seasonal calendar in Annex A), one would
expect the consumption of staple foods increases because it is more affordable and available
due to low price. Then, prices begin to increase again and stay high until the harvest of the
second season in February for maize and rice although they do not reach the same level as
during the first season. As for cassava, further analysis is needed as it can be kept in the ground
for as long as wanted until climatic conditions are best for drying, which my affects its price in
addition to the agricultural calendar and its substitution with other staple food.
90
95
100
105
110
115
Jan
Feb
Mar
Ap
r
May Jun
Jul
Au
g
Sep
Oct
No
v
De
c
Ind
ex
Maize flour
Imported rice
Local rice
Cassava flour
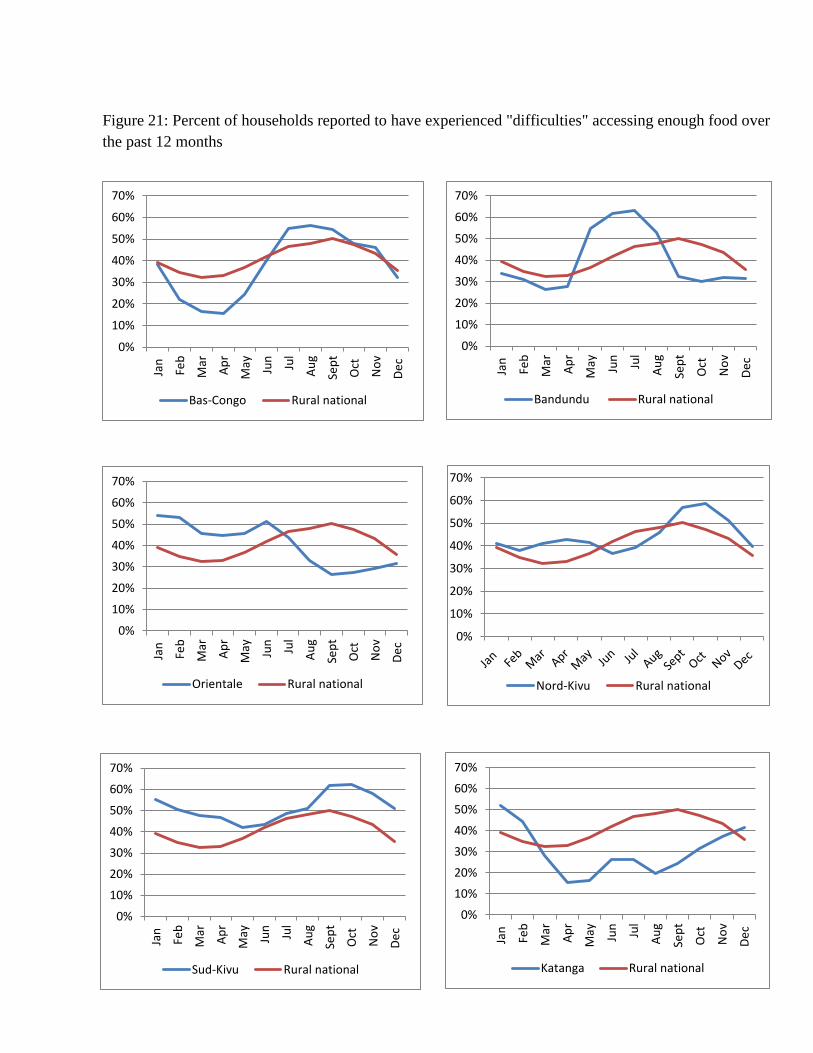
0%
10%
20%
30%
40%
50%
60%
70%
Jan
Feb
Mar
Ap
r
May Jun
Jul
Au
g
Sep
t
Oct
No
v
De
cBas-Congo Rural national
0%
10%
20%
30%
40%
50%
60%
70%
Jan
Feb
Mar
Ap
r
May Jun
Jul
Au
g
Sep
t
Oct
No
v
De
c
Bandundu Rural national
0%
10%
20%
30%
40%
50%
60%
70%
Jan
Feb
Mar
Ap
r
May Jun
Jul
Au
g
Sep
t
Oct
No
v
De
c
Orientale Rural national
0%
10%
20%
30%
40%
50%
60%
70%
Nord-Kivu Rural national
0%
10%
20%
30%
40%
50%
60%
70%
Jan
Feb
Mar
Ap
r
May Jun
Jul
Au
g
Sep
t
Oct
No
v
De
c
Sud-Kivu Rural national
0%
10%
20%
30%
40%
50%
60%
70%
Jan
Feb
Mar
Ap
r
May Jun
Jul
Au
g
Sep
t
Oct
No
v
De
c
Katanga Rural national
Figure 21: Percent of households reported to have experienced "difficulties" accessing enough food over
the past 12 months

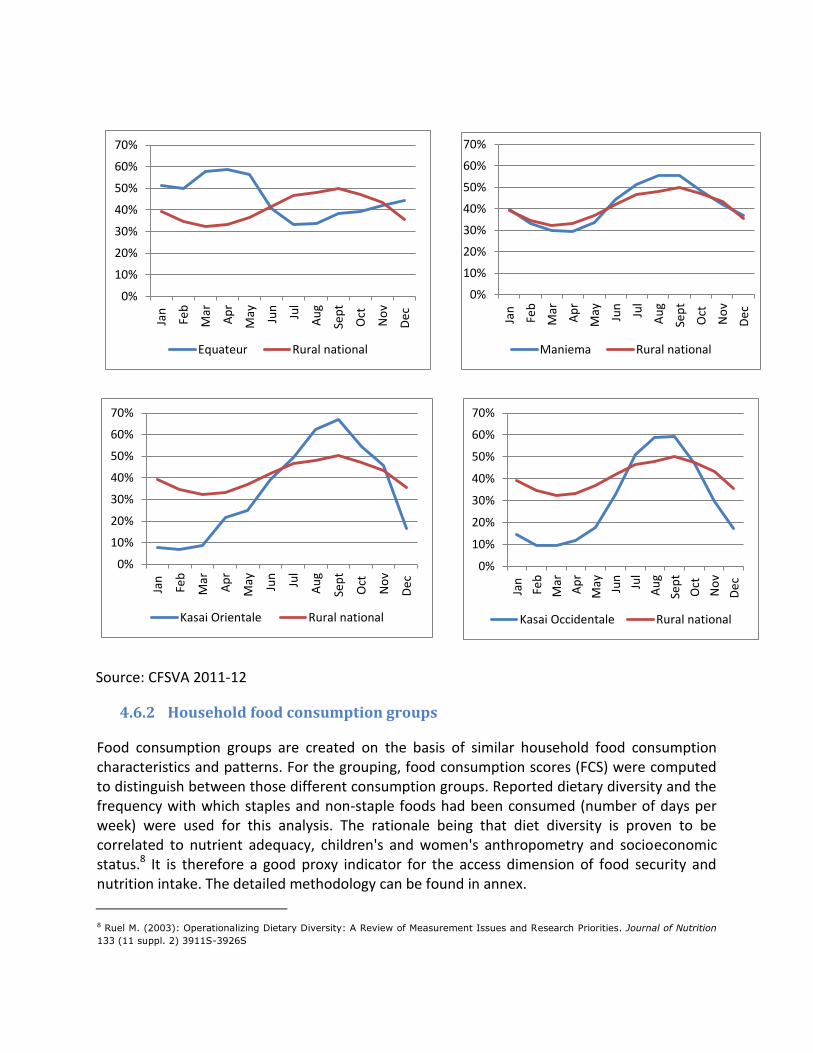
Source: CFSVA 2011-12
4.6.2 Household food consumption groups
Food consumption groups are created on the basis of similar household food consumption characteristics and patterns. For the grouping, food consumption scores (FCS) were computed to distinguish between those different consumption groups. Reported dietary diversity and the frequency with which staples and non-staple foods had been consumed (number of days per week) were used for this analysis. The rationale being that diet diversity is proven to be correlated to nutrient adequacy, children's and women's anthropometry and socioeconomic status.8 It is therefore a good proxy indicator for the access dimension of food security and nutrition intake. The detailed methodology can be found in annex.
8 Ruel M. (2003): Operationalizing Dietary Diversity: A Review of Measurement Issues and Research Priorities. Journal of Nutrition
133 (11 suppl. 2) 3911S-3926S
0%
10%
20%
30%
40%
50%
60%
70%
Jan
Feb
Mar
Ap
r
May Jun
Jul
Au
g
Sep
t
Oct
No
v
De
c
Kasai Orientale Rural national
0%
10%
20%
30%
40%
50%
60%
70%
Jan
Feb
Mar
Ap
r
May Jun
Jul
Au
g
Sep
t
Oct
No
v
De
c
Kasai Occidentale Rural national
0%
10%
20%
30%
40%
50%
60%
70%Ja
n
Feb
Mar
Ap
r
May Jun
Jul
Au
g
Sep
t
Oct
No
v
De
c
Equateur Rural national
0%
10%
20%
30%
40%
50%
60%
70%
Jan
Feb
Mar
Ap
r
May Jun
Jul
Au
g
Sep
t
Oct
No
v
De
c
Maniema Rural national
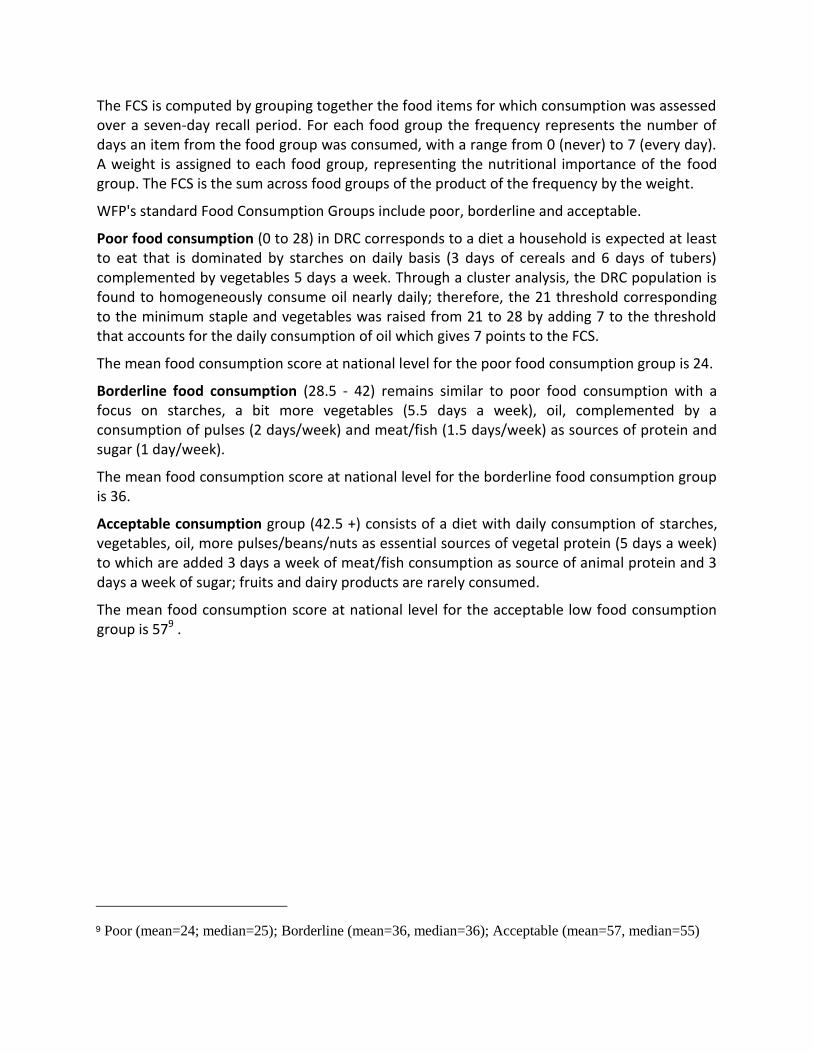
The FCS is computed by grouping together the food items for which consumption was assessed over a seven-day recall period. For each food group the frequency represents the number of days an item from the food group was consumed, with a range from 0 (never) to 7 (every day). A weight is assigned to each food group, representing the nutritional importance of the food group. The FCS is the sum across food groups of the product of the frequency by the weight.
WFP's standard Food Consumption Groups include poor, borderline and acceptable.
Poor food consumption (0 to 28) in DRC corresponds to a diet a household is expected at least to eat that is dominated by starches on daily basis (3 days of cereals and 6 days of tubers) complemented by vegetables 5 days a week. Through a cluster analysis, the DRC population is found to homogeneously consume oil nearly daily; therefore, the 21 threshold corresponding to the minimum staple and vegetables was raised from 21 to 28 by adding 7 to the threshold that accounts for the daily consumption of oil which gives 7 points to the FCS.
The mean food consumption score at national level for the poor food consumption group is 24.
Borderline food consumption (28.5 - 42) remains similar to poor food consumption with a focus on starches, a bit more vegetables (5.5 days a week), oil, complemented by a consumption of pulses (2 days/week) and meat/fish (1.5 days/week) as sources of protein and sugar (1 day/week).
The mean food consumption score at national level for the borderline food consumption group is 36.
Acceptable consumption group (42.5 +) consists of a diet with daily consumption of starches, vegetables, oil, more pulses/beans/nuts as essential sources of vegetal protein (5 days a week) to which are added 3 days a week of meat/fish consumption as source of animal protein and 3 days a week of sugar; fruits and dairy products are rarely consumed.
The mean food consumption score at national level for the acceptable low food consumption group is 579 .
9 Poor (mean=24; median=25); Borderline (mean=36, median=36); Acceptable (mean=57, median=55)
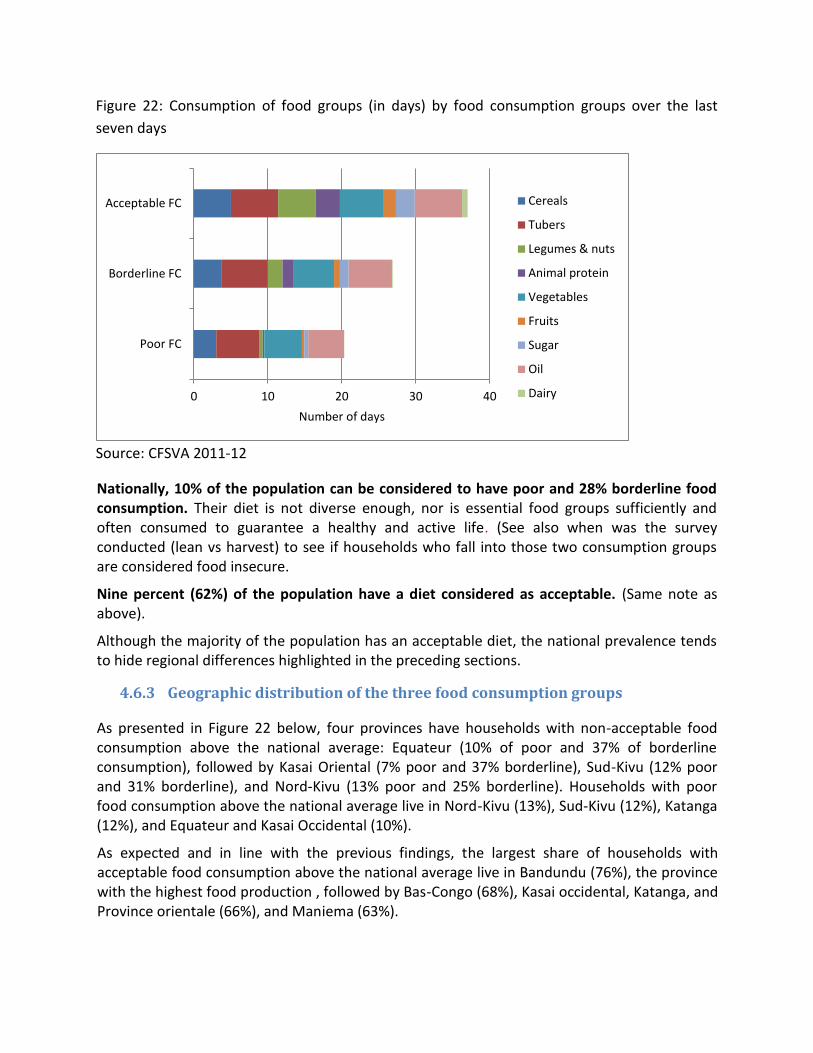
Figure 22: Consumption of food groups (in days) by food consumption groups over the last
seven days
Source: CFSVA 2011-12
Nationally, 10% of the population can be considered to have poor and 28% borderline food consumption. Their diet is not diverse enough, nor is essential food groups sufficiently and often consumed to guarantee a healthy and active life. (See also when was the survey conducted (lean vs harvest) to see if households who fall into those two consumption groups are considered food insecure.
Nine percent (62%) of the population have a diet considered as acceptable. (Same note as above).
Although the majority of the population has an acceptable diet, the national prevalence tends to hide regional differences highlighted in the preceding sections.
4.6.3 Geographic distribution of the three food consumption groups
As presented in Figure 22 below, four provinces have households with non-acceptable food consumption above the national average: Equateur (10% of poor and 37% of borderline consumption), followed by Kasai Oriental (7% poor and 37% borderline), Sud-Kivu (12% poor and 31% borderline), and Nord-Kivu (13% poor and 25% borderline). Households with poor food consumption above the national average live in Nord-Kivu (13%), Sud-Kivu (12%), Katanga (12%), and Equateur and Kasai Occidental (10%).
As expected and in line with the previous findings, the largest share of households with acceptable food consumption above the national average live in Bandundu (76%), the province with the highest food production , followed by Bas-Congo (68%), Kasai occidental, Katanga, and Province orientale (66%), and Maniema (63%).
0 10 20 30 40
Poor FC
Borderline FC
Acceptable FC
Number of days
Cereals
Tubers
Legumes & nuts
Animal protein
Vegetables
Fruits
Sugar
Oil
Dairy
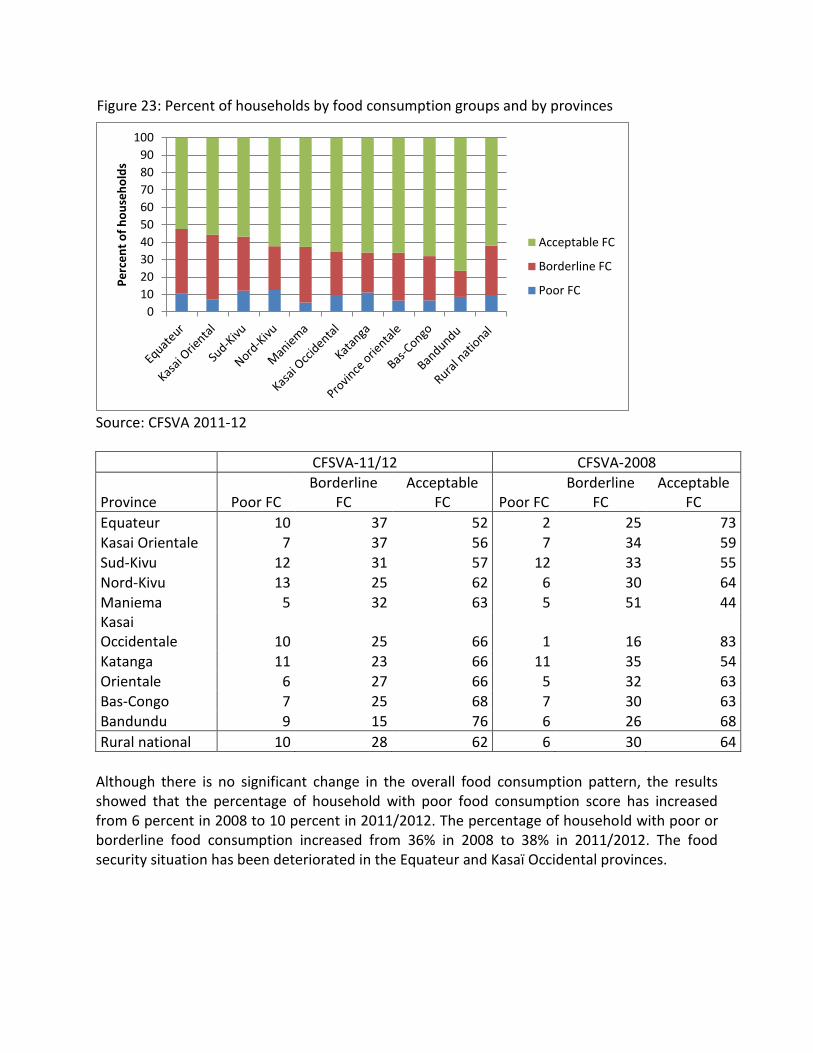
Figure 23: Percent of households by food consumption groups and by provinces
Source: CFSVA 2011-12
CFSVA-11/12 CFSVA-2008
Province Poor FC Borderline
FC Acceptable
FC Poor FC Borderline
FC Acceptable
FC
Equateur 10 37 52 2 25 73
Kasai Orientale 7 37 56 7 34 59 Sud-Kivu 12 31 57 12 33 55 Nord-Kivu 13 25 62 6 30 64 Maniema 5 32 63 5 51 44 Kasai Occidentale 10 25 66 1 16 83 Katanga 11 23 66 11 35 54 Orientale 6 27 66 5 32 63 Bas-Congo 7 25 68 7 30 63 Bandundu 9 15 76 6 26 68
Rural national 10 28 62 6 30 64
Although there is no significant change in the overall food consumption pattern, the results showed that the percentage of household with poor food consumption score has increased from 6 percent in 2008 to 10 percent in 2011/2012. The percentage of household with poor or borderline food consumption increased from 36% in 2008 to 38% in 2011/2012. The food security situation has been deteriorated in the Equateur and Kasaï Occidental provinces.
0
10
20
30
40
50
60
70
80
90
100P
erc
en
t o
f h
ou
seh
old
s
Acceptable FC
Borderline FC
Poor FC
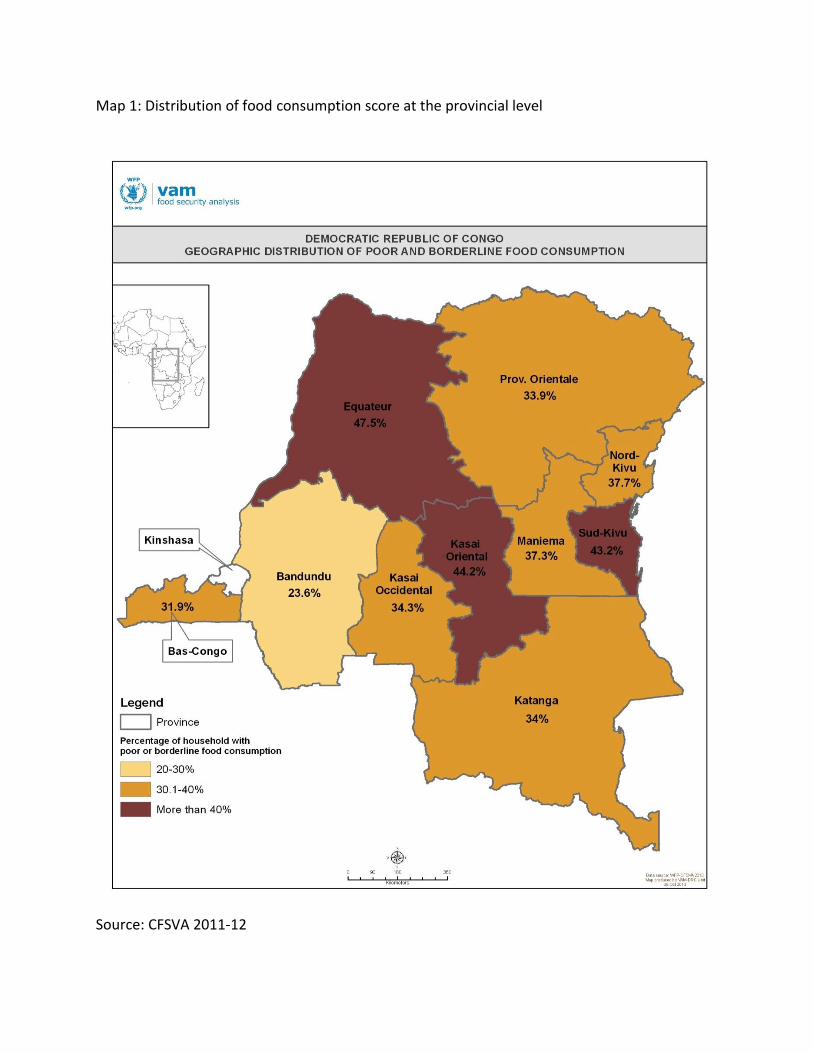
Map 1: Distribution of food consumption score at the provincial level
Source: CFSVA 2011-12

Map 2: Distribution of food consumption score at the territorial level
Source: CFSVA 2011-12
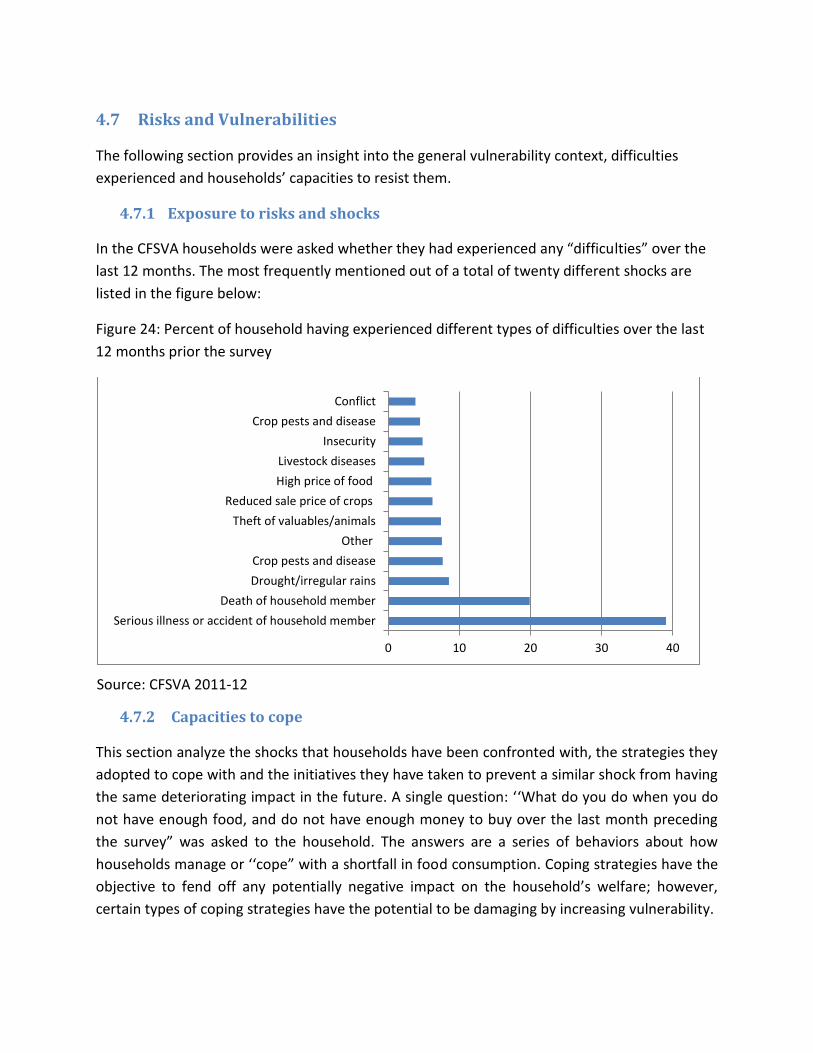
4.7 Risks and Vulnerabilities
The following section provides an insight into the general vulnerability context, difficulties
experienced and households’ capacities to resist them.
4.7.1 Exposure to risks and shocks
In the CFSVA households were asked whether they had experienced any “difficulties” over the
last 12 months. The most frequently mentioned out of a total of twenty different shocks are
listed in the figure below:
Figure 24: Percent of household having experienced different types of difficulties over the last
12 months prior the survey
Source: CFSVA 2011-12
4.7.2 Capacities to cope
This section analyze the shocks that households have been confronted with, the strategies they
adopted to cope with and the initiatives they have taken to prevent a similar shock from having
the same deteriorating impact in the future. A single question: ‘‘What do you do when you do
not have enough food, and do not have enough money to buy over the last month preceding
the survey” was asked to the household. The answers are a series of behaviors about how
households manage or ‘‘cope” with a shortfall in food consumption. Coping strategies have the
objective to fend off any potentially negative impact on the household’s welfare; however,
certain types of coping strategies have the potential to be damaging by increasing vulnerability.
0 10 20 30 40
Serious illness or accident of household member
Death of household member
Drought/irregular rains
Crop pests and disease
Other
Theft of valuables/animals
Reduced sale price of crops
High price of food
Livestock diseases
Insecurity
Crop pests and disease
Conflict

Figure 25: : Most frequently mentioned coping strategies used in response to “difficulties”
experienced over the last 30 days prior the survey
Source: CFSVA 2011-12
A reduced series of questions about frequency of household’s use of coping strategies with a shortfall in food consumption were asked: i) rely on less preferred and less expensive foods, ii) borrow food or rely on help from a friend or relative, iii) limit portion size at mealtimes, iv) restrict consumption by adults in order for small children to eat, and v) reduce number of meals eaten in a day. The recall period is the past seven days. These strategies are “weighted” by values that reflect their severity before being added together to create the coping strategy index (CSI). This simple numeric CSI score is often used as a proxy for food insecurity as it measures stress on the household, related to food access. The reduced CSI is very useful for geographic targeting because it characterizes the same set of behaviors. Higher CSI scores indicate a more serious food security situation. The mean CSI at national level is 8.410.
As shown in Figure 26, the CSI in Katanga, Sud-Kivu, Maniema, Province orientale, and Kasai Oriental are above the national average.
10 1st tercile of CSI (mean=1, median=0), 2nd tercile (mean=6, median=6); 3rd tercile (mean=19, Median=16)
0 5 10 15 20 25 30 35
Consumed seed stock held for next season
Rely on casual labour for food
Go entire day without eating
Harvest more than usual
Consume crop to be saved for next season
Reduced expenditures on health
Reduce expendittures on agricultural tools, seeds,…
Sold productive assets to buy food
Move more than usual to find job or food
Sold durable household goods
Sold more livetsock than usual
Sold household productive assets

Figure 26: Coping Strategy Index by province
Source: CFSVA 2011-12
4.8 Household Food Security Profiling
4.8.1 Food Insecure Households in the DRC: Where and how many are affected?
This section provides an overview of the magnitude and geographic distribution of food insecurity using household level data. Household food security is classified according to a combination of three indicators: (i) the food consumption score (FCS), which combines diet diversity, frequency of consumption and the relative nutritional importance of different food groups. It divides households into three groups: poor, borderline and acceptable food consumption, (ii) the wealth index, which is based on asset ownership and housing conditions, and divides households into terciles with the lowest generally referred to as poor, and (iii) the coping strategy index (CSI), which also divides households into terciles based on the severity of households’ regular behavioral responses to food shortage.
By combining the three indicators above households are subsequently divided into three food security groups:
Severely food insecure – i) households with poor food consumption and ii) households with borderline food consumption but in the lowest wealth tercile and in the most severe coping strategy index tercile;
Moderately food insecure – i) the remaining households with borderline food consumption and ii) households with acceptable food consumption but in the most severe coping strategy index tercile;
Food secure – the remaining households with acceptable food consumption. In this report food insecurity refers to households that are either severely or moderately food
insecure. The highest proportion of food insecure households is in Sud-Kivu where 64% of
0
2
4
6
8
10
12
14
16
18
Co
pin
g St
rate
gie
s In
de
x
Poor FC
Borderline FC
Acceptable FC
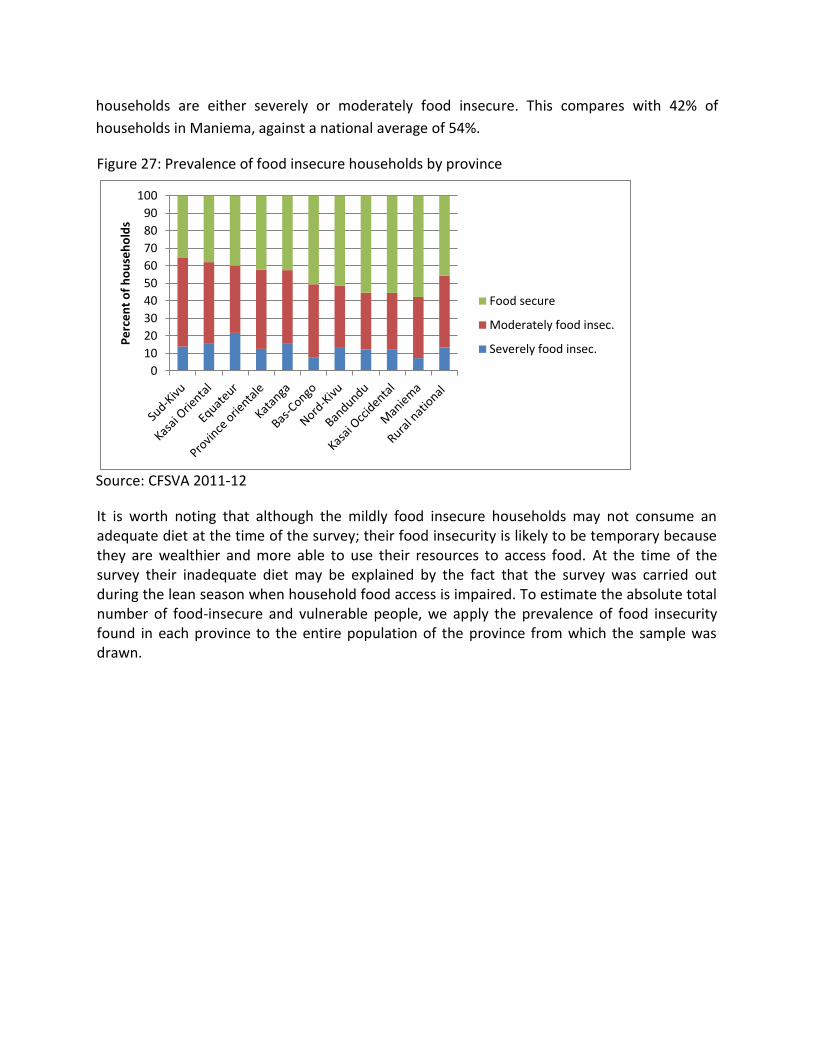
households are either severely or moderately food insecure. This compares with 42% of
households in Maniema, against a national average of 54%.
Figure 27: Prevalence of food insecure households by province
Source: CFSVA 2011-12
It is worth noting that although the mildly food insecure households may not consume an adequate diet at the time of the survey; their food insecurity is likely to be temporary because they are wealthier and more able to use their resources to access food. At the time of the survey their inadequate diet may be explained by the fact that the survey was carried out during the lean season when household food access is impaired. To estimate the absolute total number of food-insecure and vulnerable people, we apply the prevalence of food insecurity found in each province to the entire population of the province from which the sample was drawn.
0
10
20
30
40
50
60
70
80
90
100
Pe
rce
nt
of
ho
use
ho
lds
Food secure
Moderately food insec.
Severely food insec.

Table 17: Total number of rural population by food insecurity status and by province
Source: CFSVA 2011-12
The results in Table 17 indicate that in rural areas of DRC, about 28 million people are
considered either severely or moderately food insecure at the time of the survey. The province
with the highest absolute number food insecure people is Equateur because of its large rural
population combined with the relatively high proportion of food insecure households.
Maps 3 and 4 show the geographical distribution of the prevalence of food insecure
households. Tables reporting this indicator by territory are given in Annex B.
% Population % Population % Population
Equateur 22 1,612,887 38 2,855,287 60 4,468,174 7,439,518
Katanga 16 1,233,694 42 3,220,624 57 4,454,318 7,749,335
Province orientale 13 731,562 45 2,618,773 58 3,350,335 5,801,447
Bandundu 12 850,019 32 2,223,127 45 3,073,147 6,882,747
Sud-Kivu 14 646,768 51 2,364,630 64 3,011,398 4,673,181
Kasai Oriental 16 769,385 46 2,231,313 62 3,000,699 4,832,821
Kasai Occidental 12 720,972 33 1,954,009 45 2,674,981 6,003,099
Nord-Kivu 13 476,700 36 1,285,789 49 1,762,489 3,616,846
Bas-Congo 7 198,790 42 1,117,263 50 1,316,052 2,657,618
Maniema 7 141,419 35 669,627 42 811,046 1,921,454
Rural national 14 7,380,821 40 20,538,386 54 27,903,734 51,578,066
Rural
population in
2011
Province
Severely food
insecure (A)
Moderately food
insecure (B)
Total food insecure
(A+B)

Map 3: Prevalence of food insecure households at the provincial level.
Source: CFSVA 2011-12
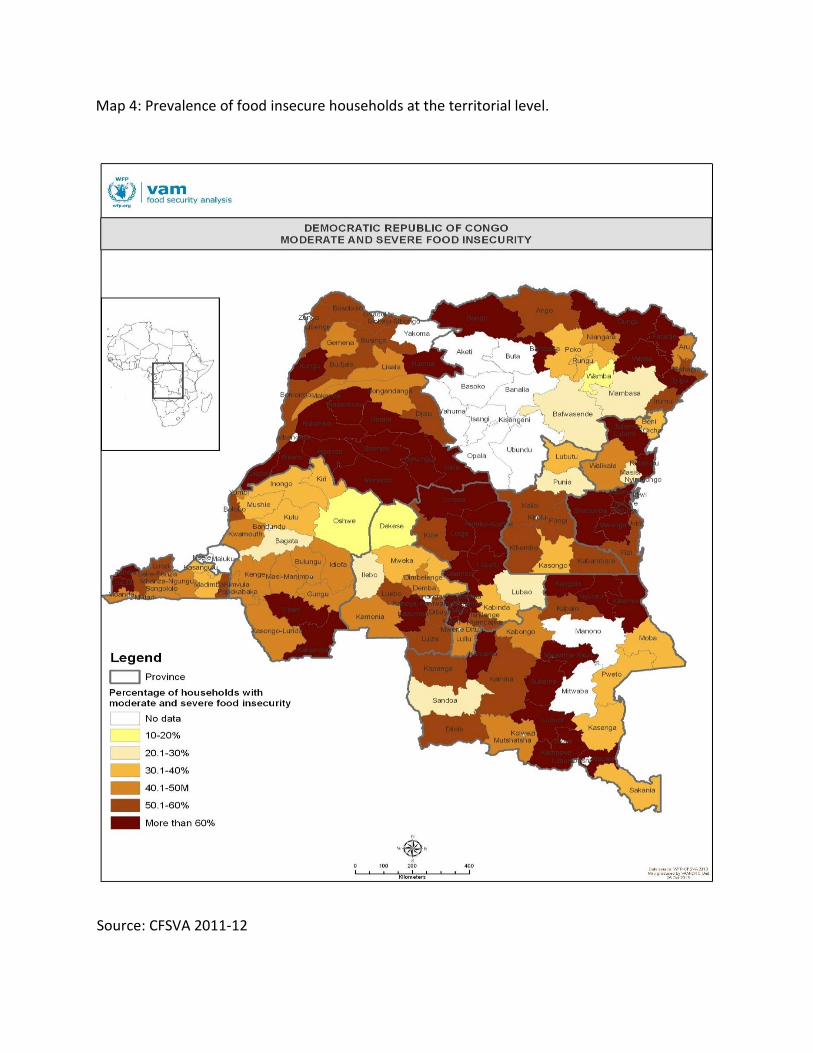
Map 4: Prevalence of food insecure households at the territorial level.
Source: CFSVA 2011-12
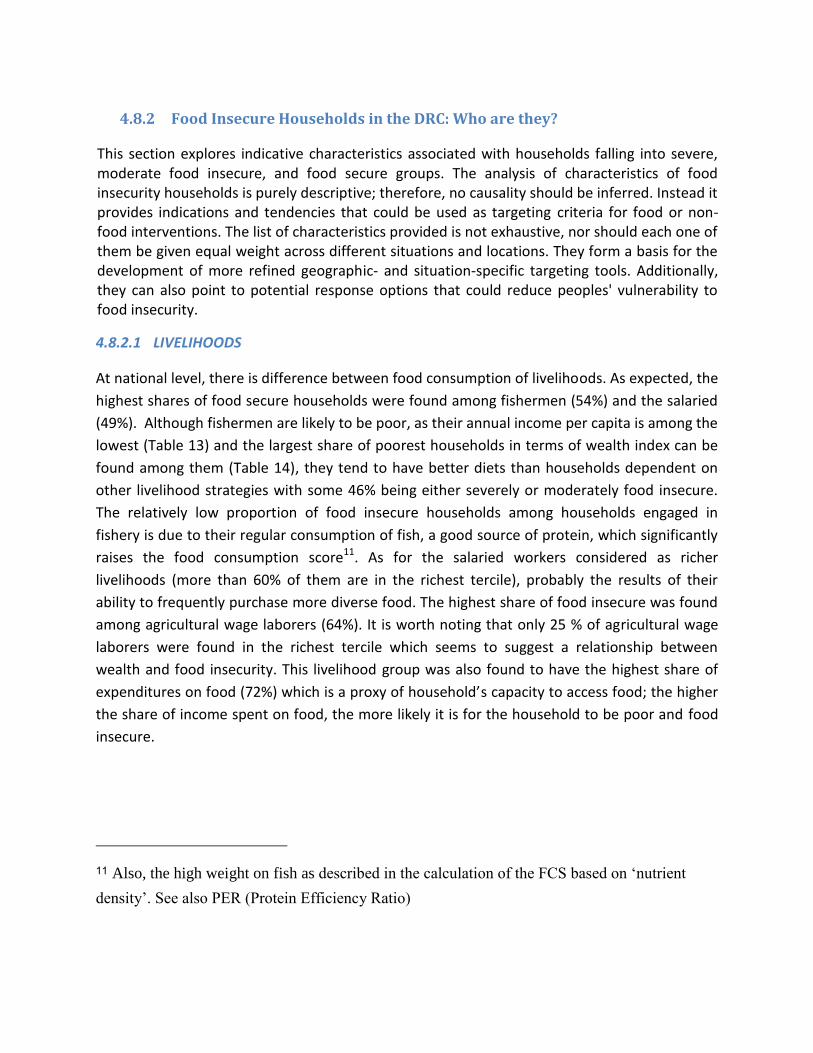
4.8.2 Food Insecure Households in the DRC: Who are they?
This section explores indicative characteristics associated with households falling into severe, moderate food insecure, and food secure groups. The analysis of characteristics of food insecurity households is purely descriptive; therefore, no causality should be inferred. Instead it provides indications and tendencies that could be used as targeting criteria for food or non-food interventions. The list of characteristics provided is not exhaustive, nor should each one of them be given equal weight across different situations and locations. They form a basis for the development of more refined geographic- and situation-specific targeting tools. Additionally, they can also point to potential response options that could reduce peoples' vulnerability to food insecurity.
4.8.2.1 LIVELIHOODS
At national level, there is difference between food consumption of livelihoods. As expected, the
highest shares of food secure households were found among fishermen (54%) and the salaried
(49%). Although fishermen are likely to be poor, as their annual income per capita is among the
lowest (Table 13) and the largest share of poorest households in terms of wealth index can be
found among them (Table 14), they tend to have better diets than households dependent on
other livelihood strategies with some 46% being either severely or moderately food insecure.
The relatively low proportion of food insecure households among households engaged in
fishery is due to their regular consumption of fish, a good source of protein, which significantly
raises the food consumption score11. As for the salaried workers considered as richer
livelihoods (more than 60% of them are in the richest tercile), probably the results of their
ability to frequently purchase more diverse food. The highest share of food insecure was found
among agricultural wage laborers (64%). It is worth noting that only 25 % of agricultural wage
laborers were found in the richest tercile which seems to suggest a relationship between
wealth and food insecurity. This livelihood group was also found to have the highest share of
expenditures on food (72%) which is a proxy of household’s capacity to access food; the higher
the share of income spent on food, the more likely it is for the household to be poor and food
insecure.
11 Also, the high weight on fish as described in the calculation of the FCS based on ‘nutrient
density’. See also PER (Protein Efficiency Ratio)
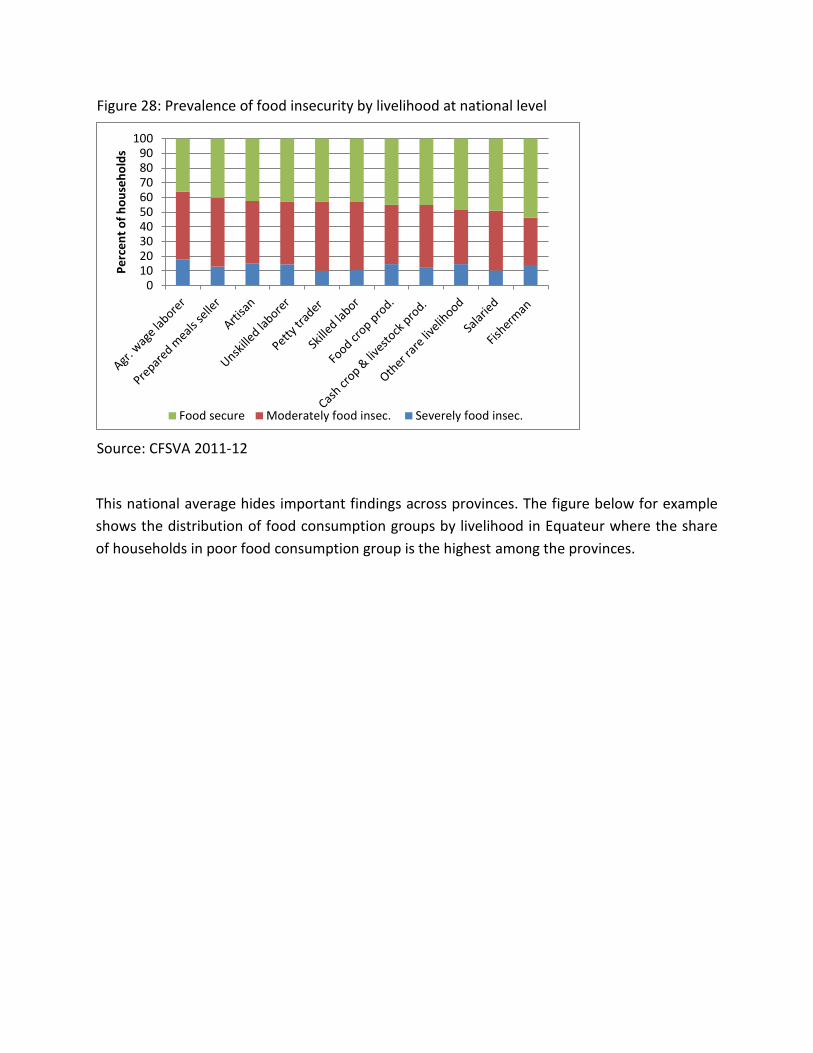
Figure 28: Prevalence of food insecurity by livelihood at national level
Source: CFSVA 2011-12
This national average hides important findings across provinces. The figure below for example
shows the distribution of food consumption groups by livelihood in Equateur where the share
of households in poor food consumption group is the highest among the provinces.
0102030405060708090
100
Pe
rce
nt
of
ho
use
ho
lds
Food secure Moderately food insec. Severely food insec.

Figure 29: Prevalence of food insecurity by livelihood in Equateur
Source: CFSVA 2011-12
While at national level, agricultural wage labor worker was the livelihood with the highest share
of household falling into food insecure group, in Equateur province this livelihood was among
the provinces with highest share of household being food secure. Similarly, while in Equateur
the skilled worker was the livelihood with greatest share of households being food insecure,
this livelihood is among the better off in terms of food security at national level.
After all, food insecurity and poor food consumption in particular are not necessarily related to the livelihood where the poor households are assumed to engage in. Further research by province is important to better understand the relationship between the two variables.
Number of income activities: Households with more or less number of activities do not differ in in their food security patterns. On average, the poor food consumption households engaged in slightly fewer income activities than their counterparts in borderline and acceptable food consumption group.
4.8.2.2 WEALTH, ASSETS AND EXPENDITURES
Wealth: While the most severe food insecurity was found among the poor households, this group has also the least prevalence of moderate food insecure households. One explanation is that households in the middle and non-poor groups employ more severe types of consumption coping strategies when they face shortfall of food.
0102030405060708090
100
Per
cen
t o
f h
ou
seh
old
s
Severely food insec. Moderately food insec. Food secure
Wealth is not automatically a shield against food insecurity; it is not always right to assume that a poor household is automatically food insecure. Indeed, 47% of poor households were found to be food secure at national level, slightly higher than the percentage in the non-poor household (45%). Similarly, 55% of the richest households were found to be food insecure. This percentage is not different from those of the households in the poor and the middle tercile as highlighted in the Figure 29. Again, the national prevalence tends to hide provincial differences which are also highlighted in the example of figures below. Maniema is the province with lowest prevalence of food insecure households.
At national level In Maniema
Source: CFSVA 2011-12
Improved and unimproved household amenities: As household amenities such as water and sanitation facilities form part of the wealth index, households' access to those amenities can be considered as a proxy for their wealth in addition to potential underlying factors. Lack of access to improved sanitation is another key disadvantage in DRC. While the national average for no access to a toilet facility is 10% and access to unimproved facility is 86%, the corresponding rates for the food unsecure households are just slightly lower (9% and 85%) which means that food secure households do not have more access to improved sanitation than their food insecure counterparts.
The CFSVA data shows significant difference between severe food insecure and secure households with regards to safe drinking water. In DRC, 66% of households use unsafe sources of drinking water. The corresponding rate for the severely food insecure households is 76%, compared to 67% for food secure households.
18 10 10
36 46 45
47 45 45
0
10
20
30
40
50
60
70
80
90
100
Poor Middle Non-poor
Severe food insec.
Moderate food insec.
Food secure
10 9 11
38 31 31
51 60 58
0
10
20
30
40
50
60
70
80
90
100
Poor Middle Non-poor
Severe food insec.Moderate food insec.Food secure
Figure 30 : Prevalence of food insecurity by wealth tercile
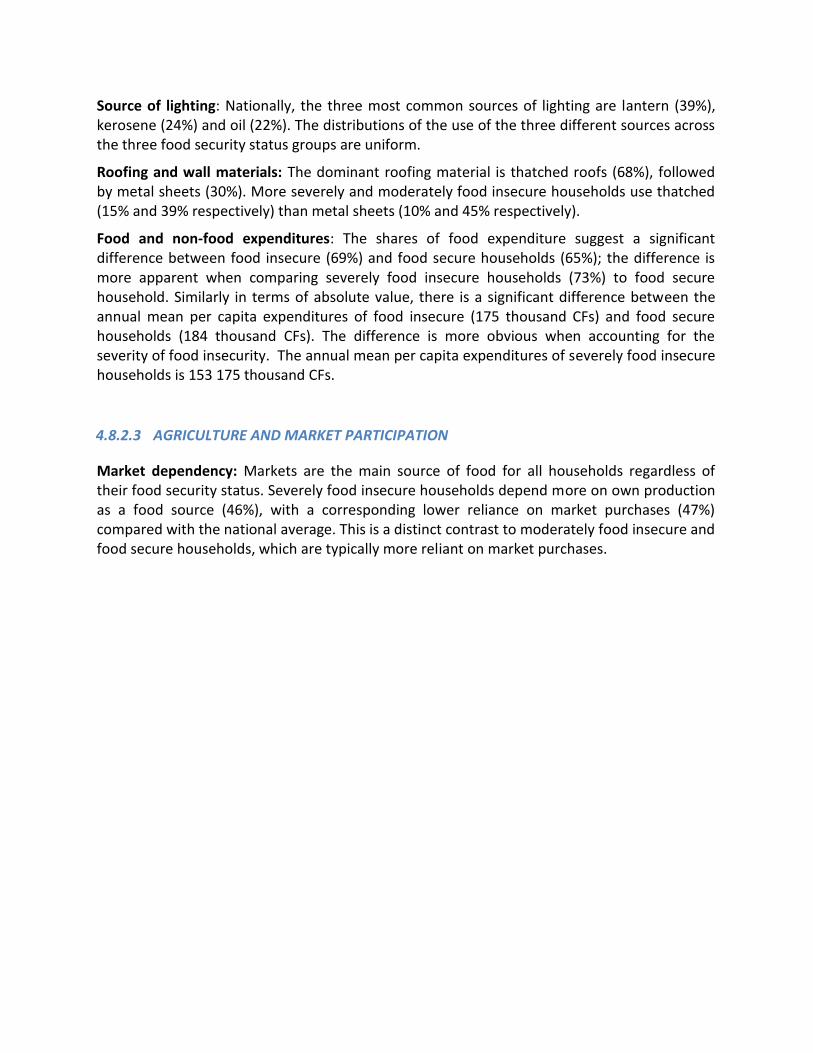
Source of lighting: Nationally, the three most common sources of lighting are lantern (39%), kerosene (24%) and oil (22%). The distributions of the use of the three different sources across the three food security status groups are uniform.
Roofing and wall materials: The dominant roofing material is thatched roofs (68%), followed by metal sheets (30%). More severely and moderately food insecure households use thatched (15% and 39% respectively) than metal sheets (10% and 45% respectively).
Food and non-food expenditures: The shares of food expenditure suggest a significant difference between food insecure (69%) and food secure households (65%); the difference is more apparent when comparing severely food insecure households (73%) to food secure household. Similarly in terms of absolute value, there is a significant difference between the annual mean per capita expenditures of food insecure (175 thousand CFs) and food secure households (184 thousand CFs). The difference is more obvious when accounting for the severity of food insecurity. The annual mean per capita expenditures of severely food insecure households is 153 175 thousand CFs.
4.8.2.3 AGRICULTURE AND MARKET PARTICIPATION
Market dependency: Markets are the main source of food for all households regardless of their food security status. Severely food insecure households depend more on own production as a food source (46%), with a corresponding lower reliance on market purchases (47%) compared with the national average. This is a distinct contrast to moderately food insecure and food secure households, which are typically more reliant on market purchases.

Figure 31: Prevalence of food insecurity by main sources of foods
Source: CFSVA 2011-12
Access to land for cultivation. While access to land for cultivation is clearly an asset and potentially a sign of wealth, it does not appear to significantly affect the status of food security among Congolese in general and their food consumption in particular. While 72% of households with an adequate diet have access to land for cultivation, 70% of households with poor food consumption also do. Clearly, access to land does not mean much in itself; what matters is the way that land is accessed, its size, available inputs and source of labor, the level of market participation that influences the cultivator's wealth and food security status. For both rural households with poor and acceptable high food consumption, the major source of access to land is ownership of the land (86%), followed by renting (11%).
Size of land cultivated. Of all households who cultivated and are severely food insecure, 79% of them cultivated less than 2 ha of land compared to 76% of households who are moderately food insecure or food secure. In terms of food consumption, of all households who cultivated and with poor food consumption, 78% of them cultivated less than 2 ha of land compared to 73% of households who had acceptable diets. This finding may be an indication that the size of cultivated land is positively associated with the pattern of a household's food consumption. In other words, the smaller the size of cultivated land, the more likely the quality of the diet will deteriorate. It appears that the cut-off of 2 ha can be safely used as one criterion for targeting the most vulnerable smallholders. However, using average land size as an indicator of geographical patterns of food security might be misleading. Average holding sizes might be smallest in the densely populated province, even below 2 ha, and yet those are the provinces where the population is least affected by food insecurity in general and inadequate food consumption in particular.
46,8
50,5
48,5
49,1
45,5
42,5
44,5
43,8
0 10 20 30 40 50 60 70 80 90 100
Severely food insec.
Moderately food insec.
Food secure
Rural national
Market Own production
Fishing, hunting & gathering Inkind payment
Borrowing Gifts
Food aid
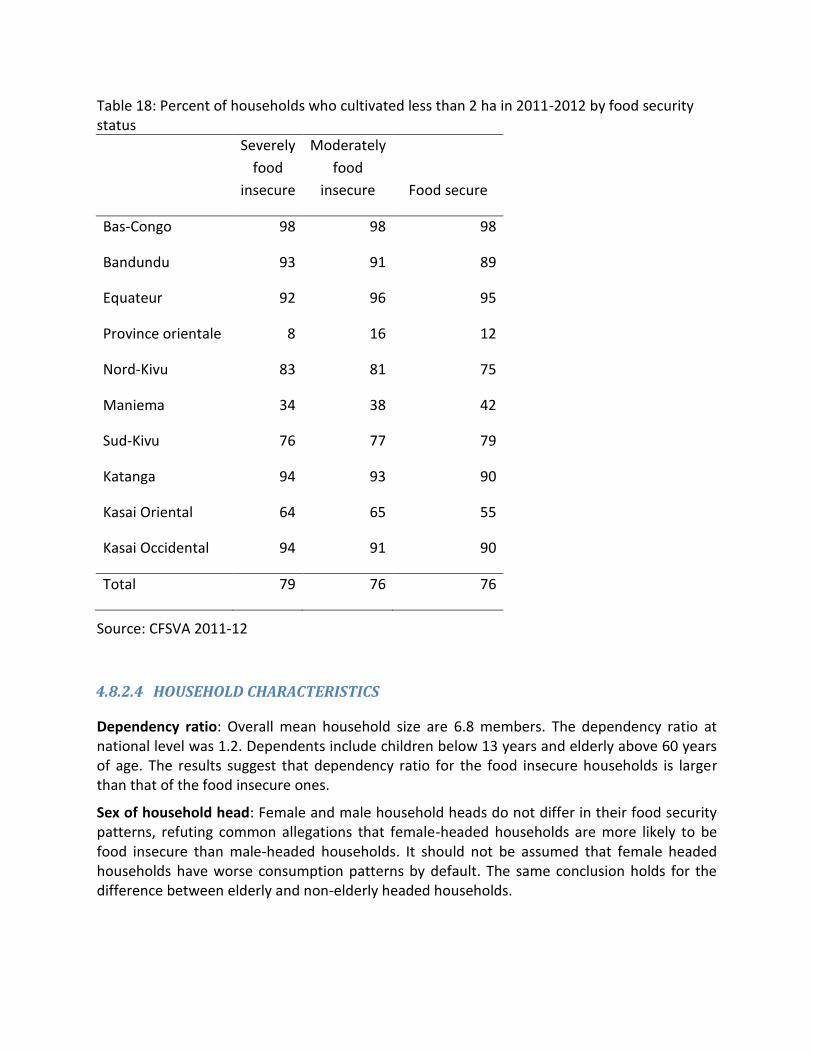
Table 18: Percent of households who cultivated less than 2 ha in 2011-2012 by food security status
Severely
food
insecure
Moderately
food
insecure Food secure
Bas-Congo 98 98 98
Bandundu 93 91 89
Equateur 92 96 95
Province orientale 8 16 12
Nord-Kivu 83 81 75
Maniema 34 38 42
Sud-Kivu 76 77 79
Katanga 94 93 90
Kasai Oriental 64 65 55
Kasai Occidental 94 91 90
Total 79 76 76
Source: CFSVA 2011-12
4.8.2.4 HOUSEHOLD CHARACTERISTICS
Dependency ratio: Overall mean household size are 6.8 members. The dependency ratio at national level was 1.2. Dependents include children below 13 years and elderly above 60 years of age. The results suggest that dependency ratio for the food insecure households is larger than that of the food insecure ones.
Sex of household head: Female and male household heads do not differ in their food security patterns, refuting common allegations that female-headed households are more likely to be food insecure than male-headed households. It should not be assumed that female headed households have worse consumption patterns by default. The same conclusion holds for the difference between elderly and non-elderly headed households.

Table 19: Percent of female and male, elderly and non-elderly household heads by food security
status
Female HH
head Male head HH
Elderly
HH
head
Non-elderly
head
Severely food
insec. 13 14 14 13
Moderately food
insec. 42 41 42 41
Food secure 45 46 44 46
Source: CFSVA 2011-12
- Education of household head: In line with previous research, the educational background of the household head is positively associated with food consumption. In other words, the more educated the household head, the better is the household's food security status While only 13% of household heads who attended primary school are found in the severely food insecure households, 41 % and 46% of them belong to the moderately food insecure and food secure households, respectively.
The food consumption score – wealth – CSI – based classification should be compatible with
nutritional status of household members. Nutrition surveys give the best information about the
status of individual (usually children under the age of five years). However, nutrition surveys
themselves provide little information about causal factors unless complemented with other
information such as health status indicators.
5 HEALTH AND NUTRITION
This chapter presents the nutrition and health situation of the Democratic Republic of The
Congo (DRC) using secondary data from the 2007 Demographic and Health Survey (DHS) and
the 2001 and 2010 Multiple Indicator Cluster Surveys from UNICEF. The analysis of those three
different surveys describes the trend in nutrition, health status, and intervention among socio
economic and demographic groups, and points the main determinants of malnutrition.
5.1 Health and Food Security: Conceptual Framework
From the definition of food security, it can be inferred that good health requires a good state of
food security. Inadequate diet increases the risk of illness and mortality. Food security is in turn
determined by a combination of factors at the individual and household, and community levels.
To achieve food security, individuals need the physical ability to produce enough food or the
financial mean to access it. By reducing productivity, poor health status prevents individuals
and households to achieve food security. Food security and health are interrelated and this
relation can be explored through social and economic phenomenon.
5.1.1 Food insecurity, poverty and health
The relationship between poverty and food insecurity is bi-directional and can often lead to the establishment of a vicious circle (Harrigan, 2008). Lacking financial means to access food, poor households are more likely to be food unsecured and consequently they are exposed to health problems. Food insecurity in turn worsens poor household’s situation by forcing them to use coping mechanisms such as asset sales, which make them poorer and prevent them to escape the poverty trap.
Poverty also denies individuals access to health care, safe water, sanitation and education, which are known to be the important determinants of health status.
5.1.2 Food insecurity, nutrition, and health
Food insecurity implies the inability to access not only sufficient food but also nutritious food
that meets human dietary needs for healthy life. Poor diet intake leads to protein-energy
malnutrition and micro nutrient deficiency. These two forms of malnutrition are very common
in developing countries and are considered major causes of death and illness of millions people,
especially pregnant women and children (Muller & Krawinkel, 2005). In DRC, while about 15
percent of households suffer from protein deficiency, at least 50 percent of the population is
deficient in vitamin B12, calories, riboflavin, iron, vitamin E, folate, and zinc (Ulimwengu et al,
2012).
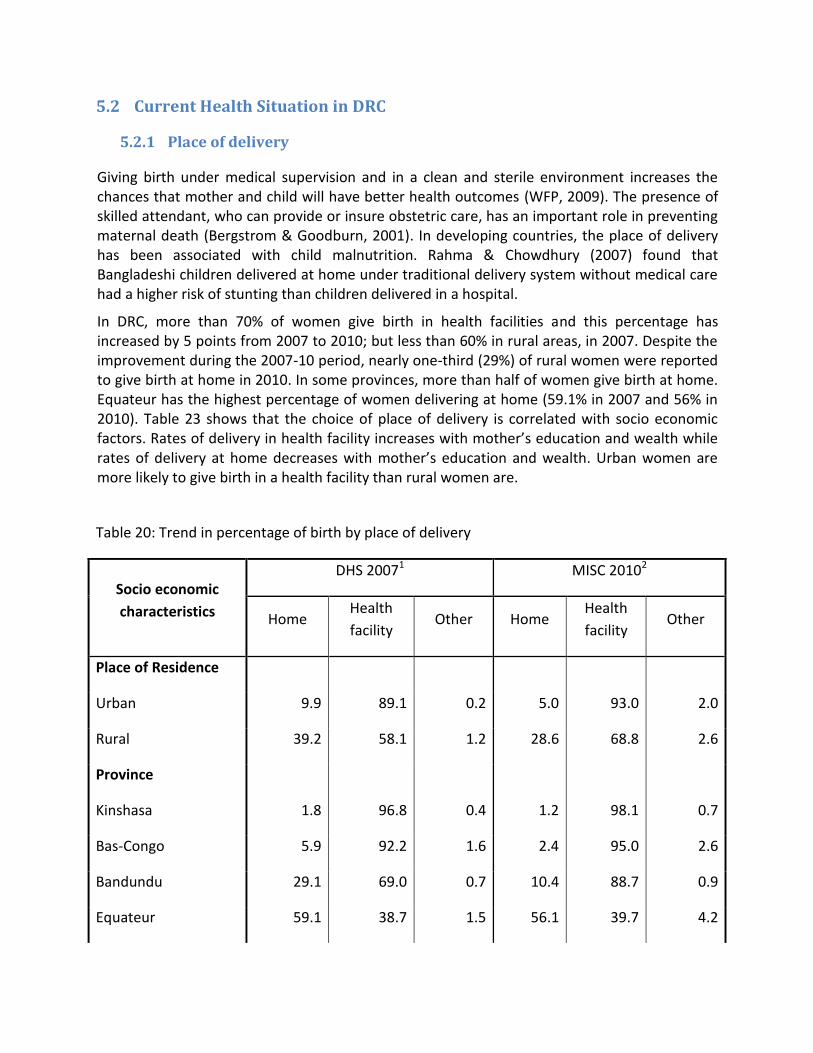
5.2 Current Health Situation in DRC
5.2.1 Place of delivery
Giving birth under medical supervision and in a clean and sterile environment increases the chances that mother and child will have better health outcomes (WFP, 2009). The presence of skilled attendant, who can provide or insure obstetric care, has an important role in preventing maternal death (Bergstrom & Goodburn, 2001). In developing countries, the place of delivery has been associated with child malnutrition. Rahma & Chowdhury (2007) found that Bangladeshi children delivered at home under traditional delivery system without medical care had a higher risk of stunting than children delivered in a hospital.
In DRC, more than 70% of women give birth in health facilities and this percentage has increased by 5 points from 2007 to 2010; but less than 60% in rural areas, in 2007. Despite the improvement during the 2007-10 period, nearly one-third (29%) of rural women were reported to give birth at home in 2010. In some provinces, more than half of women give birth at home. Equateur has the highest percentage of women delivering at home (59.1% in 2007 and 56% in 2010). Table 23 shows that the choice of place of delivery is correlated with socio economic factors. Rates of delivery in health facility increases with mother’s education and wealth while rates of delivery at home decreases with mother’s education and wealth. Urban women are more likely to give birth in a health facility than rural women are.
Table 20: Trend in percentage of birth by place of delivery
Socio economic
characteristics
DHS 20071 MISC 20102
Home Health
facility Other Home
Health
facility Other
Place of Residence
Urban 9.9 89.1 0.2 5.0 93.0 2.0
Rural 39.2 58.1 1.2 28.6 68.8 2.6
Province
Kinshasa 1.8 96.8 0.4 1.2 98.1 0.7
Bas-Congo 5.9 92.2 1.6 2.4 95.0 2.6
Bandundu 29.1 69.0 0.7 10.4 88.7 0.9
Equateur 59.1 38.7 1.5 56.1 39.7 4.2
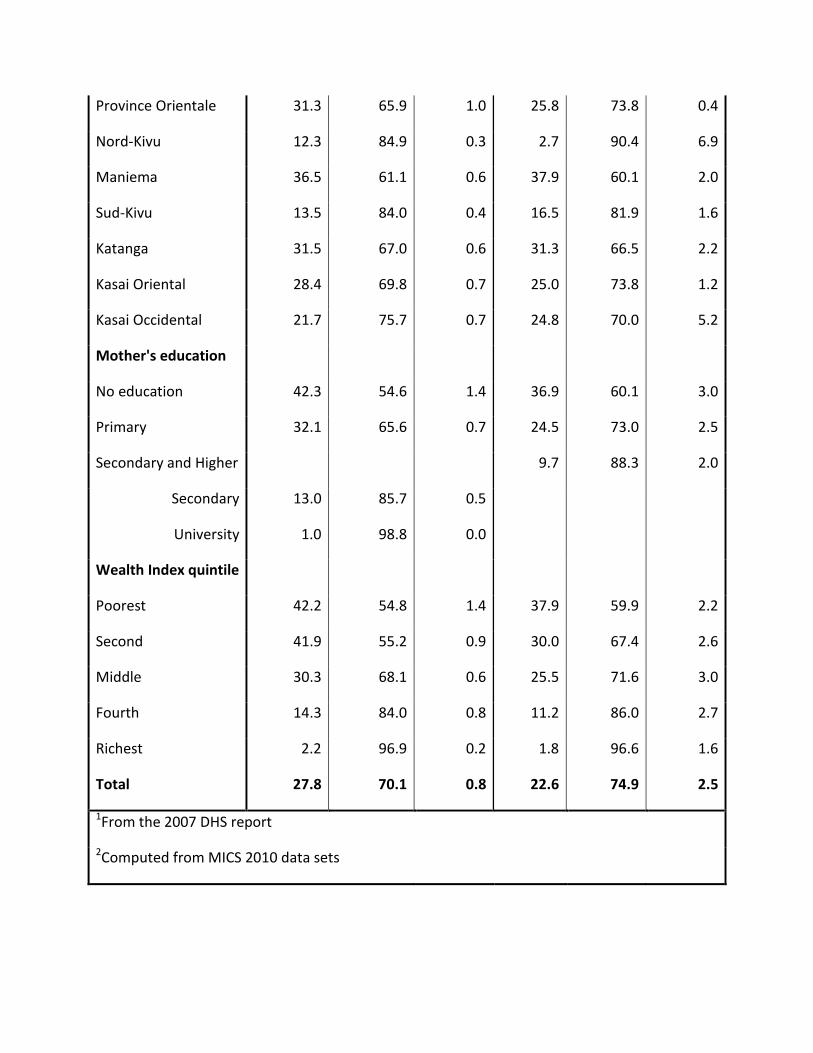
Province Orientale 31.3 65.9 1.0 25.8 73.8 0.4
Nord-Kivu 12.3 84.9 0.3 2.7 90.4 6.9
Maniema 36.5 61.1 0.6 37.9 60.1 2.0
Sud-Kivu 13.5 84.0 0.4 16.5 81.9 1.6
Katanga 31.5 67.0 0.6 31.3 66.5 2.2
Kasai Oriental 28.4 69.8 0.7 25.0 73.8 1.2
Kasai Occidental 21.7 75.7 0.7 24.8 70.0 5.2
Mother's education
No education 42.3 54.6 1.4 36.9 60.1 3.0
Primary 32.1 65.6 0.7 24.5 73.0 2.5
Secondary and Higher
9.7 88.3 2.0
Secondary 13.0 85.7 0.5
University 1.0 98.8 0.0
Wealth Index quintile
Poorest 42.2 54.8 1.4 37.9 59.9 2.2
Second 41.9 55.2 0.9 30.0 67.4 2.6
Middle 30.3 68.1 0.6 25.5 71.6 3.0
Fourth 14.3 84.0 0.8 11.2 86.0 2.7
Richest 2.2 96.9 0.2 1.8 96.6 1.6
Total 27.8 70.1 0.8 22.6 74.9 2.5
1From the 2007 DHS report
2Computed from MICS 2010 data sets
5.2.2 Health interventions: Insecticide Treated Net (ITN) usage, Vitamin A
supplementation and Deworming
5.2.2.1 ITN usage
Malaria constitutes a major health problem in DRC. It is reported to be the principal cause of morbidity and mortality, which the greatest burden falls on pregnant women and children under five (PMI, 2012). In recent years, the country has received from various donors funding for malaria prevention programs. One of the key policy interventions of these programs is the distribution of ITN.
As shown in Table 23 below, the use of ITN in DRC has considerably increased in the last decade. From 2001to 2007, the percentage of under-five sleeping in an ITN went from 0.7 to 10.9 and reaches 38%in 2010. Despite this improvement, more than half of the under-five children population does not sleep under ITN. In only four provinces (Kinshasa, Equateur, Maniema, and Province Orientale), the percentage of under five sleeping in an ITN is more than 50 and the lowest rates are recorded in the two Kasais. ITN use for children under five is correlated with socio-economic characteristics; indeed, it increases with health status and is higher in urban than in rural areas.
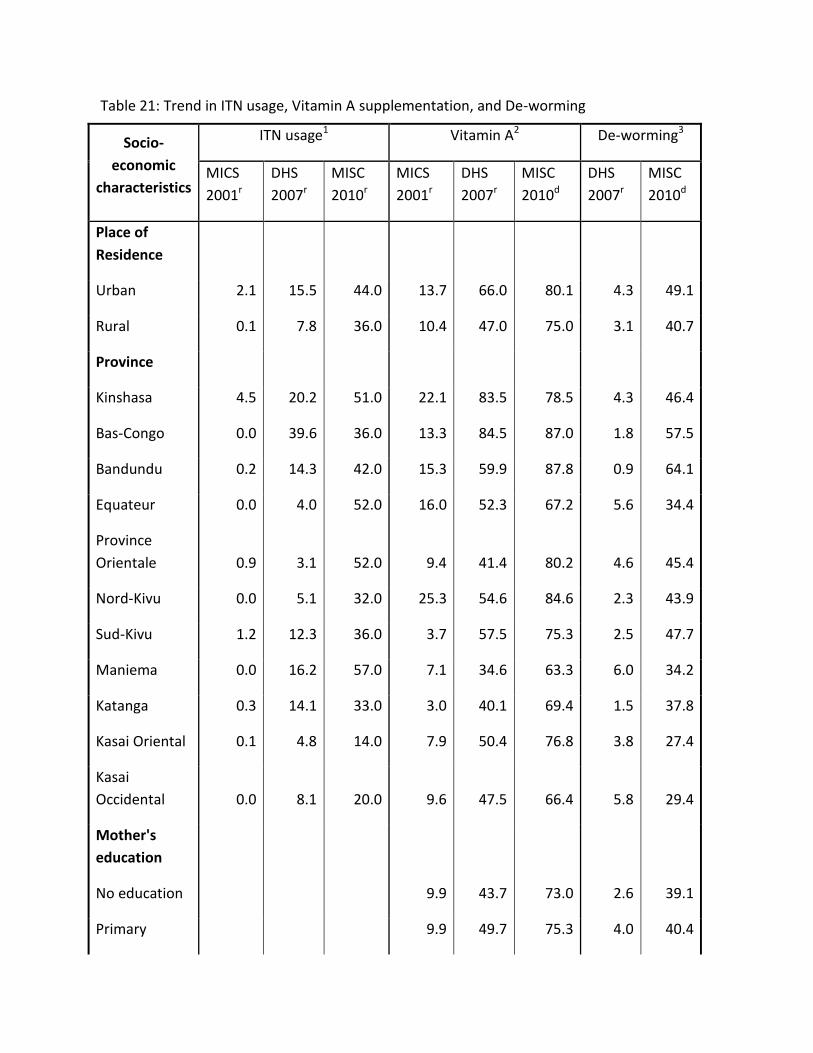
Table 21: Trend in ITN usage, Vitamin A supplementation, and De-worming
Socio-
economic
characteristics
ITN usage1 Vitamin A2 De-worming3
MICS
2001r
DHS
2007r
MISC
2010r
MICS
2001r
DHS
2007r
MISC
2010d
DHS
2007r
MISC
2010d
Place of
Residence
Urban 2.1 15.5 44.0 13.7 66.0 80.1 4.3 49.1
Rural 0.1 7.8 36.0 10.4 47.0 75.0 3.1 40.7
Province
Kinshasa 4.5 20.2 51.0 22.1 83.5 78.5 4.3 46.4
Bas-Congo 0.0 39.6 36.0 13.3 84.5 87.0 1.8 57.5
Bandundu 0.2 14.3 42.0 15.3 59.9 87.8 0.9 64.1
Equateur 0.0 4.0 52.0 16.0 52.3 67.2 5.6 34.4
Province
Orientale 0.9 3.1 52.0 9.4 41.4 80.2 4.6 45.4
Nord-Kivu 0.0 5.1 32.0 25.3 54.6 84.6 2.3 43.9
Sud-Kivu 1.2 12.3 36.0 3.7 57.5 75.3 2.5 47.7
Maniema 0.0 16.2 57.0 7.1 34.6 63.3 6.0 34.2
Katanga 0.3 14.1 33.0 3.0 40.1 69.4 1.5 37.8
Kasai Oriental 0.1 4.8 14.0 7.9 50.4 76.8 3.8 27.4
Kasai
Occidental 0.0 8.1 20.0 9.6 47.5 66.4 5.8 29.4
Mother's
education
No education
9.9 43.7 73.0 2.6 39.1
Primary
9.9 49.7 75.3 4.0 40.4

Secondary and
Higher
15.1 80.2 49.2
Secondary
66.5 3.7
University
85.1 4.6
Non formal
program
15.0
Wealth Index
quintile
Poorest 0.0 6.5
8.2 44.4 72.0 3.0 38.7
Second 0.1 7.3
12.8 41.8 74.7 3.3 38.1
Middle 0.2 9.9
10.8 57.7 77.0 3.9 41.9
Fourth 0.4 12.1
10.5 60.1 78.4 3.8 47.5
Richest 3.1 21.1
15.1 73.0 80.8 4.0 50.3
Total 0.7 10.9 38.0 11.5 54.6 75.6 3.6 42.5
1Under-five sleeping under ITN the night preceding the survey (%)
2Under-five who received vitamin-A supplementation in the last six months
preceding the survey(%)
3Under-five who received de-worming in the last six months preceding
the survey (%)
r From report
d From data sets
Sources: MICS, 2001; MICS, 2010; DHS, 2007.
In 2012, one out of two households (51%) possessed at least one ITN. This proportion was
higher in urban area (58%) than in rural areas (48%). In four provinces (Bas-Congo (42%),
Katanga (36%), Kasai Oriental(19) and Kasai Occidental (28%) the percentage of household
possessing a ITN is less than 50. The lowest rate of ITN possession was recorded in Kasai
Oriental (19%), while the highest was in Maniema (84%). In all provinces, the percentage of

women or children sleeping under ITN is lower that the percentage of household ITN
possession.

Table 22: ITN usage in 2010
Insecticide Treated
Net (ITN) use
Household with at
least one ITN (%)
Pregnant women
sleeping under ITN the
night preceding the
survey (%)
Under-five sleeping
under ITN the night
preceding the survey
(%)
DRC 51 43 38
Urban 58 43 44
Rural 48 42 36
Kinshasa 71 42 51
Bas-Congo 42 33 36
Bandundu 52 43 42
Equateur 66 53 52
Province Oriental 72 62 52
Nord-Kivu 51 39 32
Maniema 84 67 57
Sud-Kivu 50 57 36
Katanga 36 35 33
Kasai Oriental 19 15 14
Kasai Occidental 28 24 20
Source: MICS, 2010
5.2.2.2 Vitamin A supplementation and Deworming
Ulimwengu et al (2012) showed that at the national level, 12% of households suffer from
Vitamin A deficiency with Bandundu (40%), Kasai Occidental (20%), Sud-Kivu (15%) and Nord-
Kivu experiencing nutrient deficiencies that exceed the national level. Vitamin A deficiency can
affect the immune system and increases the risk of blindness. Since 1987, WHO has advocated
the routine administration of vitamin A in countries where vitamin A deficiency is a problem. In
DRC, vitamin A is administrated to children during immunization campaign. Since 2005, the
Congolese government organizes twice a year, a Vitamin A campaign along with mebendazole
deworming.
As shown in Table 24, the coverage of Vitamin A supplementation and de-worming has increased considerably in the last decade. In 2010 more than 75% of the under five population received vitamin A supplementation and more than 42% were dewormed. The percentages of children who received vitamin A supplementation and deworming is higher in urban than rural area; and increase with the economic status of the household and mother’s education. The provinces with the least coverage in vitamin A supplementation in 2010 were Equateur (67.2%), Maniema (63.3), and Kasai Occidental (66.4%).
5.2.3 Disease prevalence among children and Regional pattern of childhood
disease
Results from the MISC 2010 indicate that 27% of children had fever in the two weeks preceding
the survey while 18% was reported having diarrhea. Pneumonia has the lowest prevalence
among the three diseases (6%) although higher rates were recorded in the two Kivu (10%), in
Katanga and in Kasai Occidental (9%). As shown in Table 26, the prevalence of these diseases is
slightly higher in rural than urban areas. The two Kasai provinces display higher rates for fever
and diarrhea.
5.2.4 Access to health care
Nationally, less than half children receive treatment for fever (39%), diarrhea (39%), or
pneumonia (42%). In only three provinces (Kinshasa, Bas-Congo and Maniema), more than 50%
of children received adequate treatment for fever. The percentage of children seeking care for
diarrhea exceeds 50 in Bas-Congo and Bandundu. Treatment for pneumonia is sought by more
than half of children in Bas-Congo, Katanga and Kasai Oriental
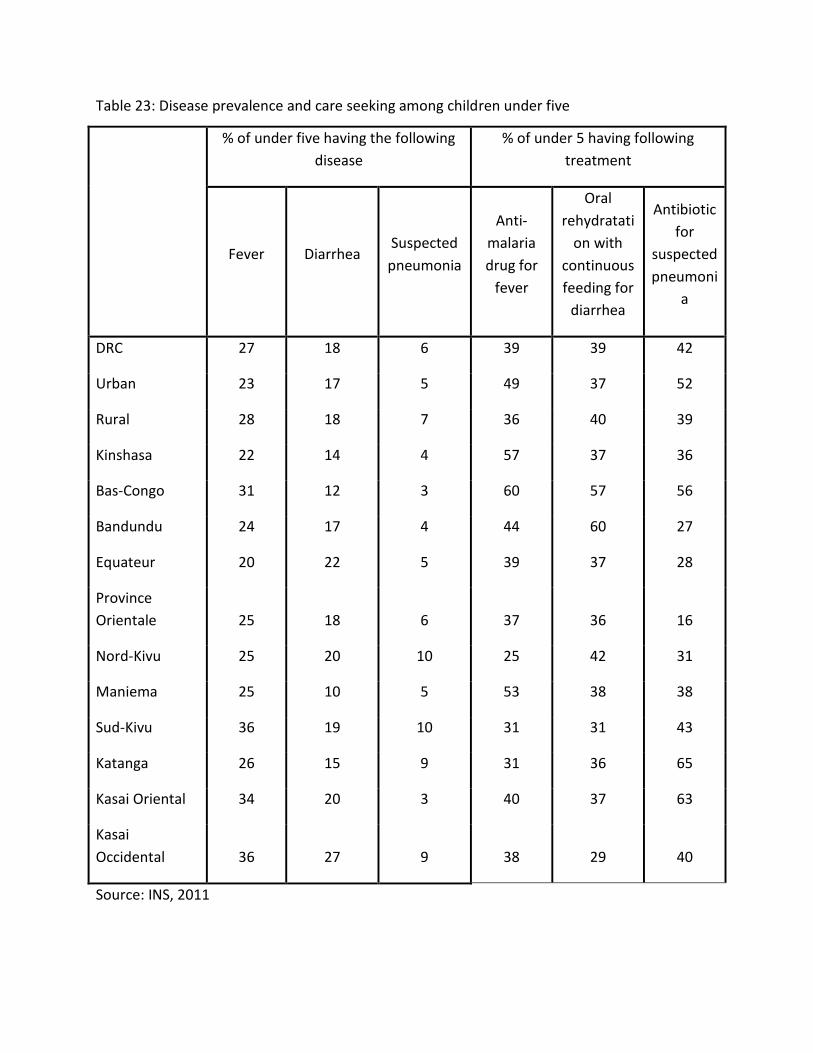
Table 23: Disease prevalence and care seeking among children under five
% of under five having the following
disease
% of under 5 having following
treatment
Fever Diarrhea Suspected
pneumonia
Anti-
malaria
drug for
fever
Oral
rehydratati
on with
continuous
feeding for
diarrhea
Antibiotic
for
suspected
pneumoni
a
DRC 27 18 6 39 39 42
Urban 23 17 5 49 37 52
Rural 28 18 7 36 40 39
Kinshasa 22 14 4 57 37 36
Bas-Congo 31 12 3 60 57 56
Bandundu 24 17 4 44 60 27
Equateur 20 22 5 39 37 28
Province
Orientale 25 18 6 37 36 16
Nord-Kivu 25 20 10 25 42 31
Maniema 25 10 5 53 38 38
Sud-Kivu 36 19 10 31 31 43
Katanga 26 15 9 31 36 65
Kasai Oriental 34 20 3 40 37 63
Kasai
Occidental 36 27 9 38 29 40
Source: INS, 2011
5.2.5 Child feeding practices
Worldwide, over two-third of malnutrition related death is often associated with feeding
practices (WHO, 2003). “Infant and young child feeding practices directly affect the nutritional
status of children under two years of age and, ultimately, impact child survival. Improving infant
and young child feeding practices in children 0–23 months of age is therefore critical to
improved nutrition, health, and development of children” (WHO et al., 2008).
WHO and UNICEF developed, in 2003, the Global Strategy of Infant and Young Child Feeding to
increase awareness about the impact of feeding practices on child health and growth (WHO &
UNICEF, 2003). This strategy should be implemented by government as a comprehensive policy,
in the context of national policies for nutrition, child and reproductive health, and poverty
reduction.
The Global Strategy of Infant and Young Child Feeding recommends exclusive breastfeeding
from birth to six month of age in order to provide infant with necessary energy and nutrients,
as well as maternal antibody to enhance immune system. After six months, complementary
food should be introduced but breastfeeding should continue until the child is two years old.
In DRC, only 37% of the child population under six months of age is exclusively breastfed. More
than 80% of children are still breastfed at 1 year old. The percentage of children still breastfed
at one year is higher in rural (90%) than urban areas (78%).

Table 24: Child feeding practices
Exclusively
breastfed
(at least 6
months)
(%)
Still
breastfed
at 1
year (%)
Still
breastfed
at 2years
(%)
Introduction
of Solid or
soft food in
children
aged 6-8
months (%)
Required
number of
meals in
children
aged 6-
23 month
(%)
Adequately
breastfed
children 0-
23 months
(%)
Prevalence
of low
birth
weight (%)
DRC 37 87 53 52 22 50 10
Urban 37 78 29 56 20 47 11
Rural 37 90 61 50 22 51 9
Kinshasa 23 74 18 58 18 38 12
Bas-Congo 20 92 49 44 16 41 12
Bandundu 30 91 81 79 42 64 7
Equateur 41 86 45 28 12 31 6
Province
Orientale 51 76 48 54 24 57 9
Nord-Kivu 58 87 67 55 23 57 13
Maniema 57 90 59 56 37 62 9
Sud-Kivu 39 91 62 40 20 50 10
Katanga 31 89 42 38 15 44 10
Kasai
Oriental 46 88 54 72 19 63 12
Kasai
Occidental 30 97 76 80 29 66 7
Source: INS, 2011

5.3 Child Nutrition
For decades, the nutritional situation of children in DRC has been one of the worst in the world. In 2007, 45 percent of children under five were stunted. In terms of IFPRI’s Global Hunger Index12, the DRC stands out among the six countries in which the hunger situation worsened. From 2010-2011, its GHI rose by about 63 percent (von Grebmer, et al., 2011).
To assess the nutritional status of children, anthropometric measures are used. Children weight and height are compared to a reference population with respect to their age. Anthropometric measures are usually expressed in terms of standard deviations from the median of the reference population, also called “z-score.” In 2006, WHO sets standard on child growth, which are used to assess children nutritional status. The three anthropometric measures are:
Height- for- age (HAZ): a measure of linear growth and its deficit generally indicates
long-term, cumulative effects of inadequate nutrition and poor health status. Children
whose height-for-age are more than two standard deviations below the median of the
reference population are considered to be stunted.
Weight- for- Height (WHZ): a measure of acute or short-term exposure to a negative environment. It is sensitive to changes in calorie intake or the effects of disease. Children whose weight- for- height are more than two standard deviations below the median of the reference population are considered to be wasted. The indicator may reveal significant seasonal shifts associated with changes in the availability of food or prevalence of disease.
Weight-for-age (WAZ): a measure of both acute and chronic malnutrition. Children
whose height-for-age are more than two standard deviations below the median of the
reference population are considered to be underweight.
In DRC, stunting is the most prevalent form of malnutrition. As shown in Table 28 below, 43% of children under five were stunted in 2010, while only 9% were wasted and 10 % underweight. While the prevalence of wasting and underweight has decreased since 2001, the percentage of stunted children has increased from 2001 to 2007 and slightly decreased in 2010. For all three indicators, girls display better nutritional status than boys do. The provinces the most affected by stunting are the two Kivu and Kasai Occidental. In those provinces, the prevalence of stunting was higher than 50% in 2010.
From, 2001 to 2010, the prevalence of stunting has been higher in rural than urban area. The difference in nutritional status between urban and rural children in the developing world has often been proved to be significant, especially for stunting. Smith, Ruel, & Ndiaye, 2005
12
The GHI is an indicator of hunger designed to measure and track hunger globally, by country and by region. It is
calculated by combining three other hunger measures: undernourishment, child underweight and child
mortality.

suggests that lower urban malnutrition is due to a series of more favorable socioeconomic conditions, leading to better caring practices for children and their mothers.
Table 25: Trend in prevalence of under five malnutrition
Socio economic
characteristics
% of Stunting % of Wasting % of Underweight
MICS
2001r
DHS
2007r
MICS
2010d
MICS
2001r
DHS
2007r
MICS
2010d
MICS
2001r
DHS
2007r
MICS
2010d
Sex
Male 40.3 48.1 47.7 14.8 11.4 9.5 32.9 27.5 26.6
Female 36.0 43.1 39.6 12.1 8.7 7.5 29.2 22.7 21.1
Age in month
<6 4.7 16.1 15.7 8.7 16.8 10.9 3.8 10.1 1.1
6 11 14.2 28.5 17.8 14.4 22.6 1.7
6- 8
13.3
16.4
16.8
9- 11
32.9
19.5
23.1
12- 23 33.4 43.3 21.8 9.8 36.4 1.1
12- 17
31.4
13.0
18.1
18- 23
42.6
8.7
23.0
24- 35 41.4 55.2 51.7 12.6 8.9 6.8 32.3 26.0 26.8
36- 47 52.7 54.0 51.5 8.5 7.3 5.5 35.8 28.5 24.4
48- 59 58.7 57.0 55.1 9.0 6.6 6.3 38.4 33.0 29.7
Place of
Residence
Urban 28.9 36.7 34.0 12.1 10.3 7.0 22.0 18.9 17.0
Rural 42.6 51.5 47.0 14.1 9.9 9.0 35.5 29.3 27.0
Province
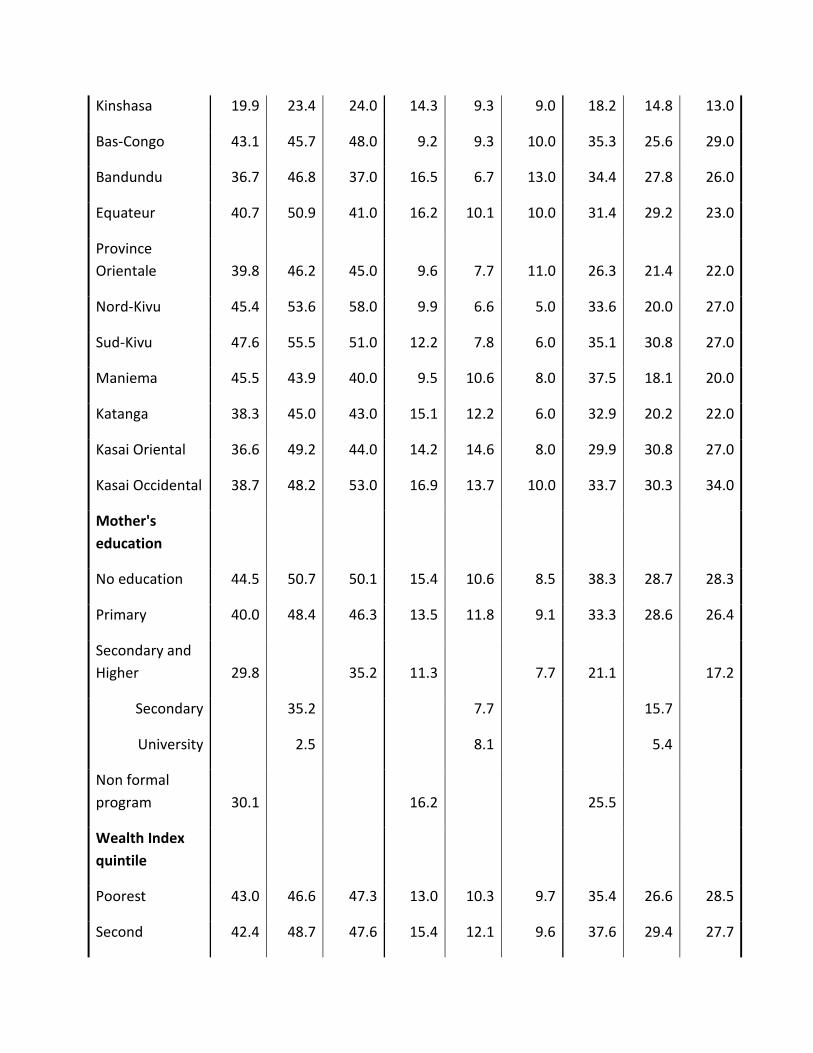
Kinshasa 19.9 23.4 24.0 14.3 9.3 9.0 18.2 14.8 13.0
Bas-Congo 43.1 45.7 48.0 9.2 9.3 10.0 35.3 25.6 29.0
Bandundu 36.7 46.8 37.0 16.5 6.7 13.0 34.4 27.8 26.0
Equateur 40.7 50.9 41.0 16.2 10.1 10.0 31.4 29.2 23.0
Province
Orientale 39.8 46.2 45.0 9.6 7.7 11.0 26.3 21.4 22.0
Nord-Kivu 45.4 53.6 58.0 9.9 6.6 5.0 33.6 20.0 27.0
Sud-Kivu 47.6 55.5 51.0 12.2 7.8 6.0 35.1 30.8 27.0
Maniema 45.5 43.9 40.0 9.5 10.6 8.0 37.5 18.1 20.0
Katanga 38.3 45.0 43.0 15.1 12.2 6.0 32.9 20.2 22.0
Kasai Oriental 36.6 49.2 44.0 14.2 14.6 8.0 29.9 30.8 27.0
Kasai Occidental 38.7 48.2 53.0 16.9 13.7 10.0 33.7 30.3 34.0
Mother's
education
No education 44.5 50.7 50.1 15.4 10.6 8.5 38.3 28.7 28.3
Primary 40.0 48.4 46.3 13.5 11.8 9.1 33.3 28.6 26.4
Secondary and
Higher 29.8 35.2 11.3 7.7 21.1 17.2
Secondary
35.2
7.7
15.7
University
2.5
8.1
5.4
Non formal
program 30.1
16.2 25.5
Wealth Index
quintile
Poorest 43.0 46.6 47.3 13.0 10.3 9.7 35.4 26.6 28.5
Second 42.4 48.7 47.6 15.4 12.1 9.6 37.6 29.4 27.7
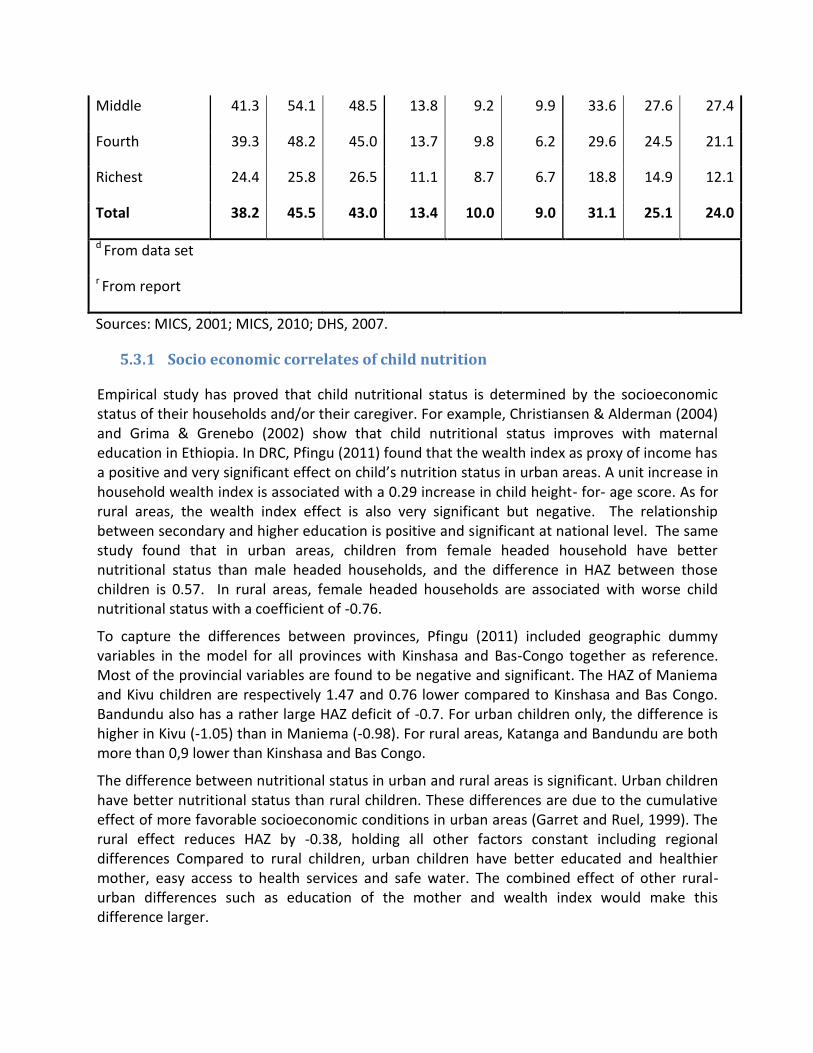
Middle 41.3 54.1 48.5 13.8 9.2 9.9 33.6 27.6 27.4
Fourth 39.3 48.2 45.0 13.7 9.8 6.2 29.6 24.5 21.1
Richest 24.4 25.8 26.5 11.1 8.7 6.7 18.8 14.9 12.1
Total 38.2 45.5 43.0 13.4 10.0 9.0 31.1 25.1 24.0
d From data set
r From report
Sources: MICS, 2001; MICS, 2010; DHS, 2007.
5.3.1 Socio economic correlates of child nutrition
Empirical study has proved that child nutritional status is determined by the socioeconomic status of their households and/or their caregiver. For example, Christiansen & Alderman (2004) and Grima & Grenebo (2002) show that child nutritional status improves with maternal education in Ethiopia. In DRC, Pfingu (2011) found that the wealth index as proxy of income has a positive and very significant effect on child’s nutrition status in urban areas. A unit increase in household wealth index is associated with a 0.29 increase in child height- for- age score. As for rural areas, the wealth index effect is also very significant but negative. The relationship between secondary and higher education is positive and significant at national level. The same study found that in urban areas, children from female headed household have better nutritional status than male headed households, and the difference in HAZ between those children is 0.57. In rural areas, female headed households are associated with worse child nutritional status with a coefficient of -0.76.
To capture the differences between provinces, Pfingu (2011) included geographic dummy variables in the model for all provinces with Kinshasa and Bas-Congo together as reference. Most of the provincial variables are found to be negative and significant. The HAZ of Maniema and Kivu children are respectively 1.47 and 0.76 lower compared to Kinshasa and Bas Congo. Bandundu also has a rather large HAZ deficit of -0.7. For urban children only, the difference is higher in Kivu (-1.05) than in Maniema (-0.98). For rural areas, Katanga and Bandundu are both more than 0,9 lower than Kinshasa and Bas Congo.
The difference between nutritional status in urban and rural areas is significant. Urban children have better nutritional status than rural children. These differences are due to the cumulative effect of more favorable socioeconomic conditions in urban areas (Garret and Ruel, 1999). The rural effect reduces HAZ by -0.38, holding all other factors constant including regional differences Compared to rural children, urban children have better educated and healthier mother, easy access to health services and safe water. The combined effect of other rural-urban differences such as education of the mother and wealth index would make this difference larger.
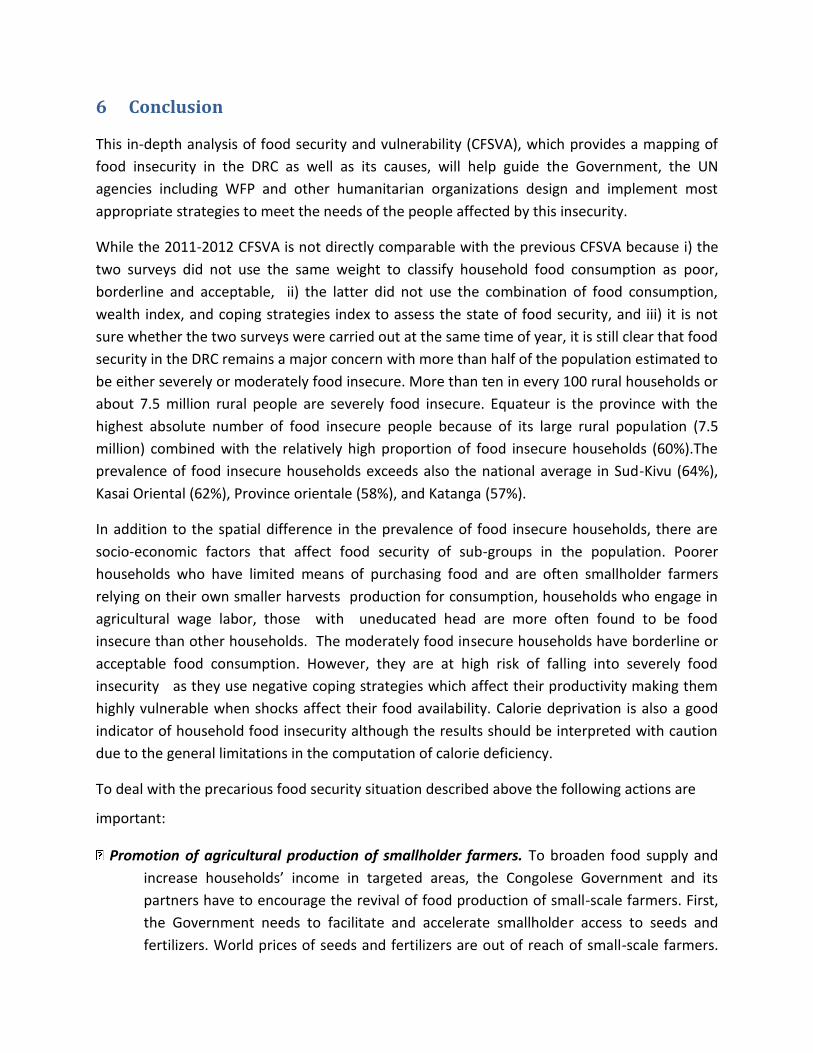
6 Conclusion
This in-depth analysis of food security and vulnerability (CFSVA), which provides a mapping of
food insecurity in the DRC as well as its causes, will help guide the Government, the UN
agencies including WFP and other humanitarian organizations design and implement most
appropriate strategies to meet the needs of the people affected by this insecurity.
While the 2011-2012 CFSVA is not directly comparable with the previous CFSVA because i) the
two surveys did not use the same weight to classify household food consumption as poor,
borderline and acceptable, ii) the latter did not use the combination of food consumption,
wealth index, and coping strategies index to assess the state of food security, and iii) it is not
sure whether the two surveys were carried out at the same time of year, it is still clear that food
security in the DRC remains a major concern with more than half of the population estimated to
be either severely or moderately food insecure. More than ten in every 100 rural households or
about 7.5 million rural people are severely food insecure. Equateur is the province with the
highest absolute number of food insecure people because of its large rural population (7.5
million) combined with the relatively high proportion of food insecure households (60%).The
prevalence of food insecure households exceeds also the national average in Sud-Kivu (64%),
Kasai Oriental (62%), Province orientale (58%), and Katanga (57%).
In addition to the spatial difference in the prevalence of food insecure households, there are
socio-economic factors that affect food security of sub-groups in the population. Poorer
households who have limited means of purchasing food and are often smallholder farmers
relying on their own smaller harvests production for consumption, households who engage in
agricultural wage labor, those with uneducated head are more often found to be food
insecure than other households. The moderately food insecure households have borderline or
acceptable food consumption. However, they are at high risk of falling into severely food
insecurity as they use negative coping strategies which affect their productivity making them
highly vulnerable when shocks affect their food availability. Calorie deprivation is also a good
indicator of household food insecurity although the results should be interpreted with caution
due to the general limitations in the computation of calorie deficiency.
To deal with the precarious food security situation described above the following actions are
important:
Promotion of agricultural production of smallholder farmers. To broaden food supply and
increase households’ income in targeted areas, the Congolese Government and its
partners have to encourage the revival of food production of small-scale farmers. First,
the Government needs to facilitate and accelerate smallholder access to seeds and
fertilizers. World prices of seeds and fertilizers are out of reach of small-scale farmers.
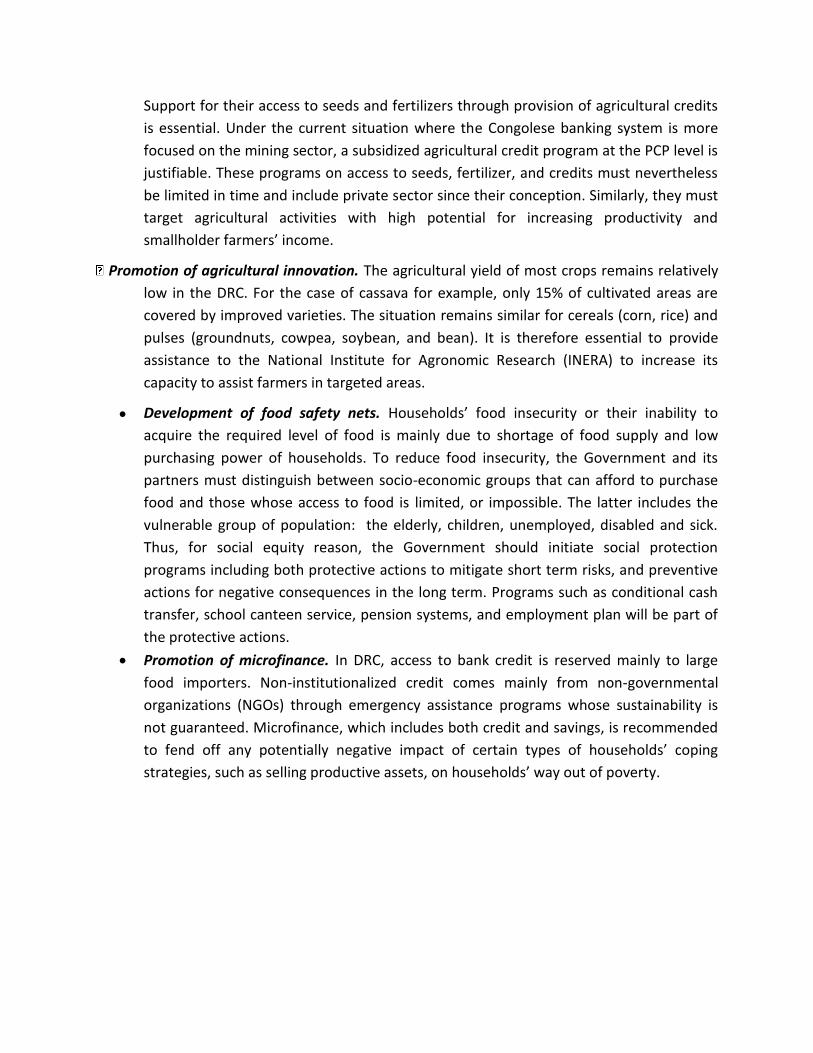
Support for their access to seeds and fertilizers through provision of agricultural credits
is essential. Under the current situation where the Congolese banking system is more
focused on the mining sector, a subsidized agricultural credit program at the PCP level is
justifiable. These programs on access to seeds, fertilizer, and credits must nevertheless
be limited in time and include private sector since their conception. Similarly, they must
target agricultural activities with high potential for increasing productivity and
smallholder farmers’ income.
Promotion of agricultural innovation. The agricultural yield of most crops remains relatively
low in the DRC. For the case of cassava for example, only 15% of cultivated areas are
covered by improved varieties. The situation remains similar for cereals (corn, rice) and
pulses (groundnuts, cowpea, soybean, and bean). It is therefore essential to provide
assistance to the National Institute for Agronomic Research (INERA) to increase its
capacity to assist farmers in targeted areas.
Development of food safety nets. Households’ food insecurity or their inability to
acquire the required level of food is mainly due to shortage of food supply and low
purchasing power of households. To reduce food insecurity, the Government and its
partners must distinguish between socio-economic groups that can afford to purchase
food and those whose access to food is limited, or impossible. The latter includes the
vulnerable group of population: the elderly, children, unemployed, disabled and sick.
Thus, for social equity reason, the Government should initiate social protection
programs including both protective actions to mitigate short term risks, and preventive
actions for negative consequences in the long term. Programs such as conditional cash
transfer, school canteen service, pension systems, and employment plan will be part of
the protective actions.
Promotion of microfinance. In DRC, access to bank credit is reserved mainly to large
food importers. Non-institutionalized credit comes mainly from non-governmental
organizations (NGOs) through emergency assistance programs whose sustainability is
not guaranteed. Microfinance, which includes both credit and savings, is recommended
to fend off any potentially negative impact of certain types of households’ coping
strategies, such as selling productive assets, on households’ way out of poverty.

Annex A. Agriculture seasonal calendar
Table 26: Agriculture seasonal calendar
Agro-ecological
zones Administrative areas
First season Second season
Planting
period
Harvesting
period
Planting
period
Harvesting
period
Maize
Central Basin Equator, East Province 15/03 - 15/04 15/07 - 15/08 15/09 - 15/10 15/01- 15/02
Centre South West Kasaï, East Kasaï 15/08 - 15/09 15/12- 15/01 15/01 - 15/02 15/05- 15/04
East North Kivu, South Kivu, Maniema, East Province 15/09 - 15/10 15/01- 15/02 15/03 - 15/04 15/07- 15/08
North Equator (North), East Province (North and Northeast) 15/03 - 15/04 15/07- 15/08 15/09 - 15/10 15/01- 15/02
Southeast Katanga 15/09 - 15/10 15/01- 15/02
Southwest Kinshasa, Bandundu, Lower-Congo 15/10 - 15/11 15/02- 15/03 15/01 - 15/02 15/05- 15/06
Rice
Central Basin Equator, East Province 15/03 - 15/04 15/07 - 15/08 15/09 - 15/10 15/01 - 15/02
Centre South West Kasaï, East Kasaï 15/09 - 15/10 15/01 - 15/02 15/02 - 15/03 15/06 - 15/07
East North Kivu, South Kivu, Maniema, East Province 15/11 - 15/12 15/04 - 15/05 15/09 - 15/10 15/12 - 15/01
North Equator (North), East Province (North and Northeast) 15/03 - 15/04 15/07 - 15/08 15/09 - 15/10 15/01 - 15/02
Southeast Katanga 15/09 - 15/10 15/01 - 15/02
Southwest Kinshasa, Bandundu, Lower-Congo 15/02 - 15/03 15/06 - 15/07 15/10 - 15/11 15/02 - 15/12
Cassava
Central Basin Equator, East Province 15/03 - 15/04 15/07 - 15/08 15/10 - 15/11 15/12 - 15/01
Centre South West Kasaï, East Kasaï 15/10 - 15/11 15/07 - 15/08 15/03 - 15/04 15/12 - 15/01
East North Kivu, South Kivu, Maniema, East Province 15/10 - 15/11 15/07 - 15/08 15/03 - 15/04 15/12 - 15/01
North Equator (North), East Province (North and Northeast) 15/03 - 15/04 15/07 - 15/08 15/10 - 15/11 15/12 - 15/01
Southeast Katanga 15/10 - 15/11 15/07 - 15/08
Southwest Kinshasa, Bandundu, Lower-Congo 15/10 - 15/11 15/07 - 15/08 15/03 - 15/04 15/12 - 15/01
Annex B. Prevalence and absolute number of food insecure people at the territory level
Table 27: Average coping strategy index by province
Province ID Coping
Strategy Index
Bas-Congo 6.8
Bandundu 7.2
Equateur 8.2
Orientale 9.0
Nord-Kivu 6.6
Maniema 9.8
Sud-Kivu 10.6
Katanga 11.0
Kasai Orientale 8.7
Kasai Occidentale 5.2
Total 8.4
Table 28: Average coping strategy index by class of food consumption
Class food consumption score
Coping Strategy
Index
Pauvre 12.34
Limite 9.52
Acceptable 7.33
Total 8.44
Table 29: Food consumption score by coping strategy index categorie.
Class CSI Food consumption score
Total Poor Borderline Acceptable
CSI <10 7.3% 26.6% 66.1% 100%
CSI 10-20 13.5% 30.0% 56.6% 100%
CSI >=20 18.1% 33.5% 48.4% 100%
Total 9.8% 28.1% 62.1% 100%
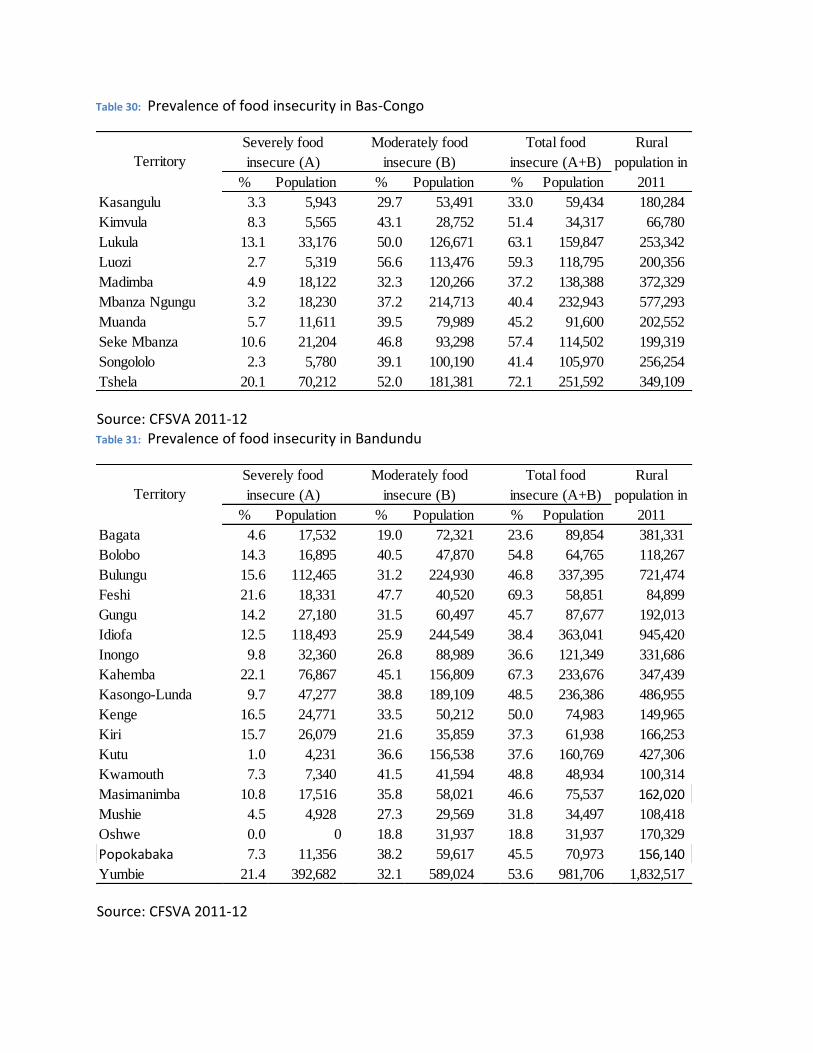
Table 30: Prevalence of food insecurity in Bas-Congo
Source: CFSVA 2011-12 Table 31: Prevalence of food insecurity in Bandundu
Source: CFSVA 2011-12
% Population % Population % Population
Kasangulu 3.3 5,943 29.7 53,491 33.0 59,434 180,284
Kimvula 8.3 5,565 43.1 28,752 51.4 34,317 66,780
Lukula 13.1 33,176 50.0 126,671 63.1 159,847 253,342
Luozi 2.7 5,319 56.6 113,476 59.3 118,795 200,356
Madimba 4.9 18,122 32.3 120,266 37.2 138,388 372,329
Mbanza Ngungu 3.2 18,230 37.2 214,713 40.4 232,943 577,293
Muanda 5.7 11,611 39.5 79,989 45.2 91,600 202,552
Seke Mbanza 10.6 21,204 46.8 93,298 57.4 114,502 199,319
Songololo 2.3 5,780 39.1 100,190 41.4 105,970 256,254
Tshela 20.1 70,212 52.0 181,381 72.1 251,592 349,109
Rural
population in
2011
Territory
Severely food
insecure (A)
Moderately food
insecure (B)
Total food
insecure (A+B)
% Population % Population % Population
Bagata 4.6 17,532 19.0 72,321 23.6 89,854 381,331
Bolobo 14.3 16,895 40.5 47,870 54.8 64,765 118,267
Bulungu 15.6 112,465 31.2 224,930 46.8 337,395 721,474
Feshi 21.6 18,331 47.7 40,520 69.3 58,851 84,899
Gungu 14.2 27,180 31.5 60,497 45.7 87,677 192,013
Idiofa 12.5 118,493 25.9 244,549 38.4 363,041 945,420
Inongo 9.8 32,360 26.8 88,989 36.6 121,349 331,686
Kahemba 22.1 76,867 45.1 156,809 67.3 233,676 347,439
Kasongo-Lunda 9.7 47,277 38.8 189,109 48.5 236,386 486,955
Kenge 16.5 24,771 33.5 50,212 50.0 74,983 149,965
Kiri 15.7 26,079 21.6 35,859 37.3 61,938 166,253
Kutu 1.0 4,231 36.6 156,538 37.6 160,769 427,306
Kwamouth 7.3 7,340 41.5 41,594 48.8 48,934 100,314
Masimanimba 10.8 17,516 35.8 58,021 46.6 75,537 162,020
Mushie 4.5 4,928 27.3 29,569 31.8 34,497 108,418
Oshwe 0.0 0 18.8 31,937 18.8 31,937 170,329
Popokabaka 7.3 11,356 38.2 59,617 45.5 70,973 156,140
Yumbie 21.4 392,682 32.1 589,024 53.6 981,706 1,832,517
Severely food
insecure (A)
Moderately food
insecure (B)
Total food
insecure (A+B)Territory
Rural
population in
2011
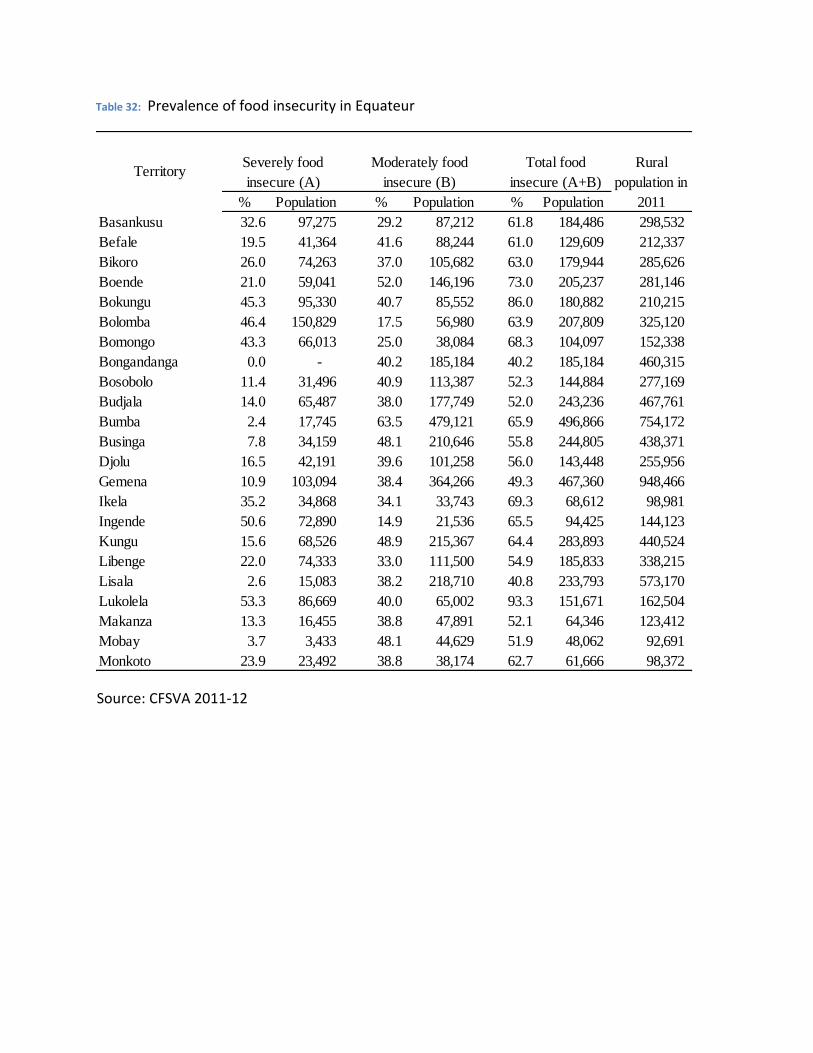
Table 32: Prevalence of food insecurity in Equateur
Source: CFSVA 2011-12
% Population % Population % Population
Basankusu 32.6 97,275 29.2 87,212 61.8 184,486 298,532
Befale 19.5 41,364 41.6 88,244 61.0 129,609 212,337
Bikoro 26.0 74,263 37.0 105,682 63.0 179,944 285,626
Boende 21.0 59,041 52.0 146,196 73.0 205,237 281,146
Bokungu 45.3 95,330 40.7 85,552 86.0 180,882 210,215
Bolomba 46.4 150,829 17.5 56,980 63.9 207,809 325,120
Bomongo 43.3 66,013 25.0 38,084 68.3 104,097 152,338
Bongandanga 0.0 - 40.2 185,184 40.2 185,184 460,315
Bosobolo 11.4 31,496 40.9 113,387 52.3 144,884 277,169
Budjala 14.0 65,487 38.0 177,749 52.0 243,236 467,761
Bumba 2.4 17,745 63.5 479,121 65.9 496,866 754,172
Businga 7.8 34,159 48.1 210,646 55.8 244,805 438,371
Djolu 16.5 42,191 39.6 101,258 56.0 143,448 255,956
Gemena 10.9 103,094 38.4 364,266 49.3 467,360 948,466
Ikela 35.2 34,868 34.1 33,743 69.3 68,612 98,981
Ingende 50.6 72,890 14.9 21,536 65.5 94,425 144,123
Kungu 15.6 68,526 48.9 215,367 64.4 283,893 440,524
Libenge 22.0 74,333 33.0 111,500 54.9 185,833 338,215
Lisala 2.6 15,083 38.2 218,710 40.8 233,793 573,170
Lukolela 53.3 86,669 40.0 65,002 93.3 151,671 162,504
Makanza 13.3 16,455 38.8 47,891 52.1 64,346 123,412
Mobay 3.7 3,433 48.1 44,629 51.9 48,062 92,691
Monkoto 23.9 23,492 38.8 38,174 62.7 61,666 98,372
Total food
insecure (A+B)Territory
Severely food
insecure (A)
Moderately food
insecure (B)
Rural
population in
2011
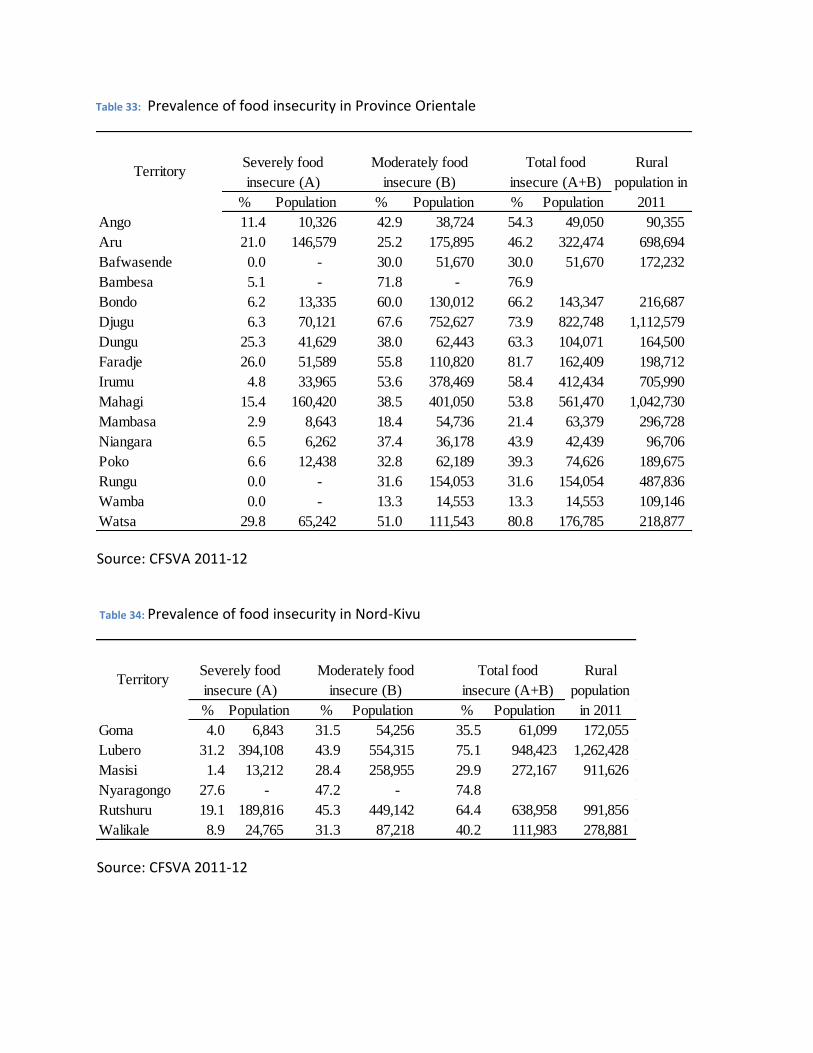
Table 33: Prevalence of food insecurity in Province Orientale
Source: CFSVA 2011-12
Table 34: Prevalence of food insecurity in Nord-Kivu
Source: CFSVA 2011-12
% Population % Population % Population
Ango 11.4 10,326 42.9 38,724 54.3 49,050 90,355
Aru 21.0 146,579 25.2 175,895 46.2 322,474 698,694
Bafwasende 0.0 - 30.0 51,670 30.0 51,670 172,232
Bambesa 5.1 - 71.8 - 76.9
Bondo 6.2 13,335 60.0 130,012 66.2 143,347 216,687
Djugu 6.3 70,121 67.6 752,627 73.9 822,748 1,112,579
Dungu 25.3 41,629 38.0 62,443 63.3 104,071 164,500
Faradje 26.0 51,589 55.8 110,820 81.7 162,409 198,712
Irumu 4.8 33,965 53.6 378,469 58.4 412,434 705,990
Mahagi 15.4 160,420 38.5 401,050 53.8 561,470 1,042,730
Mambasa 2.9 8,643 18.4 54,736 21.4 63,379 296,728
Niangara 6.5 6,262 37.4 36,178 43.9 42,439 96,706
Poko 6.6 12,438 32.8 62,189 39.3 74,626 189,675
Rungu 0.0 - 31.6 154,053 31.6 154,054 487,836
Wamba 0.0 - 13.3 14,553 13.3 14,553 109,146
Watsa 29.8 65,242 51.0 111,543 80.8 176,785 218,877
Rural
population in
2011
TerritorySeverely food
insecure (A)
Moderately food
insecure (B)
Total food
insecure (A+B)
% Population % Population % Population
Goma 4.0 6,843 31.5 54,256 35.5 61,099 172,055
Lubero 31.2 394,108 43.9 554,315 75.1 948,423 1,262,428
Masisi 1.4 13,212 28.4 258,955 29.9 272,167 911,626
Nyaragongo 27.6 - 47.2 - 74.8
Rutshuru 19.1 189,816 45.3 449,142 64.4 638,958 991,856
Walikale 8.9 24,765 31.3 87,218 40.2 111,983 278,881
Rural
population
in 2011
Moderately food
insecure (B)
Total food
insecure (A+B)Territory
Severely food
insecure (A)

Table 35: Prevalence of food insecurity in Maniema
Source: CFSVA 2011-12
Table 36: Prevalence of food insecurity in Sud-Kivu
Source: CFSVA 2011-12
% Population % Population % Population
Kindu-Alunguli 6.2 3,814 30.2 18,595 36.4 22,410 61,507
Kasuku_Mikelenge 5.2 5,932 17.8 20,338 23.0 26,270 114,401
Kabambare 9.9 34,880 41.6 147,104 51.5 181,985 353,354
Kailo 12.1 14,557 44.0 53,090 56.0 67,647 120,736
Kasongo 5.7 29,502 28.3 146,587 34.0 176,089 518,126
Kibombo 4.7 7,769 48.3 79,359 53.0 87,129 164,269
Lubutu 2.5 4,181 27.7 45,990 30.2 50,171 166,191
Pangi 12.4 36,548 45.0 132,592 57.3 169,139 294,931
Punia 7.0 9,001 21.6 27,645 28.6 36,646 127,939
Rural
population in
2011
TerritorySeverely food
insecure (A)
Moderately food
insecure (B)
Total food
insecure (A+B)
% Population % Population % Population
Bagira 6.1 3,708 26.8 16,316 32.9 20,024 60,814
Fizi 16.7 74,554 40.6 181,685 57.3 256,239 447,322
Ibanda 2.9 7,879 29.4 78,786 32.4 86,665 267,873
Idjwi 7.2 13,173 40.1 73,588 47.3 86,761 183,515
Kabare 16.5 90,465 54.3 297,083 70.8 387,548 547,257
Kadutu 1.1 2,310 31.0 62,379 32.2 64,689 200,998
Kalehe 5.7 30,925 66.5 359,757 72.2 390,682 541,182
Mwenga 18.7 88,800 54.3 258,220 73.0 347,020 475,546
Shabunda 28.3 139,193 54.2 266,609 82.6 405,802 491,459
Uvira 7.6 47,165 51.8 321,378 59.4 368,543 620,819
Walungu 17.8 149,007 53.8 450,284 71.7 599,290 836,396
Bukavu (urban) 4.2 - 50.5 - 54.7
Rural
population in
2011
TerritorySeverely food
insecure (A)
Moderately food
insecure (B)
Total food
insecure (A+B)

Table 37: Prevalence of food insecurity in Katanga
Source: CFSVA 2011-12
% Population % Population % Population
Malemba-Nkulu 20.0 149,998 68.5 513,455 88.5 663,453 749,991
Bukama 20.8 188,924 55.8 506,317 76.7 695,242 906,837
Dilolo 15.0 88,989 37.0 219,507 52.0 308,496 593,261
Kabalo 4.4 8,130 46.7 85,367 51.1 93,497 182,929
Kabongo 17.9 114,349 30.8 196,027 48.7 310,377 637,089
Kalemie 22.5 87,633 45.0 175,265 67.6 262,898 389,088
Kambove 36.4 103,785 35.5 101,191 71.8 204,976 285,410
Kamina 13.6 63,143 40.9 189,430 54.5 252,574 463,052
Kaniama 20.0 48,781 41.1 100,272 61.1 149,053 243,906
Kapanga 24.8 51,877 33.0 69,170 57.8 121,048 209,431
Kasenga 1.9 6,046 34.3 111,860 36.1 117,906 326,509
Kipushi 15.0 36,855 63.0 154,792 78.0 191,647 245,701
Kongolo 18.5 31,344 48.9 82,971 67.4 114,315 169,629
Lubudi 35.0 88,111 45.0 113,286 80.0 201,397 251,746
Moba 4.0 15,969 34.0 135,734 38.0 151,703 399,219
Mutshatsha 2.0 4,703 39.0 91,708 41.0 96,411 235,148
Nyunzu 26.7 52,672 45.5 89,738 72.3 142,410 197,033
Pweto 3.0 14,601 30.0 146,011 33.0 160,613 486,705
Sakania 1.1 2,299 31.8 64,374 33.0 66,673 202,319
Sandoa 9.1 52,212 20.0 114,867 29.1 167,079 574,333
Rural
population in
2011
TerritorySeverely food
insecure (A)
Moderately food
insecure (B)
Total food
insecure (A+B)

Table 38: Prevalence of food insecurity in Kasai Oriental
Source: CFSVA 2011-12
Table 39: Prevalence of food insecurity in Kasai Occidental
Source: CFSVA 2011-12
% Population % Population % Population
Kabeya Kamwanga 23.8 34,152 43.5 62,365 67.4 96,517 143,290
Kabinda 4.5 19,766 29.7 130,454 34.2 150,220 438,800
Kamiji 17.2 14,564 54.4 46,203 71.6 60,766 84,872
Katako Kombe 20.2 53,387 49.8 131,605 70.0 184,992 264,451
Katanda 15.8 49,071 51.6 160,300 67.4 209,371 310,786
Kole 0.0 - 56.4 43,763 56.4 43,763 77,627
Lodja 18.4 74,437 51.3 207,360 69.7 281,797 404,086
Lomela 12.9 21,668 64.4 108,338 77.2 130,005 168,340
Lubao 4.9 22,518 23.8 110,339 28.6 132,857 463,875
Lubefo 23.5 62,489 68.7 182,837 92.2 245,326 266,156
Lupatapata 26.9 72,924 37.0 100,585 63.9 173,509 271,580
Lusambo 17.0 23,828 69.8 97,960 86.8 121,789 140,322
Lwilu 18.7 - 31.1 - 49.8
Miabi 23.2 66,674 50.6 145,631 73.8 212,305 287,752
Ngandajika 12.5 51,144 40.0 163,660 52.5 214,804 409,151
Tshilenge 21.1 232,204 50.7 558,277 71.7 790,481 1,101,733
Rural
population in
2011
Territory
Severely food
insecure (A)
Moderately food
insecure (B)
Total food
insecure (A+B)
% Population % Population % Population
Dekese 1.3 1,702 16.7 21,279 18.0 22,981 127,672
Demba 18.4 118,502 31.6 203,146 50.0 321,648 643,296
Dibaya 12.1 65,195 45.1 242,153 57.2 307,349 537,084
Dimbelenge 5.3 8,902 25.0 42,286 30.3 51,188 169,143
Ilebo 0.6 2,467 20.6 83,873 21.2 86,339 407,029
Kazumba 24.2 264,038 38.1 414,916 62.3 678,954 1,089,679
Luebo 21.0 72,430 31.2 107,547 52.2 179,977 344,590
Luiza 26.0 31,935 31.8 39,093 57.8 71,028 122,784
Mweka 6.4 29,264 29.2 134,615 35.6 163,879 460,423
Tshikapa/Kamonya 5.8 121,881 39.0 819,545 44.8 941,426 2,101,398
Rural
population in
2011
Territory
Severely food
insecure (A)
Moderately food
insecure (B)
Total food
insecure (A+B)
7 References
Ajieroh, V. (2009, December). A Quantitative Analysis of Determinants of Child and Maternal
Malnutrition in Nigeria. Nigeria Strategy Support Program (NSSP),Background Paper No.
NSSP10 . . Washington, DC: IFPRI.
Atinmo, T., & Bakre A. T. (2003). “Palm Fruit in Traditional African Food Culture.” Asia Pacific
Journal of Clinical Nutrition 12 (3): 350–354.
Bassolé, L. (2007, June). Child Malnutrition in Senegal: Does access to public infrastructure realy
matter? A quantile regression analysis. CERDI-CNRS, Université d’Auvergne.
Beegle, K., De Weerdt, J., Friedman, J., & Gibson, J. (2012). “Methods of Household
Consumption Measurement through Surveys: Experimental Results from Tanzania.”
Journal of Development Economics 98 (1): 3–18.
Bergstrom, S., & Goodburn, E. (2001). The role of traditional birth attendant in the reduction of
maternal mortality. In V. De Brouwere, & W. Van Lerberghe, Safe motherhood strategie
a review of the Evidence (pp. 77-96). Antwerp: ITGPress.
Bouis, H. E. (1994). “The Effects of Income on Demand for Food in Poor Countries: Are Our Food
Databases Giving Us Reliable Estimates?” Journal of Development Economics 44 (1):
199–220.
Christiaensen, L., & Alderman, H. (2004, January). Child malnutrition in Ethiopia: Can maternal
knowlege augmente the role of income? economic development and Cultural Change,
52(2), 287-312.
Ecker, O., & Qaim, M. (2011). Analyzing Nutritional Impacts of Policies: An Empirical Study for
Malawi. World Development, 39(3), 412–428. 2011
Emina, J. O., Kandala, ,. N.-B., & Inungu, J. (2009). The Effect of MMaternal Education on Child
Nutritional Status in the Democratic Republic of the Congo. Paper presented at the
IUSSP conference .
L'Enfance, I. N. (Mai 2011). Enquete par Grappes a Indicateurs Multiples en Republique
Democratique du Congo, 2010, Rapport de Synthese.
FAO (2013). The State of Food Insecurity in the World 2013.
Felker-Kantor, E. & Wood, C.H. (2012). Female-Headed Households and Food Insecurity in
Brazil. Food Security 4:607–617
Fiedler JL, Lividini K, Bermudez O, Smitz MF. Household Consumption and Expenditures Surveys
(HCES): A Primer for Food and Nutrition Analysts in Low- and Middle-Income Countries.
Food Nutr Bull 2012;33: S170–84.
Fuwa, N. (2000). The Poverty and Heterogeneity among Female-Headed Households Revisited:
The Case of Panama. World Development, 28(8), 1515–1542.
Grima, W., & Grenebo, T. (2002). Determinants of nutritional status of women and children in
Ethiopia. Maryland: ORC Macro.
Haddad, L., & Kanbur, R. (1990). How serious is the neglect of intrahousehold inequality?
Economic Journal, 100(402), 866–881.
Harrigan, J. (2008, June). Food insecurity, poverty and the Malawian Starter Pack: Fresh start or
false start? Food Policy, 33(3), 237-249.
Headey, D., & Ecker, O. ( 2012). Improving the Measurement of Food Security. IFPRI Discussion
Paper 01225. Washington, DC: International Food Policy Research Institute.
Kabubo Mariara, J., Ndenge, J. K., & Mwabu, D. K. (2008). Determinants of Children Nutritional
Status in Kenya:Evidence from Demographic and Health Surveys. Journal of African
Economies,, volume 18,number3, 363-387.
Kamiya, Y. .. (2009, December). Economic analysis on the socioeconomic determinants of child
malnutrition in Lao PDR. OSIPP Discussion Paper : DP-2009-E-007 . . Osaka, Japan.
Macro International Inc. 2008. Enquête Démographique et de Santé, République Démocratique
du Congo 2007.
Ministère de l’Agriculture et du Développement Rural (2009). Etude du secteur agricole:
Rapport bilan diagnostic et note d'orientation.
Muller, O., & Krawinkel, M. (2005). Malnutrition and health in developing countries. CMAJ.,
173, 279-86.
Naska, A.; Oikonomou, E.; Trichopoulous, A., Wagner K, & Gedrich K (2007). Estimations of daily
energy and nutrient availability based on nationally representative household budget
survey data. The Data Food Networking (DAFNE) project. Public Health Nutr
2007;10:1422–9.
Ndobo F., & Sekhampu, T.J. (2013). Determinants of Vulnerability to Food Insecurity in a South
African Township: A Gender Analysis. Mediterranean Journal of Social Sciences,
HYPERLINK "http://www.mcser.org/journal/index.php/mjss/issue/view/27" \t "_parent"
4 (14)
Pfingu, C. (2011). Determinants of Child Malnutrition in the Democratic Republic of Congo.
Thesis for Master of Science in Agricultural Economics, University of Missouri.
PMI. (2012, April). Malaria Operational Plan, Fiscal year2011, Democratic Republic of Congo.
Retrieved April 16, 2013, from http://www.pmi.gov/countries/profiles/drc_profile.pdf
Rahma, A., & Chowdhury, S. (2007). Determinants of chronic malnutrition among pre-school
children in Bangladesh. Journal of Biosocial Science, 39, 116-173.
Rambeloson-Jariseta Z., Dary O., Fiedler J.L., & Franklin N (2012). Comparison of estimates of
the nutrient density of the diet of women and children in Uganda by Household
Consumption and Expenditures Surveys (HCES) and 24-hour recall. Food Nutr Bull 2012;
33:S199–207.
Smith, L. C., Dupriez, O., & Troubat, N. (2013). ‘Assessment of the Reliability and Relevance of
the Food Data Collected in National Household Consumption and Expenditure Surveys’,
mimeo, Washington DC: International Household Survey Network.
Smith, L. C., & A. Subandoro. (2007). Measuring Food Security Using Household Expenditure
Surveys. Food Security in Practice. International Food Policy.
Smith, L. C., H. Alderman, & Aduayom D. (2006). Food insecurity in Sub Saharan Africa: New
estimates from household expenditure surveys. IFPRI Research Report 146. Washington,
D.C.: International Food Policy Research Institute.
Smith, L. C., Ruel, M. T., & Ndiaye, A. (2005, August). Why is child malnutrition lower in urban
than in rural areas? Evidence of 36 Developing countries. World Developemnt, 33(8),
1285-1305.
Ulimwengu, J., Roberts, C., & Randriamamonjy, J. ( 2012). Resource-rich yet malnourished:
analysis of the demand for food nutrients in the Democratic Republic of the Congo.
Washington: IFPRI Discussion Papers.
UNICEF. (1990). Stategy for improvd nutrition of children and women in developing countries. A
UNICEF Policy review . New York.

UNOCHA (2012) Plan d'Action Humanitaire pour la République Démocratique du Congo (2013 .
Dec.2012 http://www.unocha.org/cap/appeals/plan-daction-humanitaire-pour-la-
r%C3%A9publique-d%C3%A9mocratique-du-congo-2013 (Accessed April 2013)
USAID ( 2010). USAID Country Profile: Property Rights and Resource Governance, the
Democratic Republic of Congo (DRC).
http://usaidlandtenure.net/sites/default/files/country-profiles/full-
reports/USAID_Land_Tenure_Democratic_Republic_of_Congo_Profile_0.pdf (Accessed
April 2013).
von Grebmer, K., Torero, M., Olofinbiyi, T., Fritschel, H., Wiesmann, D., Yohannes, Y., et al.
(2011). Global Hunger Index: The Chalenge of Hunger: Taming prices spikes and
excessive food prices volatility. Washington, DC.
WFP (World Food Programme) 2008. Food Consumption Analysis: Calculation and Use of the
Food Consumption Score. Rome.
WFP. (2009). Comprehensive Food security and vulnerability analysis.
WFP (2011) Results of the In-Depth Emergency Food Security Assessment (EFSA) of Displaced,
Returnee and Host Households in the Orientale Province: September 2011.
http://home.wfp.org/stellent/groups/public/documents/ena/wfp242295.pdf (Accessed
April 2013)
WHO. (n.d.). Retrieved April 18, 2013, from
http://www.who.int/nutrition/topics/global_strategy/en/
WHO, & UNICEF. (2003). Global Stategy for Infant and Young Child Feeding practices. Geneva,
Switzerland .
WHO, UNICEF, USAID, AED, UCDAVIS, & IFPRI. (2008). Indicators for assessing infant and young
child feeding practices - Part I: Indicators for assessing infant and young child feeding
practices - Part I: Definitions. Conclusion of a concensus meeting held 6-8 Novembre
2007 in Washington D.C.,USA.
Wiesmann, D., Bassett, L., Benson, T., & Hoddinott, J. ( 2009). Validation of the World Food
Programme’s Food Consumption Score and Alternative Indicators of Household Food
Security. IFPRI Discussion Paper 00870. Washington, DC: International Food Policy
Research Institute.

3
For more publications visit:
http://www.wfp.org/countries/congo-democratic-republic-of/publications
4 Comprehensive food security and nutrition survey, Liberia
Photo
s, F
ront C
over: W
FP/D
avid
Orr
Top Related