


Languages
Pages
Legal


1
NILS LOMMERINOPERATIONS
EXECUTIVE VICE PRESIDENT

2
DEL MONTE OPERATIONSValue Proposition
Overall competitive cost structure
Superior supply chain performance
Sustainable cost reduction programs in place• Lean Operations
Enhancing overall competitiveness with upgraded execution abilities via transformation initiatives• Continued optimization of supply chain• Pet Manufacturing improvements

3
DEL MONTE OPERATIONSOperations footprint building block for delivering value
proposition
Distribution Center- 3rd Party
Fontana
Lathrop
Terminal Island
Jacksonville
Ft. Worth
Kankakee
Rochelle
Bloomsburg
Modesto
Kingsburg
Hanford
YakimaToppenish
Lawrence
Perham
Sleepy EyePloverMarkesanCambria
Mendota
Plymouth
Crystal City
Topeka
Atlanta
FruitTomatoVegPet Food McAllen
York
Distribution Center – DLM Operated
Decatur
Buffalo
Distribution Center- 3rd Party
Fontana
Lathrop
Terminal Island
Jacksonville
Ft. Worth
Kankakee
Rochelle
Bloomsburg
Modesto
Kingsburg
Hanford
YakimaToppenish
Lawrence
Sleepy EyePloverMarkesanCambria
Mendota
Plymouth
Crystal City
Topeka
Atlanta
FruitTomatoVegPet Food McAllen
York
Distribution Center – DLM Operated
Decatur
Buffalo
InternationalProduction Facilities
Samoa- TunaVenezuela- Veg, Tomato
Mexico- Citrus
InternationalProduction Facilities
Samoa- TunaVenezuela- Veg, Tomato
Mexico- Citrus
17 U.S. production facilities
4 International production facilities
11 Distribution Centers
U.S. and international co-packers
As of July 2007

4
SITUATIONAL ASSESSMENTGenerally speaking, we have a competitive cost structure in mostbusinesses, with initiatives in place to narrow or eliminate gaps in
areas that are dis-advantaged
Consumer Products Pet Products
FruitFruit
TomatoesTomatoes
VegetablesVegetables
TunaTuna
Advantaged
Advantaged
Dry PetDry Pet
Pet SnacksPet Snacks
Wet PetWet Pet
Dis-Advantaged
At Parity
Advantaged
At Parity
Advantaged
Note: Reflects comparable products across key SKU’s.

5
SITUATIONAL ASSESSMENTOperational costs expected to remain elevated
$150
$30
$120
$145
~$110
$0
$20
$40
$60
$80
$100
$120
$140
$160
F04
F05
F06
F07
F08E
Gross Inflationary Cost Increasesvs. Preceding Year
(Excludes Savings Initiatives)
$M
Key Operational Cost Components
Cost Bucket
Packaging
Logistics
Raw Products
Other
Total
% of Op Costs
~25%
~15%
~35%
~25%
100%
F08 Increase
~$15-20
~$0-5
~$50-60
~$35-40
~$110
F07 Increase
~$25
~$15
~$60
~$45
~$145
6
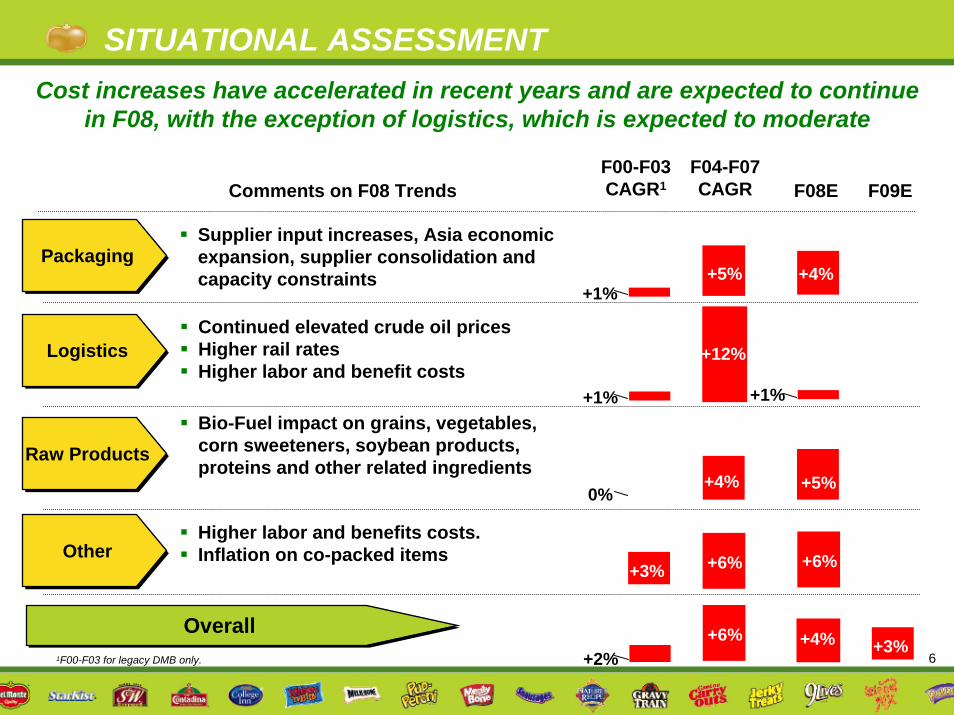
SITUATIONAL ASSESSMENTCost increases have accelerated in recent years and are expected to continue
in F08, with the exception of logistics, which is expected to moderate
PackagingPackaging
Raw ProductsRaw Products
LogisticsLogistics
OtherOther
Supplier input increases, Asia economic expansion, supplier consolidation and capacity constraints
Bio-Fuel impact on grains, vegetables, corn sweeteners, soybean products, proteins and other related ingredients
Continued elevated crude oil pricesHigher rail rates Higher labor and benefit costs
Higher labor and benefits costs.Inflation on co-packed items
F08EF04-F07CAGR
F00-F03CAGR1Comments on F08 Trends
Overall1F00-F03 for legacy DMB only.
Overall
+5% +4%
0%
+1%
+12%
+4% +5%
+6%
+6%
+6%
+4%
F09E
+2%+3%
+1%
+3%
+1%

7
SITUATIONAL ASSESSMENTSuperior supply chain value –Beyond cost competitiveness
Supply Chain excellence is driven by:Lean
• Cost competitiveness• Constant improvement focus• Managing inventory levels
On-Demand• Customer promotion execution – one chance to meet the consumer
demand• Responsiveness to satisfy dynamic customer requirements
Consistently exceed customer expectations• Match Del Monte supply delivery to specific customer strategies• High store in-stock levels

8
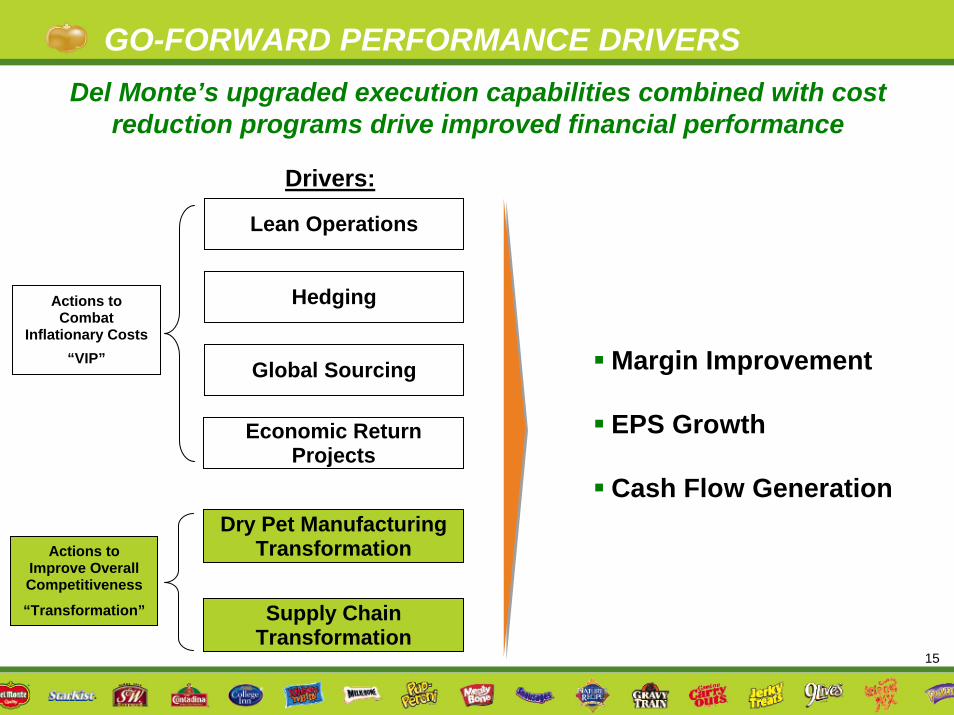
GO-FORWARD PERFORMANCE DRIVERS
Lean OperationsLean Operations
Drivers:
Del Monte’s upgraded execution capabilities combined with cost reduction programs drive improved financial performance
Dry Pet ManufacturingTransformation
HedgingHedging
Global SourcingGlobal Sourcing
Supply Chain Transformation
Actions to Improve Overall Competitiveness
“Transformation”
Actions to Combat
Inflationary Costs“VIP”
Actions to Combat
Inflationary Costs“VIP” Margin Improvement
EPS Growth
Cash Flow Generation
Economic Return Projects
Economic Return Projects

9
SUMMARY: INFLATIONARY OFFSETSVIP and Transformation Plan savings combat inflationary costs in
the short term and build the overall competitiveness of the business in the long term
100150200250300350400450500550
F05 F06 F07 F08 Cum. Gross Cost ChangeCum. Net Cost Change
Inflationary Offsets$M
VIP Cost Reduction Programs (~$60M in F08)
• Lean Operations• Hedging• Global Sourcing• Economic Return Projects
Transformation Plan Savings (~$15M in F08)
• Supply Chain Optimization• Dry Pet Food Distributed
Manufacturing
Key Drivers
$120
$270
$415
$525
$100
$205
$295$330
VIP and TransformationCost Savings
% of CostIncreases
Offsetin that year
~15% ~30% ~40% ~70%

10
GO-FORWARD PERFORMANCE DRIVERS
Lean OperationsLean Operations
Drivers:
Del Monte’s upgraded execution capabilities combined with cost reduction programs drive improved financial performance
Dry Pet ManufacturingTransformation
HedgingHedging
Global SourcingGlobal Sourcing
Supply Chain Transformation
Actions to Improve Overall Competitiveness
“Transformation”
Actions to Combat
Inflationary Costs“VIP”
Actions to Combat
Inflationary Costs“VIP” Margin Improvement
EPS Growth
Cash Flow Generation
Economic Return Projects
Economic Return Projects

11
DRIVER: LEAN OPERATIONSLean Operations is about the identification and elimination of the
seven forms of waste
INVENTORY MOTIONTRANSPORTATION WAITING
OVER PRODUCTION OVER PROCESSING DEFECTS
12
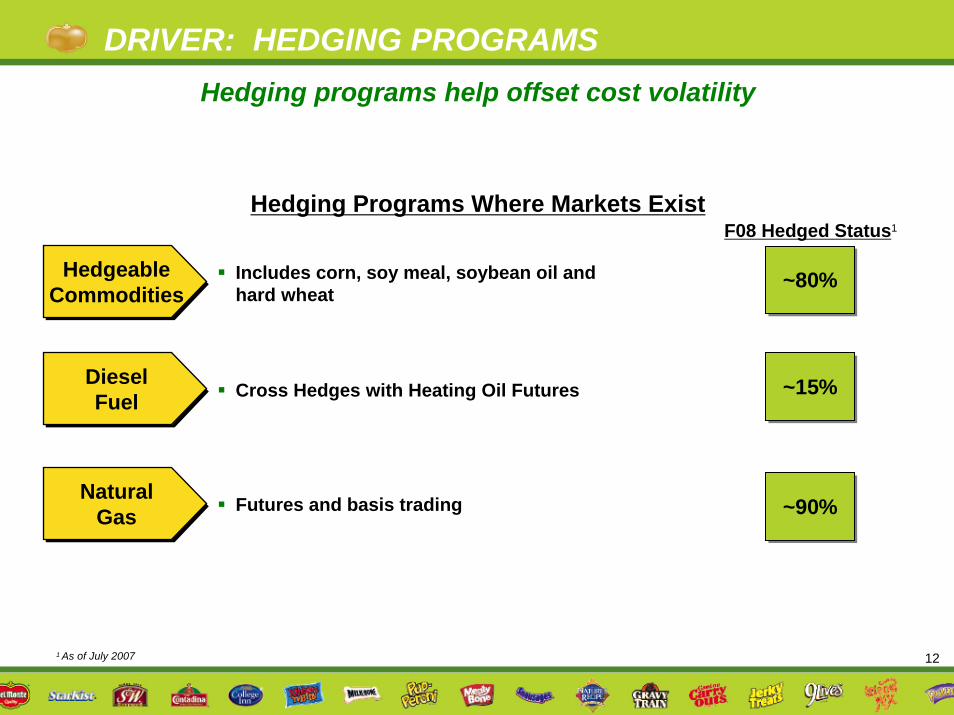
DRIVER: HEDGING PROGRAMSHedging programs help offset cost volatility
HedgeableCommoditiesHedgeable
CommoditiesIncludes corn, soy meal, soybean oil and hard wheat
Hedging Programs Where Markets Exist
~80%~80%
F08 Hedged Status1
DieselFuel
DieselFuel Cross Hedges with Heating Oil Futures ~15%~15%
NaturalGas
NaturalGas ~90%~90%Futures and basis trading
1 As of July 2007

13
DRIVER: LONG TERM RELATIONSHIPSLong-term relationships where hedging programs do not exist
PackagingPackaging Long-term contracts with Silgan (2010) and Impress (2011) Long-term relationship with Fort Dearborn (10 years)
FruitFruit Long-term relationships with ~300 growers~60% of growers are 2nd generation; 30+ years with Del Monte
VegVeg Long-term relationships with ~700 growers~85-90% growers are returning, 30% are 2nd and 3rd generation growers
TomatoTomato Long-term relationships with ~20 growers~25% of growers are 2nd generation; 30+ years with Del Monte
TunaTuna Spot and term contracts Negotiated directly with tuna vessel owners and cooperatives

14
DRIVER: GLOBAL SOURCINGInternational sourcing expertise capitalizes on global food supply
chain, with quality assurance controls in place
Asia
North America
South America
Expectations:Product ConsistencyProduct SafetyContinuous Improvement
Enhanced Measurement Tools:Vendor certification process3-Tier Audit SystemInternational QA/Tech service group
for in-country oversight
Quality Assurance
Del Monte has both the quality control and technical capabilities to expand our
current global sourcing volumes
Finished Goods Sourcing
Raw Products/ Ingredients Sourcing
Asia
North America
South America
15
GO-FORWARD PERFORMANCE DRIVERS
Lean Operations
Drivers:
Del Monte’s upgraded execution capabilities combined with cost reduction programs drive improved financial performance
Dry Pet ManufacturingTransformation
Hedging
Global Sourcing
Supply Chain Transformation
Actions to Improve Overall Competitiveness
“Transformation”
Actions to Combat
Inflationary Costs“VIP” Margin Improvement
EPS Growth
Cash Flow Generation
Economic Return Projects

16
DRIVER: DRY PET MANUFACTURING TRANSFORMATION
Redrawing the dry pet food manufacturing footprint –Reducing miles by ~5M in F07 and F08
Topeka
Decatur
Bloomsburg & Buffalo
Pet Food acquisitions have enabled a more cost effective distributed dry pet food manufacturing footprint
17
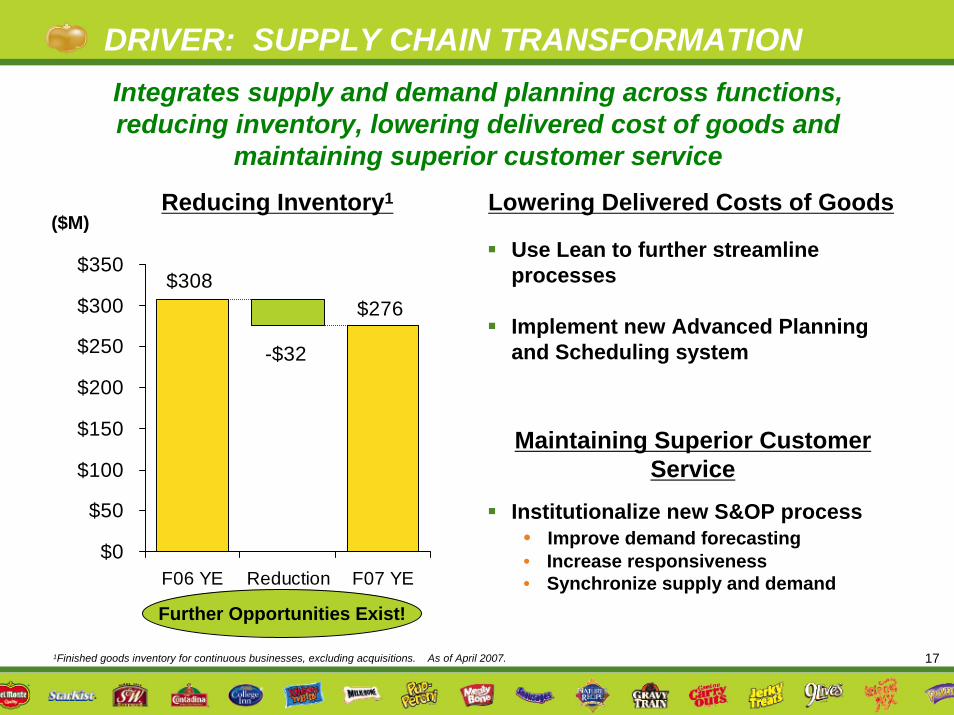
DRIVER: SUPPLY CHAIN TRANSFORMATION
$276$308
-$32
$0
$50
$100
$150
$200
$250
$300
$350
F06 YE Reduction F07 YE
Integrates supply and demand planning across functions, reducing inventory, lowering delivered cost of goods and
maintaining superior customer serviceReducing Inventory1 Lowering Delivered Costs of Goods
($M)Use Lean to further streamline processes
Implement new Advanced Planning and Scheduling system
Maintaining Superior Customer Service
Institutionalize new S&OP process• Improve demand forecasting• Increase responsiveness• Synchronize supply and demand
Further Opportunities Exist!
1Finished goods inventory for continuous businesses, excluding acquisitions. As of April 2007.
18
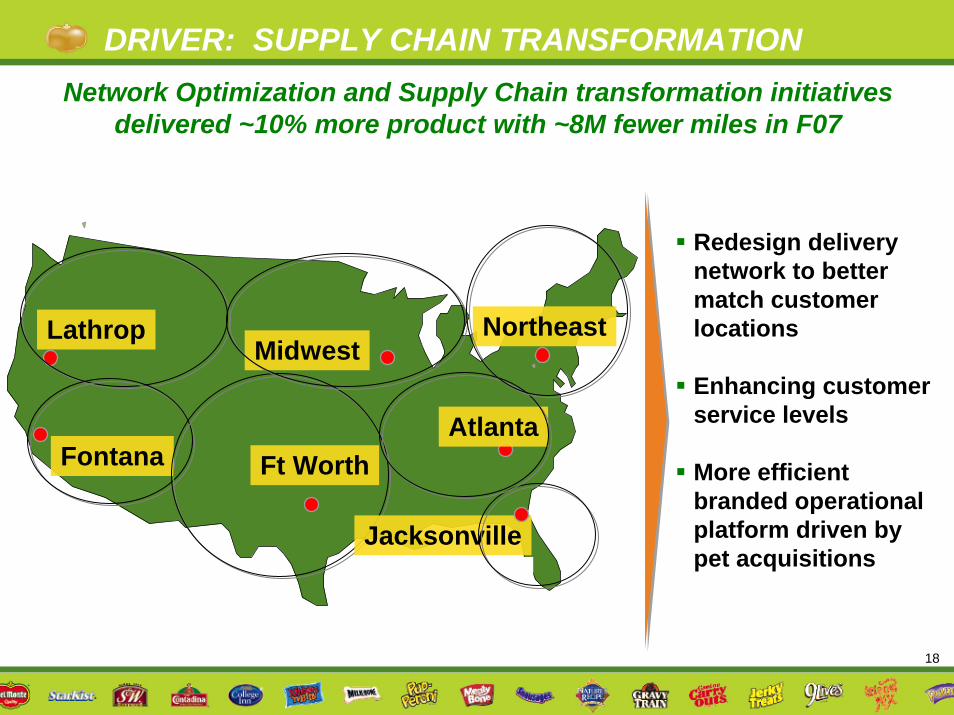
DRIVER: SUPPLY CHAIN TRANSFORMATIONNetwork Optimization and Supply Chain transformation initiatives
delivered ~10% more product with ~8M fewer miles in F07
Redesign delivery network to better match customer locations
Enhancing customer service levels
More efficient branded operational platform driven by pet acquisitions
Ft Worth
MidwestLathrop
Fontana
Jacksonville
Atlanta
Northeast
19
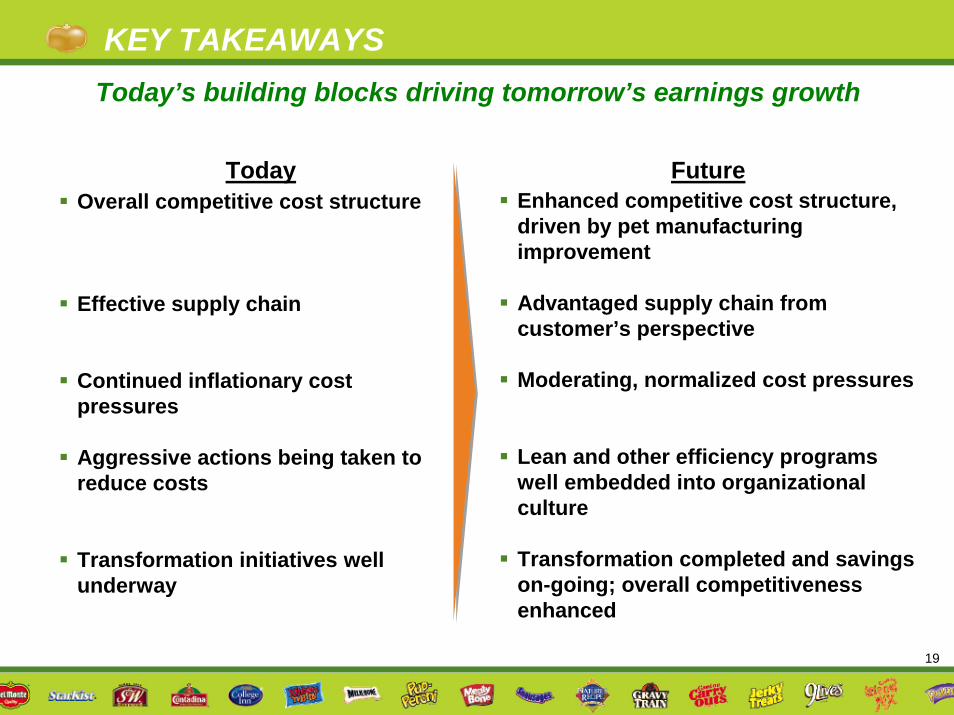
KEY TAKEAWAYSToday’s building blocks driving tomorrow’s earnings growth
FutureTodayOverall competitive cost structure
Effective supply chain
Continued inflationary cost pressures
Aggressive actions being taken to reduce costs
Transformation initiatives well underway
Enhanced competitive cost structure, driven by pet manufacturing improvement
Advantaged supply chain from customer’s perspective
Moderating, normalized cost pressures
Lean and other efficiency programs well embedded into organizational culture
Transformation completed and savings on-going; overall competitiveness enhanced

20
Q&A
Top Related